Submitted:
06 April 2025
Posted:
07 April 2025
You are already at the latest version
Abstract
Financial time series forecasting remains a focalpoint of research in finance due to its crucial role in investmentdecision-making and risk management. However, the highlynonlinear and non-stationary characteristics of financial marketspose significant challenges for prediction. This paper introducesa Frequency-Adaptive Normalized (FAN) time series predictionmodel that enhances forecasting accuracy through an innovativefrequency domain analysis approach. The model employs adual-path architecture, incorporating frequency-adaptive nor-malization mechanisms and residual learning strategies, whicheffectively captures both the periodic patterns of time series andaccurately models fine-grained market fluctuations. Experimentsconducted on the TSLA stock dataset demonstrate that theFAN model achieves substantial improvements in both predictiveaccuracy and computational efficiency compared to traditionalmethods. Notably, the model exhibits robust performance whenforecasting during periods of intense volatility. Ablation studiesfurther validate the necessity of each model component, providingnew research directions for financial time series prediction.
Keywords:
time series forecasting
; frequency adaptive
; deep learning
; frequency domain analysis
; stock prediction
I. Introduction
Financial time series forecasting, particularly stock price prediction, remains a fundamental research focus in finance. Accurate predictions not only provide crucial reference points for investment decisions but also offer significant guidance for financial market risk management and resource allocation. However, the high complexity, nonlinearity, and non-stationary characteristics of financial markets continue to pose substantial challenges for accurate forecasting.
As illustrated in Figure 1, Tesla (TSLA) stock exemplifies forecasting challenges due to its pronounced non-stationarity and volatility. Traditional models struggle with nonlinear de- pendencies and volatility clustering [2], while deep learning approaches introduce computational complexity and limited periodicity handling [3]. Frequency-domain methods lack adaptive residual feature extraction [4]. To address these is- sues, this paper proposes a Frequency-Adaptive Normalization (FAN) model with adaptive frequency extraction, dual-path architecture, and lightweight design [6].
II. Methodology
This section presents a detailed exposition of the FAN (Frequency Adaptive Normalization) model’s technical specifi- cations, encompassing data preprocessing, frequency-adaptive normalization, model architecture design, and training strate- gies. Figure 2 illustrates the model’s overall architecture and data flow process [7].
A. Data Preprocessing
This research employs TSLA stock data as the experimental subject, with initial processing focused on temporal alignment. All time series data are chronologically ordered by trading dates to ensure data continuity and completeness, establishing a foundation for subsequent prediction tasks [8]. Regarding feature selection, considering the characteristics of stock price prediction and data availability, we selected six primary fea- ture indicators: Opening price (Open), Highest price (High), Lowest price (Low), Closing price (Close), Adjusted Closing price (Adj Close), and Trading Volume (Volume). These indicators comprehensively reflect stock trading conditions and price movement trends [9]–[12]. To eliminate dimensional differences between features and enhance model training effec- tiveness [13], we implemented MinMaxScaler normalization for all numerical features. This step maps all feature values to the [0, 1] interval, preserving relative relationships while significantly improving the model’s numerical stability and convergence rate [14]–[18]. In constructing training samples, we employed a sliding window approach to segment the time series data. Specifically, each training sample comprises 64 time steps of historical data as the input sequence for predicting the subsequent 32 time steps. By setting the sliding step to 1, we fully utilize the temporal information within the data while ensuring the richness and continuity of training samples. This sliding window construction method ensures both the model’s capacity to learn long-term dependencies and meets practical requirements for prediction time spans.
B. Frequency Adaptive Normalization
The primary technical innovation of the FAN model is its frequency-adaptive normalization mechanism, which en- hances prediction accuracy by adaptively decomposing time series into representative frequency components using FFT, selectively extracting the most significant periodic features, and reconstructing signals via IFFT. This approach effectively captures essential periodic patterns while preserving detailed residual information, significantly improving the model’s pre- dictive capability [19]–[24].
C. Model Architecture
The FAN model employs an innovative dual-path architec- ture, processing main frequency features and residual signals separately. Frequency-domain features extracted via FFT are processed through Multi-Layer Perceptrons (MLPs) to cap- ture macro-trends, while residual signals capture fine-grained market fluctuations. Finally, predictions from both paths are fused, ensuring accurate modeling of both long-term trends and short-term variations.
D. Training Strategy
The FAN model employs end-to-end training with carefully designed strategies to ensure effective learning and general- ization capabilities. The loss function primarily utilizes Mean Squared Error (MSE) to measure prediction-truth differences, incorporating L1 regularization to control model complexity and prevent overfitting. For optimization, we employ the Adam optimizer with an initial learning rate of 0.001 and learning rate decay mechanism. The batch size is set to 32, balancing computational efficiency and training stability. The model trains for 5 epochs with early stopping when validation loss shows no improvement over consecutive epochs, effectively preventing overfitting. This training strategy ensures stable and excellent predictive performance with reasonable compu- tational resource consumption [25,26].
III. Experimental Results and Analysis
A. Performance Evaluation
This experiment utilizes TSLA’s historical trading dataset spanning from 2010 to 2022, encompassing 2,956 trading days. The dataset includes six features: opening price, highest price, lowest price, closing price, adjusted closing price, and trading volume. We conducted comprehensive data analysis and performance evaluation to gain deep insights into the inherent relationships among data features and the model’s predictive capabilities.
Through correlation analysis, we identified significant corre- lation patterns among the data features. As illustrated in Figure 3, price-related indicators (opening price, highest price, lowest price, closing price, adjusted closing price) exhibit extremely strong positive correlations, with correlation coefficients ap- proaching 1, indicating substantial information redundancy among price indicators. In contrast, trading volume shows weak correlation with price indicators, with correlation coeffi- cients of approximately 0.09, suggesting that volume contains unique market information that may provide complementary value for prediction. To comprehensively evaluate the FAN model’s predictive performance, we employed three metrics: Mean Squared Error (MSE), Mean Absolute Error (MAE), and Root Mean Square Error (RMSE). The test results are presented in the following table:

Table 1.
Performance metrics.
| Feature | MSE | MAE | RMSE |
|---|---|---|---|
| Open | 8.125e+03 | 65.127 | 90.139 |
| High | 8.542e+03 | 67.449 | 92.422 |
| Low | 7.688e+03 | 62.996 | 87.681 |
| Close | 8.252e+03 | 66.261 | 90.842 |
| Adj Close | 8.252e+03 | 66.261 | 90.842 |
| Volume | 5.367e+14 | 1.843e+07 | 2.319e+07 |
The performance metrics demonstrate that the FAN model exhibits stable and excellent performance across all price indicator predictions. Notably, it achieves optimal results in predicting the Low price, with an MSE of 7.688e+03, MAE of 62.996, and RMSE of 87.681, indicating accurate capture of downward market trends. In comparison, High price pre- dictions show slightly higher error rates, potentially due to the greater uncertainty and volatility typically associated with market upward movements.
B. Comparative Models
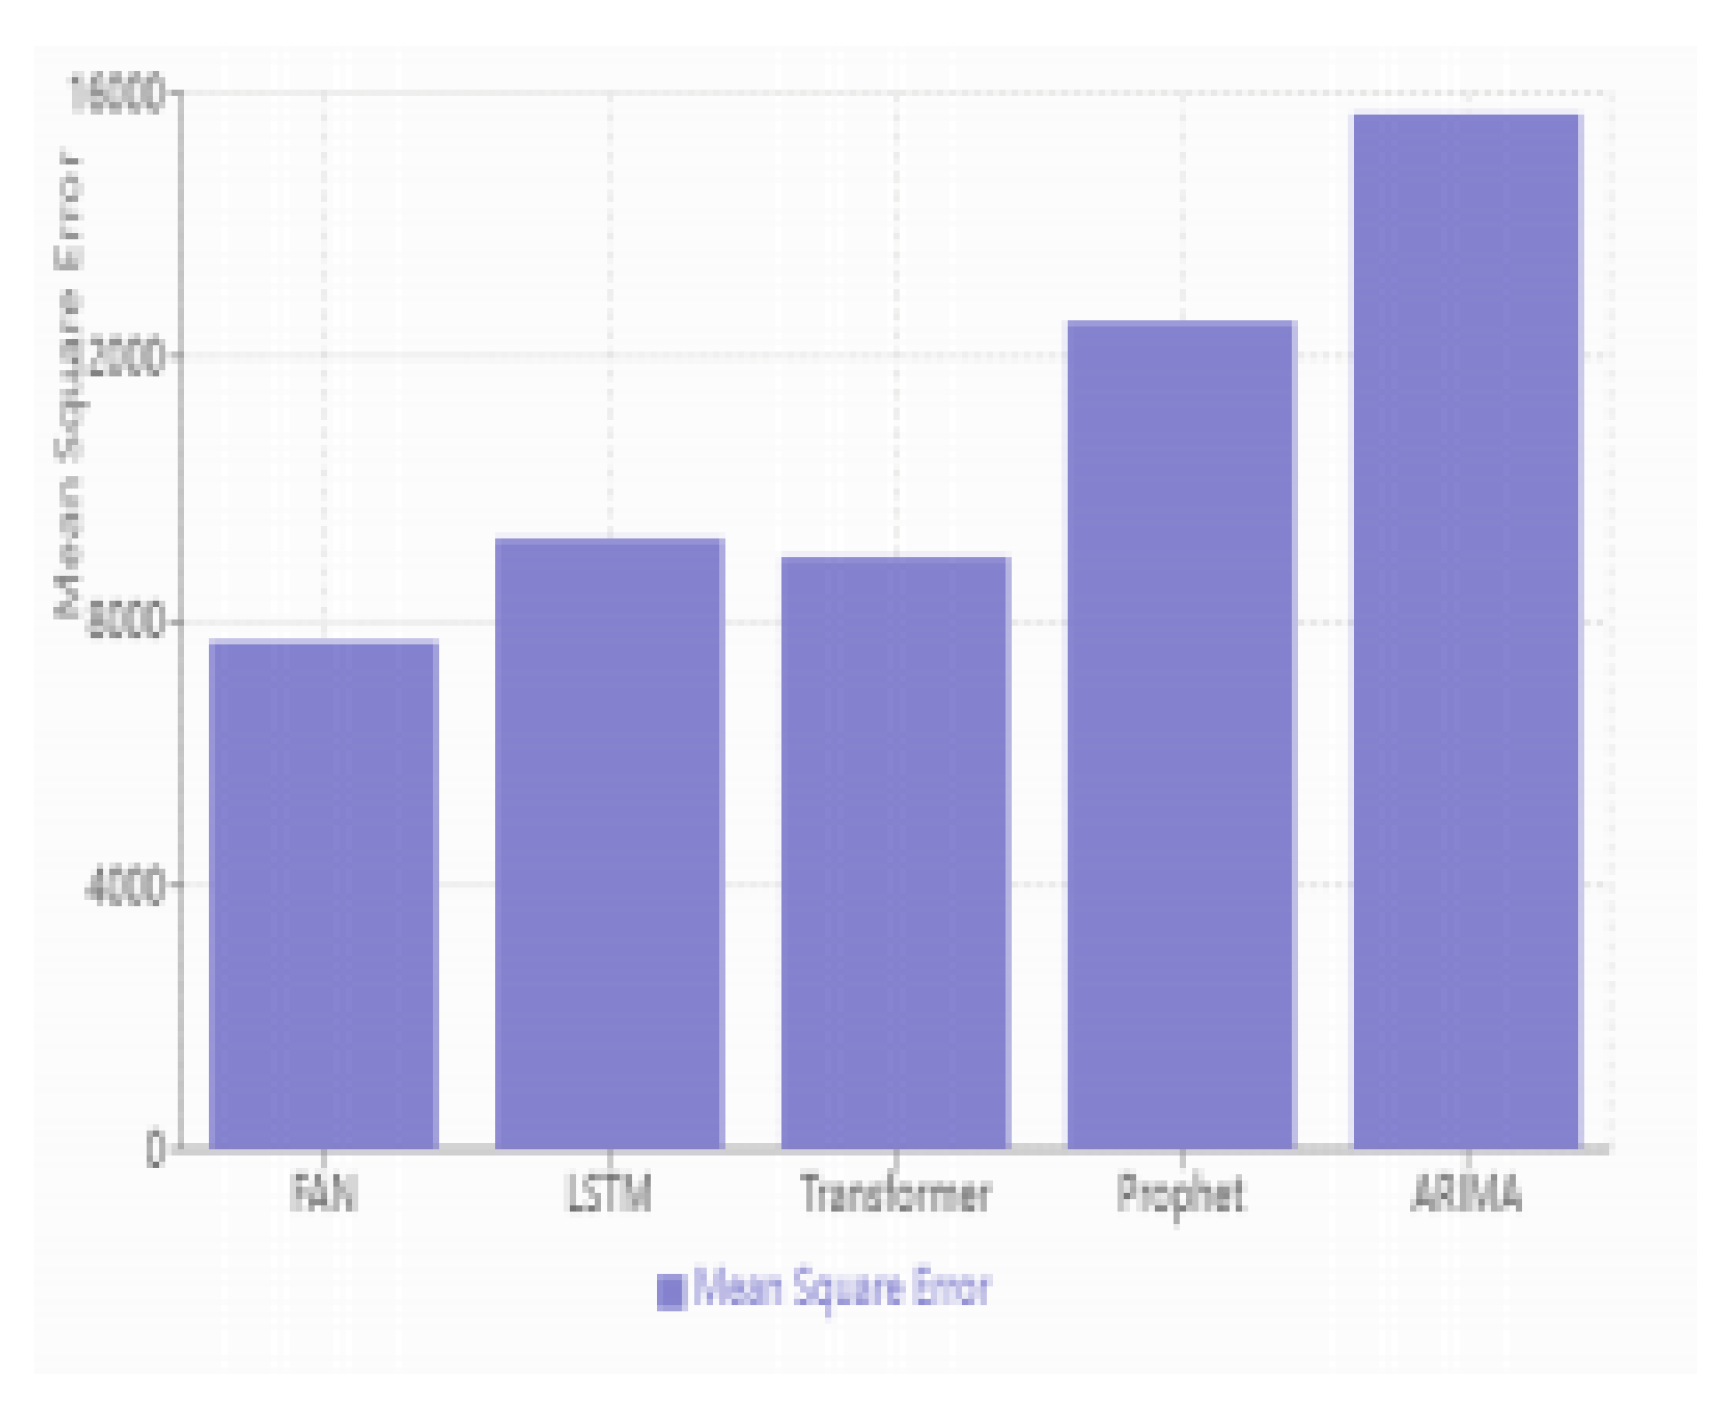
To comprehensively evaluate the performance advantages of the FAN model, we selected four representative benchmark models for comparative experiments: the classic deep temporal model LSTM, the attention mechanism-based Transformer, Facebook’s Prophet, and the traditional statistical model ARIMA. These models have extensive application foundations in time series forecasting and can validate the effectiveness of the FAN model from different perspectives.
Experimental results demonstrate that the FAN model sig- nificantly outperforms other benchmark models in predictive performance. In terms of Mean Squared Error (MSE), the FAN model achieves an error value of 7,688, showing notable improvement compared to LSTM’s 9,245 and Transformer’s 8,967. The performance enhancement is particularly signifi- cant when compared to traditional ARIMA (MSE of 15,678) and Prophet (MSE of 12,534) models . This performance advantage is manifested in several aspects:
• Through its frequency-adaptive normalization mecha- nism, the FAN model better captures periodic patterns and long-term trends in the data. Compared to LSTM, FAN demonstrates clear advantages in handling long- term dependencies, as evidenced by the smoothness of prediction curves and trend capture accuracy.
• Relative to Transformer, FAN not only improves predic- tion accuracy but also shows advantages in computational efficiency, thanks to its lightweight dual-path architecture design.
Traditional models like ARIMA and Prophet reveal obvious limitations when processing highly nonlinear stock data such as TSLA. These models are constrained by their linear as- sumptions and predefined periodic components, making it dif- ficult to adapt to rapid market changes and complex patterns. In contrast, the FAN model demonstrates superior modeling capability and prediction accuracy through adaptive frequency decomposition and residual learning. These experimental re- sults not only validate the effectiveness of the FAN model but also highlight its unique advantages in handling complex finan- cial time series prediction tasks. While maintaining relatively low computational complexity, the model achieves significant improvements in predictive performance, providing an efficient and reliable solution for financial market prediction.
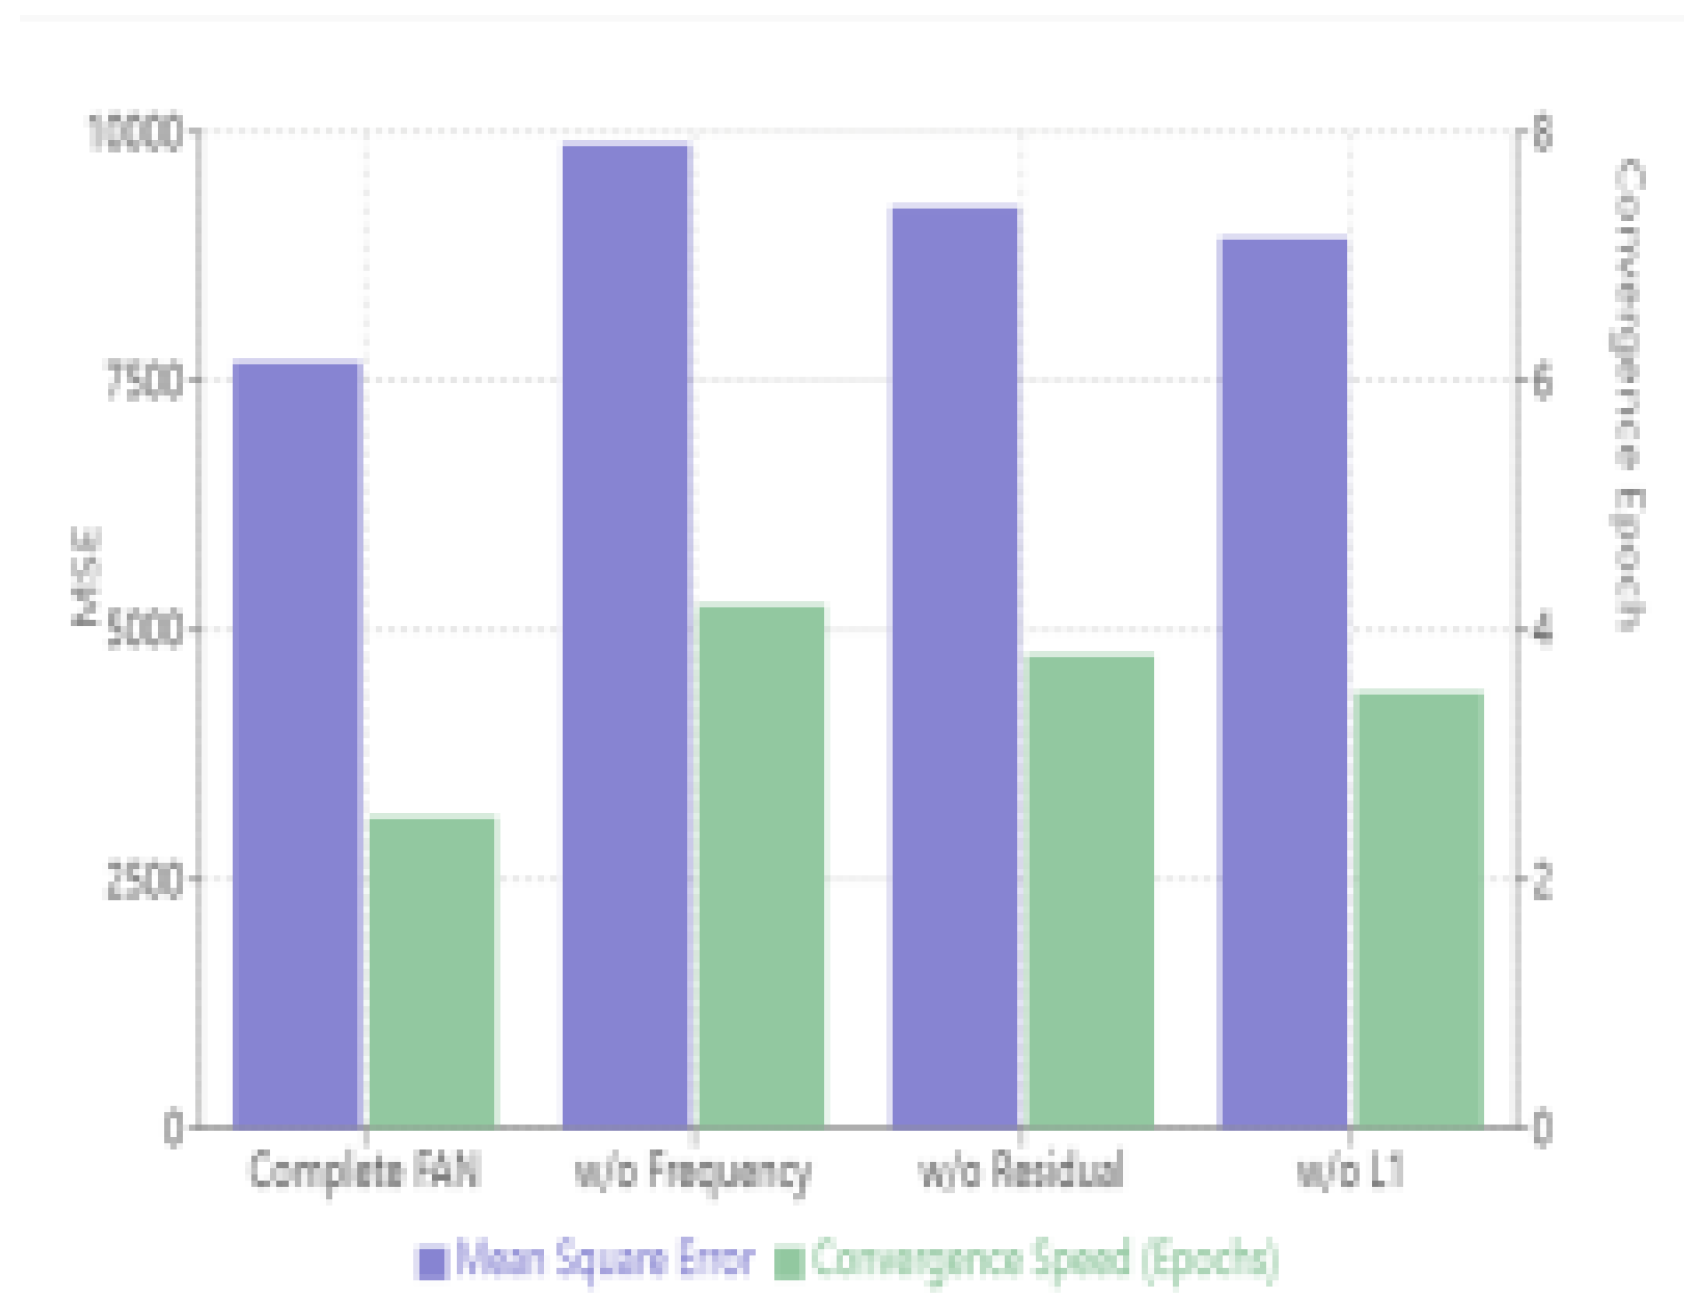
C. Ablation Study
To systematically validate the effectiveness of FAN model’s core components, we designed a series of ablation experi- ments. These experiments analyze the impact of each com- ponent on model performance through progressive removal or replacement of key components, including the frequency- adaptive module, residual signal path, and regularization strat- egy.
Through ablation studies, we evaluated the impact of each core component in the FAN model by comparing the com- plete model with variants missing key components. Results indicated that removing the frequency-adaptive normalization mechanism significantly increased prediction error (MSE: 9,876) and slowed convergence, highlighting its critical role. Removing the residual signal path or regularization similarly degraded performance and increased overfitting risk, confirm- ing their importance for model accuracy and generalization. These findings clearly validate the necessity of each compo- nent and offer directions for future improvements.
D. Conclusion
This paper proposes a Frequency-Adaptive Normalization (FAN) model, demonstrating its effectiveness in financial time series forecasting through theoretical analysis and empirical validation. We introduce a frequency-adaptive normalization mechanism to effectively capture periodic and residual features via frequency decomposition and reconstruction. Experimental results on TSLA stock data validate the superior predictive performance and robustness of FAN compared with existing models, achieving notable improvements in metrics like MSE, MAE, and RMSE. Ablation studies confirm the significance of each component, offering insights for future research direc- tions. Although the FAN model proposed in this paper showed good performance in experiments, its overall architecture is relatively simple. Future research could incorporate more innovative mechanisms or advanced methodologies to enhance its theoretical contributions and differentiate it more distinctly from existing approaches.
Figure 5.
Ablation Study Results.
Acknowledgments
AI-based tools (such as ChatGPT 4.0) were utilized to enhance the linguistic clarity and coherence of this manuscript. The tools were used for grammar correction, sentence re- structuring, and readability improvements. The intellectual contributions and core ideas remain entirely the work of the authors, and all AI-assisted content was critically reviewed and revised as necessary. The authors also acknowledge the valu- able feedback provided by reviewers and colleagues, which helped enhance the quality of this work.
References
- Ye, Weiwei, et al. Frequency Adaptive Normalization For Non- stationary Time Series Forecasting. arXiv preprint arXiv:, arXiv:2409.20371 (2024).
- Lv, Yuanhua, and ChengXiang Zhai. Adaptive term frequency nor- malization for BM25. Proceedings of the 20th ACM international conference on Information and knowledge management. 2011.
- Bershad, N. , and P. Feintuch. A normalized frequency domain LMS adaptive algorithm. IEEE transactions on acoustics, speech, and signal processing 1986, 34, 452–461. [Google Scholar] [CrossRef]
- Hofmann, Bernd, et al. An excitation-aware and self-adaptive frequency normalization for low-frequency stabilized electric field integral equation formulations. IEEE Transactions on Antennas and Propagation 2023, 71, 4301–4314. [Google Scholar] [CrossRef]
- Zhang, Sheng, et al. Adaptive frequency-domain normalized imple- mentations of widely-linear complex-valued filter. IEEE Transactions on Signal Processing 2021, 69, 5801–5814. [Google Scholar] [CrossRef]
- Leiber, Maxime. Adaptive time-frequency analysis and data normaliza- tion: contributions to monitoring under varying conditions. Diss. Ecole Normale Suprieure (ENS), 2024.
- Florian, Shaul, and Neil J. Bershad. A weighted normalized frequency domain LMS adaptive algorithm. IEEE Transactions on Acoustics, Speech, and Signal Processing 1988, 36, 1002–1007. [Google Scholar] [CrossRef]
- Kim, Mi-Young, and Randy Goebel. Detection and normalization of medical terms using domain-specific term frequency and adaptive ranking. Proceedings of the 10th IEEE International Conference on Information Technology and Applications in Biomedicine. IEEE, 2010.
- Ke, Zong, and Yin, Yuchen. Tail Risk Alert Based on Conditional Autoregressive VaR by Regression Quantiles and Machine Learning Algorithms. 5: International Conference on Artificial Intelligence and Computer Engineering (ICAICE). IEEE, 2024, 2024.
- Lee, Sangrok, Jongseong Bae, and Ha Young Kim. Decompose, adjust, compose: Effective normalization by playing with frequency for domain generalization. Proceedings of the IEEE/CVF conference on computer vision and pattern recognition.
- Yin, Wutao, and Aryan Saadat Mehr. Stochastic analysis of the normal- ized subband adaptive filter algorithm. IEEE Transactions on Circuits and Systems I: Regular Papers 2010, 58, 1020–1033. [Google Scholar]
- Yeung, Gary, Ruchao Fan, and Abeer Alwan. Fundamental frequency feature warping for frequency normalization and data augmentation in child automatic speech recognition. Speech Communication 2021, 135, 1–10. [Google Scholar] [CrossRef]
- Tang, Jingyi, et al. The Impact of Artificial Intelligence on Economic Development: A Systematic Review: The impact of artificial intelligence on economic development. International Theory and Practice in Human- ities and Social Sciences 2024, 1, 130–143. [Google Scholar]
- Xiao, Nan, et al. Transforming Education with Artificial Intelligence: A Comprehensive Review of Applications, Challenges, and Future Directions. International Theory and Practice in Humanities and Social Sciences 2025, 2, 337–356. [Google Scholar] [CrossRef]
- Yuan, ChunHong, et al. Beyond Sentiment Exploring the Dynamics of AIGC-Generated Sports Content and User Engagement on Xiao- hongshu. International Theory and Practice in Humanities and Social Sciences 2024, 1, 162–177. [Google Scholar] [CrossRef]
- Sharifani, Koosha, and Mahyar Amini. Machine learning and deep learning: A review of methods and applications. World Information Technology and Engineering Journal 2023, 10, 3897–3904. [Google Scholar]
- Almujally, Nouf Abdullah, et al. Multi-modal remote perception learn- ing for object sensory data. Frontiers in Neurorobotics 2024, 18, 1427786. [Google Scholar] [CrossRef] [PubMed]
- Thakur, Abhishek, and Sudhansu Kumar Mishra. An in-depth evalua- tion of deep learning-enabled adaptive approaches for detecting obstacles using sensor-fused data in autonomous vehicles. Engineering Applica- tions of Artificial Intelligence 2024, 133, 108550. [Google Scholar] [CrossRef]
- Tang, Qin, Jing Liang, and Fangqi Zhu. A comparative review on multi- modal sensors fusion based on deep learning. Signal, 1: (2023), 2023.
- Liu, Ye, et al. Deep learning based object detection from multi-modal sensors: an overview. Multimedia Tools and Applications 2024, 83, 19841–19870. [Google Scholar]
- Jia, Yin, et al. Deep-Learning-Based Context-Aware Multi-Level In- formation Fusion Systems for Indoor Mobile Robots Safe Navigation. Sensors 2023, 23, 2337. [Google Scholar] [CrossRef] [PubMed]
- Romanelli, Fabrizio. Multi-Sensor Fusion for Autonomous Resilient Perception.
- Rajput, Rohit Hiraman. Towards Autonomous Multi-Modal Mobility Morphobot (M4) Robot: Traversability Estimation and 3D Path Plan- ning. MS thesis. Northeastern University, 2023.
- Zheng, Ke, and Zhou Li. An Image-Text Matching Method for Multi- Modal Robots. Journal of Organizational and End User Computing (JOEUC) 2024, 36, 1–21. [Google Scholar]
- Cheng, Lei, Arindam Sengupta, and Siyang Cao. Deep Learning- Based Robust Multi-Object Tracking via Fusion of mmWave Radar and Camera Sensors. IEEE Transactions on Intelligent Transportation Systems (.
- Lee, Daegyu, et al. Enhancing State Estimator for Autonomous Race Car: Leveraging Multi-modal System and Managing Computing Re- sources. arXiv preprint arXiv:, arXiv:2308.07173 (2023).
Figure 1.
TSLA Stock Time Series.
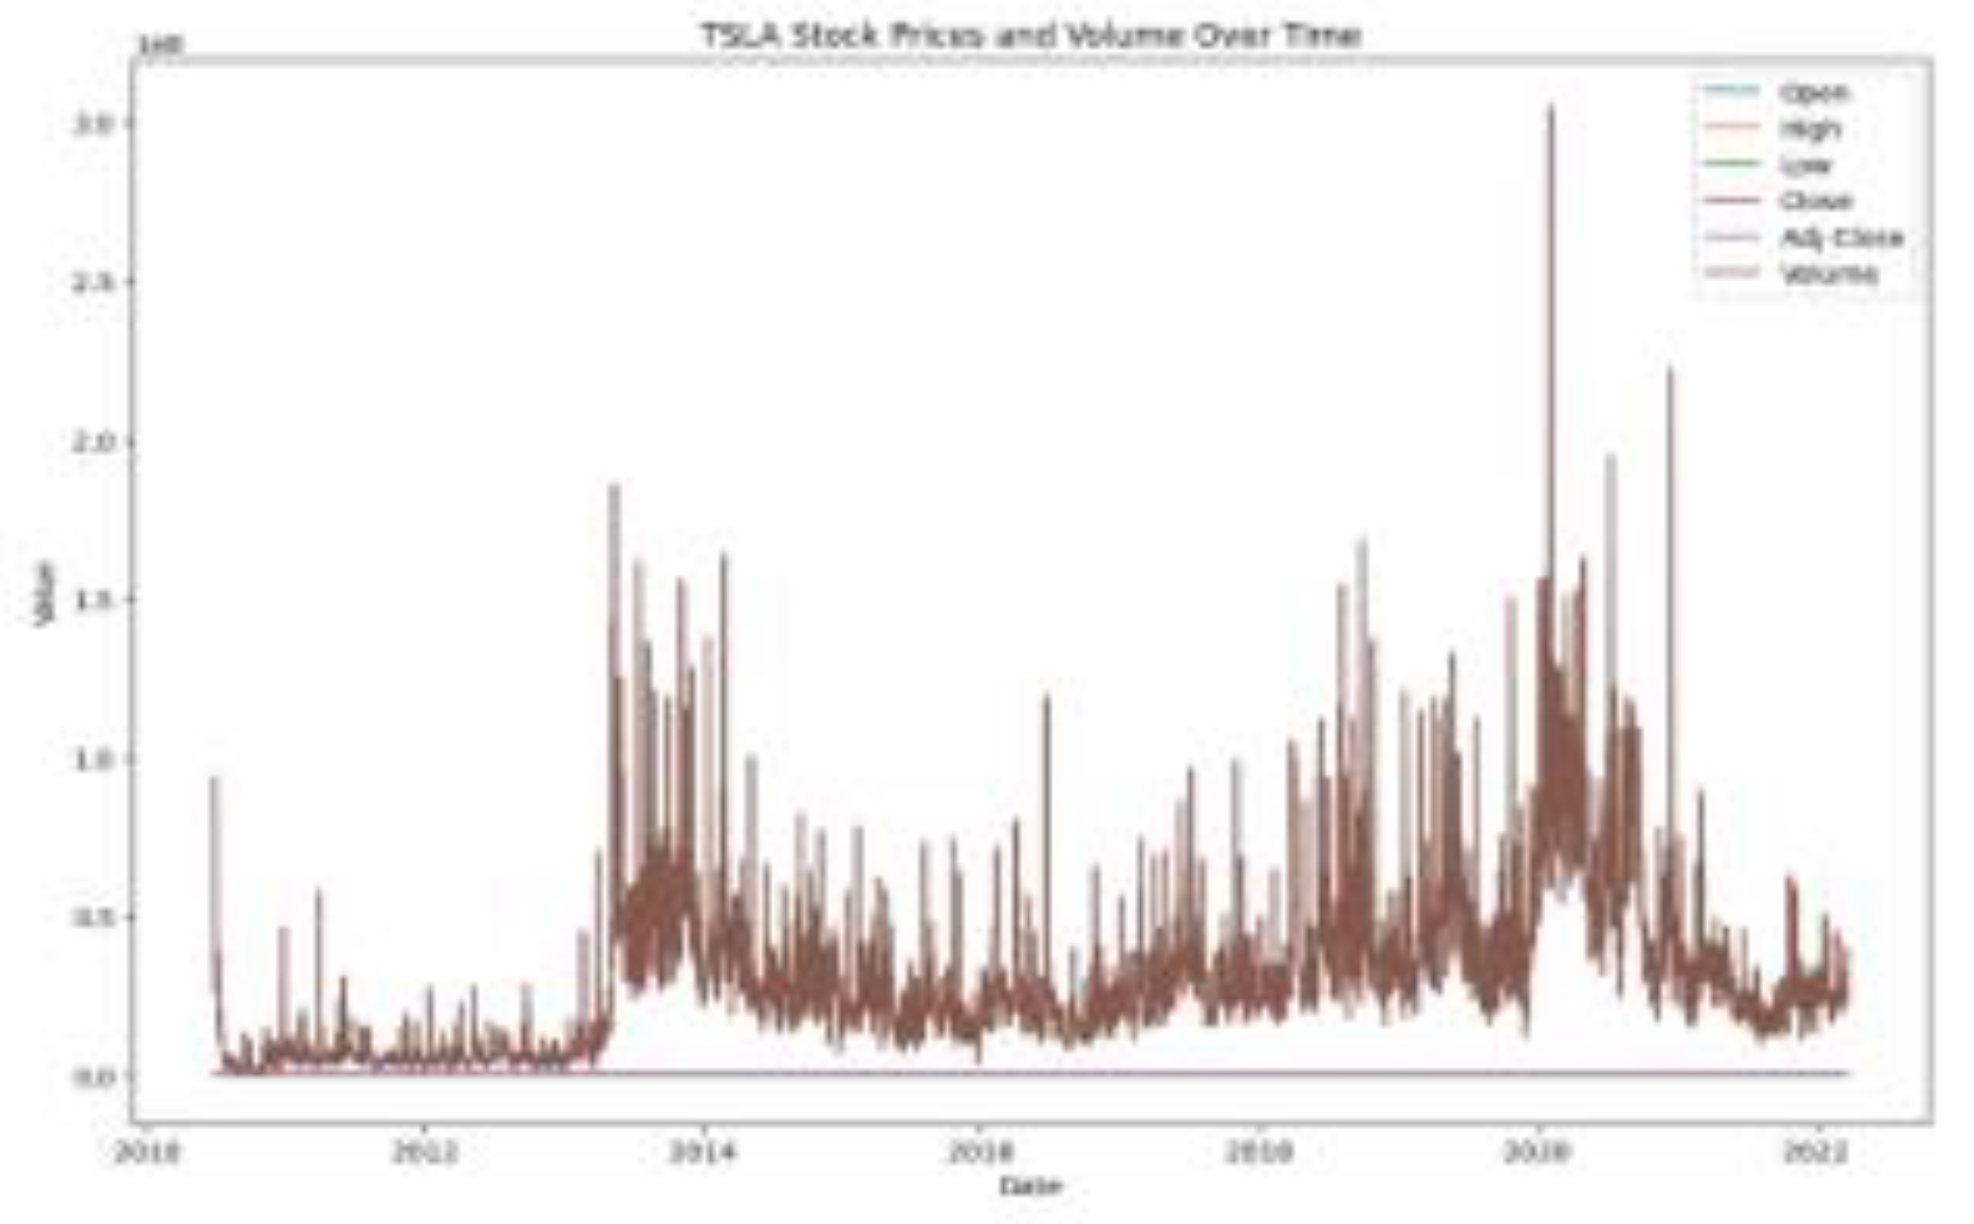
Figure 2.
Overall Model Architecture.
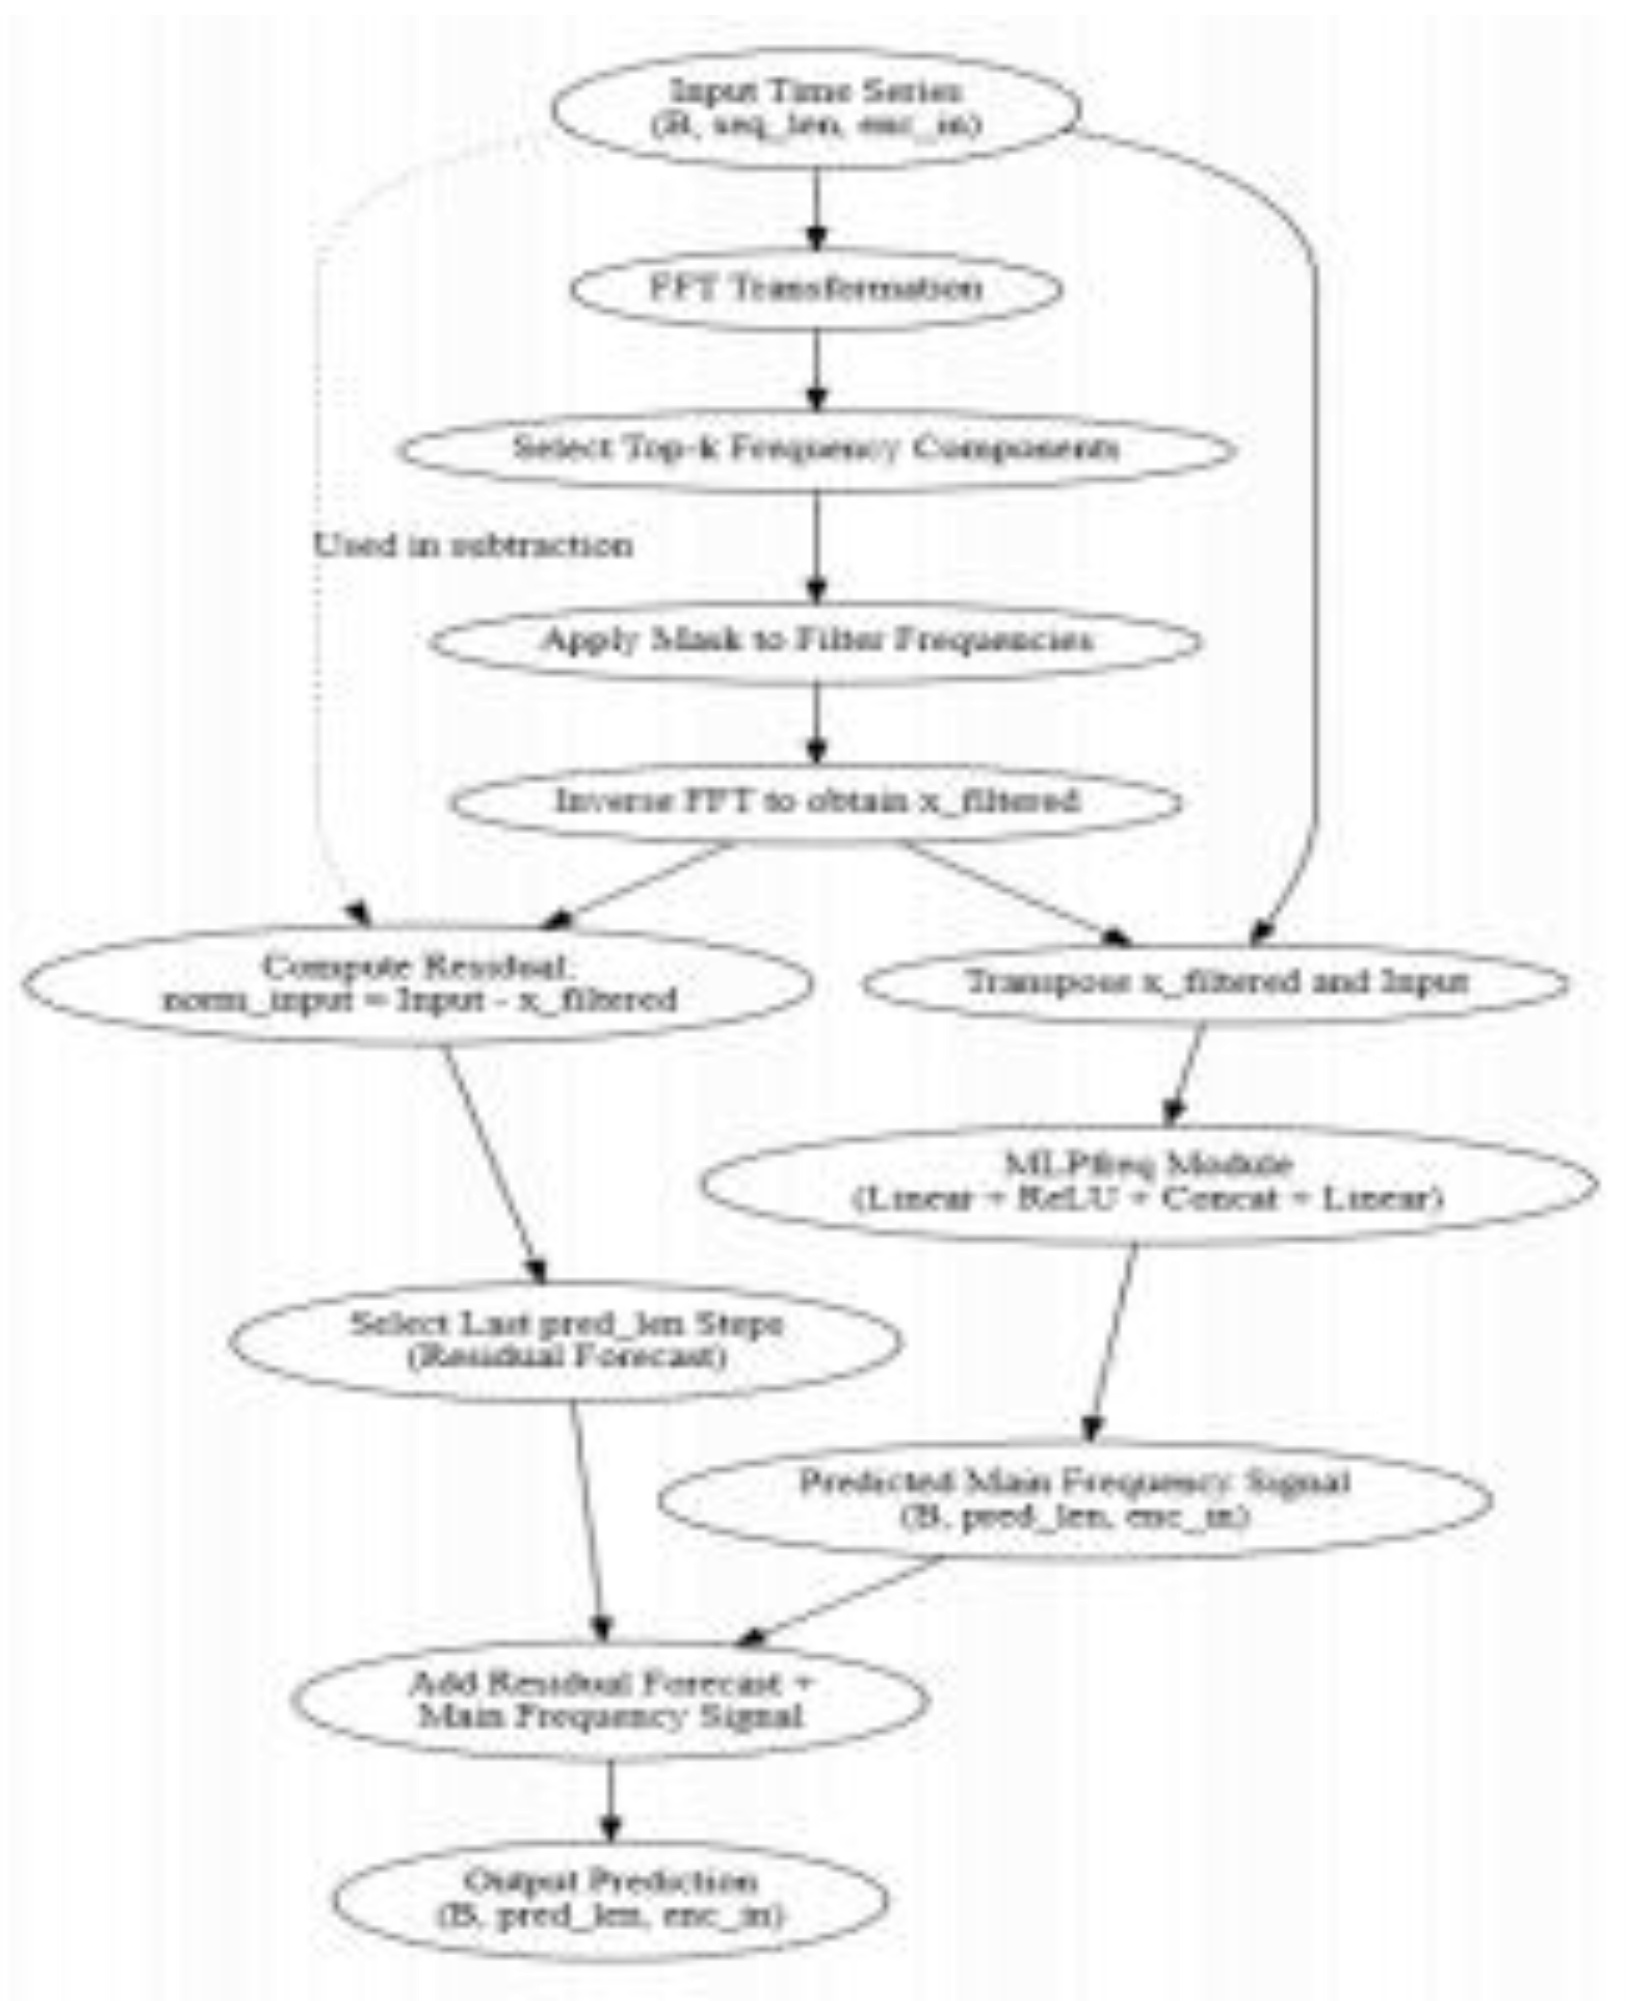
Figure 3.
Feature Correlation Heatmap.
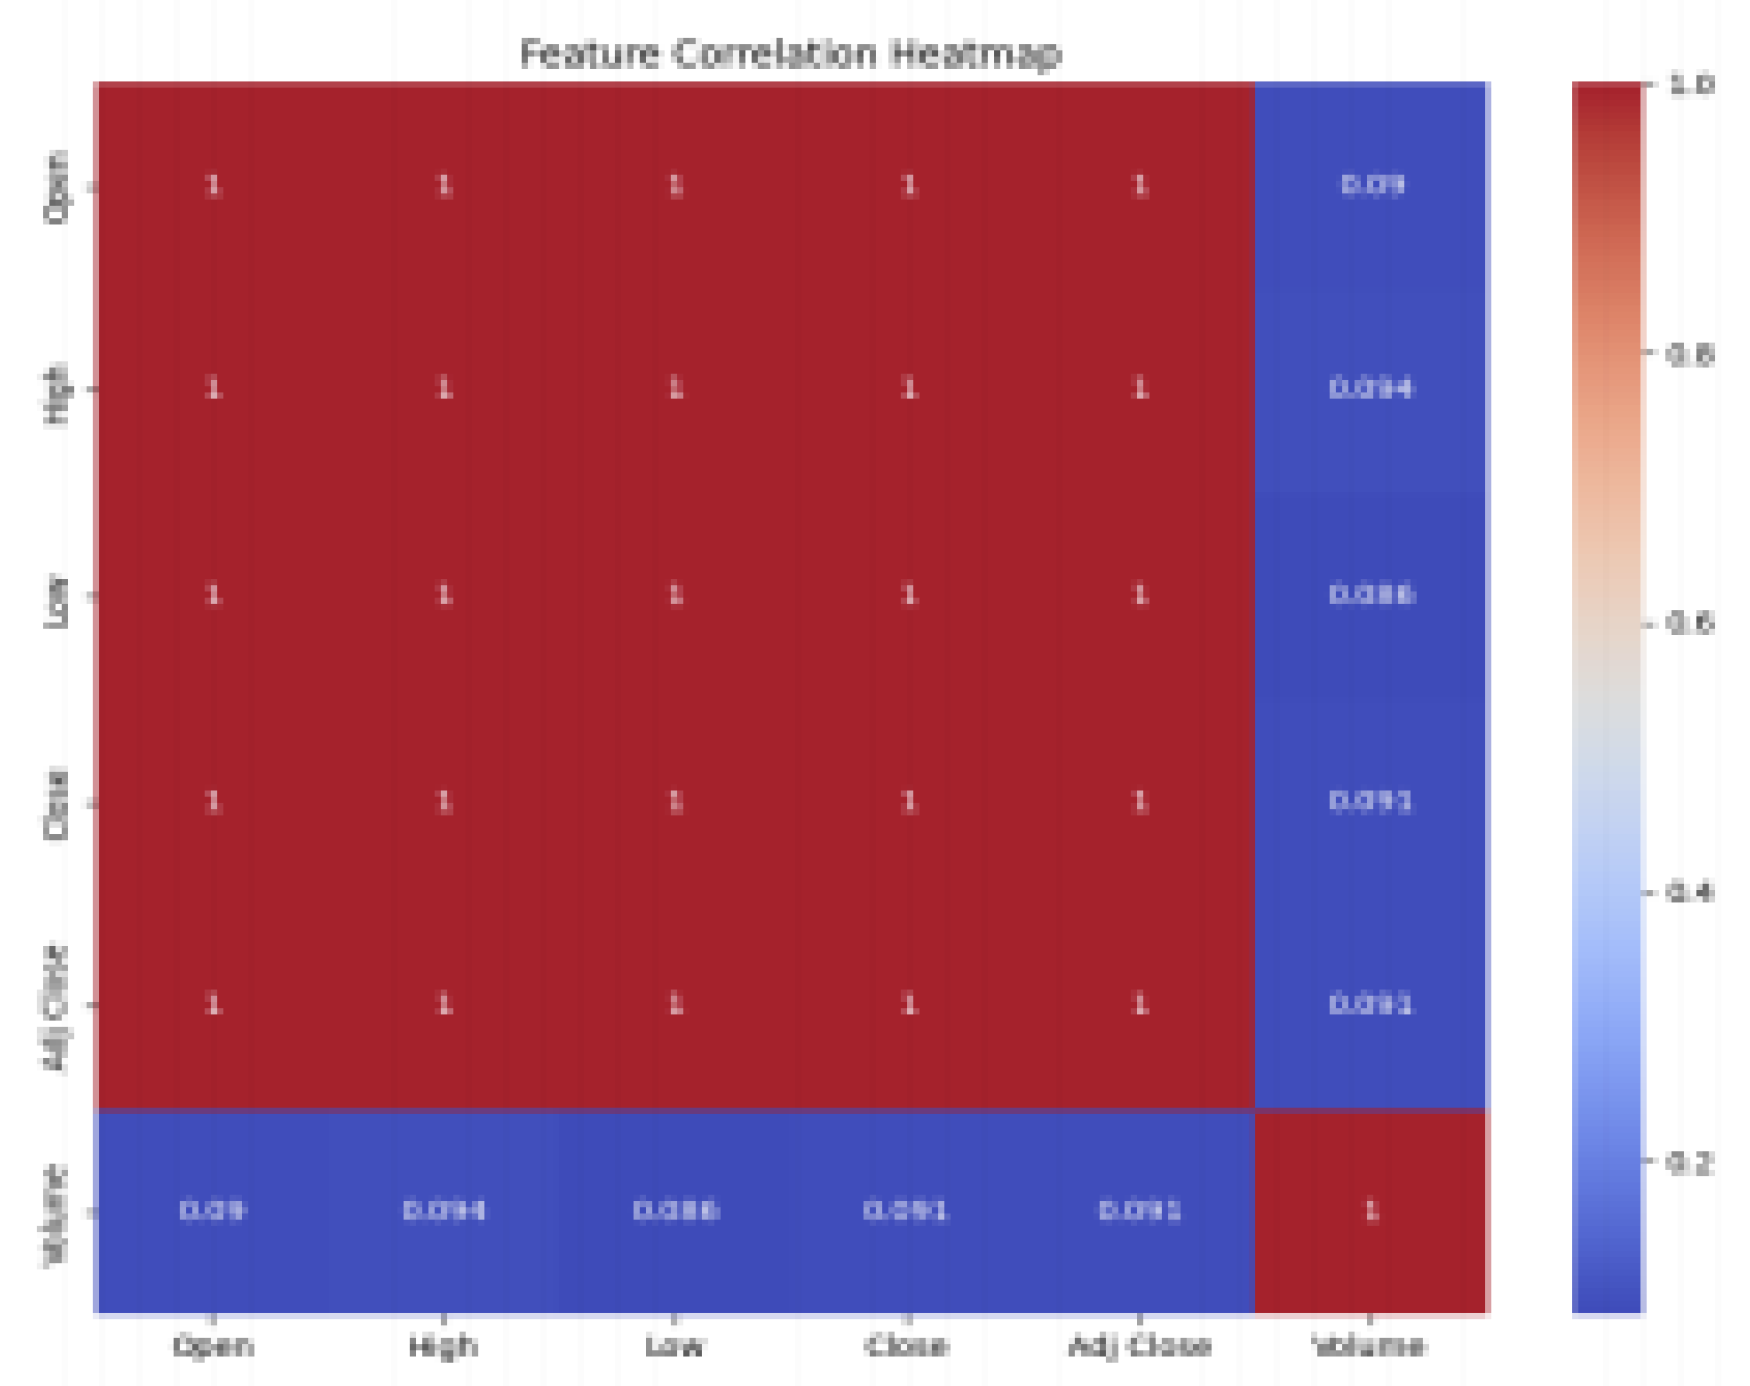
Figure 4.
Model Performance Comparison.
Disclaimer/Publisher’s Note: The statements, opinions and data contained in all publications are solely those of the individual author(s) and contributor(s) and not of MDPI and/or the editor(s). MDPI and/or the editor(s) disclaim responsibility for any injury to people or property resulting from any ideas, methods, instructions or products referred to in the content. |
© 2025 by the authors. Licensee MDPI, Basel, Switzerland. This article is an open access article distributed under the terms and conditions of the Creative Commons Attribution (CC BY) license (http://creativecommons.org/licenses/by/4.0/).
Copyright: This open access article is published under a Creative Commons CC BY 4.0 license, which permit the free download, distribution, and reuse, provided that the author and preprint are cited in any reuse.


