Submitted:
03 April 2025
Posted:
07 April 2025
Read the latest preprint version here
Abstract
The paper addresses critical challenges in renewable energy research, particularly under the difficult operational conditions caused by military conflicts in Ukraine. Despite significant infrastructure loss due to armed conflict (13% of solar and 70% of wind power), Ukraine maintains commitments to reach 27% renewable energy in final consumption by 2030. However, wartime conditions present unique challenges to scientific research, with laboratories vulnerable to missile strikes and requiring frequent evacuations. This paper introduces innovative portable laboratory stands designed for comprehensive analysis and monitoring of photovoltaic (PV) module parameters. These portable platforms, integrating advanced microcontrollers, sensors, and data processing units, enable effective real-time monitoring and parameter estimation of PV modules, thereby enhancing their operational efficiency and reliability. Two distinct portable laboratory setups are developed and detailed: the first focuses on real-time voltage and current measurements, while the second, termed the Photovoltaic Module Parameter Scanner (SPFEM), emphasizes data collection, remote data transmission, and database integration for subsequent analysis. This research provides essential tools for ensuring continuity in scientific activities and practical training for students and researchers amidst ongoing security threats. The presented systems significantly contribute to optimizing the performance of PV systems in Ukraine and underscore the necessity for continuous adaptation and technological advancement in renewable energy infrastructure.
Keywords:
photovoltaic modules
; portable and mobile laboratory stands
; scanner of parameters of photovoltaic modules
; renewable energy
1. Introduction
Today, the cost of fossil fuels is steadily rising. Therefore, the cost of electricity generated by power plants is also increasing. It is important to improve the methods and means of reliable electricity generation using solar, hydro, wind, etc. energy and methods of transmitting this electricity from its source (power plant) to consumers [1,2]. The installed capacity level of photovoltaic power plants has increased in the last ten years in Ukraine. In the IRENAs’ report is presented the energy profile Ukraine (Figure 1).
In the DIXI group report it is noted that despite the significant loss of capacity due to the occupation (13% of solar and 70% of wind power), the sector continues to demonstrate a course of recovery and modernization. According to the targets approved at the international level by the Ministerial Council of the Energy Community, by 2030 the share of renewables in the final energy consumption should reach 27%, with the expected largest contribution to electricity consumption [3].
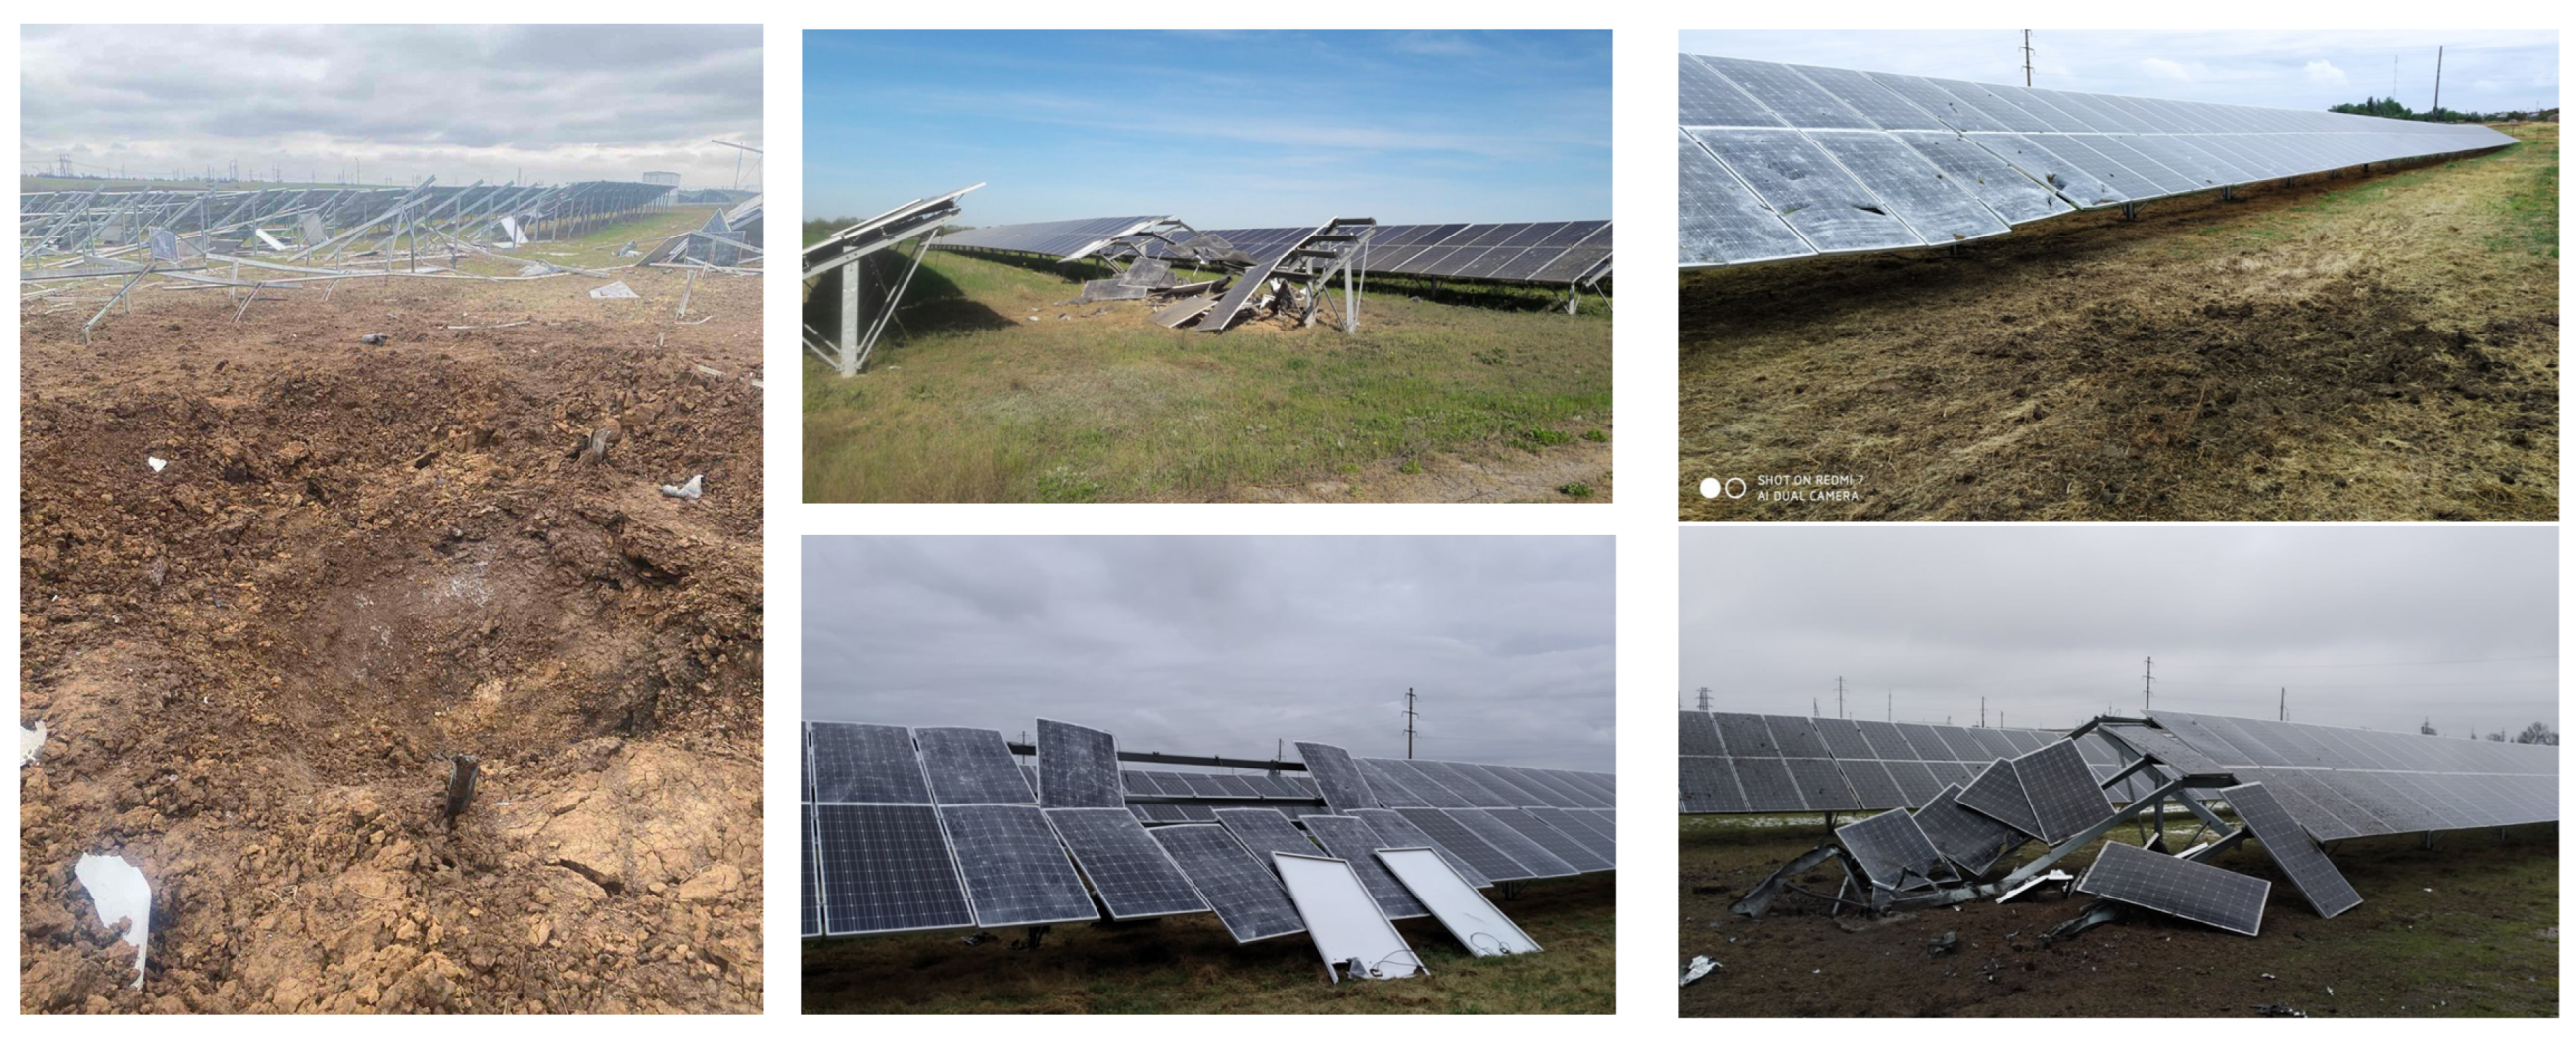
The Europe Action Plan for Ukraine "Resilience, Recovery, and Reconstruction" 2023-2026 notes the development and delivery of specialized training courses on topics relevant for investigations of the energy sector / supervisory control and data acquisition (SCADA), open source intelligence (OSINT), and others. The National Renewable Energy Action Plan until 2030 for Ukraine, which aims to increase the share of renewable energy to 27. 1% of the total gross energy consumption by 2030. The main goals for Ukraine as a member of the EU are: deploying more renewable energy, saving energy, and diversifying its energy supplies. Furthermore, the EU has agreed on stronger legislation to increase its renewable capacity by raising its binding target for 2030 to a minimum of 42%, effectively doubling the existing share of renewable energy in the EU. Implementing this policy requires high-quality personnel, particularly in power engineering for renewable energy. This requires modern scientific laboratories, equipment, and laboratory stands where scientists (masters, graduate students, doctoral students, and researchers) can conduct research, test hypotheses, develop new solutions, and obtain new patterns. The problem of conducting scientific research in Ukraine is the rocket attacks on cities and critical infrastructure enterprises (power plants and substations) (Figure 1) [4,5,6,7,8].
Figure 2.
Damage to the photovoltaic modules at the solar power plant as a result of rocket fire.
The Ukrainian war energy crisis has shown that the energy sector needs significant modernization to reach energy safety and achieve the Green Deal objectives. This modernization of the energy sector is fundamentally dependent on capacity building in higher education institutions (HEI).
Research laboratories located in the area of possible missile and guided bomb hits require frequent interruptions of research and evacuation of researchers to bomb shelters.
The purpose of the article is to develop and implement, program and multidisciplinary portable laboratory stands for studying disciplines related to renewable energy and automation systems. To achieve this goal, the following tasks were solved:
1. Analyze the current situation on the state of renewable energy sources in Ukraine.
2. Analyze the existing problems with practical and laboratory work for students of energy specialties and develop ways to solve them.
3. The configuration of two laboratory stands is proposed to conduct classes in disciplines related to the management of photovoltaic stations.
4. The interface and software of the proposed laboratory stands are developed and improved.
Interesting articles on the studied topic from well-known databases (IEEE, Springer, etc.) are analyzed. The photovoltaic power plant is a complex system and requires deep research.
Figure 3.
Research direction of the PV Energy Generation.
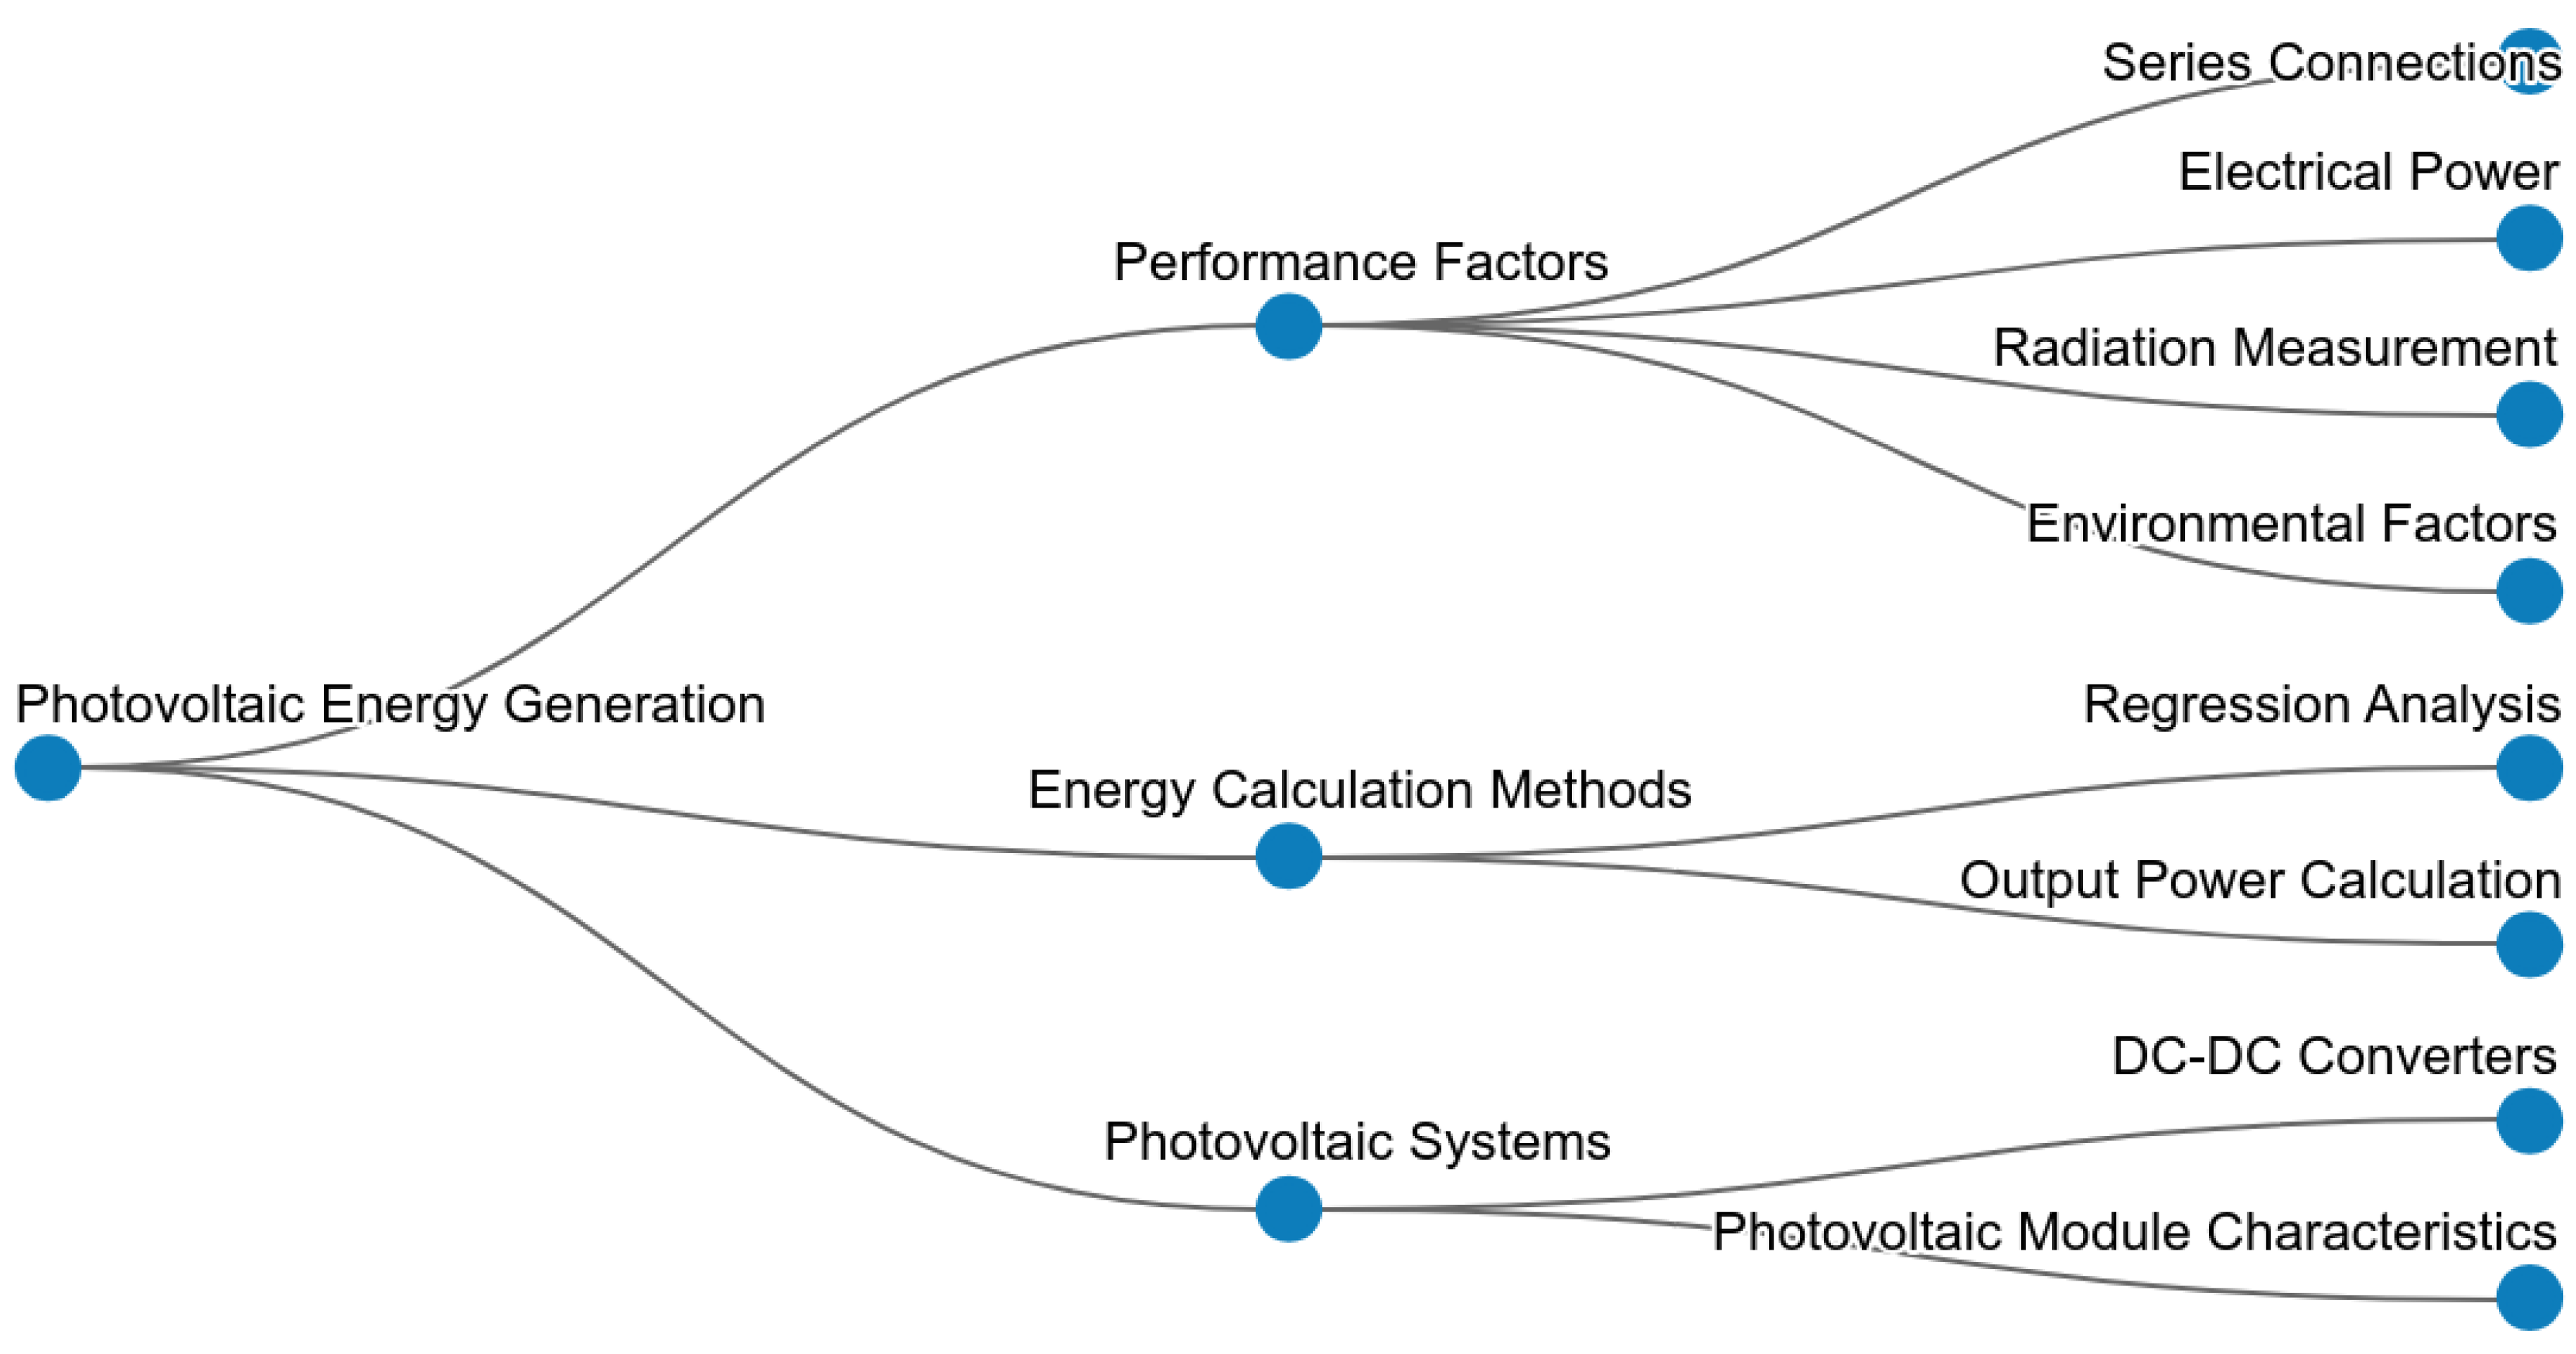
The authors present research on PV-module degradation, with a table illustrating more attention to early PV-module failures [9]. The results of the presented study can be implemented for the identification of photovoltaic system malfunctions under Ukrainian conditions. For example, studying the influence of the processing conditions of encapsulation on the degradation mechanisms of solar cells in the first year is important [9], because this problem appears in the Ukrainian photovoltaic power plant [10]. Accurate knowledge of the parameters of the PV module model is crucial for optimizing PV power generation systems, as this study introduces the single-diode model [11], analyzes the influence of the parameters on the characteristics of the iV and employs various algorithms to estimate the parameters values, highlighting the complexities and sensitivities involved. The PV hotspot fault detection model is presented in the paper [12], and is a network based on region perception and aggregation of features across channels, which can be studied on data collected from Ukrainian PV power plants. In the paper [13] presented the analysis revealed that optimal inclination angles of the photovoltaic system for the housing, public, service and manufacturing sectors. This idea is realized in the laboratory stand. The papers [14,15,16] show the diagnostic methods of the PV system. Tools and methodologies for researching and studying the parameters (open circuit voltage (Voc); short circuit current (Isc); maximum power point (MPP); fill factor (FF), etc.) Photovoltaic modules should be available to students. The evaluation of the effectiveness of the photovoltaic system and the defense of the ways in which energy generation can be optimized are presented in the next paragraph.
2. Materials and Methods
2.1. PV System Efficiency Calculation
To increase the energy generation of the PV system, more precise control of the technical condition and choosing the correct type of PV module [16,17,18]. The efficiency of the PV system can be determined as the ratio of daily energy generation E AC, D (kWh) and daily solar radiation Ht (kWh/) reaching the surface of the PV module times the area of the PV system (in our case it is one area of the PV module) As () [19]
In Equation (2) r means solar panel yeld (%); PR is performance ratio, index to take losses into account (can change from 0.9 up to 0.5) h is the number of hours of study period. To minimize the deviation between the real and calculated values, efficiency and energy need to take into account specific conditions of operation of the photovoltaic power plant, including frequency of energy sources or biological corrosion of the panels. The influence of this corrosion can be different depending on the orientation of the PV modules, the location of the design cells, and the distance between the frame and the cell. In this case eq. 1 and 2 can be rewritten
where is the area of the PV module that is not available due to biological corrosion; is the complete area of the PV module.
For detailed analyses of efficiency photovoltaic modules, portable test benches have been developed and presented in the next paragraphs. A stand has been developed to analyze the efficiency of a photovoltaic module depending on the changing frequency of the source.
2.2. Portable Test Bench for Studying the Parameters of Photovoltaic Modules
Let’s consider portable stand 1 for controlling and studying the parameters of photovoltaic modules. Figure 4 shows fragments of stand 1. Figure 4a shows a photovoltaic panel.Figure 4b,c show the Arduino Uno board from Arduino, built on the ATmega 328 microcontroller. The ATmega328 has flash, SRAM and EEPROM memory, namely: FLASH - 32 kB, of which 0.5 kB is used to store the bootloader, SRAM – 2 kB, EEPROM - 1 kB (acessible via the EEPROM library).
The serial interface is used for control. The control of indicators and the detection of button presses is performed by the TM1638 chip from the Chinese company Titan Micro Electronics. TM1638 receives from the MC and transmits data through a unique serial interface of three signals, close to the SPI interface. The difference from SPI is the combination of two lines of reception and transmission in one line. The signal names are different from those used in SPI, but they are well recognized.
There is also a voltmeter board that allows one to determine the DC voltage at the output of the photovoltaic panel and transmits the measured voltage signal to a three-digit display with three seven-segment indicators.
The second is the stand 2 - The scanner of photovoltaic module (PVM) parameters is shown in Figure 5. The appearance of the SPFEM testbed board is shown in Figure 6.
SPFEM is a mobile device that can work as part of a combination of devices and can perform the tasks of collecting PV module parameters, transferring the collected data to a laptop or to a remotely located server, automatically generating a database and saving this database to a Google disk.
It allows you to use a notebook to program the ATMega328p microcontroller (change the program code) on the Arduino uno board and use this controller to obtain information about the electrical energy generated by the photovoltaic panel, the voltage and current of the photovoltaic module. Using the ATmega 16U2 communication controller, the research bench is connected to a laptop. The developed programs allow us to accumulate the results of observations and store these results in the form of databases on a specially created server and on Google disk. Observation results can be retrieved, viewed, and processed. These results can be converted and presented in the form of MS Excel files.
2.3. Block Diagram of the System for Monitoring the Parameters of the PV System
A graphical representation of the parts of the PV module parameter monitoring system that are interconnected by a certain feature and ways of action transmission is called a system block diagram.
The system for monitoring the parameters of photovoltaic modules consists of two main blocks (Figure 7), such as a device based on the ATmega328P microcontroller (Figure 8) and a data processing server (Figure 9).
These sensors record the voltage, current, and power of the load connected to the PV system and transmit the parameters received to the microcontroller at a specified frequency. In the Figure 9 block, INA 219 is shown.
In addition, using the appropriate sensors, the microcontroller receives data such as the temperature of the ambient air around the photovoltaic module, the temperature of the PV module itself, air humidity, air pressure, and the intensity of the light on the photopanel. It is also possible to connect various actuators to the controller, such as motors, stepper motors, pumps, relays, etc. In addition, the product is equipped with the necessary LED indication. This device is equipped with a WI-FI module, through which the microcontroller communicates with the data processing server via the TCP/IP protocol. The microcontroller operates with the help of programmed software written in the C language. Data processing server - Cisco UCS C240 M5 is a rackmount server that belongs to high-performance server equipment. The system runs on the Debian 12 operating system. To run the software on the server, you need to install PHP version 7.2 or higher, MySQL database, and Apach Web server. The software of the PV system consists of a visual part in the form of an HTML page that works in any browser (frontend), written in JavaScript and API (mechanisms that allow two software components to interact with each other using a set of definitions and protocols), and written in PHP (backtend). In addition, the software of the PV control system includes a database (MySQL) that accumulates and stores data from the controller, as well as all the parameters and modes necessary for the system operation. The system starts by setting up a wireless WI-FI network on the device of the PV parameter monitoring system and connecting it to the data processing server. After that, the controller modes are set, such as automatic/manual, the time of the interval for receiving data from sensors in automatic mode, and others. The device then switches to operating mode and starts collecting data from the PV modules and the external environment, transferring these data to the data processing and storage server. When certain data, such as the temperature of the solar cell, reaches thresholds, the microcontroller, according to a programmed algorithm, begins to perform certain actions, such as activating certain actuators to cool the solar cell. When the temperature of the PVM decreases, the microcontroller deactivates the actuators and stops cooling the solar cell. The visualization of the PVM control system is presented in Figure 10.
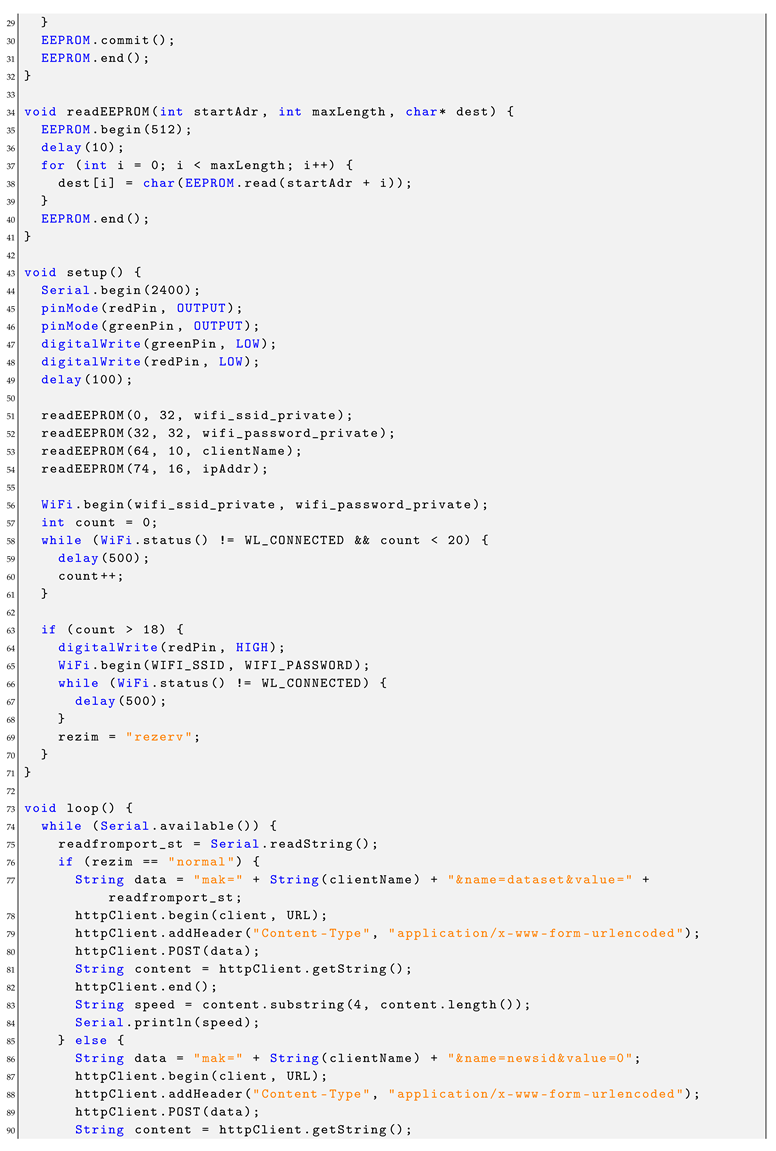
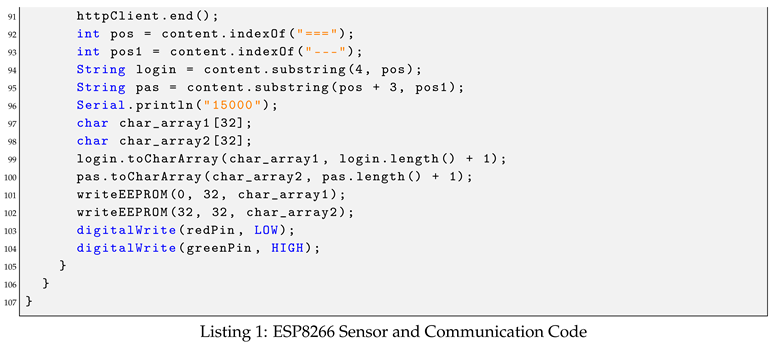
2.4. PVMCS Testbed Program Code for Controlling the Panel Generation Parameters
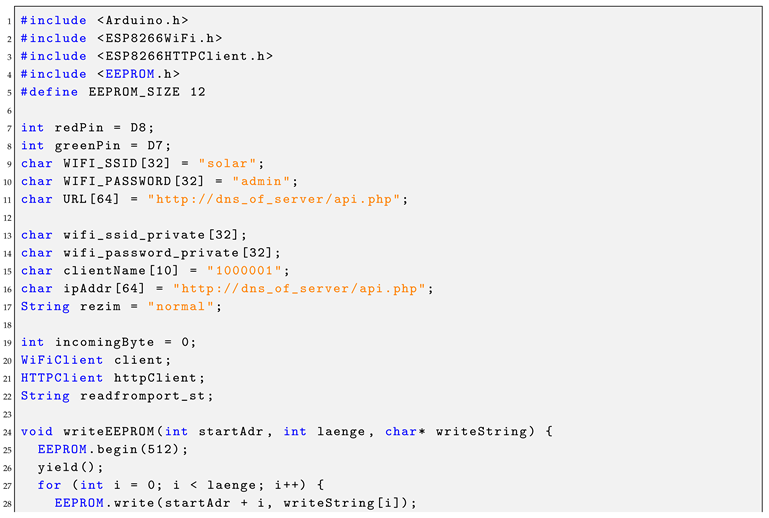
The program code is written in the C programming language in the ArduinoIDE software package.
To run the program, the controller connects libraries such as Arduino.h to work with the EEPROM memory chip, the EEPROM.h library. To operate the ESP8266WiFi module, the ESP8266WiFi.h and ESP8266HTTPClient.h libraries are used. At the beginning of the program, all the constants necessary for the device operation are set: the microcontroller pins to which the LED indication is connected, the name and password of the wireless WI-FI network for access to the Internet, the domain address of the server where the API for working with the device is located, and others. After that, the device’s non-volatile EEPROM memory is worked with, and all the necessary data for the program is read and written in the for loop. The program is initialized in the void setup() function. First, the necessary controller outputs are programmed to the OUTPUT mode, after which their logic level (LOW) is set and a delay of 0.1 s is set. The next step is to read all the necessary data from the EEPROM to connect to the WI-FI network, and then to write the connection itself.
The main algorithm and the program cycle are in the void loop function. In this loop, the program interrogates the data of the sensors connected to them from the programmed ports of the controller at a given interval, generates the necessary data and sends them to the server for processing and storage via the http protocol. The text of the program is presented in Appendix A.
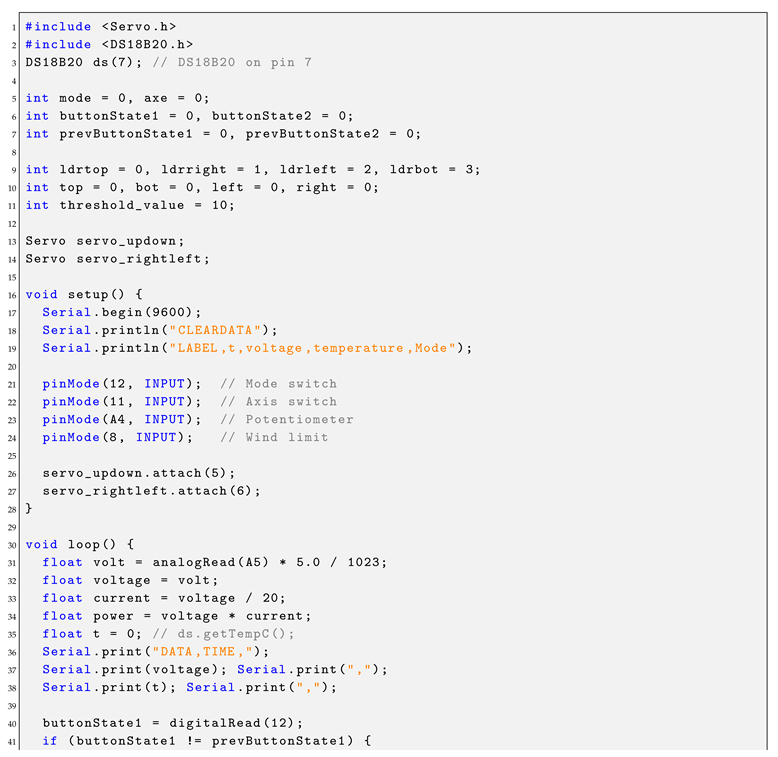
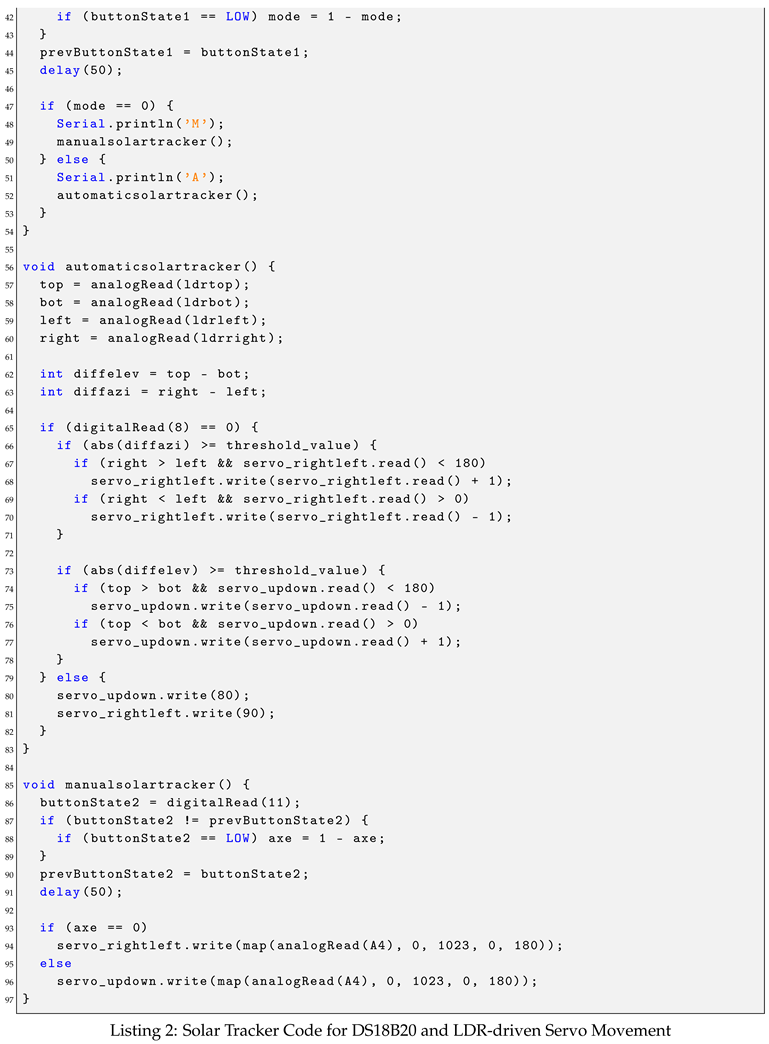
2.5. A Stand for Researching the Tracker Parameters of a Photovoltaic Station
Another portable stand is a stand for studying tracker parameters (Figure 11). Control panel 5 has two buttons and a variable resistor. The first button changes the tracker control mode from manual control to automatic control of the movement of the tracker desktop. The second button changes the possibilities of manual control of the position of the tracker desktop: position control from left to right, and from top to bottom. The control itself is carried out using the rod of the variable resistor located on the control panel 5. The direction of movement of the desktop 2 is changed by changing the direction of movement of the rod of the variable resistor on the control panel 5 in manual mode. In automatic mode, the work table 2 of the tracker moves automatically, following the movement of the light source.
Figure 11 shows: 1 - Arduino Uno board, 2 - tracker desktop, 3 - photoelectric panel of the tracker, 4 - anemometer, 5 - tracker control panel, 6 - module with four photodiodes, remote control, and with external protection against side illumination of these photodiode light sources.
The program code, which is stored in the Flash memory of the Atmel processor on the Arduino Uno board, is shown later in the text of the article in Appendix B. This code not only allows you to control the parameters of the photovoltaic panel, but also controls the wind speed. If the wind speed exceeds the set point, the Arduino Uno board gives a command to change the position of the desktop from the current position to a horizontal position.
2.6. Investigation of the Influence of the Frequency of LED Backlighting of a Photovoltaic Panel on Its Photocurrent
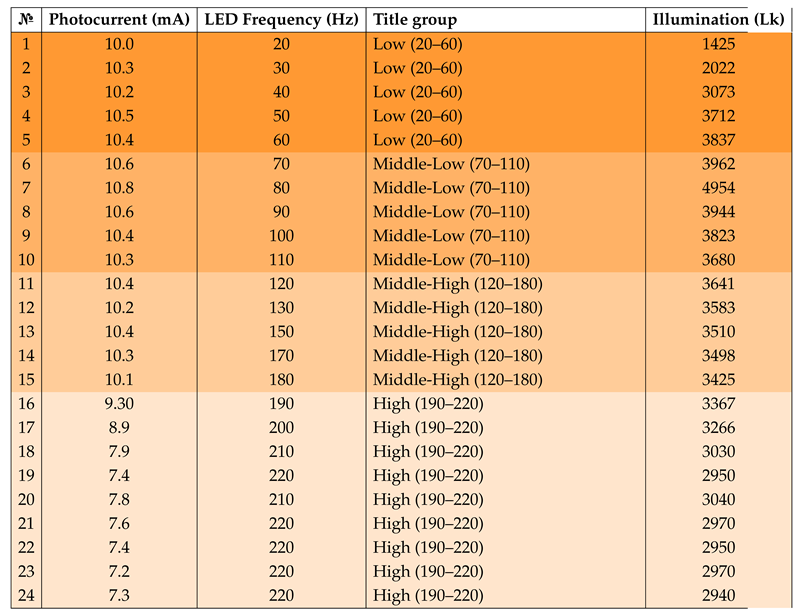
The task arose to temporarily increase photovoltaic generation in order to level the daily PV generation schedule. It is necessary to investigate whether the photocurrent (variable y) generated by the solar cell (measured in microamperes) depends on the frequency (factor x - measured in hertz). For this purpose, ANOVA analyses can be used [20,21]. Let us assume that the assumptions of the variance analysis are met, that is, the PV current has a normal distribution and the backlight frequency has no effect on the variance of y, but causes a divergence of the mean values. We selected frequency groups that were fed to the photovoltaic panel of a series of samples from six batches (batch number j varies from 1 to u) of products (u = 4). The number of measurements in each batch l varies from 1 to 5 (m). The results of the measurements and the division into groups are shown in Table 1. The calculations in the same table are self-explanatory and are necessary to find the sum of squared deviations and sample variances: ; ; ; ... etc. From each batch of lamps, we take the first measurement result and find the sum of the first results, then the second, etc. (for example h). Find the sum of the results (total) of measurements in each attempt (batch). Thus, in the first batch of measurements at j= 1 and . The results were calculated and noted in Excels’s file in Zenodo (ANOVA data model for the current of the PV panel - https://zenodo.org/records/15113282).
Divide the results obtained (for each batch)
The sums of the squared measurement results for each batch were calculated separately. For the first batch
The calculation of the sum results of all measurements:
We find the sum of the squared results of all measurements
Finding the sum of the sum of the squared results of all measurements
Finding the total number of measurements M. The calculation of the overall average for all measurements. The square of the total divided by the number of all observations
The total sum of squared deviations can be calculated
The of squared deviations in the middle of the series can be calculated
Sum of squared deviations between measurement series
The number of batches (series of measurements) u = 4. The number of degrees of freedom in the middle of the series is = M - u. The number of degrees of freedom between the series is = u - 1. The total number of degrees of freedom is = M - 1. The total sample variance is
Sample variance in the middle of the series
Sample variance between series
Checking the significance of the influence of factor x, for which we find the variance ratio (the calculated value of the Fisher’s criterion)
3. Results
3.1. Investigation of the shading effects
It is important to analyze shading effects. For this purpose, it is better to use larger panels and specifically change the area under shade. This test allows students to easily understand the negative influence of shading and analyze the VA characteristics. The VA characteristics obtained are presented in Figure 12.
3.2. Investigation the Frequency of LED Backlighting of a Photovoltaic Panel
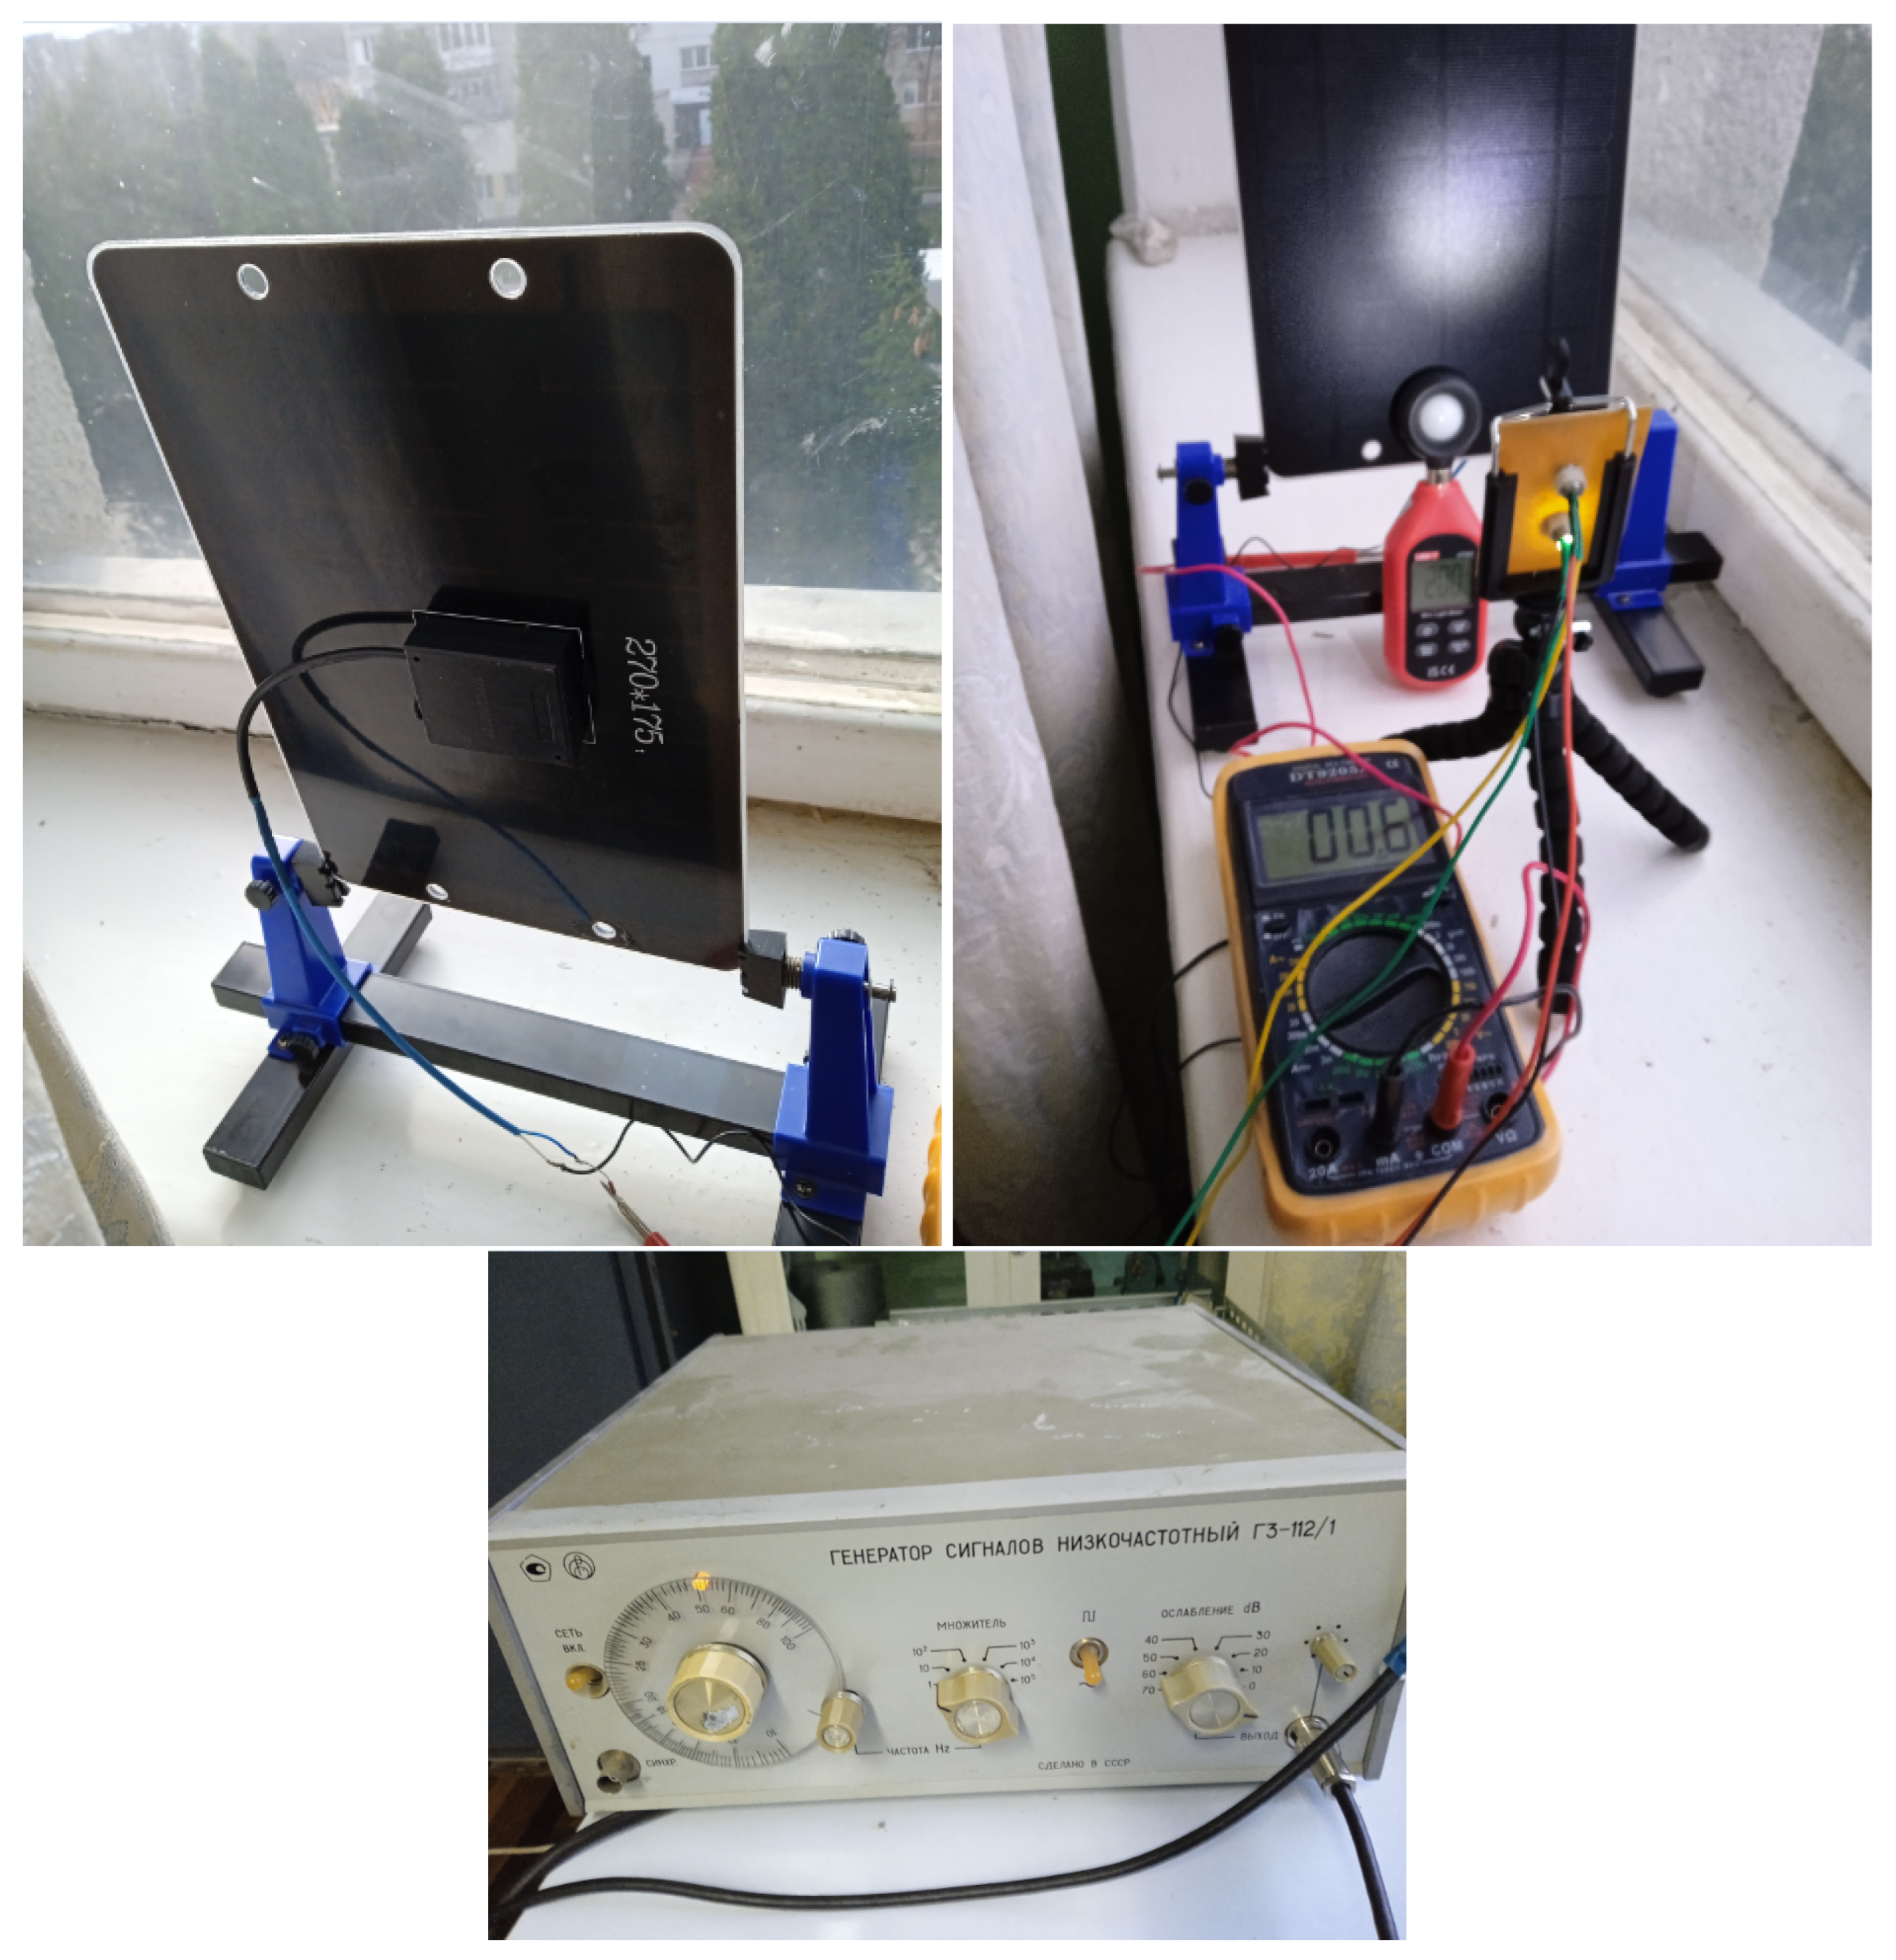
During the operation of photovoltaic panels (PVs), their generation decreases because of short-term interference with the passage of sunlight to the PV. We propose using the light flux from a white LED to illuminate the PV panels at this time.
Let us determine whether the frequency of the harmonic signal (which is supplied from the generator to the LED) affects the photocurrent of the photovoltaic module. Figure 13 shows the equipment for the study; photovoltaic panel, multimeter, luxmeter, photodiodes.
The measurement results are shown in Table 1.

Table 1.
Measurement results
 |
From [20,21], the F test value for the five percent significance level and the number of degrees of freedom and is equal to
Since F < , the effect of frequency on the current of the photovoltaic panel can be considered significant and therefore the panel should be illuminated with LEDs by applying a voltage of 80 Hz.
4. Discussion
During the study, the effect of backlight frequency on the photocurrent generated by the photovoltaic panel (PVP) was analyzed. Data were grouped into four frequency ranges: low (20-60 Hz), medium-low (70-110 Hz), medium-high (120-180 Hz) and high (190-220 Hz) (see Table 1). For each group, photocurrent measurements were taken, followed by a one-way analysis of variance (ANOVA). The results showed:
• F-statistic = 49.47 — indicates a significant difference between the groups.
• p-value = 1.95 × — significantly less than the threshold value of 0.05.
This allows us to reject the null hypothesis with a high level of statistical confidence and conclude that the backlight frequency has a statistically significant effect on the photocurrent generated by the PVP. It is particularly noteworthy that as the frequency increases to a certain optimal value (approximately 80–90 Hz), the photocurrent increases, after which a gradual decrease is observed. This indicates a non-linear relationship between backlight frequency and photocurrent, which should be considered when designing systems for leveling daily generation schedules of PVP.
5. Conclusions
In the paper, the development and implementation of portable and mobile laboratory stands is demonstrated to investigate the parameters of photovoltaic modules under war conditions. These tools are not only innovative but also essential for ensuring the continuity of research in challenging environments and the preparation of new generation power engineering. The integration of advanced sensors, microcontrollers, and data processing systems provides a comprehensive platform for the analysis of PV modules and for the study of students to learn new technologies. The results obtained highlight the importance of accurate parameter estimation and real-time monitoring to optimize the performance and efficiency of photovoltaic systems in the Ukrainian power system operating under Ukrainian conditions. The study also underscores the need for continued innovation and adaptation in the face of environmental and operational challenges. In general, the research presented in this paper makes a significant contribution to the field of renewable energy, offering practical solutions to improve the resilience and effectiveness of the research of PV modules. Future studies should build on these findings, exploring new technologies and methodologies to further advance the field. The originality of the code of the tracker control program is the presence of a module that, based on the signal coming from the anemometer, commands the horizontal position of the desktop. The developed stands allow the location of research to be changed in cases of threat to the life of researchers during military operations or during natural disasters. The developed remote laboratory stands are in the Laboratory of "Solar Energy, Energy Storage Systems and Production Forecasting" and are used in the educational process of students specializing in specialty 145 – Renewable Energy Sources and Hydropower [22,23].
Author Contributions
Conceptualization, S.B., O.R., A.S., I.H., M.B. and O.R.; methodology, O.R. and O.R..; validation, M.B. and S.B., O.R., A.S.; formal analysis, M.B. and O.R., O.R.; investigation, I.H., M.B. and O.R. and O.R.; resources, I.H., M.B. and O.R. O.R..; writing—original draft preparation, A.S., M.B. and O.R.; writing—review and editing, S.B., O.R., A.S., I.H., M.B. and O.R. All authors have read and agreed to the published version of the manuscript
Funding
This results were supported by projects 25-PKVV-UM-001, and MSCA4Ukraine ID number 1233365.
Data Availability Statement
Most data are included in the article. Additional information and data are available from the corresponding author if required.
Acknowledgments
We want to say thanks to the University of West Bohemia in Pilsen, Vinnitsya National Technical University, Institute of Renewable energy NAS Ukraine for all round support in this research work.
Conflicts of Interest
The authors declare no conflicts of interest.
Appendix A. Arduino Code for Sensor and Communication
Appendix B. Arduino Code for Solar Tracker
References
- Cleary, K.; Palmer, K. Renewables 101: Integrating Renewable Energy Resources into the Grid; Resources for the Future: 2020. Available online: https://www.rff.org/publications/explainers/renewables-101-integrating-renewable-energy-resources-grid/ (accessed on 18 April 2024).
- Belik, M.; Rubanenko, O. Implementation of Digital Twin for Increasing Efficiency of Renewable Energy Sources. Energies 2023, 16, 4787. [Google Scholar] [CrossRef]
- Passage of the Autumn-Winter Periods of 2022–2024. State of the Power System. 18 April 2024. Available online: https://www.irf.ua/prohodzhennya-osinno-zymovyh-periodiv-2022-2024-rr-stan-energosystemy/ (accessed on 18 April 2024).
- Russia’s War on Ukraine: Implications for EU Energy Supply. European Union, 2022. Available online: https://www.europarl.europa.eu/RegData/etudes/ATAG/2022/729281/EPRS_ATA (accessed on day month year).
- Galushchenko, G. 50% of Ukraine’s Energy Infrastructure has been Damaged. United for Justice Conference, Lviv, 2022. Available online: https://www.kmu.gov.ua/en/news/poshkodzheni-50enerhetychnoi-infrastruktury-ukrainy-rosiia-maie-vidpovistyza-tse-herman-halushchenko (accessed on 18 April 2024).
- Draft Ukraine Recovery Plan: Materials of the "Audit of War Damage", 2022. Available online: https://upload sssl.webflow.com/621f88db25fbf24758792dd8/62c48b51bd97677a3c4d7b1c_Audit%20of%20war%20damag e.pdf (accessed on 18 April 2024).
- Ukrenergo Showed a Transformer Hit by a Russian Missile. Available online: https://www.unian.ua/econo mics/energetics/viyna-v-ukrajini-v-ukrenergo-pokazali-transformator-v-yakiy-vluchila-rosiyska-raketa-120 48951.html (accessed on 18 April 2024).
- Trunova, I.; Miroshnyk, O.; Ladyzhynskii, I.; Moroz, O.; Onegina, V.; Qawaqzeh, M. The Motivational Model for Improvement of Electricity Supply Continuity in Post-War Ukraine. In Proceedings of the 2023 IEEE 4th KhPI Week on Advanced Technology (KhPIWeek), Kharkiv, Ukraine; 2023; pp. 1–6. [Google Scholar]
- Palmiotti, E.C.; et al. Growing Panes: Investigating the PV Technology Trends Behind Frequent Early Failures in Modern Glass–Glass Modules. IEEE J. Photovoltaics 2025, 15, 297–308. [Google Scholar] [CrossRef]
- Rubanenko, O.; Belik, M.; Rubanenko, O.; Bobba, P.B.; Smaglo, I.; Lakshmi, G.S. Determining Probable Locations of Photovoltaic Modules Malfunctions. In Proceedings of the 2024 IEEE 4th International Conference on Sustainable Energy and Future Electric Transportation (SEFET), Hyderabad, India; 2024; pp. 1–6. [Google Scholar] [CrossRef]
- Li, G.; Zhang, Y.; Zhou, H.; Guan, Y. Parameter Identification and Output Characteristics Modelling of Photovoltaic Module Based on Effective Irradiance Correction. Trans. China Electrotech. Soc. 2024. [Google Scholar]
- Hao, S.; Qi, T.; Ma, X.; Li, J.; Li, T. RP-CFANet: An Adaptive Photovoltaic Hot-Spot Fault Detection Network Based on Region Perception and Cross-Channel Feature Aggregation. IEEE Trans. Instrum. Meas. 2025. [Google Scholar] [CrossRef]
- Choi, H.; et al. Optimal Inclination and Azimuth Angles of a Photovoltaic Module With Load Patterns for Improved Power System Stability. IEEE J. Photovoltaics 2024, 14, 525–537. [Google Scholar] [CrossRef]
- Castallà, M.; Kapouropoulos, K.; Urbano, E.; Romeral, L. Supervision and Fault Detection System for Photovoltaic Installations Based on Classification Algorithms. Renew. Energy Power Qual. J. 2020, 18, 375–379. [Google Scholar]
- Kandeal, A.W.; Elkadeem, M.R.; Thakur, A.K.; Abdelaziz, G.B.; Sathyamurthy, R.; Kabeel, A.E.; Yang, N.; Sharshir, S.W. Infrared Thermography-Based Condition Monitoring of Solar Photovoltaic Systems: A Mini Review of Recent Advances. Sol. Energy 2021, 223, 33–43. [Google Scholar] [CrossRef]
- Degradation of PV Modules, Inverters, Components and System. Available online: https://energy.ec.europ a.eu/system/files/2022-09/degradation-of-pv-modules-inverters-components-and-system.pdf (accessed on 18 April 2024).
- Performance Ratio - Quality Factor for the PV Plant. Available online: https://www.pv-tech.org/technical-briefing/performance-ratio-quality-factor-for-the-pv-plant/ (accessed on 18 April 2024).
- Shimada, S.; Mizuochi, H.; Takeuchi, W. Investigation of Spectral Variations in Different Solar Photovoltaic Modules Using Spaceborne and In-Situ Hyperspectral Data. IEEE J. Sel. Top. Appl. Earth Obs. Remote Sens. 2025. [Google Scholar] [CrossRef]
- Belik, M.; Rubanenko, O.; Bobba, P.B. Increasing Efficiency PV System Due Considering Technical Condition. In Proceedings of the 2024 IEEE 65th Int. Sci. Conf. Power and Electrical Engineering of Riga Technical University (RTUCON), Riga, Latvia; 2024; pp. 1–5. [Google Scholar] [CrossRef]
- Plonsky, M. One Way ANOVA. Available online: https://www.uwsp.edu/psych/stat/12/anova-1w.htm (accessed on 13 November 2007).
- Gupta, B.B.; Gaurav, A.; Chui, K.T. Robust Phishing Detection in Consumer IoT Devices with ANOVA F-Test and Satin Bowerbird Optimization of Deep Learning Model. In Proceedings of the 2025 IEEE Int. Conf. Consumer Electronics (ICCE), Las Vegas, NV, USA; 2025; pp. 1–6. [Google Scholar]
- Laboratory of "Solar Energy, Energy Storage Systems and Production Forecasting." Available online:. Available online: https://iq.vntu.edu.ua/departs/index.php?id=219&mode=new_item&f=674/main/Bak_laboratorii_VDE.h tml (accessed on 18 April 2024).
- Renewable Energy Laboratory Catalog. Online Flipbook. (accessed on 18 April 2024).
Figure 1.
Energy profile Ukraine.
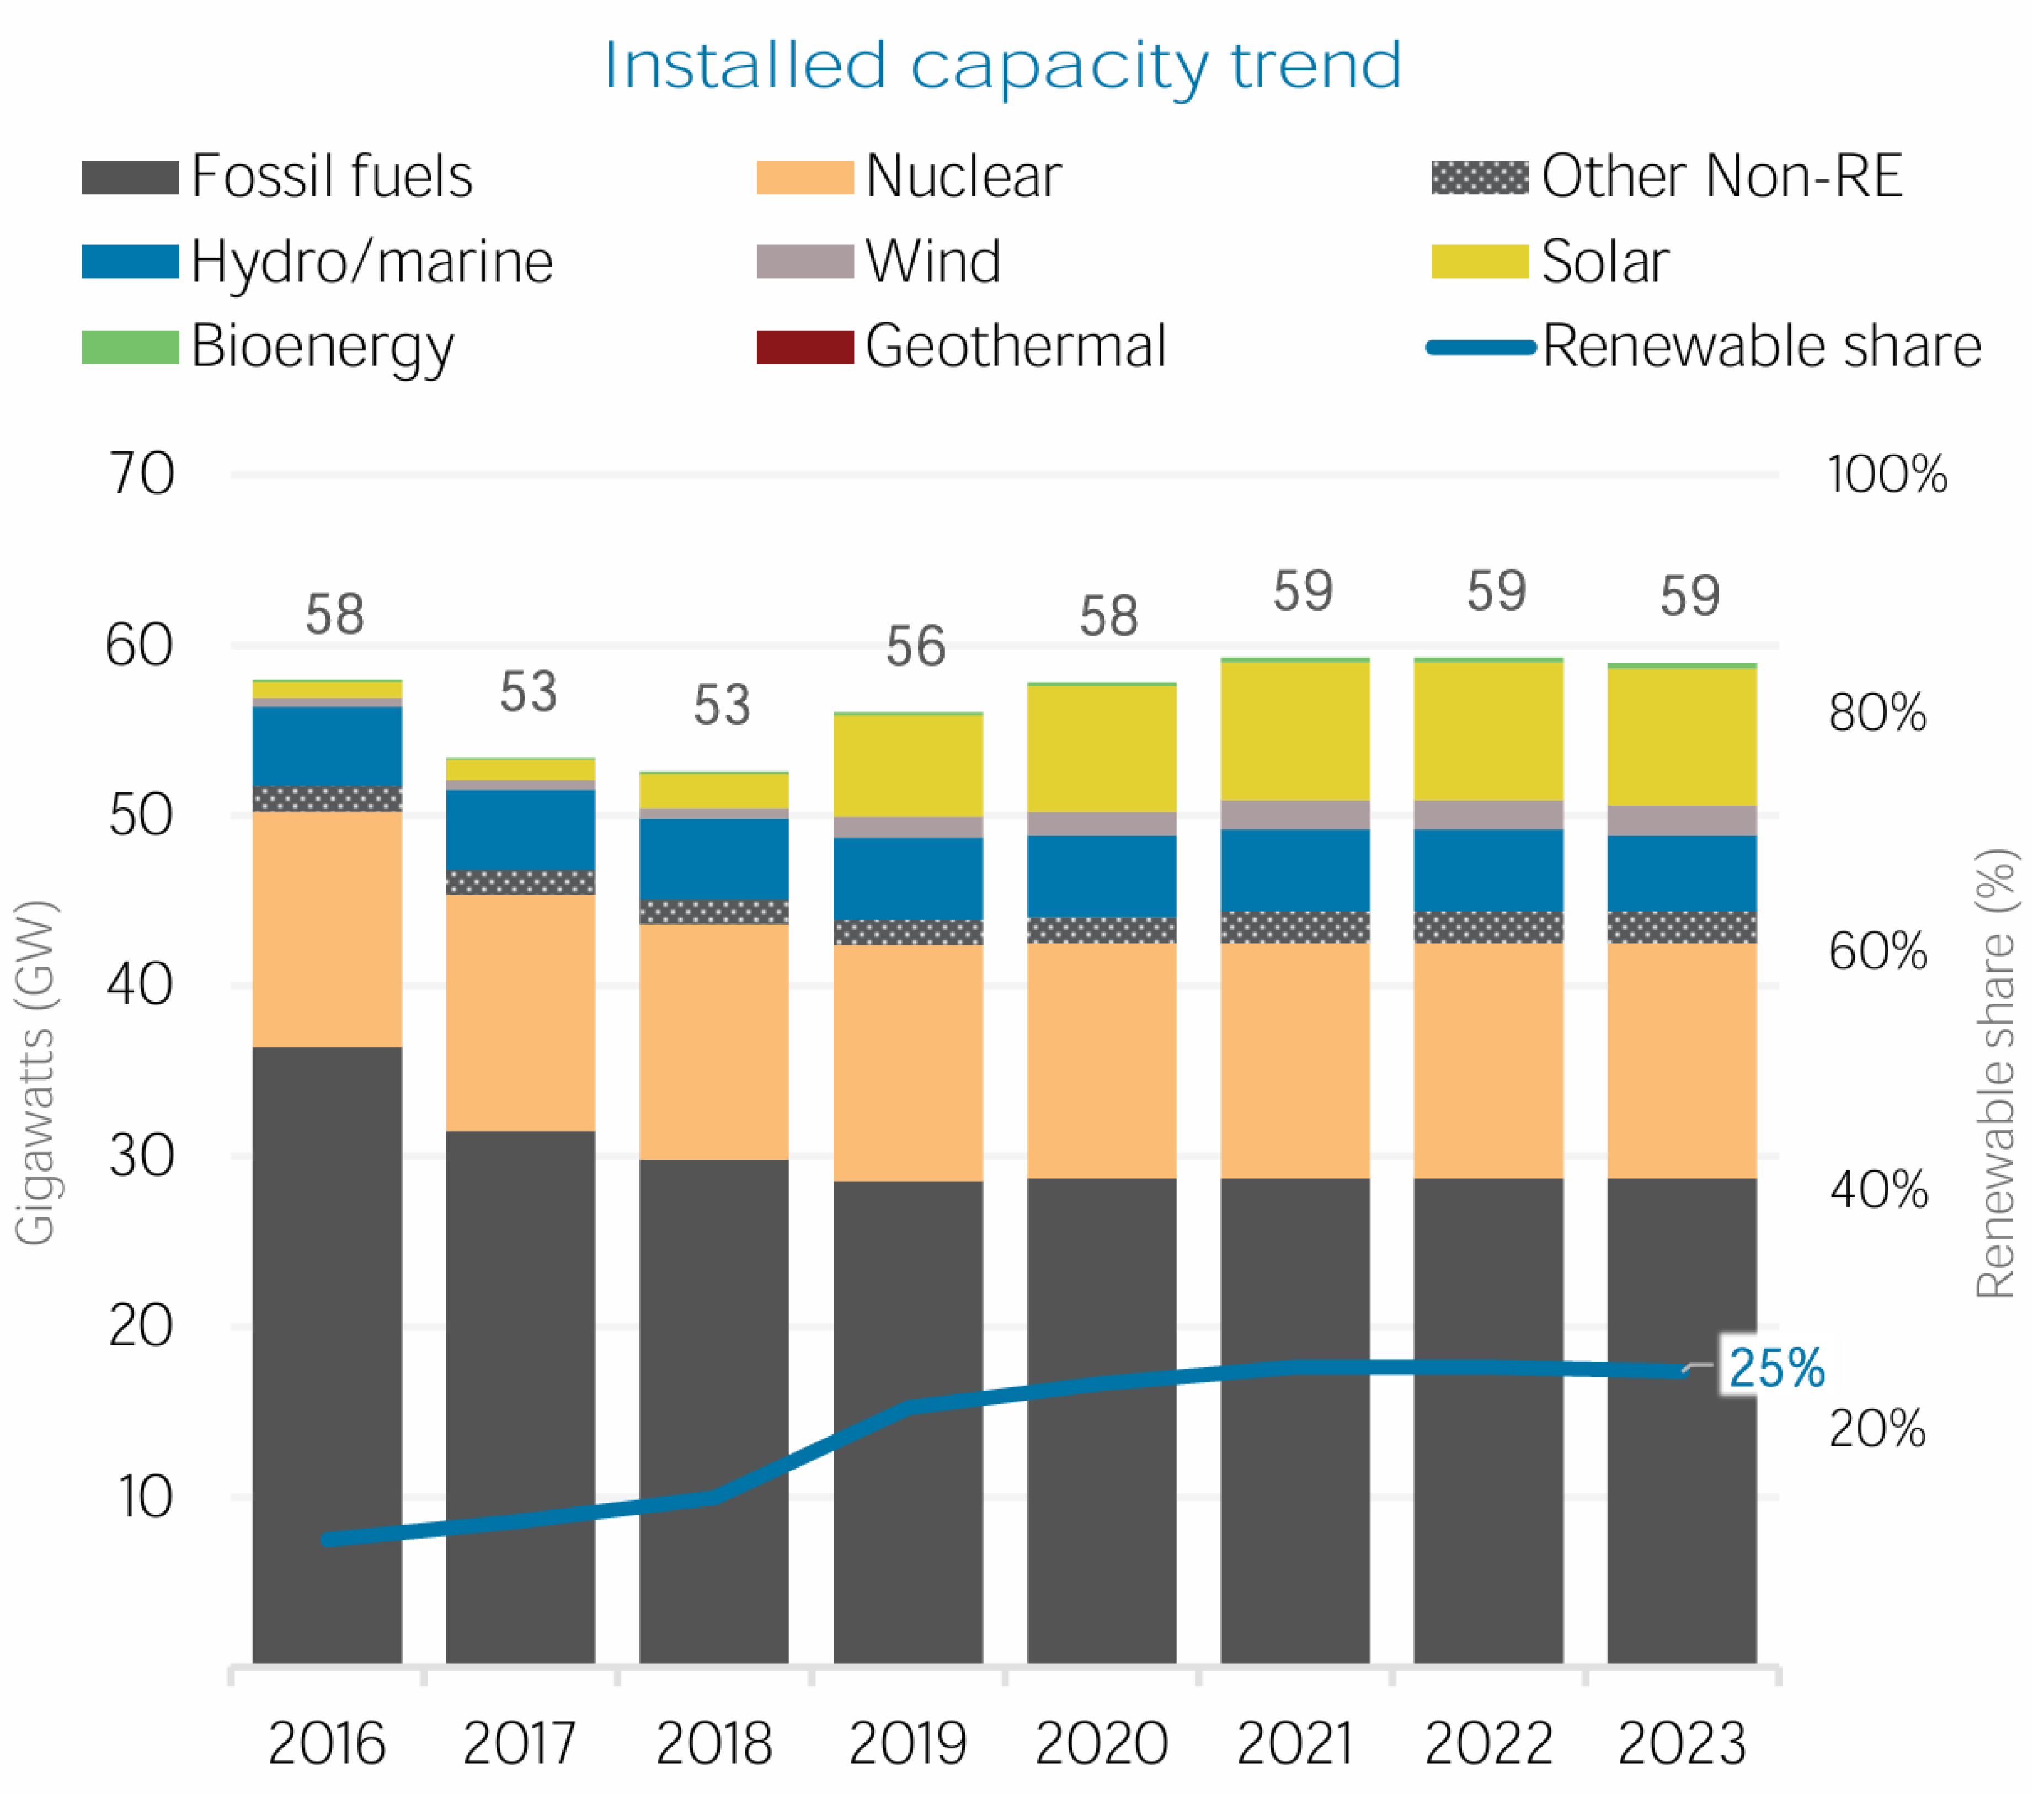
Figure 4.
Test bench for control and research of the photovoltaic module (continued).
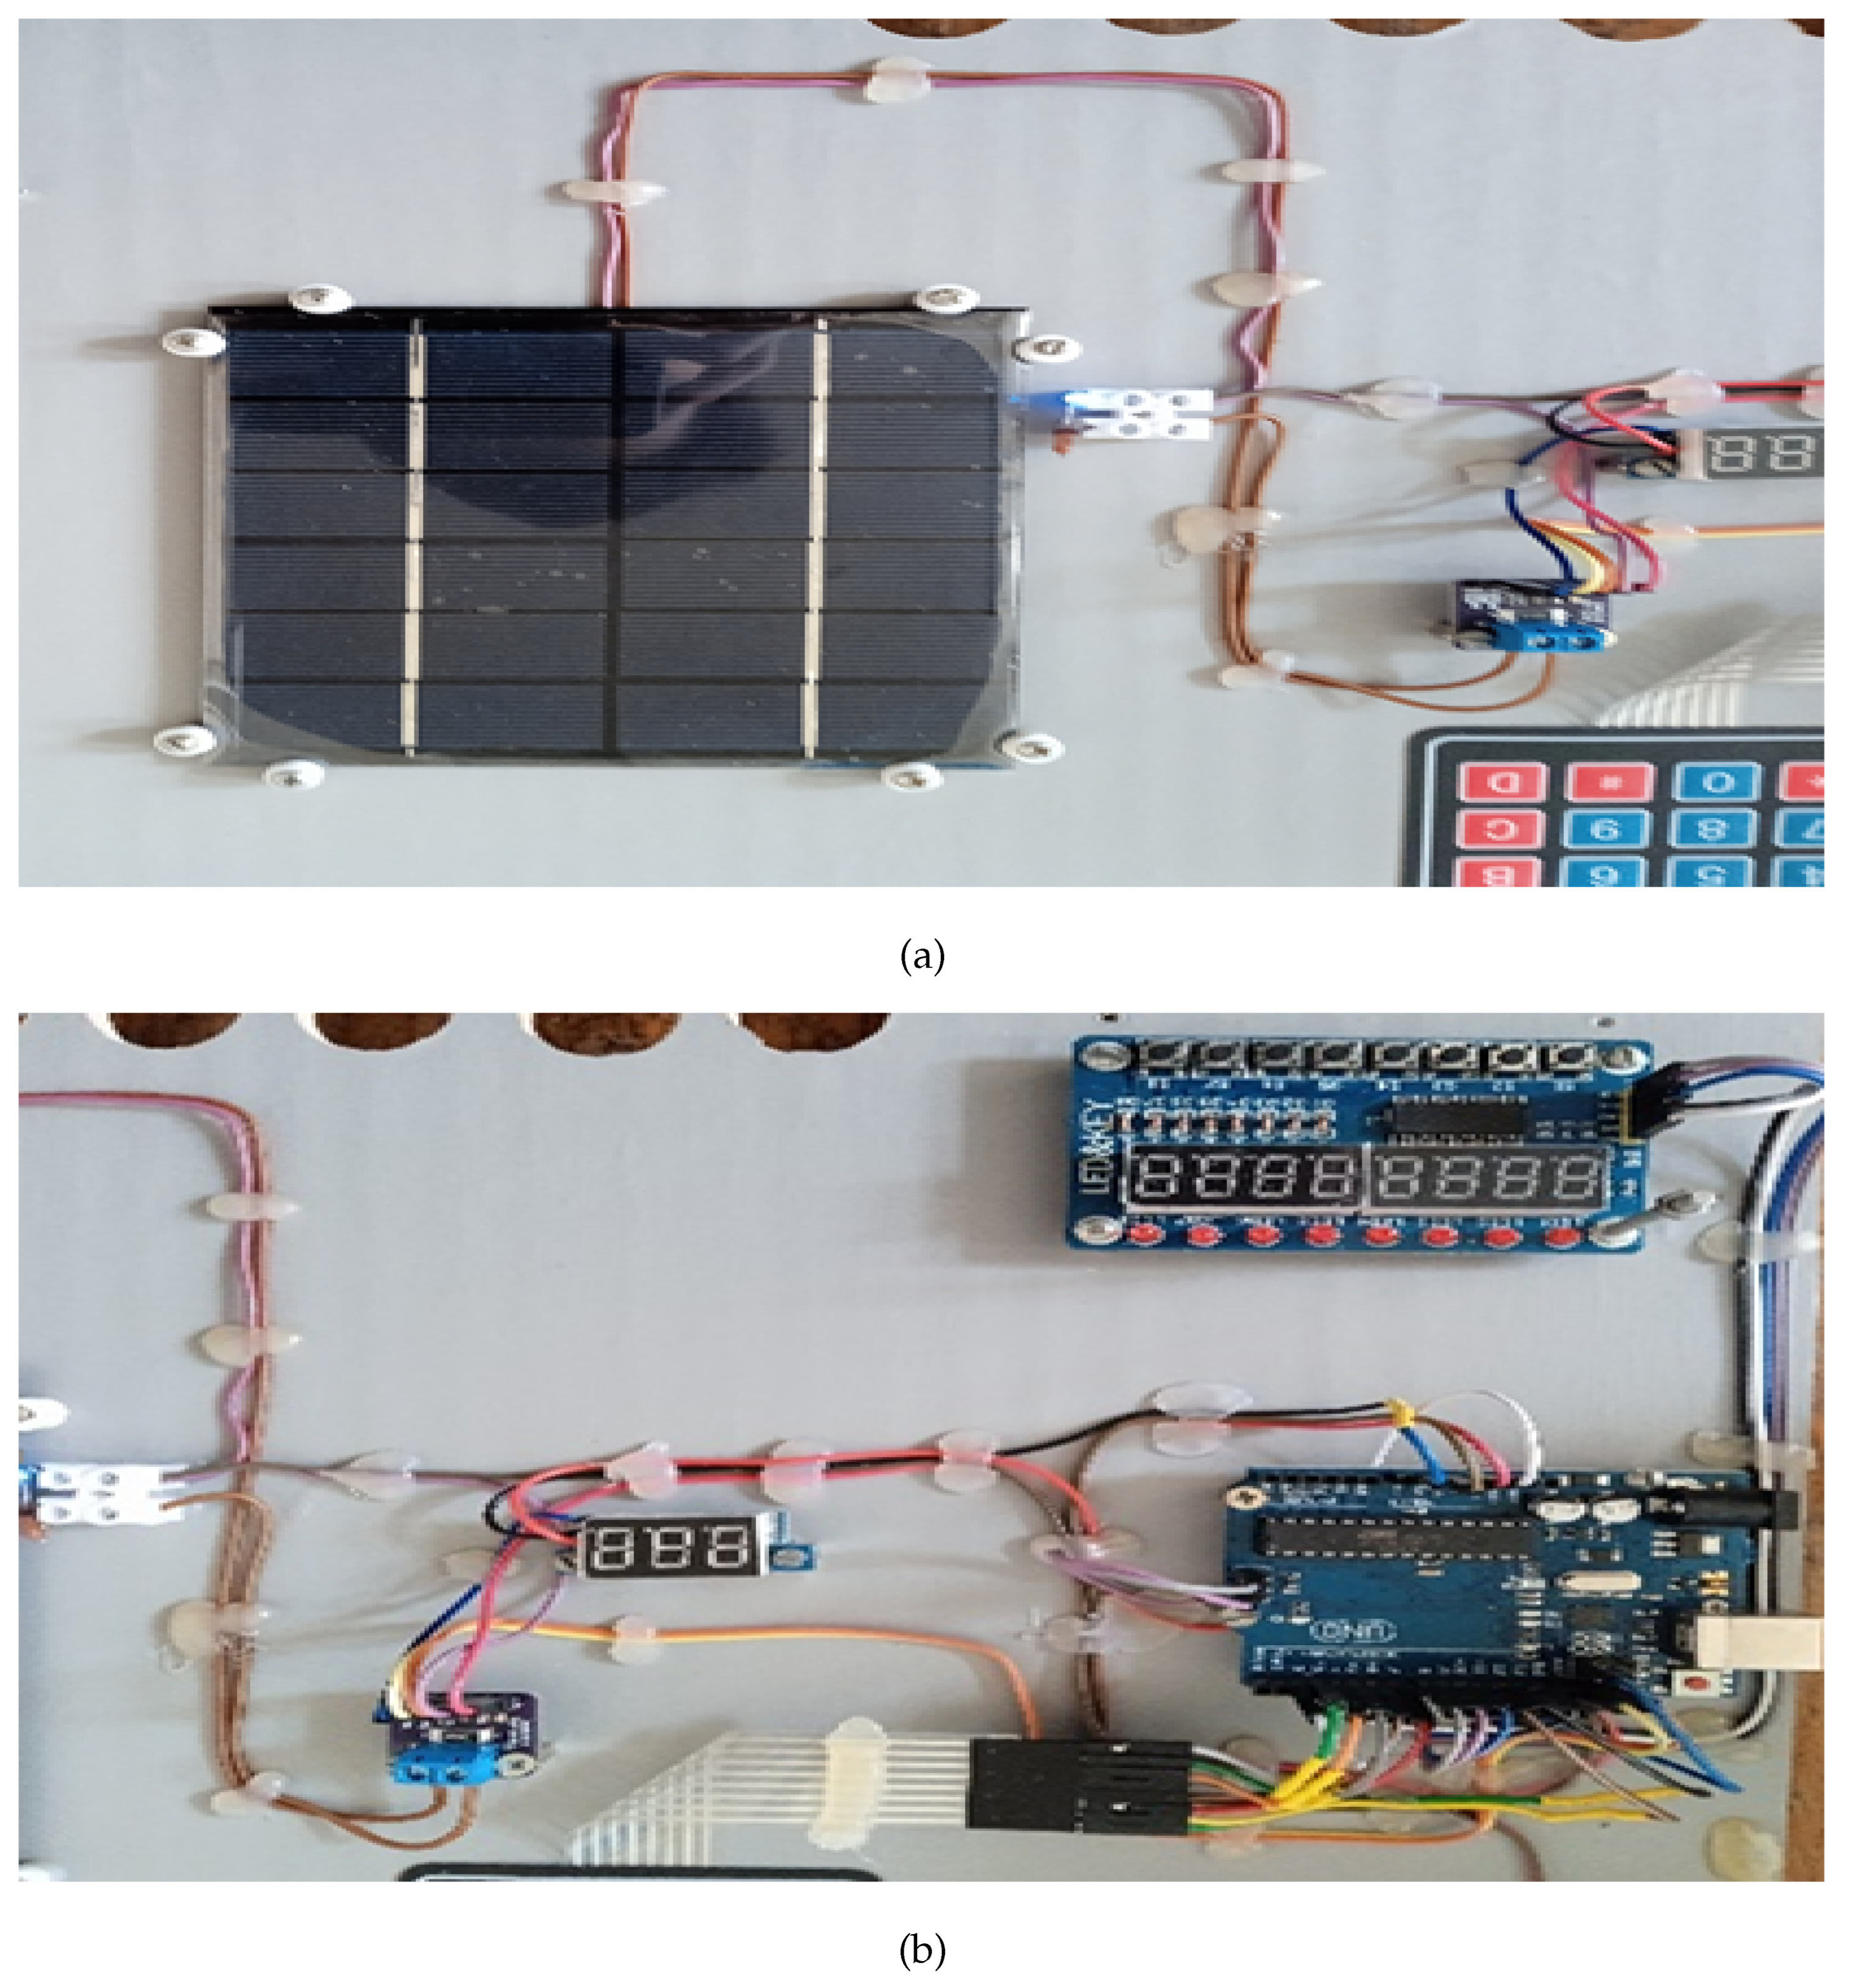
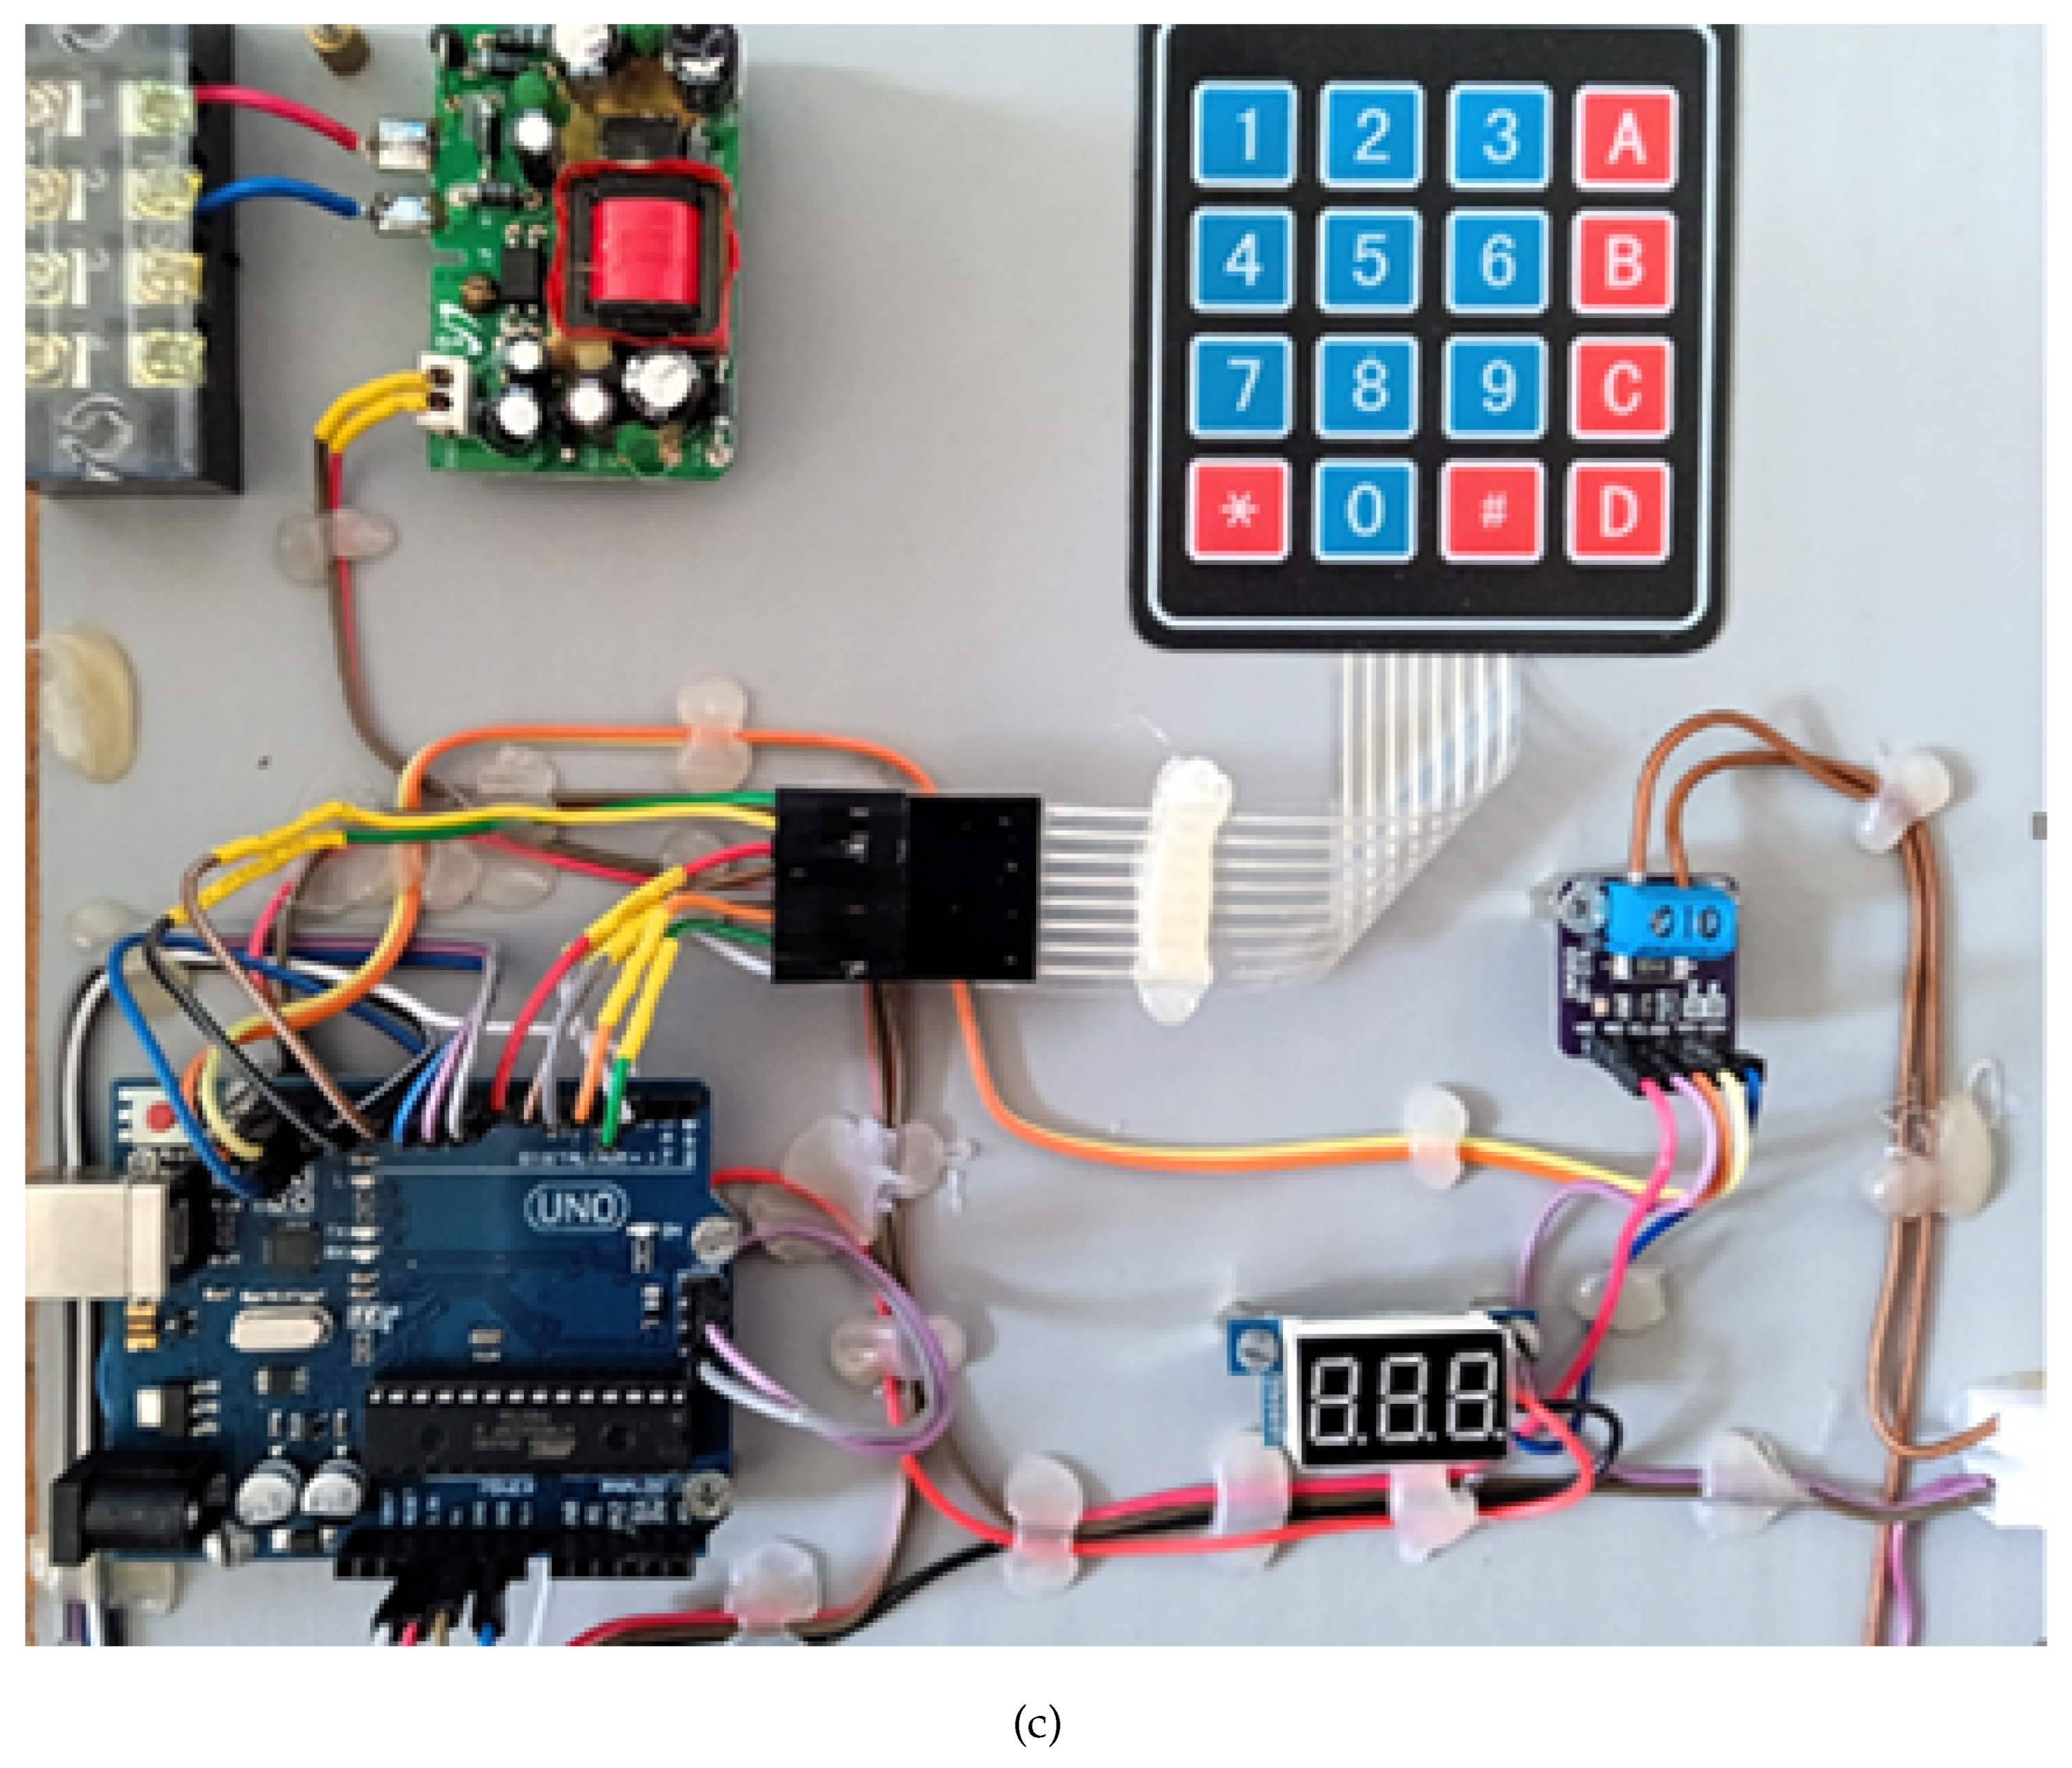
Figure 5.
Scanner of parameters of photovoltaic modules
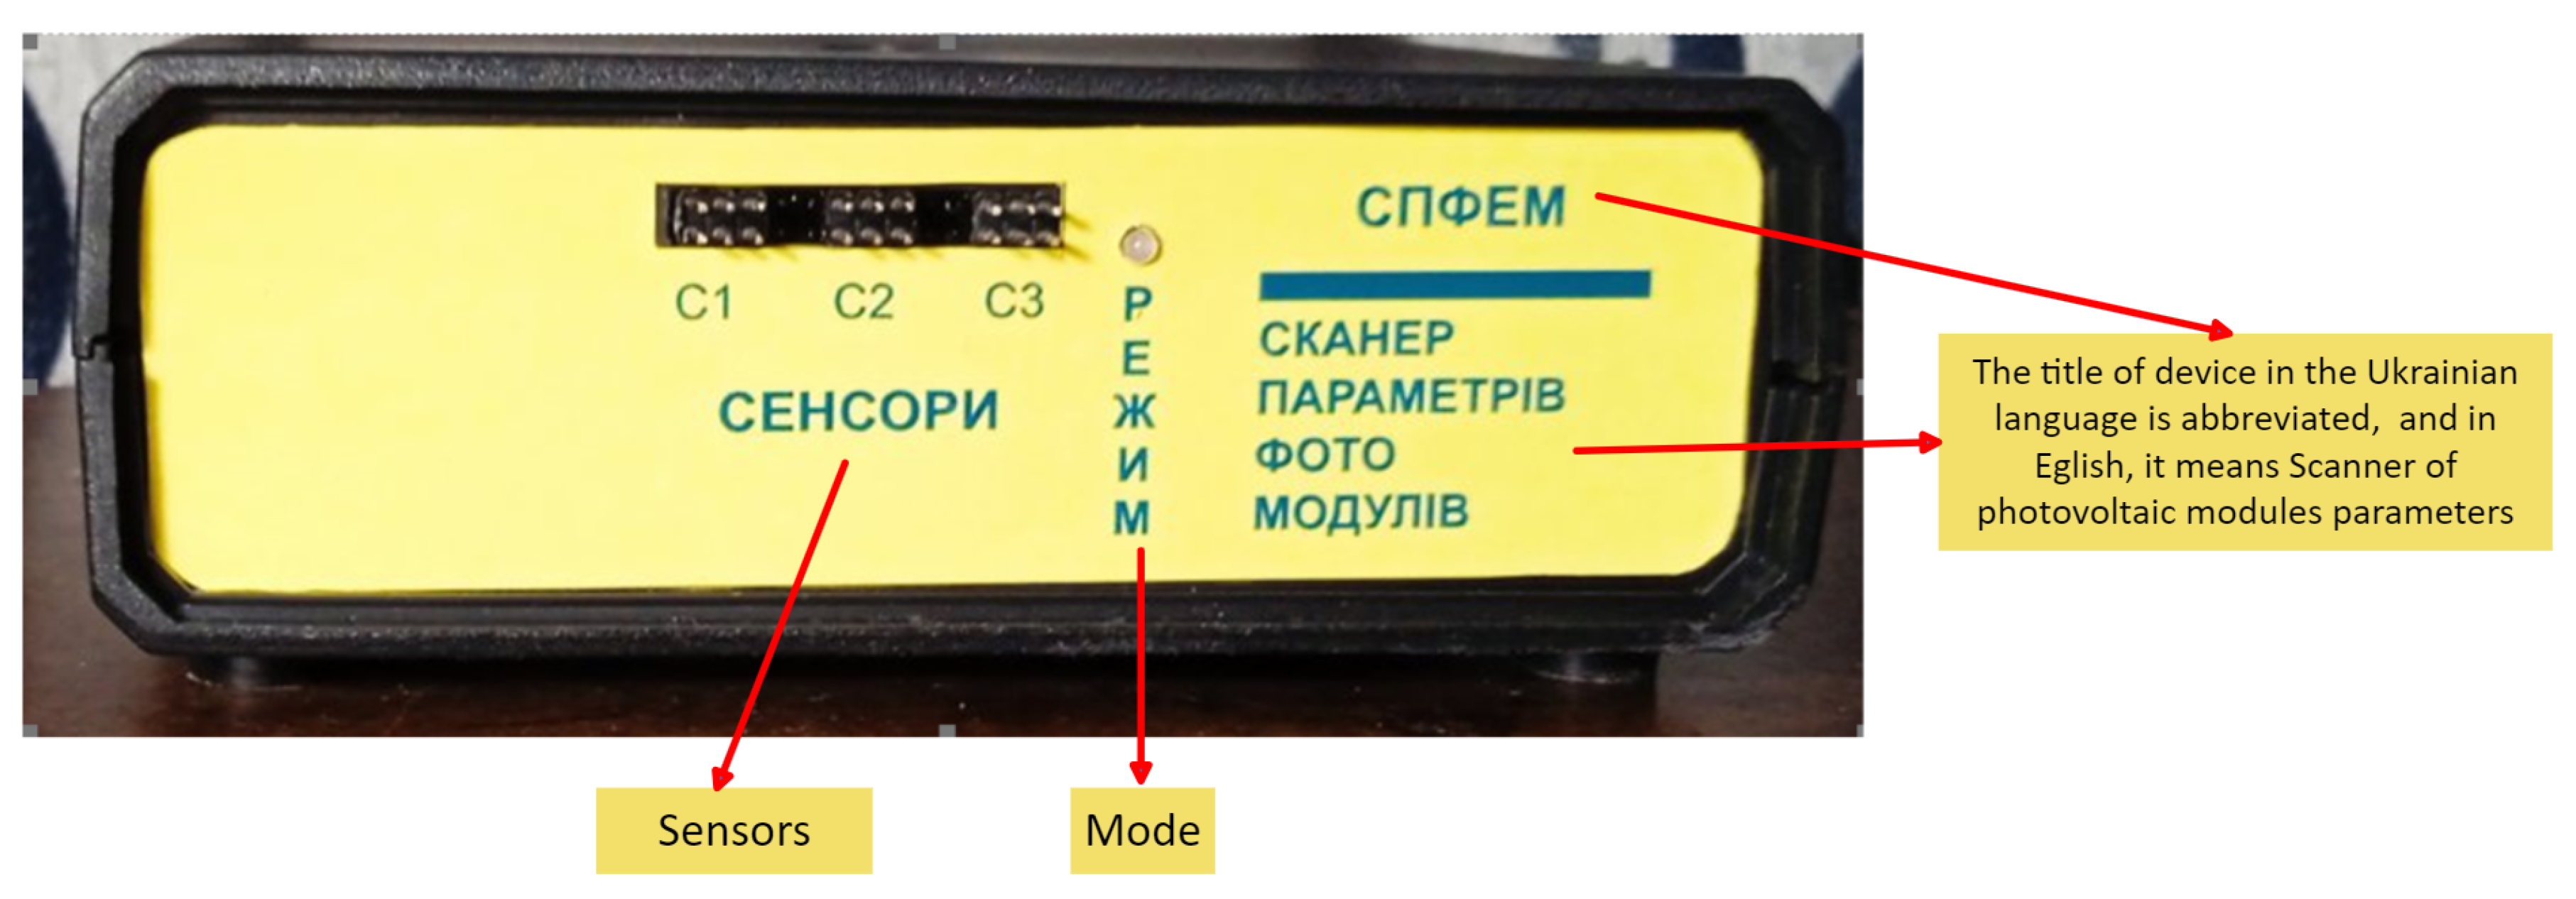
Figure 6.
The view of the SPFEM testbed board
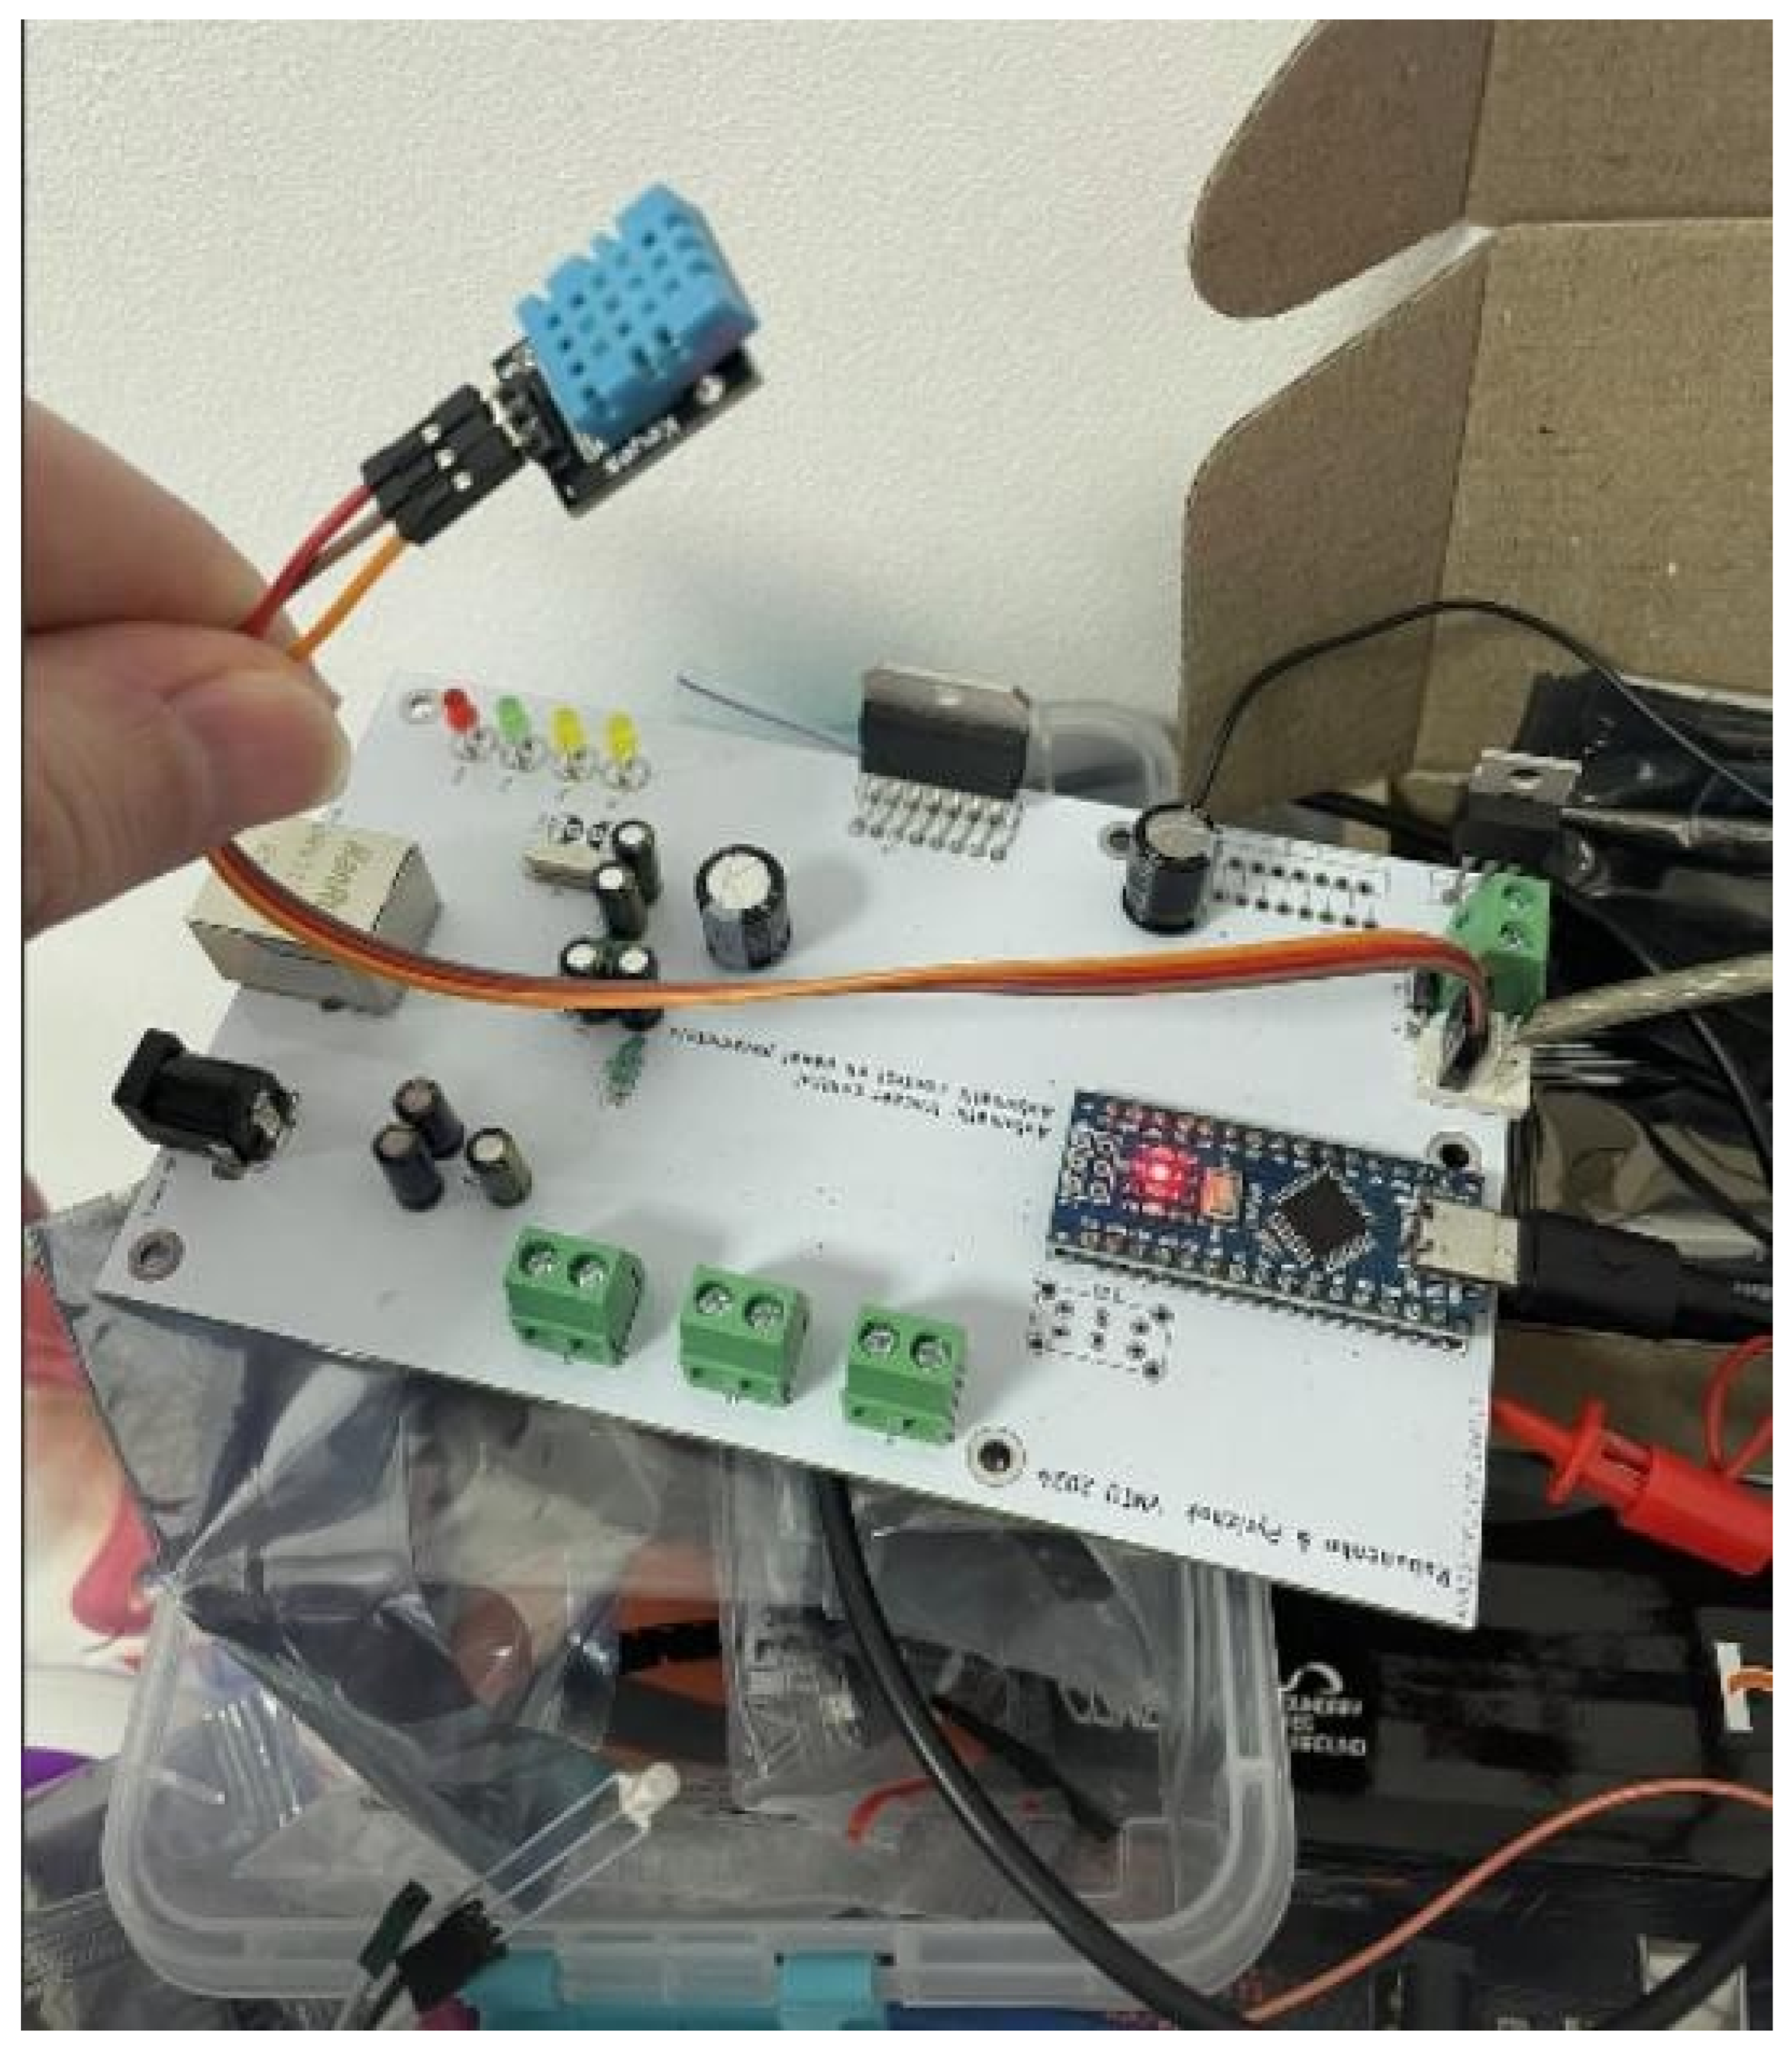
Figure 7.
Structural scheme of the system for monitoring the parameters of photovoltaic modules
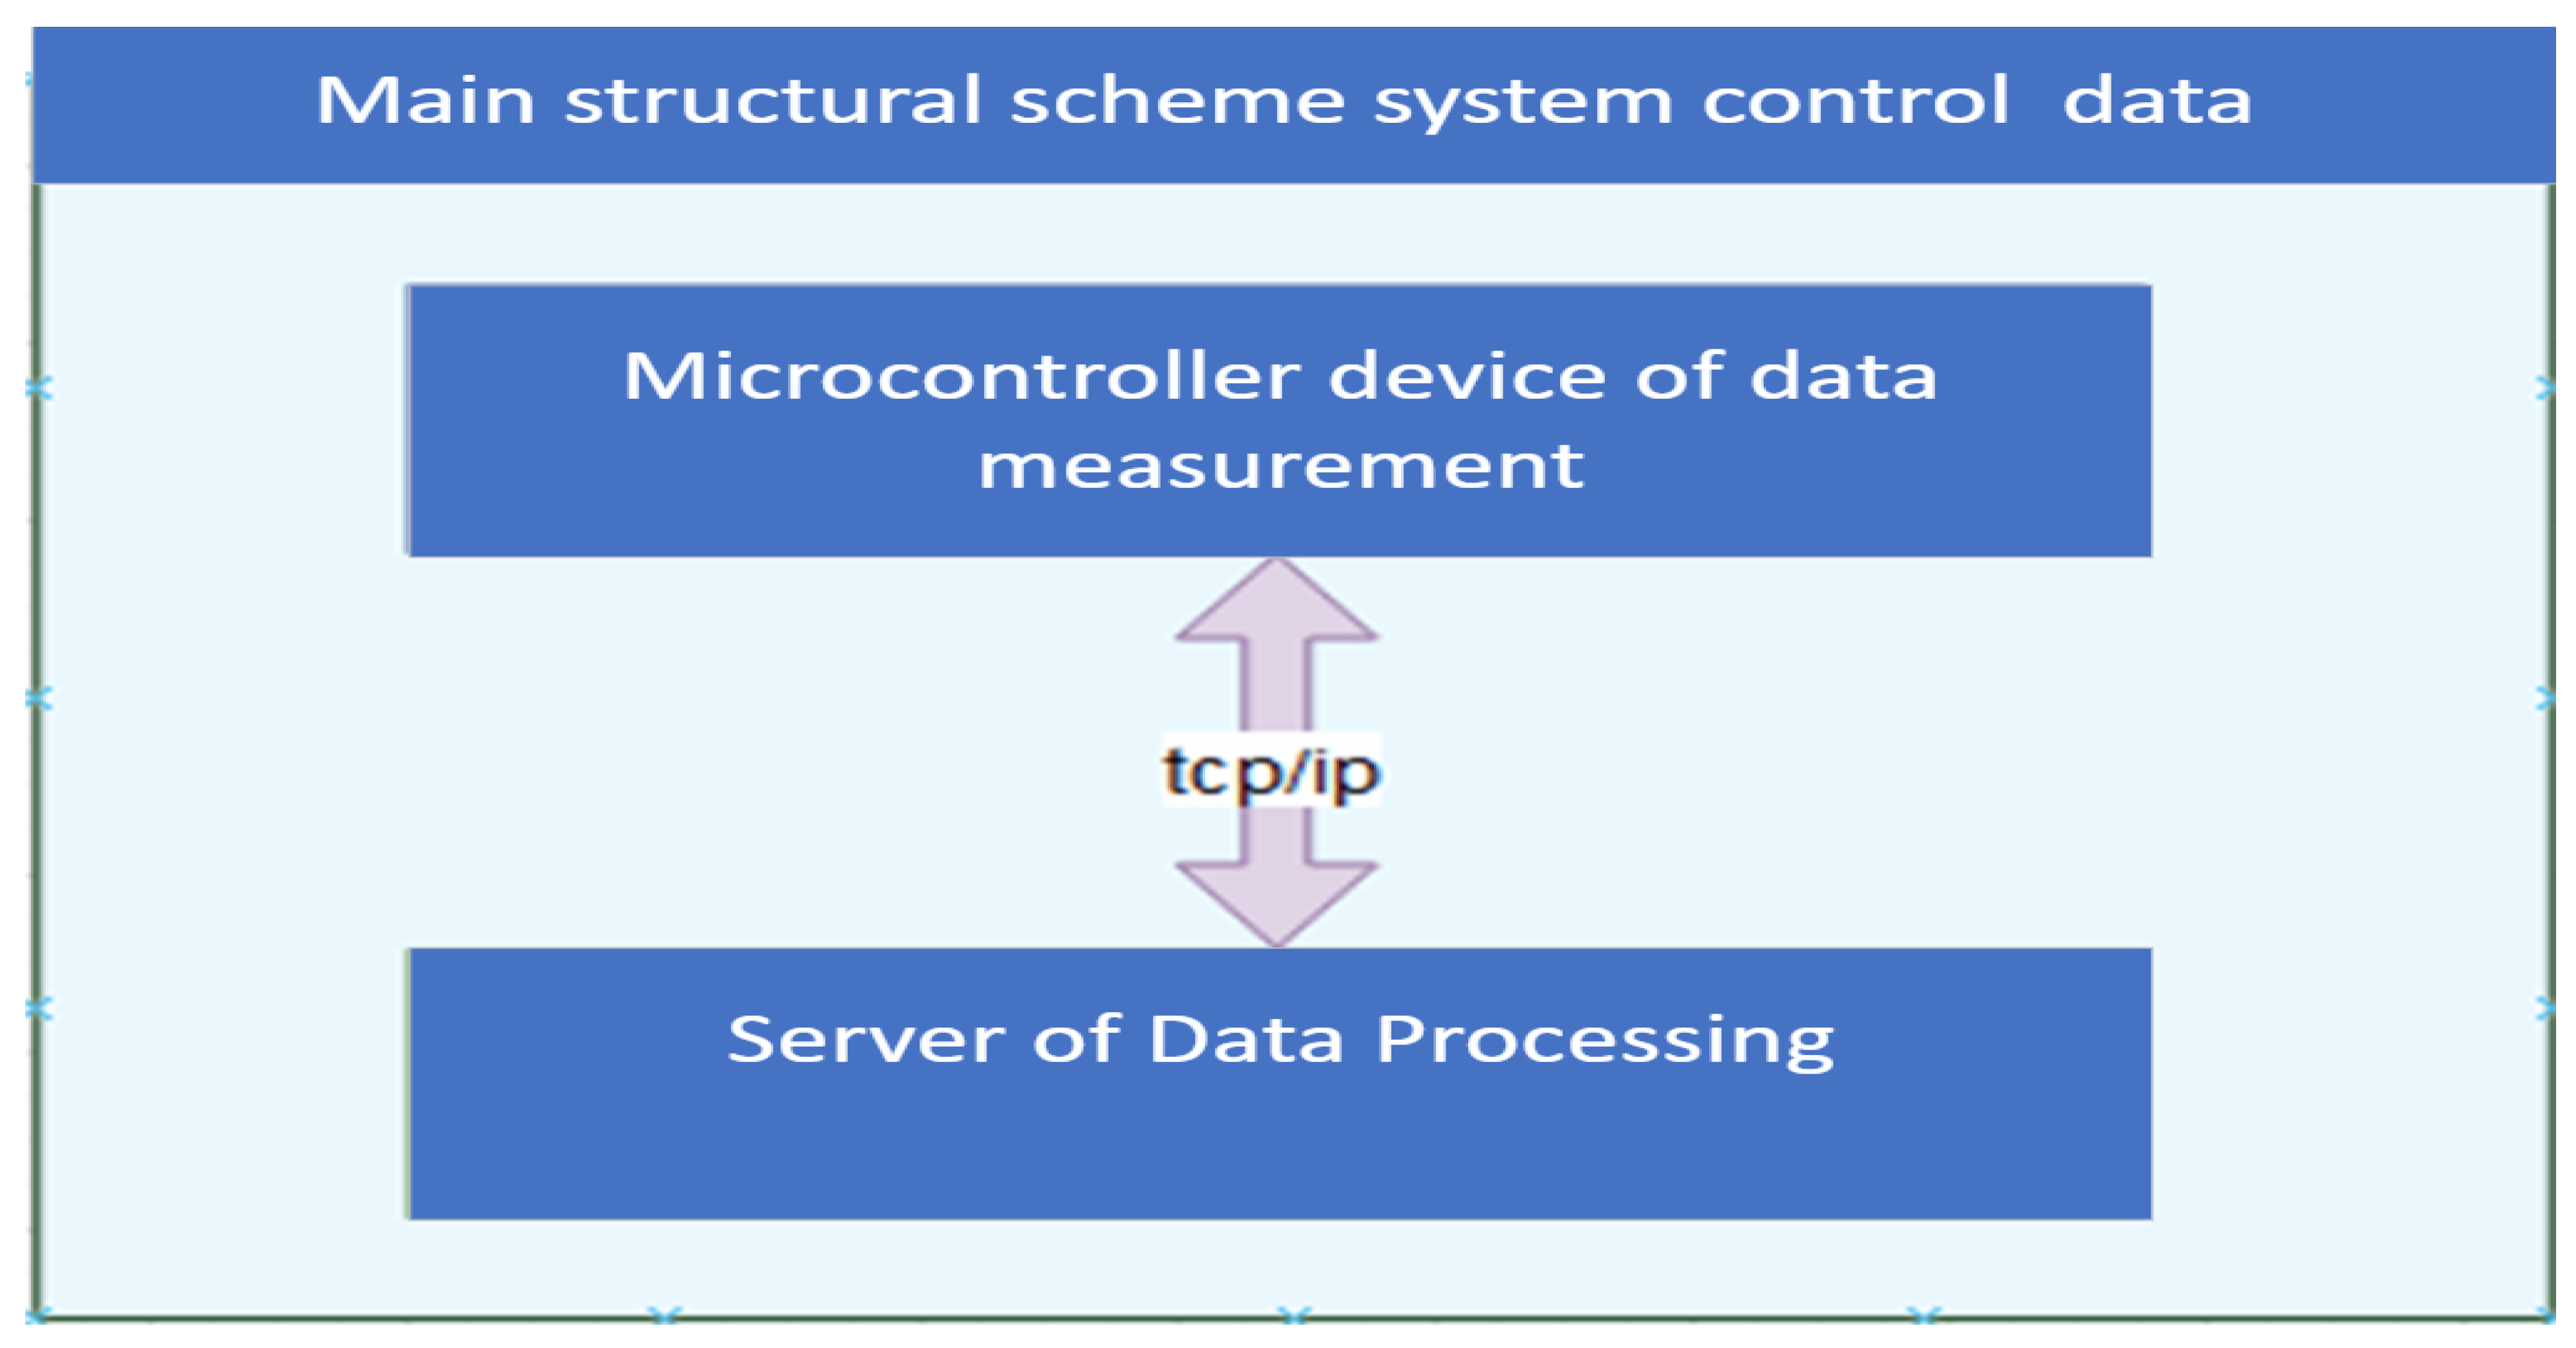
Figure 8.
Structural scheme of the system for monitoring the parameters of photovoltaic modules
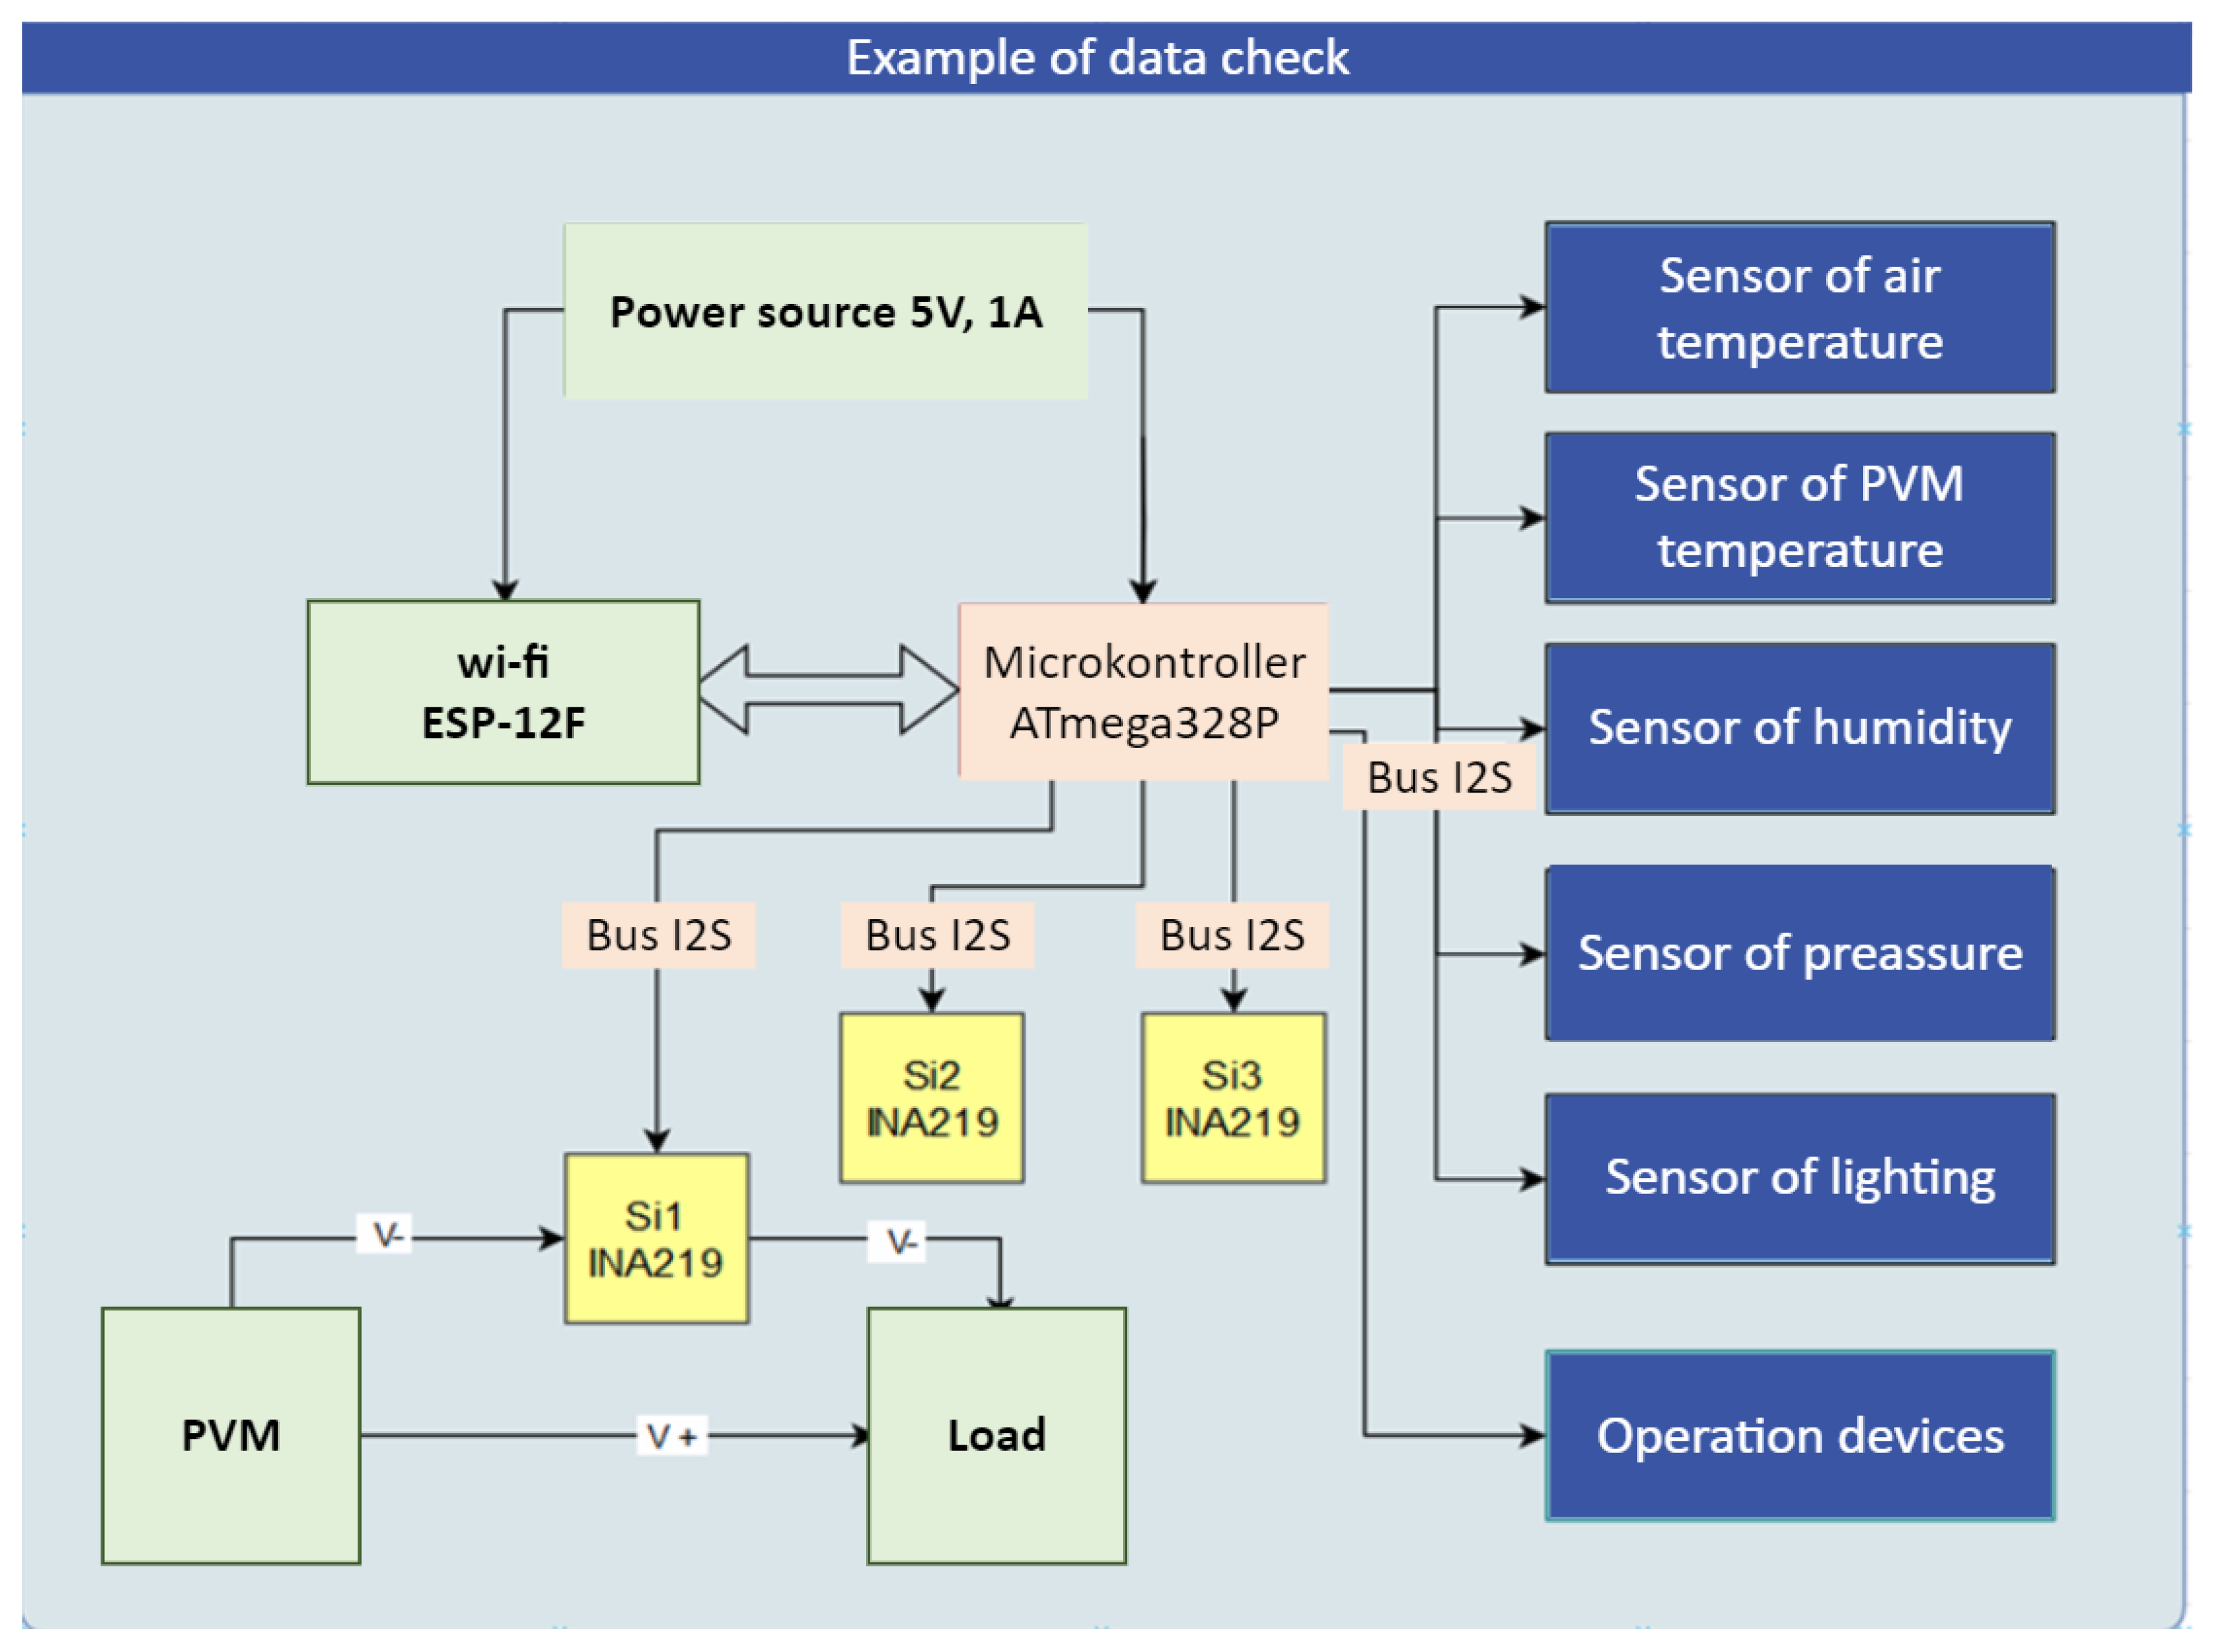
Figure 9.
Block INA 219
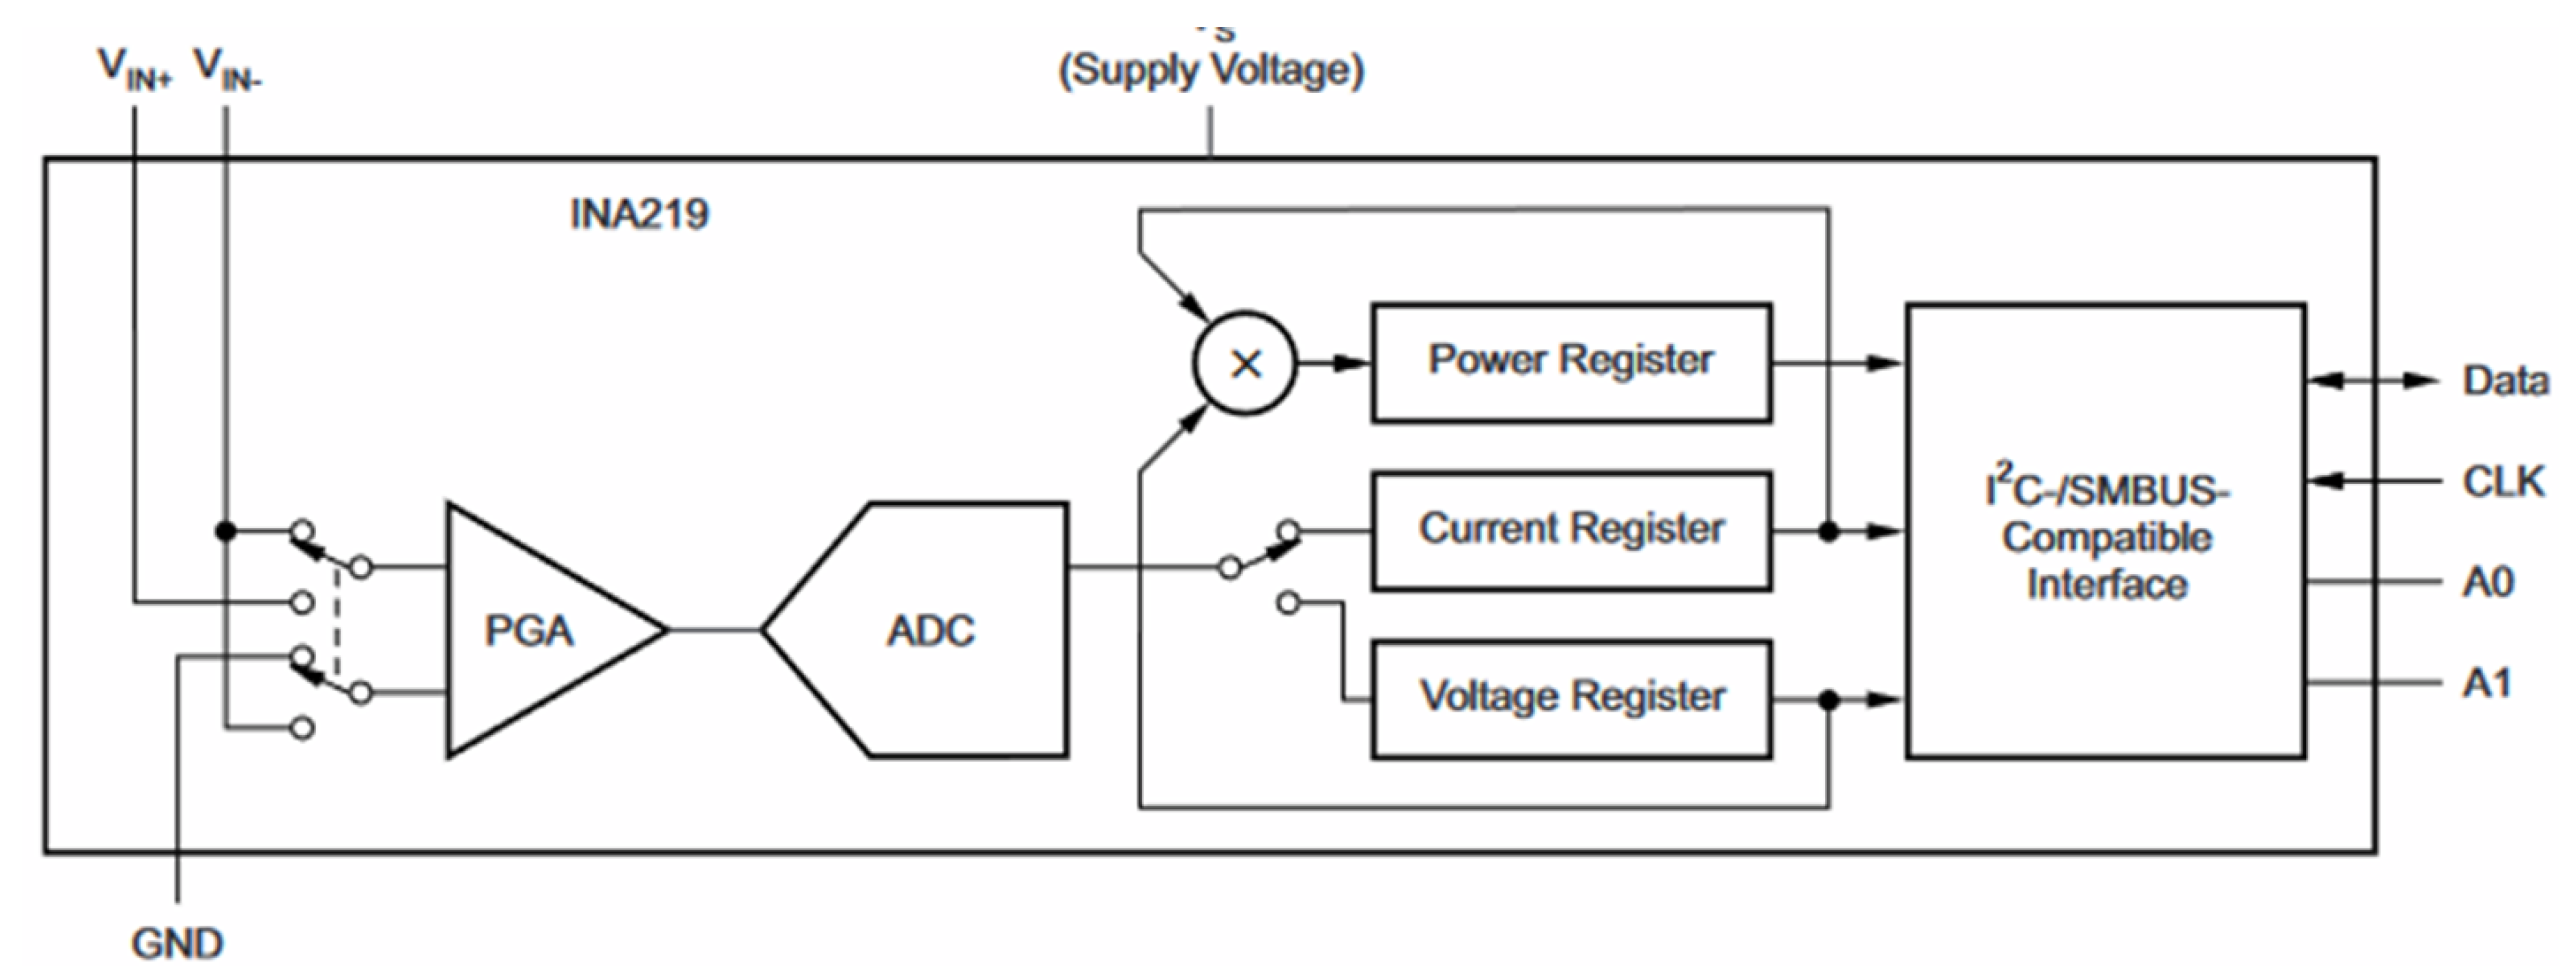
Figure 10.
PVM control system
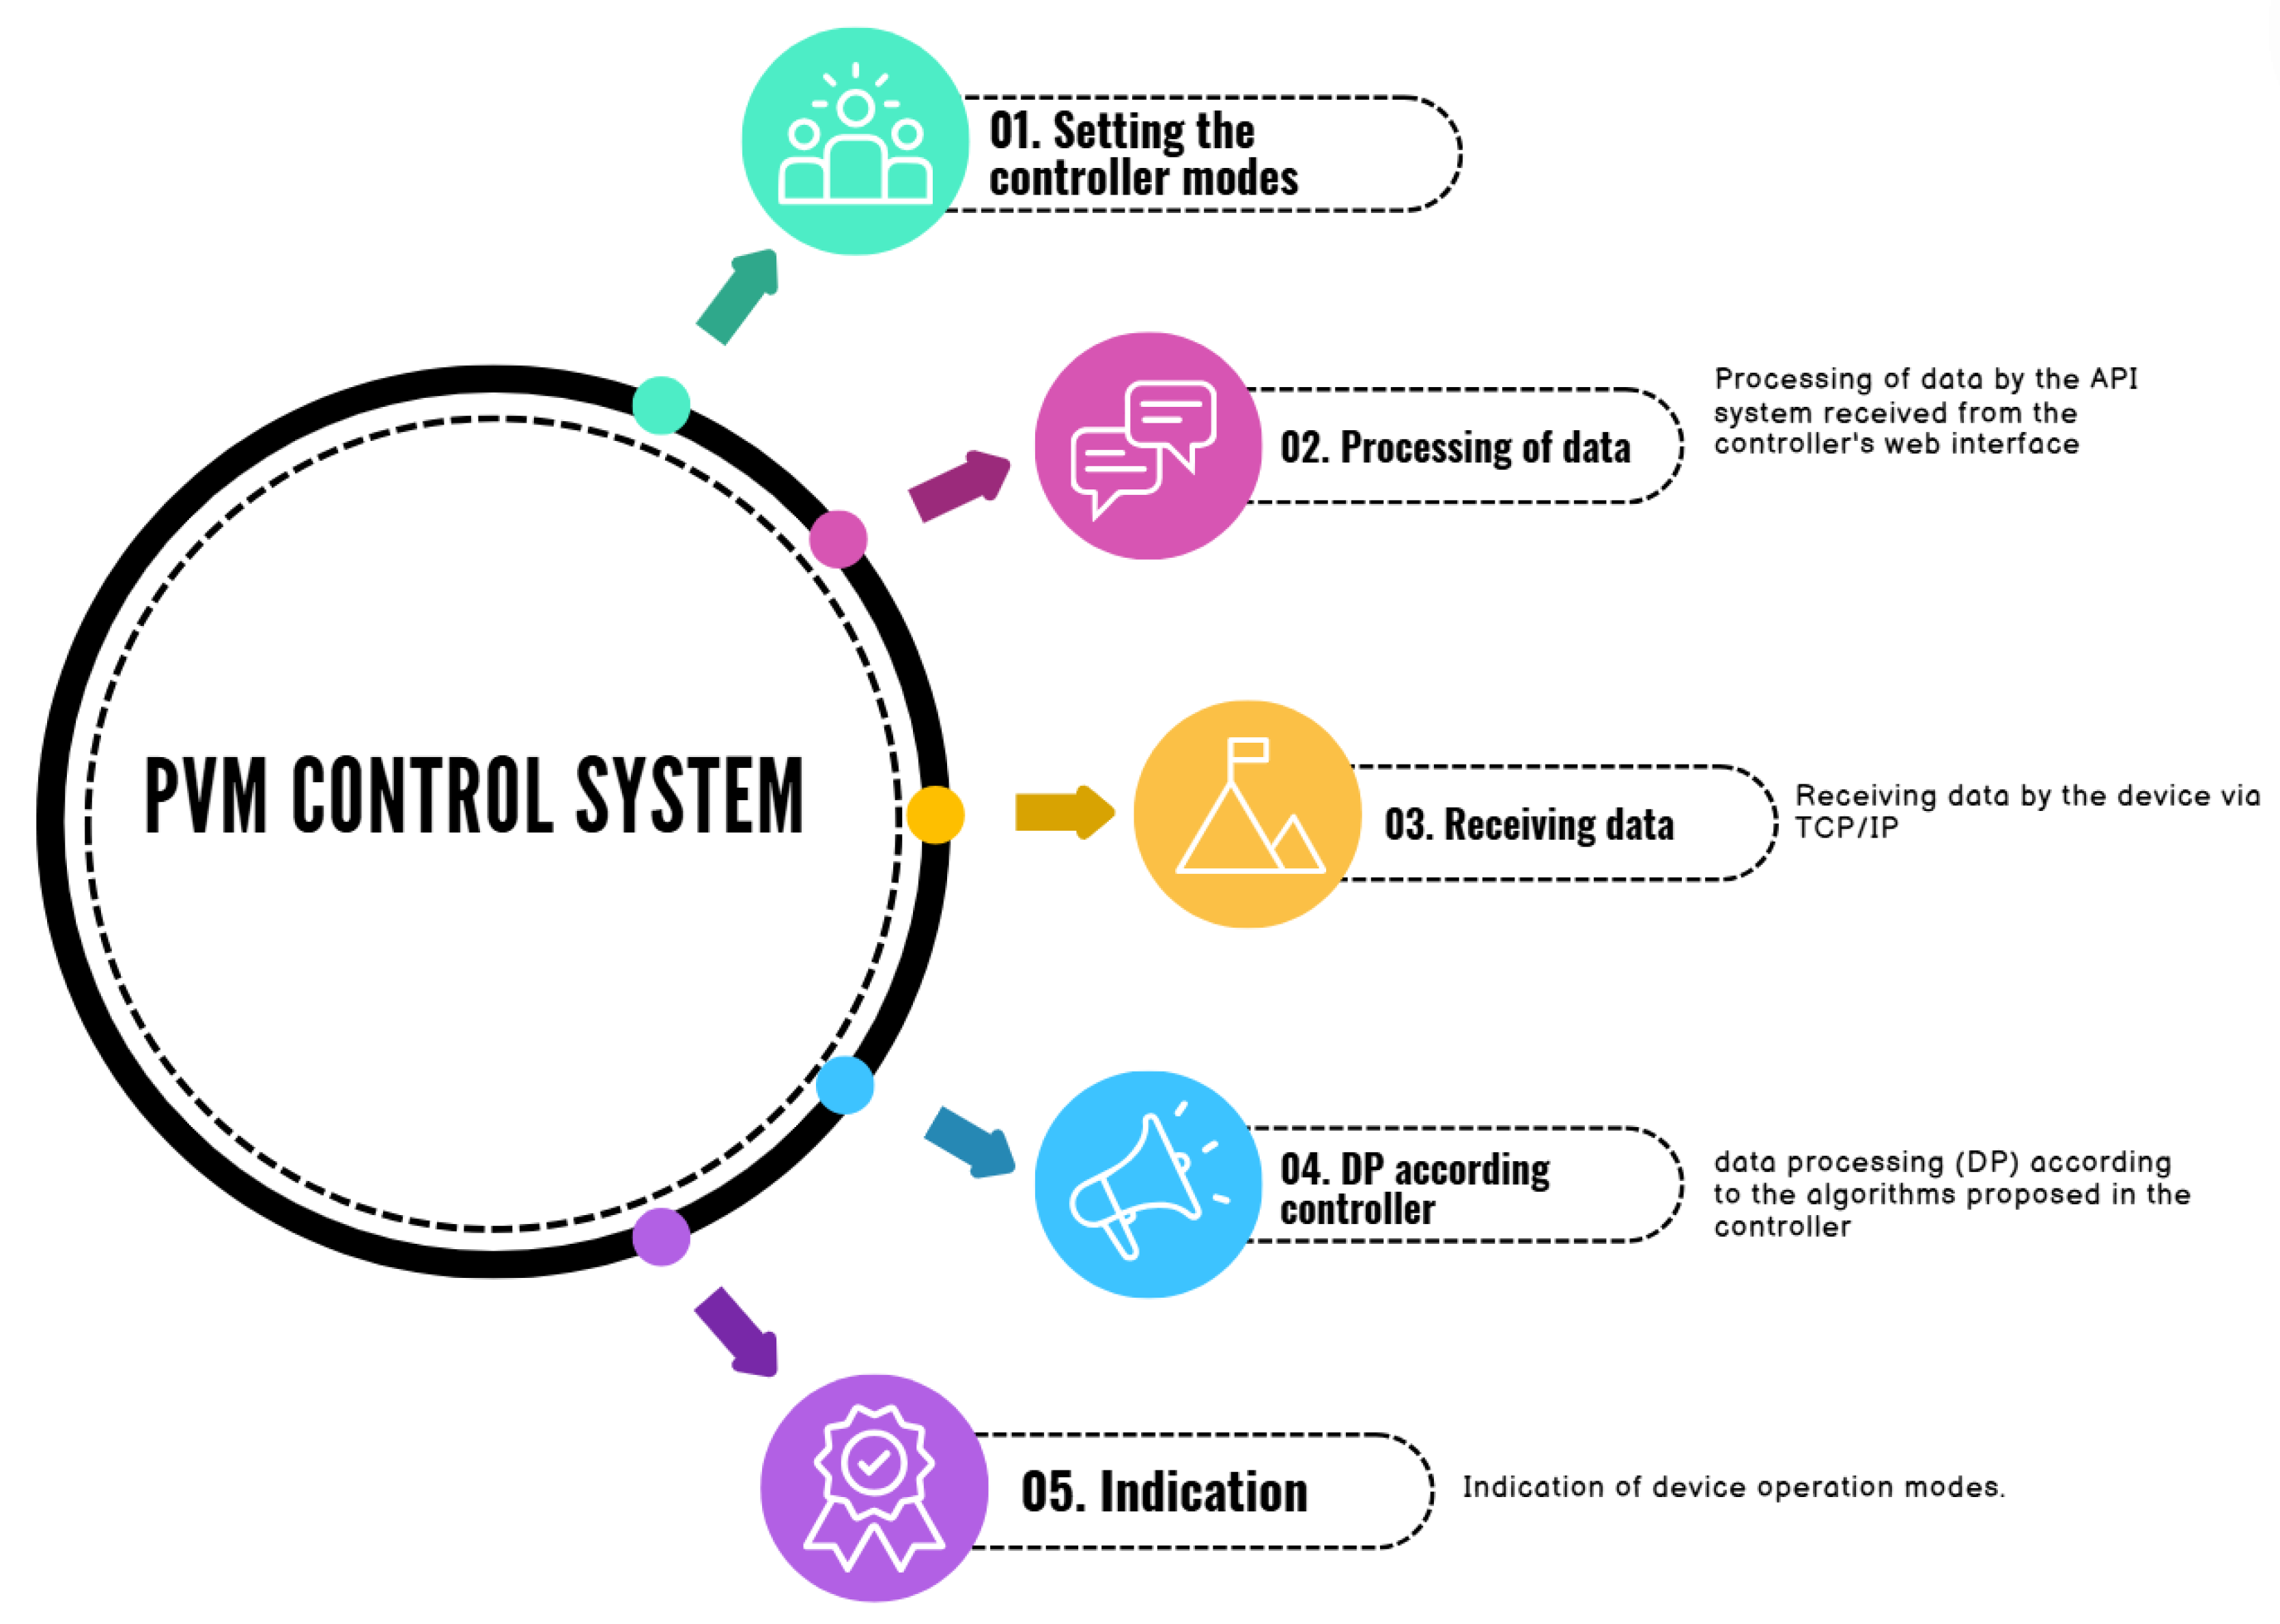
Figure 11.
Stand for researching tracker parameters
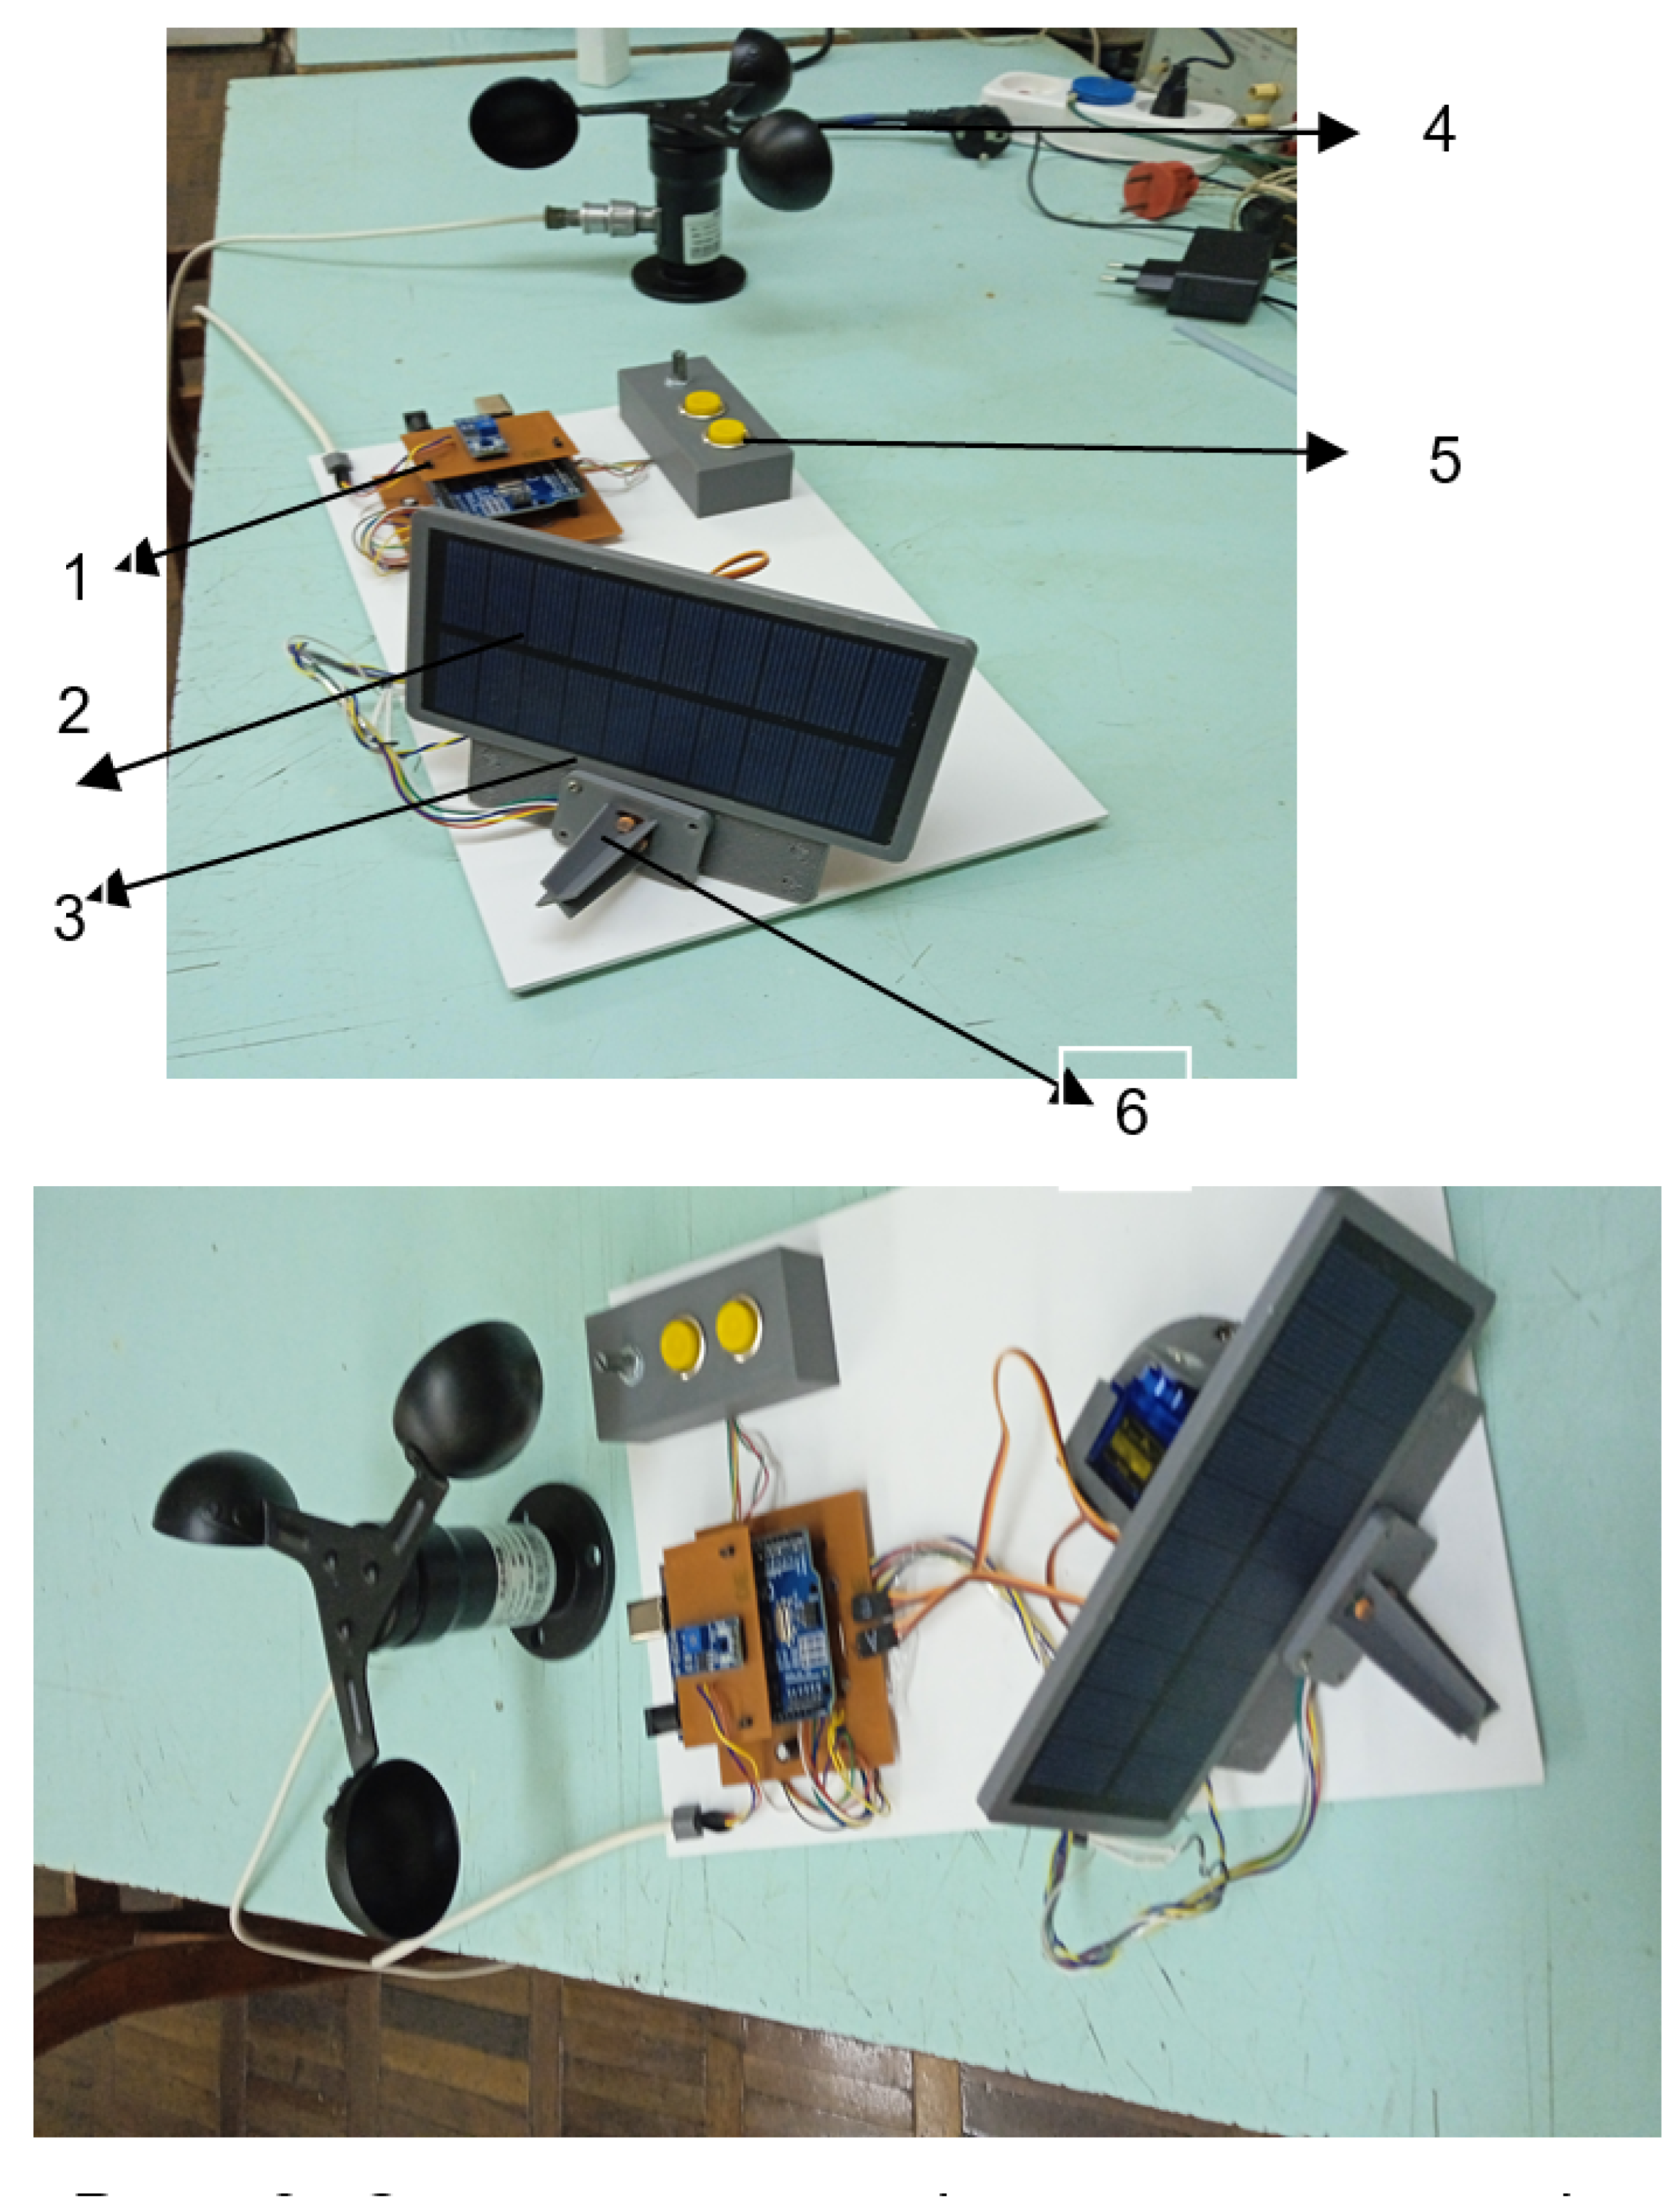
Figure 12.
VA characteristics for analyzed PV-module for different shadings
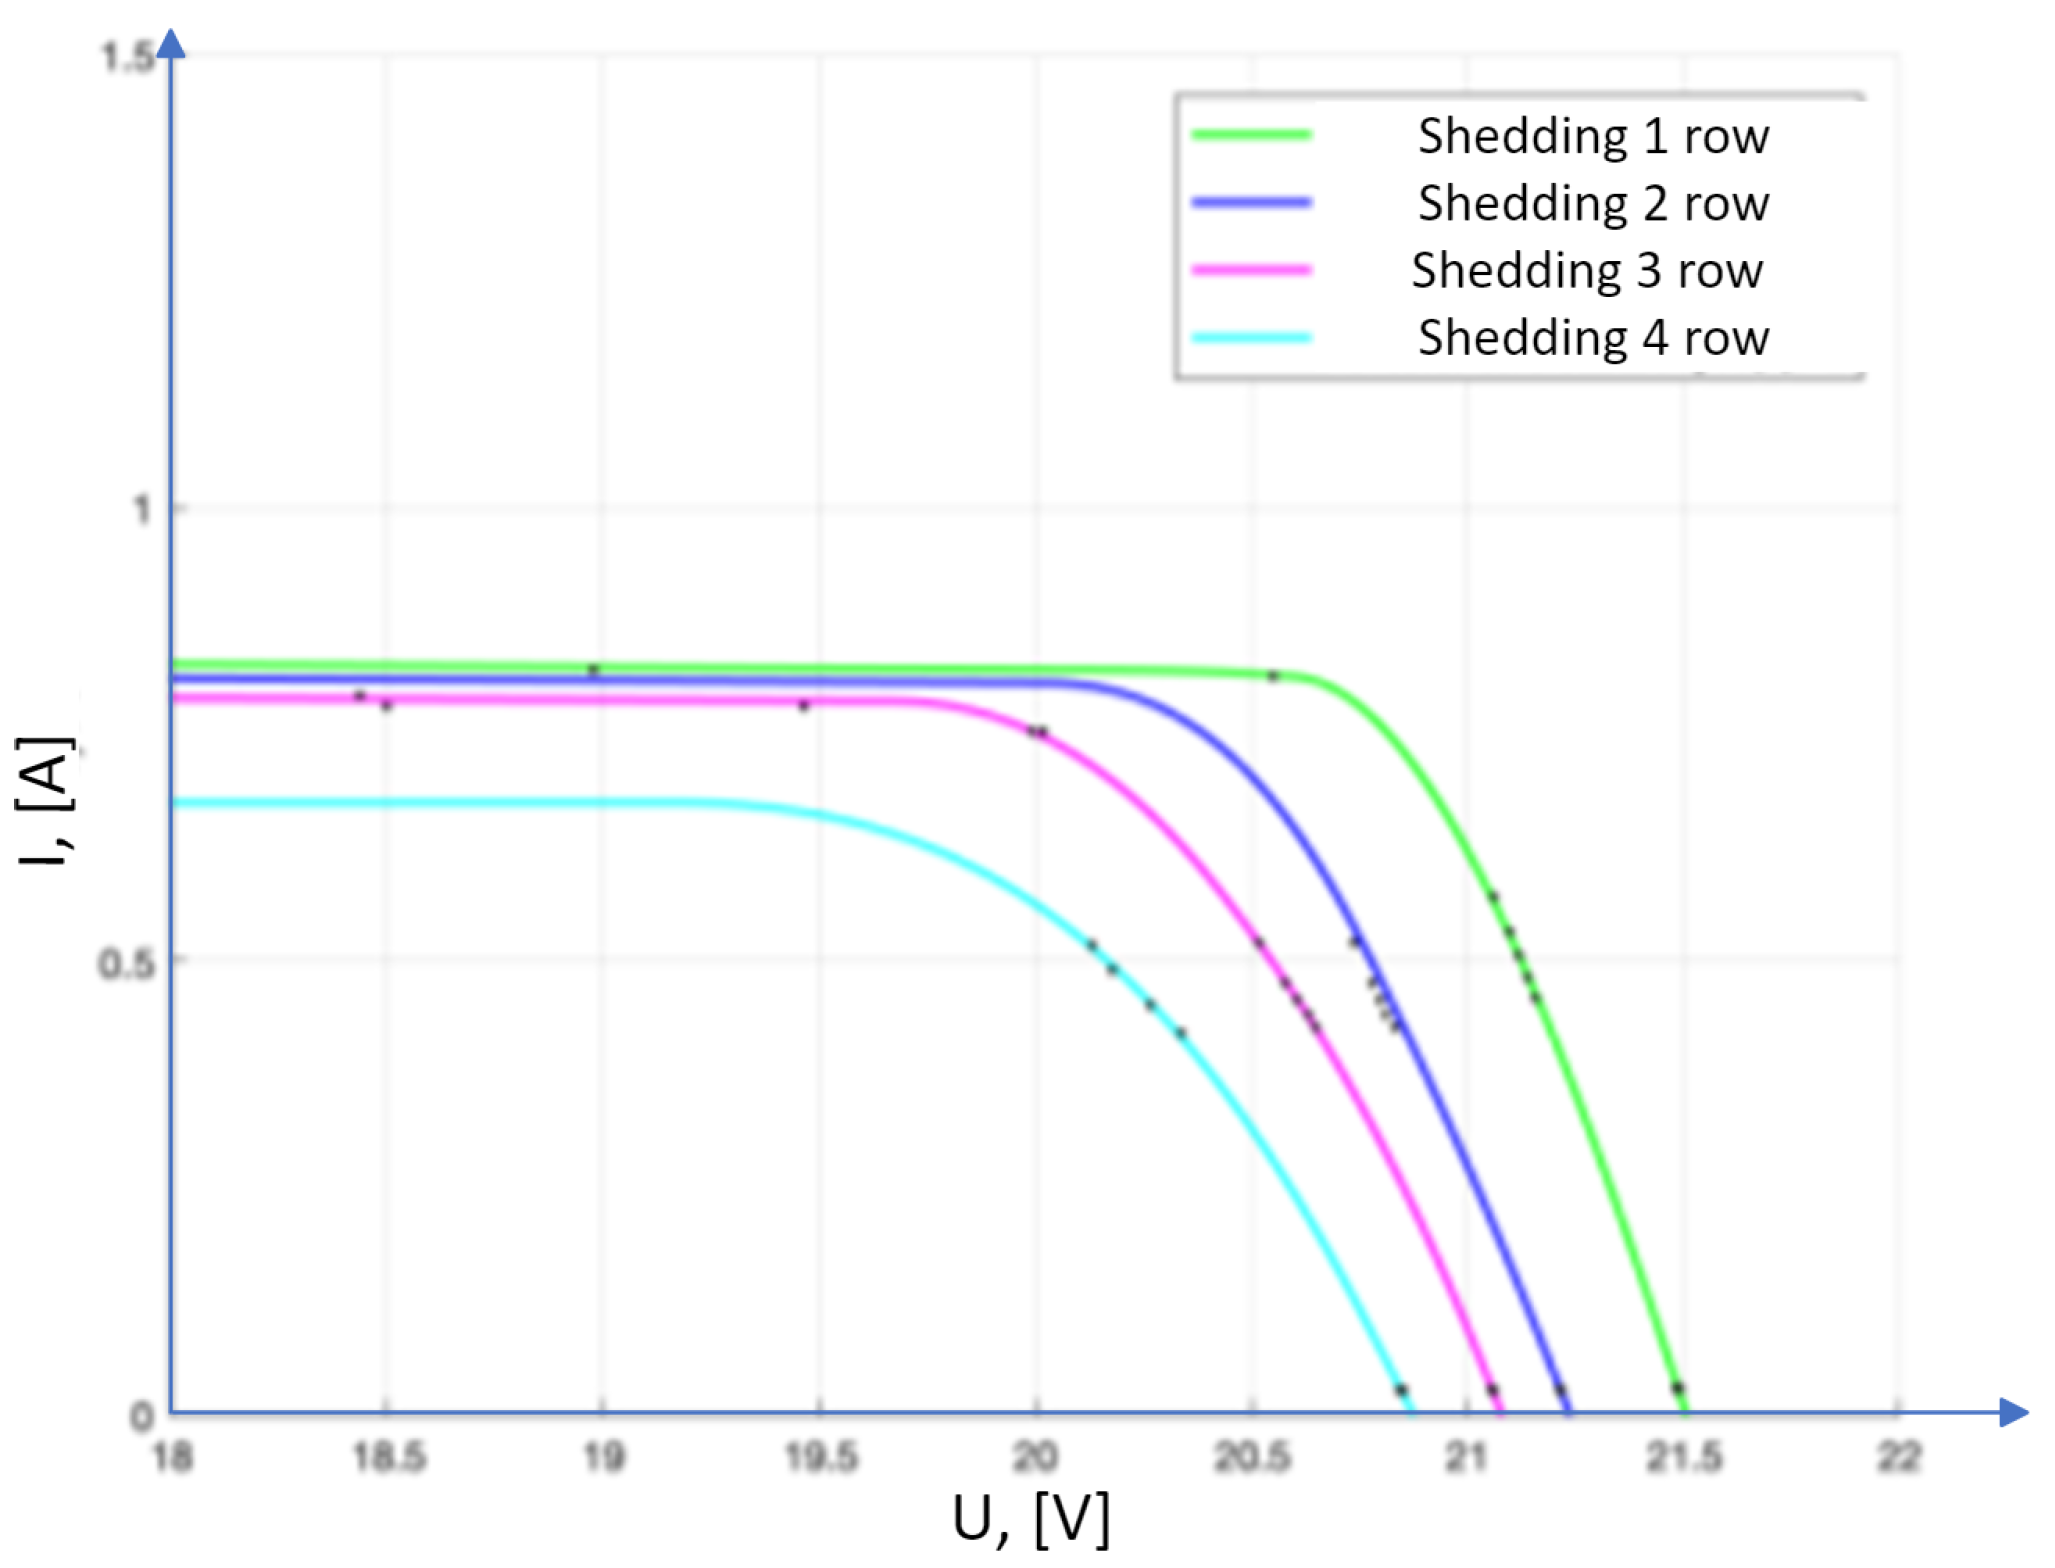
Figure 13.
Research equipment: panel; sourse of light and impuls generator (low-frequency)
Disclaimer/Publisher’s Note: The statements, opinions and data contained in all publications are solely those of the individual author(s) and contributor(s) and not of MDPI and/or the editor(s). MDPI and/or the editor(s) disclaim responsibility for any injury to people or property resulting from any ideas, methods, instructions or products referred to in the content. |
© 2025 by the authors. Licensee MDPI, Basel, Switzerland. This article is an open access article distributed under the terms and conditions of the Creative Commons Attribution (CC BY) license (http://creativecommons.org/licenses/by/4.0/).
Copyright: This open access article is published under a Creative Commons CC BY 4.0 license, which permit the free download, distribution, and reuse, provided that the author and preprint are cited in any reuse.


