
Submitted:
04 April 2025
Posted:
07 April 2025
You are already at the latest version
Abstract
Molecular imaging of α-synuclein (α-syn) pathology in Parkinson’s disease (PD) and related movement disorders is a clinical unmet need. The aim of this study was to discover and characterize in vitro a radioligand for imaging α-syn pathology. A library of 78 small molecules was developed and screened using recombinant α-syn fibrils and brain homogenates from Alzheimer´s disease (AD) donors. Selection criteria were: Kiα-syn <30 nM, Kitau and KiA-β >200 nM. Three compounds, GMC-073 (Kiα-syn: 8 nM), GMC-098 (Kiα-syn: 9.7 nM), and GMC-058 (Kiα-syn: 22.5 nM) fulfilled the criteria and were radiolabelled with 3H. [3H]GMC-058 was the only compound with negligible binding in controls and was further evaluated using tissue microarrays, autoradiography on fresh-frozen brain slices and in vitro saturation binding assay on brain homogenates. [3H]GMC-058 binding co-localised with α-syn inclusions in Parkinson´s disease (PD) and multiple system atrophy (MSA), with dense A-β plaques in cerebral amyloid angiopathy and AD and with p-tau inclusions in progressive supranuclear palsy (PSP) and corticobasal degeneration (CBD). Specific binding was highest in PSP and CBD. In vitro KD was highest in AD (5.4 nM), followed by PSP (41 nM) and CBD (75 nM). The KD in MSA, PD and controls was >100 nM. [3H]GMC-058 is a novel radioligand displaying low affinity for aggregated α-syn in tissue, with an in vitro profile also suitable for detecting tau pathology in 4R tauopathies.
Keywords:
in vitro assay
; neurodegeneration
; proteinopathy
; Lewy bodies
1. Introduction
The accumulation of intracellular aggregates of misfolded α-synuclein (α-syn) is a pathological hallmark of neurodegenerative disorders called synucleinopathies [1]. Such disorders include Parkinson´s disease (PD) and dementia with Lewy bodies (DLB), characterized by the accumulation of pathological α-syn in neurons, in the form of Lewy bodies and Lewy neurites [2], and multiple system atrophy (MSA), characterized by the accumulation of pathological α-syn in glial cells, in the form of glial cytoplasmic inclusions [3].
In the last decade, extensive research and efforts have been devoted to the search and discovery of imaging agents able to detect in vivo pathological α-syn in patients with synucleinopathies using positron emission tomography (PET). Recent clinical studies with newly developed PET tracers [18F]ACI-12589 [4], [18F]SPAL-T-06 [5] and [18F]C05-05 [6] have shown promising results in patients with MSA ([18F]ACI-12589 and [18F]SPAL-T-06) and in patients with Lewy-body disease ([18F]C05-05). However, these PET radioligands present some shortcomings (Table 1).
[18F]ACI-12589 displays in vitro selectivity for α-syn vs. tau and Aβ, and a KD in PD and MSA tissue ~30 nM. [18F]ACI-12589 is able to successfully image α-syn pathology only in MSA, likely because the Bmax/KD of the radioligand is not adequate enough to detect a lower level of pathology in PD. In case of [18F]SPAL-T-06 and [18F]C05-05, an IC50 = 2-3 nM in brain homogenates from DLB or MSA cases has been reported using homologous competition binding studies. However, both radioligands have been developed from the same scaffold as PBB3 and display also affinity to Aβ and tau. Considering that concomitant Aβ and tau pathology is frequent in Lewy-body disease, particularly DLB and PD with dementia, selectivity for α-syn over Aβ and tau is a requirement for a fit-for-purpose α-syn PET radioligand. All clinical PET radioligands developed so far lack the properties of combined high Bmax/KD and selectivity for α-syn, required to image α-syn pathology in Lewy-body disease with high specificity.
Therefore, a selective PET radioligand able to image α-syn in all synucleinopathies is still a clinical unmet need. The aim of this study was to discover small molecules displaying suitable in vitro profiles (affinity in nM range and >10-fold selectivity for α-syn vs. Aβ and tau) for development as α-syn PET radioligands. The work included in vitro screening using recombinant α-syn fibrils and brain homogenates from Alzheimer´s disease (AD) donors. Compounds with suitable in vitro affinity profiles were radiolabelled with 3H. Potential candidates were evaluated with in vitro autoradiography (ARG). Brain tissue from control donors and from patients with different proteinopathies was used for ARG experiments using fresh-frozen tissue sections and paraffine embedded tissue microarrays (TMAs). High-resolution ARG and immunohistochemistry on consecutive TMA sections were performed to study the co-localization of ARG signal with α-syn, p-tau and Aβ pathology.
2. Materials and Methods
2.1. In Vitro Binding Assays
2.1.1. Radioligand Binding to α-syn Fibrils
Compound affinity for α-syn fibrils was measured by means of radioligand binding displacement experiments of an AbbVie tool radioligand with high affinity for α-syn fibrils ([3H]-α-syn-tool). Aggregation of α-syn monomers into fibrils was obtained by incubating monomers (5 mg/mL, prepared in AbbVie) in 150 mM KCl, 50 mM Tris-HCl (pH 7.5) for 7 days at 37 ˚C, in constant shaking conditions. After incubation, the fibrils were harvested by ultra centrifugation, resuspended in buffer, sonicated, divided into aliquots (5.5 mg/ml) and stored at -80 ˚C until the day of the experiment.
On the day of the experiment, α-syn fibrils were thawed for a few minutes at 37 ˚C, diluted in Dulbecco’s Phosphate Buffered Saline (PBS) without calcium and magnesium, pH = 7.4 (DPBS) plus 0.1% bovine serum albumin (BSA) and incubated (at the final fibrils concentration of 2.5 µg/mL) for 60 min, at room temperature (RT), with 5 nM [3H]-α-syn-tool, in the absence or presence of different concentrations of non-radiolabelled compounds. Bound radioligand was separated from free radioligand by rapid filtration and washings with cold DPBS, using a Unifilter-96 GF/B filter plate presoaked in 0.3% polyethylenimmine (PEI) and a Unifilter Cell Harvester (PerkinElmer). Plates were air dried, the scintillation liquid (Betaplate Scint, PerkinElmer) added and counted using a MicroBeta2 2450. Non-specific binding (NSB) was defined as the binding in the presence of 10 µM unlabelled α-syn tool. Data fitting and the constant of inhibition (Ki) calculation was performed using the software platform from Dotmatics (Boston, MA).
2.1.2. Radioligand Binding to Native tau and Aβ Fibrils
Compounds affinity for tau and Aβ fibrils was measured by means of radioligand binding displacement experiments on AD brain homogenates, using [3H]NFT-355 [7] (AbbVie Germany) and [3H]Pittsburg Compound-B (PiB Novandi Chemistry AB, Sweeden [8] to label tau and Aβ aggregates, respectively. Flash-frozen tissue from the frontal cerebral cortex of an AD (Braak stage V) brain was purchased from Analytical Biological Services Inc. (ABS; Wilmington, DE), homogenized in DPBS, divided into aliquots (10 mg/mL) and stored at -80 °C until the day of the experiment.
On the day of the experiment, the brain homogenate was brought to RT, diluted in DPBS plus 0.1% BSA and incubated for 90 min, at RT, with 0.5 nM [3H]NFT-355 or 1 nM [3H]PiB, in the absence or presence of different concentrations of non-radiolabelled compounds. Bound radioligand was separated from free radioligand by rapid filtration and washings with cold DPBS, using a Unifilter-96 GF/B filter plate (presoaked in 0.3% PEI) and a Unifilter Cell Harvester (PerkinElmer). Plates were air dried, the scintillation liquid (Betaplate Scint, PerkinElmer) added and counted using a MicroBeta2 2450. NSB was defined as the binding in the presence of 10 µM T808 [9] (AbbVie Germany) and 10 µM PiB for [3H]NFT-355 and [3H]PiB, respectively. Data fitting was performed using the software platform from Dotmatics (Boston, MA).
2.2. Radiosynthesis of [3H]GMC-058, [3H]GMC-073, and [3H]GMC-098
Chemicals and solvents were obtained from commercial sources and were used without further purification. NMR spectra were recorded on a Bruker 500 MHz AVANCE III system using standard Bruker pulse sequences. Experiments were run in D6-DMSO at 25 °C. 1H NMR chemical shifts were referenced relative to the residual solvent peak at 2.50 ppm, and 13C NMR chemical shifts were referenced to 39.5 for D6-DMSO. Flash column chromatography was carried out using prepacked silica gel columns supplied by Biotage and using a Biotage automated flash system with UV detection. Preparative HPLC was performed using a Waters Xbridge C18 5 µ OBD 19X150 mm, 25 ml/min, 30% for 2 min then was ramped to 95% over 18 min and held for 3 min MeCN-0.2% aq. NH4OH unless otherwise indicated. Reactions with tritium gas were performed on a RC Tritec tritium manifold. Analytical HPLC was carried out using an Agilent 1100 series HPLC using a Waters 4.6 × 100 mm Xbridge C18 3.5 μ, with the following elution profile: 5% for 3 min then ramped to 95% over 22 min and hold 95% for 5 min MeCN/water 10 mM NH4HCO3 pH 10 with radioactive detection using a LabLogic Beta-Ram 4 detector. LCMS analysis was carried out using a Waters 1100 HPLC system with a Waters 3100 mass detector on a XSelect CSH C-18 4.6/150 mm, 3.5 micron with a gradient of 5%–100% MeCN–0.1% formic acid (adjusted to pH 3) over 10 min followed by a 2-min wash with 100% MeCN or on a Waters1200 series UPLC with a Waters 4.6 × 100 mm Xselect CSH C18 3.5 μ, 5 to 95% MeCN/water 0.2% formic acid pH 3 for 1.85 min then isocratic elution for 0.1 min with mass detection using a QDA mass detector. The molar activities of the products were determined by LC/MS using Isopat2 to deconvolute the MS signals [10]. Liquid scintillation counting was performed with a Beckman LS 6500 scintillation counter.
2.3. Autopsy Material
Frozen human brain tissues from patients with Parkinson’s disease (PD), Lewy body disease (LBD), multiple system atrophy (MSA), corticobasal degeneration (CBD) and non-demented controls were obtained from the Netherlands brain bank (Table 2) and frozen human tissues from patients with MSA, PSP and one control were obtained from the UK brain bank (Table 3). Formalin-fixed paraffine embedded tissue blocks from patients with different synucleinopathies were obtained from the Netherland Brain Bank (Table A1). Approval for the use of the autopsy material for the project was obtained by the Swedish Ethical Research Authority. Brain homogenates were obtained from tissue of AD, CBD, PSP, MSA-P patients and healthy controls, obtained from the Alzheimer´s Disease Research Center of University of Pittsburgh (Table A2), from the University California San Francisco (Table A3), and from the Banner Sun Health Research Institute (Table A4).

Table 2.
Demographic data of cases from the Netherlands Brain Bank selected for autoradiography studies using fresh-frozen tissue.
Table 2.
Demographic data of cases from the Netherlands Brain Bank selected for autoradiography studies using fresh-frozen tissue.
| Case n. | Diagnosis | Age | Sex | PMI (h) | Brain region |
|---|---|---|---|---|---|
| PD1 | Parkinson’s disease | 69 | M | 7 | Cingulate gyrus |
| PD2 | Parkinson’s disease | 77 | M | 5 | Cingulate gyrus |
| PD3 | Parkinson’s disease | 75 | M | 6 | Cingulate gyrus |
| LBV1 | Lewy bodies variant | 83 | M | 5 | Cingulate gyrus |
| LBV2 | Lewy bodies variant | 54 | M | 5 | Cingulate gyrus |
| MSA1 | Multi-system atrophy | 66 | M | 5 | Cerebellum |
| MSA2 | Multi-system atrophy | 69 | F | 5 | Cerebellum |
| CBD1 | Corticobasal degeneration | 58 | F | 7 | Superior frontal gyrus |
| C01 | Non-demented control | 81 | F | 4 | Cingulate gyrus |
| C02 | Non-demented control | 51 | M | 8 | Cingulate gyrus |
| C03 | Non-demented control | 79 | F | 11 | Cingulate gyrus |
Table 3.
Demographic data of cases from the UK Brain Bank selected for autoradiography studies using fresh-frozen tissue.
Table 3.
Demographic data of cases from the UK Brain Bank selected for autoradiography studies using fresh-frozen tissue.
| Case n. | Diagnosis | Age | Sex | PMI (h) | Brain region |
|---|---|---|---|---|---|
| MSA3 | Multiple system atrophy | 58 | F | 10 | Cerebellum |
| MSA4 | Multiple system atrophy-Cerebellar form | 52 | M | 33 | Cerebellum |
| PSP1 | Progressive supranuclear palsy | 66 | M | 8 | Globus pallidus |
| PSP2 | Progressive supranuclear palsy | 77 | F | 11 | Globus pallidus |
| C04 | Control | 68 | M | 7,5 | Caudate, putamen and globus pallidus |
2.4. Preparation of Human Brain Tissue for In Vitro Binding Studies
As described in Bagchi et al. [11], to prepare insoluble fraction from PD and MSA-P patients, fresh frozen tissue blocks were sequentially homogenized in four buffers (3 mL/g wet weight of tissue) with glass Dounce tissue grinders (Kimble): 1) High salt (HS) buffer: 50 mM Tris-HCl pH 7.5, 750 mM NaCl, 5mM EDTA; 2) HS buffer with 1%Triton X-100; 3) HS buffer with 1%Triton X-100 and 1M sucrose; and 4) phosphate buffered saline (PBS). Homogenates were centrifuged at 100,000 x g after each homogenization step and the pellet was resuspended and homogenized in the next buffer in the sequence. For AD, CBD, PSP and CT cases the frozen tissue blocks were prepared as described in Stehouwer et al. [12]. In brief tissue blocks were thawed and homogenized in ice-cold pH 7.0 phosphate-buffered saline (PBS) at 300 mg/mL on ice using a glass homogenizer, diluted 30-fold with PBS to 10 mg/mL and homogenized a second time with a Brinkmann Polytron homogenizer before storage at −80 °C.
2.5. Saturation Binding Assays
Saturation binding assays were performed in AD, CBD, PSP, MSA-P, PD and healthy patients brain homogenates (0.1 mg/mL tissue) using a [3H]GMC-058 concentration range of 0.9 nM to 80 nM and incubation for 90 minutes at room temperature (RT) with PBS + 20% EtOH. Non-specific binding was determined using 10μM of unlabelled GMC-044. After incubation, samples were filtered under vacuum on equilibrated GF/B UniFilter plates (PerkinElmer) using the FilterMate 196 (PerkinElmer). Afterwards, filters were washed three times with 250 μL chilled buffer (PBS + 20% EtOH). [3H]GMC-058 binding was measured with a beta scintillation counter (PerkinElmer).The saturation data was fitted and analysed using the non-linear regression function of GraphPad Prism 10 software to calculate the dissociation constant (KD) and maximum number of binding sites (Bmax). Scatchard plots were prepared with GraphPad Prism 10 software to display the saturation binding data.
2.6. Autoradiography Experiments on Fresh Frozen Tissue Sections
Selections of frozen human sections (described in Table 2 and Table 3) were used for binding autoradiography. Sections were first pre-incubated for 20 min in binding buffer [50 mM Tris-HCl (pH 7.4), 120 mM NaCl, 5 mM KCl, 2 mM CaCl2, 1 mM MgCl2, 0.1% BSA] and then incubated with [3H]GMC-058 (specific activity 22 Ci/mmol); [3H]GMC-073 (specific activity 23.4 Ci/mmol); or [3H]GMC-073 (specific activity 26.4 Ci/mmol) in binding buffer for 180 min at RT. In the pilot autoradiography experiment (Supplementary Figure 1). [3H]GMC-058 was tested at 25 and 50 nM, while [3H]GMC-073 and [3H]GMC-098 were each tested at 10 and 20 nM. For all other autoradiography in fresh-frozen tissue sections, 25 nM [3H]GMC-058 was used. To determine NSB, adjacent brain sections were incubated with [3H]-tracer mixed with 5 μM of unlabelled GMC-044. The binding reaction was stopped by two 10-minute washes in washing buffer [50 mM Tris-HCl (pH 7.4) at 4 °C] and a brief dip in cold distilled water. Slides were allowed to air-dry before being placed under storage phosphor screens (Fujifilm Plate BAS-TR2025, Fujifilm, Tokyo, Japan) in imaging cassettes for 90 hours together with ART0123C and ART0123B tritium standards on glass slides (American Radiolabeled Chemicals Inc. St. Louis, MO, USA). Storage phosphor screens were scanned using an Amersham Typhoon FLA-9500 phosphor imaging scanner (Cytiva, Marlborough, MA, USA) and resulting images were analyzed using Multi Gauge 3.2 phosphor imager software (Fujifilm, Tokyo, Japan) for ROI delimitation, density calibration and quantification. Quantitative binding data from duplicates of total and NSB were plotted and analysed using graphPad Prism v10 (GraphPad Software, Boston, MA, USA). Specific binding was determined by subtracting the non-specific signal from the total signal. Toluidine blue staining of adjacent sections was used to obtain anatomical references for white and grey matter ROI selection. Care was taken not to include artifact signals in the ROIs analysed. These artifacts were identified as randomly placed punctate signal appearing in both total and NSB images, and they often coincided with small folds or tears in the tissue sections.
2.7. Autoradiography and Emulsion Autoradiography on Tissue Microarrays
Tissue micro arrays (TMAs), prepared from paraffin-embedded tissue from human post-mortem tissue as described in [13], were first de-paraffinized with two 1-hour and one overnight incubation in Neo-Clear Xylene Substitute (Sigma-Aldrich, St. Louis, MO, USA) at 37 ºC, then dehydrated in three short incubations at RT with decreasing concentrations of ethanol, before autoradiography with [3H]GMC-058 was performed as described above. For the saturation binding autoradiography, duplicate slides of each TMA set were incubated with 0.3 nM to 200 nM [3H]GMC-058. Adjacent sections were co-incubated with 5 μM of unlabelled GMC-044 to calculate NSB.
For high-resolution emulsion autoradiography, an autoradiography experiment with TMAs using 25 nM [3H]GMC-058 was performed as described above. At the end of the 90-hour exposure to the storage phosphor screen, slides were stored in vacuum until dipping in photoemulsion. In the dark, using a sodium lamp, Agar Scientific, AGP9284 type NTB emulsion was melted in heated water bath and diluted (1:1) with ddH2O. Emulsion was poured into dipping chambers, slides were dipped and placed vertically to air-dry. When completely dry, slides were placed in a light-tight slide box with desiccant and exposed at 4C for 1-12 weeks. After exposure, slides were developed in diluted Phenisol Developer for 2 min, rinsed in water and fixed in hypam Fixer at 17°C in water bath. After rinsing in water slides were counterstained with Harris HTX, dehydrated in graded ethanol, cleared in Xylene, and mounted in Pertex. Images were taken using a 3D Histech P250 III scanner at up to 15 focal layers with a distance of 0.2 microns.
2.8. Immunohistochemistry
Immunohistochemical chromogenic (IHC) staining was made essentially as in [14] reference antibodies for respective proteinopathies used were; Signet laboratories (Abeta 6E10, Abeta 4G8), Abcam(Anti-Alpha-synuclein antibody [LB 509]) and Thermo Fisher Scientific (AT-8 Phospho-PHF-Tau. Briefly 5 μm slide mounted tissue sections was performed according to a standardized protocol with modifications to optimize the specificity of the observed staining patterns. IHC staining was performed using the Discovery Ultra platform (Ventana) automated immunostaining robot, using the OmniMap DAB chromogenic staining kit (Ventana Medical Systems) according to the manufacturer’s instructions. In brief, initial deparaffinization, followed by heat activated antigen retrieval in a pH 8.0 buffer was performed to improve the detection of antigens in the FFPE tissue. Endogenous tissues peroxidases (Inhibitor CM, Ventana), which may interfere with the assays, were blocked with 0.3 % hydrogen peroxide. The primary antibody for phosphorylated Tau detection (AT-8 (pTau was applied, followed by incubation with the HRP-conjugated secondary antibody (the HPR labeled OmniMap goat anti-Mouse Ab). Visualization of the positively stained cells was performed by addition of hydrogen peroxide and DAB (single IHC) resulting in an insoluble brown (DAB) staining precipitate at the site of antibody binding. Counterstaining for IHC was done with hematoxylin [Hematoxylin II, Ventana, 760-2208and Bluing Reagent, Ventana, 760-2037]. The stained slides were subsequently scanned at up to 10 focal layers in brightfield (20x -40 objective) using a digital whole slide scanner [Pannoramic 250 III Scanner, 3DHistech, Budapest, Hungary). Analysis was performed of the IHC stained tissue sections by manual evaluation, using a digital image viewer software (CaseViewer). All analyses of the stained and labelled tissue sections by reference antibodies for Aβ, p-tau and α-syn and/or ligands, were compared, side by side, to each other. Adjacent fresh-frozen tissue sections or TMAs were used when comparing IHC immunoreactivity with autoradiography binding signal.
3. Results
The work plan for this study included a first part that was devoted to the discovery of small molecules with an in vitro profile suitable for the development of a selective α-syn ligand, and a second part that included the in vitro characterization of lead candidates.
The discovery part included compound design and in vitro competition experiments for the identification of lead candidates. The in vitro characterization included 3H-radiolabelling, in vitro saturation binding and autoradiography experiments in tissues from donors with different proteinopathies.
3.1. Discovery and In Vitro Characterization of GMC-058
3.1.1. Discovery of GMC-058, GMC-073 and GMC-098
- A library of 78 small molecules was generated based on available information from the public domain. Four optimization cycles were performed with radioligand binding assays to measure the affinity of compounds for in vitro-assembled α-syn fibrils and native tau and Aβ fibrils in AD homogenates;
- Sixteen of these compounds showed affinity for α-syn fibrils < 30 nM and for Aβ and tau >50 nM (Table A5). Criteria for selection were Ki for α-syn < 30 nM and Ki for tau and Aβ > 200 nM;
- Three compounds, GMC-058, GMC-073, and GMC-098 were selected based on those criteria and on feasibility of radiolabelling. The Ki of GMC-058, GMC-073, and GMC-098 using recombinant α-synuclein fibrils was 22.5 nM, 8 nM and 9.7 nM, respectively.
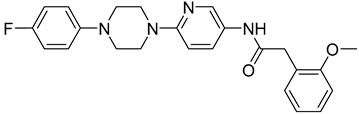
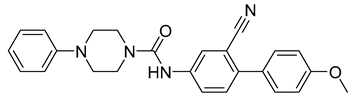
- All three compounds showed lower affinity for Aβ (Ki=1490 nM for GMC-058, 2630 nM for GMC-073, 226 nM for GMC-098) and tau (Ki= 1320 nM for GMC-058, 248 nM for GMC-073, 805 nM for GMC-098) in AD brain homogenates. GMC-058 (Figure 1), GMC-073 and GMC-098 were therefore selected for radiolabelling with 3H.
3.1.2. Autoradiography Experiments with [3H]GMC-058, [3H]GMC-073 and [3H]GMC-098
The three [3H]-labelled compounds were initially evaluated by autoradiography in tissue sections from the cingulate cortex of healthy controls;
- [3H]GMC-073 and [3H]GMC-098 displayed clear binding in control cingulate cortex tissue, approximately 50% of which was displaced by 5 µM GMC-044, whereas [3H]GMC-058 displayed negligible binding (Figure B.1 and Table A6). The nature of this off-target displaceable binding is not known.
- [3H]GMC-058 was selected for further evaluation in pathological tissue sections.
3.1.3. In Vitro Saturation Binding Assays with [3H]GMC-058 in Brain Homogenates
Saturation binding assays with [3H]GMC-058 were conducted in brain homogenates from cases with AD, PSP, CBD, MSA-P, PD and Controls.
- The KD estimated in AD tissue was 5.4 nM, in PSP tissue was 46 nM and CBD tissue was 71 nM (Figure 2);
- In brain homogenates from MSA-P and control cases, KD was > 100 nM. No evidence of saturation binding was observed in PD tissue.
3.1.4. Autoradiography Experiments with [3H]GMC-058
Autoradiography experiments using 25 nM [3H]GMC-058 in tissue sections from the cingulate cortex of controls and PD patients and from the cerebellum of MSA patients did not show clear evidence of specific binding higher than the displaceable (off-target) binding in controls (Figure 3 and Table A7). Saturation [3H]GMC-058 binding autoradiography experiments in TMAs showed that specific binding did not reach a saturation in any of the tissues (Figure B.2) and did not permit us to obtain reliable KD estimates (data not shown).
However, the specific binding data obtained at the concentration of 25 nM [3H]GMC-058 showed clear differences in specific binding and were thus selected for group comparison.
- In synucleinopathies (PD and MSA), cerebral amyloid angiopathy (CAA), AD and 4R tauopathies (PSP and CBD), the specific binding of 25 nM [3H]GMC-058 was significantly higher than the displaceable binding in controls (p<0.01, ANOVA with Dunnett’s multiple comparisons test, Table 3 and Figure B.3);
- High-resolution autoradiography showed that the binding of 25 nM [3H]GMC-058 co-localised with α-syn inclusions in PD and MSA, with dense Aβ plaques in CAA and AD, and with p-tau inclusions in PSP and CBD (Figure 4 and Figures B.4-B.6).
Table 3.
Specific binding (fmol/mg tissue equivalent) of 25 nM [3H]GMC-058, measured in TMAs from cases with different proteinopathies. In non-demented controls (NDE) and liver tissue the values refer to displaceable (off-target) binding.
Table 3.
Specific binding (fmol/mg tissue equivalent) of 25 nM [3H]GMC-058, measured in TMAs from cases with different proteinopathies. In non-demented controls (NDE) and liver tissue the values refer to displaceable (off-target) binding.
| TMAs | NDE | Liver Control | MSA | CAA | AD | CBD | PSP | PD |
|---|---|---|---|---|---|---|---|---|
| N= | 8 | 4 | 1 | 3 | 4 | 2 | 2 | 6 |
| Mean (± SEM) |
70 | 57 | 166** | 131** | 127** | 204**** | 173**** | 129**** |
| (4) | (7) | (19)† | (12) | (15) | (38) | (2) | (7) |
NDE=non-demented elderly controls; MSA=multiple system atrophy; CAA=cerebral amyloid angiopathy; AD=Alzheimer´s disease; CBD=cortico-basal degeneration; PSP=progressive supranuclear palsy; PD=Parkinson´s disease. ****p<0.0001; ***p<0.001; ** p<0.01, compared to NDE control, obtained by one-way ANOVA with Dunnett’s multiple comparisons test. †SEM from 10 technical replicates of n=1 MSA case.
We then conducted autoradiography experiments in fresh-frozen tissue for which α-syn, Aβ and p-tau expression was measured by IHC. We selected tissue sections of cerebellum from two donors with MSA, of superior frontal gyrus from one donor with CBD, of globus pallidus (GP) from two donors with PSP, and of cingulate cortex, caudate, GP and putamen from two controls (Figure 5 and Table A8).
- In the two MSA cases, specific binding measured in cerebellar grey matter was two-fold higher than the average displaceable binding measured in grey matter of cingulate cortex, caudate, globus pallidus and putamen of controls (Figure 5A and 5D-E);
- In CBD and PSP cases, the specific binding in the grey matter of the superior frontal gyrus and globus pallidus was on average three-fold and ten-fold higher, respectively, than the displaceable binding measured in controls (Figure 5B-E);
4. Discussion
This study was designed to identify a small molecule with in vitro properties suitable for development as ligand binding to pathological α-syn. We identified three compounds, GMC-058, GMC-073, and GMC-098, that displayed selective binding to recombinant α-syn fibrils. The three compounds were radiolabelled with 3H and among the three compounds [3H]GMC-058 was selected, since it showed the lowest non-displaceable binding in control tissue. However, when [3H]GMC-058 was further evaluated in human brain tissue homogenates and sections, it displayed low specific binding in synucleinopathy cases, but clear specific binding in PSP and CBD cases. This observation was unexpected considering that the Ki of GMC-058 measured in tau-enriched AD tissue was > 200 nM. However, since the competition studies were performed using the reference tau tracer [3H]NF-355, it is possible that GMC-058 recognizes a different binding site on tau fibrils. Several radioligands have been developed for imaging tau pathology [15]. Second-generation tau PET radioligands [18F]PI-2620 and [18F]PM-PPB3 (aka [18F]APN-1607 or florzolotau) have been studied in patients with AD [16,17] and PSP [18,19]. Those studies showed that both radioligands can image 3R and 4R tau pathology in vivo. More recently, the discovery, in vitro characterization and in vivo pre-clinical assessment of [18F]OXD-2314 has been reported [20], indicating that this radioligand has also potential to image 3R and 4R tauopathies. Although [3H]GMC-058 has been designed and developed as potential α-syn PET radioligand, the in vitro properties suggest that the Bmax/KD is not high enough to enable imaging of α-syn pathology in vivo. On the other hand, the evidence of higher specific binding of [3H]GMC-058 in PSP and CBD than in MSA, suggests that GMC-058 might have potential as a PET radioligand for imaging 4R tauopathies. A discrepancy was observed between the high KD (>50 nM) of [3H]GMC-058 in brain homogenates from PSP and CBD cases and the clear evidence of specific binding in fresh frozen brain sections from CBD and PSP cases. A similar discrepancy between results of in vitro saturation studies in brain homogenates and autoradiography studies on brain sections has been observed for another potential α-syn tracer, [3H] -4i, and is difficult to explain [21].
5. Conclusions
[3H]GMC-058 is a novel radioligand displaying low in vitro affinity for aggregated α-syn, with an in vitro profile also suitable for imaging tau pathology in 4R tauopathies. Further evaluations including radiolabelling with 11C and in vivo imaging in non-human primates are warranted to further assess the potential of GMC-058 as potential PET radioligand for 4R tau.
Author Contributions
For research articles with several authors, a short paragraph specifying their individual contributions must be provided. The following statements should be used “Conceptualization, A.V., S.J.F. and M.S.; methodology, V.C.S., M.M., S.B., G.N., C.S.E., D.S.,D.S.G.; formal analysis, V.C.S., M.M., S.B., D.S.,D.S.G.; investigation, A.V., V.C.S., M.M., S.B., G.N., C.S.E., D.S.,D.S.G., S.J.F., M.S.; resources, A.V., V.C.S., M.M., S.B., G.N., C.S.E., D.S.,D.S.G., S.J.F., M.S.; data curation, A.V., V.C.S., M.M., S.B., G.N., C.S.E., D.S., D.S.G., S.J.F., M.S.; writing—original draft preparation, A.V.; writing—review and editing, A.V. V.C.S., M.M., G.N., C.S.E., D.S.,D.S.G., S.J.F., M.S..; visualization, A.V., V.C.S., M.M. D.S. D.S.G., M.S.; supervision, A.V.; project administration, A.V.; funding acquisition, A.V. All authors have read and agreed to the published version of the manuscript.
Funding
This research was funded by the Michael J Fox Foundation for Parkinson Research, grant number 10908, by the Swedish Parkinson Foundation (Parkinsonfonden), grant number 1268/20, by AstraZeneca and AbbVie.
Institutional Review Board Statement
The study was approved by the Regional Ethics Committee of Stockholm, Sweden (protocol code 2015/4:6 and date of approval: 2015-06-17).
Informed Consent Statement
Not applicable.
Data Availability Statement
The raw data supporting the conclusions of this article will be made available by the authors on request.
Acknowledgments
We would like to acknowledge David Holzinger (Molecular & Imaging Biomarkers, AbbVie Deutschland GmbH & Co. KG) for α-syn fibrils generation and Åsa Södergren for technical assistance with autoradiography. All autoradiography experiments were performed at the autoradiography core facility of Karolinska Institutet.
Conflicts of Interest
Charles S. Elmore and Magnus Schou are employed at AstraZeneca. Manolo Mugnaini, Sandra Biesinger and Sjoerd J. Finnema are employed at AbbVie. Gunnar Nordvall is employed at AlzeCure. Dan Sunnemark is employed at Offspring Biosciences.
Abbreviations
The following abbreviations are used in this manuscript:
Abbreviations. Aβ = amyloid beta; AD = Alzheimer’s disease; ARG = Autoradiography; α-syn = α-synuclein; CAA = Cerebral amyloid angiopathy; CBD = Corticobasal degeneration; DLB = Dementia with Lewy bodies; IHC = Immunohistochemistry; LBD = Lewy body disease; MSA = multiple system atrophy; PD = Parkinson’s disease; PSP = Progressive supranuclear palsy; TMA = Tissue microarray
Appendix A
Appendix A.1
Synthesis of [3H]GMC-058
1-(3-bromo-4-methoxyphenyl)-4-(4-nitrophenyl)piperazine
A suspension of 1-(3-bromo-4-methoxyphenyl)piperazine as the HCl salt (198 mg, 0.64 mmol) and cesium carbonate (524 mg, 1.61 mmol) in DMF (5 mL) was stirred under N2 as 1-fluoro-4-nitrobenzene (0.075 mL, 0.71 mmol) was added, and the reaction was stirred at 50°C for 4.5 hours and at rt overnight. The reaction was poured into water (30 ml), and the aqueous portion washed with isopropyl acetate (3 X 10 ml). The combined organics were dried by passing through a phase separator, and the solvent was removed under reduced pressure. The residue was washed with heptane and the resultant solid dried under vacuum overnight to afford 1-(3-bromo-4-methoxyphenyl)-4-(4-nitrophenyl)piperazine (130 mg, 51.5 %) as an orange solid. LCMS (M+H)+: 392.1 (100%), 394 (90%). 1H NMR (500 MHz, DMSO) δ 8.08 (m, 2H), 7.22 (d, J = 2.5 Hz, 1H), 7.09 (m, 2H), 7.01 (m, 2H), 3.77 (s, 3H), 3.60 (m 4H), 3.19 (m, 4H). 13C NMR (126 MHz, DMSO) δ 155.1, 149.7, 146.3, 137.5, 126.2, 121.3, 117.1, 113.9, 113.3, 111.6, 56.9, 49.2, 46.7.
4-(4-(3-bromo-4-methoxyphenyl)piperazin-1-yl)aniline
A suspension of 1-(3-bromo-4-methoxyphenyl)-4-(4-nitrophenyl)piperazine (130 mg, 0.33 mmol) in ethanol (1 mL) and acetic acid (1 mL) was stirred at room temperature under a stream of nitrogen. Iron (130 mg, 2.32 mmol) was added, and the mixture stirred at 80 °C for 90 minutes and at rt overnight. The mixture was filtered, and the filtrate diluted with sat. aq. sodium bicarbonate solution. The aqueous portion was washed with ethyl acetate (2 X 5ml) and the combined organics passed through a phase separator. The residue was purified by reversed phase HPLC (MeCN/0.2% w/w NH4OH) to afford an off-white solid (25 mg, 20%). Manipulation of the compound in solution resulted in rapid colouration so the compound was used immediately in the next reaction. LCMS (M+H)+: 362.2 (95%), 364.2 (100%).
N-(4-(4-(3-bromo-4-methoxyphenyl)piperazin-1-yl)phenyl)pivalamide
A solution of pivaloyl chloride (0.013 mL, 0.10 mmol) and NEt3 (0.029 mL, 0.21 mmol) in CH2Cl2 (1 mL) was stirred for 15 min at rt and then 4-(4-(3-bromo-4-methoxyphenyl)piperazin-1-yl)aniline (25 mg, 0.07 mmol) in CH2Cl2 (1 mL) added. The resulting mixture was stirred for 120 minutes.
Water (5ml) was added to the reaction mixture and the layers separated. The aqueous layer was washed twice with CH2Cl2 (2X1 mL), and the combined organic layers passed through a phase separator. The organic layer was concentrated to dryness and the residue purified by reversed phase HPLC (35-95% gradient over 7 minutes). Fractions containing the pure product were combined and lyophilized to afford N-(4-(4-(3-bromo-4-methoxyphenyl)piperazin-1-yl)phenyl)pivalamide (22.00 mg, 71.4 %) as an off-white solid. LCMS (M+H)+: 446.1 (90%), 448.1 (100%). 1H NMR (500 MHz, DMSO) δ 8.99 (s, 1H), 7.48 (d, J = 9.1 Hz, 2H), 7.20 (d, J = 2.4 Hz, 1H), 7.01 (m, 2H), 6.93 (d, J = 9.1 Hz, 1H), 3.77 (s, 3H), 3.18 (m, 8H), 1.20 (s, 9H). 13C NMR (126 MHz, DMSO): 175.9, 149.0, 147.0, 146.1, 131.7, 121.5, 120.7, 116.5, 115.8, 113.4, 111.1, 56.4, 49.2, 48.9, 27.3.
N-(4-(4-(4-methoxy-[3-3H]phenyl)piperazin-1-yl)phenyl)pivalamide ([3H]GMC-058)
A slurry of N-(4-(4-(3-bromo-4-methoxyphenyl)piperazin-1-yl)phenyl)pivalamide (2.5 mg, 5.60 µmol), 10% Pd-C (2.1 mg, 0.02 mmol) and NEt3 (20 µl, 0.14 mmol) in DMF (0.5 mL) was degassed using freeze-thaw methodology [22] and T2 (274 GBq, 129 µmol) was added. The reaction mixture was stirred at rt for 4 hours. The unused tritium was recovered, and the volatiles were removed by blowing a stream of N2 over the slurry. MeOH (0.5 mL) was added and removed under a N2 stream twice. The residue was taken up in EtOH and the catalyst removed via filtration. HPLC showed 86% radiochemical purity. The residue was purified by preparative HPLC, and product containing fractions were combined and concentrated to dryness. The residue was taken up in 10 mL of EtOH to give 3554 MBq. LCMS (M-H)-: 368.2 (24%), 370.2 (100%). Molar activity: 854 GBq/mmol. 1H NMR: 9.00 (s, 1H), 7.49 (d, J=8.5 Hz, 2H) 6.95 (t, J = 10.7 Hz, 4H), 6.86 (s, 1H), 3.71 (s, 3H). 3H NMR: 6.9 (s). LC Rad: 99.5%
Synthesis of [3H]GMC-073
1-(3-bromo-2-methoxyphenyl)-3-(3-cyano-4-(4-(4-fluorophenyl)piperazin-1-yl)phenyl)urea
A solution of 5-amino-2-(4-(4-fluorophenyl)piperazin-1-yl)benzonitrile (167 mg, 0.56 mmol), 3-bromo-2-methoxyaniline (114 mg, 0.56 mmol), and NEt3 (0.47 mL, 3.4 mmol) in THF (2 mL) under N2 was cooled in an ice bath and was stirred as triphosgene (120 mg, 0.40 mmol) in THF (2 mL) was added. The mixture was stirred for 90 minutes in the ice-bath. Water (25 mL) was added to the mixture, and the mixture was stirred for 15 minutes. The sample was diluted with EtOAc, and the organic portion separated. The aqueous layer was washed with EtOAc, and the combined organics were dried (Na2SO4). The solids were removed by filtration, and the solvent was concentrated to dryness. The residue was purified by silica gel chromatography to afford 1-(3-bromo-2-methoxyphenyl)-3-(3-cyano-4-(4-(4-fluorophenyl)piperazin-1-yl)phenyl)urea (34.8 mg, 11.78 %) as a pale yellow solid. LCMS (M+1)+: 524.4 (80%), 526-4 (100%) 1H NMR (500 MHz, DMSO) δ 9.52 (s, 1H), 8.53 (s, 1H), 8.20 (dd, J = 8.3, 1.5 Hz, 1H), 7.91 (d, J = 2.6 Hz, 1H), 7.57 (dd, J = 8.9, 2.7 Hz, 1H), 7.22 (m, 2H), 7.04 (m, 5H), 3.79 (s, 3H), 3.25 (m, 8H).
1-(3-cyano-4-(4-(4-fluorophenyl)piperazin-1-yl)phenyl)-3-(2-methoxy-[3-3H]-phenyl)urea ([3H]GMC-073)
A slurry of 1-(3-bromo-2-methoxyphenyl)-3-(3-cyano-4-(4-(4-fluorophenyl)piperazin-1-yl)phenyl)urea (2.4 mg, 4.58 µmol) and 10% Pd/C (2 mg, 18.79 µmol) in DMF (0.5 mL) and NEt3 (20 µL, 143.49 µmol) was degassed by two freeze/thaw cycles (1) and T2 (280 GBq, 131 µmol) was added. The reaction mixture was stirred at rt for 4 hours. The unused tritium was recovered, and then volatiles removed by blowing a stream of N2 over the slurry. MeOH (0.5 mL) was added and removed under a N2 stream twice. The sample was taken up in 0.5 mL of EtOH and was filtered to give 4117 MBq. HPLC analysis showed the radiochemical purity to be 47%. The EtOH solution was concentrated to dryness and purified by preparative HPLC. Product containing fractions were combined and concentrated under vacuum. The sample was dissolved in EtOH (30 mL) to give 832.8 MBq of [3H]GMC-073. LCMS (M+1): 446 (19.7%), 448 (100%). Molar activity: 865 GBq/mmol. 1H NMR (500 MHz, DMSO) δ 9.54 (s, 1H), 8.29 (s, 1H), 8.11 (d, J = 7.9 Hz, 1H), 7.92 (s, 1H), 7.56 (s, 1H), 7.23 (d, J = 9.2 Hz, 1H), 7.10 (s, 2H), 7.05 (s, 2H), 6.91 (s, 1H), 3.89 (s, 3H). 3H NMR (533 MHz, DMSO): 7.08 (d, 4.3 Hz). LC Rad: 98.9%.
Synthesis of [3H]GMC-098
N-(2-cyano-4’-methoxy-[1,1’-biphenyl]-4-yl)-4-(4-iodophenyl)piperazine-1-carboxamide
A solution of N-(2-cyano-4’-methoxy-[1,1’-biphenyl]-4-yl)-4-phenylpiperazine-1-carboxamide (10 mg, 24 µmol) and N-iodosuccinimde (12.5 mg, 55.5 µmol) in MeCN (5 ml) was stirred at rt overnight. LCMS analysis showed incomplete reaction; therefore, N-iodosuccinimide (5 mg, 20 µmol) was added. After 3.5 hours, a third portion of N-iodosuccinimde (5 mg, 20 µmol) was added. After a further 90 minutes, the reaction was concentrated to dryness under a stream of nitrogen, and the residue was purified by preparative HPLC. Product containing fractions were pooled and lyophilized to afford (1.8 mg, 14 %) as a white solid. The location of the iodide was inferred from the tritiation product. LCMS (M+H)+: 539.1.
N-(2-cyano-4’-methoxy-[1,1’-biphenyl]-4-yl)-4-([4-3H]phenyl)piperazine-1-carboxamide ([3H]GMC-098)
A slurry of N-(2-cyano-4’-methoxy-[1,1’-biphenyl]-4-yl)-4-(4-iodophenyl)piperazine-1-carboxamide (0.75 mg, 1.4 µmol), 10% Pd-C (1 mg), and NEt3 (20µL, 149 µmol) in DMF (0.5 mL) was degassed by two freeze/thaw cycles [22] and T2 (282 GBq, 132 µmol) was added. The reaction mixture was stirred at rt for 4 hours. The unused tritium was recovered, and the volatiles removed by blowing a stream of N2 over the slurry. MeOH (0.5 mL) was added and removed under a N2 stream twice. The sample was taken up in 0.5 mL of EtOH and was filtered. HPLC analysis showed the radiochemical purity to be 56%. The EtOH solution was concentrated to dryness, and the residue purified by preparative HPLC. Product containing fractions were combined and concentrated under vacuum. The sample was dissolved in EtOH (30 mL) to give 281 MBq of [3H]GMC-098. LCMS (M+H)+: 413.3 (8.8%), 415.3 (100%). Molar activity: 974 GBq/mmol. 1H NMR (500 MHz, DMSO) δ 9.02 (s, 1H), 8.55 (m, 2H), 8.04 (s, 1H), 7.83 (d, J = 8.9 Hz, 1H), 7.49 (m, 3H), 7.23 (m, 3H), 7.07 (d, J = 8.2 Hz, 2H), 7.00 (d, J = 8.2 Hz, 2H). 3H NMR (533MHz, DMSO): 6.88. LC-RAD 98.5%.
Table A1.
Demographic data of cases from the Netherlands Brain Bank selected for the construction of tissue microarrays.
Table A1.
Demographic data of cases from the Netherlands Brain Bank selected for the construction of tissue microarrays.
| Case n. | Diagnosis | Age | Sex | PMI (h) | Brain region | Aβ/pTau/α-syn* |
|---|---|---|---|---|---|---|
| S11/010 | Parkinson´s disease | 82 | M | 6.1 | Cingulate gyrus | - /+/+++ |
| S10/47 | Lewy-body disease | 76 | M | 6.3 | Hippocampus | +++/+++/+++ |
| S14/013 | Lewy-body disease | 68 | F | 4.6 | Hippocampus | +/+++/+++ |
| S13/054 | Dementia with Lewy-bodies | 91 | F | 4.7 | Inferior parietal gyrus | +++/+/+++ |
| Multiple system atrophy | 66 | M | 4.9 | Cerebellum | -/-/+++ | |
| S10/134 | Multiple system atrophy | 65 | M | 4.75 | Cerebellum | -/-/+++ |
| S95/120 | Multiple system atrophy | 69 | F | 4.5 | Cerebellum | -/-/+++ |
| S11/074 | Cortico-basal degeneration | 63 | M | 6.5 | Superior frontal gyrus | -/+++/- |
| S98/105 | Cortico-basal degeneration | 72 | M | 5.3 | Thalamus and subthalamic nucleus | -/+++/- |
| S11/085 | Cortico-basal degeneration | 65 | F | 6 | Thalamus | -/+++/- |
| S13/064 | Progressive supranuclear palsy | 70 | M | 6.8 | Cerebellum | -/+++/- |
| S12/004 | Progressive supranuclear palsy | 65 | F | 5.8 | Cerebellum | -/+++/- |
| S12/083 | Cerebral amyloid angiopathy | 79 | M | 9.75 | Hippocampus | +++/+++/- |
| S98/071 | Cerebral amyloid angiopathy | 79 | M | 9.75 | Cerebellum | +++/-/- |
| S98/071 | Cerebral amyloid angiopathy | 79 | M | 9.75 | Parietal cortex | +++/+/+ |
| S98/071 | Non-demented control | 78 | F | 7.17 | Cingulate gyrus | -/-/- |
| S14/029 | Non-demented control | 51 | F | 7.7 | Cingulate gyrus | -/-/- |
| S94/325 | Non-demented control | 63 | F | 6.4 | Cingulate gyrus | -/-/- |
| S95/258 | Non-demented control | 56 | M | 5.4 | Cingulate gyrus | -/-/- |
| S98/235 | Non-demented control | 56 | M | 5.4 | Medial temporal gyrus | -/-/- |
| S98/235 | Non-demented control | 56 | M | 5.4 | Superior frontal gyrus | -/-/- |
| S98/235 | Alzheimer’s disease | 85 | M | 4.6 | Inferior frontal gyrus | +++/+++ |
| M05/340 | Alzheimer’s disease | 67 | F | 5.8 | Hippocampus | +++/+++ |
| M05/332 | Alzheimer’s disease | 88 | F | 5.2 | Hippocampus | +++/+++ |
| M05/331 | Alzheimer’s disease | 84 | F | 5.9 | Hippocampus | +++/+++ |
| M05/327 | Parkinson´s disease | 98 | M | 5.7 | Substantia nigra | -/+/+++ |
| S09/252 | Parkinson´s disease | 78 | M | 5.8 | Substantia nigra | -/+/+++ |
| S13/059 | Parkinson´s disease | 86 | M | 4.2 | Substantia nigra | +/-/+++ |
| S13/077 | Parkinson´s disease | 57 | M | 6.6 | Substantia nigra | -/-/+++ |
| S17/055 | Parkinson´s disease | 87 | F | 7.9 | Substantia nigra | -/-/+++ |
| S17/056 | Parkinson´s disease | 90 | F | 5.3 | Substantia nigra | -/+/+++ |
| S17/101 | Parkinson´s disease | 85 | F | 5.2 | Substantia nigra | +/+/+++ |
| S17/162 | Parkinson´s disease | 82 | M | 6.1 | Cingulate gyrus | Aβ/pTau/α-syn* |
Aβ/pTau/α-syn=ICH was performed using antibodies for Aβ (6E10/4G8), pTau (AT-8) and α-syn (LB509). *Qualitative score of pathology: - = negative to pathology; + = low abundance of aggregates / inclusions; +++ = high amount of aggregates / inclusions.
Table A2.
Demographic data of cases from the Alzheimer´s Disease Research Center selected for brain homogenates.
Table A2.
Demographic data of cases from the Alzheimer´s Disease Research Center selected for brain homogenates.
| Diagnosis | Sex(M/F) | Age (years) | PMT (hrs) |
ApoE | A | B | C | Region sampled |
|---|---|---|---|---|---|---|---|---|
| AD | F | 88 | 4 | 34 | 3 | 3 | 3 | MFG |
| AD | F | 67 | 3 | 34 | 3 | 3 | 3 | MFG |
| AD | F | 81 | 8 | 34 | 3 | 3 | 3 | MFG |
| AD | M | 61 | 6 | 33 | 3 | 3 | 3 | MFG |
| AD | M | 62 | 3 | 33 | 3 | 3 | 3 | MFG |
| AD | M | 84 | 7 | 44 | 3 | 3 | 3 | MFG |
| Control | M | 44 | 14.2 | n/a | 0 | 0 | 0 | prefrontal,occipital, temporal, parietal. |
Table A3.
Demographic data of cases from the University of California San Francisco selected for brain homogenates.
Table A3.
Demographic data of cases from the University of California San Francisco selected for brain homogenates.
| Diagnosis | Sex(M/F) | Age (years) | PMT (hrs) |
Abeta pathology: | Tau pathology: Specific tau lesions |
Region sampled |
|---|---|---|---|---|---|---|
| PSP | M | 63 | 4.4 | n/a | Neuronal and glial inclusions, tufted astrocytes | L-SFG |
| PSP | F | 70 | 7.2 | n/a | Neuronal and glial inclusions, tufted astrocytes | L-SFG |
| PSP | M | 68 | 10.1 | n/a | Neuronal and glial inclusions, tufted astrocytes | R-SFG |
| CBD | M | 68 | 7.4 | 0 | Neuronal and glial inclusions, astrocytic plaques | R-M/IFG(A) |
| CBD | F | 70 | 7.4 | 0 | Neuronal and glial inclusions, astrocytic plaques | R-M/IFG(A) |
| CBD | F | 63 | 5.0 | 0 | Neuronal and glial inclusions, astrocytic plaques | R-M/IFG(A) |
Table A4.
Demographic data of cases from Banner Sun Health Research Institute selected for brain homogenates.
Table A4.
Demographic data of cases from Banner Sun Health Research Institute selected for brain homogenates.
| Diagnosis | Sex(M/F) | Age (years) | PMT | LB stage |
|---|---|---|---|---|
| PD | M | 81 | 2.5 | lll. Brainstem/Limbic |
| PDD | M | 70 | 1.83 | lll. Brainstem/Limbic |
| PDD | M | 75 | 2.25 | lV. Neocortical |
| PD | M | 75 | 2.33 | lV. Neocortical |
| MSA-P | F | 57 | 32 | n/a. |
| MSA-P | M | 58 | 12 | n/a |
Table A5.
Compounds displaying Ki values < 30 nM for α-syn and > 50 nM for Aβ and tau. In bold the compounds that were selected for 3H-radiolabelling.
Table A5.
Compounds displaying Ki values < 30 nM for α-syn and > 50 nM for Aβ and tau. In bold the compounds that were selected for 3H-radiolabelling.
| Structure | Name | Molecular weight | XLogP | α-syn (Ki, nM) | Aβ (Ki, nM) | Tau-NFT (Ki, nM) |
|---|---|---|---|---|---|---|
 |
GMC013_FR-1 | 397,5 | 3,37 | 25,5 | 63 | 151 |
 |
GMC015 | 413,5 | 3,26 | 28,3 | 294 | 761 |
 |
GMC021 | 442,3 | 2,63 | 22,2 | 889 | 2510 |
 |
GMC023 | 427,5 | 2,86 | 21,2 | 151 | 44 |
 |
GMC024 | 427,5 | 2,86 | 25,3 | 81 | 68 |
 |
GMC025 | 427,5 | 2,86 | 29,7 | 141 | 50 |
 |
GMC044 | 411,5 | 3,32 | 25,2 | 3440 | 692 |
 |
GMC045 | 402,5 | 3,15 | 24,7 | 412 | 239 |
 |
GMC058 | 367,5 | 3,49 | 22,5 | 1490 | 1320 |
 |
GMC070 | 403,5 | 2,64 | 6,8 | 64 | 90 |
 |
GMC071 | 428,5 | 2,36 | 14,2 | 8180 | 86 |
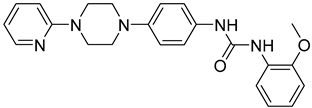
 |
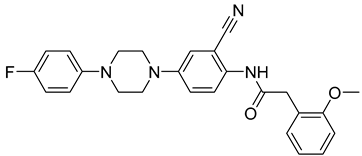
GMC073 | 445,5 | 3,37 | 8,0 | 2630 | 248 |
 |
GMC079 | 420,5 | 3,24 | 23,9 | 404 | 2510 |
 |
GMC086 | 444,5 | 3,87 | 15,2 | 809 | 26 |
 |
GMC095 | 438,5 | 2,98 | 14,5 | 2630 | 2510 |
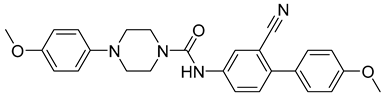 |
GMC096 | 442,5 | 4,13 | 6,5 | 51 | 2510 |
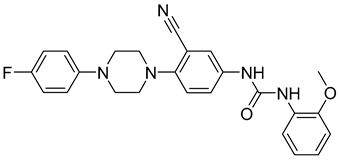
 |
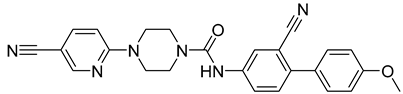
GMC098 | 442,5 | 4,13 | 9,7 | 226 | 805 |
Table A6.
Average total, non-specific binding (NSB) and total minus NSB (in fmol/mg tissue equivalent) ± standard error of the mean (SEM), measured at two concentrations for each radioligand from grey matter of the cingulate cortex of n=1 control subject (C03). Average calculated from 4 technical replicates per condition.
| [3H]GMC-058 | [3H]GMC-073 | [3H]GMC-098 | ||||||||||
|---|---|---|---|---|---|---|---|---|---|---|---|---|
| 25 nM | 50 nM | 10 nM | 20 nM | 10 nM | 20 nM | |||||||
| Total | NSB | Total | NSB | Total | NSB | Total | NSB | Total | NSB | Total | NSB | |
| Average (fmol/mg) ± SEM | 57,6 ±1,8 | 37,6 ± 3,8 | 114,1 ± 9,3 | 74,6 ± 4,1 | 664,6 ± 24,3 | 346,9 ± 14,5 | 1870 ± 100,2 | 1022 ± 45 | 2705 ± 62,2 |
1878 ± 74,1 | 5146 ± 386,2 | 2336 ± 48,5 |
| Total minus NSB (fmol/mg) | 20 | 40 | 318 | 848 | 827 | 2810 | ||||||
Table A7.
Binding (fmol/mg tissue equivalent) of 25nM [3H]GMC-058 in tissue sections from controls, PD and MSA patients. Each grey matter (GM) or white matter (WM) value represents an average from ROIs of 4 replicates.
Table A7.
Binding (fmol/mg tissue equivalent) of 25nM [3H]GMC-058 in tissue sections from controls, PD and MSA patients. Each grey matter (GM) or white matter (WM) value represents an average from ROIs of 4 replicates.
| binding in fmol/mg | |||||
|---|---|---|---|---|---|
| Condition | Cases | ROI | Total | NSB (5 µM GMC044) |
Total minus NSB |
|
Non demented control (cingulate gyrus) |
C01 | GM | 56,8 | 60,3 | -3,5 |
| WM | 56,9 | 59,8 | -2,9 | ||
| C02 | GM | 44,3 | 24,6 | 19,8 | |
| WM | 45,3 | 31,8 | 13,6 | ||
| C03 | GM | 45,3 | 28,6 | 16,7 | |
| WM | 48,7 | 39,0 | 9,7 | ||
|
MSA (cerebellum) |
MSA1 | GM | 46,9 | 27,4 | 19,5 |
| WM | 50,1 | 33,3 | 16,8 | ||
| MSA2 | GM | 30,3 | 19,9 | 10,3 | |
| WM | 52,5 | 27,7 | 24,8 | ||
|
PD (cingulate gyrus) |
PD1 | GM | 55,6 | 42,3 | 13,3 |
| WM | 52,5 | 50,6 | 1,9 | ||
| PD2 | GM | 16,2 | 17,1 | -0,9 | |
| WM | 55,4 | 53,7 | 1,6 | ||
| PD3 | GM | 59,3 | 42,0 | 17,2 | |
| WM | 55,4 | 47,1 | 8,3 |
Table A8.
Specific 25 nM [3H]GMC058 binding (fmol/mg tissue equivalent) from autoradiography of brain tissue from different proteinopathies. Binding was quantified from grey (GM) and white matter (WM) regions of interest (ROI) in all cases. Bars represent the average ±s.e.m. of two technical replicates quantified from each case. MSA= multiple system atrophy; CBD=cortical-basal degeneration; PSP=progressive supranuclear palsy; NDE= non-demented elderly controls. Non-specific binding was measured with excess (5 µM) of cold blocker (GMC-044).
| specific binding (fmol/mg tissue equivalent) |
||||
|---|---|---|---|---|
| Region | ||||
| Pathology | Case | Regions | WM | GM |
| MSA | MSA3 | Cerebellum | 21 | 26 |
| MSA4 | 49 | 23 | ||
| CBD | CBD1 block 1 | SFG | 29 | 50 |
| CBD1 block 2 | 130 | 32 | ||
| PSP | PSP1 | GP | 32 | 102 |
| PSP2 | -1 | 118 | ||
| NDE | C03 | Cingulate cortex | -2 | 15 |
| C04 | Caudate | -1 | 8 | |
| C04 | Globus Pallidus | 0 | 10 | |
| Co4 | Putamen | 4 | 12 | |
Appendix B
Figure A1.
Representative images from a pilot autoradiography experiment on post-mortem sections from cingulate cortex of one healthy human subject. Testing specific binding of: [3H]GMC-058: 25nm, 50nM; [3H]GMC-073: 10nM, 20nM; [3H]GMC-098: 10nM, 20nM. Non-specific binding (NSB) was measured with excess (5 µM) of blocker GMC044. GMC044 displaced ~65% of [3H]GMC-058 binding and ~50% of [3H]GMC-073 and [3H]GMC-078. Line scale: 10 mm.
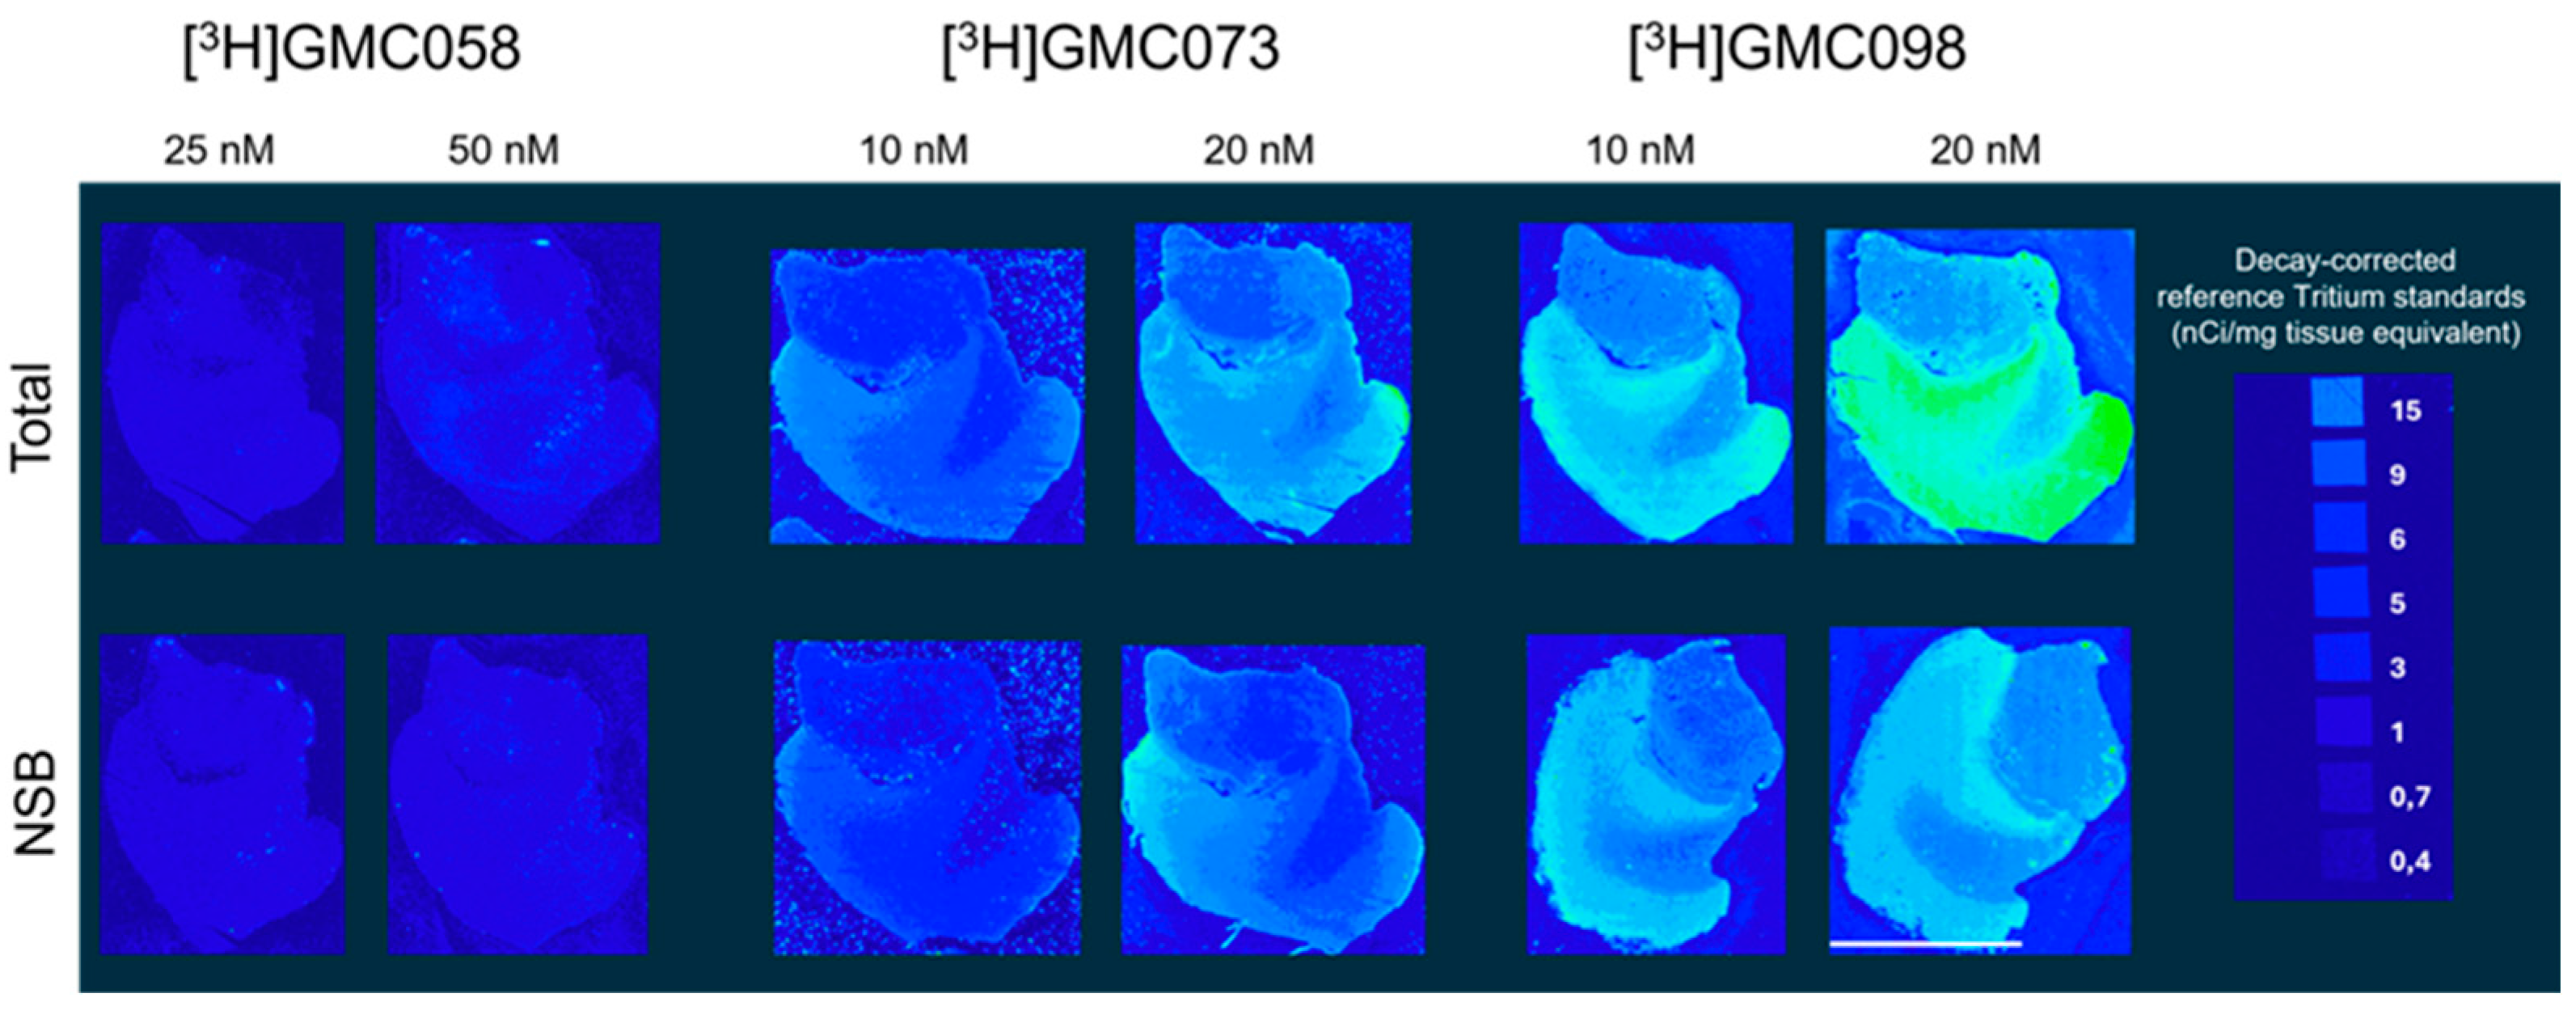
Figure A2.
Quantitative analysis from [3H]GMC-058 saturation binding autoradiography in tissue Microarrays (TMAs). (a) Non-specific binding plotted as % of total binding. (b) Specific binding in fmol/mg tissue equivalent. Bars represent the average ± s.e.m. of the respective number of cases as described in Table 2. NDE=non-demented elderly controls; MSA=multiple system atrophy; CAA=Cerebral amyloid angiopathy; AD=Alzheimer´s disease; CBD=cortico-basal degeneration; PSP=progressive supranuclear palsy; PD=Parkinson´s disease.
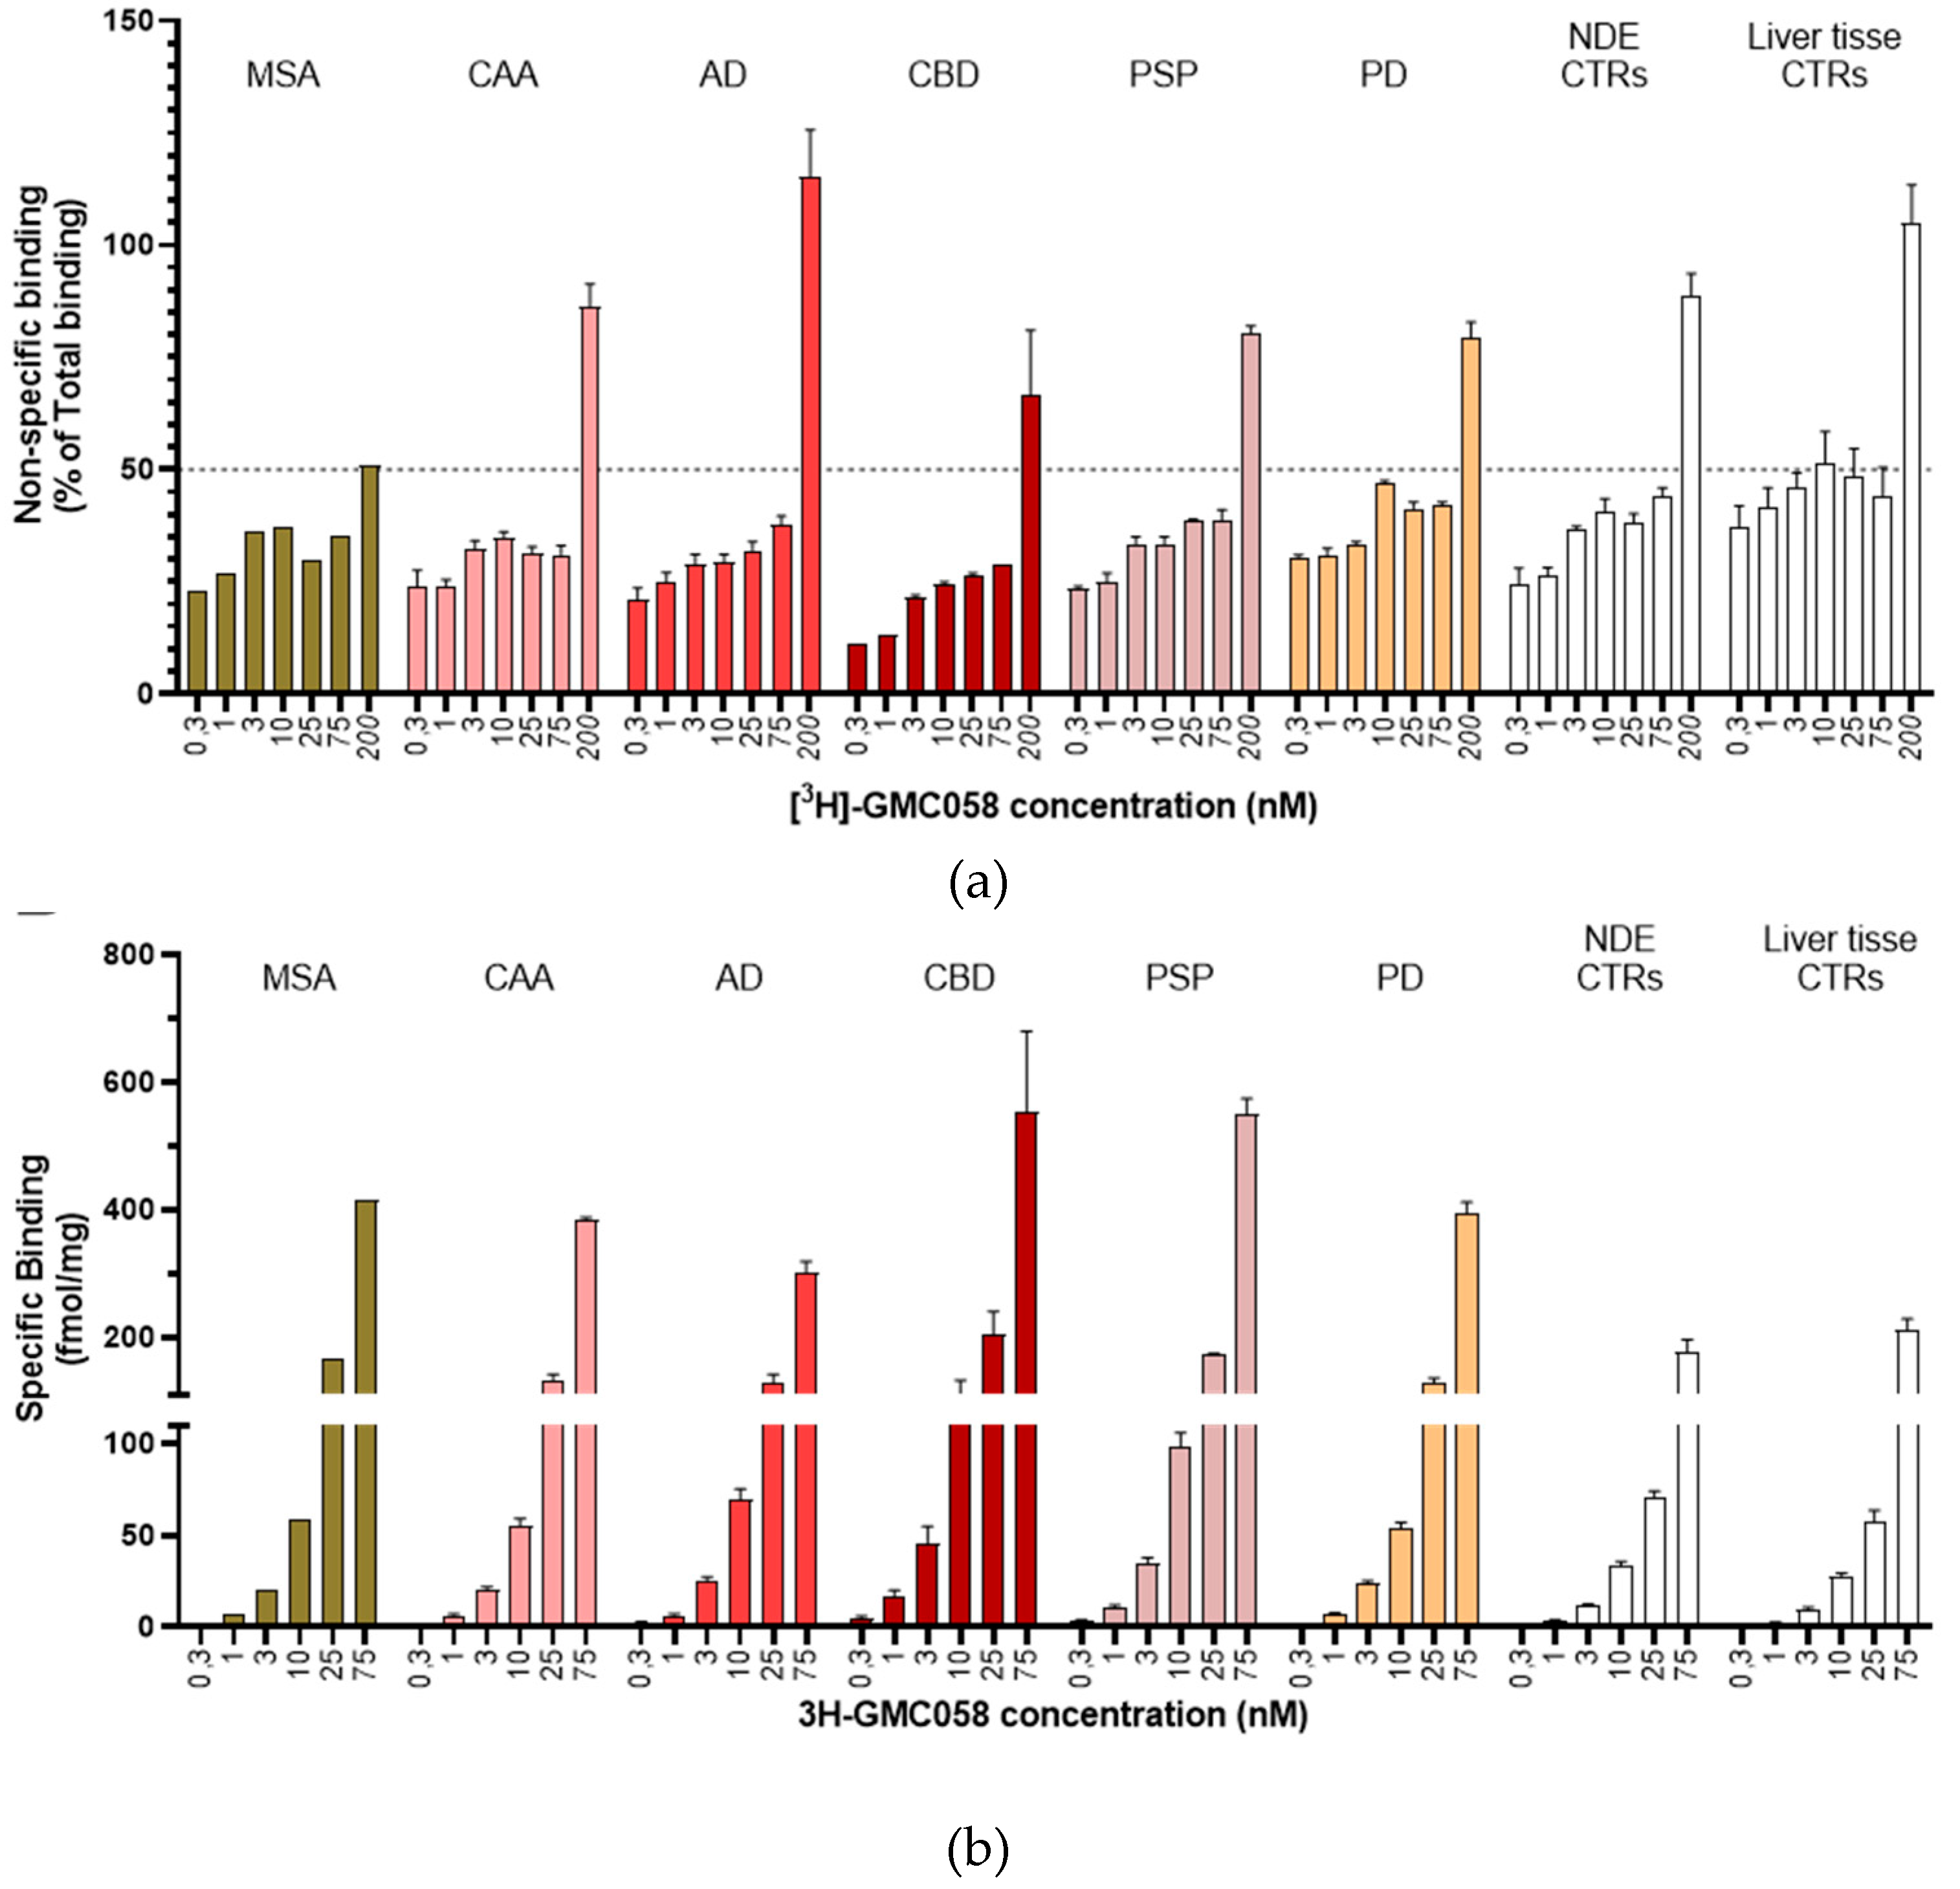
Figure A3.
Specific binding (fmol/mg tissue equivalent) of 25 nM [3H]GMC-058, measured in TMAs from cases with different proteinopathies. NDE=non-demented elderly controls; MSA=multiple system atrophy; CAA=Cerebral amyloid angiopathy; AD=Alzheimer´s disease; CBD=cortico-basal degeneration; PSP=progressive supranuclear palsy; PD=Parkinson´s disease. ****p<0.0001; ***p<0.001; ** p<0.01, compared to NDE control, obtained by one-way ANOVA with Dunnett’s multiple comparisons test. Bars represent the average ± s.e.m. of the respective number of cases as described in Table 2. In non-demented controls (NDE) and liver tissue the values represent displaceable (off-target) binding.
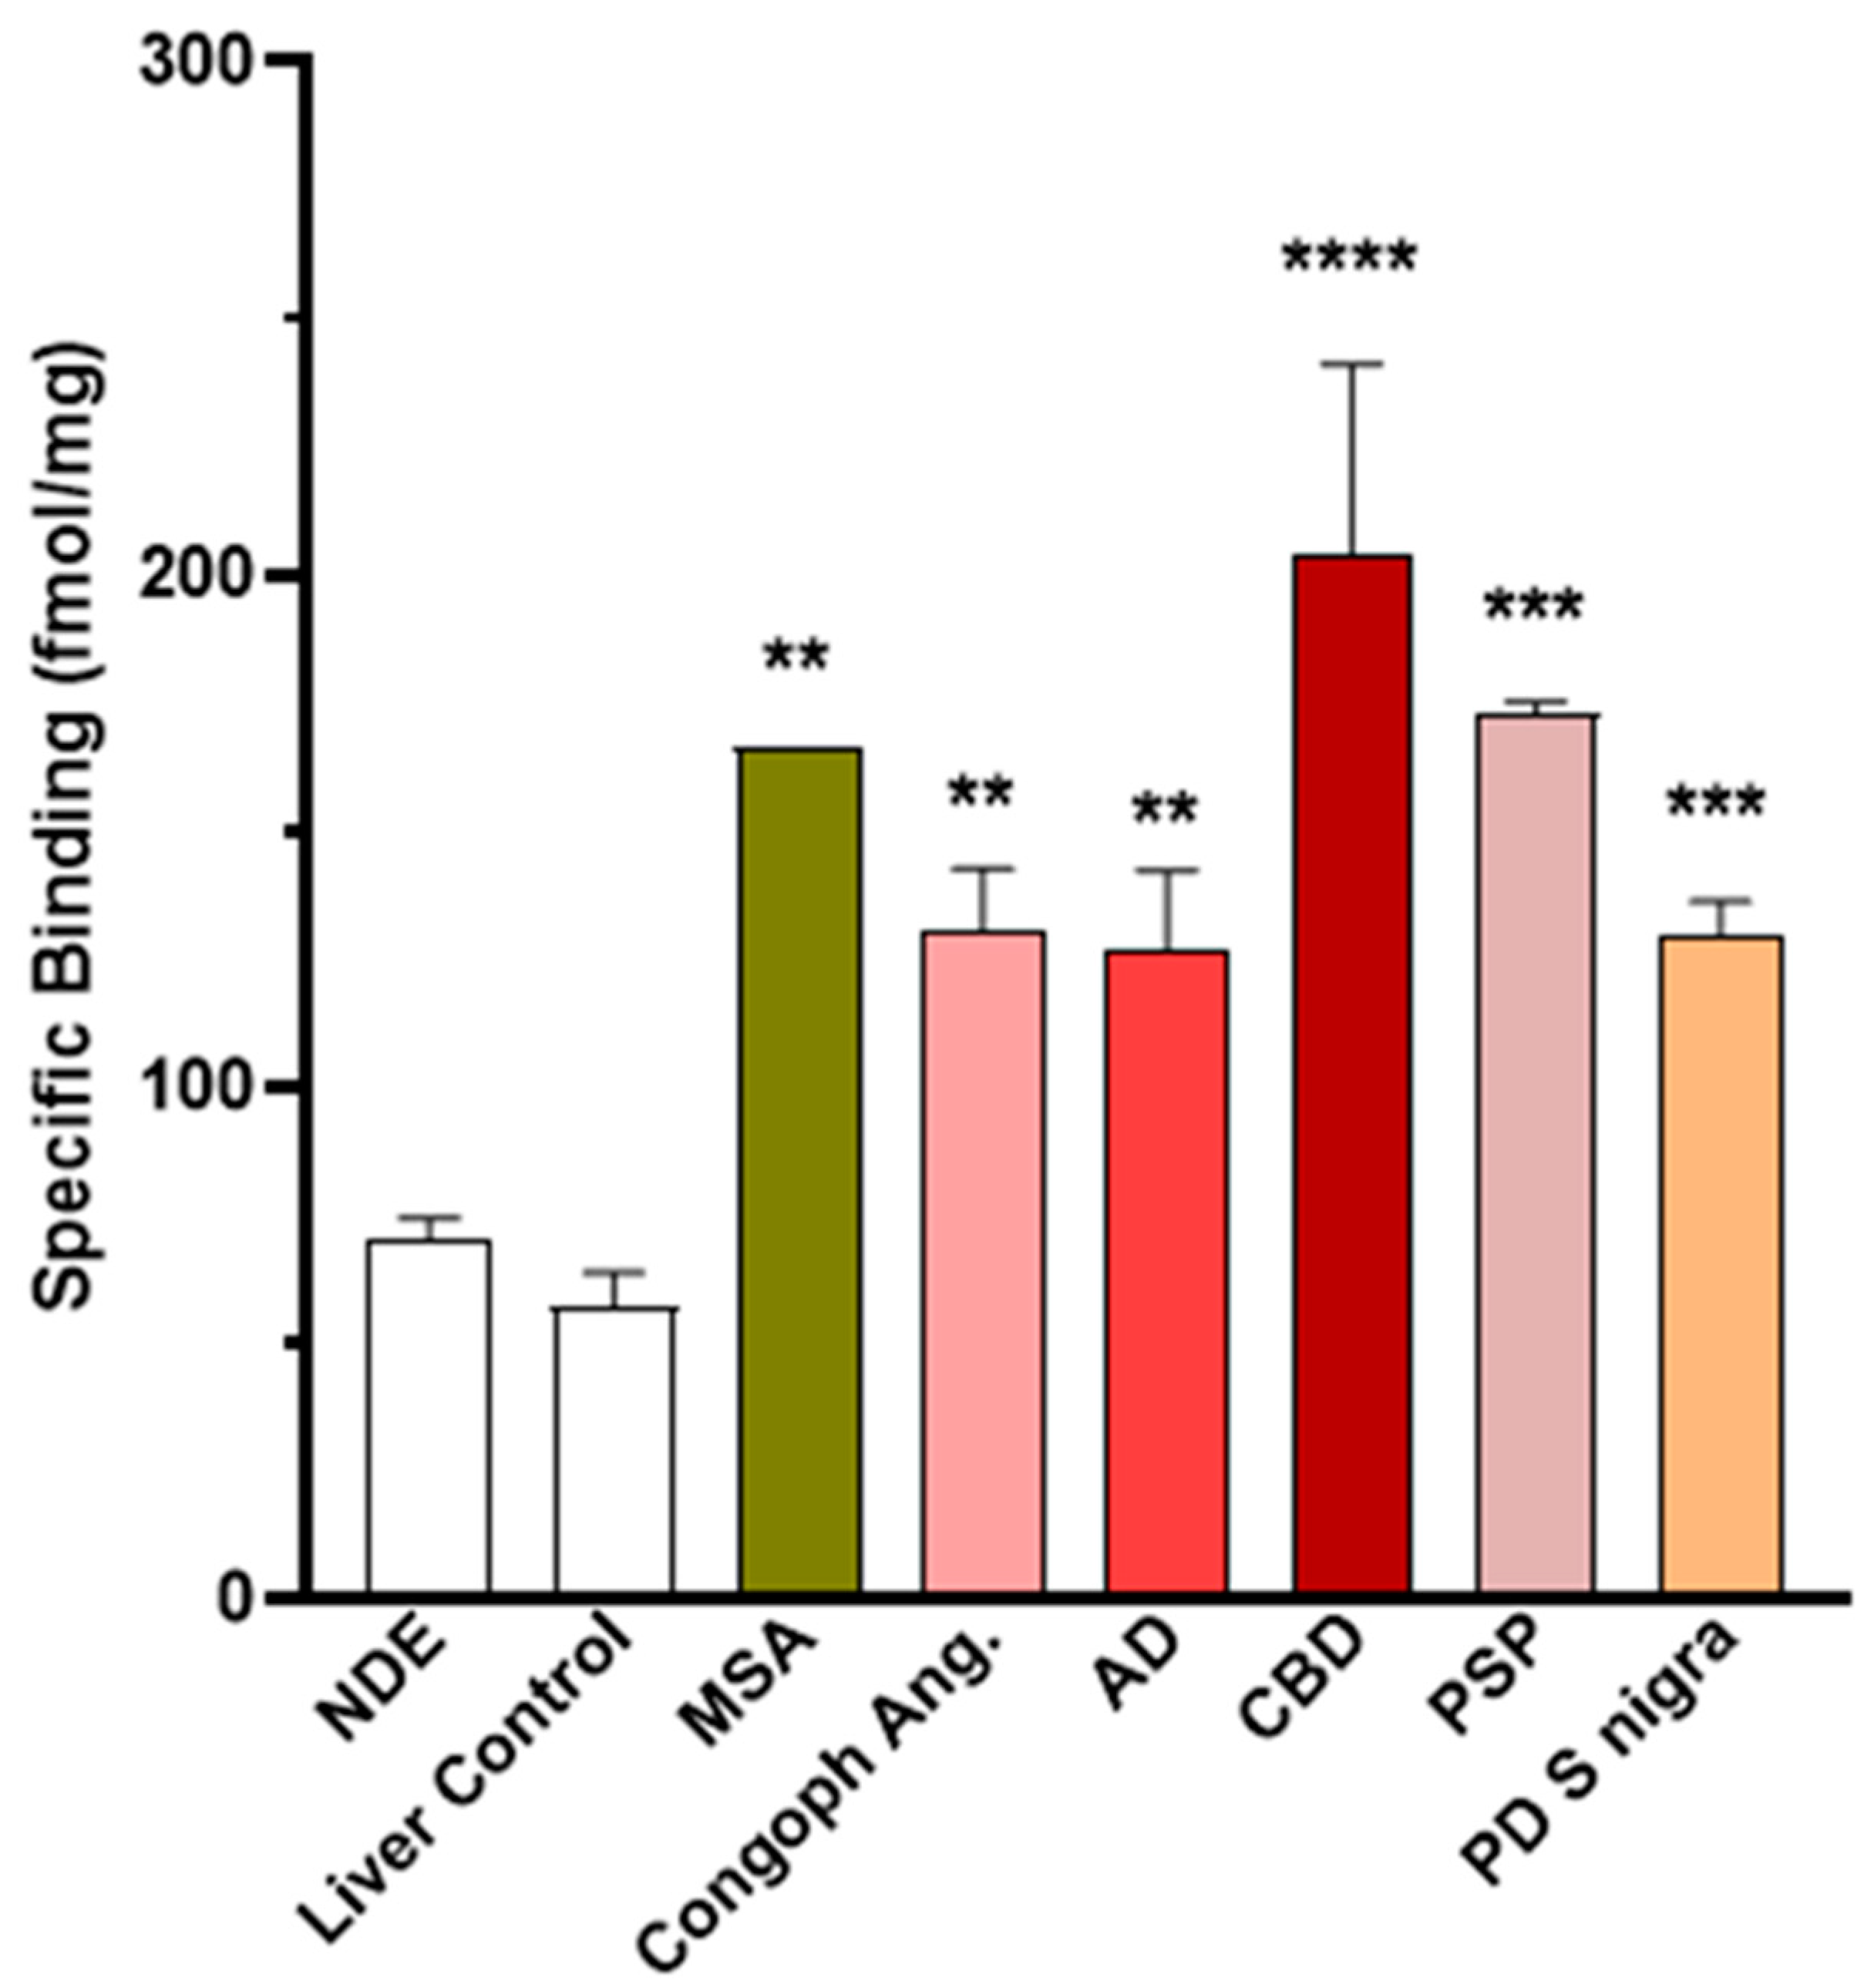
Figure A4.
Representative high magnification images from immunohistochemistry (IHC) and emulsion autoradiography (ARG) with 25 nM [3H]GMC-058 performed on TMA sections from cases with MSA and Lewy-body disease. ARG signal (silver grains on the left) correspond to α-syn inclusions in MSA (oligodendrocytic cytoplasmic inclusions) and PD (Lewy bodies) and is reduced after co-incubation of 5 µM GMC-044.
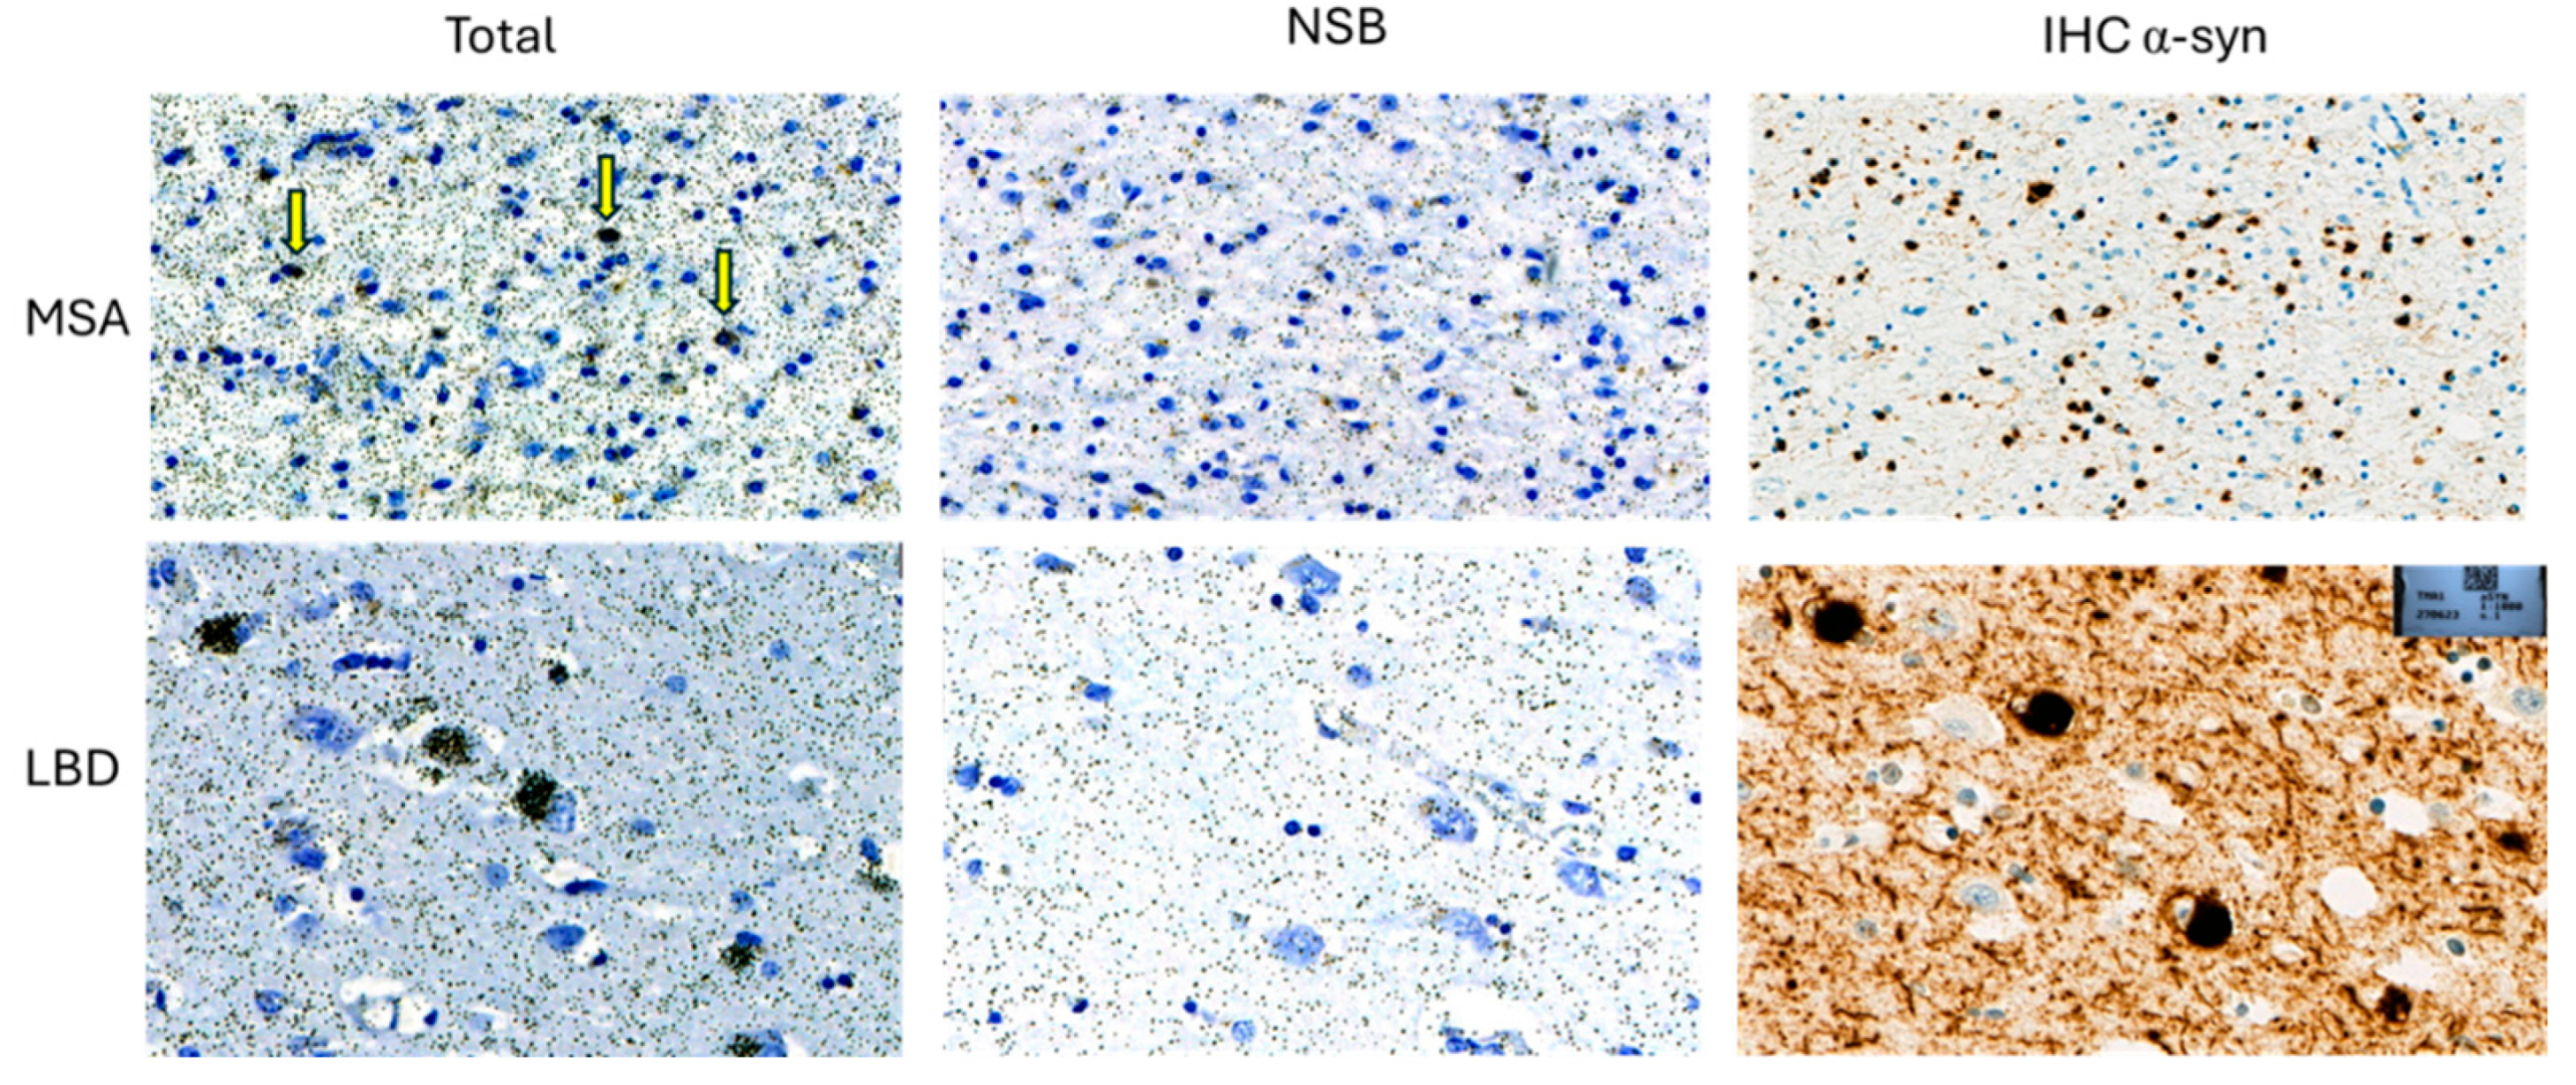
Figure A5.
Representative high magnification images from immunohistochemistry (IHC) and emulsion autoradiography (ARG) with 25 nM [3H]GMC-058 performed on TMA sections from the substantia nigra of one case with Parkinson´s disease. The circled Lewy bodies are the same identified with ARG and IHC.
Figure A5.
Representative high magnification images from immunohistochemistry (IHC) and emulsion autoradiography (ARG) with 25 nM [3H]GMC-058 performed on TMA sections from the substantia nigra of one case with Parkinson´s disease. The circled Lewy bodies are the same identified with ARG and IHC.
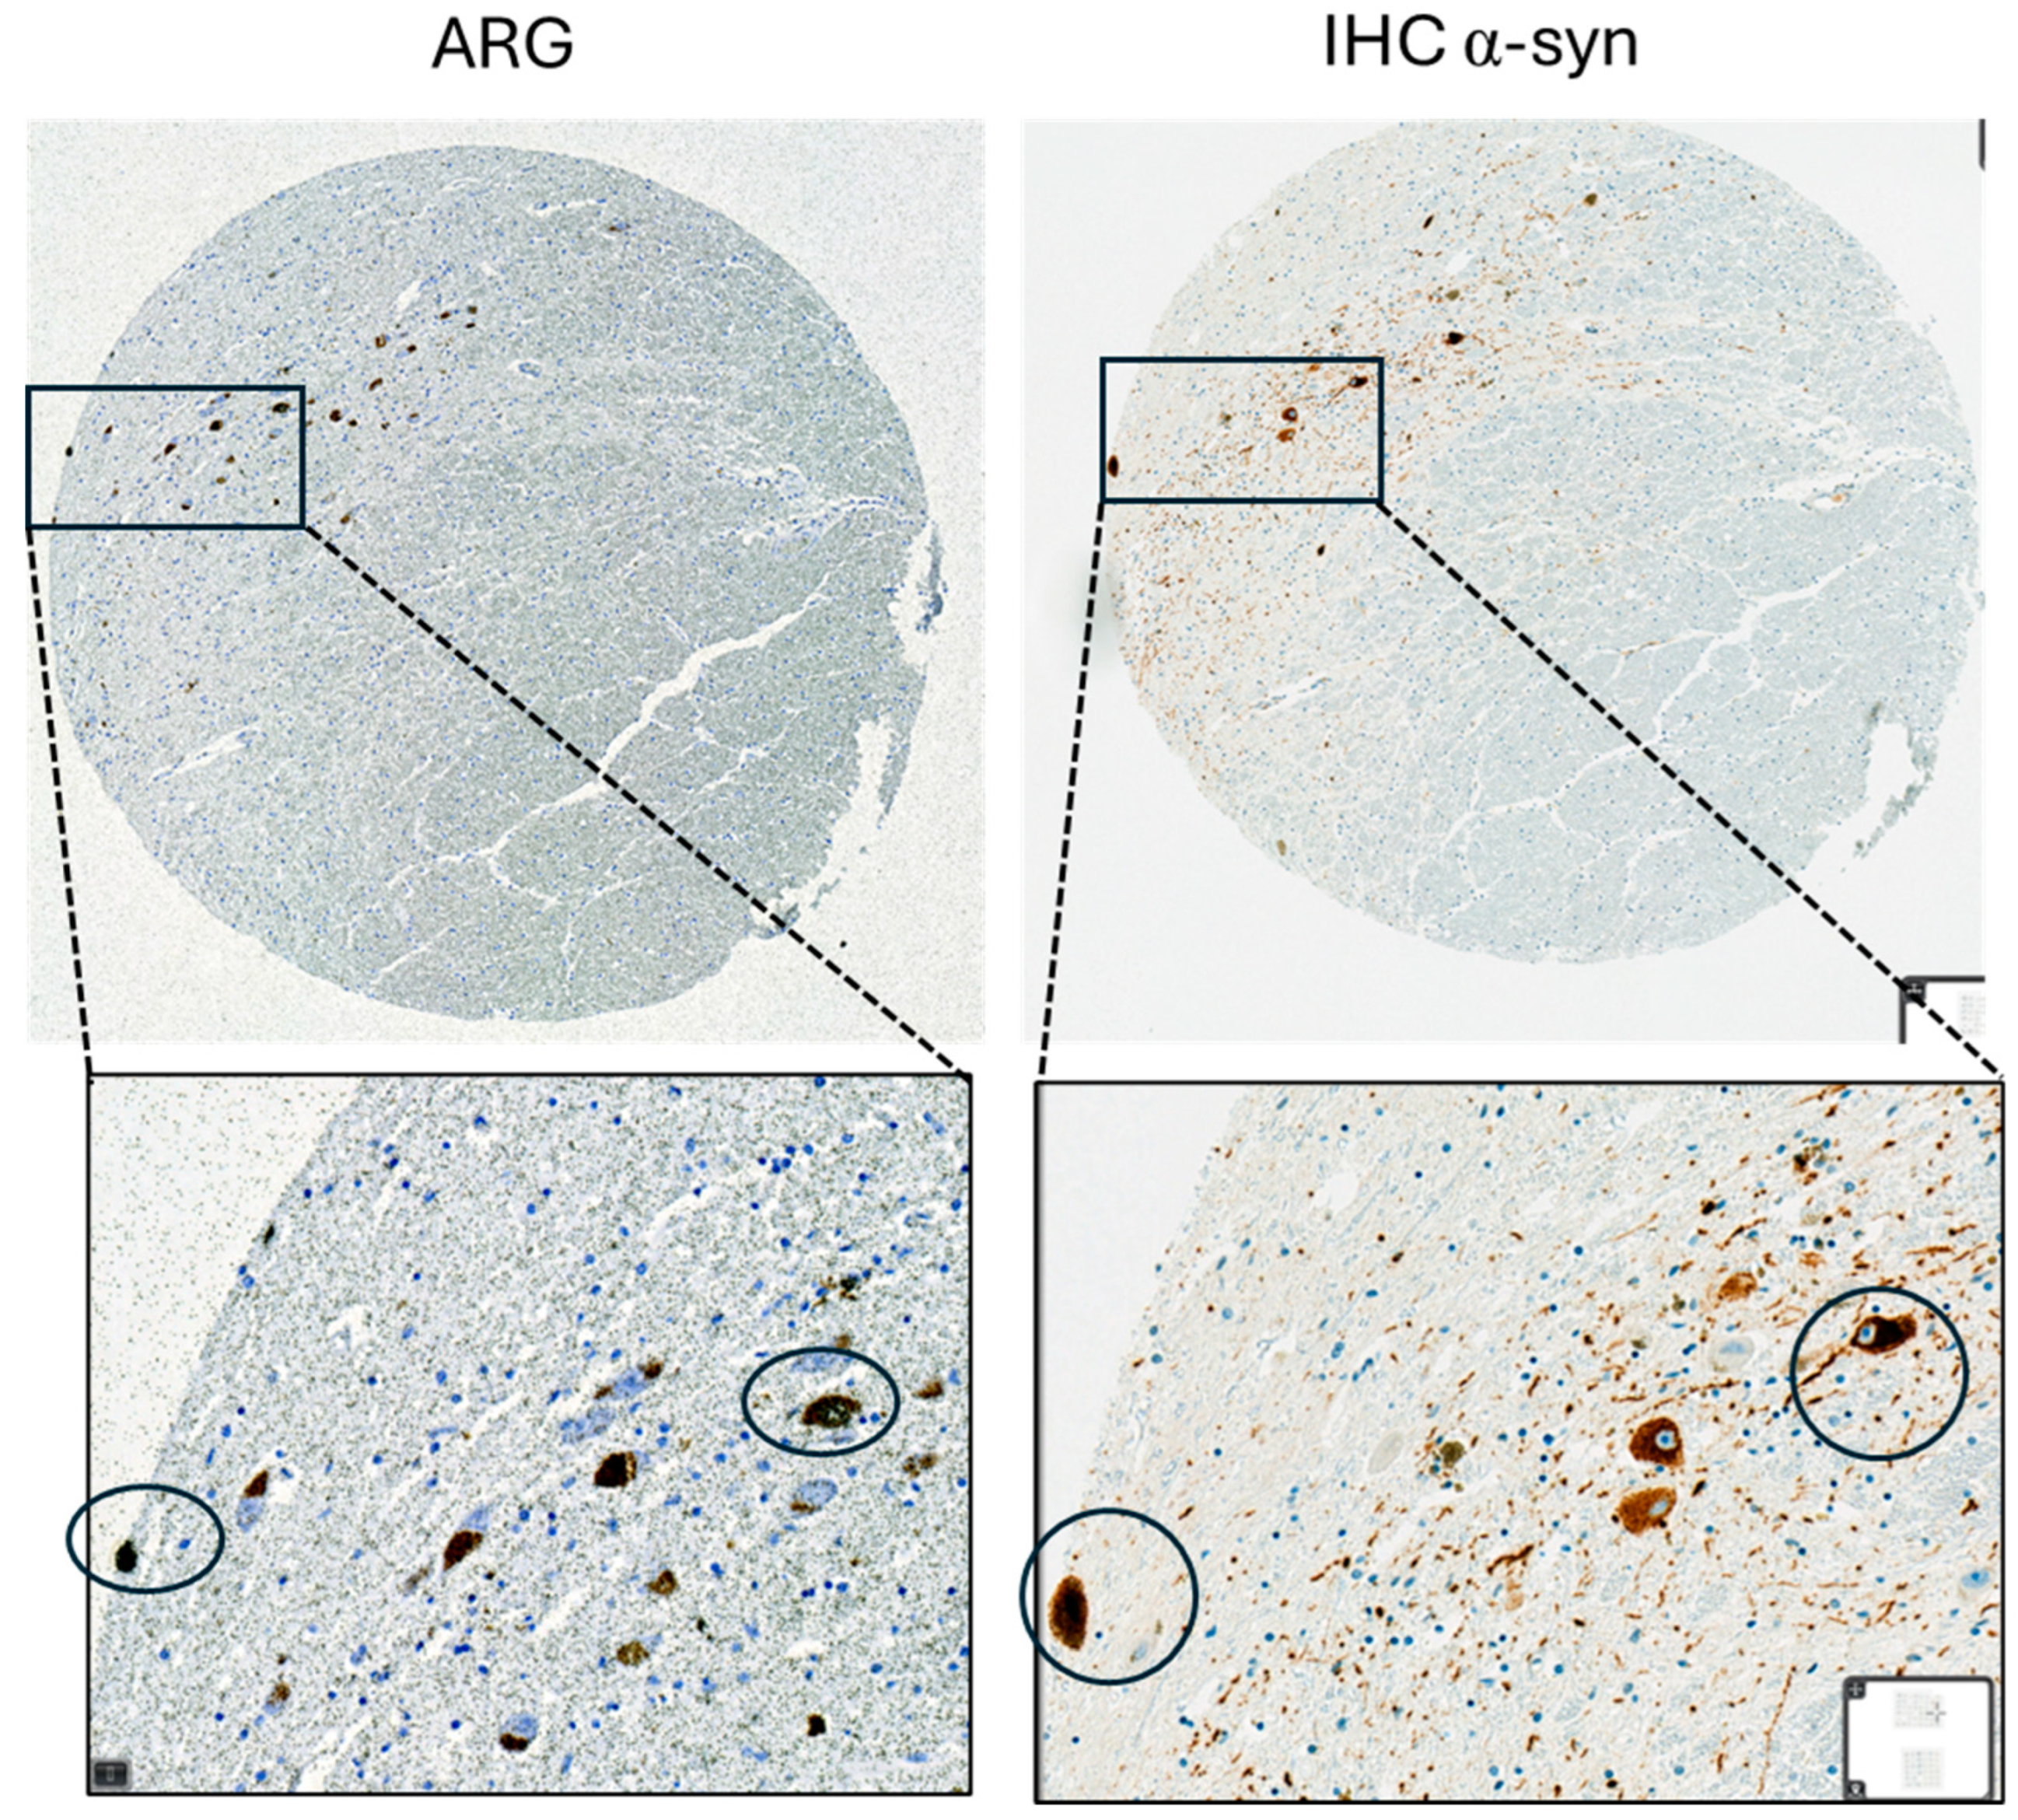
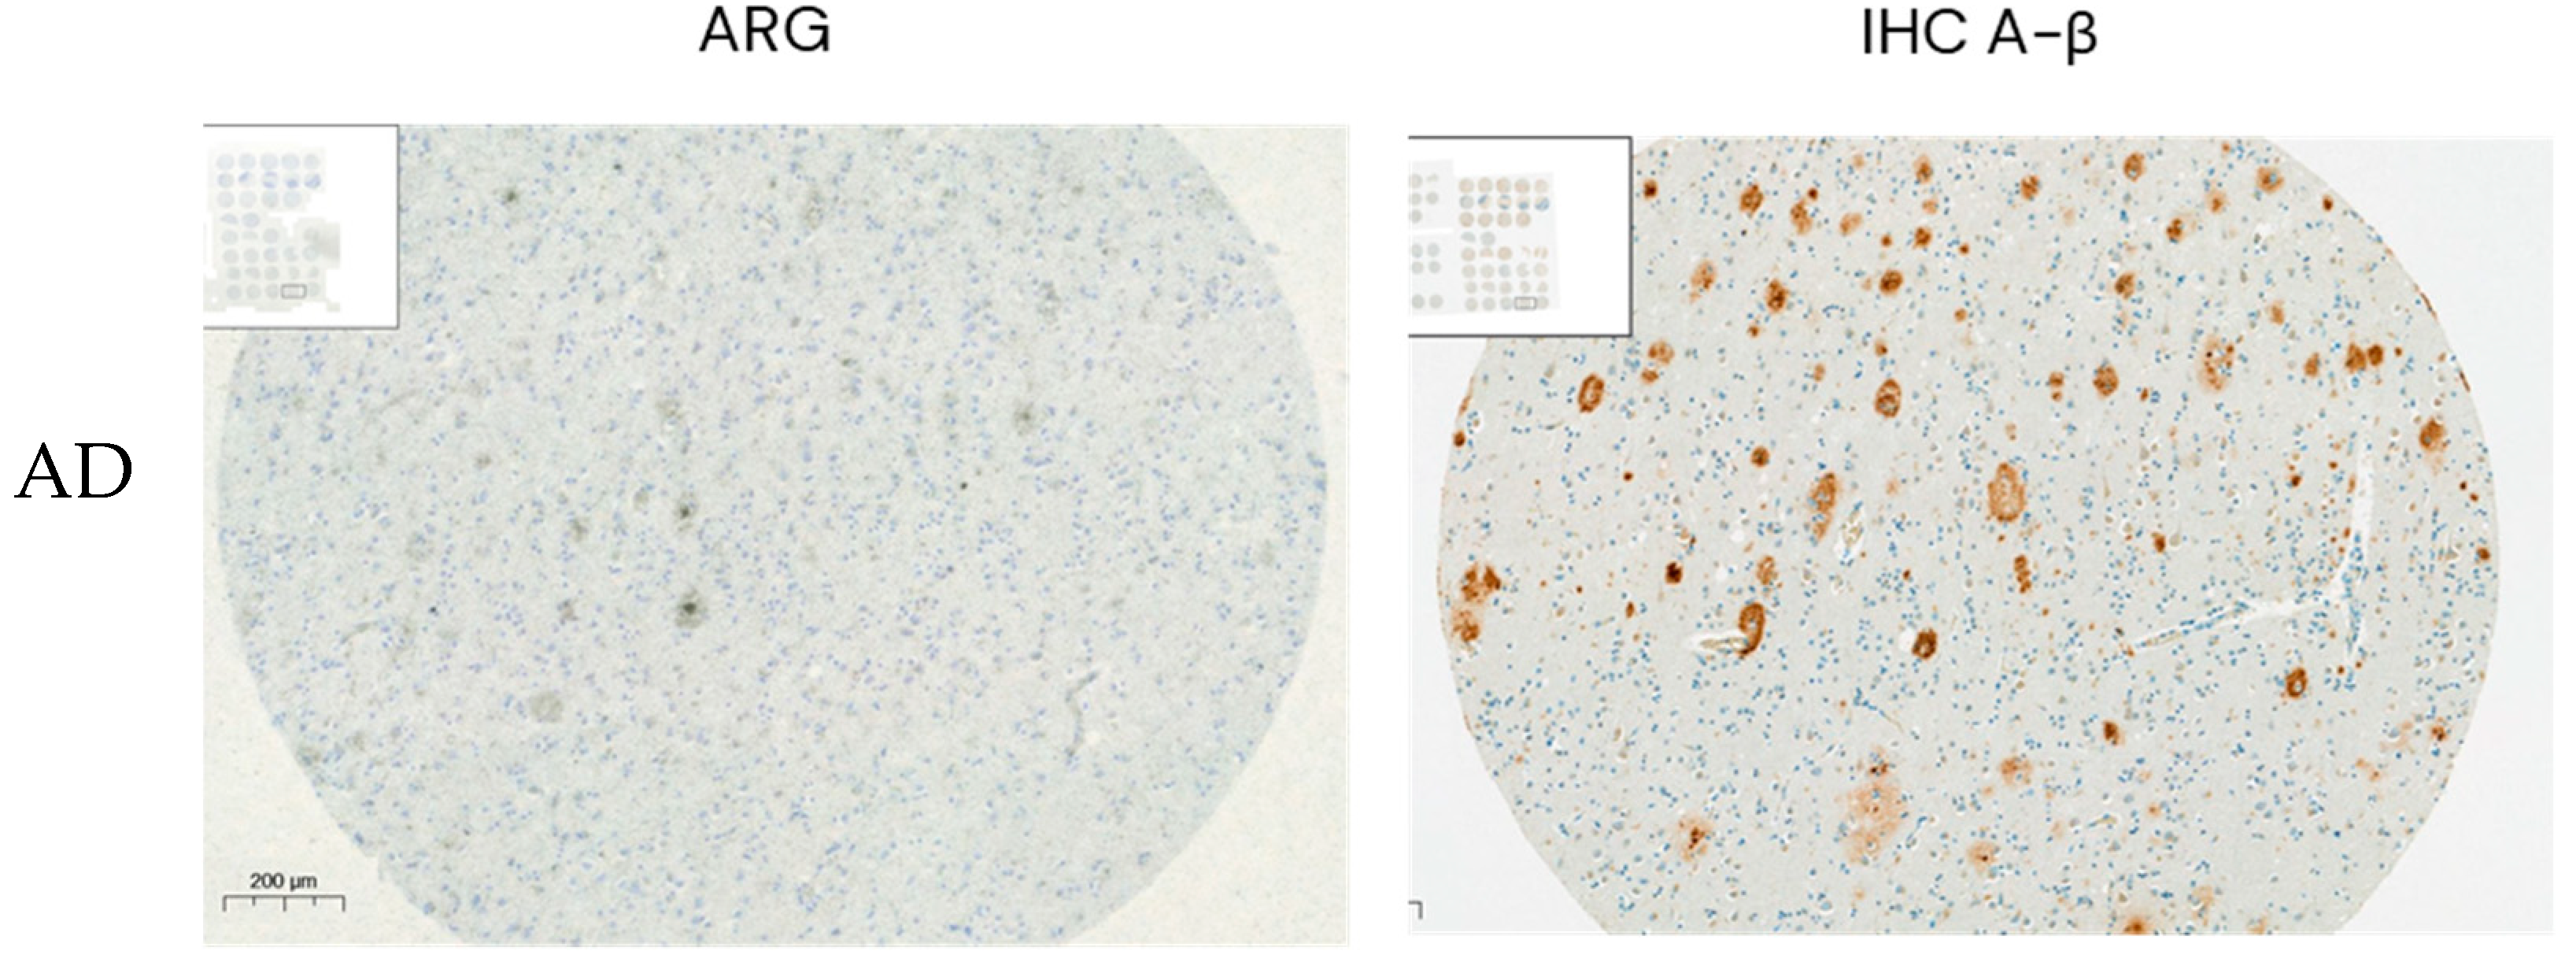
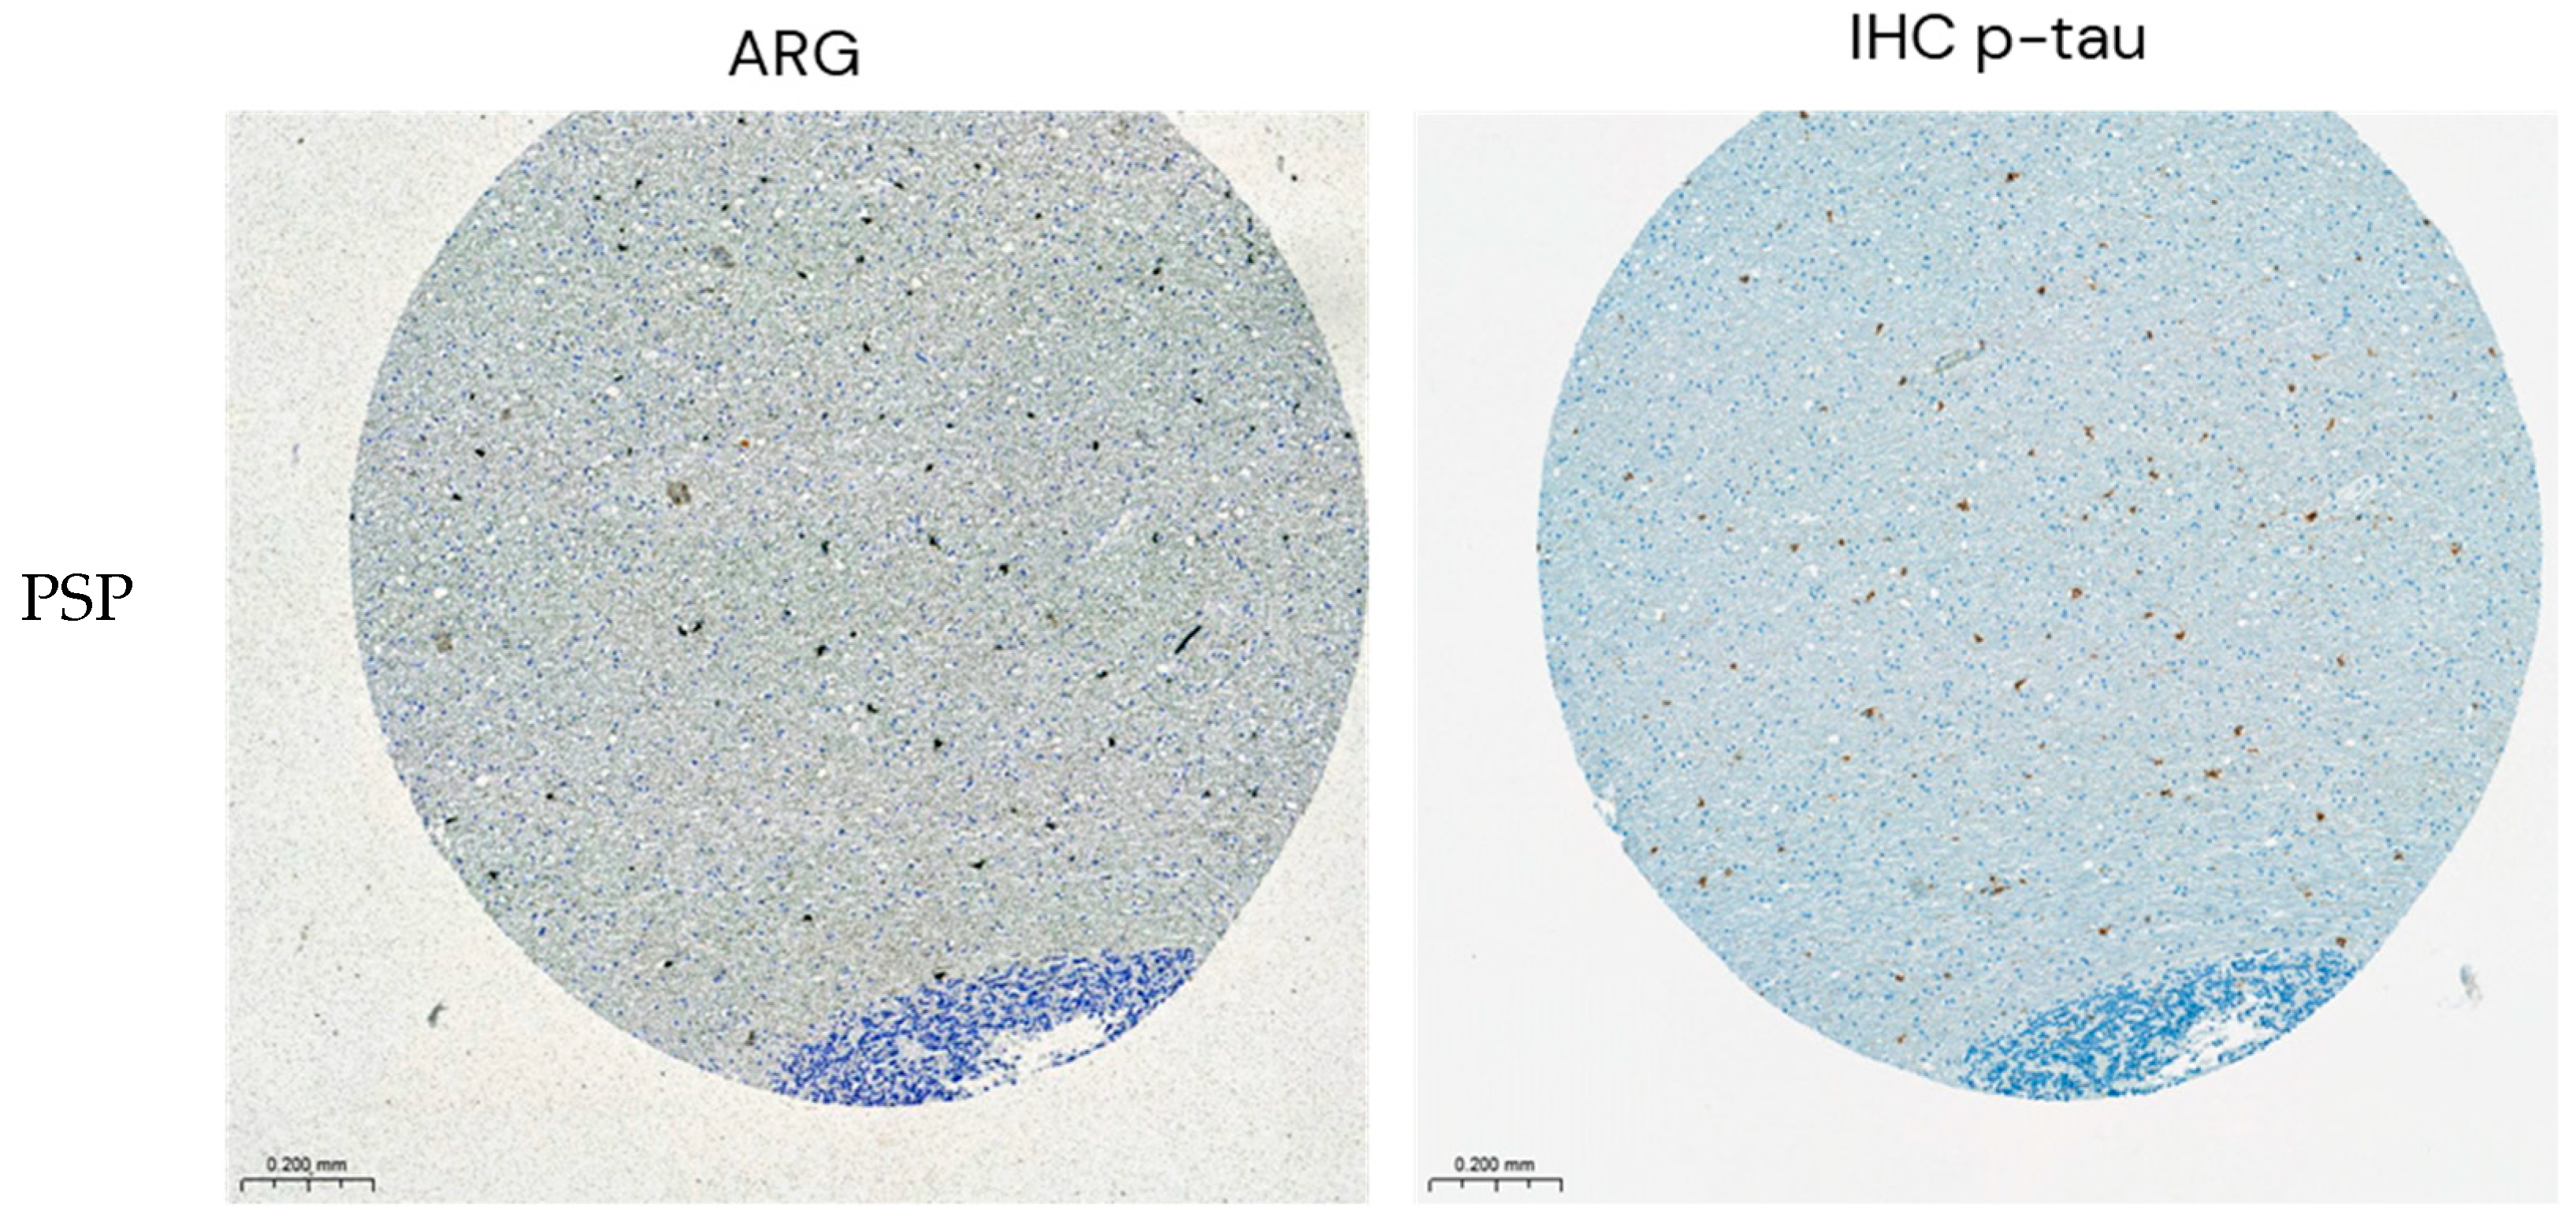
Figure A6.
Representative high magnification images from immunohistochemistry (IHC) and emulsion autoradiography (ARG) with 25 nM [3H]GMC-058 performed on TMA sections from one case with Alzheimer´s disease (AD) and one case with progressive supranuclear palsy (PSP). The ARG signal corresponds to dense A-β plaques in AD and p-tau inclusions in PSP.
References
- McCann H, Stevens CH, Cartwright H, Halliday GM. α-Synucleinopathy phenotypes. Parkinsonism Relat Disord. 2014 Jan;20 Suppl 1:S62-7. [CrossRef] [PubMed]
- Günter U Höglinger, Charles H Adler, Daniela Berg, Christine Klein, Tiago F Outeiro, Werner Poewe, Ronald Postuma, A Jon Stoessl, Anthony E Lang, A biological classification of Parkinson’s disease: the SynNeurGe research diagnostic criteria, The Lancet Neurology, Volume 23, Issue 2, 2024, Pages 191-204. ISSN 1474-4422. [CrossRef]
- Papp MI, Kahn JE, Lantos PL. Glial cytoplasmic inclusions in the CNS of patients with multiple system atrophy (striatonigral degeneration, olivopontocerebellar atrophy and Shy-Drager syndrome). J Neurol Sci. 1989 Dec;94(1-3):79-100. [CrossRef] [PubMed]
- Smith, R., Capotosti, F., Schain, M. et al. The α-synuclein PET tracer [18F] ACI-12589 distinguishes multiple system atrophy from other neurodegenerative diseases. Nat Commun 14, 6750 2023. [CrossRef]
- Matsuoka, K., Ono, M., Takado, Y., Hirata, K., Endo, H., Ohfusa, T., Kojima, T., Yamamoto, T., Onishi, T., Orihara, A., Tagai, K., Takahata, K., Seki, C., Shinotoh, H., Kawamura, K., Shimizu, H., Shimada, H., Kakita, A., Zhang, M.-R., Suhara, T. and Higuchi, M. High-Contrast Imaging of α-Synuclein Pathologies in Living Patients with Multiple System Atrophy. Mov Disord, 2022 37: 2159-2161. [CrossRef]
- Endo H, Ono M, Takado Y, Matsuoka K, Takahashi M, Tagai K, Kataoka Y, Hirata K, Takahata K, Seki C, Kokubo N, Fujinaga M, Mori W, Nagai Y, Mimura K, Kumata K, Kikuchi T, Shimozawa A, Mishra SK, Yamaguchi Y, Shimizu H, Kakita A, Takuwa H, Shinotoh H, Shimada H, Kimura Y, Ichise M, Suhara T, Minamimoto T, Sahara N, Kawamura K, Zhang MR, Hasegawa M, Higuchi M. Imaging α-synuclein pathologies in animal models and patients with Parkinson’s and related diseases. Neuron. 2024 May 27:S0896-6273(24)00332-5. Epub ahead of print. [CrossRef] [PubMed]
- Gruber C. C., Oberdorfer G., Voss C. V., Kremsner J. M., Kappe C. O., and Kroutil W. “An Algorithm for the Deconvolution of Mass Spectroscopic Patterns in Isotope Labeling Studies. Evaluation for the Hydrogen-Deuterium Exchange Reaction in Ketones,” The Journal of Organic Chemistry 2007 72: 5778–5783. [CrossRef]
- Hostetler ED, Walji AM, Zeng Z, Miller P, Bennacef I, Salinas C, Connolly B, Gantert L, Haley H, Holahan M, Purcell M, Riffel K, Lohith T, Coleman P, Soriano A, Ogawa A, Xu S, Zhang X, Joshi E, Della Rocca J, Hesk D, Schenk DJ, Evelhoch JL. Preclinical characterization of 18F-MK-6240, a promising positron emission tomography (PET) tracer for in vivo quantification of human neurofibrillary tangles (NFTs). J Nucl Med. 2016; 57(10):1599-1606. [CrossRef]
- Klunk WE, Wang Y, Huang GF, Debnath ML, Holt DP, Shao L, Hamilton RL, Ikonomovic MD, DeKosky ST, Mathis CA. The binding of 2-(4’-methylaminophenyl)benzothiazole to postmortem brain homogenates is dominated by the amyloid component. J Neurosci. 2003 23(6):2086-92. [CrossRef]
- Zhang W, Arteaga J, Cashion DK, Chen G, Gangadharmath U, Gomez LF, Kasi D, Lam C, Liang Q, Liu C, Mocharla VP, Mu F, Sinha A, Szardenings AK, Wang E, Walsh JC, Xia C, Yu C, Zhao T, Kolb HC. A highly selective and specific PET tracer for imaging of tau pathologies J Alzheimers Dis 2012 31(3):601-12. [CrossRef]
- Bagchi DP, Yu L, Perlmutter JS, Xu J, Mach RH, Tu Z, Kotzbauer PT. Binding of the radioligand SIL23 to α-synuclein fibrils in Parkinson disease brain tissue establishes feasibility and screening approaches for developing a Parkinson disease imaging agent. PLoS One. 2013;8(2):e55031. Epub 2013 Feb 6. [CrossRef] [PubMed] [PubMed Central]
- Stehouwer JS, Huang G, Saturnino Guarino D, Debnath ML, Polu A, Geib SJ, Lopresti B, Ikonomovic MD, Mason N, Mach RH, Mathis CA. Structure-Activity Relationships and Evaluation of 2-(Heteroaryl-cycloalkyl)-1H-indoles as Tauopathy Positron Emission Tomography Radiotracers. J Med Chem. 2025 Mar 27;68(6):6462-6492. Epub 2025 Mar 11. [CrossRef] [PubMed] [PubMed Central]
- Miranda-Azpiazu P, Svedberg M, Higuchi M, Ono M, Jia Z, Sunnemark D, Elmore CS, Schou M, Varrone A. Identification and in vitro characterization of C05-01, a PBB3 derivative with improved affinity for alpha-synuclein. Brain Res. 2020 Dec 15;1749:147131. Epub 2020 Sep 18. [CrossRef] [PubMed]
- Lund, H., Cowburn, R.F., Gustafsson, E., Strömberg, K., Svensson, A., Dahllund, L., Malinowsky, D. and Sunnemark, D. TTBK1 in Alzheimer’s Disease Brain. Brain Pathology, 2013 23: 378-389. [CrossRef]
- Aguero C, Dhaynaut M, Amaral AC, Moon SH, Neelamegam R, Scapellato M, Carazo-Casas C, Kumar S, El Fakhri G, Johnson K, Frosch MP, Normandin MD, Gómez-Isla T. Head-to-head comparison of [18F]-Flortaucipir, [18F]-MK-6240 and [18F]-PI-2620 postmortem binding across the spectrum of neurodegenerative diseases. Acta Neuropathol. 2024 Jan 27;147(1):25. [CrossRef] [PubMed] [PubMed Central]
- Mueller A, Bullich S, Barret O, Madonia J, Berndt M, Papin C, Perrotin A, Koglin N, Kroth H, Pfeifer A, Tamagnan G, Seibyl JP, Marek K, De Santi S, Dinkelborg LM, Stephens AW. Tau PET imaging with 18F-PI-2620 in Patients with Alzheimer Disease and Healthy Controls: A First-in-Humans Study. J Nucl Med. 2020 Jun;61(6):911-919. Epub 2019 Nov 11. [CrossRef] [PubMed] [PubMed Central]
- Tagai K, Ono M, Kubota M, Kitamura S, Takahata K, Seki C, Takado Y, Shinotoh H, Sano Y, Yamamoto Y, Matsuoka K, Takuwa H, Shimojo M, Takahashi M, Kawamura K, Kikuchi T, Okada M, Akiyama H, Suzuki H, Onaya M, Takeda T, Arai K, Arai N, Araki N, Saito Y, Trojanowski JQ, Lee VMY, Mishra SK, Yamaguchi Y, Kimura Y, Ichise M, Tomita Y, Zhang MR, Suhara T, Shigeta M, Sahara N, Higuchi M, Shimada H. High-Contrast In Vivo Imaging of Tau Pathologies in Alzheimer’s and Non-Alzheimer’s Disease Tauopathies. Neuron. 2021 Jan 6;109(1):42-58.e8. Epub 2020 Oct 29. [CrossRef] [PubMed]
- Brendel M, Barthel H, van Eimeren T, Marek K, Beyer L, Song M, Palleis C, Gehmeyr M, Fietzek U, Respondek G, Sauerbeck J, Nitschmann A, Zach C, Hammes J, Barbe MT, Onur O, Jessen F, Saur D, Schroeter ML, Rumpf JJ, Rullmann M, Schildan A, Patt M, Neumaier B, Barret O, Madonia J, Russell DS, Stephens A, Roeber S, Herms J, Bötzel K, Classen J, Bartenstein P, Villemagne V, Levin J, Höglinger GU, Drzezga A, Seibyl J, Sabri O. Assessment of 18F-PI-2620 as a Biomarker in Progressive Supranuclear Palsy. JAMA Neurol. 2020 Nov 1;77(11):1408-1419. https://doi.org/10.1001/jamaneurol.2020.2526. Erratum in: JAMA Neurol. 2020 Nov 1;77(11):1453. Erratum in: JAMA Neurol. 2020 Nov 1;77(11):1453. [CrossRef] [PubMed] [PubMed Central]
- Li L, Liu FT, Li M, et al. Clinical utility of 18F-APN-1607 tau PET imaging in patients with progressive supranuclear palsy. Mov Disord 2021;36(10):2314-2323. [CrossRef]
- Lindberg A, Murrell E, Tong J, Mason NS, Sohn D, Sandell J, Ström P, Stehouwer JS, Lopresti BJ, Viklund J, Svensson S, Mathis CA, Vasdev N. Ligand-based design of [18F]OXD-2314 for PET imaging in non-Alzheimer’s disease tauopathies. Nat Commun. 2024 Jun 14;15(1):5109. [CrossRef] [PubMed] [PubMed Central]
- Kim H., Y. Kim H. Y., Chia W. K., Hsieh C-J, Saturnino Guarino D., Graham T. J. A., Lengyel-Zhand Z., Schneider M., Tomita C., Lougee M. G., Kim H. J., Pagar V. V., Lee H., Hou C., Garcia B. A., E. Petersson J., O’Shea J., Kotzbauer P. T., Mathis C. A., Lee V. M.-Y., Luk K. C., and Mach R. H. A Novel Brain PET Radiotracer for Imaging Alpha Synuclein Fibrils in Multiple System Atrophy. Journal of Medicinal Chemistry 2023 66 (17), 12185-12202. [CrossRef]
- Shriver D.F. and Drezdzon M.A. The Manipulation of Air-Sensitive Compounds 1986. 104. Eds: New York: John Wiley and Sons, Inc. ISBN 978-0-471-86773-9.
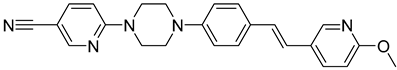
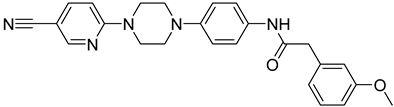
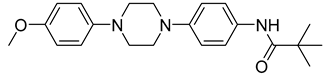
Figure 1.
Chemical structure of [3H]GMC-058.
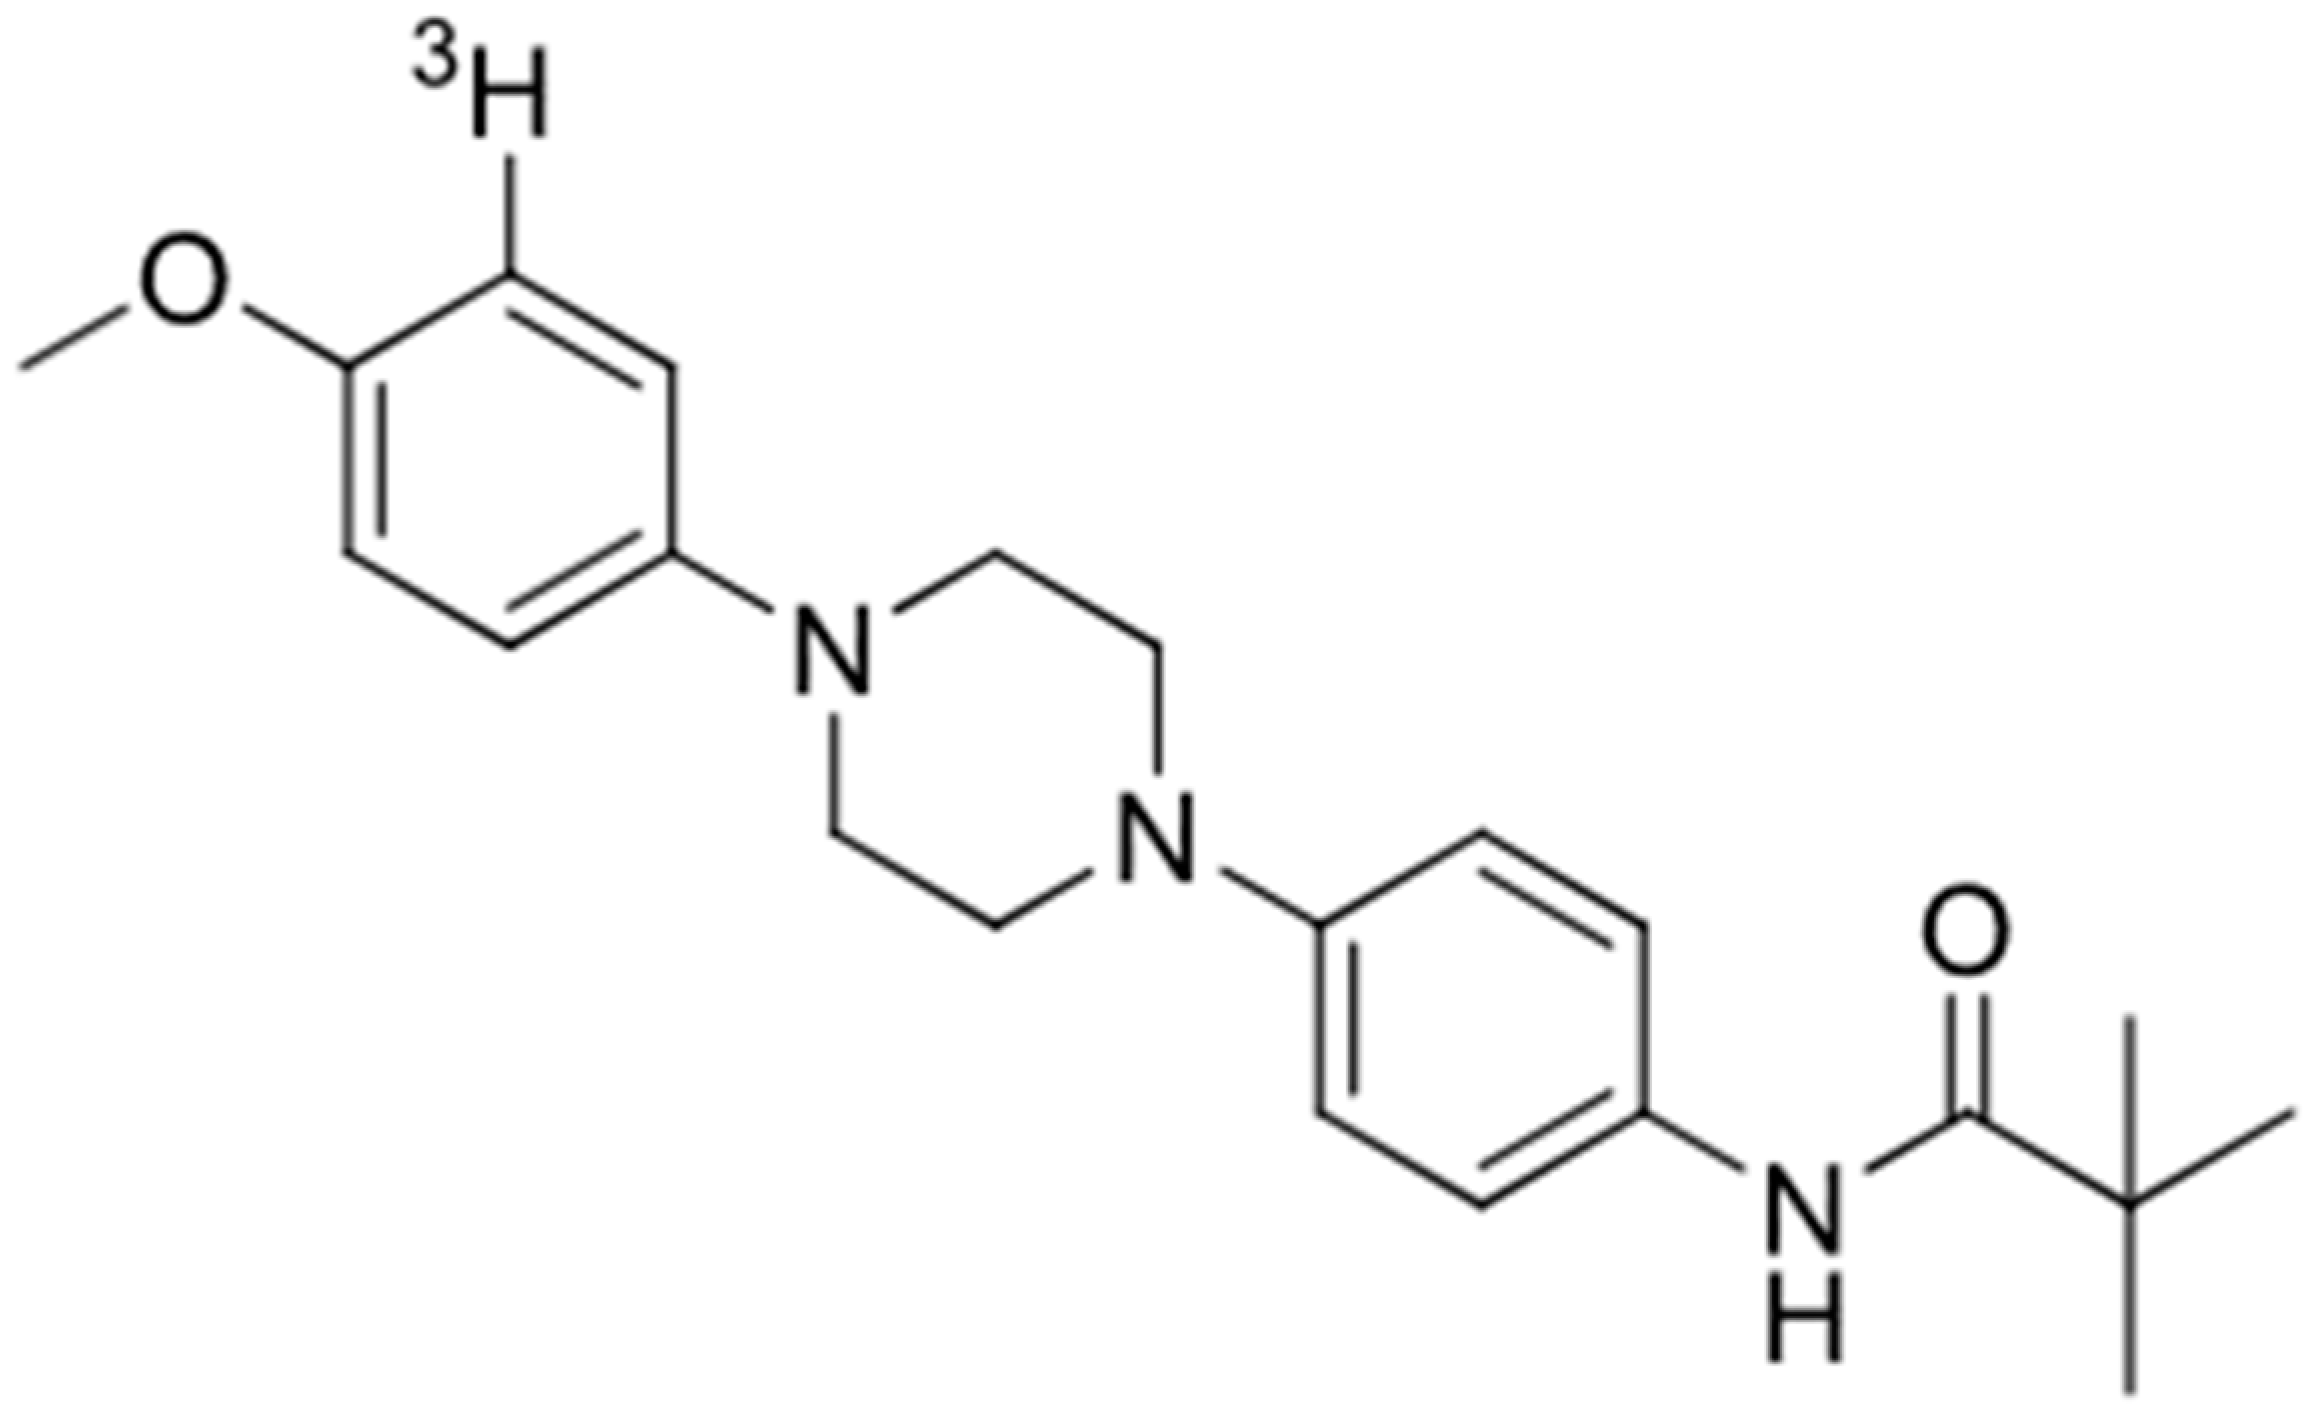
Figure 2.
[3H]GMC-058 saturation binding assays in (a) AD, (b) PSP, (c) CBD, (d) MSA-P, (e) PD and (f) control brain homogenates. [3H]GMC-058 saturation binding assays were carried out in brain tissue homogenates from AD, PSP, CBD, MSA-P, PD and control cases using concentrations of 0.9 to 80 nM. Non-specific binding was determined using 10 μM of unlabelled GMC-058. Scatchard plots indicating Bmax and KD values. Error bars represent the mean ± SD for two experiments in triplicates. Bmax = maximum number of binding sites; KD =dissociation constant.
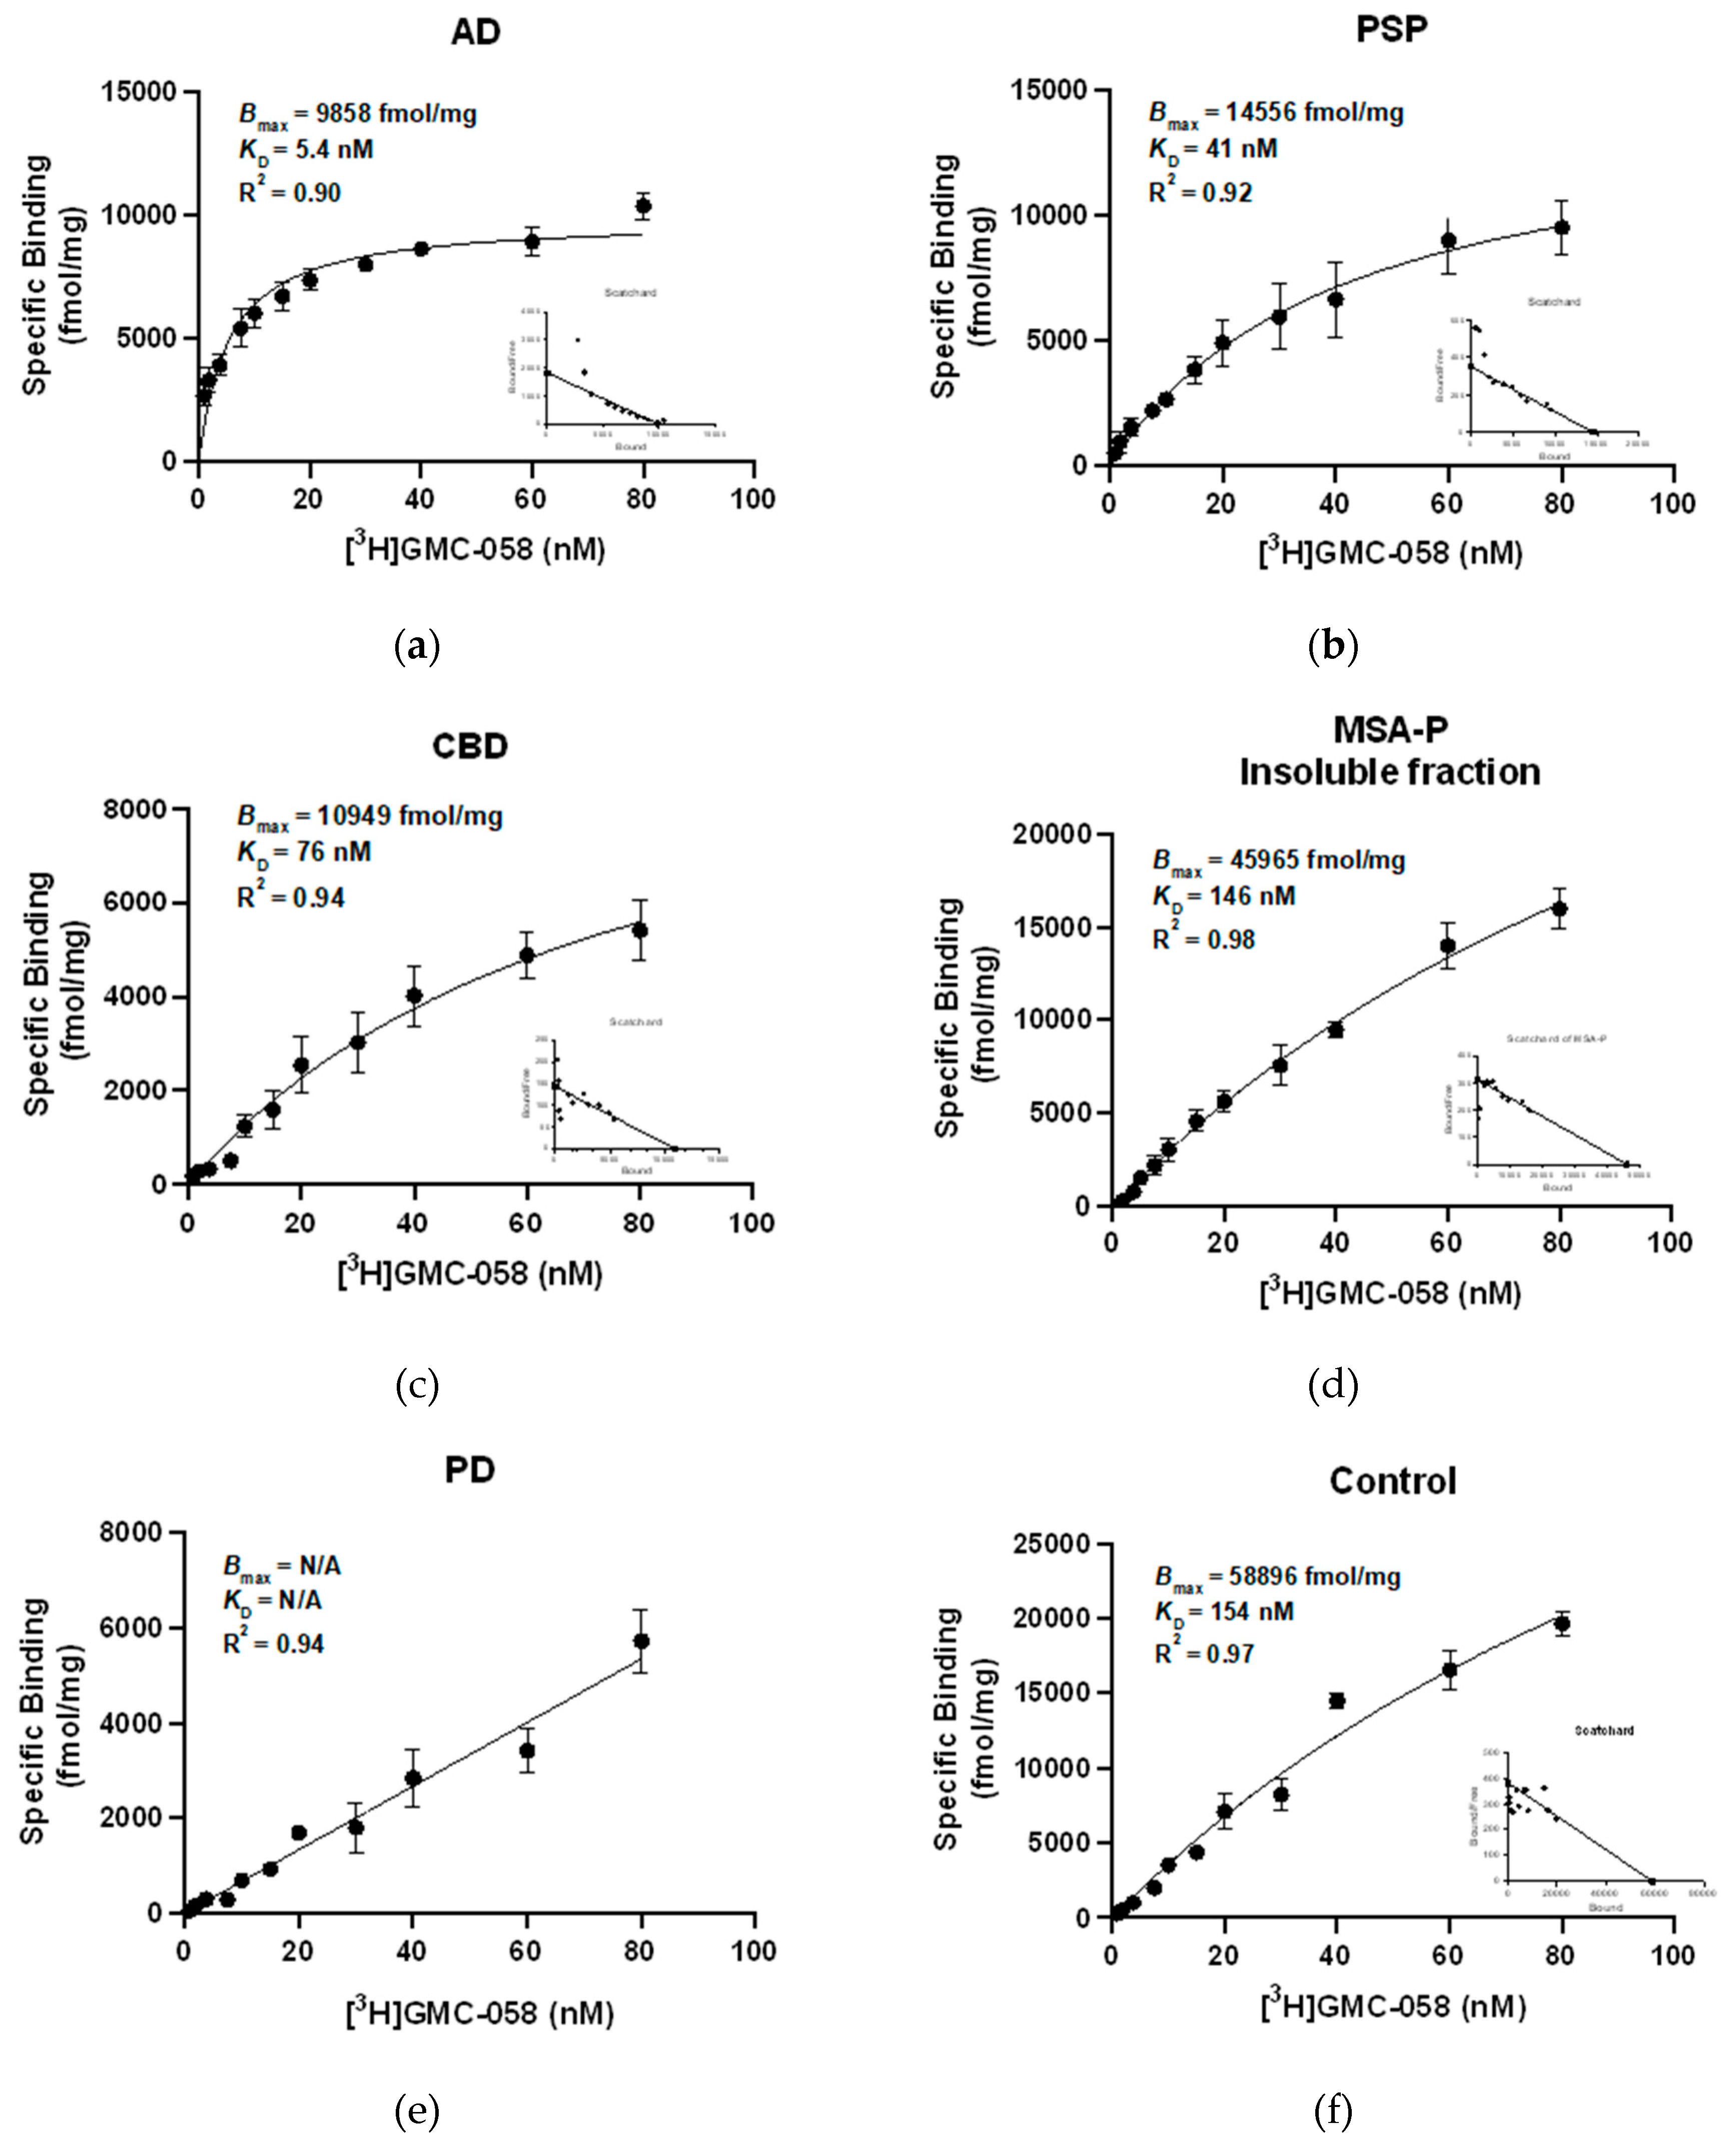
Figure 3.
Representative images from autoradiography with [3H]GMC-058 (25 nM) on fresh-frozen tissue sections from patients with multiple system atrophy (MSA), Parkinson´s disease (PD), Lewy-body disease (LB) and controls. Non-specific binding was measured with excess (5 µM) of blocker (GMC-044). Line scale: 10 mm.
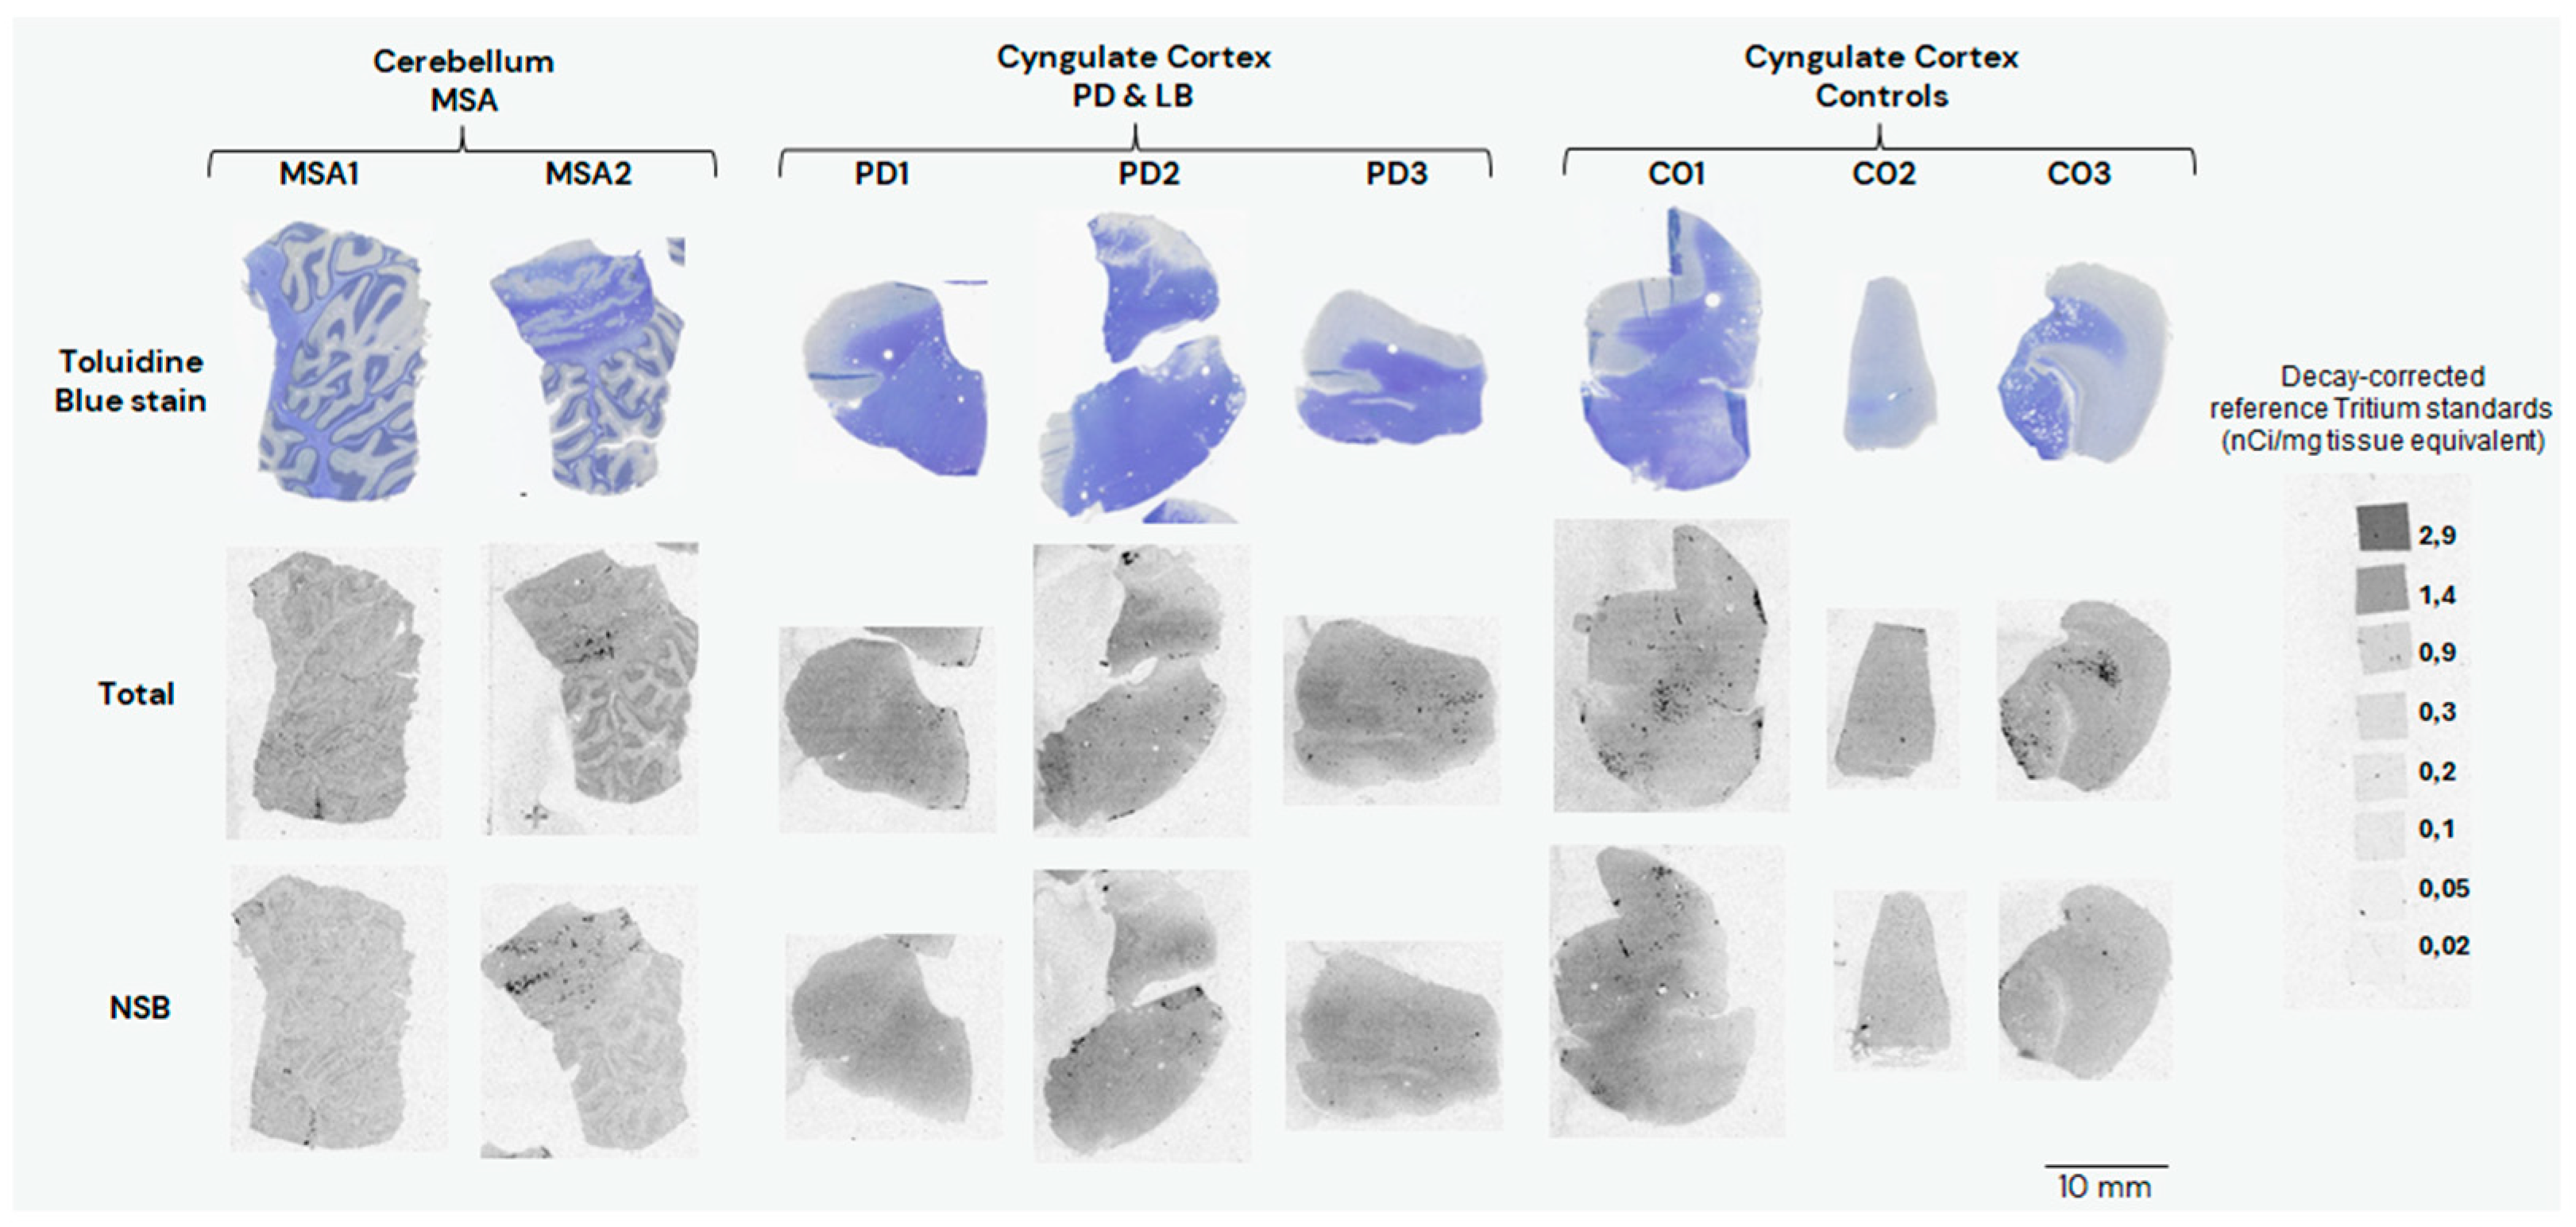
Figure 4.
Representative high magnification images from α-synuclein (α-syn), amyloid beta (Aβ) and phospho-tau (p-tau) immunohistochemistry (IHC) and emulsion autoradiography (ARG) with 25 nM [3H]GMC-058. (a, b, c, d) In two representative LBD (a, b) and MSA cases (c, d), the ARG signal (yellow arrows) corresponds to Lewy bodies (a) and oligodendrocytic inclusions (c). (e, f) In CAA cases, ARG signal corresponds to dense perivascular Aβ deposits (e). (g, h, i, j) In PSP (g, h) and CBD (j, k), ARG signal seems to localize in areas of p-tau positive inclusions (g, i). (k, l) In AD the case with abundant Aβ plaques and p-tau inclusions (k), a weak ARG signal was observed (l).
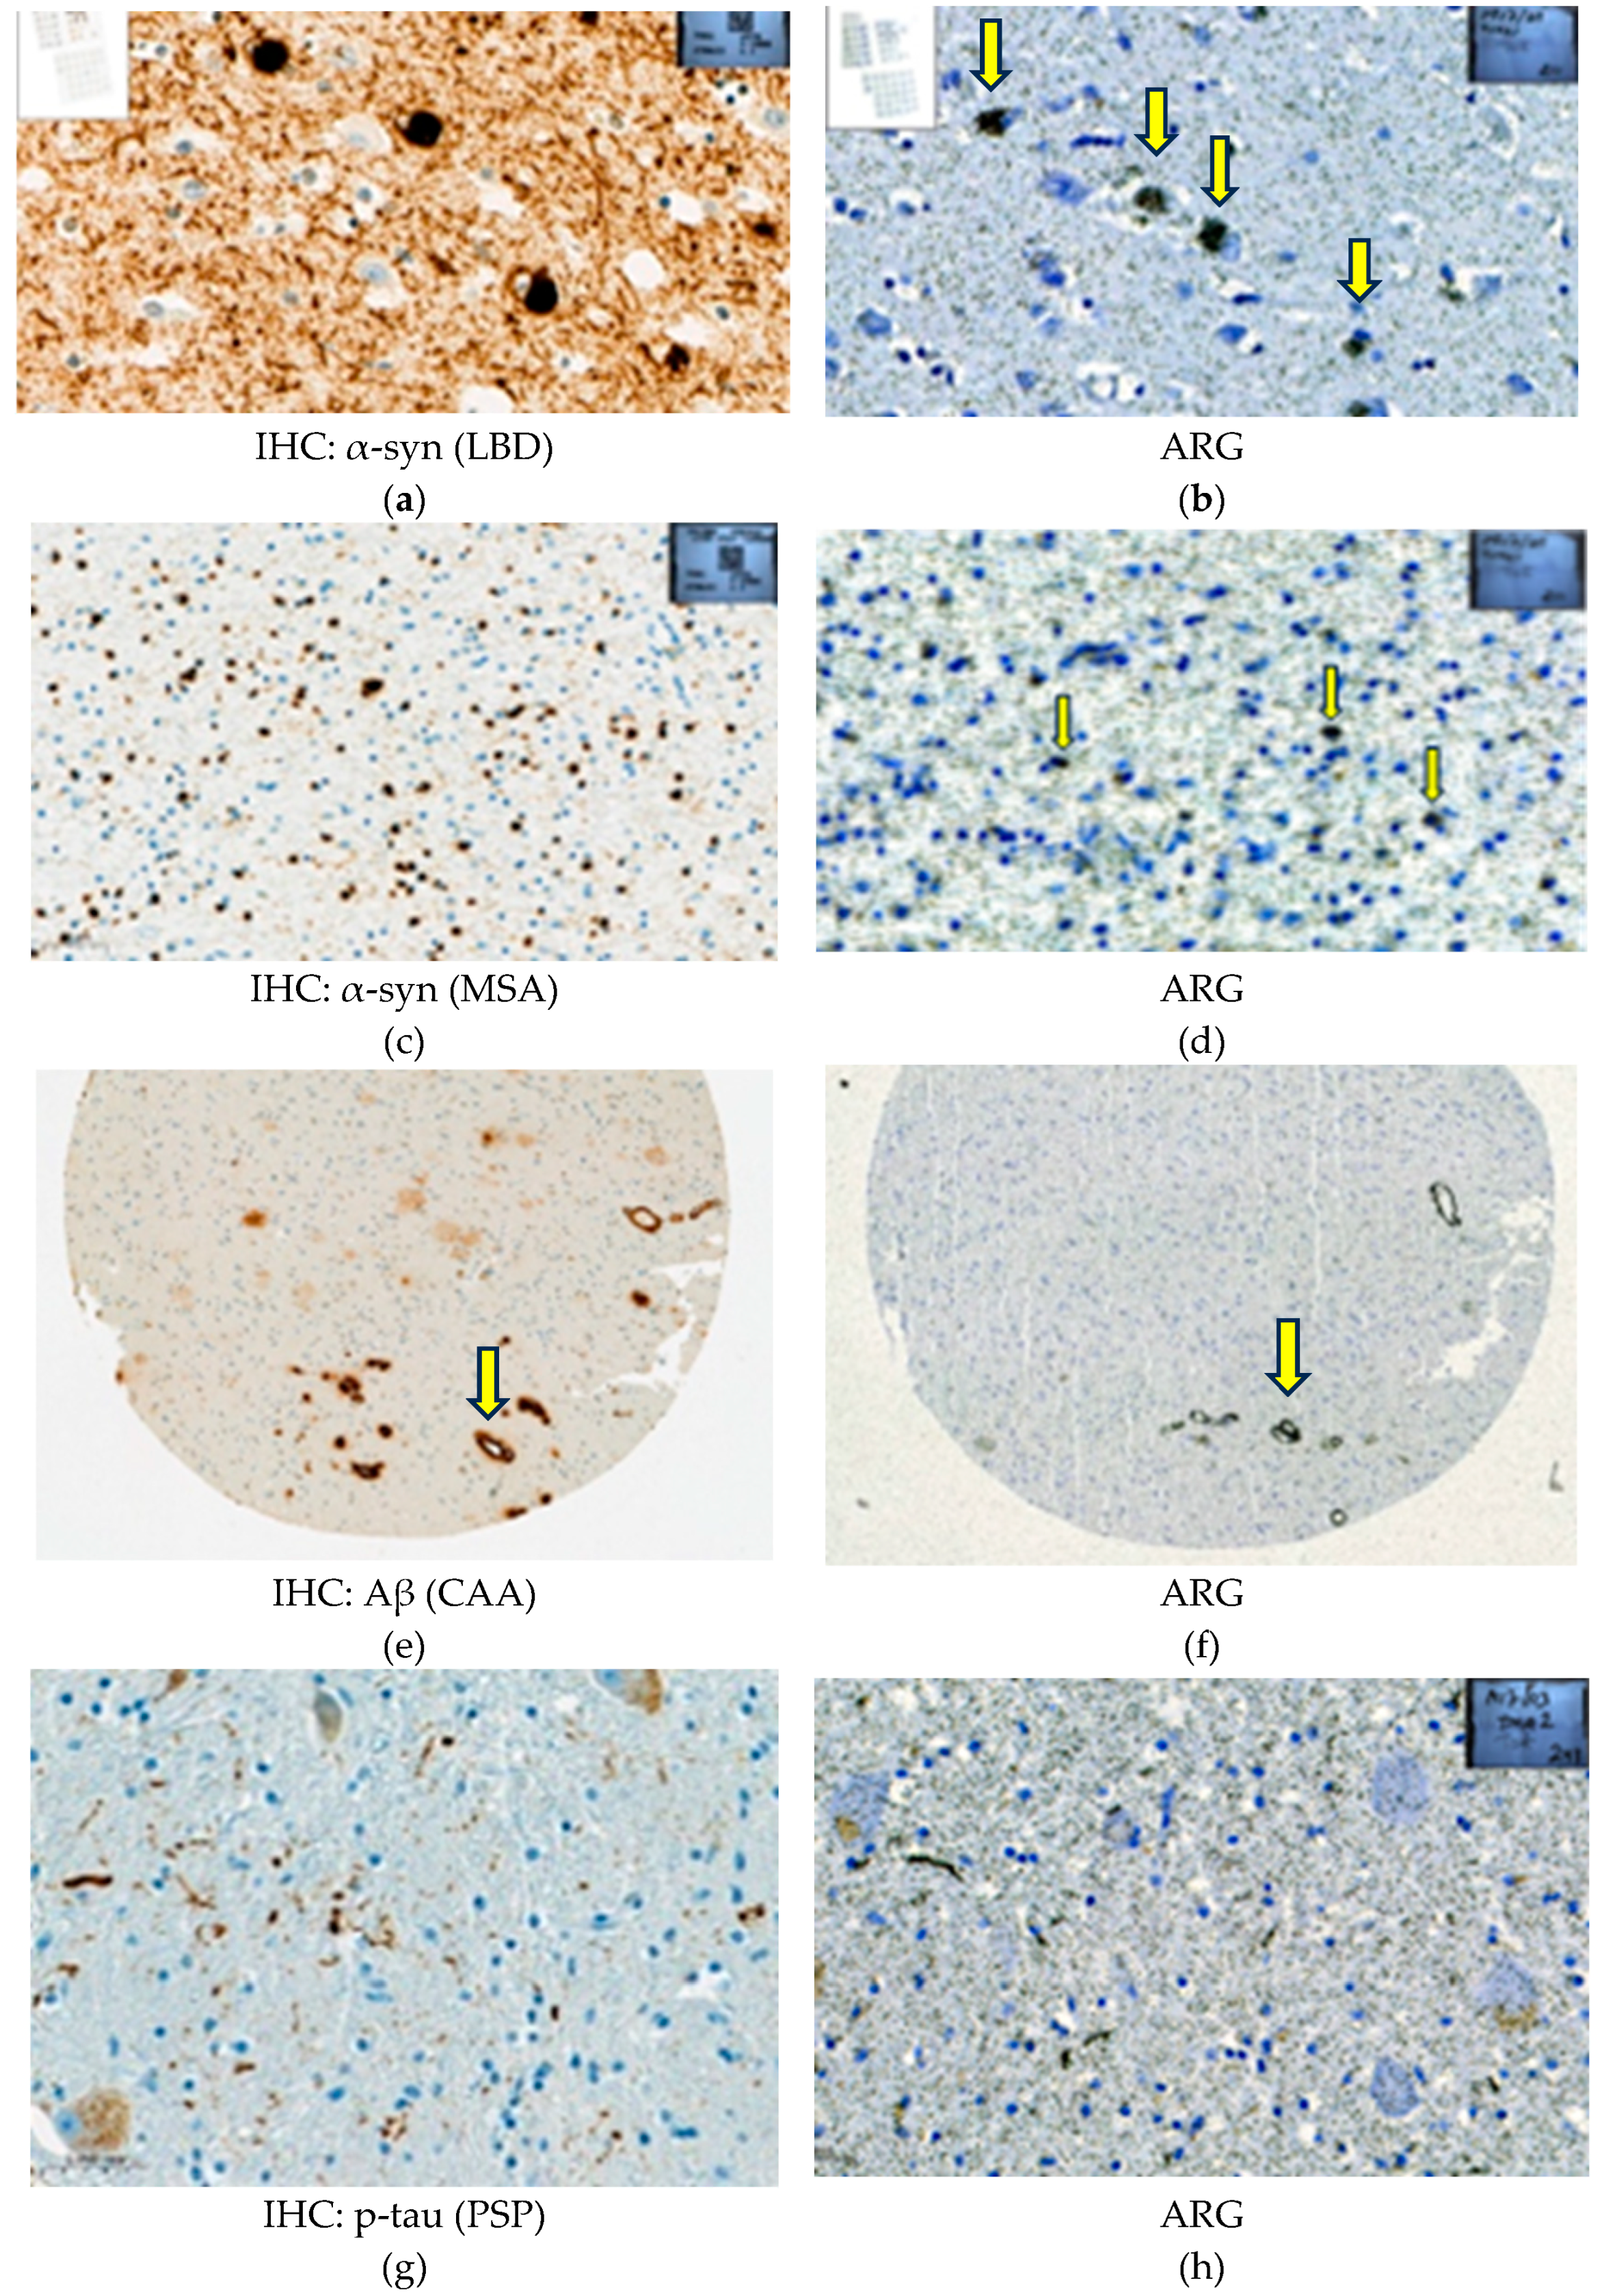
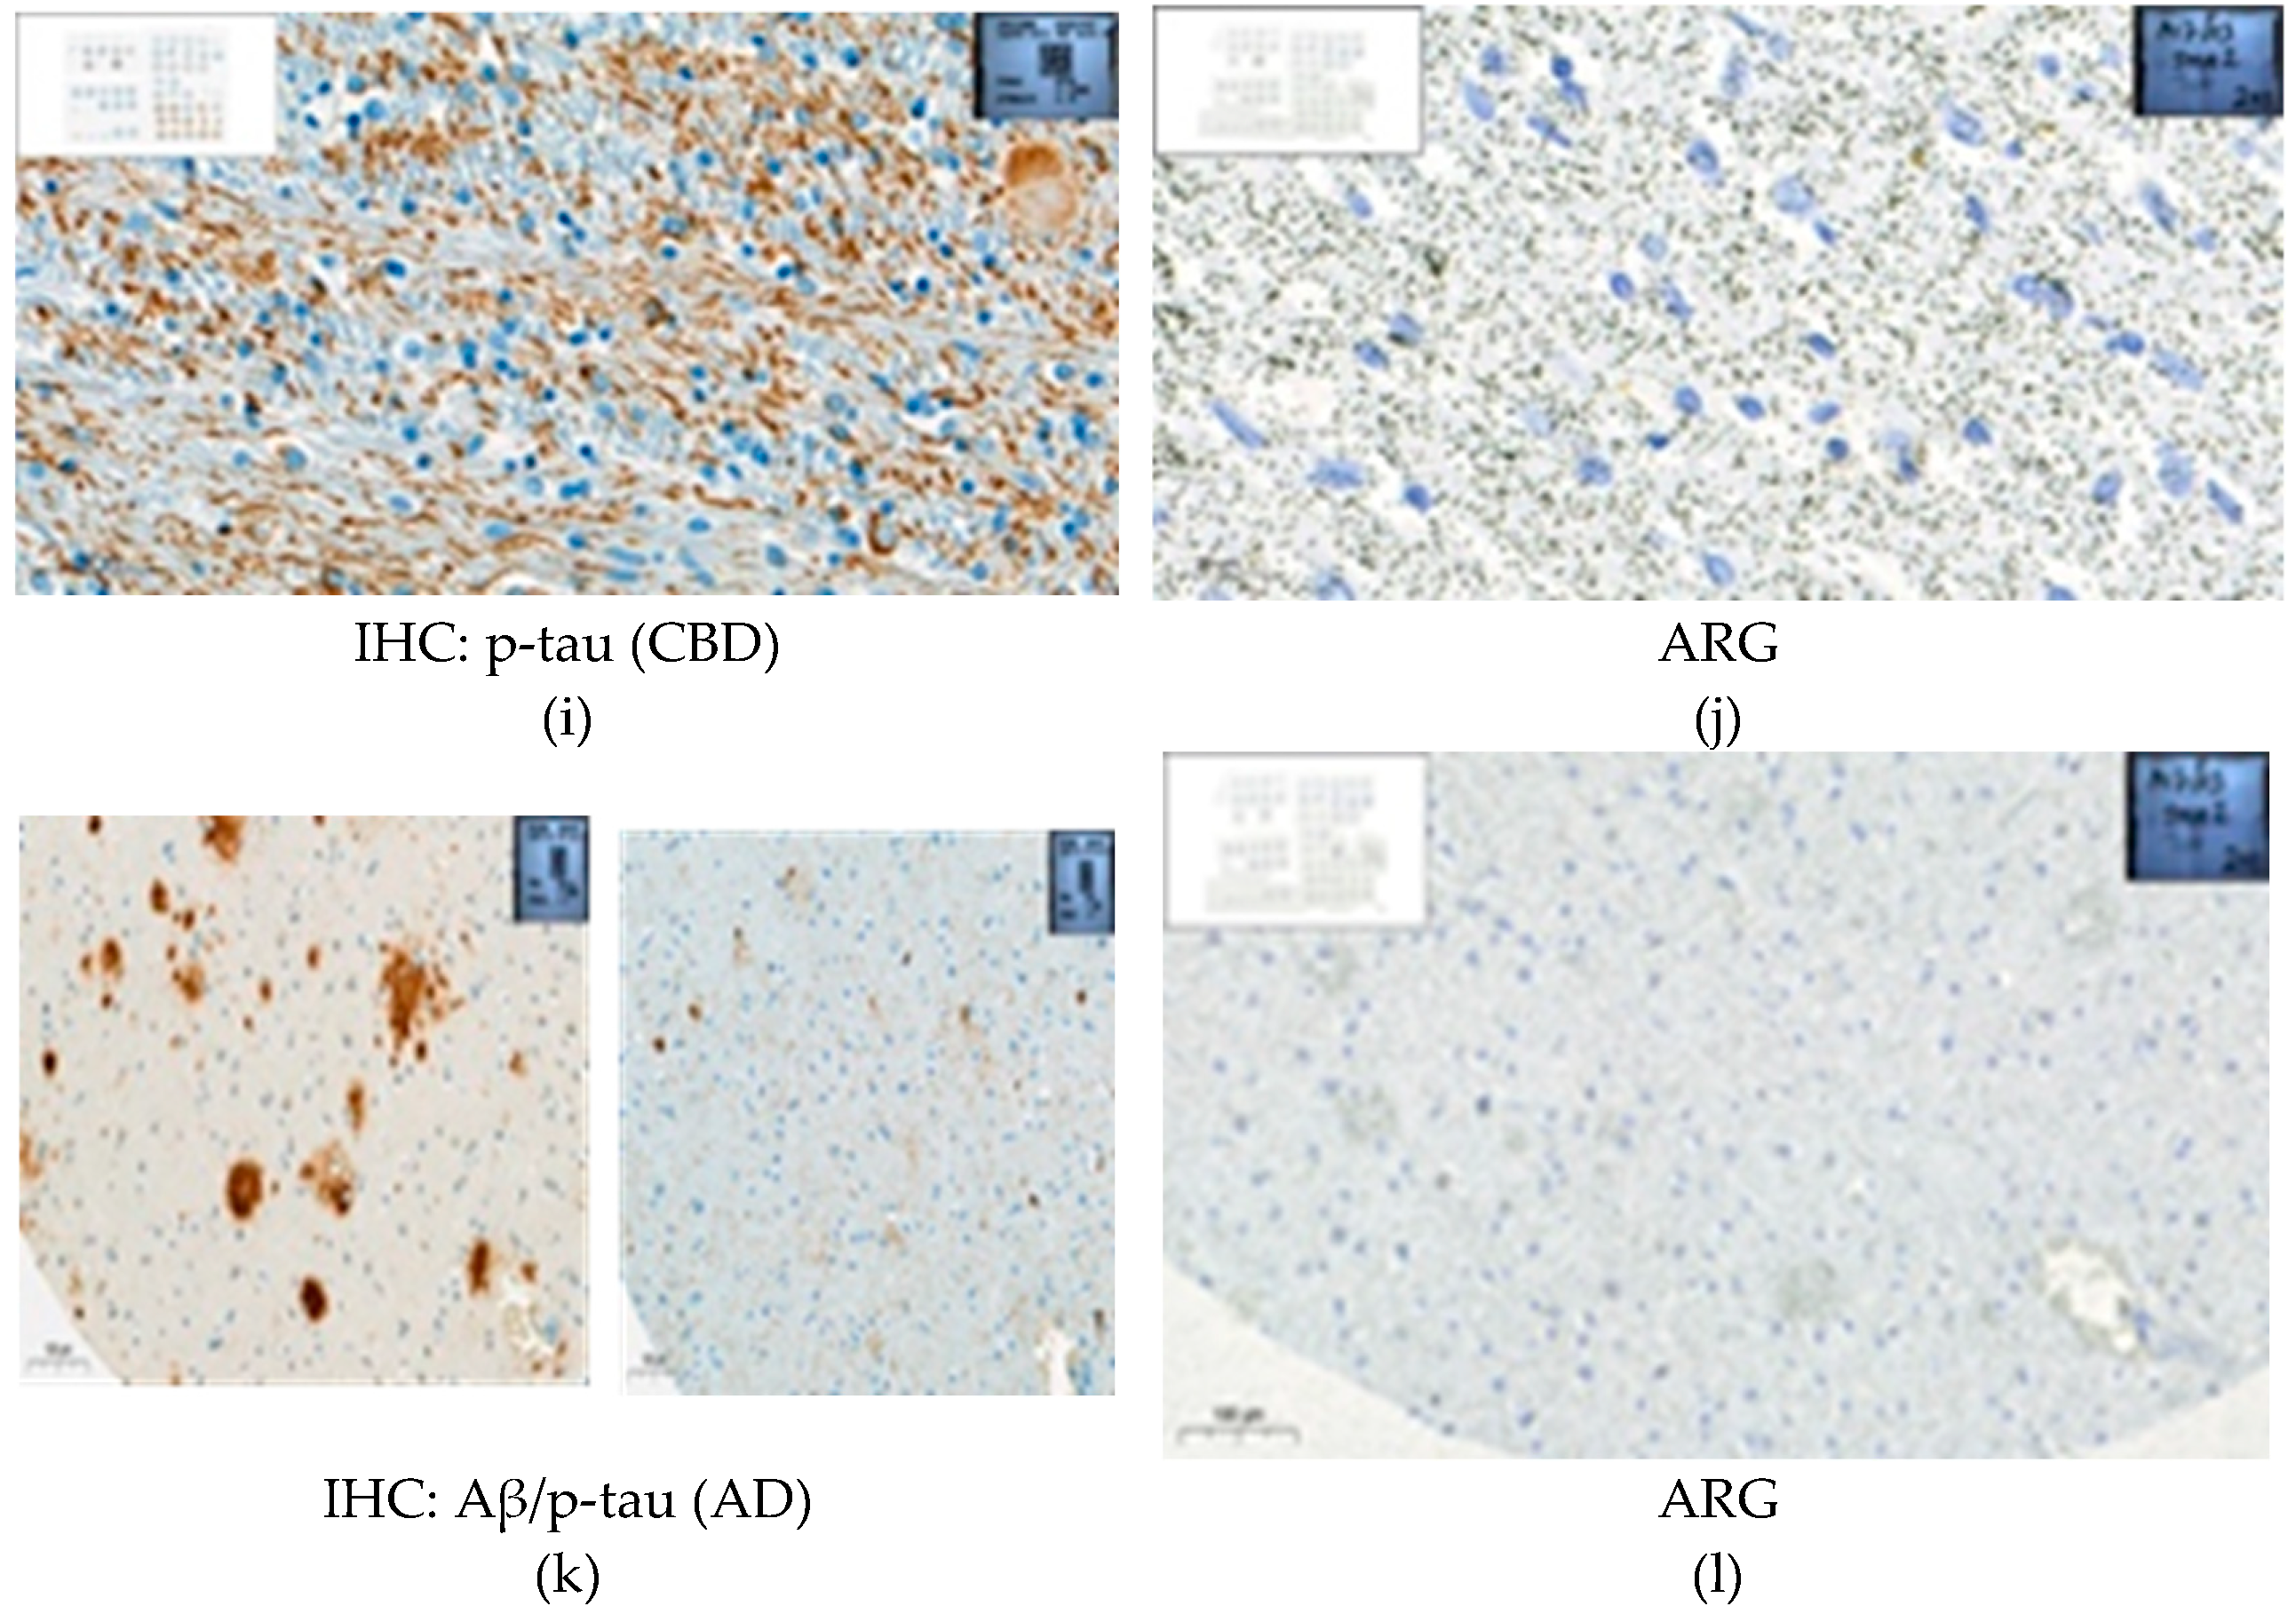
Figure 5.
Representative images from autoradiography with [3H]GMC-058 (25 nM) and corresponding immunohistochemistry (IHC) heatmap showing the density of α-synuclein (α-syn) or phospho-tau (p-tau) immunoreactivity on fresh-frozen tissue sections from patients with (a) multiple system atrophy (MSA); (b) cortical-basal degeneration (CBD); (c) progressive supranuclear palsy (PSP); and (d) non-demented controls. Non-specific binding was measured with excess (5 µM) of cold blocker (GMC-044). (e) Specific binding (fmol/mg) quantified from grey and white matter regions of interest in all cases. Bars represent the average ±s.e.m. of two technical replicates quantified from each case. Line scale: 10 mm. C04 was negative for pTau, α-Syn and Aβ, therefore a Toluidine blue stain is shown in (D).

Table 1.
Main in vitro and in vivo characteristics of α-syn PET radioligands evaluated in patients with synucleinopathies.
Table 1.
Main in vitro and in vivo characteristics of α-syn PET radioligands evaluated in patients with synucleinopathies.
| Radioligand | IC50 or KD | Synucleinopathies Evaluated** |
||
|---|---|---|---|---|
| α-syn | Aβ | pTau | ||
| [18F]ACI-12589 | 33.5 ± 17.4 nM (sporadic PD); 28 nM (MSA) | 317 nM (AD) | PD***, MSA (+), DLB | |
| [18F]SPAL-T-06 | 2.5 nM (MSA) | Not reported | MSA (+) | |
| [18F]C05-05 | IC50*: 1.5 nM (DLB); | IC50* in AD tissue: 12.9 nM | PD/DLB (+) and MSA (+) | |
*=only 50% of the total binding was displaced in homologous competition experiments. **= (+) indicates the cases in which specific binding higher than controls was measured. ***=two participants with duplications of the SNCA gene were included in the study.
Disclaimer/Publisher’s Note: The statements, opinions and data contained in all publications are solely those of the individual author(s) and contributor(s) and not of MDPI and/or the editor(s). MDPI and/or the editor(s) disclaim responsibility for any injury to people or property resulting from any ideas, methods, instructions or products referred to in the content. |
© 2025 by the authors. Licensee MDPI, Basel, Switzerland. This article is an open access article distributed under the terms and conditions of the Creative Commons Attribution (CC BY) license (http://creativecommons.org/licenses/by/4.0/).
Copyright: This open access article is published under a Creative Commons CC BY 4.0 license, which permit the free download, distribution, and reuse, provided that the author and preprint are cited in any reuse.


