Submitted:
05 April 2025
Posted:
08 April 2025
You are already at the latest version
Abstract
Ensuring accurate violation detection in power sys- amount for operational reliability. This paper intro- tems is par duces the Enhanced Voltage recovery Violation Index (EVRVI), a comprehensive index designed to quantify Fault-Induced Delayed Voltage Recovery (FIDVR). EVRVI enhances traditional entropy- based methods by leveraging Empirical Mode Decomposition (EMD) to extract key features from the voltage signal, which are then used to quantify over-voltage (OV) and under-voltage (UV) events. Our simulations on the Nordic system, involving over 245,000 scenarios, demonstrate EVRVI’s superior ability to identify and categorize voltage recovery issues compared to the traditional entropy based measure. EVRVI not only significantly reduces false negatives in violation detection but also provides a reliable framework for over-voltage detection, making it an invaluable tool for modern power system studies.
Keywords:
Terms—Voltage Recovery Violation Index
; Over-Voltage/ Under-Voltage Detection
; Delayed Voltage Recovery
; Voltage Performance
I. Introduction
Fault-Induced Delayed Voltage Recovery (FIDVR) events present significant challenges to power system reliability. The entropy-based method using Kullback-Leibler (KL) divergence [1] is commonly used to quantify FIDVR by comparing deviations of post-fault voltage signals from a reference. While effective for basic measurements, this method faces challenges in handling scenarios with oscillations or over- voltages, complicating accurate FIDVR quantification. These limitations highlight the need to refine the KL divergence approach to better capture both pure FIDVR events and those influenced by oscillatory or over-voltage conditions.
EMD emerges as a powerful tool in this context, known for its effectiveness in decomposing non-linear and non-stationary signals into intrinsic mode functions. Applying EMD enables a more detailed analysis of the signal’s characteristics, allowing the KL-divergence of each monotonic envelope to be calcu- lated for precise quantification of its recovery. This approach provides an accurate index for FIDVR quantification.
A. Literature Review and Research Gap
The research on Delayed voltage recovery has led to various indices that quantify system performance during transient events. In [2], the transient voltage dip acceptability (TVDA) index was introduced to assess the severity of voltage dips and their duration. This approach enables the system operator to minimize critical load shedding and maintain transient stability. In [3], the transient voltage severity index (TVSI) was introduced, which globally evaluates system performance by averaging local transient voltage deviation indices (TVDIs) at each bus. While this method provides a comprehensive system- level ovEVRVIew, it may overlook regional variations in bus behavior under severe disturbances.
Numerous studies have refined these indices to improve the accuracy of Delayed Voltage Recovery (DVR) assessments. Generally, methods for quantifying Fault-Induced Delayed Voltage Recovery (FIDVR) in the literature fall into two categories [1]:
- Slope-based methods: These metrics, which rely on the slope or derivative of voltage progression, are less suit- able when voltage exhibits oscillations or abrupt (discon- tinuous) changes.
- Integral error-based methods: While these techniques measure the deviation over time, they fail to differentiate between two scenarios: (i) a waveform with a smaller ini- tial voltage drop but slower recovery, and (ii) a waveform with a larger initial drop that recovers quickly within a short time frame.
To deal with the aforementioned limitations, [4] introduced a contingency severity index (CSI) that accounts for both the magnitude and timing of voltage limit violations. However, it only considers the most critical points of failure rather than the entire transient period. Reference [1] proposed entropy- based index usingKL divergence, which takes a probabilistic approach to characterizing voltage recovery by comparing observed waveforms to reference performance metrics. This index improves upon earlier approaches by providing a more detailed understanding of voltage recovery patterns during disturbances.
However, this method faces challenges in addressing de- layed recovery accompanied by oscillations—a limitation that the Voltage Recovery Index (VRI), introduced in [5], seeks to overcome. VRI incorporates weighting functions that reward or penalize voltage recovery to enhance the KL divergence method, helping it better quantify oscillatory recovery. VRI was developed based on the observation that the KL diver- gence can yield a higher index when the probability at 1 pu exceeds the normal distribution value at 1, as illustrated in [5]. The gap in understanding here is that this issue can be managed by decreasing the standard deviation of the normal distribution. However, while VRI improves the index by penalizing oscillations, it does not specifically address oscillations occurring during FIDVR events.
Based on [5,6] proposed a new update for entropy- based index to assess the voltage recovery at the system level (VRIsys), which enhances the VRI by creating a global measure of voltage recovery across all buses in a power system. This index is based on a weighted average of the VRI values at each bus, considering the electrical distance are presented in Section IV. Finally, conclusions and future work are summarized in Section V.
II. Background
- A.
- KL Divergence Measure
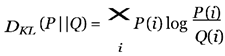
KL divergence, also known as relative entropy, is a funda- mental concept in information theory introduced by Solomon Kullback and Richard Leibler in 1951. It quantifies the difference between two probability distributions, P and Q. Mathematically, KL divergence is defined as:
from the fault location and voltage recovery at different buses. VRIsys provides a complete assessment of short-term voltage assessment, especially for large-scale systems with significant non-conventional generation (NCG) penetration, such as wind and solar. The global index in [6] leverages the VRI from [5]; However, it does not effectively address over-voltage issues or accurately manage oscillations that occur during FIDVR events.
Our research addresses significant gaps in the traditional entropy-based method, which primarily quantifies deviations from reference signals without effectively identifying critical conditions such as over-voltage, under-voltage, and voltage oscillations. Moreover, the traditional use of the KL measure falls short in comparing diverse voltage signal profiles.
- B.
- Contribution of This Paper
This paper introduces the Enhanced Voltage recovery Vio- lation Index (EVRVI) and addresses several key limitations of the previous work on Entropy-based KL divergence measure. The primary limitations of the KL measure that EVRVI addresses include:
- Over-voltage and Under-voltage Detection:The KL divergence focuses on detecting deviations from reference signals but does not efficiently capture cases of over- voltage or under-voltage, which can be equally harmful to power system stability. EVRVI is designed to detect both under-voltage and over-voltage violations, providing a more comprehensive assessment of voltage recovery.
- Managing Oscillations During Recovery: While the KL measure is sensitive to deviations, it cannot effec- tively handle oscillations during recovery. To address this, EVRVI introduces an additional criterion that minimizes the impact of oscillations on the KL divergence, allowing a focus on smooth, monotonic recovery behavior.
- Enhanced Comparison of Voltage Signals: Traditional KL measures are often limited when comparing voltage signals with varying profiles. The EVRVI framework improves accuracy by enabling a more adaptable compar- ison of similar distribution functions, allowing for a more consistent and precise evaluation of voltage recovery behaviors and overall system stability.
In Section II, we provide background information on KL divergence and EMD. The proposed index is detailed in Section III, while simulation results using the Nordic system for discrete distributions, and as an integral for continuous distributions. This measure is non-symmetric and always non- negative, with DKL(P ||Q) = 0 if and only if P and Q are identical.
In the context of FIDVR, KL divergence can quantify the deviation of post-fault voltage profiles from the ideal behav- ior, denoted as Q = PIdeal, providing a rigorous measure for detecting and analyzing FIDVR events. To calculate the entropy-based index for a voltage signal, the voltage axis is divided into N segments, and the sample count in each segment is normalized to obtain the mass probability density function (mdf) of the voltage profile. Similarly, the mdf of a normal distribution over the same range is obtained. The KL divergence then measures the statistical distance between the voltage profile’s mdf and the ideal normal distribution PIdeal using 1. A smaller KL value indicates a profile closer to the normal distribution, reflecting good recovery behavior, while a higher KL value indicates poorer recovery.
A voltage violation criterion defines the minimum accept- able voltage level. This work adopts the WECC voltage violation criterion [7], used in various studies ( [1,8,9]) to evaluate FIDVR. Similarly, Exelon in PJM has defined another stepwise criteria in [10]. Figure 1 shows an example of a stepwise reference voltage criterion with three sample recovery curves. A violation is detected if the KL divergence of the voltage signal KL(v) exceeds that of the reference signal KL(ref), indicating the voltage has crossed the acceptable threshold.
KL divergence can sometimes lead to false detections, identifying oscillations, over-voltage, or smooth recovery as violations (false positives) or missing actual violations (false negatives). To examine this, we use a composite load model with four motor types: Motor A (low inertia, constant torque), Motor B (high inertia, quadratic torque), Motor C (low inertia, quadratic torque), and Motor D (single-phase HVAC). Motor A causes oscillations, Motor B over-voltage, Motor C both over- voltage and oscillations, and Motor D mainly FIDVR events. These dynamics complicate the accuracy of KL divergence, as it encounters difficulty distinguishing these conditions across motor types.
1 1 illustrates three cases where the traditional entropy- based measure encounters difficulty in accurately detecting violations in voltage recovery profiles. Despite the values of parameters λ and N being selected according to the recommended guidelines [1], the results reveal the sensitivity of the KL measure to these parameters, as well as its limi- tations when dealing with different types of voltage recovery behaviors.
In the (a) High penetration of motor D, we observe a case where two different signal profiles are compared. The KL divergence fails to detect a violation, as the recovered signal exhibits a different shape from the stepwise reference signal, yet the KL value is lower than the threshold. In the case of high penetration of both motor A and D (Figure 1 (b)), we see the impact of oscillations on the KL measure. The oscillatory nature of the recovered signal results in a KL value that is lower than that of the reference signal, despite the clear violation of the recovery profile. Moreover, the (c) High penetration of motor C illustrates an over-voltage condition where the KL measure detects a violation. This is another drawback of the KL method, as it was originally designed to detect voltage dips, not over-voltage conditions, leading to false positives.
B. Empirical Mode Decomposition
EMD is a powerful, adaptive signal processing technique introduced by N. E. Huang and colleagues in 1998 [11]. It is specifically designed to analyze non-linear and non-stationary time series data by decomposing the original signal into a set of intrinsic mode functions (IMFs) and a residual. Each IMF represents a simple oscillatory mode, capturing different frequency components of the signal. This process is analogous to an adaptive wavelet transform but without requiring prede- fined basis functions. The flexibility and data-driven nature of EMD make it particularly suitable for our application. The computational process of EMD involves several iterative steps [12]:
- (1)
- Identify all the local maxima and minima of the signal.
- (2)
- Interpolate the local extrema to form an upper envelope U (t) and a lower envelope L(t).
- (3)
- Calculate the mean of the upper and lower envelopes.
- (4)
- Subtract the mean envelope from the original signal to produce a new signal. This new signal is considered an IMF if it satisfies two conditions: (1) the number of extrema and zero crossings must either be equal or differ by one, and (2) at any point, the mean of the envelope should be zero. If these conditions are not met, the sifting process is repeated on the resulting signal.
- (5)
- Once an IMF is obtained, it is subtracted from the original signal to produce a residue. This residue is then subjected to the same process to extract further IMFs.
- (6)
- The process is repeated iteratively on the residue until the residue becomes a monotonic function.
The final residual component, r(t), represents the overall trend of the original signal after all oscillatory modes are ex- tracted. In the proposed index, EMD is applied to decompose voltage signals, capturing over-voltage and under-voltage sepa- rately. The monotonically decreasing upper envelope U (t) and monotonically increasing lower envelope L(t) are constructed from the decomposed components as follows:
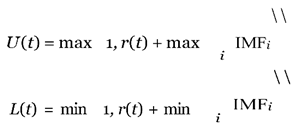
By defining the upper and lower envelopes in this way, the EMD framework effectively separates over-voltage and under- voltage cases. Using U (t) as a monotonically decreasing func- tion and L(t) as a monotonically increasing function enables a structured approach to assessing voltage recovery. Deviations from these monotonic envelopes highlight potential delayed recoveries, offering insights into the signal’s behavior during recovery phases. Additionally, these monotonic functions are designed to follow a similar distribution, making the KL divergence a more meaningful statistical measure for com- paring different voltage recovery trajectories to the reference. This alignment in distribution increases the reliability of KL divergence as a metric for quantifying deviations in recovery performance.
III. Enhanced Index Using EMD
The extended entropy-based index combines two statistical measures to assess delayed voltage recovery events. The index leverages KL divergence to quantify over-voltage and under- voltage recovery from EMD envelope results.
The first component of the index evaluates over-voltage by computing the KL divergence between the monotonically decreasing upper envelope distribution of the voltage signal and an ideal distribution, represented by a normal distribution centered at 1. This divergence quantifies how closely the actual voltage path aligns with the ideal profile, with lower KL values indicating a more effective recovery.
Similarly, the second component of the index evaluates under-voltage by computing the KL divergence between the monotonically increasing lower envelope distribution of the voltage signal and the same ideal normal distribution centered at 1. Similar to the first component, with lower KL values signifying improved recovery. This component represents the under-voltage delayed recovery index.
The proposed stability index is defined as:
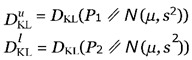
For over-voltage and under-voltage respectively. Where:
- P1 ∼ L(t): Represents the distribution of the lower envelope L(t).
- P2 ∼ U (t): Represents the distribution of the upper
- envelope U (t).
- N (µ, s2): The normal distribution with mean µ and variance s2, typically set to µ = 1 and s as a small positive value, symbolizing the ideal steady-state voltage level during normal operation conditions.
For further analysis within the evaluation framework, it is crucial to establish critical threshold values: Dviolate. This threshold is defined based on the KL index relative to a standard reference signals. For the under-voltage recovery threshold Dviolate, UV, the upper envelope of the reference’s low-voltage criteria serves as the benchmark. Conversely, for the over-voltage scenario, the lower envelope of the reference’s high-voltage criteria is employed to establish the violation threshold Dviolate, OV.
A. Step-by-Step Implementation
Voltage recovery assessment involves calculating the KL divergence between the envelope of the voltage recovery signal and an ideal reference distribution modeled as a normal distri- bution centered at 1. Let P1(vi), P2(vi) represent the discrete probability distribution of the voltage recovery upper/lower envelop at discrete points vi, respectively. The KL divergence for voltage recovery (from 1) is calculated as:
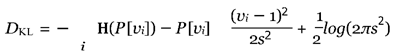
where P = P1 or P2 to find Du or Dl respectively, and the reference ideal distribution N (vi) is modeled as a normal distribution with mean µ = 1 and small standard deviation s2. H(x) = −x ln(x) is the entropy
The EVRVI is defined by two indices: EVRVI+, which measures over-voltage violations, and EVRVI−, which cap- tures under-voltage violations. These indices are calculated as a ratio between Du and Dl to Dviolate, OV and Dviolate, UV, respectively. These indices allow for a direct comparison between the reference signal and any measured voltage signal.
The calculation process begins by dividing the voltage axis into N partitions. If ∆Ti represents the time the voltage remains in partition i and the total time is T , then EVRVI+ and EVRVI− are given by:
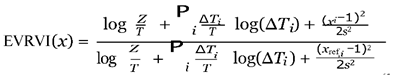
where xi represents the values of the upper or lower en-velopes in segment i for EVRVI+ and EVRVI−, respectively. Similarly, xref,i denotes the values of the upper or lower reference envelopes in segment i for EVRVI+ and EVRVI−, respectively, and Z is given by Z =
IV. Simulation Results
The simulation was carried out using the Nordic system at operation point A [13]. The composite load model parameters for AC motors were based on the details provided in [14]. For the KL divergence measure, the simulation was run for 10 seconds to capture the voltage behavior.
A total of 245,729 scenarios were analyzed (These scenarios are discussed in [14]), with 221,497 non-violation cases and 34,232 violation cases, where signals exceeded the reference by at least 0.005 pu for 250 ms or more. The KL mea- sure correctly classified 215,799 non-violation cases with 678 false positives (mainly over-voltage cases). For violations, it detected 12,030 true positives with 17,222 false negatives (mainly oscillation cases). The overall accuracy was 58.9% for violation cases and 99.7% for non-violations. All cases were accurately classified by the extended index without errors.
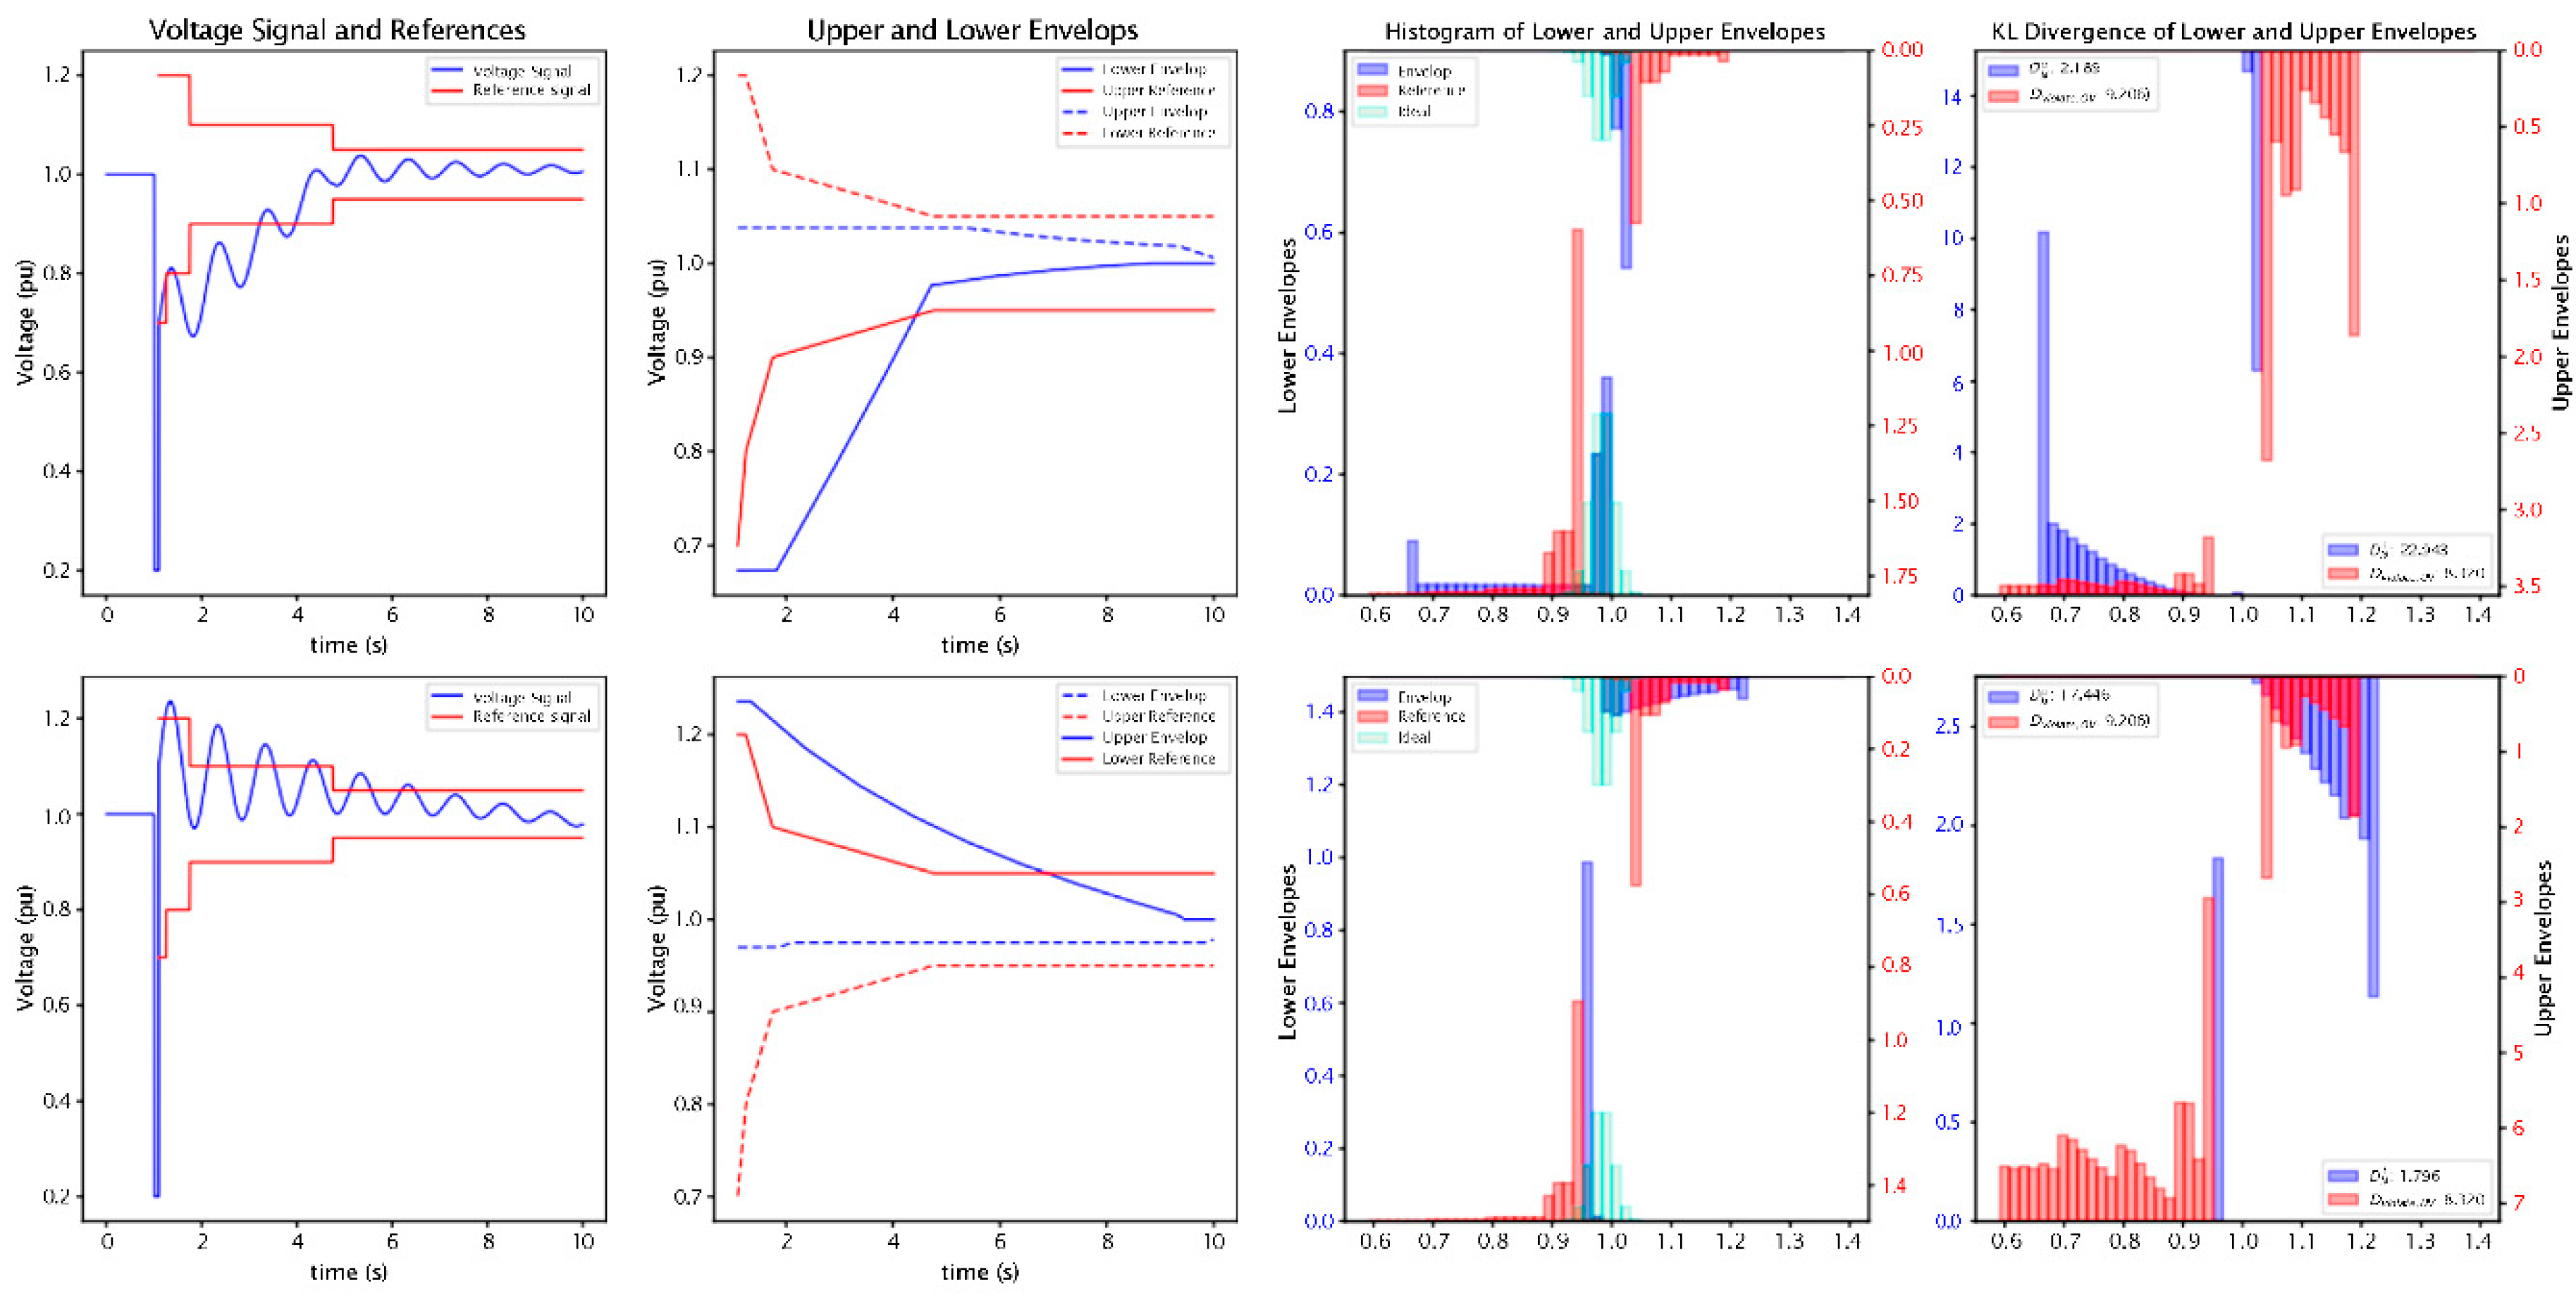
The implementation of the extended index is illustrated in Figure 2, which details the comprehensive steps required to analyze two delayed voltage recovery signals with oscillations: an under-voltage case and an over-voltage case. The first col- umn of subplots displays the voltage signal alongside the step- wise reference criteria, while the second column illustrates the corresponding envelopes for both the voltage and reference signals. The third column presents the probability distributions of these envelopes alongside the ideal (normal) distribution, with the lower envelope distribution shown on the left axis and the upper envelope distribution on the right axis. The final set of subplots in the fourth column depicts the calculated KL divergence.
In the first row, the KL divergence values indicate that the lower envelope of the voltage signal exceeds the threshold, suggesting an under-voltage violation, where EVRVI− ≃ 2.76, successfully detecting the violation. Similarly, the second row subplots outline the calculation steps for the over-voltage signal. Here, the KL divergence values indicate an over-voltage violation with EVRVI+ ≃ 1.8.
V. Conclusions
This paper introduced the Enhanced Voltage recovery Vio- lation Index (EVRVI) as a comprehensive index for quantified delayed voltage recovery. Our research effectively addresses the limitations of the traditionalKL divergence measure.
Through rigorous simulations conducted on the Nordic system, we demonstrated EVRVI’s superior accuracy in assessing voltage stability, notably excelling in identifying undervoltage violations and oscillatory behaviors.
Although the traditional KL divergence measure effectively identified non-violation cases with a low false positive rate, it suffered from a substantial false negative rate of 41.1%, indicating a significant number of undetected voltage vio- lations. EVRVI represents a substantial advancement over existing methods for voltage stability assessment and violation detection. Future efforts will be directed towards optimizing ESVI’s computational efficiency to facilitate its real-time im- plementation in large-scale power systems.
Acknowledgments
This work was supported by the DOE through Cy- DERMS project (DOE CESER DE-FOA-0002503 award DE-CR0000040), the Power System Engineering Research Center (PSERC) and the National Science Foundation (NSF).
References
- Y. Xue, T. Xu, B. Liu, and Y. Li, “Quantitative assessments for transient voltage security,” IEEE Transactions on Power Systems, vol. 15, no. 3, pp. 1077–1083, 2000.
- Swami, G., Sheth, K., & Patel, D. (2024). PV capacity evaluation using ASTM E2848: Techniques for accuracy and reliability in bifacial systems. Smart Grid and Renewable Energy, 15(9), Article 159012. [CrossRef]
- Sheth, K., & Patel, D. (2024). Comprehensive examination of solar panel design: A focus on thermal dynamics. Smart Grid and Renewable Energy, 15(1), 12–28. [CrossRef]
- Y. Xu, Z. Y. Dong, K. Meng, W. F. Yao, R. Zhang, and K. P. Wong, “Multi-objective dynamic var planning against short-term voltage instability using a decomposition-based evolutionary algorithm,” IEEE Transactions on Power Systems, vol. 29, no. 6, pp. 2813–2822, 2014. [CrossRef]
- G. Lammert, D. Premm, L. D. P. Ospina, J. C. Boemer, M. Braun, and T. Van Cutsem, “Control of photovoltaic systems for enhanced short-term voltage stability and recovery,” IEEE Transactions on Energy Conversion, vol. 34, no. 1, pp. 243–254, 2019. [CrossRef]
- A. Alshareef, R. Shah, N. Mithulananthan, and S. Alzahrani, “A new global index for short term voltage stability assessment,” IEEE Access, vol. 9, pp. 36 114–36 124, 2021. [CrossRef]
- Shoup, J. Paserba, and C. Taylor, “A survey of current practices for transient voltage dip/sag criteria related to power system stability,” in IEEE PES Power Systems Conference and Exposition, 2004., 2004, pp. 1140–1147 vol.2.
- Sheth, K., & Patel, D. (2024). Strategic placement of charging stations for enhanced electric vehicle adoption in San Diego, California. Journal of Transportation Technologies, 14(1), Article 141005. [CrossRef]
- Sheth, K., Patel, D., & Swami, G. (2024). Reducing electrical consumption in stationary long-haul trucks. Open Journal of Energy Efficiency, 13(3), Article 6. [CrossRef]
- PJM, “Exelon transmission planning criteria,” https://www.pjm. com/-/media/planning/planning-criteria/exelon-planning-criteria.ashx, accessed: 2024.
- N. E. Huang, Z. Shen, S. R. Long, M. C. Wu, H. H. Shih, Q. Zheng, N.-C. Yen, C. C. Tung, and H. H. Liu, “The empirical mode decomposition and the hilbert spectrum for nonlinear and non-stationary time series analysis,” Proceedings of the Royal Society of London. Series A: mathematical, physical and engineering sciences, vol. 454, no. 1971, pp. 903–995, 1998.
- G. Wang, X.-Y. Chen, F.-L. Qiao, Z. Wu, and N. E. Huang, “On intrinsic mode function,” Advances in Adaptive Data Analysis, vol. 2, no. 03, pp. 277–293, 2010.
- T. Van Cutsem, M. Glavic, W. Rosehart, C. Canizares, M. Kanatas, L. Lima, F. Milano, L. Papangelis, R. A. Ramos, J. A. dos Santos et al., “Test systems for voltage stability studies,” IEEE Transactions on Power Systems, vol. 35, no. 5, pp. 4078–4087, 2020. [CrossRef]
- A. Boricˇic´, J. L. R. Torres, and M. Popov, “Fundamental study on the influence of dynamic load and distributed energy resources on power system short-term voltage stability,” International Journal of Electrical Power & Energy Systems, vol. 131, p. 107141, 2021.
Figure 1.
False Detection cases using KL Divergence.
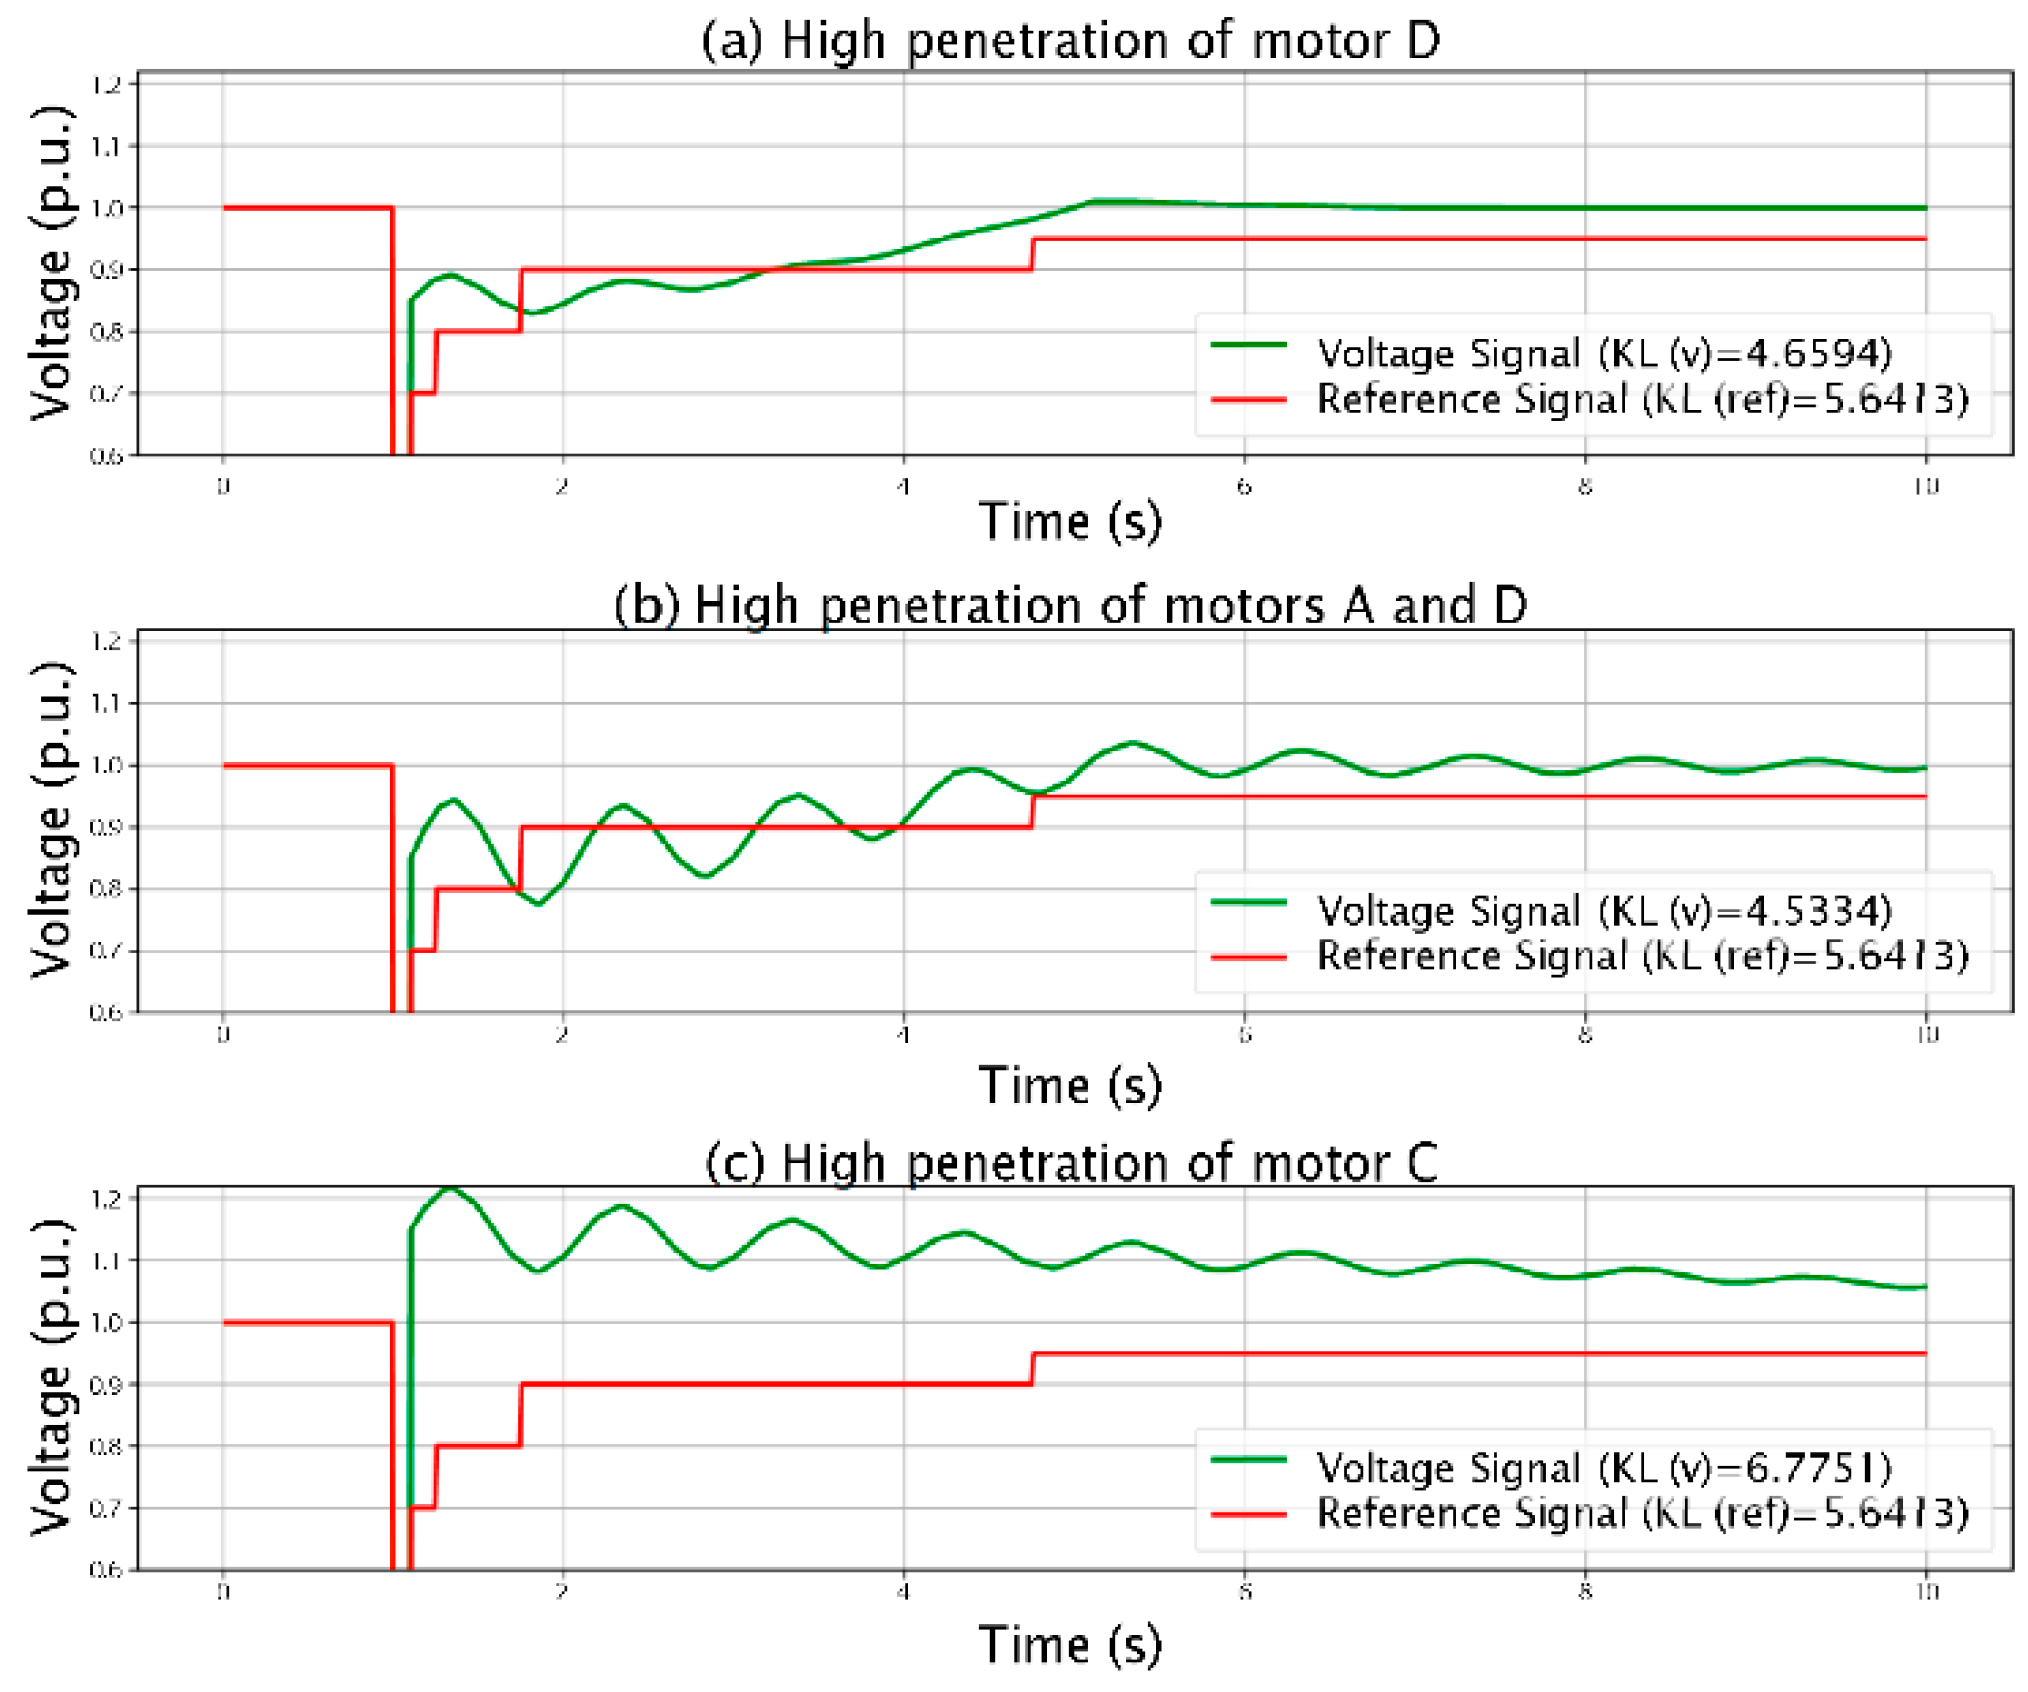
Figure 2.
Implementation process of the proposed index, detailing the steps and outcomes in the oscillatory delayed recovery scenario.
Figure 2.
Implementation process of the proposed index, detailing the steps and outcomes in the oscillatory delayed recovery scenario.
Disclaimer/Publisher’s Note: The statements, opinions and data contained in all publications are solely those of the individual author(s) and contributor(s) and not of MDPI and/or the editor(s). MDPI and/or the editor(s) disclaim responsibility for any injury to people or property resulting from any ideas, methods, instructions or products referred to in the content. |
© 2025 by the authors. Licensee MDPI, Basel, Switzerland. This article is an open access article distributed under the terms and conditions of the Creative Commons Attribution (CC BY) license (http://creativecommons.org/licenses/by/4.0/).
Copyright: This open access article is published under a Creative Commons CC BY 4.0 license, which permit the free download, distribution, and reuse, provided that the author and preprint are cited in any reuse.


