Submitted:
03 April 2025
Posted:
04 April 2025
You are already at the latest version
Abstract
With the increasing detection of artemisinin resistance to front-line antimalarials in Africa and notwithstanding the planned roll-out of RTS’S and R21 in Africa, the search for new vaccines with high efficacy remains an imperative. Towards this endeavor, we performed in silico screening to identify Plasmodium falciparum gametocyte stage genes that could be targets of protection or diagnosis. Through the analysis, we identified a gene, Pf3D7_1105800, coding for a Plasmodium falciparum subtilisin-like do-main-containing protein (PfSDP). Genetic diversity assessment revealed the Pfsdp gene to be relatively conserved across continents with signs of directional selection. Using RT qPCR and western blots, we observed that Pfsdp is expressed in all parasite developmental stages at the transcript and protein levels. Immunofluorescence assays found PfSDP protein colocalizing with PfMSP-1 and partially with Pfs48/45 at the asexual and sexual stages, respectively. Further, we demonstrated that anti-PfSDP peptide-specific antibodies inhibited erythrocyte invasion by 20-60% in a dose-dependent manner, suggesting that PfSDP protein might play a role in merozoites invasion. We also discovered that PfSDP protein is immunogenic in children from different endemic areas with antibody level increasing from acute infection to day 7 post-treatment, followed by a gradual decay. The limited effect of antibodies on erythrocyte invasion could imply that it might be more involved in other processes in the development of the parasite.
Keywords:
Plasmodium falciparum
; clinical isolates
; antibody response
; genetic diversity
; gene expression
; localization
1. Introduction
Plasmodium falciparum is increasingly becoming resistant to frontline antimalarials [1,2] whilst no effective vaccine exists against malaria. Even though the circumsporozoite protein-based vaccines (RTS’S-Mosquirix, R21) have been approved, their efficacy remains (https://www.malariavaccine.org/malaria-and-vaccines/rtss). This is largely due to the complexity of the parasite’s life cycle, genetic diversity, and antigenic variations [3]. In the human host, the parasite invades liver cells and red blood cells. Additionally, infected cells sequester in tissues with late asexual stages found mostly in the spleen and gametocytes in the bone marrow [4,5,6,7]. The asexual stages are exclusively found in the human host whereas the sexual stages are initiated in the human host [4,5,8] but continue their development in the mosquito after taking up an infected blood [9,10]. Tackling both the asexual and sexual stages of the parasite could be an effective strategy to control malaria. One way to attain such a goal is the development of multi-components vaccines having both anti-disease and transmission-blocking activities [11,12]. Another way to achieve this will be to select antigens from different stages of the parasite’s life cycle or antigens with cross-stage expression. This has become a hurdle due to the polymorphic nature of some of the antigens [13]. With the advent of the X-omics technology, parasite-related genomic, transcriptomic, and proteomic data have increased exponentially over the past years [14]. In silico analysis of such data shows that a majority of genes remain uncharacterised, with many lacking classical motifs that would suggest their function [15]. Characterising these genes could help identify functionally relevant ones that can serve as vaccine or drug targets (Kengne-Ouafo et al. 2019). In addition to its immunogenicity, a good vaccine target should be conserved to offer strain- or/and species-transcending protection, and accessible to the immune system to induce appropriate responses [16,17]. Nowadays, reverse vaccinology approach has been developed, whereby, algorithms are used to predict surface exposed or exported proteins which are considered potential vaccine candidates based on the presence of the above-mentioned properties and validated using animal models followed by clinical trials [16,18]. The present study aimed to utilize available P. falciparum genomics, transcriptomics, and proteomic data to discover and prioritise genes with vaccine candidate properties, assess their genetic diversity across continents, and determine the potential roles of their corresponding proteins in the biology of the parasite. In this regard, the localization, breath, and kinetics of antibody response of PfSDP were assessed. This study demonstrated that the PfSDP gene is conserved across continents and encodes for a subtilisin-like domain containing protein. It co-localizes with merozoite surface protein-1 (MSP-1) in asexual stage schizonts. PfSDP protein is immunogenic in children with antibodies decaying from 2 weeks post-infection. Moreover, antibodies to PfSDP-specific peptides inhibited red blood cell invasion in a dose dependent manner.
2. Materials and Methods
2.1. Gene Selection
Genes were prioritised from available P. falciparum proteome and gene expression datasets (unpublished, either provided by Dr Yaw Aniweh or found in PlasmoDB). The primary screen was achieved by filtering all differentially expressed genes with unknown function. This was followed by sorting out the genes predicted to have signal peptides and/or transmembrane domains using the protein features on the PlasmoDB (http://plasmodb.org/plasmo/app/record/gene) platform. The different expression patterns of the genes across erythrocytic stages and their essentiality were also checked on PlasmoDB.
2.2. Genetic Diversity Assessment
Plasmodium falciparum genomes from the Pf3k MalariaGEN database release 3 (https://www.malariagen.net/apps/pf3k/release_3/index.html) were used to assess the genetic diversity of selected genes. Genome data of P. falciparum samples collected from 7 different countries in Africa (Congo, Nigeria, Malawi, Mali, Ghana, Senegal and Guinea) and 5 in South-East Asia; SEA (Laos, Vietnam, Bangladesh, Cambodia and Thailand) were used. Bam files were indexed and the genomic regions covering the selected genes were extracted as reads using the view option of the Samtools package [19], while the genomic location of the gene of interest was obtained from PlasmoDB. The reads were used to generate the consensus sequences using the mpileup options of the Samtools package, bcftools and vcfutils commands. The consensus sequences were converted into the FASTA format using the -seqtk tool and aligned using Fast Fourier Transform-auto (mafft_auto) algorithm [20] and converted to phylip format using a custom-made script. RAxML software was used to generate the phylogenetic trees for the gene. A heatmap was plotted using cophenetic correlation coefficients generated by computing the correlation levels in the distance matrix. Nucleotide variations between continents were measured. Neutrality tests (Tajima’s D) were conducted. These were done using the PopGenome package [21]. Haplotype network analysis was carried out using the Pegas package. These were implemented in the open-source R-programming software version 3.5.1 (https://www.r-project.org/).
2.3. Description and Source of Clinical Isolates and Lab Strains
Clinical P. falciparum isolates and NF54 reference strain used in this study [22]. Clinical isolates were sampled from symptomatic children aged 2 to 14 years, who reported at the Ledzokuku-Krowor Municipal Assembly Hospital (LEKMAH) in Teshie, Accra (Greater Accra Region), Ghana. The samples were collected in a major study with ethical approval number GHS-ERC:002/08/17. Before sample collection, the objective, nature and potential risks associated with the study were well explained to the participants and/or guardians who gave informed consent.
Parasite Culture, Developmental Stage Production
Frozen parasitized RBCs were thawed using 2 different concentrations (12% and 1.6% consecutively) of NaCl following a protocol previously described by [22]. The thawed parasites were then washed 3 times in RPMI 1640 medium (Sigma, UK) to remove lysed cells and any other unwanted components. Washed parasitized cells were maintained in culture at 2% hematocrit in complete culture medium (RPMI 1640 medium (Sigma, UK), supplemented with 0.5% Albumax II (Gibco), 50 ug/mL Gentamicin and 2 mg/mL sodium bicarbonate) containing 2% heat-inactivated normal human serum (NHS) (PAN Biotech, UK). Before incubation at 37°C, the culture flasks (CORNING) were gassed with a 5.5% CO2, 2% O2, and N2 gas mixture. The cultures were maintained in 1X PBS-washed O+ RBCs. Gametocyte production was carried out according to a protocol adapted from Fivelman et al. [23]. Prior to gametocytogenesis induction, parasites were synchronized with 5% D-Sorbitol (Sigma Aldrich, UK) [23]. Gametocytogenesis was induced at a parasitaemia of about 10% by increasing the haematocrit and feeding the parasites with a mixture of fresh and spent media in a ratio of 2:3 on the first day of induction (Day-2), 1:2 the second day (Day-1) and with fresh media on the third day (Day-0). On day 4 from the point of induction, upon microscopic observation of gametocytes stage I, the culture maintained in complete medium (CM) supplemented with 50 mM of N-acetyl glucosamine (SIGMA, UK). Parasitaemia was monitored daily by thin smear Giemsa staining and microscopy. Six and 12 days after the final synchronization, early and late-stage gametocytes infected cells were pelleted by using percoll gradient (3 ml of 90%, 2 ml of 70%, and 40% layered from bottom to top) and centrifuged at 2400 rpm for 20 min with no break. Late (stage IV and V) gametocytes were collected from the 40%/70% Percoll gradient interface. The collected samples were washed twice in RPMI medium at 1500 rpm for 10 min and stored in Trizol at -80°C until RNA extraction.
2.4. RNA Extraction, RT q-PCR and Immunoblotting
RNA extraction was performed using Direct-zol RNA miniprep Kits (ZYMO RESEARCH) following the manufacturer’s instructions and concentration was checked using a NanoDrop spectrophotometer (Thermo Fisher Scientific, Madison, WI, USA). The expression profiles of the selected genes in P. falciparum gametocytes and asexual stages were analysed using the Luna® Universal One-Step RT-qPCR Kit (New England Biolabs, Inc.). The reactions were performed in triplicates in a final volume of 10 µl following the manufacturer’s instructions. Experiments were performed on a QuantStudio 5 Real-Time PCR System (Applied Biosystems). All reactions were run alongside a reference gene (P. falciparum seryl-tRNA synthetase). The fold change in gene expression in gametocyte and asexual stages was estimated using the formula 2-ΔΔCT [24] and asexual stages (rings) as reference. Primer design for PF3D7_1105800 was carried out using A plasmid Editor (ApE) software (https://jorgensen.biology.utah.edu/wayned/ape/) with the cDNA sequence downloaded from PlasmoDB (forward 5’-GCATTAAGTTTAGCAGGTGGTG-3’ reverse 5’-GCTTCCACATCTTCTGACGT-3’). Primer sequences for P. falciparum seryl-tRNA synthetase and Pfs25 used as positive control [25,26]. A melt curve was performed on the final product to determine the specificity of the primers (Supplementary Figure S1).
Immunoblotting was carried out to confirm the gene expression at the protein level. To achieve that, rings, trophozoites, schizonts, and early and mature gametocyte stage pellets were produced as previously. To eliminate haemoglobin, the pellets were incubated in 5 mL of cold 0.03% saponin (SIGMA, UK) solution for 10 min at RT on ice and washed repeatedly with 1X PBS till the supernatant became clear [27]. The pellets were subsequently lysed in 1% triton_X-100 lysis buffer (1% triton_X-100, 500mM tris-HCl, pH 7.5, 150 mM NaCl, 1mM EDTA and 1X Halt™ Protease Inhibitor Cocktail (Thermo Scientific, UK))[27]. Uninfected RBCs were subjected to the same procedure to produce ghost membranes that served as a negative control. The 6X SDS loading buffer dye was added to 50 µL of each sample, heated at 95° C for 15 min. 20 µL was loaded alongside molecular markers on a 12% pre-cast SDS-page gel (GenScript, UK), and run at 100 V. Proteins were then blotted onto a nitrocellulose membrane (BIO-RAD, Germany) for 20 min using a trans-blot Turbo transfer system (BIO-RAD) at 20 V following manufacturer’s instructions. After transfer, the membrane was washed 3 times in 1X tris-buffered saline (TBS) and 0.1% Tween 20 (TBST) and then blocked in 3% bovine serum albumin (BSA) overnight. The membrane was then immuno-stained with primary antibodies (raised against peptides specific to our proteins of interest (GenScript, UK)) at a dilution of 1:500. After washing steps, the membrane was stained in mouse anti-rabbit HRP conjugated secondary antibody (Thermo Scientific, UK) at 1:10000 dilution. The SuperSignal West Pico Plus chemiluminescent substrate (Thermo Scientific, UK) was used for signal development and images were captured in a chemiluminescent Amersham Imager 600 (AI600) (GE Healthcare).
2.5. Antibody Production
The 3D7 strain amino acid sequence of the PF3D7_1105800 protein was downloaded from PlasmoDB and submitted to the GenScript platform for B-cell epitope mapping and synthesis (GenScript, USA). Three peptides were selected based on the predicted sequence antigenicity, surface exposure and hydrophobicity scores from the GenScript OptimumAntigenTM design tool. These peptides were used to immunize New Zealand Rabbits by GenScript to produce polyclonal antibodies. These antibodies were purified by passing immune sera from the animals through a column containing A/G coupled protein beads followed by concentration through an Amicon 30 kDa and reconstituted in PBS (GenScript).
2.6. Full-Length Protein Expression and Purification
Complementary DNA (cDNA) coding for the PF3D7_1105800 proteins was codon-optimized, synthesized and subcloned by GenScript (USA) in frame with a C-terminal Hexa-histidine (6x His) tag into a T7 promoter Escherichia coli expression vector (pET-24b) to obtain a chimera plasmid with improved expression in E. coli. BL21-Codon Plus (DE3)-RIPL E coli competent cells (Agilent Technologies) were transformed with the chimera plasmids and cultured in terrific broth (12 g bacto tryptone, 24 g bacto yeast extract and 4 mL glycerol per litre) supplemented with 50 µM kanamycin till an optical density of 0.5 obtained. Protein expression was induced by addition of 0.25 mM of Isopropyl β-D-1-thiogalactopyranoside (IPTG) into the culture and shaking at RT for 16 hours. Crude lysate was extracted using a phosphate-based lysis buffer (50mM NaH2PO4, 300 mM NaCl, 10mM imidazole, pH to 8.0). To purify the target proteins, the lysates were passed through Ni-NTA resin containing column (Qiagen, USA) and eluted in a gradient of imidazole [28]. The imidazole buffer was then exchanged with 1X PBS using 10kDa amicon centrifugal filters (Merck). The recombinant proteins were subsequently subjected to size exclusion chromatography (GE, Superdex-200 increase 10/300 GL column) using the AKTA PURE (Sweden). The samples were subjected to SDS-PAGE using a 12% pre-cast SDS-page gel (GenScript, UK) and stained with Coomassie brilliant blue dye. Bands from the gels were cut, processed, and subjected to Liquid Chromatography-Mass Spectrometry (LC-MS) to validate the identity of the protein.
2.7. Protein Structure Prediction
The 3D7 strain amino acid sequences of PfSDP was submitted to the I-TASSER platform for 3-D structure prediction. Data generated by I-TASSER was visualized and labelled using PyMOL package. Moreover, using I-TASSER output data and protein structural information obtained from the Eukaryotic Linear Motif resource for Functional Sites in Proteins (ELM), the topographical representation of the proteins was designed.
2.8. Indirect Immunofluorescence Assay (IFA)
Thin smears of P. falciparum asexual and sexual stages were prepared, air-dried and then fixed with cooled 4% paraformyldehyde-PBS at RT for 10 min then kept at -80°C till use. Before IFA, smears were acclimatized to RT for 10 min and permeabilized with 0.1 % Triton X-100 dissolved in 1X PBS, then blocked for 1 hour with 1% BSA-PBS for 30 min. The smears were co-stained with the target protein anti-peptide primary antibodies at 1:500 dilution and antibodies for the organelle markers (anti-merozoite surface protein-1 (MSP-1), anti-Pfs48/45 (BEI Resources MR4, USA) at 1:1000 dilution was added and incubated for 2 hours at RT in a humidified chamber. After 3 washes of slides in PBS-0.1%Triton, goat anti-rabbit Alexa Fluor® 488 and goat anti-mouse Alexa Fluor® 568 (Invitrogen, UK) secondary antibodies, at a dilution of 1:500, were added and incubated for 1 hour as previously described. The slides were washed and mounted with VECTASHIELD antifade mounting medium (Burlingame, CA) containing 4′, 6′-diamidino-2-phenylindole (DAPI) for nucleus staining and sealed with coverslips and nail polish. Differential interference contrast (DIC) and fluorescent images were captured using Carl Zeiss LSM800 confocal microscope. The obtained images were processed using the open-access Fiji-Image J software (National Institutes of Health).
2.9. Growth Inhibition Assays (GIA)
In vitro growth inhibition assays were performed using antibodies (GenScript, USA) raised against PfSDP-specific peptides following a protocol previously published by Amlabu and colleagues [15]. Briefly, late trophozoite- or schizont-infected RBCs were mixed with an equal volume of carboxyfluorescein diacetate succinimidyl ester (CFDA-SE)-stained (20µM) O+ RBCs and cultured in complete medium supplemented with escalating concentrations (0-250mg/mL) of each antibody. Cultures were maintained for about 24-30 hours at 37°C in 96-flat bottom well plates. The experiments were carried out in a final volume of 50 µL in duplicates. In addition to the target antibodies, anti-human basigin antibodies (clone MEM-M6/6, Thermo Scientific, UK) and pre-immune serum sample (GenScript, USA) were used as positive and negative controls, respectively. Anti-basigin antibodies were used at a working concentration of 12 µg/mL based on a previous study [29]. After incubation, plates were centrifuged at 1500 rpm for 5 min and the supernatants were carefully removed and replaced with 45µL of 1µg/mL Hoechst 33342 (Thermo Scientific, UK) solution for parasite DNA staining. The data was then acquired using a BD LSR Fortessa X-20 cytometer (BD Biosciences, Belgium) and the invasion rates determined.
2.10. PfSDP Immunogenicity Assessment by Indirect-ELISA
To assess the immunogenicity and kinetics of PF3D7_1105800-specific antibodies, archived plasma samples collected from areas with different transmission intensities in Ghana (Navrongo, Kintampo, Accra, and Ho) were used. These samples were collected from symptomatic and asymptomatic individuals in the framework of projects based at the West African Centre for cell biology of infectious diseases (WACCBIP). Some of the projects (Kintampo, Accra and Ho) were longitudinal whereby samples were collected on Day 0 before anti-malarial treatment, then at 7 days and 21 days after treatment and involved only children than less 15 years. In Ho, follow-up was done on day 7 only while the project in Navrongo involved a cohort study design in which samples were also collected from adults and asymptomatic (Subclinical infection) individuals. Apart from these minor differences in the study design of individual projects, sample collection was done following the same protocol established at WACCBIP.
Using indirect ELISA, protein-specific IgG were measured in plasma samples. Before the assay proper, a checker-board titration was used to determine the optimum sample and conjugate antibody dilution. Briefly, the 96-well flat-bottom plates (NUNC, Denmark), were coated with 1 μg/mL of PF3D_1105800 recombinant proteins and incubated overnight at 4°C. The plates were washed 3 times with 1x PBS supplemented with 0.05% Tween-20 (PBS-T) and blocked with 200 µL/well of 5% bovine serum albumin (BSA, SIGMA) in PBS-T for 1 hr at RT. The plates were washed once more as previously described and 100 µL/well of the plasma samples were added at 1:1000 dilution in 1% BSA-PBS-T. The plates were incubated at RT for 2hrs followed by washing. Then, 100 µL/well of anti-human HRP-conjugated secondary antibodies (Thermo Scientific, UK) was added at 1:8000 in 1% BSA-PBS-T and incubated for 1 hr at RT. After the final wash, HRP activity was measured with one-Step™ Ultra 3,3',5,5'-Tetramethylbenzidine (SIGMA, USA) by measuring the optical density (OD) at 450 nm using a Varioskan™ LUX multimode microplate reader (Thermo Scientific, USA). For these assays, a non-immune serum negative control (from a malaria-naïve European donor)) was used to determine the sero-reactivity in the study population. A pooled positive plasma sample was used throughout the assays as standard to estimate antibody levels in the study population and account for inter-plate variations. The standard was used to generate a standard curve from which the IgG level of individual samples was extrapolated from their ODs and converted into arbitrary units (AU) using ADAMSEL (Edmond J. Remarque®). The immunogenicity of the expressed proteins was validated using Western and dot blots.
Protein Immunogenicity Confirmation by Western and Dot Blots
To confirm immunogenicity of the protein, recombinant proteins were subjected to SDS-PAGE, transferred to nitrocellulose (NC) membrane, and stained with plasma (1:1000) from malaria-exposed and non-exposed individuals followed by goat anti-human HRP-conjugated secondary anti-IgG at a dilution of 1:15000 (Thermo Scientific, UK). For Dot blot, 10µL of different concentrations (5µg/mL, 10µg/mL, 15µg/mL) of the protein were spotted directly on NC membrane and immunostained as previously described. This was carried out to ascertain that plasma from malaria-exposed individuals could detect the recombinant proteins.
2.11. Data Analysis
The PopGenome and pegas packages were used to assess the genetic diversity of the prioritised genes. Fold changes in gene expression arising from qPCR analysis were compared between parasite developmental stages using Kruskal Wallis followed by a Dunnett’s post-hoc test.
The generated IgG levels were log-transformed and compared between groups (areas with different transmission levels, different age groups) using the Mann Whitney U and Kruskal Wallis tests for pairwise and multiple group comparisons, respectively. The Dunnet’s multiple comparison test was used for pairwise comparisons following a significant Kruskal Wallis test. Spearman rank correlation analysis was carried out to determine associations between antibody responses and parasitaemia. The chi-square test was used for categorical variables. All statistical analyses were done using the R-programming software (https://www.r-project.org/) and SPSS 20 (Software SPSS INC, Chicago, IL, USA). The significance level was set at 5 % for all statistical tests.
3. Results
3.1. Gene Selection Criteria
Genes were prioritised based on gametocyte specific expression or cross-stage expression in the different erythrocytic stages using available P. falciparum laboratory strain transcriptomic and proteomics data (Dr Aniweh, WACCBIP, unpublished data, and PasmoDB). The selection was also based on properties associated with desirable vaccine candidates. Some of such criteria used include predicted surface localization, predicted exposure to the host’s immune system, and the presence of signal peptides and/or transmembrane domains.
3.2. Expression Profiles of Selected Genes in Online Datasets (PlasmoDB)
In identifying genes that are expressed across the sexual and asexual stages, we identified PfSDP as a possible candidate for validation. The gene is found on chromosome 11. It is conserved with unknown function and expressed across parasite stages with expression higher from late trophozoites to schizont and early to late gametocytes [30,31]. It has also been demonstrated to be involved in protein-protein interactions in P. falciparum [32]. Besides, using genome-wide CRISPR screening, the orthologue of this gene in Toxoplasma gondi has been found to be essential, and likely to be involved in cell invasion [33].
3.3. Pfsdp May Be Under Directional Selection and Genetically Conserved Across Different Continents
To query the levels of genetic diversity of the gene, a total of 2276 samples (1336 from Africa and 1010 from South East Asia; SEA) were selected from the Pf3k MalariaGEN database release 3 (https://www.malariagen.net/apps/pf3k/release_3/index.html). Our target gene of interest PF3D7_1105800; PfSDP, had limited levels of polymorphisms with 91 and 18 segregating sites in Africa and SEA, respectively (Table 1). Nucleotide diversity (Pi) was quite low both in Africa (0.00168) and SEA (0.00085, Table 1). The same trend was observed with haplotype diversity (Hd). Generally, the haplotype number was higher in Africa than in SEA, estimated at 101 and 40 respectively). The overall haplotype diversity was higher in Africa (0.916) than SEA (0.873, Table 1)). However, it is worth mentioning that haplotype construction would have been more prone to error in Africa as compared to SEA due to higher multi-genomic infections (multi clone infections).
Population structure assessment using Fst revealed moderate genetic differentiation; Fst in the range of 0.005-0.15 (Table 1). The gene was found to have negative Tajima’s D values suggesting a directional selection or recent population expansion. This departure from neutrality was more pronounced in Africa than in SEA (Figure 1). The diversity is likely to be more ancient than would be expected under neutrality (Polley et al 2003).
To check whether there was any clustering of the observed limited genetic diversity per region, heatmap and principal component analysis (PCA) scatter plots were generated. The heatmap showed that the pfsdp diversity was neither region- nor country-specific but rather randomly distributed across countries and continents (Figure 1A). The PCA summarizing this genetic diversity confirmed the conserved nature of this gene as all samples clustered together (Figure 1B). Moreover, Haplotype network analysis showed the major haplotypes present in both Africa and SEA (Supplementary Figure S2) confirming our results.
3.4. PfSDP Has Cross-Stage Expression at the Transcript and Protein Levels in Clinical Isolates
To evaluate and compare expression pattern of Pf3D7_115800 (Pfsdp) gene in clinical isolates to that of the 3D7 strain found in PlasmoDB, a total of 5 isolates were used, 4 of which were clinical isolates and the NF54 lab reference strain. A total of 29 samples composed of 5 ring, 5 trophozoite, 5 schizont, 5 early gametocyte, and 9 late gametocyte-stage (5 from Clinical isolates and 4 from NF54 reference strain) were produced. Using total mRNA, PF3D7_115800 was found to have cross-stage expression by quantitative PCR. As expected, this gene was highly expressed in early gametocytes derived from clinical isolates (stage 2 and 3) with a mean fold change of 8. This expression pattern was consistent with that of the laboratory reported in PlasmoDB. Moreover, the expression in clinical isolate-derived late gametocytes was like that of their NF54 counterparts used as control (Figure 2). The positive control, Pfs25, had the expected expression pattern of slight expression in asexual stages and early-stage gametocytes and high expression in late gametocytes (500-fold increase in clinical isolate gametocytes compared to their ring counterparts) ascertaining sample purity (Figure 2).
Protein structure prediction revealed PF3D7_1105800 to be made up, mainly, of alpha helices consisting mostly of a transmembrane domain, a disordered region, a low complexity region, a globular and a subtilisin/kexin isozyme-1 (SKI1) domains (Figure 3 A&B). This structure was predicted from that of a Photosynthetic Reaction Center Protein. Besides, orthologues of this gene in Toxoplasma gondi have been shown, through genome-wide CRISPR screen, to be essential and likely to be involved in cell invasion [33]. Based on these observations, this protein was referred to a P. falciparum subtilisin-like domain containing protein (PfSDP).
Moreover, Western blots were used to confirm protein expression in different developmental stages of clinical isolates (Figure 3 C, D&E). PF3D7_115800 (PfSDP) protein was found to be expressed in all developmental stages and more likely to be dimeric in nature or to undergo processing in the parasite as demonstrated with PfSDP-specific anti-peptide 1, 2 & 3 antibodies (Figure 3C, D&E). Anti-peptide-2 recognised a band (about 37kD) in all stages with pronounced signal in early gametocytes. However, this band was not detected in the recombinant protein suggesting protein processing or interaction in the parasite. This antibody also detected a dimer in late gametocytes. The list and characteristics of selected peptides used for antibody production are shown in supplementary Table 1.
To determine the localization of the selected protein, various parasite developmental stages were immuno-stained with antibodies each specific to a region (peptide) on the PfSDP protein. Parasites were co-stained with antibodies to known organelle markers; merozoite surface protein 1 (MSP-1) for merozoite (parasite) surface [34,35], and Pfs48/45 for gametocyte surface [36,37,38,39]. The two markers were selected based on the 3D structure prediction output. In asexual stages (trophozoites and schizonts), anti-PfSDP antibody signals co-localized with those of anti-MSP-1 antibodies suggesting association with PF3D7_1105800 to the merozoite surface (Figure 4A).
With the observation that PfSDP may be associated with merozoite surface and its likely involvement in cell invasion as determined from its 3D structure prediction, Growth inhibition assays were carried out for a confirmation purpose using peptide-specific antibodies against PfSDP. These antibodies inhibited erythrocyte invasion in a concentration-dependent manner (Figure 4B). Two of the anti-PfSDP peptide-specific antibodies (anti-peptide-2 (PfSDP-2) and anti-peptide-3 (PfSDP-3) inhibited erythrocyte invasion with rates ranging from 6.5% to 50% and 0% to 20% for PfSDP-2 and PfSDP-3 respectively. Anti-peptide-1 (PfSDP-1) did not display any remarkable growth inhibition in 3D7 (Figure 4B). The reference strain 3D7 was more sensitive than the clinical isolate. Pre-immune serum did not inhibit parasite growth. Rather, it had a tendency to potentiate growth.
In sexual stages of the parasite, anti-PfSDP antibodies showed signals beneath Pfs48/45 with partial colocalization at some sections of the parasite (Figure 5). These results suggested that PF3D7_1105800 localizes partially at the gametocyte body. Moreover, native PfSDP stained as aggregates in gametocytes, implying that this protein may be associated with the membranous organelle.
3.6. Plasma Samples from Children and Adults from Different Endemic Areas Reacted to PfSDP Recombinant Proteins
Recombinant PfSDP was expressed in the E. coli system and detected on Coomassie blue-staining after nickel-nitrilotriacetic acid (Ni-NTA) affinity purification as dominant species of about 29 kDa (Figure 6A). This was slightly different from the expected size of the native proteins (30.6kDa) because the sequences coding for signal and transmembrane domains were removed before cloning. The Ni-NTA-purified proteins were concentrated using a 10 kDa cutoff centrifugal filter and subsequently subjected to further purification using size exclusion chromatography using the AKTA pure TM protein purification system (Figure 6B). The purified recombinant protein was detected by immunoblotting using anti-6xHis monoclonal antibodies (Figure 6C) and pooled plasma samples from malaria exposed and non-exposed individuals (Figure 6D & E).
To assess the acquired antibody response to PfSDP, a total of 447 plasma samples were used; of which 45 (10%) were from Accra, 155(34.7%) from Ho, 92(20.6%) from Kintampo, and 155(34.7%) from Navrongo. In Navrongo, 49/155 (31.6%) samples were collected from adults. Accra and Ho are known to exhibit low malaria transmission while Kintampo and Navrongo are known to be high transmission areas. The description of the study populations is given in suppl. Table S2. Non-immune serum was used as negative control, and a study participant was considered seropositive when his/her antibody level was greater than the cut off value. The Cut-off was set to be mean antibody level of negative controls + 3SD. The PfSDP protein was found to be immunogenic with seropositivity greater than 80% in all the localities (Figure 6F). Navrongo, which is a high transmission area, had the highest seroreactivity (95%) in children (0-15 yrs) with acute malaria. However, this was not the case for Kintampo (highest transmission site) which registered significantly lower values relative to the other sites. Plasma samples from adults were also found to be highly reactive to PfSDP with the highest seropositivity (98.5%). Antibody response did not follow the trend of transmission intensity as Kintampo, with the highest transmission potential, was found with relatively lower antibody levels compared to the other sites (Figure 6G,). Children from Navrongo and adults were found to have significantly higher IgG titres compared to children from the other sites (Figure 6G). Adults (> 18 years) were enrolled in Navrongo only.
3.6.1. Associations Between Antibody Response Level, Age, Disease Episode, Parasite Density, and Exposure Among the Study Population
To test the effect of age, which is a surrogate of exposure, the study participants were categorized into three groups: < 6 years, 7-15 years, and adults (> 15years) (Supplementary Table S2). Comparing these groups, there was no significant association of IgG level with age among children (< 15 years) irrespective of site (Figure 7A). There was a significant increase in IgG response in adults compared to children less than 15 years old (Figure 7A).
To find out whether antibodies raised against the malaria parasite antigen had a protective effect on clinical episodes, parents at enrolment into the study were asked to declare the number of times their child had suffered from malaria within the year. The information obtained was used to group patients into three groups: a group of children with no clinical episode per year, a group with 1-2 clinical episodes per year and another group with > 3 clinical episodes yearly (Supplementary Table S2). Children with less frequent episodes of malaria had significantly higher PfSDP antibody levels compared to those with high frequency of clinical episodes (P< 0.01) when the whole study population was considered in the analysis (Figure 7B). While considering the different study sites, no significant association was found between antibody response and disease episode. Samples were also collected from individuals with sub-clinical (asymptomatic) infections in Navrongo. Comparing their IgG levels with those with symptomatic infections revealed a higher IgG titre in asymptomatic individuals (P< 0.05) in the 7-15 yrs group but not in children less than 7yrs old (Figure 7D).
Global analysis revealed a negative significant association between antibody response and parasitaemia (P < 0.05, Figure 7C). However, this association was only found in Navrongo when the analysis was done by site (P< 0.05). Globally, there was a weak significant negative correlation between PfSDP antibody titres and parasitaemia (r= -0.2, P=0.001). However, this correlation became non-significant within study site except in Navrongo (r= -0.27, P=0.0044). For the correlation analysis, only seropositive individuals harbouring the parasites were considered in the analysis.
In Navrongo, 6/85 (7.3%) asymptomatic individuals were found to harbour gametocytes in their blood. We sought to check whether there was an association between gametocytaemia and IgG titres. Individuals harbouring gametocytes appeared to have slightly lower levels of PfSDP IgG antibodies. Using only gametocyte positive samples, spearman rank correlation revealed a strong but non-significant positive relationship between IgG titres and gametocyte PfSDP (r= 0.77, P= 0.07).
3.6.2. Time Point-Specific Variations in PfSDP Seropositivity and IgG Level in Malaria-Infected Children Was Observed Across Areas with Different Transmission Potentials
To evaluate the kinetics of PfSDP antigen-specific antibody levels, plasma samples were collected on day 7 and 21 (convalescence) post-treatment in addition to the ones collected on day 0 before treatment (acute infection). IgG level assessment showed time-dependent variations in seroreactivity to PfSDP. The seropositivity increased remarkably from acute infection (day 0) to day 7 post-treatment followed by a decrease towards day 21 post-treatment irrespective of the sample collection site (Figure 8A). The fold increase (seropositivity day 7/seropositivity day 0) in seropositivity of 1.2 was recorded in all the three sites (Accra (P= 0.004), Ho (P< 0.0001) and Kintampo (P= 0.001). Samples were not collected on day 21 in Ho based on the design of that study. The same trend was observed while comparing IgG levels in each child at the different time points (acute infection versus convalescence). Like seropositivity, IgG titres were found to significantly increase from day 0 to day 7 followed by a slight decrease to day 21 (Figure 8B). This observation was made at all transmission levels. The fold increase in antibody titre (mean IgG titre day7/mean IgG titre day0) was 2.5 in Accra (P< 0.001), 1.7 in Ho (P< 0.001) and 1.5 in Kintampo (P< 0.001). Comparing IgG levels in children from the three sites at different time points showed that children from low endemic areas (Accra and Ho) reacted more than those from the high transmission area (Kintampo) at day 7 and day 21 (Figure 8B & Supplementary Figure S3). On day0, mean antibody levels were similar across the three sites. Follow-up was not done in Navrongo hence, the exclusion of this site from the analysis.
4. Discussion
This study sought to select and characterise Plasmodium falciparum parasite genes to determine their likelihood to be potential vaccine candidates. The selected gene, PF3D7_110580, was found to be conserved across continents with limited diversity found to be normally distributed in all study countries.
As a preliminary step, the gene was prioritised based on its expression patterns using available P. falciparum laboratory strain transcriptome and proteomic data (published and unpublished) and the standard vaccine candidate-associated criteria. Genomic sequence analysis revealed the gene was largely conserved with the few polymorphisms found under directional selection based on the negative Tajima’s D. Previous studies have found many P. falciparum genes to be either under directional or balancing selection (Duffy et al., 2015, Ahouidi et al., 2010, Ochola et al., 2010, Jennings et al., 2007). It is worth noting that immune or drug pressure, or both, play an important role in selection (Ahouidi et al., 2010, Jennings et al., 2007). This is an indication that the selected gene may be of interest. However, as previously observed with P. falciparum parasites, the negative Tajima’s D could also be as a result of recent population expansion (Kassegne et al., 2020). Nucleotide and haplotype diversity were found to be higher in Africa than SEA. These findings are in line with a previous study which revealed higher haplotype diversity of var2csa in Africa than SEA [46]. This observation could be attributed to the higher transmission potentials and the older nature of African genomes. An interesting finding in our study is that the selected gene was found to be conserved across continents and even the limited diversity found was normally distributed in all countries. This was revealed by the heatmap and the PCA scatter plots which were used to summarize the genetic diversity and did not show any geographical clustering of SNPs. Similar results have been obtained with the N-terminal region in circumsporozoite surface protein (CSP), the main antigen in the RTS’S vaccine [47,48]. Moreover, haplotype network analysis revealed the presence of major haplotypes both in Africa and SEA. Taken together, these findings imply that a vaccine containing the relevant variants of these genes could provide strain-transcending immunity.
RT q-PCR expression analysis revealed that PfSDP has cross-stage expression with higher expression in early gametocytes. The expression pattern found with field isolates was consistent with those observed with the 3D7 lab strain that was used for prioritisation in PlasmoDB. The expected expression of the gametocyte-specific Pfs25 positive control indicates that our experimental design was sound and free from contamination by asexual stages. This validates the results obtained from our experiments. This result was confirmed by immunofluorescence and immunoblot experiments that revealed similar expression pattern at the protein level. Based on Western blot data, the PfSDP protein may be polymeric in nature and more likely to undergo stage-specific processing in the parasites. PfSDP had an ~37kD band that was different from the dimer and the expected monomer; and found predominantly in early gametocytes and trophozoites. This suggests that this protein may also be processed for biological processes in some stages of the parasite. Early gametocytes and trophozoites parasite stages are known to sequester in tissues but the mechanism involved is not fully elucidated yet, especially in the case of maturing gametocytes [49]. PfSDP structure was modeled from that of a Photosynthetic Reaction Center Protein whose orthologues have been revealed to be indispensable and likely to be implicated in cell invasion in Toxoplasma gondi [33]. Moreover, the structure was predicted to have a subtilisin/kexin isozyme-1 (SKI1) domain hence the name P. falciparum subtilisin-like domain-containing protein (PfSDP). Subtilisin-like serine proteases in P. falciparum are enzymes involved in the pre-processing of proteins some of which are involved in cell invasion (eg MSPs), as such they are considered key regulators of disease pathogenesis [50,51,52]. This is an indication that this protein could have an important role in the parasite during egress and RBC invasion. It is worth mentioning that PfSDP colocalized with MSP-1 at the schizont stage in our study, suggesting they are both associated with merozoite surface. MSP-1 is involved in the tight junction formation during the invasion process supporting the potential involvement of PfSDP in cell invasion.
To complement the structure and function prediction, we also showed that Peptide-specific antibodies against PfSDP could mildly inhibit red blood cell invasion in a concentration-dependent manner in both lab and clinical parasite lines. Antibodies to PfSDP peptides had more effects on the lab compared to clinical parasite lines. Parasite lines have previously been shown to respond differently to antibodies against invasion related genes such as PfEBA181, PfCyRPA and PfRAMA [53]. The observed low inhibitory activity against erythrocyte invasion may be attributed to the antigen's potential expression across stages.
However, PfSDP co-localized partially with a known vaccine candidate Pfs48/45 in gametocytes. Pfs48/45 play a role in parasite fertilization in the mosquito midgut [40,41,42,43,44,45]. In the asexual parasite, PfSDP showed membrane localization in late trophozoites/early schizonts but showed a peri-nuclear staining pattern like PfMSP-1 in mature schizonts [54,55,56]. The proximity of PfSDP to known vaccine candidates suggested that it likely associated with membrane and exposed to the human host immune system. In that context, we went further to evaluate the naturally acquired antibody responses to this antigen in children and adults living in different endemic areas.
The antigen was found to be immunogenic with antibody levels for most of the children and adults above the cut-off. The samples were collected from malaria-endemic areas with different transmission intensities with Kintampo having the highest entomological inoculation rate >250 infective bites/person per year (ib/p/yr), followed by Navrongo with <250ib/p/yr, Ho with 69ib/p/yr and Accra with < 50ib/p/yr as previously reported [57,58,59,60]. Analysis based on site failed to show a relationship between transmission intensity and neither antibody level nor seropositivity. This observation was previously made with some P. falciparum invasion-related merozoite proteins such as MSP-7, PF3D7_1404900, PF3D7_038300, Armadillo-Type Repeat Protein PfATRP [61], reticulocyte-binding homologue antigen RH4.2 and erythrocyte-binding antigen 140 (EBA140) [62]. This suggests that this antigen cannot be used as a biomarker for disease transmission intensity. Kintampo, a high transmission, site registered lower IgG titres [63].
Despite the significantly higher increase in IgG level in adults, age was not found to significantly influence antibody response in children less than 15 yrs old [61]. This suggests that these antigens may need more exposure time to boost the immune system. Globally, there was a significant negative but weak association between IgG titre and parasite load which was reproducible only in Navrongo. Although no significant association was found between gametocytaemia and IgG levels in the human host, it would be interesting to evaluate the transmission-blocking activity of these antibodies in the vector using a standard membrane feeding approach [41,44,45,64].
A major issue with common malaria vaccine candidates is that they elicit the production of short-lived antibodies or memory B cells. To address that issue in this study, samples were collected during acute infection (day 0) and convalescence (day 7 and day 21). Both the seroreactivity of children to the antigen and the level of specific antibody response were found to markedly increase from day 0 to day 7 followed by a drop on day 21. These findings were consistent with previous data reported on P. falciparum invasion-related antigens (AMA-1, MSP-119, MSP-2, MSP-3, and RH5) which have been shown to stimulate the production of short-lived antibodies [65,66,67,68]. Partey and colleagues found out that both the seropositivity and antibody response to PfRh5, a leading vaccine candidate, decay rapidly within 42 days post-treatment after a sharp increase from disease onset to convalescence in Ghanaian children. Anti-AMA-1 antibody level and specific B cell count were shown to decrease from convalescence to 12th month in Malian children [67]. This is an indication that the titres of total IgG against our selected antigen, PfSDP, could constitute markers of recent P. falciparum exposure in natural infections. Memory B cells in concert with T cells are important in the presence of the antigens. A good vaccine does not only rely on how protective the produced antibodies are, but on the persistence of its specific memory B cells [66]. Studies geared towards evaluating the breath and kinetics of specific memory B cells and T cells are highly warranted to complement the findings of the present study.
5. Conclusions
In this study, PfSDP was found to be relatively conserved across continents and likely under directional selection. It displayed cross-stage expression both at the transcript and protein level in clinical isolates. The protein is more likely to be associated with the gametocyte body and merozoite surface in asexual stages. Structure and motif predictions suggested that they might be involved in cell invasion-related processes. Peptides specific to PfSDP protein inhibited erythrocyte invasion to some extent. The protein is immunogenic in children from different endemic areas with both seroreactivity and antibody level increasing from acute infection to day 7 post-treatment followed by a gradual decay.
Supplementary Materials
The following supporting information can be downloaded at the website of this paper posted on Preprints.org. Supplementary Table S1: List and characteristics of selected peptides used for antibody production. Supplementary Figure S2: Description of the study population. Supplementary Figure S1: Melt curves generated after RT-qPCR. Supplementary Figure S2: Haplotype analysis for PF3D7_1105800 (Pfsdp) showing the major haplotypes present in both Africa and SEA. Supplementary Figure S3: Antibody level comparison between sites at different time points.
Author Contributions
BD, BU, YA, GAA, LAE, YB, JAK-O conceived and designed Study; JAK-O, BD, LAE, NKN, CMM, RT carried out sample collection and processing; JAK-O, YA, JKM carried laboratory investigations, JAK-O, JKM, CMM, SYB analysed the data. JAK-O drafted the paper and all authors proofread the manuscript.
Funding
JAK-O, SYB, NKN, CMM are supported by a DELTAS Africa grant (DEL-15-007: Awandare). The DELTAS Africa Initiative is an independent funding scheme of the African Academy of Sciences (AAS)'s Alliance for Accelerating Excellence in Science in Africa (AESA) and supported by the New Partnership for Africa's Development Planning and Coordinating Agency (NEPAD Agency) with funding from the Wellcome Trust (107755/Z/15/Z: Awandare) and the UK government. YA was supported by the Crick-Africa Network (CAN) Fellowship. BD was funded by a Wellcome Trust (110090/Z/15/Z) and the Cambridge-Africa ALBORADA Research Fund (RG86330: Billker O, Dinko B). The views expressed in this publication are those of the authors and not necessarily those of AAS, NEPAD Agency, Wellcome Trust, the UK government or ALBORADA.
Institutional Review Board Statement
The study was conducted in accordance with the Declaration of Helsinki, under ethical approval number GHS-ERC:002/08/17. Before sample collection, the objective, nature and potential risks associated with the study were well explained to the participants and guardians who subsequently gave informed consent.
Data Availability Statement
Data generated can be obtained from the corresponding authors upon request.
Acknowledgments
We thank all the parents, guardians and participants for willingly taking part in this study. Our gratitude also goes to members of the Kintampo Health Research Centre, Ledzokuku-Krowor Municipal Assembly Hospital (LEKMAH), Volta teaching hospital in Ho, Ho municipal hospital and St Anthony’s hospital at Dzodze for helping in sample collection. The authors are grateful to West Africa Microscopy and Bio-Imaging Analysis Network (WAMBIAN) for the training. We thank the Molecular Genetics and Cell Biology research and the Genomics and Bioinformatic groups at WACCBIP for the discussions and perspectives offered during presentations. We thank the MalariaGEN P. falciparum Community Project and Pf3K Project for allowing access to the parasite genome data used in this study. We thank Dr Asamoah K. Kusi of the Noguchi Memorial Institute for Medical Research, Accra (NMIMR), and Dr Yaw Bediako from WACCBIP for their technical and intellectual criticisms that helped improve this piece of work.
Conflicts of Interest
None declared
References
- Neher, R.A. , et al., Genomic epidemiology of artemisinin resistant malaria. eLife 2016, 5, e08714. [Google Scholar]
- Mbacham, W.F. , et al., Efficacy of amodiaquine, sulphadoxine-pyrimethamine and their combination for the treatment of uncomplicated Plasmodium falciparum malaria in children in Cameroon at the time of policy change to artemisinin-based combination therapy. Malaria journal 2010, 9, 1. [Google Scholar] [CrossRef] [PubMed]
- Mohd Abd Razak, M.R. , et al., Genetic Diversity of Plasmodium falciparum Populations in Malaria Declining Areas of Sabah, East Malaysia. PLOS ONE 2016, 11, e0152415. [Google Scholar] [CrossRef] [PubMed]
- Smalley, M., S. Abdalla, and J. Brown, The distribution of Plasmodium falciparum in the peripheral blood and bone marrow of Gambian children. Transactions of the Royal Society of Tropical Medicine and Hygiene 1981, 75, 103–105. [CrossRef]
- Aguilar, R. , et al., Molecular evidence for the localization of Plasmodium falciparum immature gametocytes in bone marrow. Blood 2014, 123, 959–966. [Google Scholar] [CrossRef]
- Joice, R. , et al. , Plasmodium falciparum transmission stages accumulate in the human bone marrow. Science translational medicine 2014, 6, re5–re244. [Google Scholar]
- Farfour, E. , et al., The extravascular compartment of the bone marrow: a niche for Plasmodium falciparum gametocyte maturation? Malaria journal 2012, 11, 285. [Google Scholar] [CrossRef]
- Smith, T. , et al., Commitment to sexual differentiation in the human malaria parasite, Plasmodium falciparum. Parasitology 2000, 121, 127–133. [Google Scholar] [CrossRef]
- Peatey, C.L. , et al. , Effect of Antimalarial Drugs on Plasmodium falciparum Gametocytes. The Journal of Infectious Diseases 2009, 200, 1518–1521. [Google Scholar]
- Smith, R.C., J. Vega-Rodríguez, and M. Jacobs-Lorena, The Plasmodium bottleneck: malaria parasite losses in the mosquito vector. Memórias do Instituto Oswaldo Cruz 2014, 109, 644–661. [Google Scholar]
- Hill, A.V.S. , Vaccines against malaria. Philosophical transactions of the Royal Society of London. Series B, Biological sciences 2011, 366, 2806–2814. [Google Scholar] [CrossRef] [PubMed]
- Wykes, M. and M. F. Good, A case for whole-parasite malaria vaccines. International Journal for Parasitology 2007, 37, 705–12. [Google Scholar]
- Doumbo, O.K. , et al., Malaria transmission-blocking vaccines: present status and future perspectives. Towards Malaria Elimination-A Leap Forward, 2018.
- Conway, D.J. , Paths to a malaria vaccine illuminated by parasite genomics. Trends in Genetics 2015, 31, 97–107. [Google Scholar] [CrossRef]
- Amlabu, E. , et al., Functional Characterization of Plasmodium falciparum Surface Related Antigen (PfSRA) as a Potential Blood-Stage Vaccine Target. Journal of Infectious Diseases, 2018.
- Frimpong, A. , et al. , Novel strategies for malaria vaccine design. Frontiers in immunology 2018, 9, 2769. [Google Scholar]
- Krishnarjuna, B. , et al., Strain-transcending immune response generated by chimeras of the malaria vaccine candidate merozoite surface protein 2. Scientific reports 2016, 6, 20613–20613. [Google Scholar] [CrossRef]
- Garçon, N. L. Stern, and A.L. Cunningham, Understanding modern vaccines: perspectives in vaccinology. 2011: Elsevier.
- Danecek, P. , et al. , The variant call format and VCFtools. Bioinformatics 2011, 27, 2156–2158. [Google Scholar]
- Stamatakis, A. , RAxML version 8: a tool for phylogenetic analysis and post-analysis of large phylogenies. Bioinformatics 2014, 30, 1312–1313. [Google Scholar] [CrossRef]
- Pfeifer, B. , et al., PopGenome: an efficient Swiss army knife for population genomic analyses in R. Molecular biology and evolution 2014, 31, 1929–1936. [Google Scholar] [CrossRef]
- Moll, K. , et al., Methods IN Malaria Research. 2013.
- Fivelman, Q.L. , et al. , Improved synchronous production of Plasmodium falciparum gametocytes in vitro. Molecular and biochemical parasitology 2007, 154, 119–123. [Google Scholar]
- Beshir, K.B. , et al., Measuring the efficacy of anti-malarial drugs in vivo: quantitative PCR measurement of parasite clearance. Malaria journal 2010, 9, 312. [Google Scholar] [CrossRef]
- Ayanful-Torgby, R. , et al., Plasmodium falciparum genotype and gametocyte prevalence in children with uncomplicated malaria in coastal Ghana. Malaria journal 2016, 15, 592. [Google Scholar] [CrossRef] [PubMed]
- Salanti, A. , et al., Selective upregulation of a single distinctly structured var gene in chondroitin sulphate A-adhering Plasmodium falciparum involved in pregnancy-associated malaria. Molecular Microbiology 2003, 49, 179–91. [Google Scholar] [CrossRef] [PubMed]
- Heiber, A. and T. Spielmann, Preparation of parasite protein extracts and western blot analysis. Electrophoresis 2014, 115, 035–062. [Google Scholar]
- Schreiber, N. , et al., Expression of Plasmodium falciparum 3D7 STEVOR proteins for evaluation of antibody responses following malaria infections in naive infants. Parasitology 2008, 135, 155–167. [Google Scholar] [CrossRef]
- Mensah-Brown, H.E. , et al., Analysis of Erythrocyte Invasion Mechanisms of Plasmodium falciparum Clinical Isolates Across 3 Malaria-Endemic Areas in Ghana. The Journal of Infectious Diseases 2015, 212, 1288–1297. [Google Scholar] [CrossRef]
- Zanghì, G. , et al., A Specific PfEMP1 Is Expressed in P. falciparum Sporozoites and Plays a Role in Hepatocyte Infection. Cell Reports 2018, 22, 2951–2963. [Google Scholar] [CrossRef]
- López-Barragán, M.J. , et al., Directional gene expression and antisense transcripts in sexual and asexual stages of Plasmodium falciparum. BMC Genomics 2011, 12, 587. [Google Scholar] [CrossRef]
- LaCount, D.J. , et al., A protein interaction network of the malaria parasite Plasmodium falciparum. Nature 2005, 438, 103–107. [Google Scholar] [CrossRef]
- Sidik, S.M. , et al., A Genome-wide CRISPR Screen in Toxoplasma Identifies Essential Apicomplexan Genes. Cell 2016, 166, 1423–1435.e12. [Google Scholar] [CrossRef]
- Mazumdar, S. , et al., Plasmodium falciparum Merozoite Surface Protein 1 (MSP-1)-MSP-3 Chimeric Protein: Immunogenicity Determined with Human-Compatible Adjuvants and Induction of Protective Immune Response. Infection and Immunity 2010, 78, 872–883. [Google Scholar] [CrossRef]
- Kadekoppala, M. , et al., Deletion of the Plasmodium falciparum Merozoite Surface Protein 7 Gene Impairs Parasite Invasion of Erythrocytes. Eukaryotic Cell 2008, 7, 2123–2132. [Google Scholar] [CrossRef] [PubMed]
- Bousema, T. and C. Drakeley, Epidemiology and infectivity of Plasmodium falciparum and Plasmodium vivax gametocytes in relation to malaria control and elimination. Clinical Microbiology Reviews 2011, 24, 377–410. [Google Scholar] [CrossRef] [PubMed]
- Kumar, N. , Target antigens of malaria transmission blocking immunity exist as a stable membrane bound complex. Parasite immunology 1987, 9, 321–335. [Google Scholar] [CrossRef]
- Rener, J. , et al., Target antigens of transmission-blocking immunity on gametes of Plasmodium falciparum. Journal of Experimental Medicine 1983, 158, 976–81. [Google Scholar] [CrossRef]
- Quakyi, I.A. , et al., The 230-kDa gamete surface protein of Plasmodium falciparum is also a target for transmission-blocking antibodies. The Journal of Immunology 1987, 139, 4213–4217. [Google Scholar] [CrossRef]
- Graves, P.M. , et al., Naturally occurring antibodies to an epitope on Plasmodium falciparum gametes detected by monoclonal antibody-based competitive enzyme-linked immunosorbent assay. Infection and immunity 1988, 56, 2818–2821. [Google Scholar] [CrossRef]
- Kapulu, M. , et al., Comparative assessment of transmission-blocking vaccine candidates against Plasmodium falciparum. Scientific reports 2015, 5, 11193. [Google Scholar] [CrossRef]
- Gebru, T. , et al., Recognition of Plasmodium falciparum mature gametocyte-infected erythrocytes by antibodies of semi-immune adults and malaria-exposed children from Gabon. Malaria journal 2017, 16, 176. [Google Scholar] [CrossRef]
- van der Kolk, M., S. J. de Vlas, and R.W. Sauerwein, Reduction and enhancement of Plasmodium falciparum transmission by endemic human sera. International journal for parasitology 2006, 36, 1091–1095. [Google Scholar]
- Bousema, T. , et al., Revisiting the circulation time of Plasmodium falciparum gametocytes: molecular detection methods to estimate the duration of gametocyte carriage and the effect of gametocytocidal drugs. Malaria journal 2010, 9, 136. [Google Scholar] [CrossRef]
- Bousema, T. , et al., Human immune responses that reduce the transmission of Plasmodium falciparum in African populations. International Journal for Parasitology 2011, 41, 293–300. [Google Scholar] [CrossRef] [PubMed]
- Benavente, E.D. , et al. Global genetic diversity of var2csa in Plasmodium falciparum with implications for malaria in pregnancy and vaccine development. Scientific Reports 2018, 8, 15429. [Google Scholar] [CrossRef] [PubMed]
- Mohamed, N.S. , et al., Genetic polymorphism of the N-terminal region in circumsporozoite surface protein of Plasmodium falciparum field isolates from Sudan. Malaria Journal 2019, 18, 333. [Google Scholar] [CrossRef] [PubMed]
- Pringle, J.C. , et al., RTS,S/AS01 malaria vaccine mismatch observed among Plasmodium falciparum isolates from southern and central Africa and globally. Scientific Reports 2018, 8, 6622. [Google Scholar] [CrossRef]
- Niang, M. , et al., STEVOR is a Plasmodium falciparum erythrocyte binding protein that mediates merozoite invasion and rosetting. Cell Host & Microbe 2014, 16, 81–93. [Google Scholar]
- Tawk, L. , et al., A key role for Plasmodium subtilisin-like SUB1 protease in egress of malaria parasites from host hepatocytes. The Journal of biological chemistry 2013, 288, 33336–33346. [Google Scholar] [CrossRef]
- Li, H., M.A. Child, and M. Bogyo, Proteases as regulators of pathogenesis: examples from the Apicomplexa. Biochimica et biophysica acta 2012, 1824, 177–185. [CrossRef]
- Blackman, M.J. , Proteases in host cell invasion by the malaria parasite. Cellular Microbiology 2004, 6, 893–903. [Google Scholar] [CrossRef]
- Bustamante, L.Y., et al., Synergistic malaria vaccine combinations identified by systematic antigen screening. Proceedings of the National Academy of Sciences of the United States of America 2017, 114, 12045–12050.
- Chauhan, V.S., S. S. Yazdani, and D. Gaur, Malaria vaccine development based on merozoite surface proteins of Plasmodium falciparum. Human Vaccines 2010, 6, 757–762. [Google Scholar] [CrossRef]
- McCarthy, J.S. , et al., A phase 1 trial of MSP2-C1, a blood-stage malaria vaccine containing 2 isoforms of MSP2 formulated with Montanide® ISA 720. PLoS One 2011, 6, e24413. [Google Scholar] [CrossRef] [PubMed]
- Blank, A. , et al., Immunization with full-length Plasmodium falciparum merozoite surface protein 1 is safe and elicits functional cytophilic antibodies in a randomized first-in-human trial. npj Vaccines 2020, 5, 10. [Google Scholar] [CrossRef] [PubMed]
- Dery, D.B. , et al., Patterns and seasonality of malaria transmission in the forest-savannah transitional zones of Ghana. Malaria journal 2010, 9, 314–314. [Google Scholar] [CrossRef]
- Owusu-Agyei, S. , et al., Epidemiology of malaria in the forest-savanna transitional zone of Ghana. Malaria Journal 2009, 8, 220. [Google Scholar] [CrossRef]
- Kweku, M. , et al., Seasonal intermittent preventive treatment for the prevention of anaemia and malaria in Ghanaian children: a randomized, placebo controlled trial. PLoS One 2008, 3, e4000. [Google Scholar] [CrossRef]
- Baffoe-Wilmot, A., et al., Malaria vector studies in two ecological zones in southern Ghana. African Entomology 2001, 9, 59–65.
- Amlabu, E. , et al. Molecular Characterization and Immuno-Reactivity Patterns of a Novel Plasmodium falciparum Armadillo-Type Repeat Protein, PfATRP. Frontiers in Cellular and Infection Microbiology 2020, 10, 114. [Google Scholar] [CrossRef]
- Mensah-Brown, H.E. , et al., Antibody Reactivity to Merozoite Antigens in Ghanaian Adults Correlates With Growth Inhibitory Activity Against Plasmodium falciparum in Culture. Open Forum Infectious Diseases 2019, 6. [Google Scholar] [CrossRef]
- Ademolue, T.W. , et al., Patterns of inflammatory responses and parasite tolerance vary with malaria transmission intensity. Malaria journal 2017, 16, 145. [Google Scholar] [CrossRef]
- Graves, P.M. , et al., Antibodies to Plasmodium falciparum gamete surface antigens in Papua New Guinea sera. Parasite immunology 1988, 10, 209–18. [Google Scholar] [CrossRef]
- Partey, F.D. , et al., Kinetics of antibody responses to PfRH5-complex antigens in Ghanaian children with Plasmodium falciparum malaria. PloS one 2018, 13, e0198371–e0198371. [Google Scholar] [CrossRef] [PubMed]
- Yman, V. , et al., Antibody responses to merozoite antigens after natural Plasmodium falciparum infection: kinetics and longevity in absence of re-exposure. BMC Medicine 2019, 17, 22. [Google Scholar] [CrossRef] [PubMed]
- Weiss, G.E. , et al., The Plasmodium falciparum-Specific Human Memory B Cell Compartment Expands Gradually with Repeated Malaria Infections. PLOS Pathogens 2010, 6, e1000912. [Google Scholar] [CrossRef] [PubMed]
- Kinyanjui, S.M. , et al., IgG antibody responses to Plasmodium falciparum merozoite antigens in Kenyan children have a short half-life. Malaria journal 2007, 6, 82. [Google Scholar] [CrossRef] [PubMed]
Figure 1.
Heatmap and Principal Component Analysis (PCA) scatter plot summarizing the genetic diversity per geographical location of P. falciparum subtilisin-like domain containing protein (pfsdp, Pf3D7_1105800) gene. A) Gene sequences were aligned using Mafft_auto and used for sequential and parallel maximum likelihood-based inference of phylogenetic trees which was finally used for the generation of phylogenetic trees and heatmaps in the R-software. B) Allele counts (frequencies) were extracted from the VCF, cleaned, and then used to perform the PCA. Estimates of selection indices were calculated. The departure from neutrality was more pronounced in Africa than in SEA. Squares at the centre of ellipses represent the different countries. The data used was from 12 countries: 7 in Africa (Congo, Nigeria, Malawi, Mali, Ghana, Senegal and Guinea) and 5 in South-East Asia (Laos, Vietnam, Bangladesh, Cambodia and Thailand) [PFK3 release 1]. a = significant, b =non-significant.
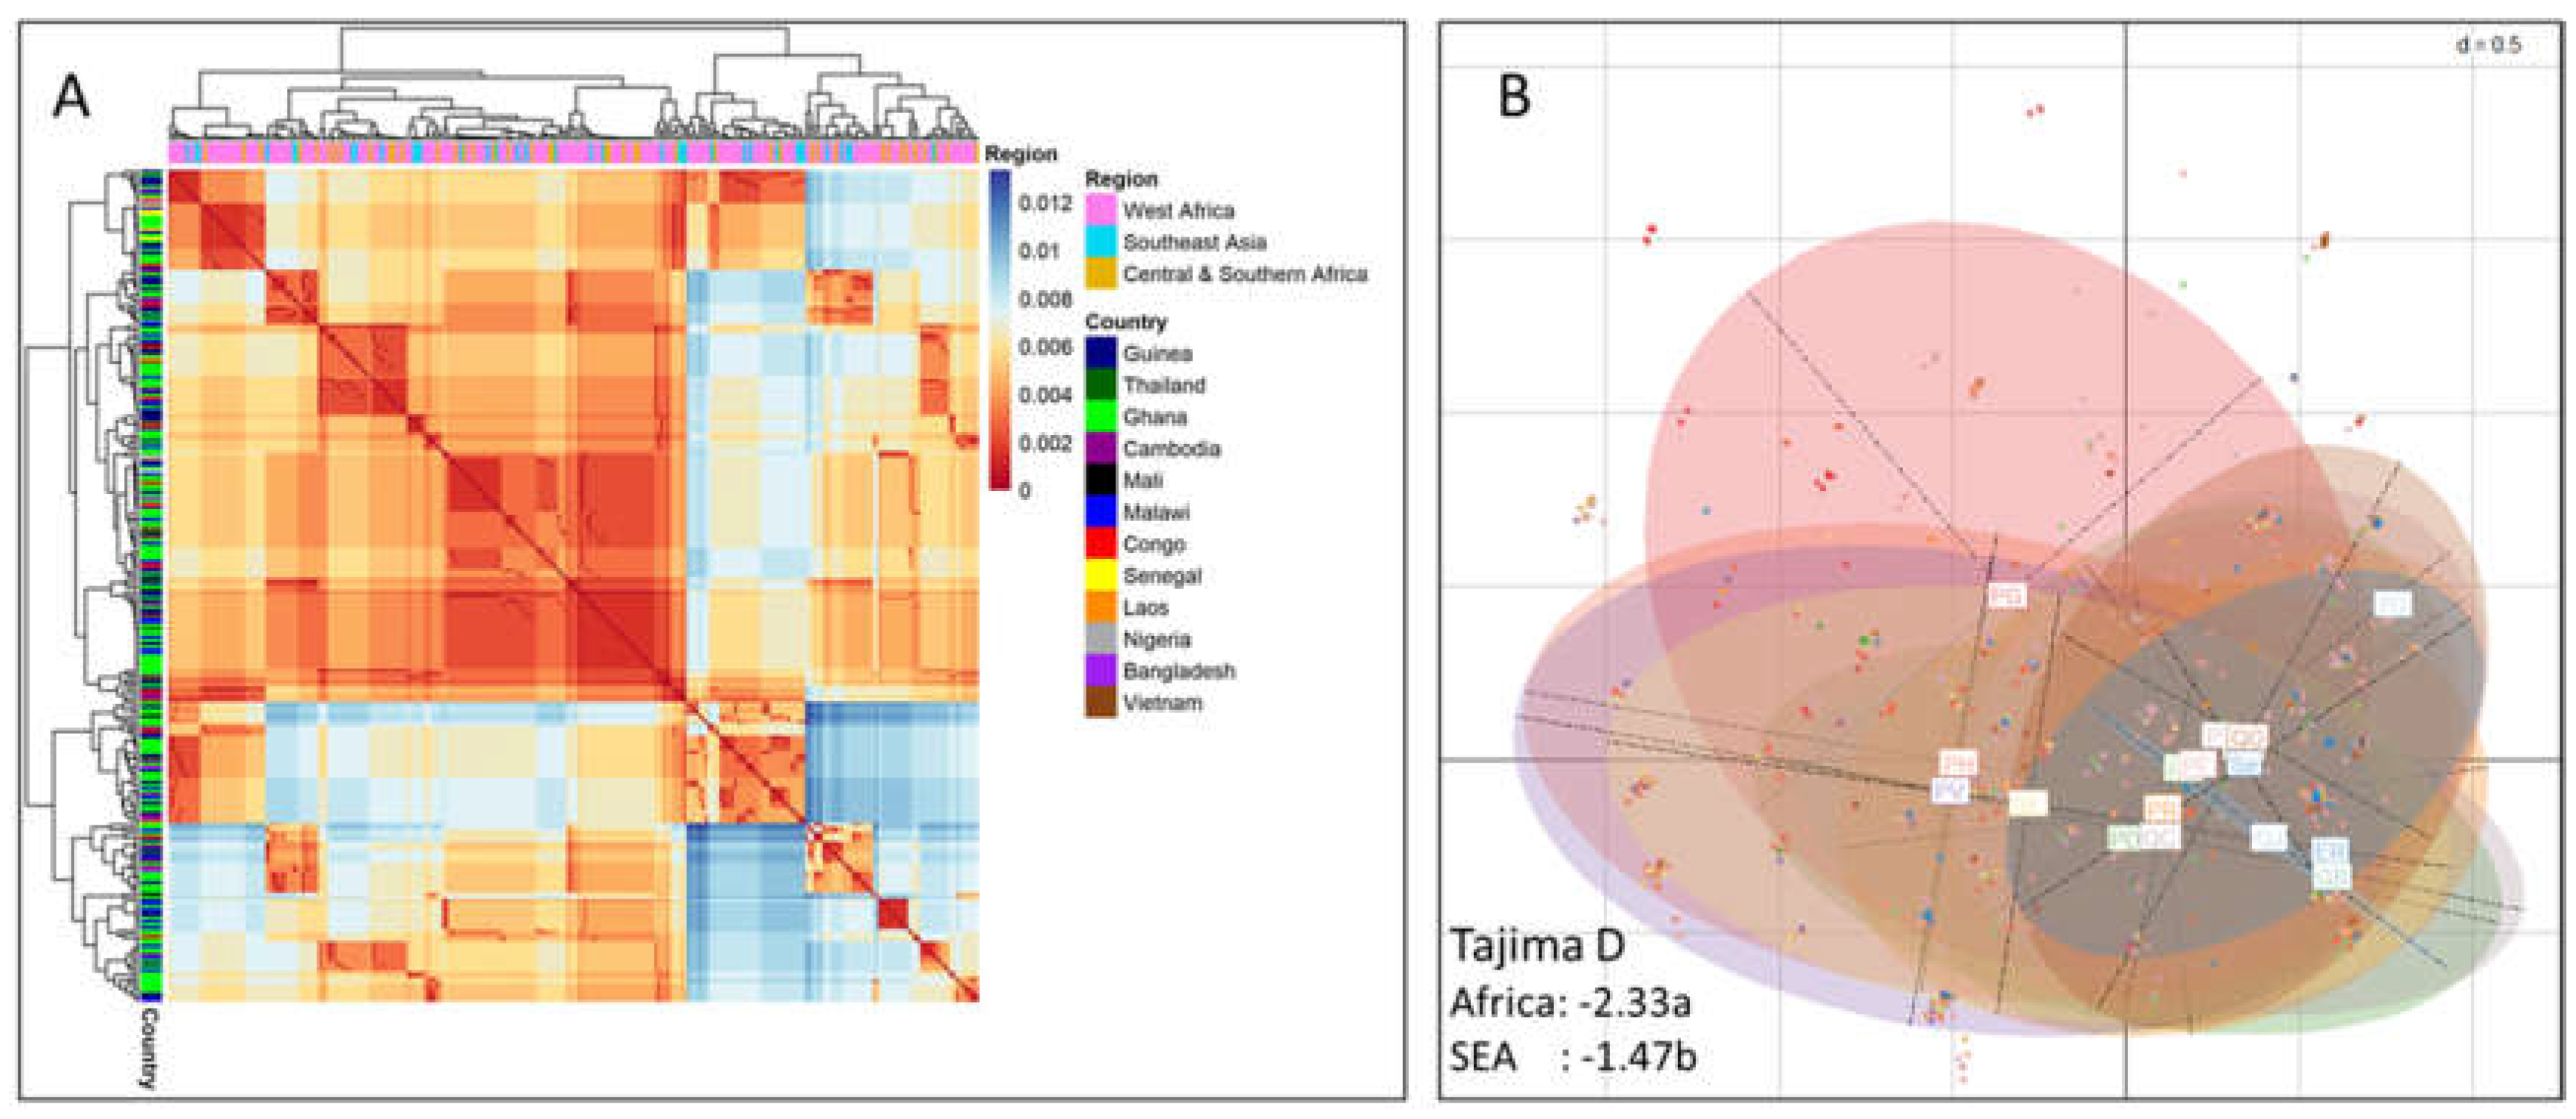
Figure 2.
Assessment of pfsdp (Pf3D7_1105800) expression in clinical isolates (FI). Differential expression of the pfsdp gene was consistent with observations in laboratory strains (PlasmoDB). The gene had cross-stage expression as shown by RT-qPCR using cultivated field isolated parasites in comparison with NF54 lab strain as control. Pfs25, a gametocyte-specific was used as a positive control to ascertain the purity of the samples, was upregulated in late gametocytes with very low expression in asexual stages.
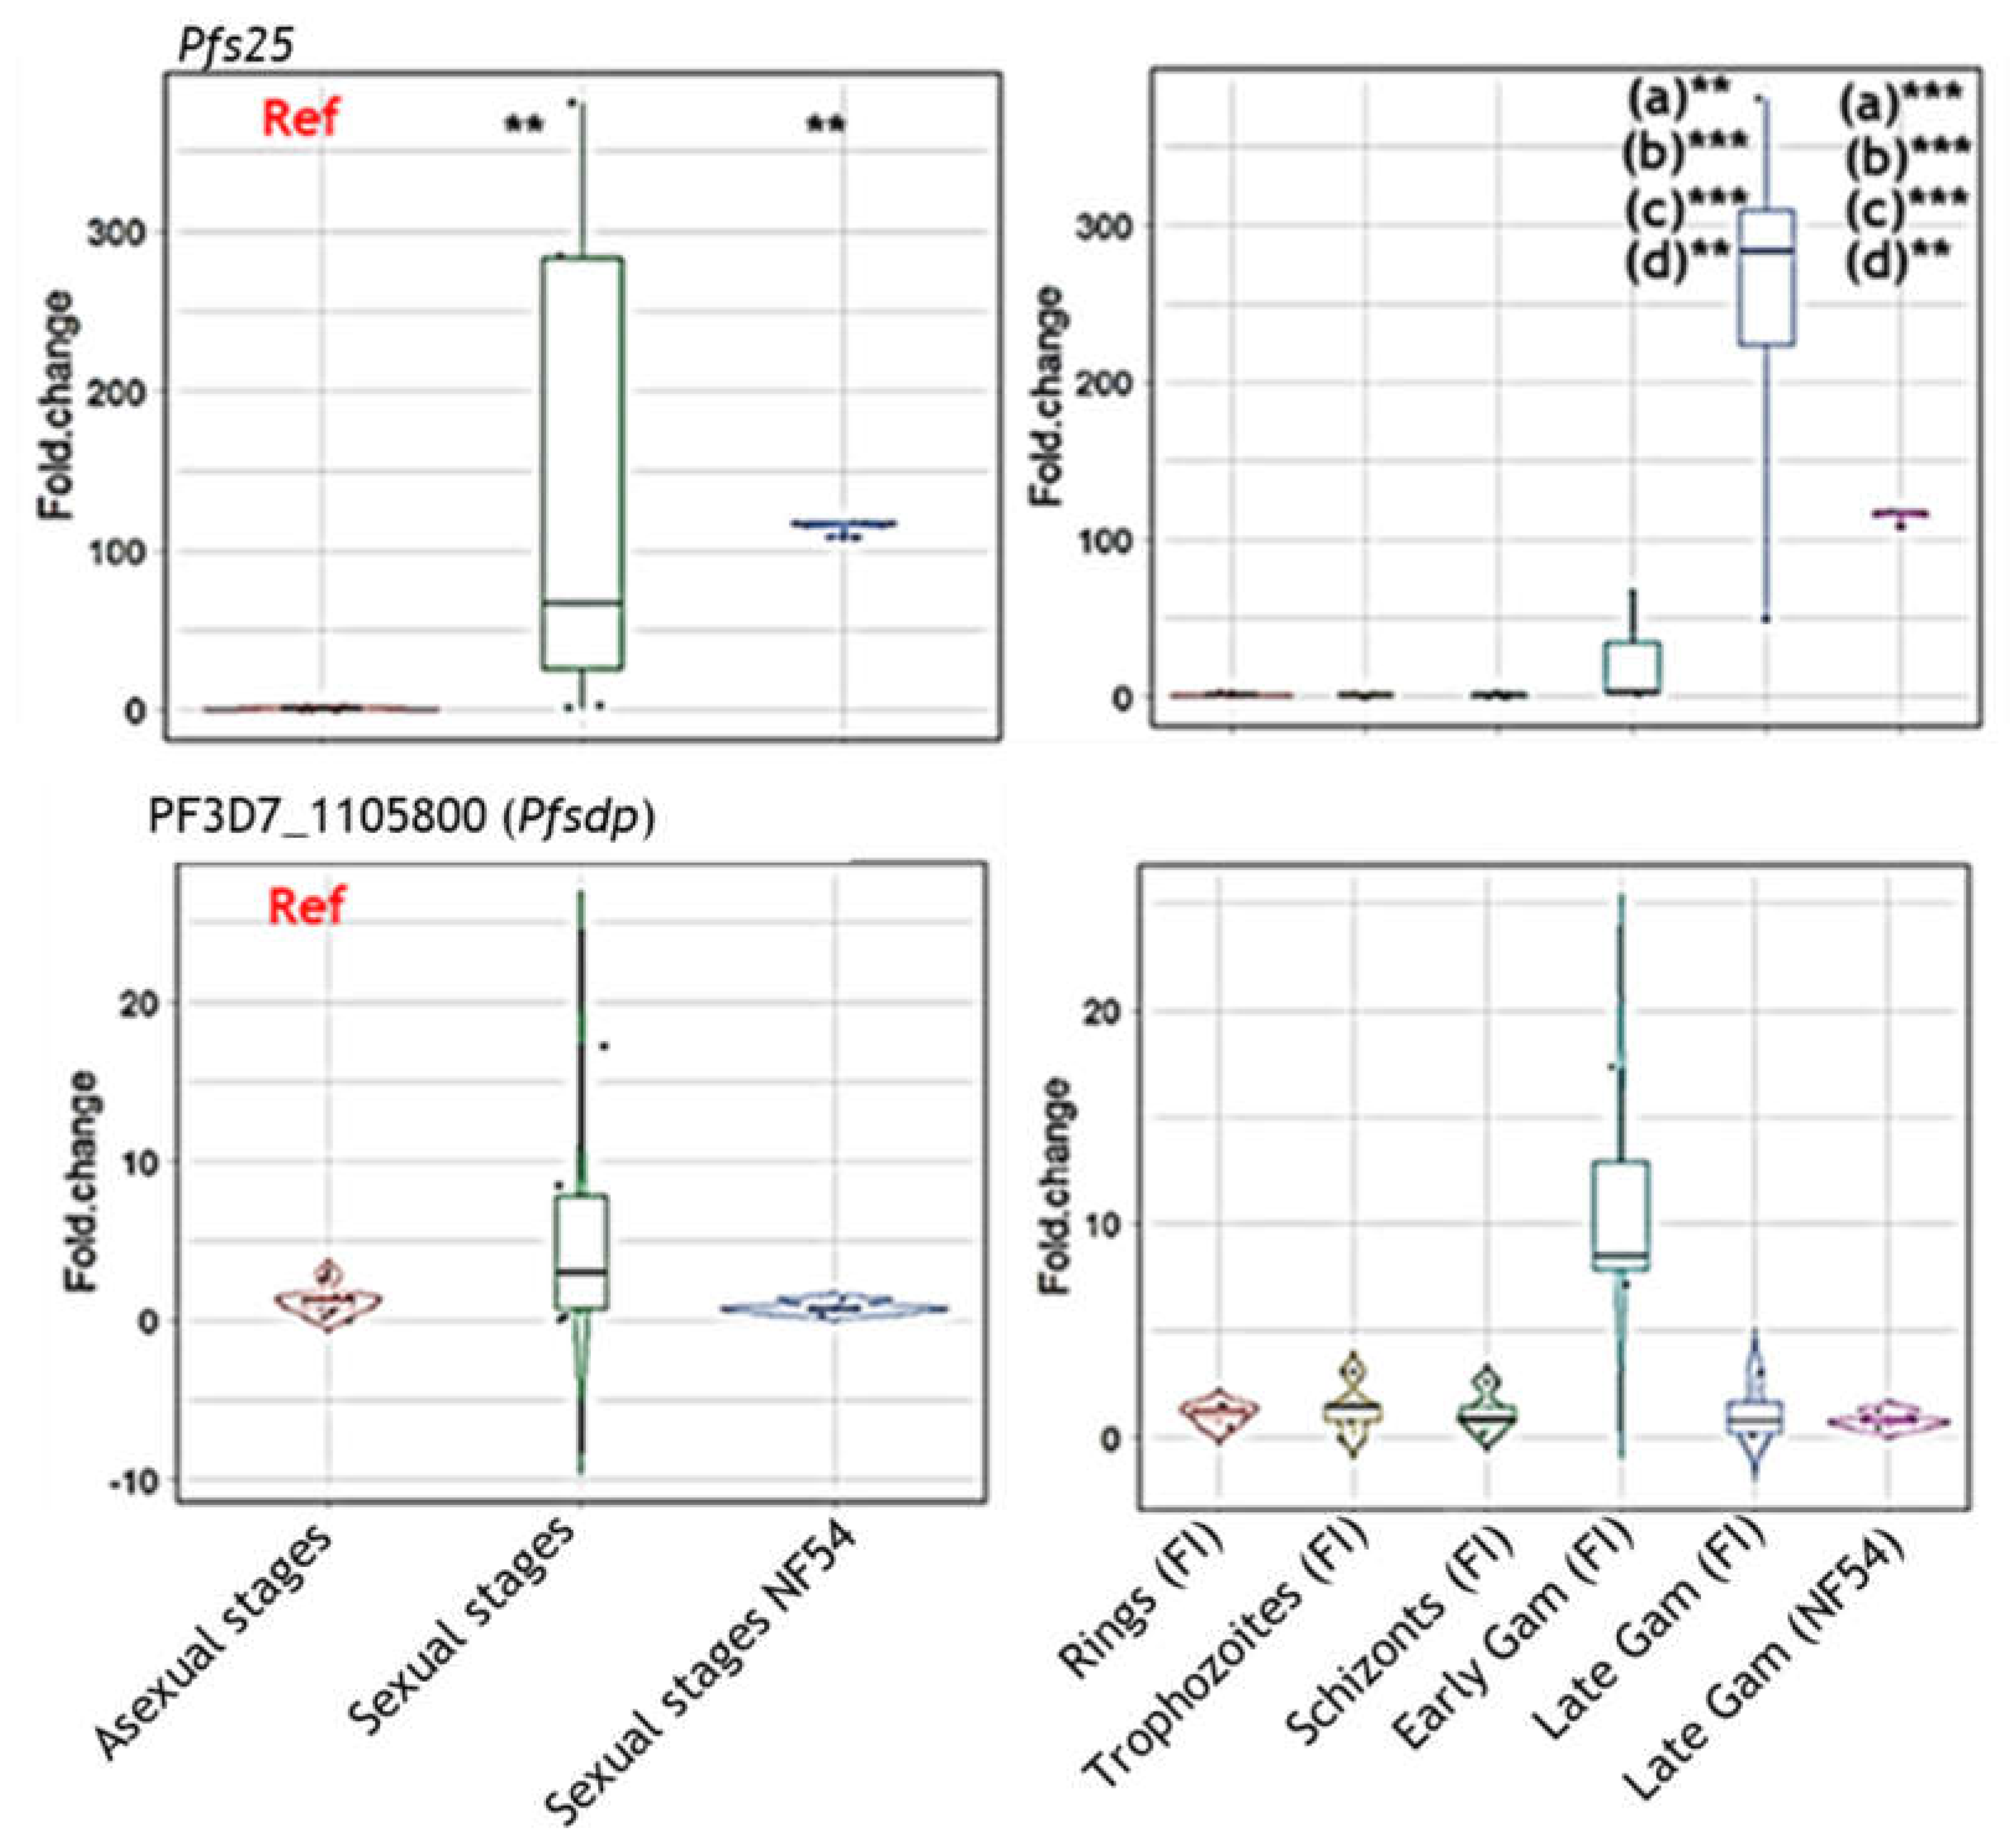
Figure 3.
Assessment of PfSDP (Pf3D7_1105800) protein 3D structure prediction and expression. A) Topographical representation of the different domains of the PfSDP protein. B) Predicted 3-dimensional structure. Structure prediction was performed using I-TASSER and visualized in PyMol. Topographical representation was generated using information from I-TASSER and Eukaryotic linear domain (ELM) resources. C, D & E) Immunoblots with lysates derived from different developmental stages (rings (R), trophozoites (T), schizonts (S), early (EG) and late (LG) gametocytes) of P falciparum. PfSDP proteins are expressed in both asexual and sexual developmental stages and might be dimeric in nature. Lysates were subjected to SDS-PAGE followed by transfer of proteins to a nitrocellulose membrane and immunostaining. Antibodies against short peptides derived PfSDP proteins were used as primary antibodies. Asexual stages were produced by synchronizing the culture at 10% parasitaemia and harvesting them at different time points post-incubation or invasion; 8hrs, 30hrs and 46 hours for rings, trophozoites and schizonts respectively. Gametocytes on the other hand were collected on day 6 (early gametocytes) and day 12 (late gametocytes) post-induction using a percoll gradient. M: Molecular weight markers; GM: Ghost membrane, Rpr: recombinant protein, blue arrow: monomer, green arrow: Potential processed or interacting proteins, orange arrow: Dimer. 3.5 PfSDP colocalized with MSP-1, partially with Pfs45/48 and Peptide-specific antibodies showed mild impacts on merozoites invasion in a concentration-dependent manner.
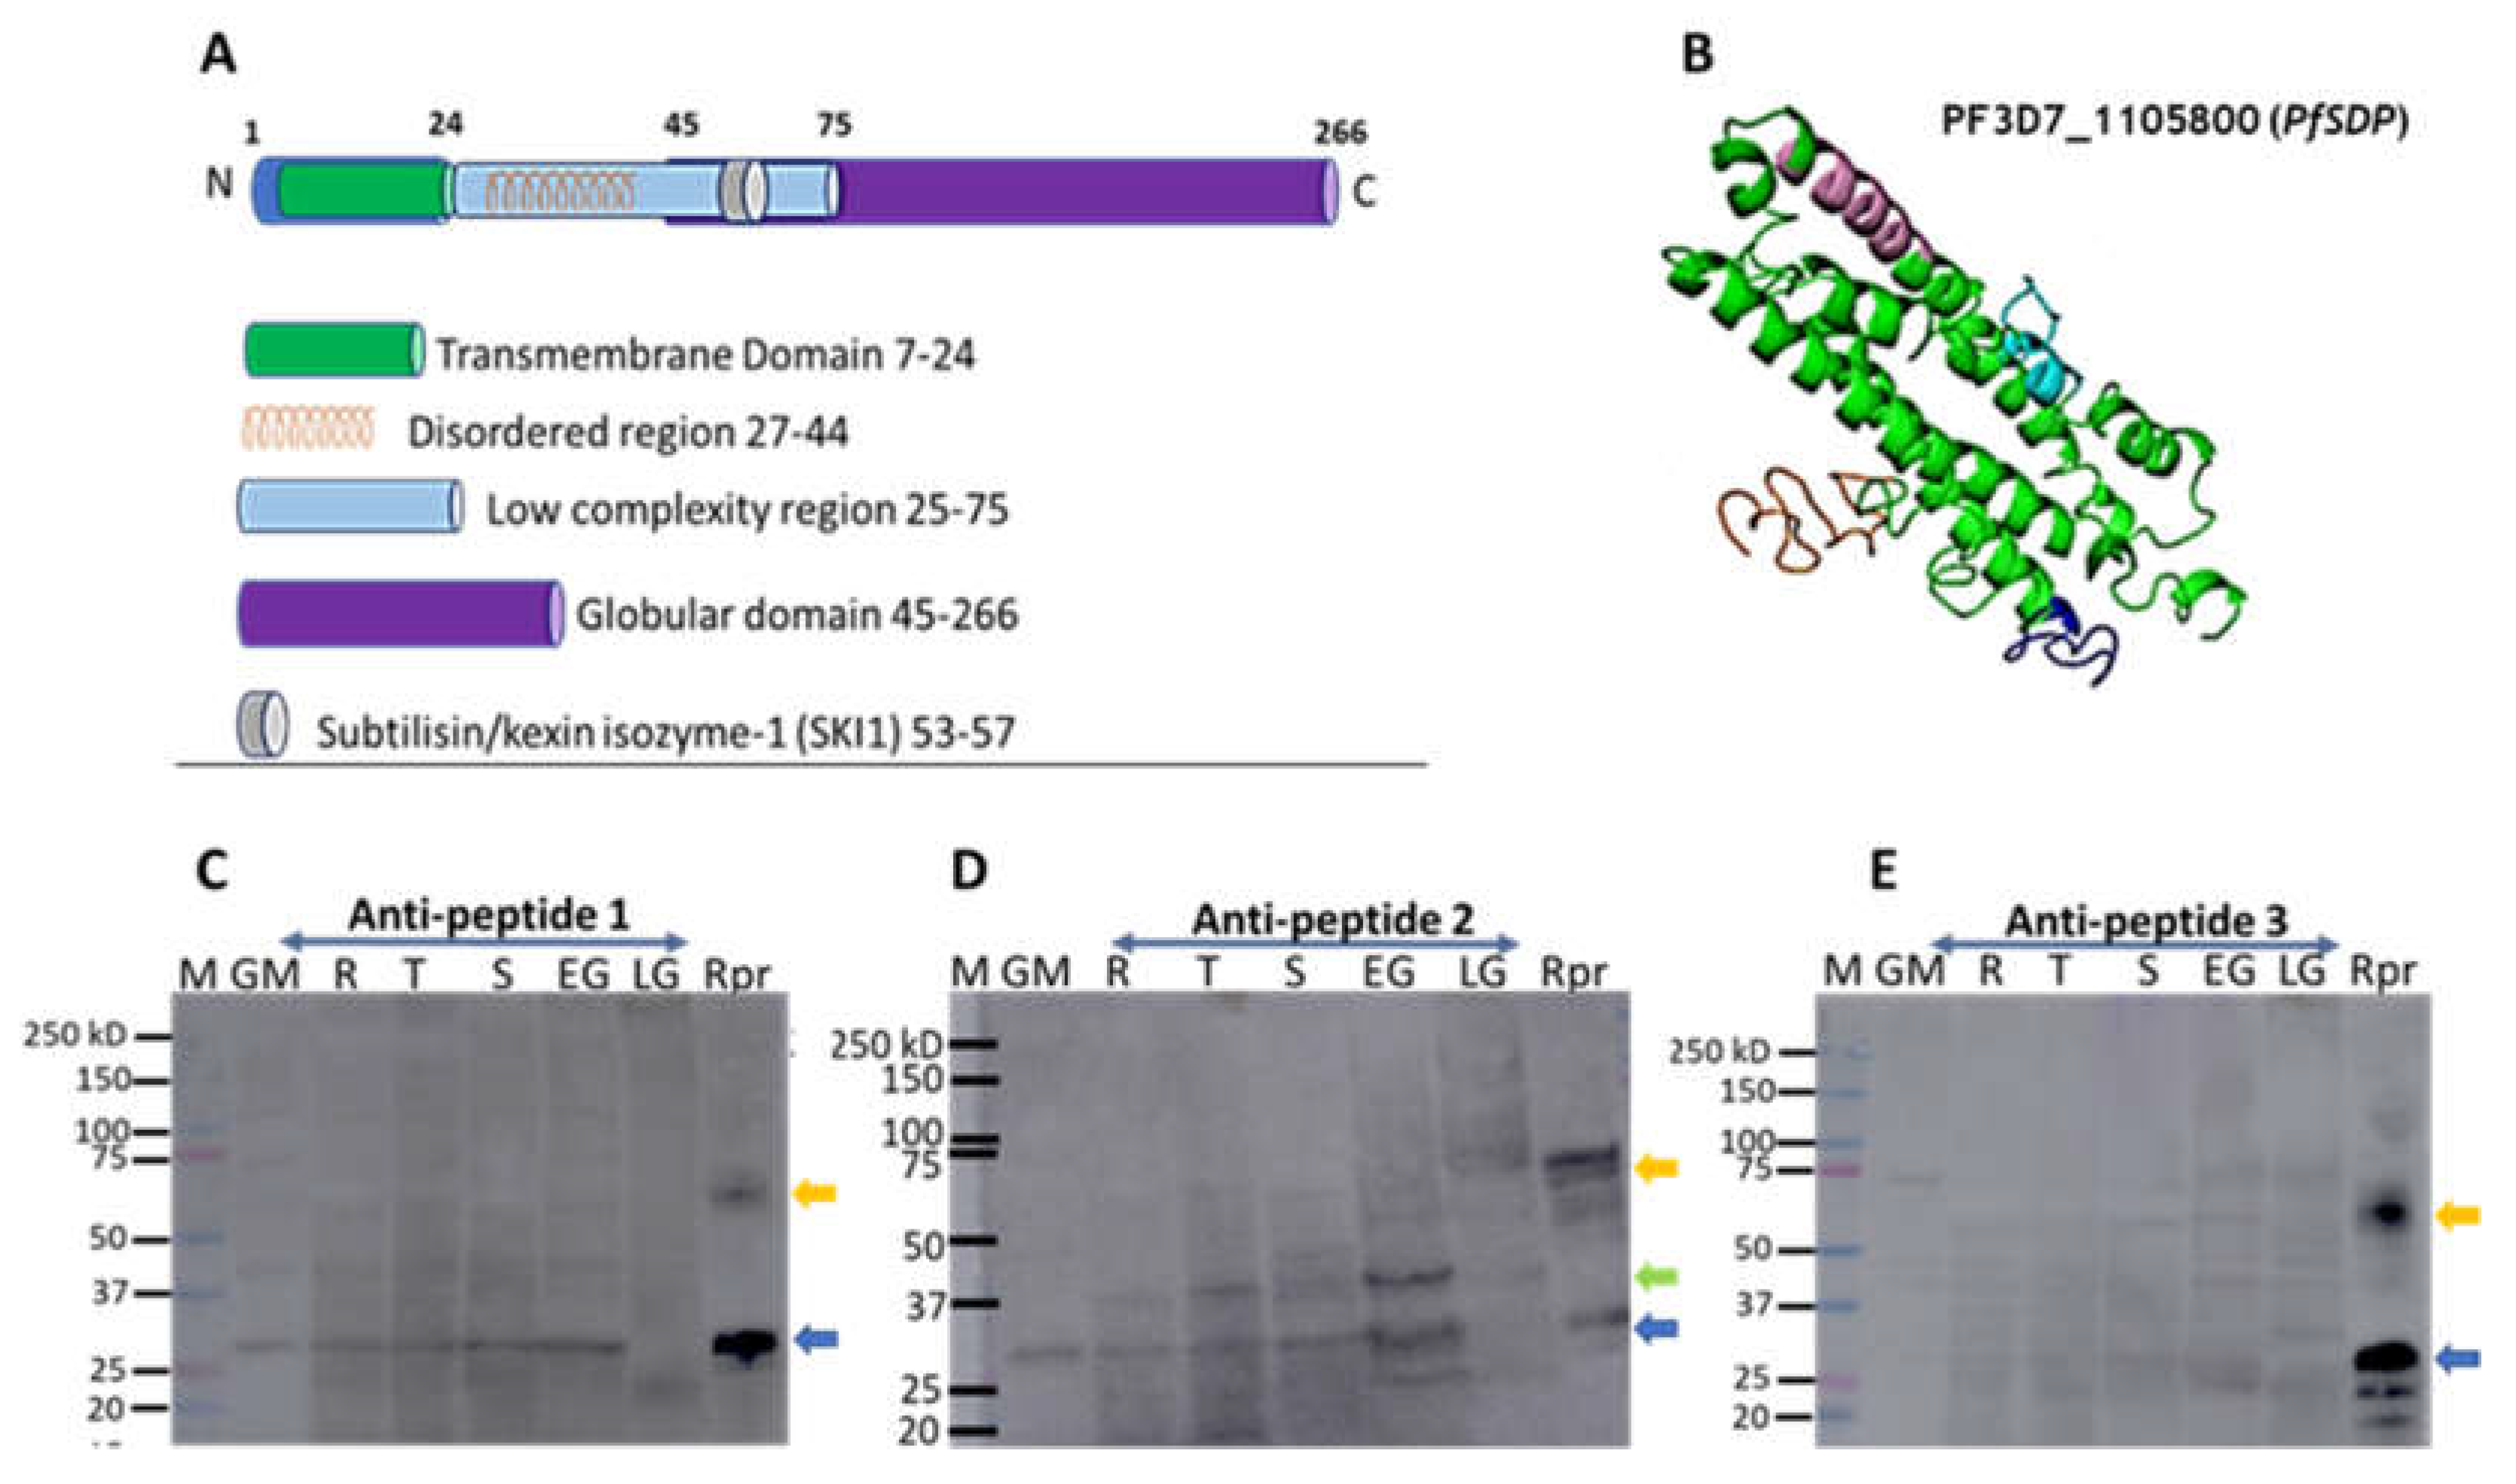
Figure 4.
Asexual stage parasite localization of the native PfSDP (Pf3D7_1105800) protein and Growth inhibition assays. A) Immunofluorescence assays (IFAs). Parasites were co-stained with anti-PF3D7_1105800 (anti-PfSDP) anti-Peptide-1 antibodies and a merozoite surface (MSP-1) marker. Secondary antibodies used were Alexa Fluor 488–conjugated goat α-mouse immunoglobulin G (IgG) for PfSDP (green) and Alexa Fluor 568-conjugated goat α-rabbit IgG for the markers MSP-1). Parasite nuclei were stained with DAPI (blue). The differential interference contrast (DIC) and merged images are shown. B) Growth inhibition assays (GIA) with antibodies raised in rabbit against PfSDP-specific B cell epitopes (short peptides: PfSDP-1, PfSDP-2 & PfSDP-3). All three peptide-specific antibodies inhibited red blood cell invasion in a concentration-dependent manner. A clinical isolate parasite line MISA031 and Lab strain 3D7 were cultured with different concentrations of antibodies. rabbit pre-immune (PI) serum was used as a negative control. parasitemia was determined by flow cytometry Two independent assays were carried out in duplicates. The error bars represent the standard errors of the means.
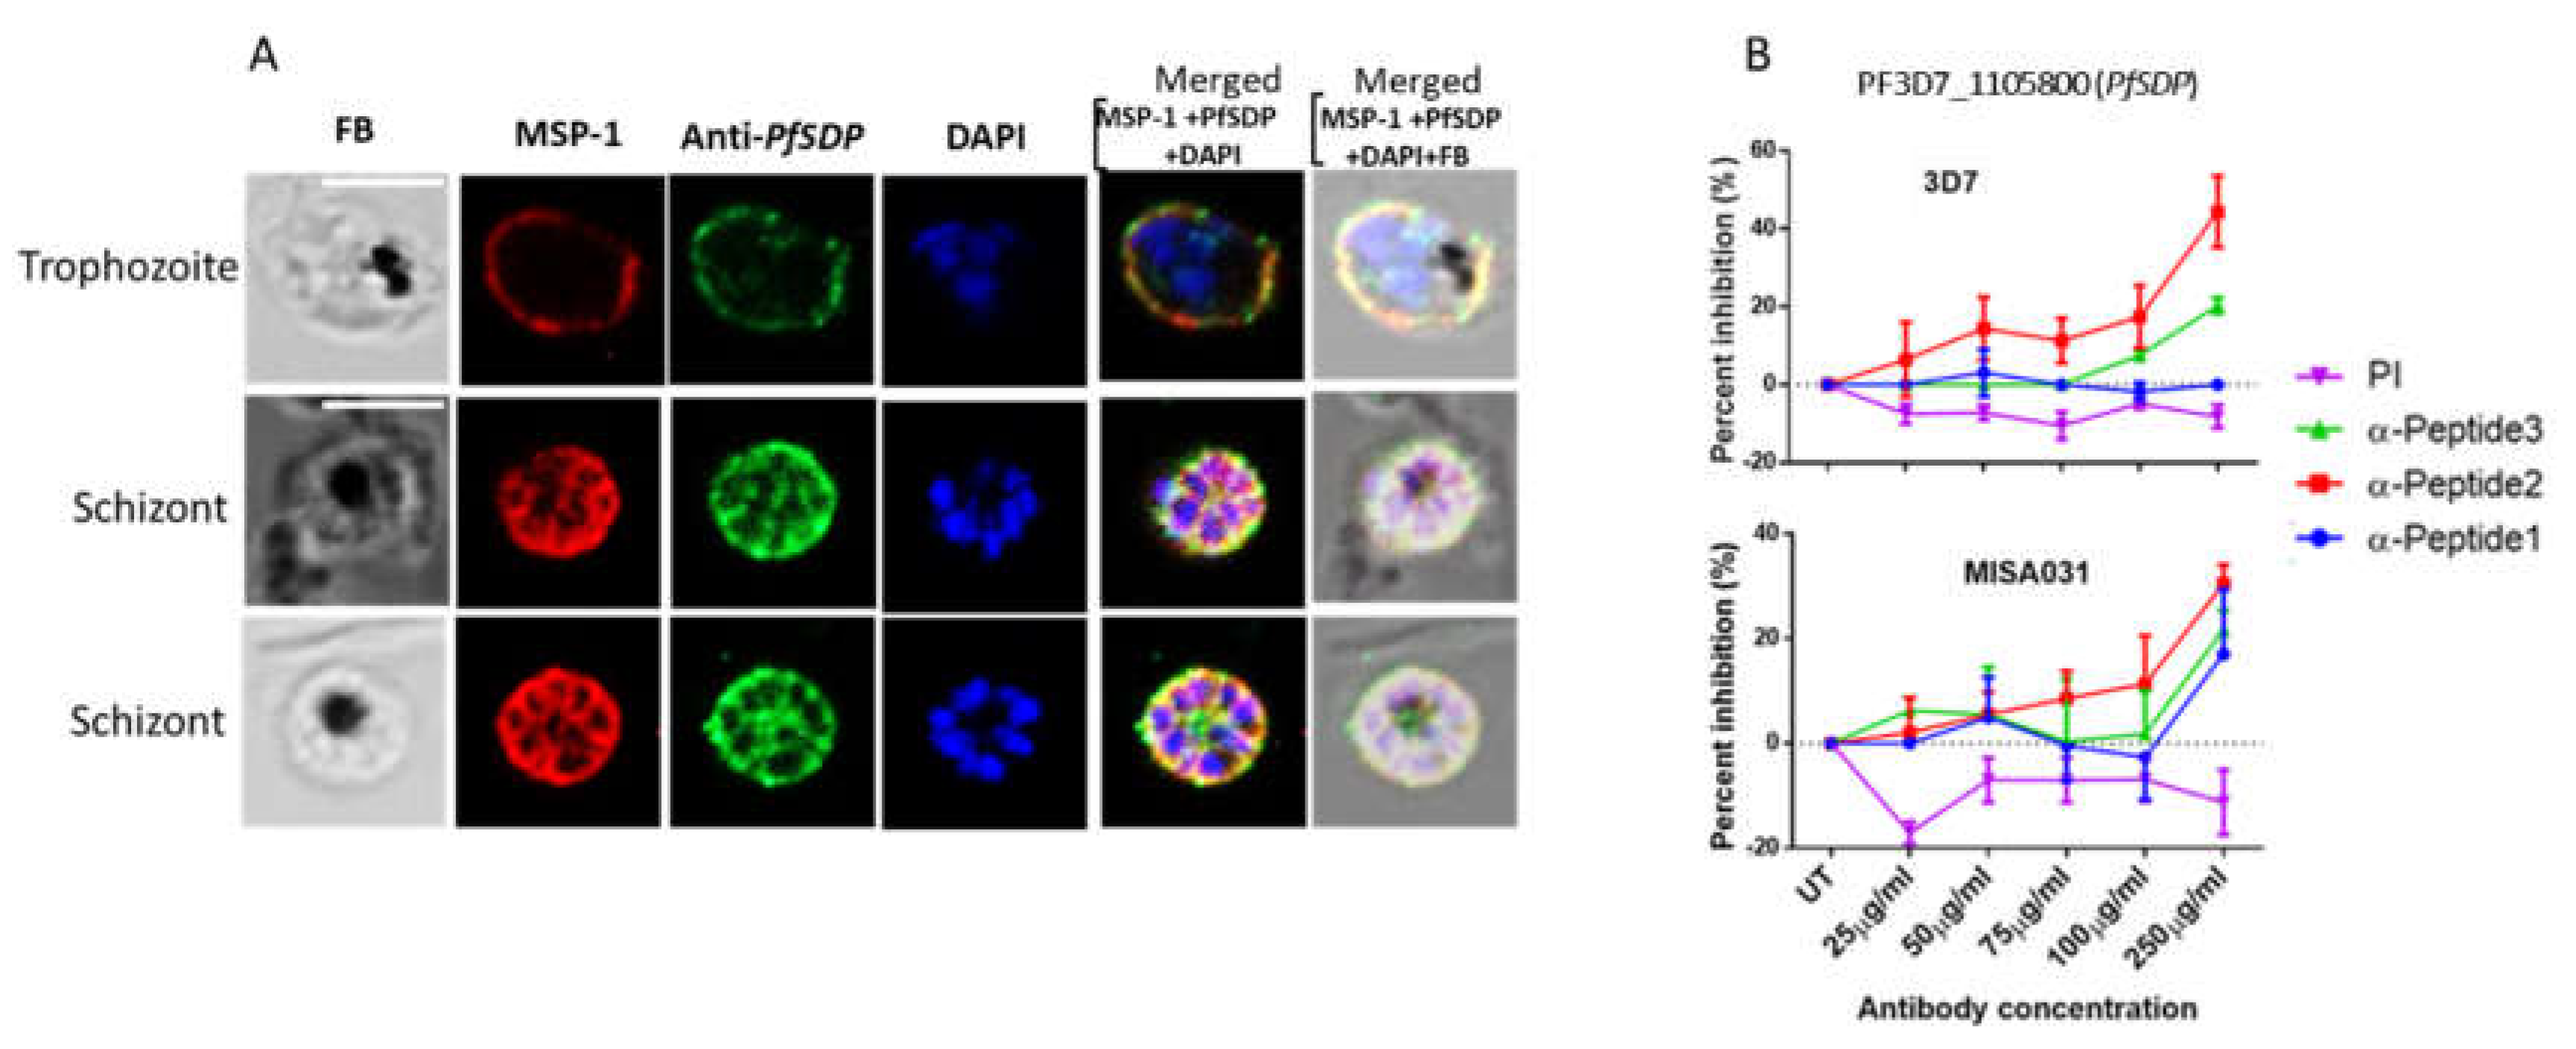
Figure 5.
Sexual stage parasite localization of the native PfSDP (Pf3D7_1105800) protein using IFA. Gametocytes were co-stained with anti-PF3D7_1105800 (anti-PFSDP) antibodies and gametocyte surface (Pfs48/45) markers. Secondary antibodies used were Alexa Fluor 488–conjugated goat α-mouse immunoglobulin G (IgG) for PfSDP (green) and Alexa Fluor 568-conjugated goat α-rabbit IgG for the markers MSP-1 & Pfs48/45 (red). Parasite nuclei were stained with DAPI (blue). The differential interference contrast (DIC) and merged images are shown.
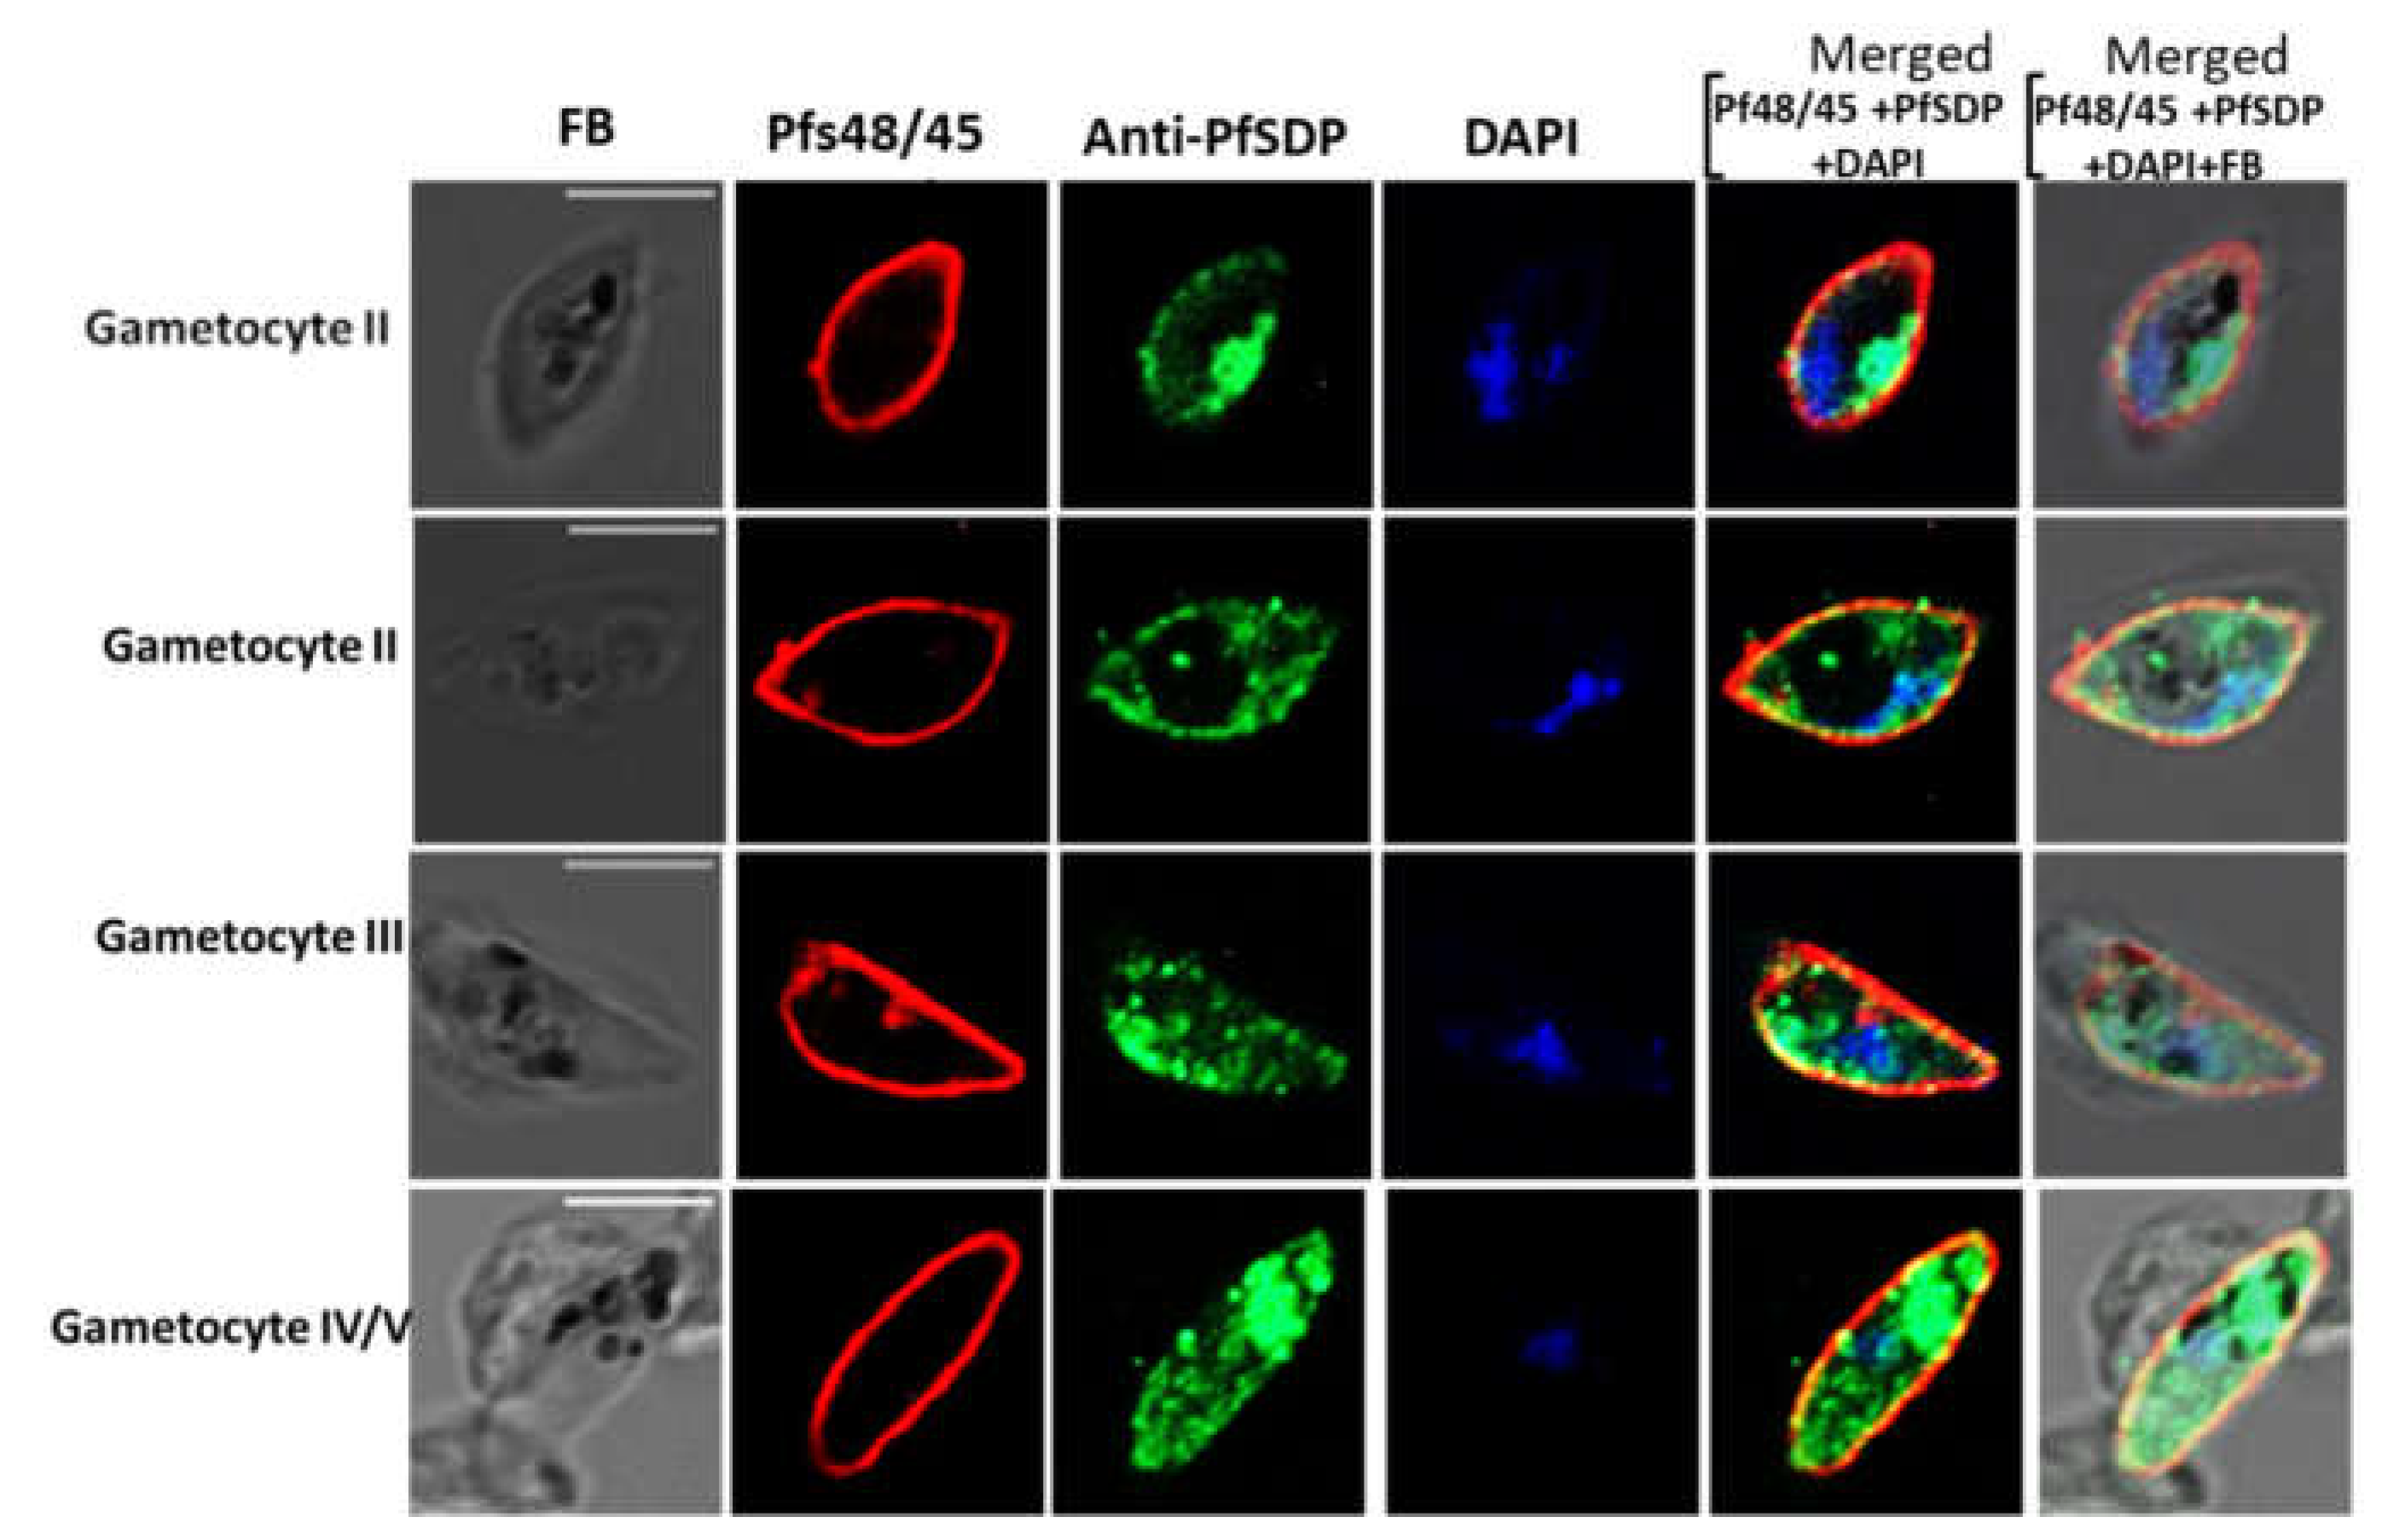
Figure 6.
Production of recombinant PfSDP (Pf3D7_1105800) and reactivity to naturally acquired antibodies. A) The crude extracts of IPTG-induced (I) and un-induced (UI) E. Coli cultures were subjected to SDS-PAGE and stained with Coomassie Brilliant Blue (CBB). The target band of about 29 kDa was detected as the dominant species in the induced sample. B) CBB stain after size exclusion chromatography C). Western blot with anti-Histidine HRP-conjugated antibodies (1:10000). D & E) Naturally acquired antibodies recognised PfSDP recombinant proteins; Western blot using plasma from malaria-infected patients (D) Dot blots with plasma from malaria-infected and non-infected patients (E). For dot blot, 10µL of the recombinant protein at the indicated concentrations (5, 10 and 15µg/mL) were applied onto a nitrocellulose membrane. F) Seropositivity of malaria exposed children and adults to the PfSDP recombinant protein in different endemic areas. A study participant was considered seropositive when his/her Day 0 antibody level was greater than the cut off value (----). Cut-off = mean antibody level of the naive European plasma + 3SD. G) Immunogenicity levels across sites of contrasting endemicities; Accra (n= 45), Ho (n=155), Kintampo (n=92). Navrongo (n=155 (106 children and 49 Adults)). Accra & Ho are low endemic areas while Kitampo & Navrongo are high endemic areas. P value code: ns: p > 0.05. *: p ≤ 0.05, **: p ≤ 0.01, ***: p ≤ 0.001, ****: p ≤ 0.0001. IPTG: Isopropyl β-D-1-thiogalactopyranoside, M: molecular marker.
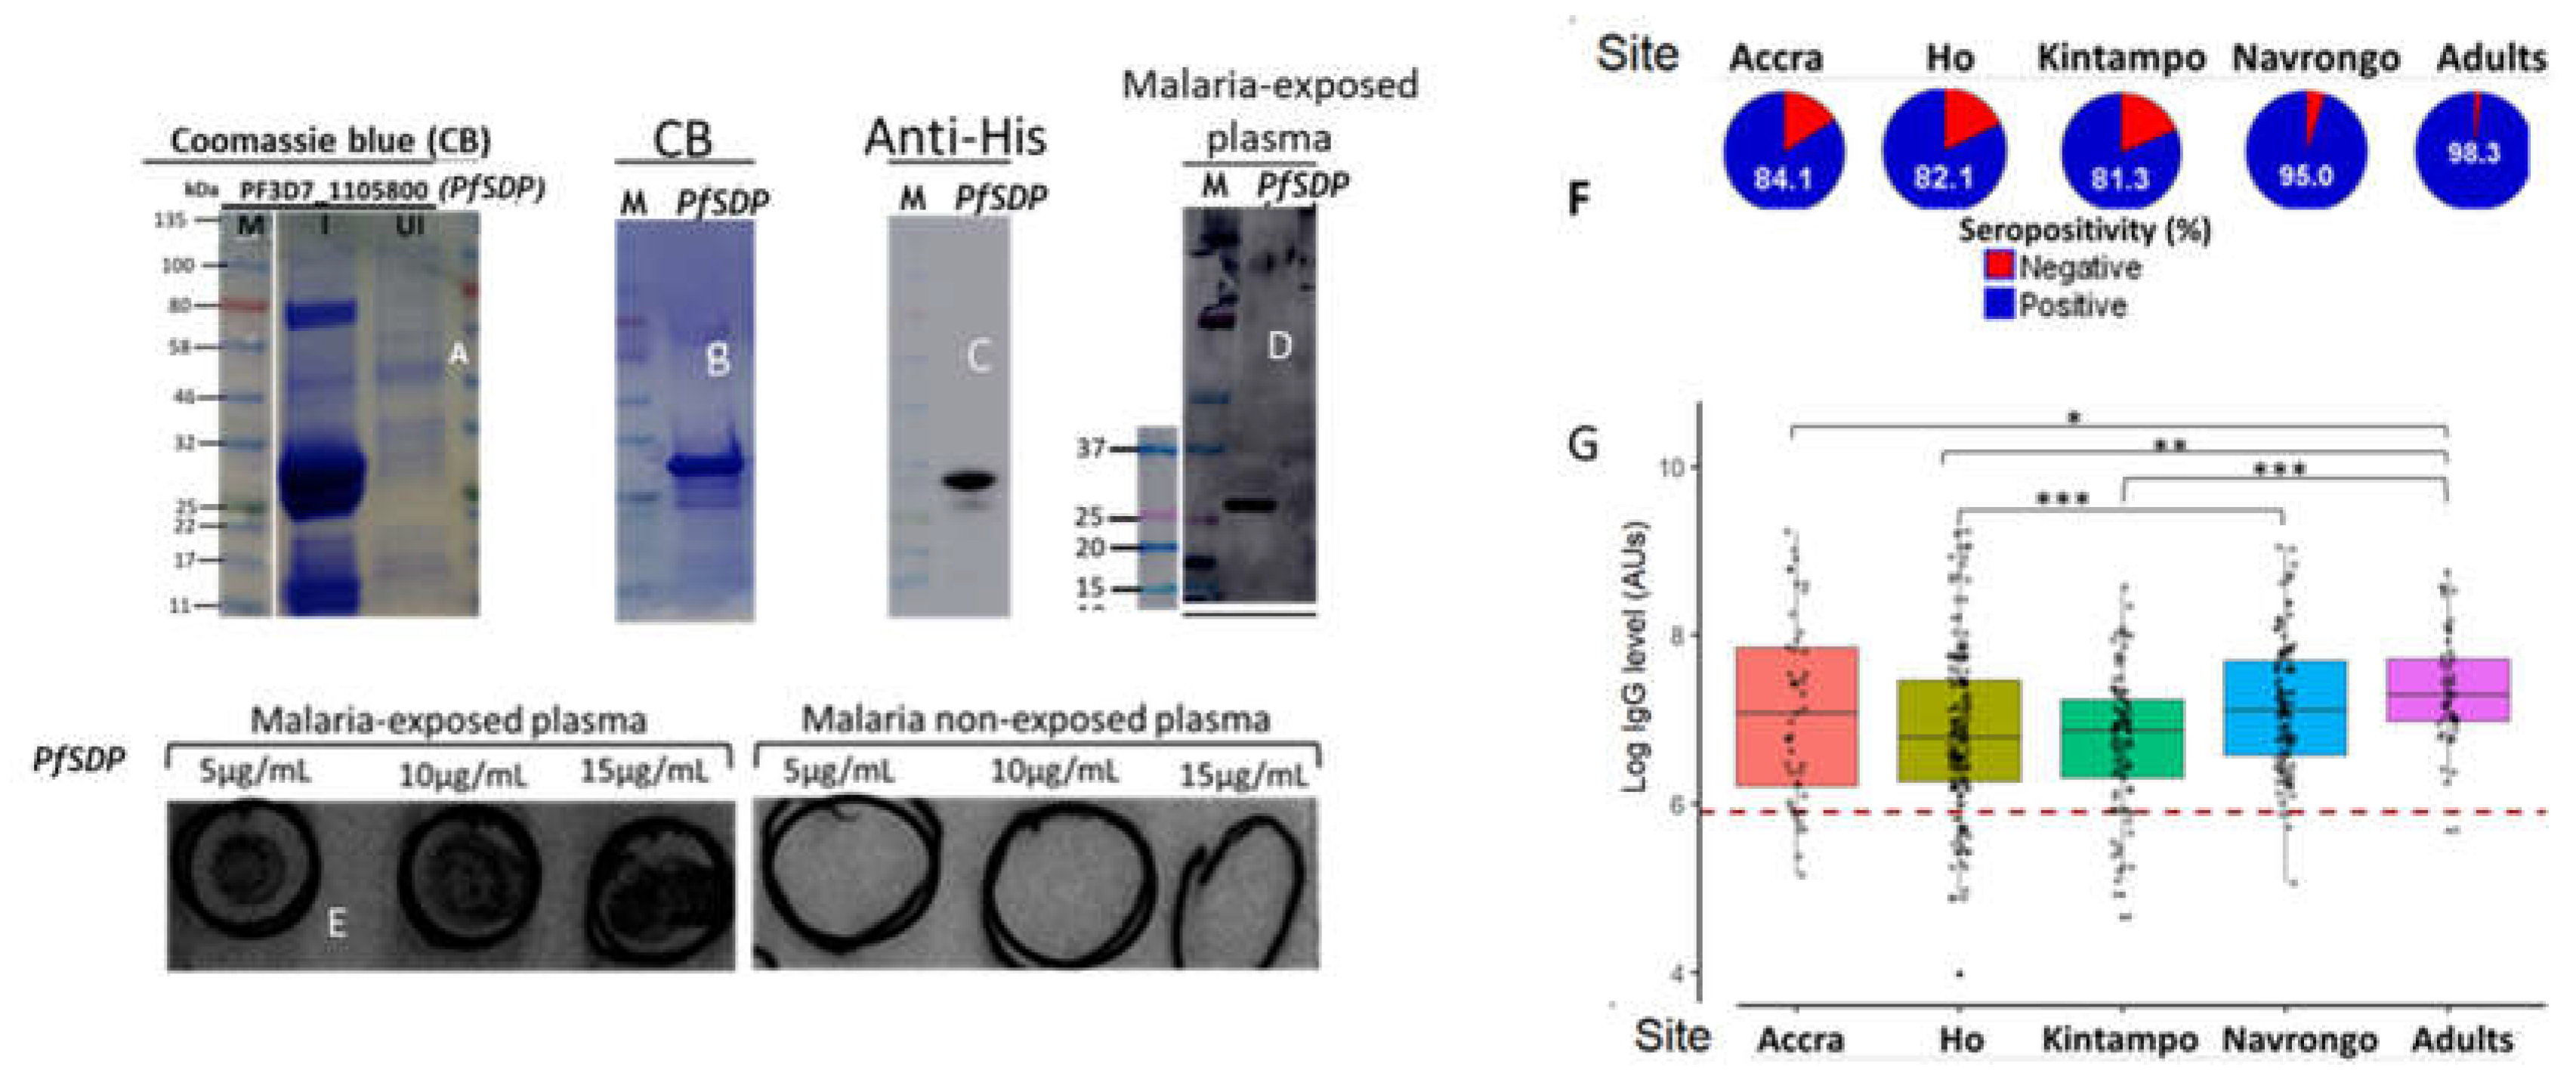
Figure 7.
Associations between PfSDP antibody response level, age, disease episode, and parasite density among the study population. A) IgG level by age and site; Significant increase in IgG response in adults compared to children less than 15 years old (A). Slight decrease in IgG level with age in children less than 15 years. B) Association between IgG Levels and Disease Episodes. A global significant negative association between IgG levels and disease episodes per year which disappeared when sites were considered. C) Global association between IgG levels and parasite load. A global significant negative association between IgG levels and parasite density which disappeared when sites were considered except in Navrongo (high endemic area). D) Association between IgG titres and clinical status of malaria in the 7-15 yrs group in Navrongo. Mean IgG levels were compared using Kruskal Wallis (KW) and Mann-Whitney tests. When a KW test was significant (P-value < 0.05), a Dunnett’s test was used as post-hoc for multiple comparisons. P-value code: ns: p > 0.05. *: p ≤ 0.05, **: p ≤ 0.01, ***: p ≤ 0.001.
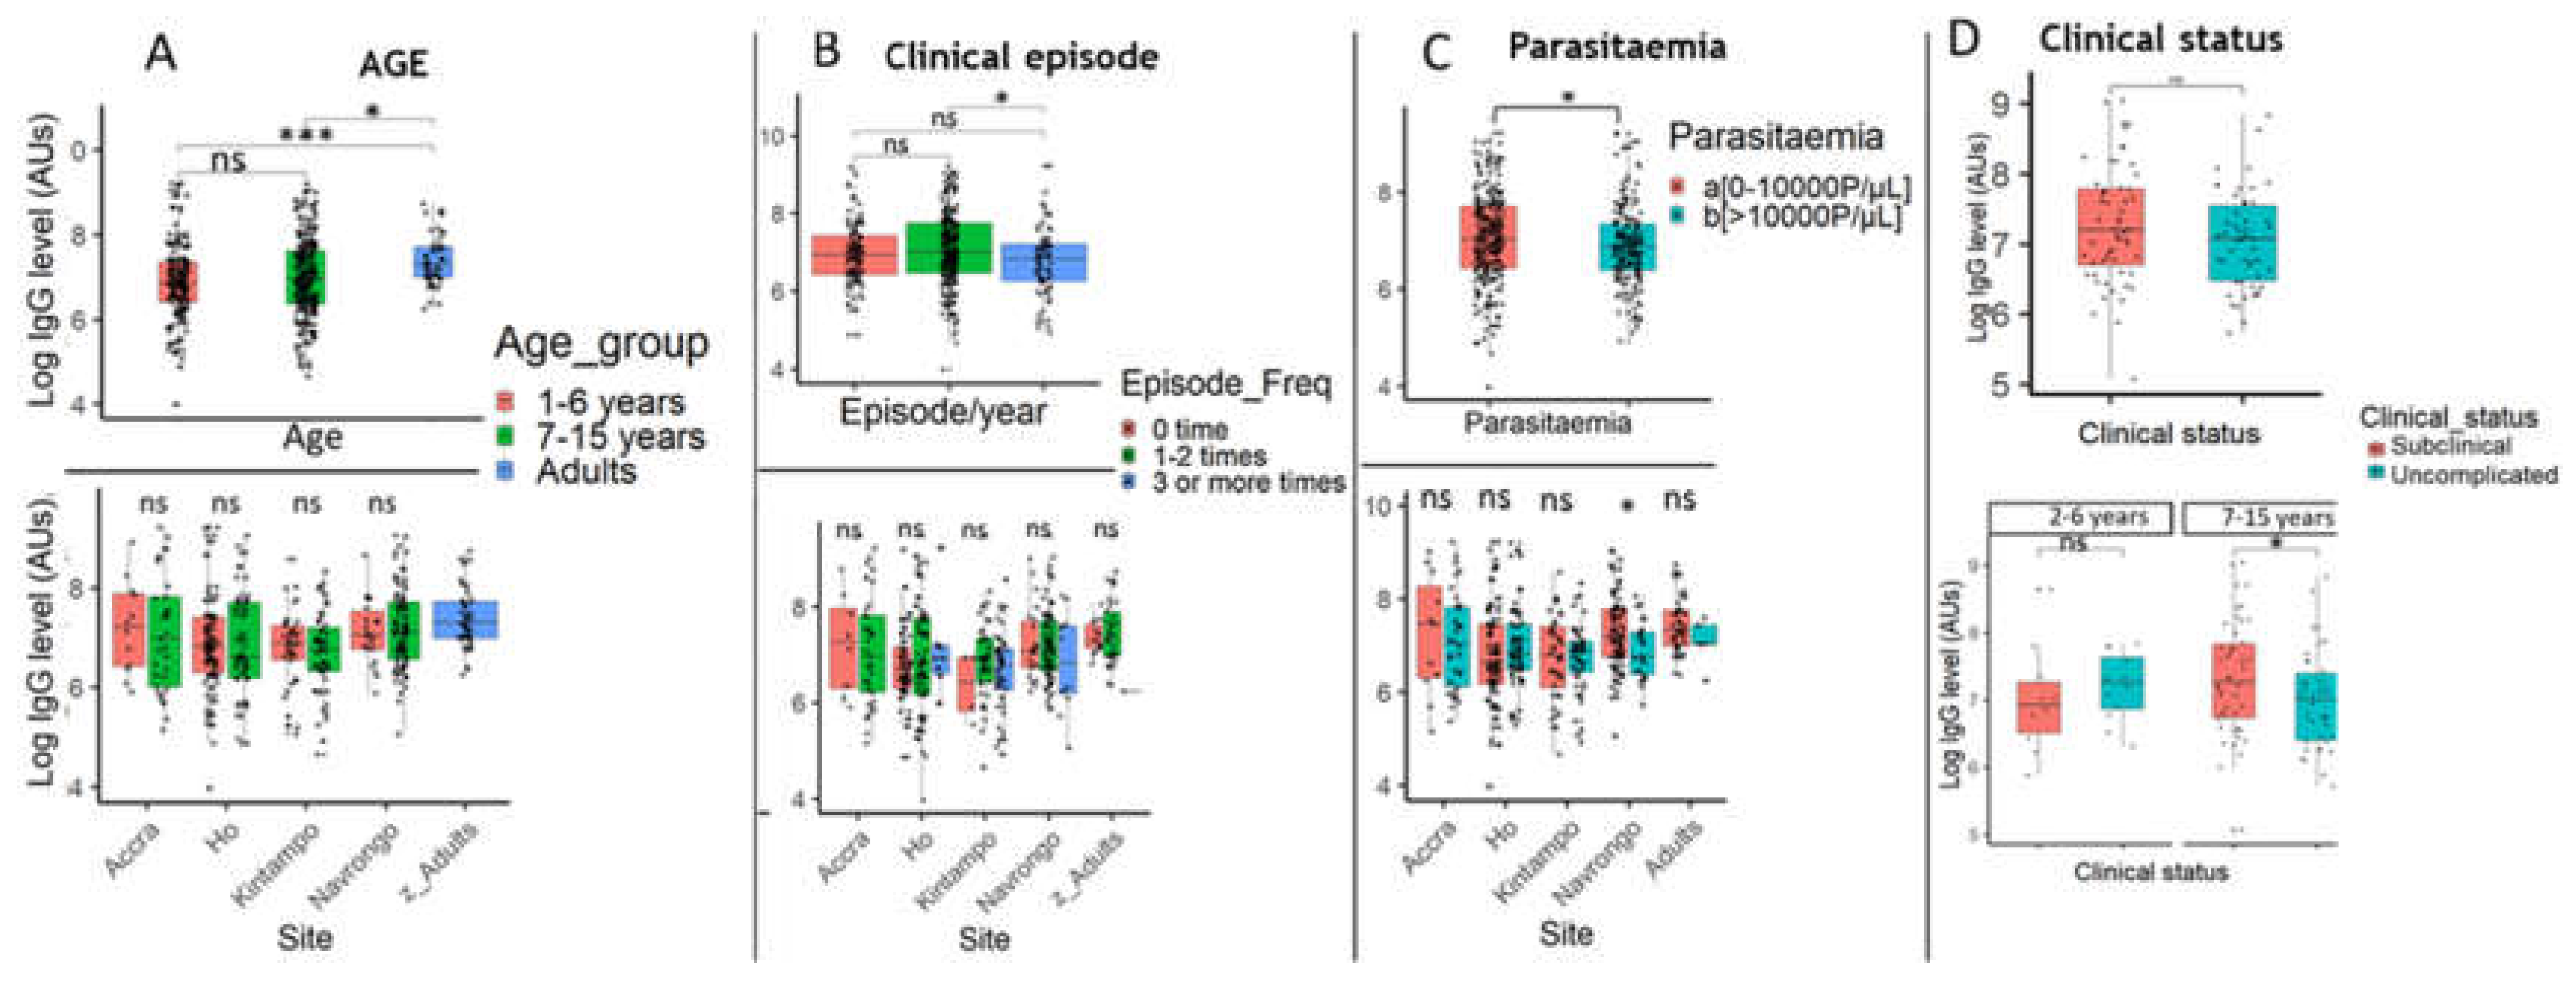
Figure 8.
Kinetics of anti-PfSDP specific antibody response in malaria-infected children from acute infection (day 0) to convalescence (Day 7 through day 21) in areas with different transmission potentials. A) Variation in seropositivity in children at different time points. B) Antibody level comparison per individual at different time points by site. An increasing trend of antibody levels was observed from day 0 to day 7 followed by a gradual decrease till day 21. Follow-up was not done in Ho on Day 21. Cut-off (-------) = mean ab level of naïve European plasma + 3SD. Mean IgG levels were compared using Kruskal Wallis (KW) and Mann-Whitney tests. When a KW test was significant (P-value < 0.05), a Dunnett’s test was used as post-hoc for multiple comparisons. P-value code: ns: p > 0.05. *: p ≤ 0.05, **: p ≤ 0.01, ***: p ≤ 0.001.
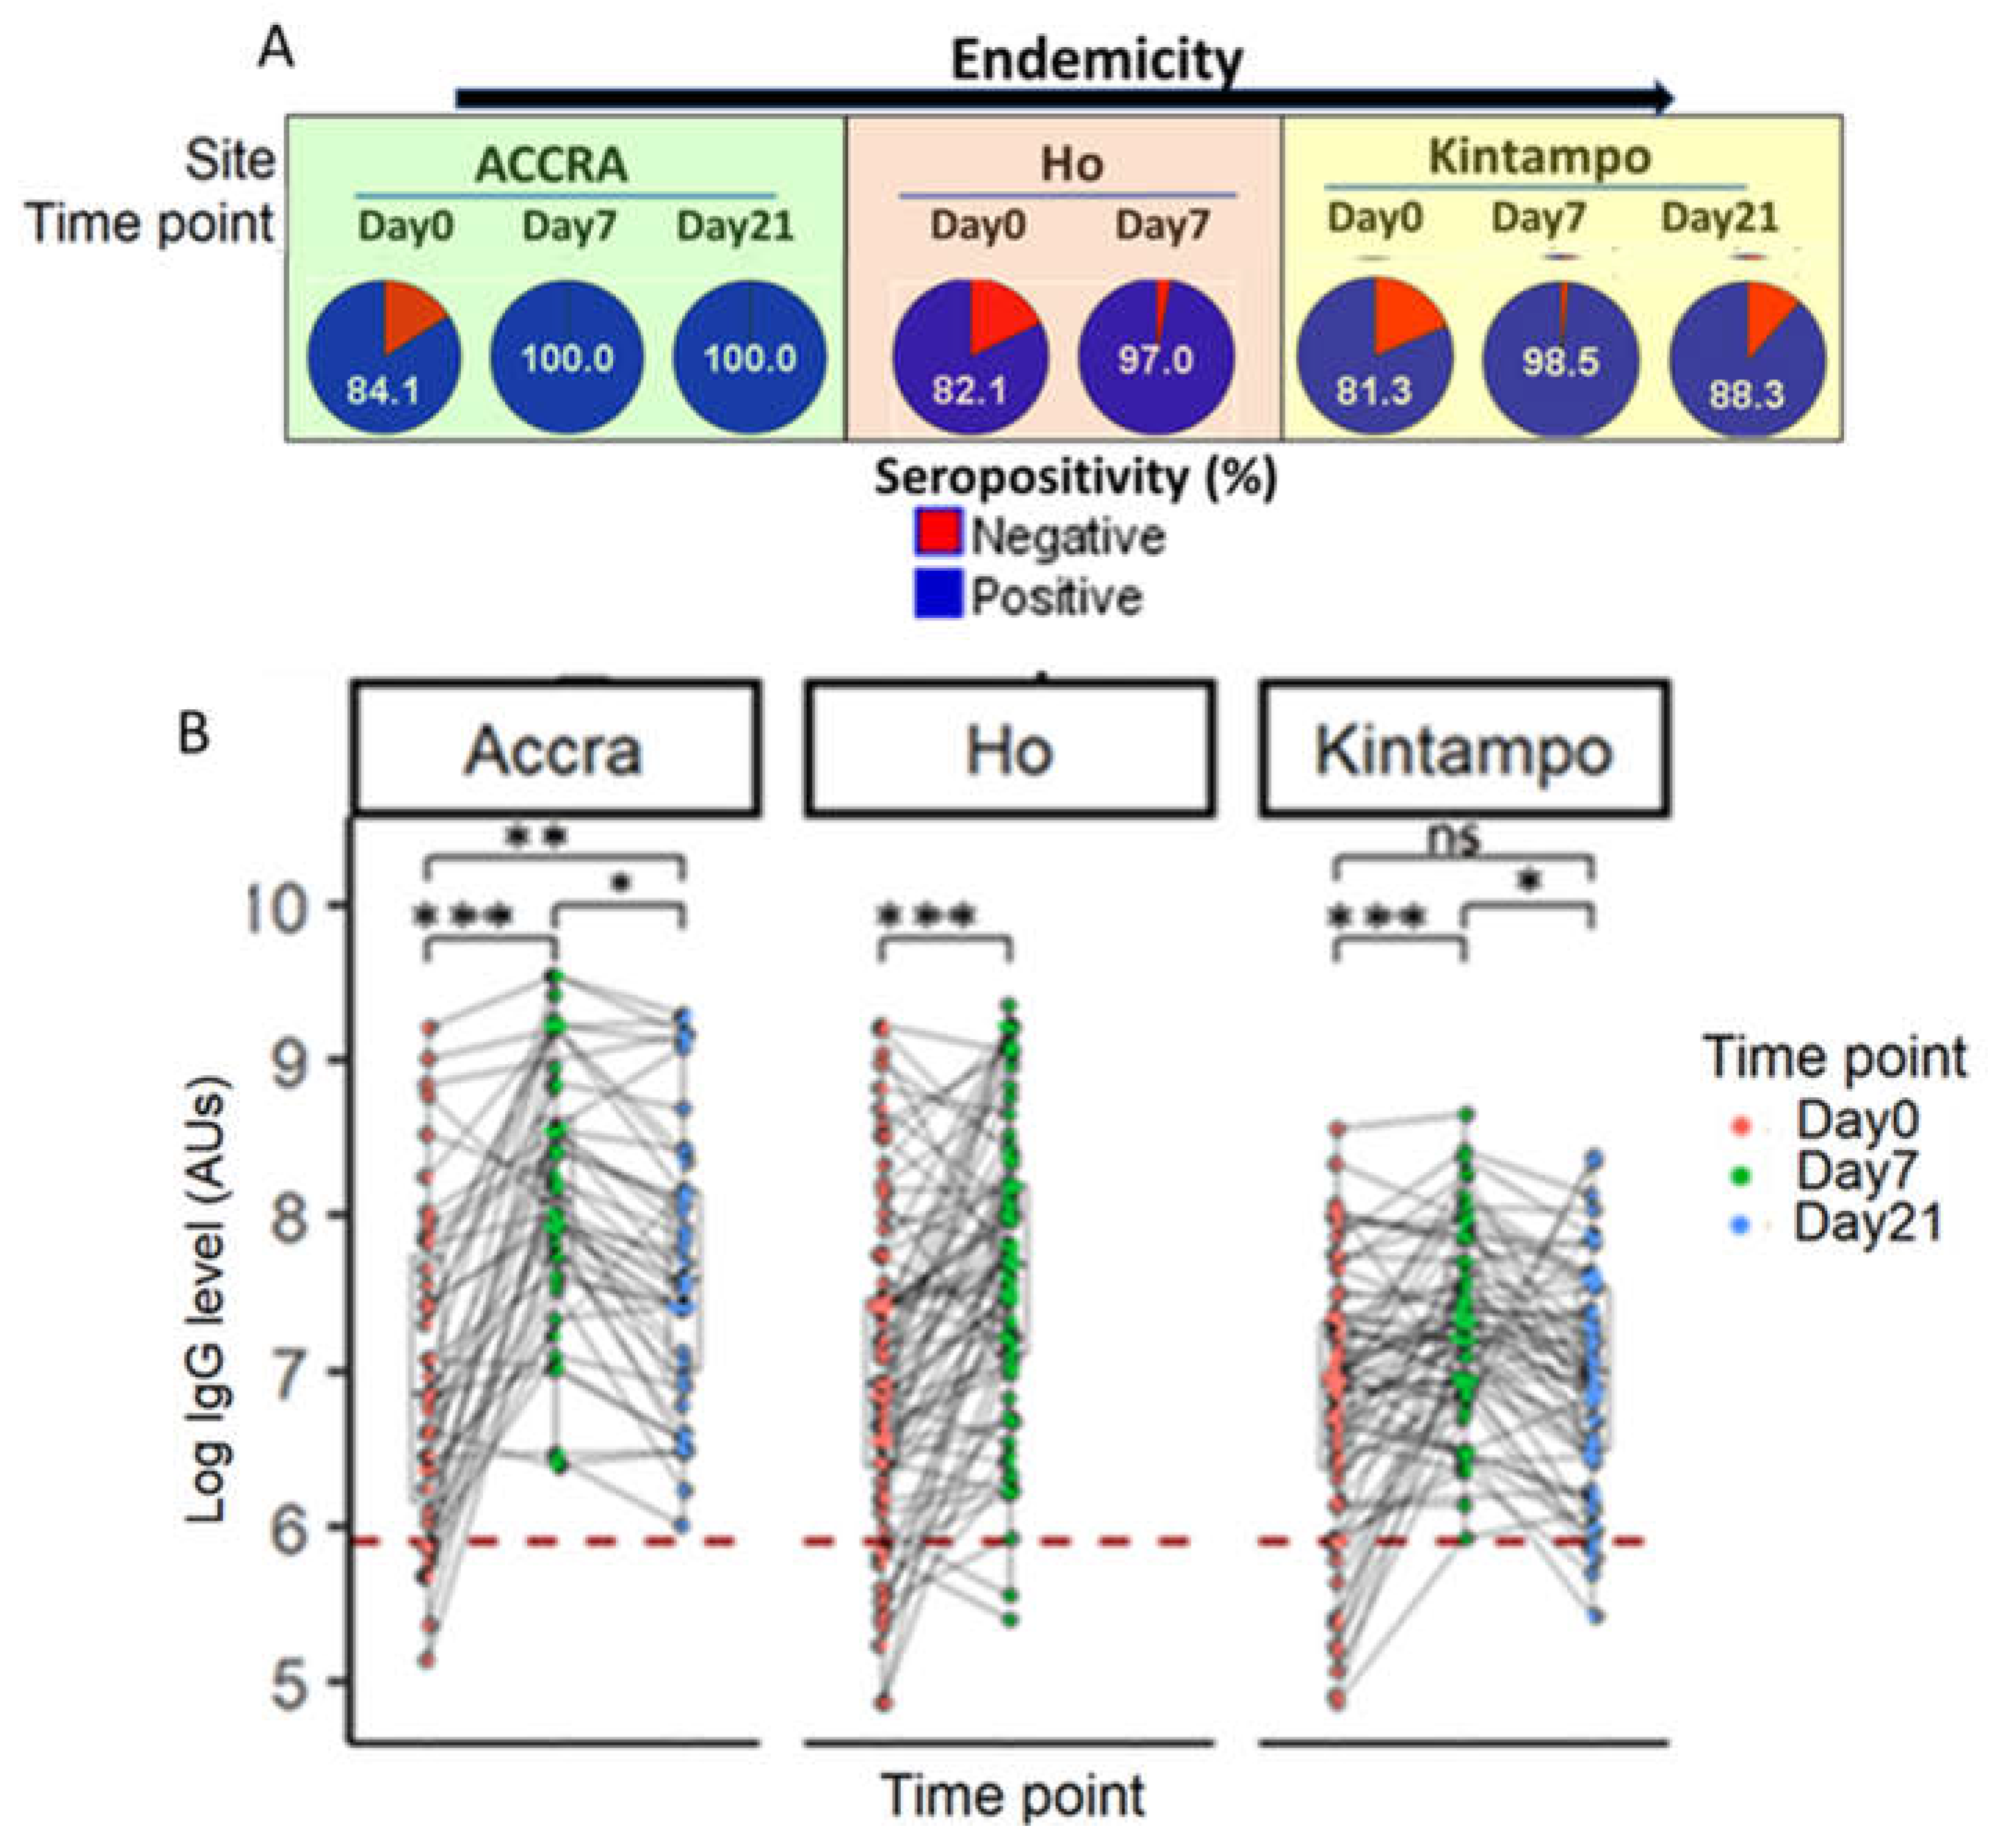

Table 1.
Nucleotide and haplotype diversity of PF3D7_1105800 (PfSDP) within and between sites in Africa (n=1336) and South-East Asia (n=1010).
Table 1.
Nucleotide and haplotype diversity of PF3D7_1105800 (PfSDP) within and between sites in Africa (n=1336) and South-East Asia (n=1010).
 |
Fst measures nucleotide variation between and within populations. An Fst value of zero means the two populations are genetically similar (less divergence or limited gene flow for the locus) while a value of 1 means genetically different (complete divergence or high gene flow) populations. These were generated using the PopGenome package implemented in the R programming software.
Disclaimer/Publisher’s Note: The statements, opinions and data contained in all publications are solely those of the individual author(s) and contributor(s) and not of MDPI and/or the editor(s). MDPI and/or the editor(s) disclaim responsibility for any injury to people or property resulting from any ideas, methods, instructions or products referred to in the content. |
© 2025 by the authors. Licensee MDPI, Basel, Switzerland. This article is an open access article distributed under the terms and conditions of the Creative Commons Attribution (CC BY) license (http://creativecommons.org/licenses/by/4.0/).
Copyright: This open access article is published under a Creative Commons CC BY 4.0 license, which permit the free download, distribution, and reuse, provided that the author and preprint are cited in any reuse.


