
Submitted:
04 April 2025
Posted:
04 April 2025
You are already at the latest version
Abstract
The cross-border port serves as a crucial cross-border travel connecting mainland China with Hong Kong and Macau, directly impacting the overall satisfaction of cross-border travel. While previous studies on neighborhoods, communities, and other areas have thoroughly examined the heterogeneity and asymmetry in satisfaction, research on the satisfaction of cross-border travel at ports remains notably limited. This paper explores the heterogeneity and asymmetry of cross-border travel satisfaction using gradient boosted decision trees (GBDT) and k-means cluster analysis under the framework of three-factor theory, aiming to demonstrate the latest scientific research results on the fundamental theories and applications of artificial intelligence. The results show that prevalent asymmetric relationships between factors and cross-border travel satisfaction, with the factor structure exhibiting heterogeneity across different groups. High-income individuals were more likely to prioritize the reliability of cross-border travel, whereas low-income individuals tended to emphasize the convenience of travel. Finally, this paper proposes improvement priorities for different types of passengers, reflecting the practical application of advanced mathematical methods in artificial intelligence to drive intelligent decision-making.
Keywords:
three-factor theory
; advanced algorithms in machine learning
; cross-border travel
; k-means clustering
; gradient boosting decision trees
; nonlinear effect
1. Introduction
Cross-border travel occurs across a variety of geographic and geopolitical contexts. Most research focused on cross-border cooperation between EU countries (Castillo-Díaz et al., 2024; Duarte & Carvalho, 2024; Kozera et al., 2024), such as the France-Luxembourg (Gerber et al., 2017; Maciejewska et al., 2023) and Germany-Poland (Novotný, 2025). The dynamics of cross-border travel connecting mainland China with Hong Kong and Macau remain understudied in academic literature (Liu & Shi, 2021; X. Luo & Shen, 2012; Shen, 2014; J. Wang et al., 2021).
As a key economic zone in southern China, the Greater Bay Area integrates nine cities from Guangdong Province with the distinct territories of Hong Kong and Macau (Hui et al., 2020). As cross-border regional cooperation within the Greater Bay Area intensifies, cross-border travel connecting mainland China with Hong Kong and Macau requires more attention (L. Li et al., 2023; Y. Li et al., 2023; X. Zhang et al., 2024). However, existing cross-border research from EU countries is inapplicable primarily to the Greater Bay Area, as most EU member states lack border checkpoints (Edzes et al., 2022; Novotný, 2025). Cross-border travel connecting mainland China with Hong Kong and Macau must undergo customs inspection and usually requires intermodal transport at designated ports.
Satisfaction is a vital measure of service quality in intermodal transport services (Q. Wang & Hu, 2017). When passengers' travel needs are met, they feel satisfied, which enhances their likelihood of using similar services in the future. Conversely, if their travel needs are not addressed, passengers may cease using the service and share their negative experiences with others (Yuan et al., 2021). Cross-border port connection is the most vulnerable link in intermodal transport, and the quality of connecting transport is a critical correlate in passenger satisfaction (Chen et al., 2024; McIlroy, 2023; Ren et al., 2024). However, previous intermodal transport studies ignore some unique characteristics of customs inspection, such as customs inspection efficiency and customs flow management in the port inspection hall.
Previous studies have indicated that passenger heterogeneity significantly affects their satisfaction with transportation services (Jiang et al., 2024; S. Luo et al., 2023). Passengers with varying socioeconomic and travel characteristics generally have distinct travel needs and assess the same service differently (Abenoza et al., 2017). Ignoring heterogeneity may result in only some passengers being satisfied with the current service (Yuan et al., 2022). By examining the heterogeneity in passenger satisfaction, intermodal passengers can be categorized into distinct segments, which is crucial for implementing targeted service quality improvements.
This study utilizes the 2023 Hengqin Port cross-border travel satisfaction survey data and explores the heterogeneity and asymmetry of cross-border travel satisfaction using GBDT and k-means cluster analysis. This study aims to address the following research questions: (1) How prevalent are asymmetric associations between factors and cross-border travel satisfaction? (2) What key factors should be the primary focus to optimize the cross-border travel experience for passengers? (3) How do satisfaction outcomes vary across distinct passenger segments?
This study applies advanced mathematical methods in artificial intelligence to cross-border travel research, aiming to showcase the latest scientific advancements in the fundamental theories and applications of artificial intelligence and machine learning. Its methodology and practical applications align with artificial intelligence’s core objective of achieving intelligent decision-making through algorithms. This investigation advances theoretical discourse and operational paradigms through multiple contributions. First, it proposes an analytical framework for investigating the whole cross-border travel process at Hengqin Port. Second, it classifies cross-border groups into four categories, namely "low-income students with high-frequency cross-border travel", "high-income tourists with low-frequency cross-border travel", "low-income retirees with low-frequency cross-border travel", and "high-income commuters with high-frequency cross-border travel". Third, it reveals a prevalent asymmetric relationship between factors and cross-border travel satisfaction. Finally, it uncovers heterogeneity in the factor structure of different cross-border passengers and suggests targeted strategies for improvement.
This paper adopts a systematic architecture comprising 4 integrated components: Section 2 conducts a critical synthesis of extant scholarship, systematically interrogating the multidimensional heterogeneity and spatial-temporal asymmetries inherent in cross-border travel satisfaction paradigms. Section 3 articulates the methodological framework, delineating the multilevel analytic approach and data curation protocols governing the empirical investigation. Section 4 unveils the analytical findings. The culminating section advances theoretical discourse and operational paradigms.
2. Literature Review
2.1. Factors of Cross-Border Travel Satisfaction
Most existing research on cross-border travel originates from EU countries (Cavallaro & Dianin, 2020; Gerber et al., 2020). The process of European integration has significantly promoted labor mobility within the EU, as most EU member states do not maintain customs inspection, allowing citizens of EU member states to live and work freely in any EU country (Campos et al., 2022; Castillo-Díaz et al., 2024; Duarte & Carvalho, 2024; Gerber et al., 2017; Kozera et al., 2024; Xu et al., 2024). Connecting transport services, clarity of path indication, and convenience of connection are closely related to cross-border travel satisfaction (Gerber et al., 2020; Liu & Shi, 2021; Sener et al., 2015; Shen, 2014). Gerber et al (Gerber et al., 2020) focused on cross-border commuters from Luxembourg’s neighboring countries and investigated the relationship between travel attitudes, mode choice, and cross-border travel satisfaction with structural equation modeling (SEM). They found that optimizing intermodal transport quality, such as operating lines and frequency, significantly enhanced cross-border travel satisfaction.
Cross-border travel connecting mainland China with Hong Kong and Macau requires customs inspection and usually requires intermodal transport. However, research on intermodal transport within ports remains relatively limited, let alone studies on passenger satisfaction with intermodal travel (Abenoza et al., 2019; Chen et al., 2024; Chiambaretto et al., 2013; Jiang et al., 2021; McIlroy, 2023; Ren et al., 2024; Zeng et al., 2024). As shown in Table 1, many scholars have found that the operating lines, operating hours, operating frequency, transfer distance, flow management, and path indication are significant determinants of passenger satisfaction (L. Li & Loo, 2016; Ren et al., 2024; M. Yang et al., 2022; Yuan et al., 2022; J. Zhang et al., 2022; Zhou et al., 2022, 2024). Yang et al (M. Yang et al., 2022) found that the operating lines and path indication significantly influence passenger satisfaction with air-rail intermodal travel.
2.2. Heterogeneity in Passenger Satisfaction
Extensive research examines the heterogeneity of passenger satisfaction based on socioeconomic characteristics (Jiang et al., 2024; S. Luo et al., 2023; Singh & Kathuria, 2023), and travel characteristics (Deng et al., 2025), with these findings mainly applied to passenger market segmentation (Gao et al., 2023). Abenoza et al (Abenoza et al., 2017) found that passengers with different socioeconomic and travel characteristics evaluate their experiences of the same public transport services differently. Luo et al (S. Luo et al., 2023) investigated passenger satisfaction with Shenzhen metro and bus services, and explored the heterogeneity in travel space and time. Results indicated that satisfaction was lower during the morning peak, primarily due to concerns over reliability. Previous studies have examined the heterogeneity of user behavior through market segmentation and developed differentiated strategies for target user groups. While these studies have yielded valuable conclusions (Allen et al., 2018; Cai et al., 2025; Gholi et al., 2022), few studies have considered the segmentation of cross-border travel clusters.
2.3. Asymmetric Relationship Between Factors and Satisfaction
Previous literature indicates that factors exhibit different sensitivities to satisfaction depending on whether their performance is good or poor, and the nonlinear effect dynamics between factors and overall satisfaction is prevalent in the field of urban transport systems (Ramos, 2025; Sun et al., 2020; Tuan et al., 2022; X. Wu et al., 2018). Within the framework of the three-factor theory, as illustrated in Figure 1, the factors of passenger satisfaction can be categorized as basic, performance and excitement factors. Basic factors have significant impacts on satisfaction only when their performance is below passenger expectations; in contrast, excitement factors have significant impacts on satisfaction only when their performance exceeds passenger expectations (Fang et al., 2021). The asymmetric relationship indicates a hierarchy of factor importance: basic factors should be satisfied first, and passengers focus only on whether these factors meet basic requirements, not on whether they exceed expectations; excitement factors are at the bottom of the improvement priority scale (Matzler et al., 2003).
Gradient Decision Boosting belongs to the machine learning methods in the field of artificial intelligence, the principle of which is to optimize the loss function in multiple rounds of iterations by gradient descent, thus reducing the prediction error. Gradient decision boosting is often used in modern finance, intelligent construction, and other practical application scenarios (P. Wang et al., 2025; J. Wu et al., 2024; J. Yang et al., 2020), reflecting the core value of artificial intelligence technology to empower intelligent decision making through mathematical optimization. Existing studies (Cappello et al., 2025; Dong et al., 2019; Fang et al., 2021) have introduced machine learning techniques into the study of asymmetric relationships in transportation satisfaction. Dong et al (Dong et al., 2019) used the GBDT method to assess the walking satisfaction of community residents in Harbin, China, and found that most factors had a nonlinear effect on comparing satisfaction with the walkability of residents, challenging linear assumptions used in previous research. Fang et al (Fang et al., 2021) applied the same methodology to explore the factor structure of different public transport passenger satisfaction in developing countries and found a generally asymmetric relationship between public transport factors and overall satisfaction, which is consistent with other applications in developed countries (X. Wu et al., 2020). Previous studies have demonstrated the widespread existence of asymmetric relationships in transportation satisfaction, and ignoring non-linearity may misestimate the effects of factors on overall satisfaction, leading to incorrect implications for planning practices (Tuan et al., 2022; X. Wu et al., 2018).
In summary, although previous studies have thoroughly discussed the heterogeneity and asymmetric relationships in passenger satisfaction, studies on the satisfaction of cross-border groups at ports are scarce, with a lack of consideration for the various stages of cross-border travel at ports, and limited discussion on the heterogeneity of different types of groups. To fill these gaps, this paper employs k-means clustering analysis and GBDT in the field of artificial intelligence to explore the heterogeneity and asymmetry of cross-border travel satisfaction at Hengqin Port, aiming to demonstrate the latest scientific research results on the fundamental theories and applications of artificial intelligence and machine learning techniques.
3. Study Method
3.1. Data and Variables
This study utilizes structured questionnaire surveys administered at Hengqin Port, located within the Guangdong-Macao In-Depth Cooperation Zone in Hengqin, with data collection spanning October to November 2023. Located at Zhuhai's southern periphery in Guangdong Province, the Guangdong-Macao In-Depth Cooperation Zone in Hengqin occupies a 106 km² area bordering Macau's maritime boundary, with its closest point separated by merely 200 meters of waterways, as shown in Figure 2. Hengqin Port, has begun operations in 2020 and implements a 24/7 Joint Inspection-One Time Release (JI-OTR) mechanism, allowing passengers to enjoy the one-stop clearance experience. In 2023, the number of passenger customs clearances exceeded 16.7 million.
The survey was pretested by 50 cross-border passengers and revised based on their feedback. After receiving a two-hour of questionnaire administration training, 20 surveyors conducted face-to-face interviews to recruit respondents at the passenger inspection hall of Hengqin Port. No incentives were used for respondent recruitment, and the response rate exceeded 70%. Researchers established perpendicular virtual demarcation lines at the passenger inspection hall, implementing a k=15 interval selection protocol where every fifteenth consecutive passenger crossing the lines was enrolled. Responses were recorded using tablet computers, and the data was transmitted wirelessly to the server. The study obtained 2,067 valid responses. The sample demonstrated near-equilibrium in cross-border flow directions: Macau-to-Hengqin passengers constituted 49.3% of participants (n=1,020), while Hengqin-to-Macau passengers comprised the remaining 50.7% (n=1,047).
The dependent variable in this study is overall satisfaction with cross-border travel, and the independent variables fall into three groups: satisfaction with factors, travel characteristics, and socioeconomic characteristics. The survey used a five-point Likert scale, asking respondents to rate their overall satisfaction as well as eight factors, where "1" represents "unacceptable" and "5" represents "excellent". The selection of factors was based on previous literature on intermodal transport satisfaction and other relevant factors (L. Li & Loo, 2016; Ren et al., 2024; M. Yang et al., 2022; Zhou et al., 2024), encompassing the entire process of cross-border travel. This process includes connecting transportation to the port inspection hall, and the customs inspection stage at the inspection hall. The factors include path indication, operating lines, operating hours, operating frequency, and transfer distance for connecting transportation, as well as path indication, customs inspection efficiency, and customs flow management in the port inspection hall. Travel-related factors in this study are defined by main travel purpose and travel frequency in the previous year. Socioeconomic characteristics include gender, age, education, annual income, and occupation.
Table 2 and Table 3 present the descriptive statistics of the survey respondents. The majority of respondents hold bachelor's degrees and are enterprise staff, with most traveling across borders for leisure purposes, and having a relatively high frequency of travel. In general, the average overall satisfaction with cross-border travel and satisfaction with factors for the group of passengers from Hengqin to Macau is 4.37, which exceeds the 4.25 reported for the group of passengers from Macau to Hengqin.
3.2. Analysis Approaches
3.2.1. Cluster Analysis
In this study, we apply the k-means clustering algorithm to categorize passenger groups according to their socioeconomic and travel characteristics (Eltved et al., 2021; Esmailpour et al., 2020). The k-means clustering method is an advanced mathematical method of artificial intelligence technology, which has an important position in the field of unsupervised learning, and despite its relatively simple algorithm, it still widely supports the construction of artificial intelligence systems in practical applications such as data processing. The k-means clustering divides all samples into k mutually exclusive clusters, where samples within each cluster are as close as possible, while being as far as possible from those in other clusters (Lletı́ et al., 2004).
The silhouette coefficient is a commonly used metric for evaluating clustering performance, as it considers both cohesion within clusters and separation between clusters. The procedure for calculating the silhouette coefficient is as follows:
where is the silhouette coefficient of sample i, represents the average distance from sample i to other samples in the same cluster, and represents the minimum distance from sample i to any sample in another cluster. The closer is to 1, the more appropriate the clustering of sample i (Bagirov et al., 2023; Du et al., 2024). is the mean of all the individual silhouettes, is referred to as the silhouette coefficient for clustering result k.
where m represents the number of samples in the cluster. A higher silhouette coefficient implies better clustering quality (Lletı́ et al., 2004).
3.2.2. Impact-Asymmetry Analysis
Penalty-reward contrast analysis is a commonly used method for identifying asymmetric relationships between factors and overall satisfaction(Cao et al., 2020; Dong et al., 2019; Fang et al., 2021). This study consists of three steps: recoding satisfaction variables, estimating the penalty and reward indices for factors, and classifying them. First, factors are recoded into three categorical variables. Given the average ratings for overall satisfaction and specific factors are around 4.3, a score of 4 is labeled as “0,” indicating the standard category (i.e., meeting expectations). Scores from 1 to 3 are categorized as “-1,” representing penalties (i.e., performance below expectations), while a score of 5 is assigned a “1,” signifying rewards (i.e., performance exceeding expectations) (Dong et al., 2019; X. Wu et al., 2018). Second, machine learning models are utilized to calculate the penalty and reward index for various factors. Finally, the impact asymmetry index is calculated based on the relative sizes of the penalties and rewards (Cao et al., 2020; Fang et al., 2021). Detailed steps are provided in section 4.2. Gradient decision boosting is a machine learning method that belongs to the advanced mathematical methods in the field of artificial intelligence. This study employs the GBDT algorithm for modeling.
GBDT employs decision trees to approximate the observed values in the sample, with the goal of iteratively minimizing the prediction error until the loss function reaches convergence, thus reducing the overall loss (Cao et al., 2020).
This section introduces the GBDT algorithm using mathematical symbols. It assumes that the variable x represents the independent variables (which include socioeconomic and travel characteristics, and factor satisfaction in this study), while F(x) serves to estimate the dependent variable y (overall cross-border travel satisfaction). The algorithm models the function as an additive series of the basis function , with each decision tree contributing incrementally.
In this model, denotes the average of the split locations and the terminal nodes for each variable involved in the splits of the decision tree . Additionally, is refined through the minimization of the loss function . For the parameter estimation, Ding et al (Ding et al., 2016) proposed the gradient boosting framework. The optimization technique can be summarized in the following way:
| Initialize to be a constant, For m = 1 to M: For i = 1, 2, …,N compute the negative gradient Fit a regression tree to the targets Compute a gradient descent step size as Update the model as Output the final model |
This study uses the learning rate to prevent the issue of model over-fitting by introducing a factor , which scales the contribution of each basis function (Y. Zhang & Haghani, 2015), as shown in the following equation:
Smaller learning rate values are more effective at minimizing the loss function, but this necessitates adding more trees to the model, presenting a balance between the number of trees and the learning rate (Ding et al., 2018). Tree complexity, or the number of nodes within each tree, is another crucial factor for the GBDT method (Luo et al., 2022; Ma, Cottam, et al., 2023; Ma, Karimpour, et al., 2023a). To properly capture complex interactions among variables, increasing the complexity of the trees is essential (Ma, Karimpour, et al., 2024; Wu et al., 2019; Yang et al., 2024). Ultimately, the effectiveness of the GBDT model is influenced by the interplay of the number of trees, the learning rate, and the complexity of the trees (Y. Zhang & Haghani, 2015). Compared to regression models with dummy variables commonly found in the satisfaction research literature (Sun et al., 2020; X. Wu et al., 2018), the GBDT model offers several advantages. First, GBDT outperforms traditional regression models in terms of predictive accuracy (Ma et al., 2025; Ma, Karimpour, et al., 2023b; Ma, Noh, et al., 2024). Second, GBDT aids in addressing multicollinearity problems (Cottam et al., 2024; Ma, Karimpour, et al., 2023c; Zhang et al., 2024). Given that some factors are interrelated, this correlation may result in multicollinearity within regression models (Ma, 2022; Ma et al., 2020; Wang et al., 2025). Decision trees inherently account for interactions between independent variables (Cao et al., 2020; Dong et al., 2019). Third, GBDT can handle various types of independent variables, accommodate missing data, and requires minimal preprocessing (Ding et al., 2018). Finally, as an ensemble-based boosting machine learning method, GBDT is highly effective for small samples (Fang et al., 2021; X. Wu et al., 2020).
4. Results
4.1. Cluster Analysis
This study employs the k-means clustering algorithm to categorize passenger groups according to their socioeconomic and travel characteristics. For each group, this study conducted continuous clustering and silhouette coefficient was calculated for consecutive numbers ranging from k = 2 to k = 8 clusters. The results were displayed in a line chart, as shown in Figure 3 and Figure 4. When k reaches 4, the silhouette coefficient for both travel groups reaches its maximum value. Based on this observation, the study considered the 4 clusters appear to be optimal clustering result. The distribution of the sample from the clustering analysis is detailed in Table 4, while Table 5 displays the descriptive statistics for the socioeconomic and travel characteristics.
Among the passengers from Macau to Hengqin, the first group consists almost entirely of students (99.00%) who have the least income (81.00% with an annual income below 50,000 CNY). Their main cross-border travel purpose is commuting to school (82.00%), and they demonstrate a relatively high travel frequency (67.00% traveling more than four times per week). This group can be described as "low-income students with high-frequency cross-border travel".
The second group primarily comprises enterprise staff (74.00%) with higher incomes (72.00% earning 100,000–300,000 CNY annually). Their main travel purpose is recreation (93.00%), and nearly two-thirds of them only make 1-3 times per month or less. This group can be described as "high-income tourists with low-frequency cross-border travel".
The third group has the highest percentage of older individuals, with 82.00% aged 50 and above, and the lowest educational attainment, as 85.00% have no more than a high school education. Most individuals in this group are retired (82.00%), with recreation as their main travel purpose (61.00%). They have the lowest travel frequency (88.00% traveling 1–3 times per month or less) and can be described as "low-income retirees with low-frequency cross-border travel".
The last group mainly consists of middle-aged and young adults, with 92% of them aged between 25 and 50 years. Their main travel purpose for cross-border travel is commuting (77.00%), and they display the highest travel frequency (70.00% traveling more than four times per week). This group can be described as "high-income commuters with high-frequency cross-border travel".
A similar grouping pattern is observed among passengers from Hengqin to Macau.

Table 5.
Comparison of socioeconomic and travel characteristics of the clustering result.
| Characteristics | Passengers from Macau to Hengqin | Passengers from Hengqin to Macau | ||||||
|---|---|---|---|---|---|---|---|---|
| Group 1 | Group 2 | Group 3 | Group 4 | Group 1 | Group 2 | Group 3 | Group 4 | |
| Gender | ||||||||
| Male | 55.56% | 46.71% | 34.45% | 55.56% | 47.57% | 50.48% | 31.40% | 57.14% |
| Female | 44.44% | 53.29% | 65.55% | 44.44% | 52.43% | 49.52% | 68.60% | 42.86% |
| Age | ||||||||
| 24 years or lower | 65.02% | 1.50% | 1.54% | 62.55% | 3.62% | 1.79% | ||
| 25-29 years | 25.93% | 23.05% | 0.84% | 16.98% | 29.59% | 21.01% | 16.07% | |
| 30-34 years | 8.23% | 23.65% | 0.84% | 30.25% | 6.74% | 29.95% | 27.86% | |
| 35-39 years | 0.82% | 31.44% | 3.36% | 27.16% | 1.12% | 28.74% | 5.81% | 28.93% |
| 40-49 years | 14.07% | 12.61% | 17.90% | 13.04% | 12.79% | 18.57% | ||
| 50 years or higher | 6.29% | 82.35% | 6.17% | 3.62% | 81.40% | 6.79% | ||
| Education | ||||||||
| High school or lower | 1.23% | 4.19% | 56.30% | 8.95% | 0.37% | 3.14% | 54.65% | 5.00% |
| High school | 1.65% | 12.28% | 28.57% | 16.36% | 2.62% | 7.49% | 25.58% | 12.50% |
| Associate degree | 0.82% | 16.17% | 7.56% | 12.35% | 0.75% | 19.81% | 10.47% | 15.36% |
| Bachelor degree | 58.85% | 58.38% | 7.56% | 44.75% | 48.31% | 58.94% | 9.30% | 44.29% |
| Graduate degree | 37.45% | 8.98% | 17.59% | 47.94% | 10.63% | 22.86% | ||
| Annual Income (CNY) | ||||||||
| <50,000 | 80.66% | 7.78% | 59.66% | 5.56% | 82.02% | 5.56% | 72.09% | 5.00% |
| 50,000-100,000 | 11.93% | 11.98% | 19.33% | 12.35% | 11.24% | 20.29% | 15.12% | 13.21% |
| 100,000-150,000 | 4.94% | 33.53% | 9.24% | 33.64% | 4.49% | 28.99% | 9.30% | 27.86% |
| 150,000-200,000 | 0.82% | 25.75% | 5.04% | 24.38% | 1.87% | 18.60% | 2.33% | 25.36% |
| 200,000-300,000 | 1.65% | 12.57% | 2.52% | 13.27% | 16.91% | 1.16% | 17.86% | |
| >300,000 | 8.38% | 4.20% | 10.80% | 0.37% | 9.66% | 10.71% | ||
| Occupation | ||||||||
| Worker | 5.39% | 0.84% | 12.96% | 3.38% | 3.49% | 7.14% | ||
| Enterprise staff | 73.65% | 9.24% | 73.15% | 64.25% | 6.98% | 76.43% | ||
| Public institution staff | 7.78% | 4.20% | 4.94% | 0.37% | 7.49% | 1.16% | 10.36% | |
| Student | 98.77% | 0.30% | 97.00% | 0.36% | ||||
| Retiree | 0.41% | 0.30% | 82.35% | 0.62% | 1.12% | 0.97% | 82.56% | 0.36% |
| Self-employees | 11.98% | 3.40% | 19.81% | 1.16% | 3.93% | |||
| Other | 0.82% | 0.60% | 3.36% | 4.94% | 1.50% | 4.11% | 4.65% | 1.43% |
| Main Travel Purpose | ||||||||
| Business | 1.23% | 5.25% | 1.87% | 3.49% | 8.93% | |||
| Reside | 33.61% | 15.12% | 11.63% | 3.93% | ||||
| Commute | 0.82% | 0.30% | 77.47% | 1.50% | 1.16% | 71.01% | ||
| School | 81.89% | 0.93% | 74.16% | 0.24% | 5.36% | |||
| Visit | 2.47% | 7.19% | 5.88% | 1.23% | 2.25% | 6.52% | 10.47% | 3.57% |
| Recreation | 13.58% | 92.51% | 60.50% | 20.22% | 93.24% | 73.26% | 7.50% | |
| Travel Frequency | ||||||||
| ≤2 times per year | 2.06% | 47.01% | 63.87% | 9.57% | 5.62% | 64.73% | 62.79% | 6.43% |
| 1-3 times per month | 4.53% | 20.96% | 24.37% | 6.48% | 5.24% | 15.70% | 16.28% | 3.21% |
| 1 time per week | 9.47% | 19.16% | 2.52% | 4.32% | 7.49% | 12.32% | 11.63% | 5.00% |
| 2-3 times per week | 16.87% | 8.38% | 5.88% | 9.26% | 23.60% | 7.25% | 2.33% | 12.14% |
| ≥4 times per week | 67.00% | 4.49% | 3.36% | 70.37% | 58.05% | 6.98% | 73.21% | |
4.2. Impact-Asymmetry Analysis
Following the studies (Cao et al., 2020; Dong et al., 2019; Fang et al., 2021), we carry out an analysis of impact-asymmetry. The GBDT model generates predictions of overall satisfaction (POS) for each factor. This satisfaction is categorized into three levels: below expectation, meet expectation, and exceed expectation, which are denoted as POSb, POSm, and POSe, respectively. The impact-asymmetry index is calculated as follows:
The Reward Index (RI) is defined as RI = POSe - POSm. It quantifies the increase in overall satisfaction when a factor's performance shifts from "meeting expectation" to "exceeding expectation."
The Penalty Index (PI) is calculated as PI = POSm - POSb. It assesses the decline in overall satisfaction when a factor's performance drops from "meeting expectation" to "below expectation."
The Range of Impact on Overall Satisfaction (RIOS) is represented by RIOS = PI + RI = POSe - POSb. The Satisfaction-Generating Potential (SGP) is expressed as SGP = RI / RIOS; The Dissatisfaction-Generating Potential (DGP) is calculated as DGP = PI / RIOS.
The Impact Asymmetry Index (IA Index) is IA = SGP - DGP. Based on the IA Index thresholds presented by (J. Zhang et al., 2022), we categorize the factor into one of three groups.
- An excitement factor, if 0.2<IA<1;
- A performance factor, if -0.2<IA<-0.2;
- A basic factor, if -0.2<IA<-1.
The factor structures of factors are shown in Table 6, indicating that asymmetric relationship between factors and cross-border overall satisfaction are prevalent. Among passengers from Macau to Hengqin, only one factor is categorized as a performance factor for the student and retiree groups, while performance factors account for 4 out of 8 and 2 out of 8 factors for the tourist and commuter groups, respectively. For passengers from Hengqin to Macau, only one factor is classified as a performance factor for the tourist and commuter groups, while performance factors account for 2 out of 8 and 3 out of 8 factors for the student and retiree groups, respectively.
The factor classifications for passengers from Macau to Hengqin are illustrated in Figure 5, Figure 6, Figure 7 and Figure 8, while factor classifications for passengers from Hengqin to Macau are illustrated in Figure 9, Figure 10, Figure 11 and Figure 12. The horizontal axis represents the average performance of each factor, while the vertical axis displays the IA Index for the corresponding factor.
Basic factors are regarded as “must be” factors. If they do not perform well, they have a detrimental effect on overall satisfaction. Basic factors with performance below passengers’ expectations (i.e., the average satisfaction of all factors) should be the highest priority improvements. However, once they meet passengers’ expectations, their impact on overall satisfaction becomes limited. Planners should only improve basic factors when their performance is poor, and the improvement is only made to align with passengers’ expectations to minimize overinvestment. Among passengers from Macau to Hengqin, all basic factors for the student and tourist groups exceed their expectations and therefore do not require further improvement. For the retiree group, factors such as path indication, operating lines, and operating hours for connecting transportation are below passengers’ expectations and must be prioritized for improvement. For the commuter group, operating hours and transfer distance for connecting transportation and customs flow management are below expectations and require urgent attention. For passengers from Hengqin to Macau, factors such as path indication and customs flow management in the port inspection hall are below passengers’ expectations for both the retiree and commuter groups and must be prioritized for improvement. Additionally, for the retiree group, operating hours and operating frequency for connecting transportation are below passengers’ expectations and require immediate attention.
Performance factors have a lower priority compared to basic factors. Although any improvement in performance factors can enhance overall satisfaction, there is a diminishing return once they meet passengers’ expectations. Among passengers from Macau to Hengqin, connecting transportation operating frequency for the retiree group and operating lines for the commuter group fall below passengers’ expectations and should be enhanced. For passengers from Hengqin to Macau, the performance of connecting transportation path indication and transfer distance for the retiree group fall below passengers’ expectations. Similarly, the performance of connecting transportation path indication and operating lines for the commuter group fall below passengers’ expectations and improvement should also be made.
Excitement factors refer to factors that do not cause dissatisfaction even if they do not meet passengers’ expectations, planners should improve excitement factors to the level beyond passengers’ expectations. Among the passengers from Macau to Hengqin, the excitement factors that exceed passengers’ expectations include path indication and customs inspection efficiency in the port inspection hall for the student group, connecting transportation operating lines and operating hours for the tourist group, and path indication in the port inspection hall for the commuter group. For the passengers from Hengqin to Macau, the excitement factors that exceed passengers’ expectations include connecting transportation operating lines and operating hours, customs inspection efficiency, and customs flow management for the student group; Operating lines and operating frequency for connecting transportation, as well as path indication and customs inspection efficiency in the port inspection hall for the tourist group.
The analyses of basic factors reveal that high-income groups are more likely to prioritize the reliability of cross-border travel, whereas low-income groups are more likely to value its convenience. For high-income commuters and tourists travel groups, basic factors include customs flow management, customs inspection efficiency, operating hours, and transfer distance. These factors are closely related to travel efficiency and reliability. In contrast, for low-income students and retirees travel groups, basic factors include path indication, operating lines, and operating hours, which are more associated with travel guidance and convenience.
This divergence is plausible. High-income people often have tighter time constraints for cross-border travel and thus prioritize the efficiency of customs inspections and the connections between transportation modes to ensure their travel time remains manageable.
5. Conclusions
Drawing on advanced mathematical methods in artificial intelligence, this study employs k-means clustering analysis and GBDT machine learning methods to explore the heterogeneity and asymmetry of cross-border travel satisfaction. This study aims to showcase the latest scientific research on the fundamental theory and applications of artificial intelligence techniques. The findings advance theoretical understanding and offer actionable insights for cross-border transportation planning and policy development, reflecting the practical application of advanced mathematical methods in artificial intelligence to drive intelligent decision-making. The contributions, key findings, recommendations, and limitations are summarized as follows:
First, this study introduces an analytical framework for investigating the whole cross-border travel process at Hengqin Port (encompassing the stages from connecting transportation to the port inspection hall and the customs inspection within the inspection hall). The framework examines factors that would influence travel satisfaction, including path indication, operating lines, operating hours, operating frequency, and transfer distance for connecting transportation, as well as path indication, customs inspection efficiency, and customs flow management in the port inspection hall.
Second, this study employs the k-means clustering analysis method within the realm of artificial intelligence to categorize cross-border passengers into four distinct groups, based on their socioeconomic and travel characteristics: "low-income students with high-frequency cross-border travel", " high-income tourists with low-frequency cross-border travel"," low-income retirees with low-frequency cross-border travel", and "high-income commuters with high-frequency cross-border travel."
Third, this study reveals prevalent asymmetric relationships between factors and cross-border overall travel satisfaction. The result aligns with the use of asymmetric research in studying passenger satisfaction in other urban planning investigations (Cao et al., 2020; Dong et al., 2019; Fang et al., 2021). Future studies on cross-border passenger satisfaction should account for these asymmetric relationships. Furthermore, heterogeneity was observed among different types of cross-border passengers: high-income individuals were more likely to prioritize the reliability of cross-border travel, whereas low-income individuals tended to emphasize the convenience of travel.
In addition, according to the three-factor theory, basic factors that fall below passengers’ expectations take priority. This is followed by performance factors that also fall below expectations, and lastly, excitement factors that exceed expectations. For the retiree group, planners should focus on enhancing the following factors: path indication, operating lines, and operating hours for connecting transportation on the Macau side, as well as operating hours and frequency for connecting transportation on the Hengqin side. Targeted recommendations include: 1) Strengthening path indication for connecting transportation on the Macau side to improve the visibility of traffic signage for this group. 2) Conducting further interviews to optimize the operating lines and operating hours of connecting transportation on the Macau side based on the specific needs of this group. 3) Proactively encouraging demand-responsive transit services to accommodate the flexible travel requirements of this group, thereby decreasing their dependence on fixed schedules.
For the commuter group, planners should prioritize investments in the following factors: operating hours, transfer distance for connecting transportation, and customs flow management on the Macau side. Targeted recommendations include: 1) Enhancing pedestrian navigation systems on the Macau side to improve signage visibility and streamline connections between public transit modes for this group. 2) Optimizing transfer pathways to shorten the walking distance for passengers during transfers. 3) Providing "frequent passenger" fast-track clearance channels for commuters with good credit records to enhance inspection efficiency for this group.
For the student group, which places greater emphasis on the efficiency of customs inspections, planners can include this group in the "frequent passenger" fast-track clearance channels to enhance their clearance efficiency. For the tourist group, which is more concerned with the service quality of connecting transportation, planners should optimize the operating lines and operating hours of connecting public transportation based on the specific needs of this group, improving the accessibility of major tourism and cultural attractions in Macau and Hengqin.
While this study applies advanced algorithms in the field of artificial intelligence to establish a conceptual analytical framework for identifying critical factors in cross-border travel factors and prioritizing improvement strategies, it has notable limitations. First, the framework does not incorporate cost considerations, which are critical for evaluating the financial feasibility and scalability of proposed improvements. This omission limits its direct applicability to real-world decision-making, where budgetary constraints and resource allocation often dictate implementation priorities. Future studies should build upon this foundational framework by integrating economic evaluations, such as cost-benefit or cost-effectiveness analyses, to assess the financial viability and implementation priorities of targeted service improvements. This would enable evidence-based policymaking and ensure resource allocation aligns with both passenger needs and institutional capacities.
References
- Abenoza, R. F.; Cats, O.; Susilo, Y. O. Travel satisfaction with public transport: Determinants, user classes, regional disparities and their evolution. Transportation Research Part A: Policy and Practice 2017, 95, 64–84. [Google Scholar] [CrossRef]
- Abenoza, R. F.; Cats, O.; Susilo, Y. O. Determinants of traveler satisfaction: Evidence for non-linear and asymmetric effects. Transportation Research Part F: Traffic Psychology and Behaviour 2019, 66, 339–356. [Google Scholar] [CrossRef]
- Allen, J.; Muñoz, J. C.; Ortúzar, J. de D. Modelling service-specific and global transit satisfaction under travel and user heterogeneity. Transportation Research Part A: Policy and Practice 2018, 113, 509–528. [Google Scholar] [CrossRef]
- Bagirov, A. M.; Aliguliyev, R. M.; Sultanova, N. Finding compact and well-separated clusters: Clustering using silhouette coefficients. Pattern Recognition 2023, 135, 109144. [Google Scholar] [CrossRef]
- Cai, H.; Li, B.; Li, W.; Wang, J. Heterogeneity in electric taxi charging behavior: Association with travel service characteristics. Travel Behaviour and Society 2025, 38, 100917. [Google Scholar] [CrossRef]
- Campos, N. F.; Coricelli, F.; Franceschi, E. Institutional integration and productivity growth: Evidence from the 1995 enlargement of the European Union. European Economic Review 2022, 142, 104014. [Google Scholar] [CrossRef]
- Cao, J.; Hao, Z.; Yang, J.; Yin, J.; Huang, X. Prioritizing neighborhood attributes to enhance neighborhood satisfaction: An impact asymmetry analysis. Cities 2020, 105, 102854. [Google Scholar] [CrossRef]
- Cappello, C.; Congedi, A.; De Iaco, S.; Mariella, L. Traditional Prediction Techniques and Machine Learning Approaches for Financial Time Series Analysis. Mathematics 2025, 13(3), 537. [Google Scholar] [CrossRef]
- Castillo-Díaz, F. J.; Belmonte-Ureña, L. J.; Diánez-Martínez, F.; Camacho-Ferre, F. Challenges and perspectives of the circular economy in the European Union: A comparative analysis of the member states. Ecological Economics 2024, 224, 108294. [Google Scholar] [CrossRef]
- Cavallaro, F.; Dianin, A. Efficiency of public transport for cross-border commuting: An accessibility-based analysis in Central Europe. Journal of Transport Geography 2020, 89, 102876. [Google Scholar] [CrossRef]
- Chen, L.; Yao, E.; Yang, Y.; Pan, L.; Liu, S. Understanding passengers’ intermodal travel behavior to improve air-rail service: A case study of Beijing-Tianjin-Hebei urban agglomeration. Journal of Air Transport Management 2024, 118, 102615. [Google Scholar] [CrossRef]
- Chiambaretto, P.; Baudelaire, C.; Lavril, T. Measuring the willingness-to-pay of air-rail intermodal passengers. Journal of Air Transport Management 2013, 26, 50–54. [Google Scholar] [CrossRef]
- Cottam, A.; Li, X.; Ma, X.; Wu, Y.-J. Large-Scale Freeway Traffic Flow Estimation Using Crowdsourced Data: A Case Study in Arizona. Journal of Transportation Engineering, Part A: Systems 2024, 150(7), 4024030. [Google Scholar] [CrossRef]
- Deng, J.; Li, T.; Yang, Z.; Yuan, Q.; Chen, X. Heterogeneity in route choice during peak hours: Implications on travel demand management. Travel Behaviour and Society 2025, 38, 100922. [Google Scholar] [CrossRef]
- Ding, C.; Cao; (Jason), X.; Næss, P. Applying gradient boosting decision trees to examine non-linear effects of the built environment on driving distance in Oslo. Transportation Research Part A: Policy and Practice 2018, 110, 107–117. [Google Scholar] [CrossRef]
- Ding, C.; Wu, X.; Yu, G.; Wang, Y. A gradient boosting logit model to investigate driver’s stop-or-run behavior at signalized intersections using high-resolution traffic data. Transportation Research Part C: Emerging Technologies 2016, 72, 225–238. [Google Scholar] [CrossRef]
- Dong, W.; Cao, X.; Wu, X.; Dong, Y. Examining pedestrian satisfaction in gated and open communities: An integration of gradient boosting decision trees and impact-asymmetry analysis. Landscape and Urban Planning 2019, 185, 246–257. [Google Scholar] [CrossRef]
- Du, P.; Li, F.; Shao, J. Multi-agent reinforcement learning clustering algorithm based on silhouette coefficient. Neurocomputing 2024, 596, 127901. [Google Scholar] [CrossRef]
- Duarte, M. P.; Carvalho, F. M. P.; de, O. How digital transformation shapes European union countries’ national systems of innovation: A configurational moderation approach. Journal of Innovation & Knowledge 2024, 9(4), 100578. [Google Scholar] [CrossRef]
- Edzes, A. J. E.; Van Dijk, J.; Broersma, L. Does cross-border commuting between EU-countries reduce inequality? Applied Geography 2022, 139, 102639. [Google Scholar] [CrossRef]
- Eltved, M.; Breyer, N.; Ingvardson, J. B.; Nielsen, O. A. Impacts of long-term service disruptions on passenger travel behaviour: A smart card analysis from the Greater Copenhagen area. Transportation Research Part C: Emerging Technologies 2021, 131, 103198. [Google Scholar] [CrossRef]
- Esmailpour, J.; Aghabayk, K.; Abrari Vajari, M.; De Gruyter, C. Importance–Performance Analysis (IPA) of bus service attributes: A case study in a developing country. Transportation Research Part A: Policy and Practice 2020, 142, 129–150. [Google Scholar] [CrossRef]
- Fang, D.; Xue, Y.; Cao, J.; Sun, S. Exploring satisfaction of choice and captive bus riders: An impact asymmetry analysis. Transportation Research Part D: Transport and Environment 2021, 93, 102798. [Google Scholar] [CrossRef]
- Gao, Y.; Pan, H.; Xie, Z.; Habib, K. N. Understanding patients heterogeneity in healthcare travel and hospital choice—A latent class analysis with covariates. Journal of Transport Geography 2023, 110, 103608. [Google Scholar] [CrossRef]
- Gerber, P.; Ma, T.-Y.; Klein, O.; Schiebel, J.; Carpentier-Postel, S. Cross-border residential mobility, quality of life and modal shift: A Luxembourg case study. Transportation Research Part A: Policy and Practice 2017, 104, 238–254. [Google Scholar] [CrossRef]
- Gerber, P.; Thériault, M.; Enaux, C.; Carpentier-Postel, S. Links between Attitudes, Mode Choice, and Travel Satisfaction: A Cross-Border Long-Commute Case Study. Sustainability 2020, 12(21), Article 21. [Google Scholar] [CrossRef]
- Gholi, H.; Kermanshah, M.; Reza Mamdoohi, A. Investigating the sources of heterogeneity in passengers’ preferences for transit service quality. Journal of Public Transportation 2022, 24, 100014. [Google Scholar] [CrossRef]
- Hui, E. C. M.; Li, X.; Chen, T.; Lang, W. Deciphering the spatial structure of China’s megacity region: A new bay area—The Guangdong-Hong Kong-Macao Greater Bay Area in the making. Cities 2020, 105, 102168. [Google Scholar] [CrossRef]
- Jiang, Y.; Xie, Y.; Shao, Q. How did Internet usage affect life satisfaction before and after COVID-19? Mediating effects and heterogeneity analysis. Socio-Economic Planning Sciences 2024, 95, 102007. [Google Scholar] [CrossRef]
- Jiang, Y.; Yu, S.; Guan, W.; Gao, S.; Feng, T. Ground access behaviour of air-rail passengers: A case study of Dalian ARIS. Travel Behaviour and Society 2021, 24, 152–163. [Google Scholar] [CrossRef]
- Kozera, A.; Satoła; Standar, A. European Union co-funded investments in low-emission and green energy in urban public transport in Poland. Renewable and Sustainable Energy Reviews 2024, 200, 114530. [Google Scholar] [CrossRef]
- Li, L.; Li, J.; Peng, L.; Wang, X.; Sun, S. Spatiotemporal evolution and influencing factors of land-use emissions in the Guangdong-Hong Kong-Macao Greater Bay Area using integrated nighttime light datasets. Science of The Total Environment 2023, 893, 164723. [Google Scholar] [CrossRef]
- Li, L.; Loo, B. P. Y. Towards people-centered integrated transport: A case study of Shanghai Hongqiao Comprehensive Transport Hub. Cities 2016, 58, 50–58. [Google Scholar] [CrossRef]
- Li, Y.; Zhang, X.; Xia, C. Towards a greening city: How does regional cooperation promote urban green space in the Guangdong-Hong Kong-Macau Greater Bay Area? Urban Forestry & Urban Greening 2023, 86, 128033. [Google Scholar] [CrossRef]
- Liu, J.; Shi, W. A cross-boundary travel tale: Unraveling Hong Kong residents’ mobility pattern in Shenzhen by using metro smart card data. Applied Geography 2021, 130, 102416. [Google Scholar] [CrossRef]
- Lletı, R.; Ortiz, M. C.; Sarabia, L. A.; Sánchez, M. S. Selecting variables for k-means cluster analysis by using a genetic algorithm that optimises the silhouettes. Analytica Chimica Acta 2004, 515(1), 87–100. [Google Scholar] [CrossRef]
- Luo, S.; He, S. Y.; Grant-Muller, S.; Song, L. Influential factors in customer satisfaction of transit services: Using crowdsourced data to capture the heterogeneity across individuals, space and time. Transport Policy 2023, 131, 173–183. [Google Scholar] [CrossRef]
- Luo, X.; Ma, X.; Munden, M.; Wu, Y.-J.; Jiang, Y. A Multisource Data Approach for Estimating Vehicle Queue Length at Metered On-Ramps. Journal of Transportation Engineering, Part A: Systems 2022, 148(2), 1–9. [Google Scholar] [CrossRef]
- Luo, X.; Shen, J. The making of new regionalism in the cross-boundary metropolis of Hong Kong–Shenzhen, China. Habitat International 2012, 36(1), 126–135. [Google Scholar] [CrossRef]
- Ma, X. Traffic Performance Evaluation Using Statistical and Machine Learning Methods; The University of Arizona, 2022. [Google Scholar]
- Ma, X.; Cottam, A.; Shaon, M. R. R.; Wu, Y.-J. A Transfer Learning Framework for Proactive Ramp Metering Performance Assessment. ArXiv Preprint 2023, ArXiv:2308.03542. [Google Scholar]
- Ma, X.; Karimpour, A.; Wu, Y.-J. Statistical evaluation of data requirement for ramp metering performance assessment. Transportation Research Part A: Policy and Practice 2020, 141, 248–261. [Google Scholar] [CrossRef]
- Ma, X.; Karimpour, A.; Wu, Y.-J. A Causal Inference Approach to Eliminate the Impacts of Interfering Factors on Traffic Performance Evaluation. ArXiv Preprint 2023a, ArXiv:2308.03545. [Google Scholar]
- Ma, X.; Karimpour, A.; Wu, Y.-J. Eliminating the impacts of traffic volume variation on before and after studies: a causal inference approach. Journal of Intelligent Transportation Systems 2023b, 1–15. [Google Scholar] [CrossRef]
- Ma, X.; Karimpour, A.; Wu, Y.-J. On-ramp and Off-ramp Traffic Flows Estimation Based on A Data-driven Transfer Learning Framework. ArXiv Preprint 2023c, ArXiv:2308.03538. [Google Scholar]
- Ma, X.; Karimpour, A.; Wu, Y. J. Data-driven transfer learning framework for estimating on-ramp and off-ramp traffic flows. Journal of Intelligent Transportation Systems: Technology, Planning, and Operations 2024, 1–14. [Google Scholar] [CrossRef]
- Ma, X.; Noh, H.; Hatch, R.; Tokishi, J.; Wang, Z. Data-Driven Transfer Learning Framework for Estimating Turning Movement Counts. ArXiv Preprint 2024, ArXiv:2412.09861. [Google Scholar]
- Ma, X.; Noh, H.; Hatch, R.; Tokishi, J.; Wang, Z. Domain Adaptation Framework for Turning Movement Count Estimation with Limited Data. ArXiv Preprint 2025, ArXiv:2503.20113. [Google Scholar]
- Maciejewska, M.; Boussauw, K.; Kębłowski, W.; Van Acker, V. Assessing public transport loyalty in a car-dominated society: The case of Luxembourg. Journal of Public Transportation 2023, 25, 100061. [Google Scholar] [CrossRef]
- Matzler, K.; Sauerwein, E.; Heischmidt, K. Importance-performance analysis revisited: The role of the factor structure of customer satisfaction. The Service Industries Journal 2003, 23(2), 112–129. [Google Scholar] [CrossRef]
- McIlroy, R. C. “This is where public transport falls down”: Place based perspectives of multimodal travel. Transportation Research Part F: Traffic Psychology and Behaviour 2023, 98, 29–46. [Google Scholar] [CrossRef]
- Novotný, L. Assessing the role of rural tourism in fostering cross-border integration within the EU: A case study of the Czech-German-Polish borderland. Journal of Rural Studies 2025, 114, 103529. [Google Scholar] [CrossRef]
- Ramos, J. I. Piecewise Analytical Approximation Methods for Initial-Value Problems of Nonlinear Ordinary Differential Equations. Mathematics 2025, 13(3), 333. [Google Scholar] [CrossRef]
- Ren, Y.; Yang, M.; Chen, E.; Cheng, L.; Yuan, Y. Exploring passengers’ choice of transfer city in air-to-rail intermodal travel using an interpretable ensemble machine learning approach. Transportation 2024, 51(4), 1493–1523. [Google Scholar] [CrossRef]
- Sener, I. N.; Lorenzini, K. M.; Aldrete, R. M. A synthesis on cross-border travel: Focus on El Paso, Texas, retail sales, and pedestrian travel. Research in Transportation Business & Management 2015, 16, 102–111. [Google Scholar] [CrossRef]
- Shen, J. Not quite a twin city: Cross-boundary integration in Hong Kong and Shenzhen. Habitat International 2014, 42, 138–146. [Google Scholar] [CrossRef]
- Singh, H.; Kathuria, A. Heterogeneity in passenger satisfaction of bus rapid transit system among age and gender groups: A PLS-SEM Multi-group analysis. Transport Policy 2023, 141, 27–41. [Google Scholar] [CrossRef]
- Sun, S.; Fang, D.; Cao, J. Exploring the asymmetric influences of stop attributes on rider satisfaction with bus stops. Travel Behaviour and Society 2020, 19, 162–169. [Google Scholar] [CrossRef]
- Tuan, V. A.; Van Truong, N.; Tetsuo, S.; An, N. N. Public transport service quality: Policy prioritization strategy in the importance-performance analysis and the three-factor theory frameworks. Transportation Research Part A: Policy and Practice 2022, 166, 118–134. [Google Scholar] [CrossRef]
- Wang, J.; Chandra, K.; Du, C.; Ding, W.; Wu, X. Assessing the Potential of Cross-border regional innovation Systems:A case study of the Hong Kong-Shenzhen region. Technology in Society 2021, 65, 101557. [Google Scholar] [CrossRef]
- Wang, P.; Tao, Q.; Dong, H.; El-Fallah, G. M. A. M. Advanced machine learning analysis of radiation hardening in reduced-activation ferritic/martensitic steels. Computational Materials Science 2025, 251, 113773. [Google Scholar] [CrossRef]
- Wang, Q.; Hu, H. Rise of Interjurisdictional Commuters and Their Mode Choice: Evidence from the Chicago Metropolitan Area. Journal of Urban Planning and Development 2017, 143(3), 05017004. [Google Scholar] [CrossRef]
- Wang, Z.; Ma, X.; Yang, H.; Lyu, W.; Liu, Y.; Sun, P.; Guntuku, S. C. Uncertainty-aware crime prediction with spatial temporal multivariate graph neural networks. ICASSP 2025-2025 IEEE International Conference on Acoustics, Speech and Signal Processing (ICASSP); 2025; pp. 1–5. [Google Scholar]
- Wu, J.; Zhao, G.; Wang, M.; Xu, Y.; Wang, N. Concrete carbonation depth prediction model based on a gradient-boosting decision tree and different metaheuristic algorithms. Case Studies in Construction Materials 2024, 21, e03864. [Google Scholar] [CrossRef]
- Wu, X.; Cao, J.; Huting, J. Using three-factor theory to identify improvement priorities for express and local bus services: An application of regression with dummy variables in the Twin Cities. Transportation Research Part A: Policy and Practice 2018, 113, 184–196. [Google Scholar] [CrossRef]
- Wu, X.; (Jason) Cao, X.; Ding, C. Exploring rider satisfaction with arterial BRT: An application of impact asymmetry analysis. Travel Behaviour and Society 2020, 19, 82–89. [Google Scholar] [CrossRef]
- Wu, Y.-J.; Cottam, A.; Ma, X. Data-Driven Evaluation for ADOT Ramp Metering: Developing Ramp Metering Evaluation Tool; 2019. [Google Scholar]
- Xu, J.; Di Nardo, M.; Yin, S. Improved Swarm Intelligence-Based Logistics Distribution Optimizer: Decision Support for Multimodal Transportation of Cross-Border E-Commerce. Mathematics 2024, 12(5), 763. [Google Scholar] [CrossRef]
- Yang, J.; Zhao, C.; Yu, H.; Chen, H. Use GBDT to Predict the Stock Market. Procedia Computer Science 2020, 174, 161–171. [Google Scholar] [CrossRef]
- Yang, H.; Lin, J.; Shi, J.; Ma, X. Application of Historical Comprehensive Multimodal Transportation Data for Testing the Commuting Time Paradox: Evidence from the Portland, OR Region. Applied Sciences 2024, 14(18), 8369. [Google Scholar] [CrossRef]
- Yang, M.; Wang, Z.; Cheng, L.; Chen, E. Exploring satisfaction with air-HSR intermodal services: A Bayesian network analysis. Transportation Research Part A: Policy and Practice 2022, 156, 69–89. [Google Scholar] [CrossRef]
- Yuan, Y.; Yang, M.; Feng, T.; Ma, Y.; Ren, Y.; Ruan, X. Heterogeneity in the transfer time of air-rail intermodal passengers based on ticket booking data. Transportation Research Part A: Policy and Practice 2022, 165, 533–552. [Google Scholar] [CrossRef]
- Yuan, Y.; Yang, M.; Feng, T.; Rasouli, S.; Ruan, X.; Wang, X.; Li, Y. Analyzing heterogeneity in passenger satisfaction, loyalty, and complaints with air-rail integrated services. Transportation Research Part D: Transport and Environment 2021, 97, 102950. [Google Scholar] [CrossRef]
- Zeng, Z.; Wang, M.; Gao, X.; Wang, N. Exploring Passenger Satisfaction in Multimodal Railway Hubs: A Social Media-Based Analysis of Travel Behavior in China’s Major Rail Stations. Sustainability 2024, 16(12), 4881. [Google Scholar] [CrossRef]
- Zhang, J.; Yang, M.; Ji, J.; Feng, T.; Yuan, Y.; Chen, E.; Wang, L. Customizing the promotion strategies of integrated air-bus service based on passenger satisfaction. Transportation Research Part D: Transport and Environment 2022, 109, 103385. [Google Scholar] [CrossRef]
- Zhang, X.; Lu, Y.; Xu, Y.; Zhou, C.; Zou, Y. Governing regional inequality through regional cooperation? A case study of the Guangdong-Hong Kong-Macau Greater Bay area. Applied Geography 2024, 162, 103135. [Google Scholar] [CrossRef]
- Zhang, Y.; Haghani, A. A gradient boosting method to improve travel time prediction. Transportation Research Part C: Emerging Technologies 2015, 58, 308–324. [Google Scholar] [CrossRef]
- Zhang, Z.; Sun, Y.; Wang, Z.; Nie, Y.; Ma, X.; Sun, P.; Li, R. Large Language Models for Mobility in Transportation Systems: A Survey on Forecasting Tasks. ArXiv Preprint 2024, ArXiv:2405.02357. [Google Scholar]
- Zhou, Z.; Cheng, L.; Yang, M.; Wang, L.; Chen, W.; Gong, J.; Zou, J. Analysis of passenger perception heterogeneity and differentiated service strategy for air-rail intermodal travel. Travel Behaviour and Society 2024, 37, 100872. [Google Scholar] [CrossRef]
- Zhou, Z.; Yang, M.; Cheng, L.; Yuan, Y.; Gan, Z. Do passengers feel convenient when they transfer at the transportation hub? Behaviour and Society 2022, 29, 65–77. [Google Scholar] [CrossRef]
Figure 1.
Three-factor theory of satisfaction. Derived from (Cao et al., 2020).
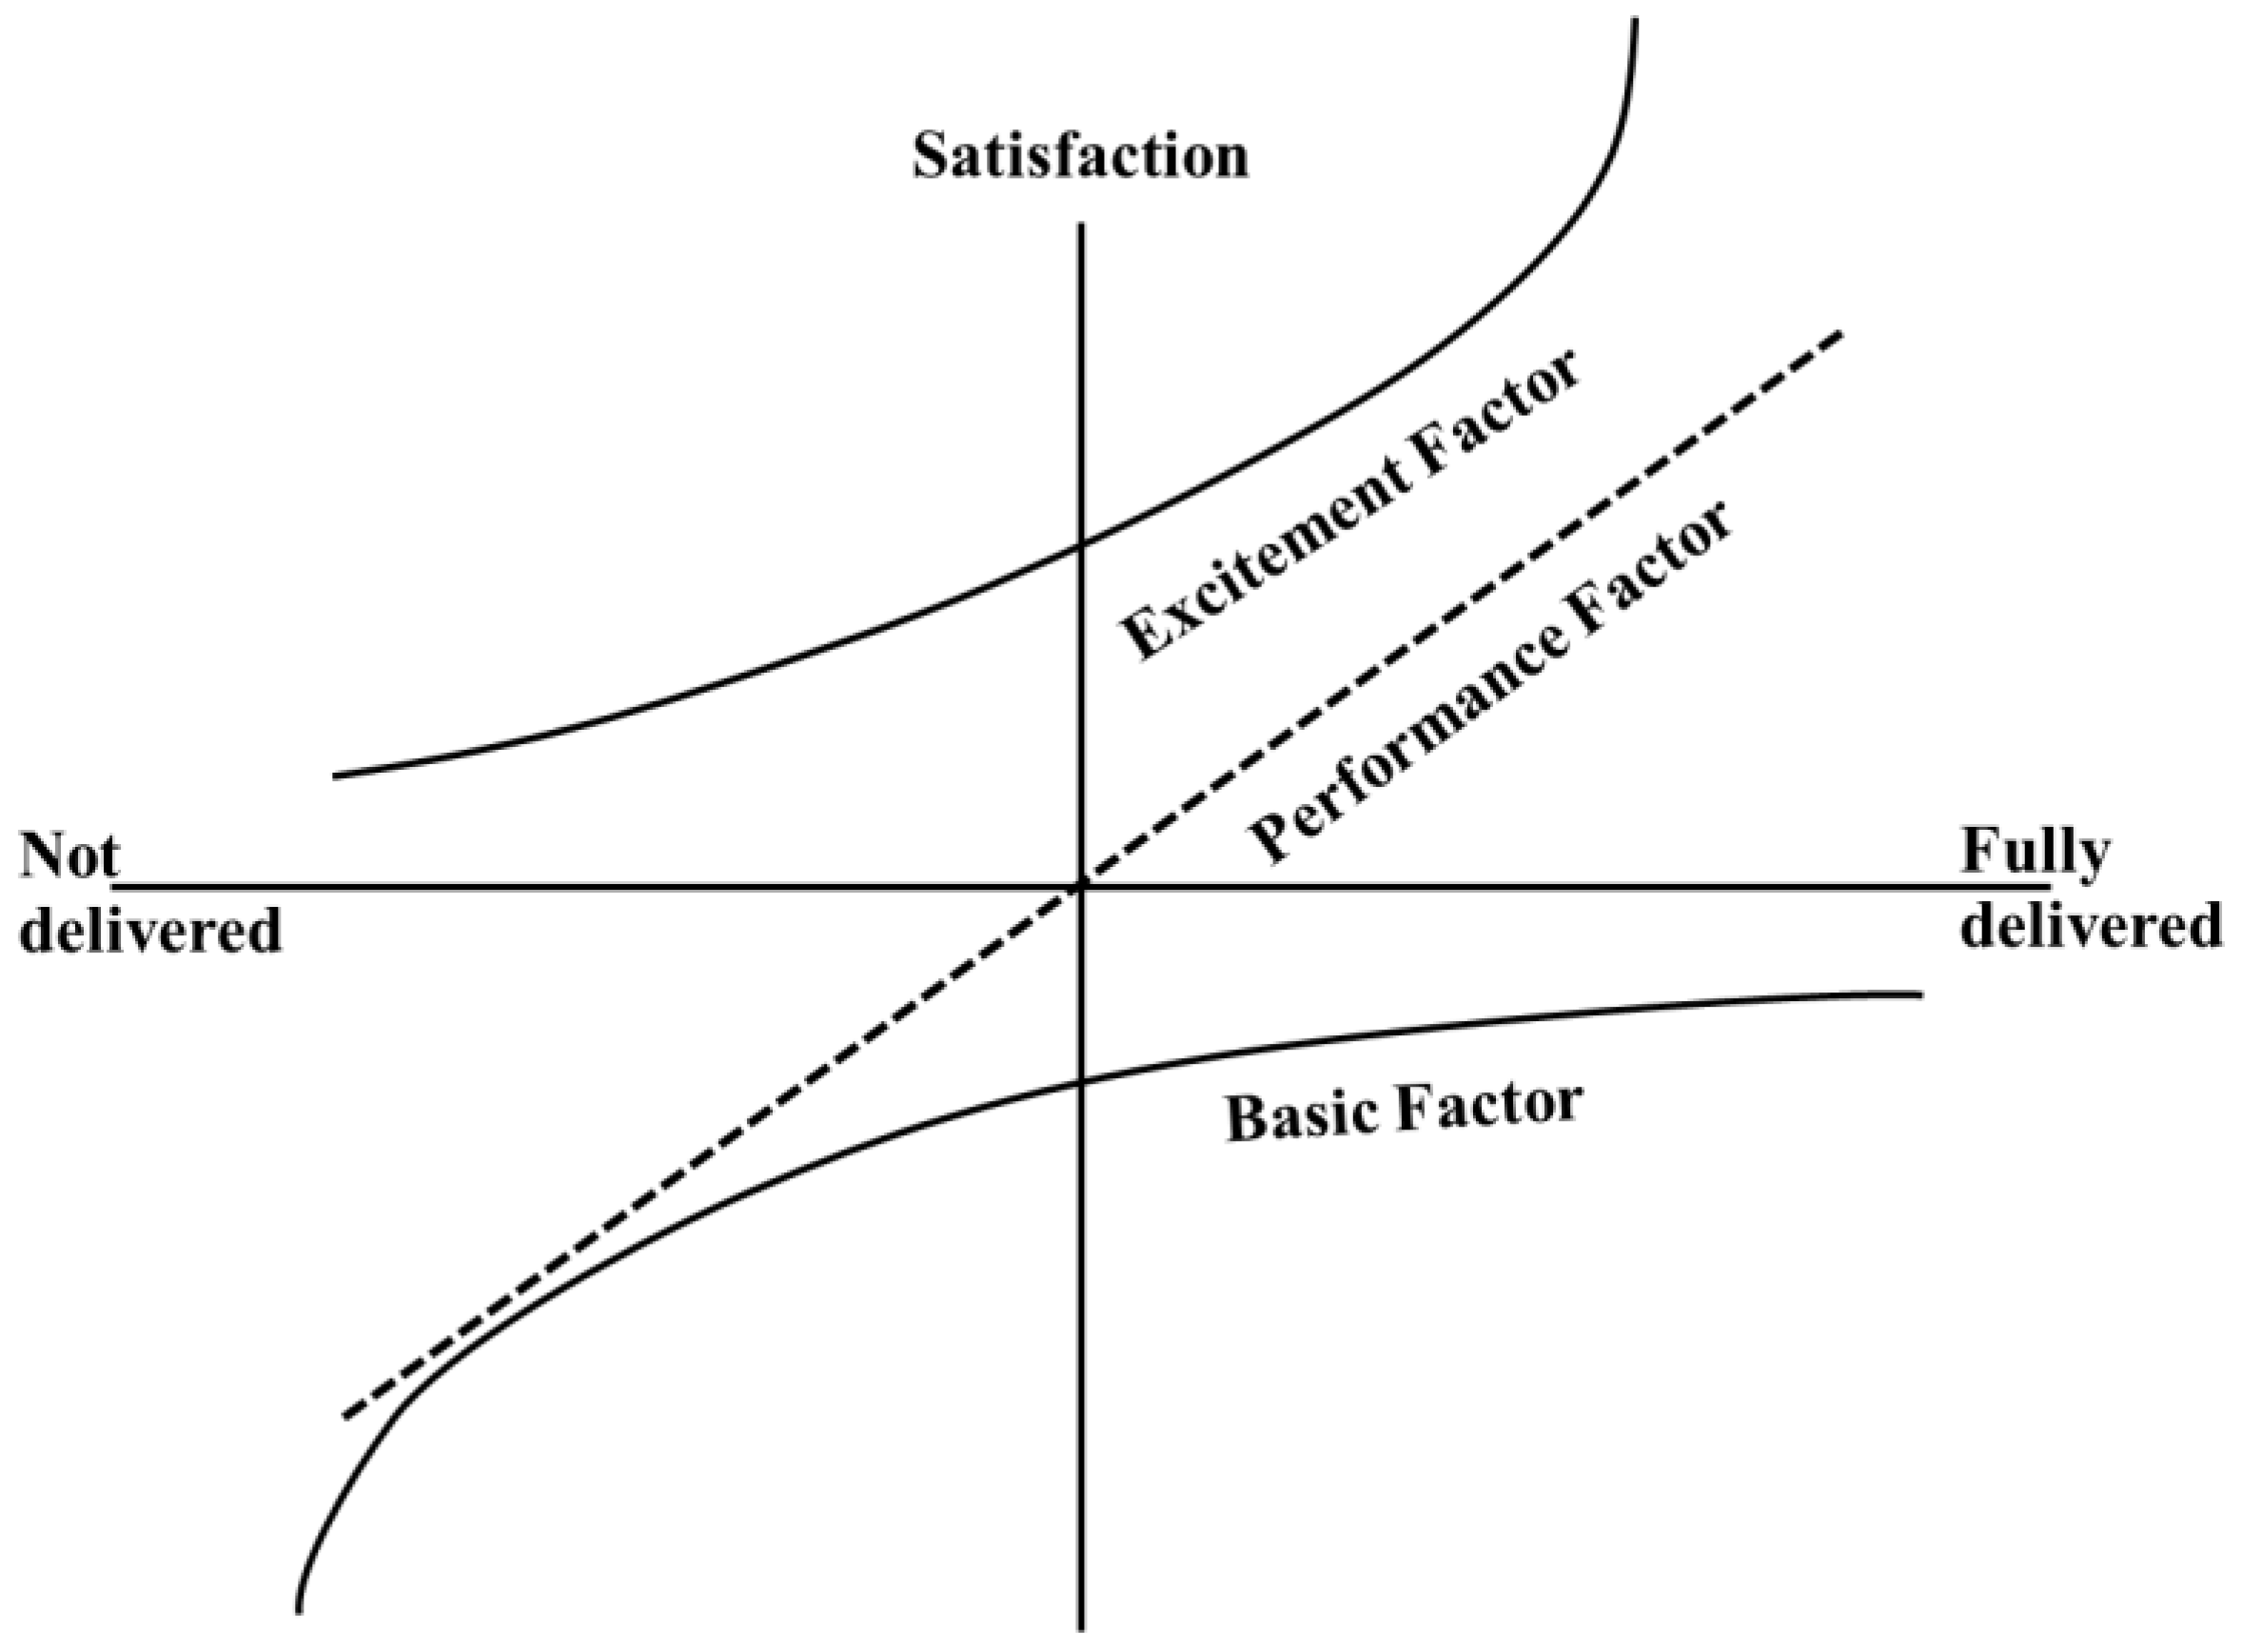
Figure 2.
Location of Hengqin Port.
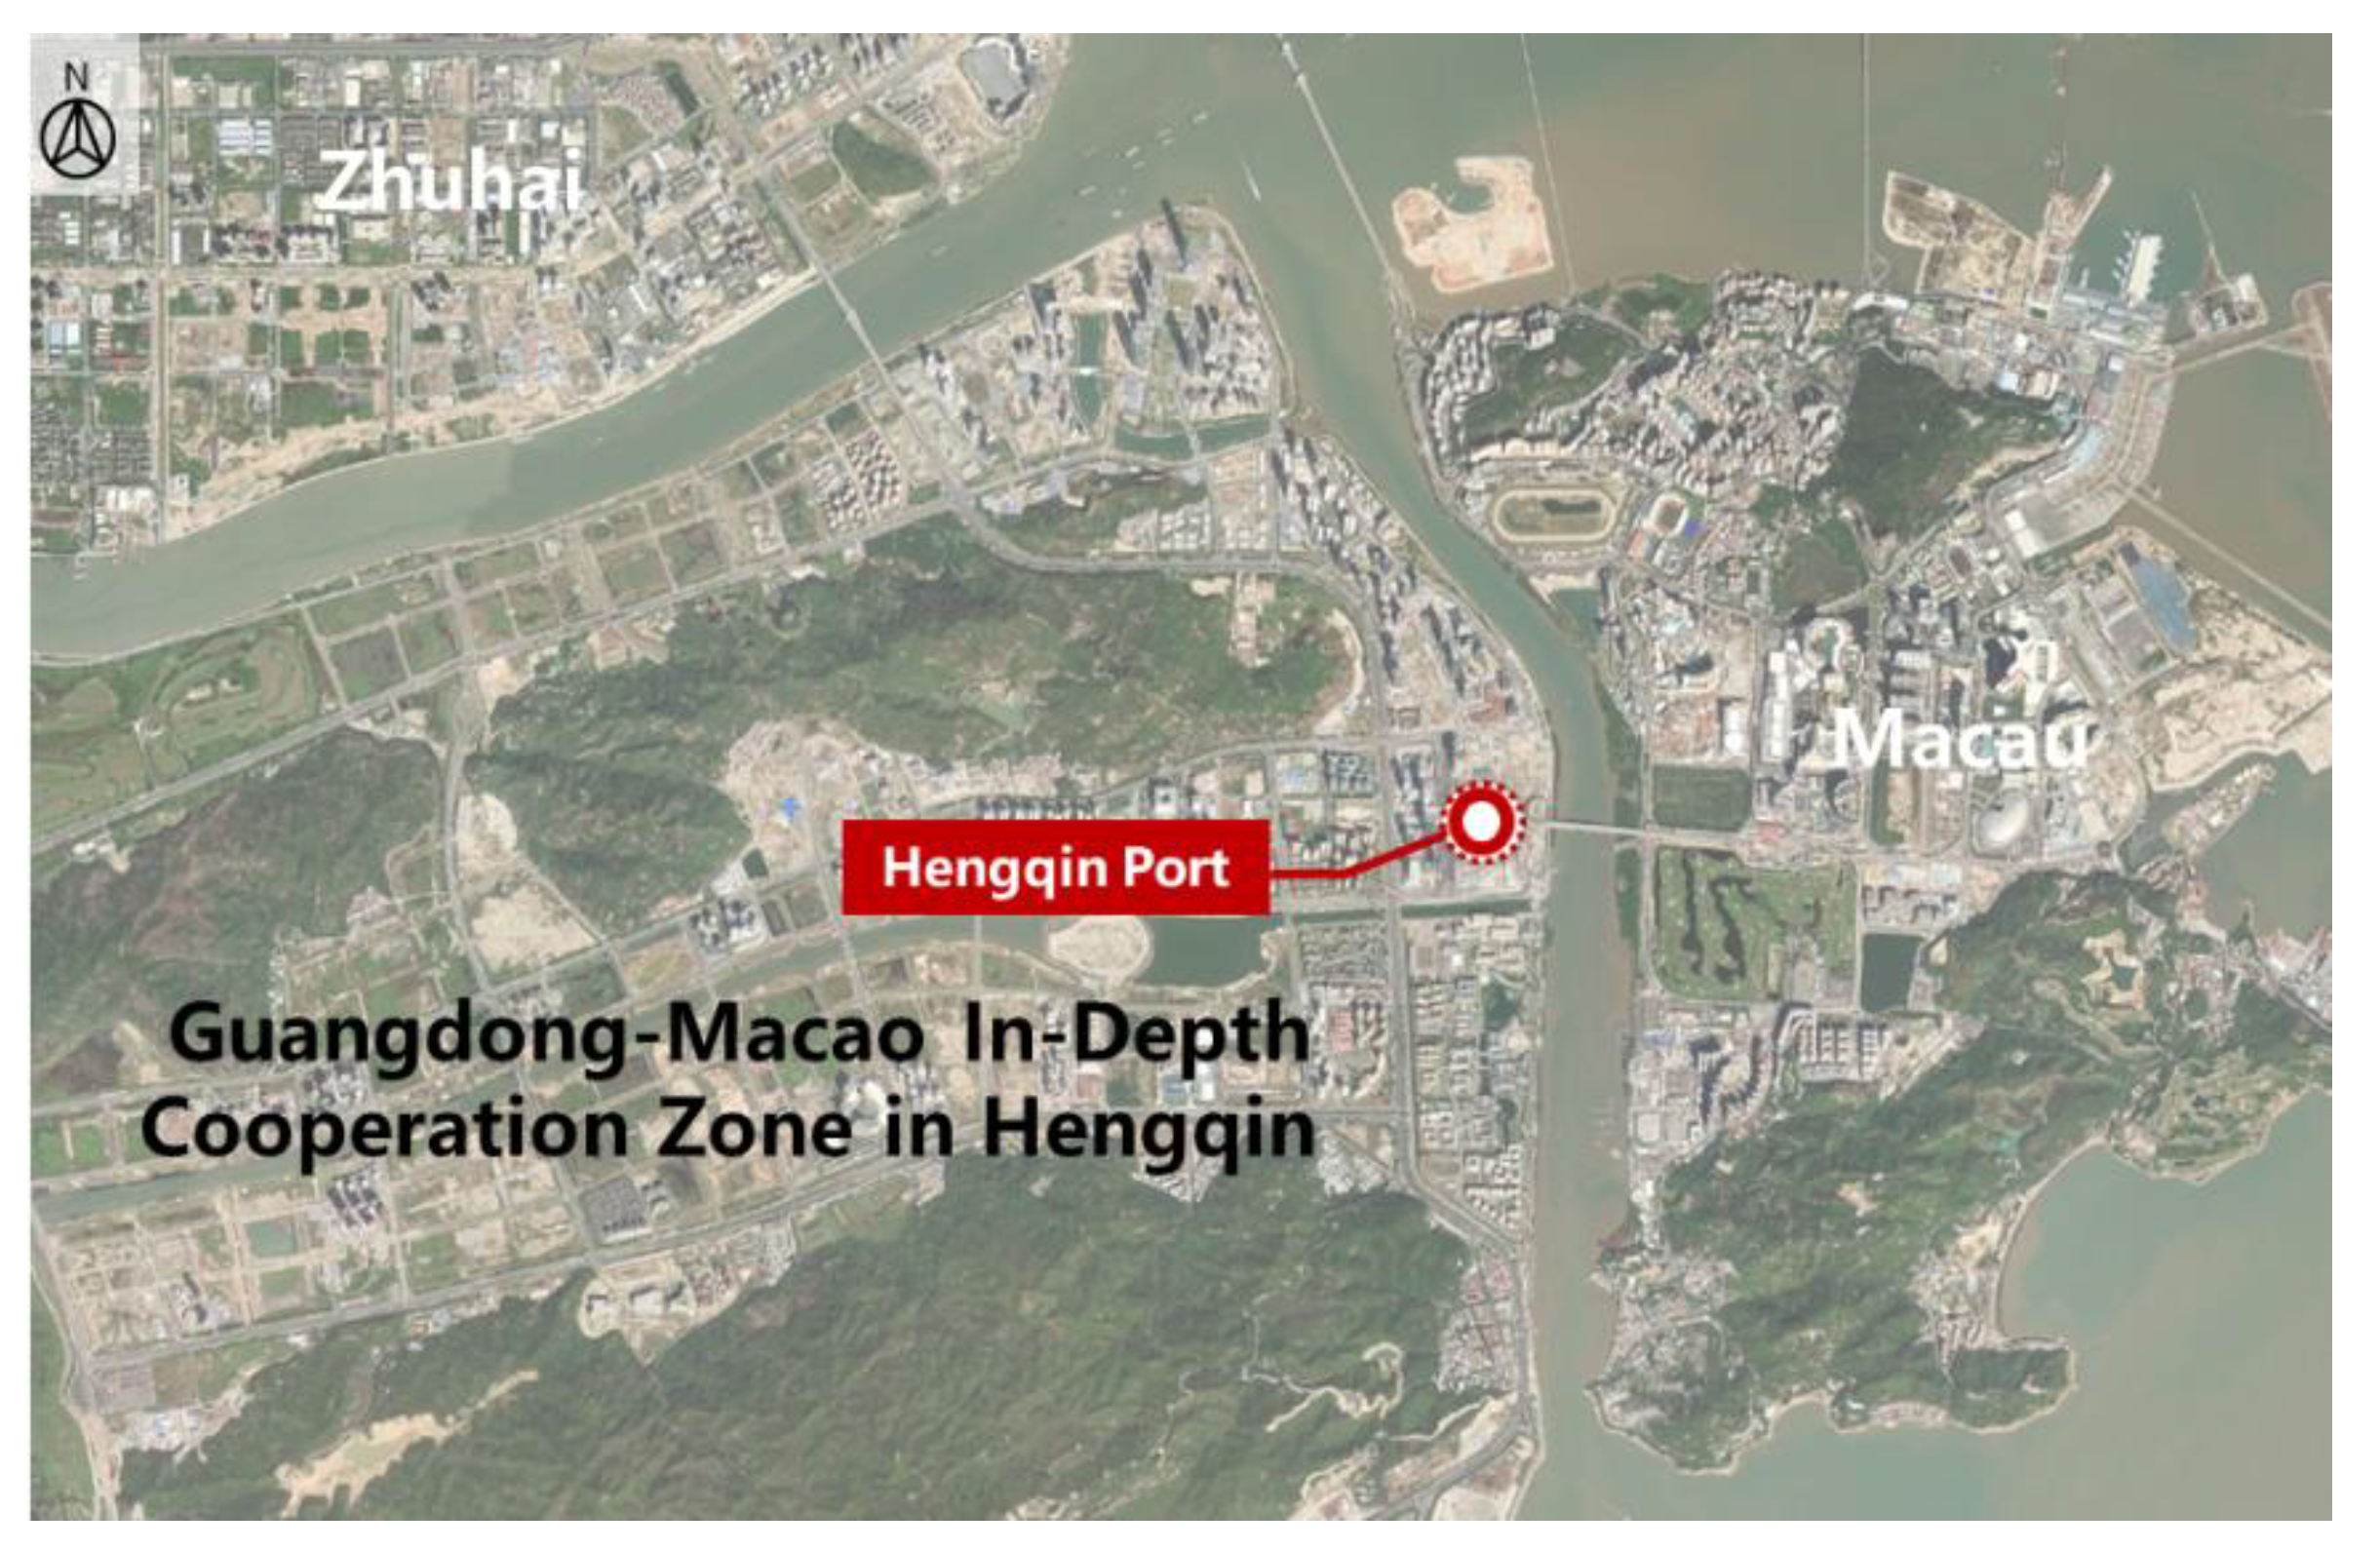
Figure 3.
The variation of silhouette coefficient k for passengers from Macau to Hengqin.
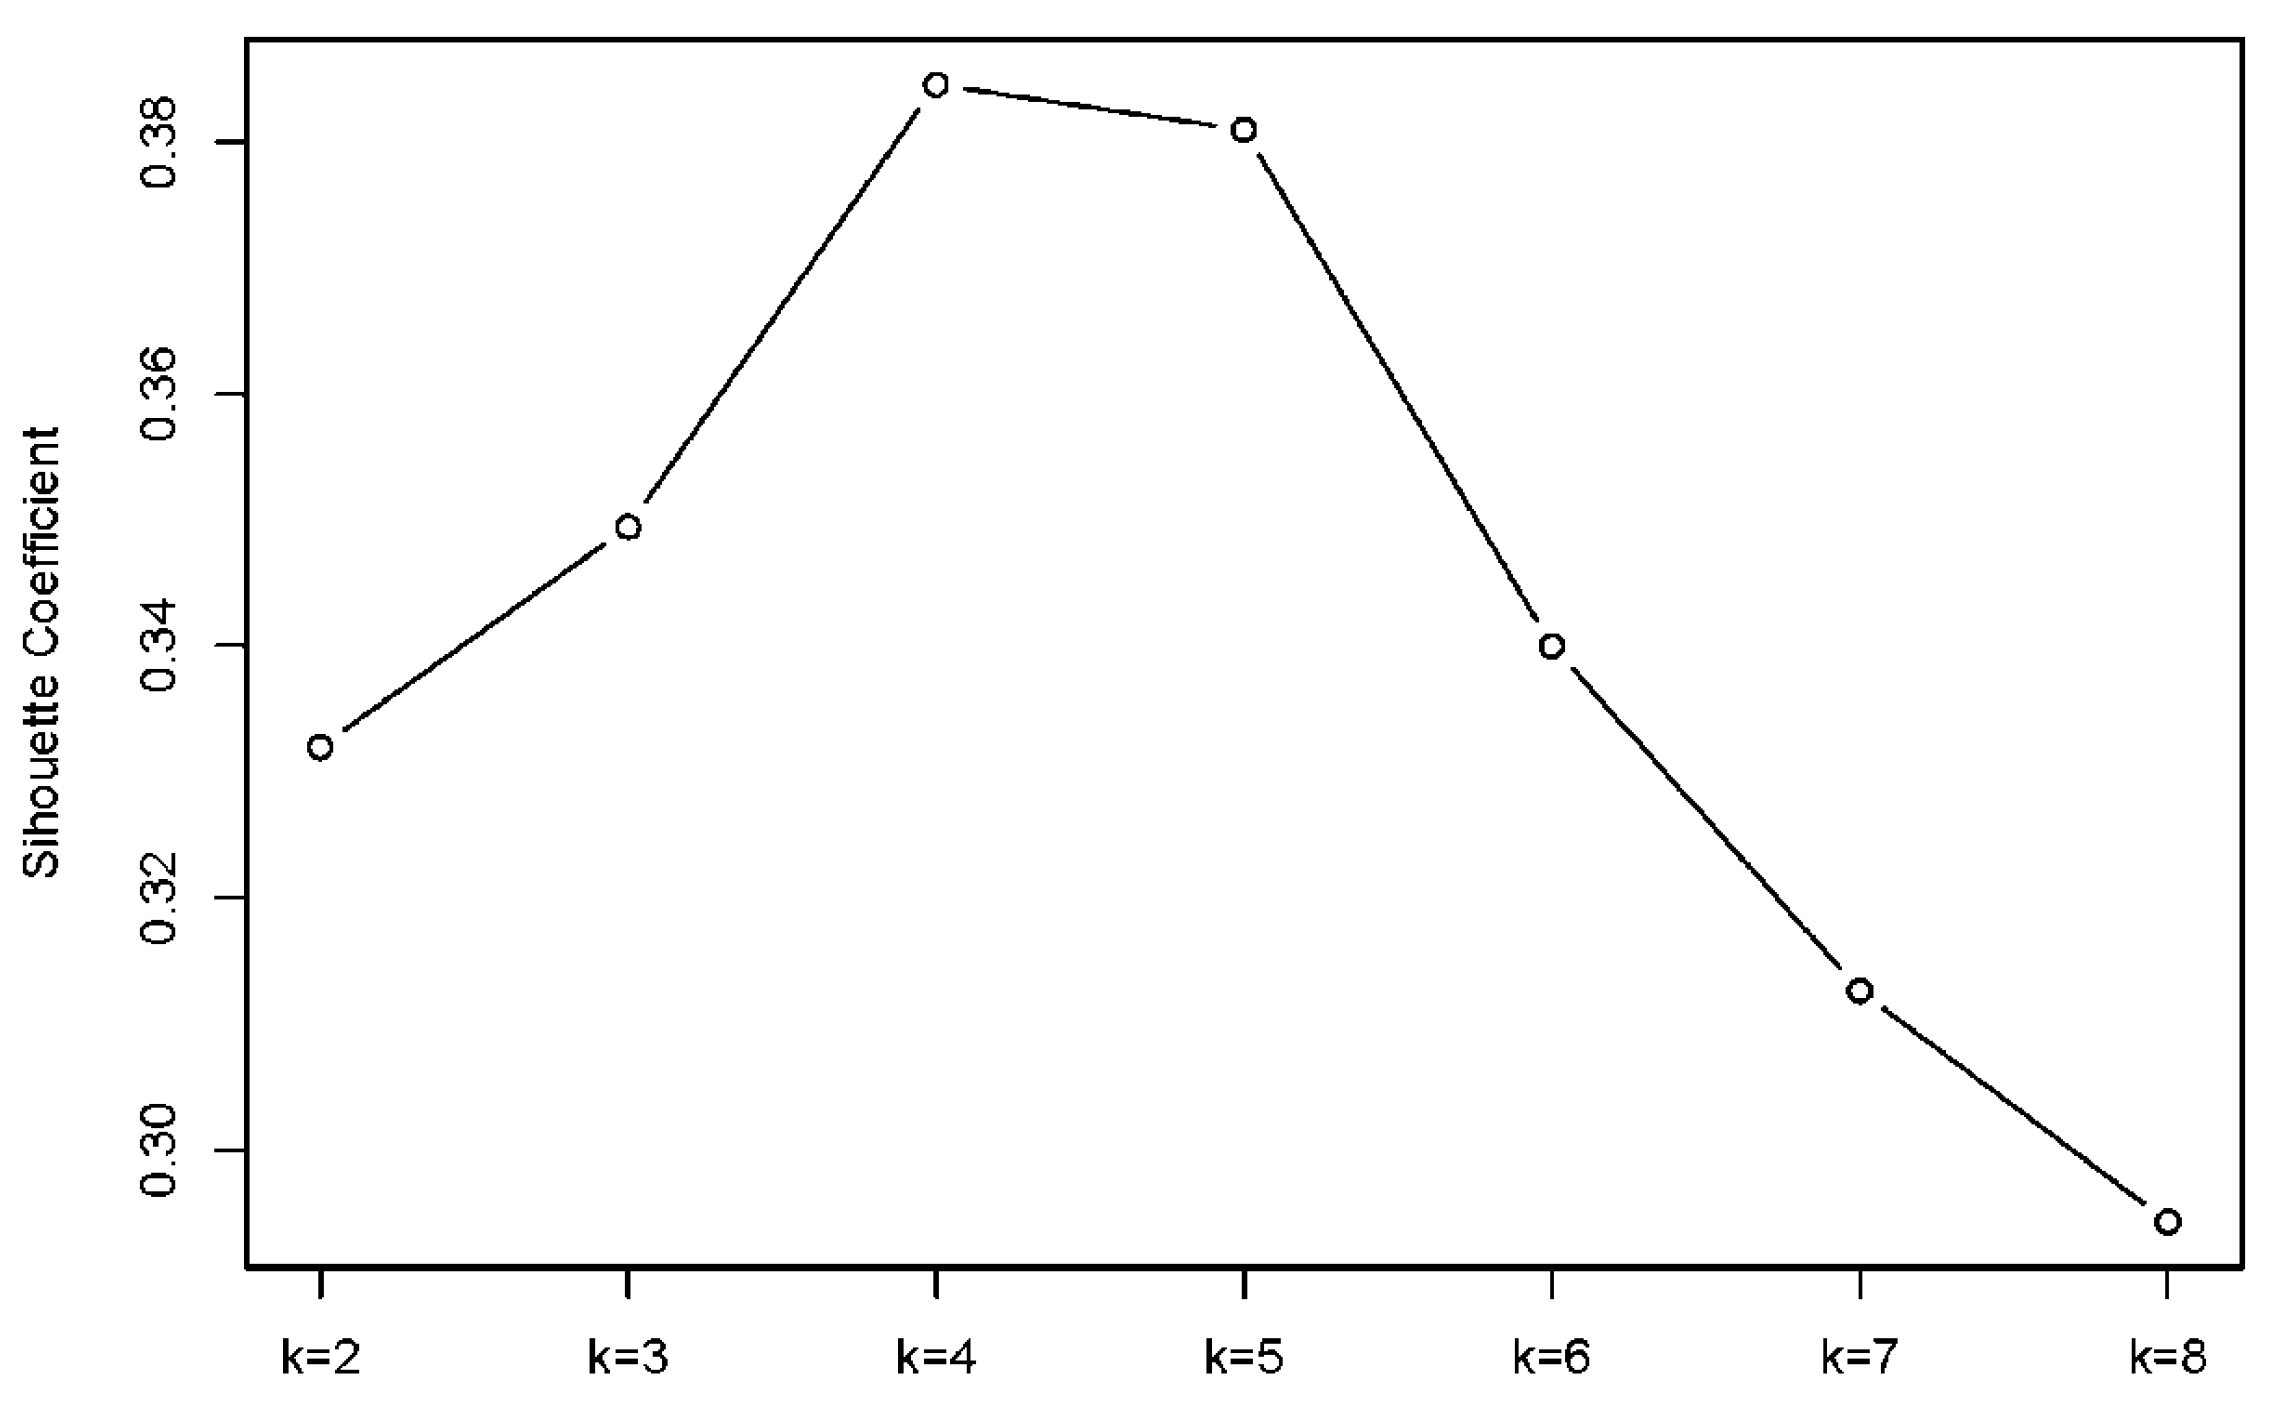
Figure 4.
The variation of silhouette coefficient k for passengers from Hengqin to Macau.
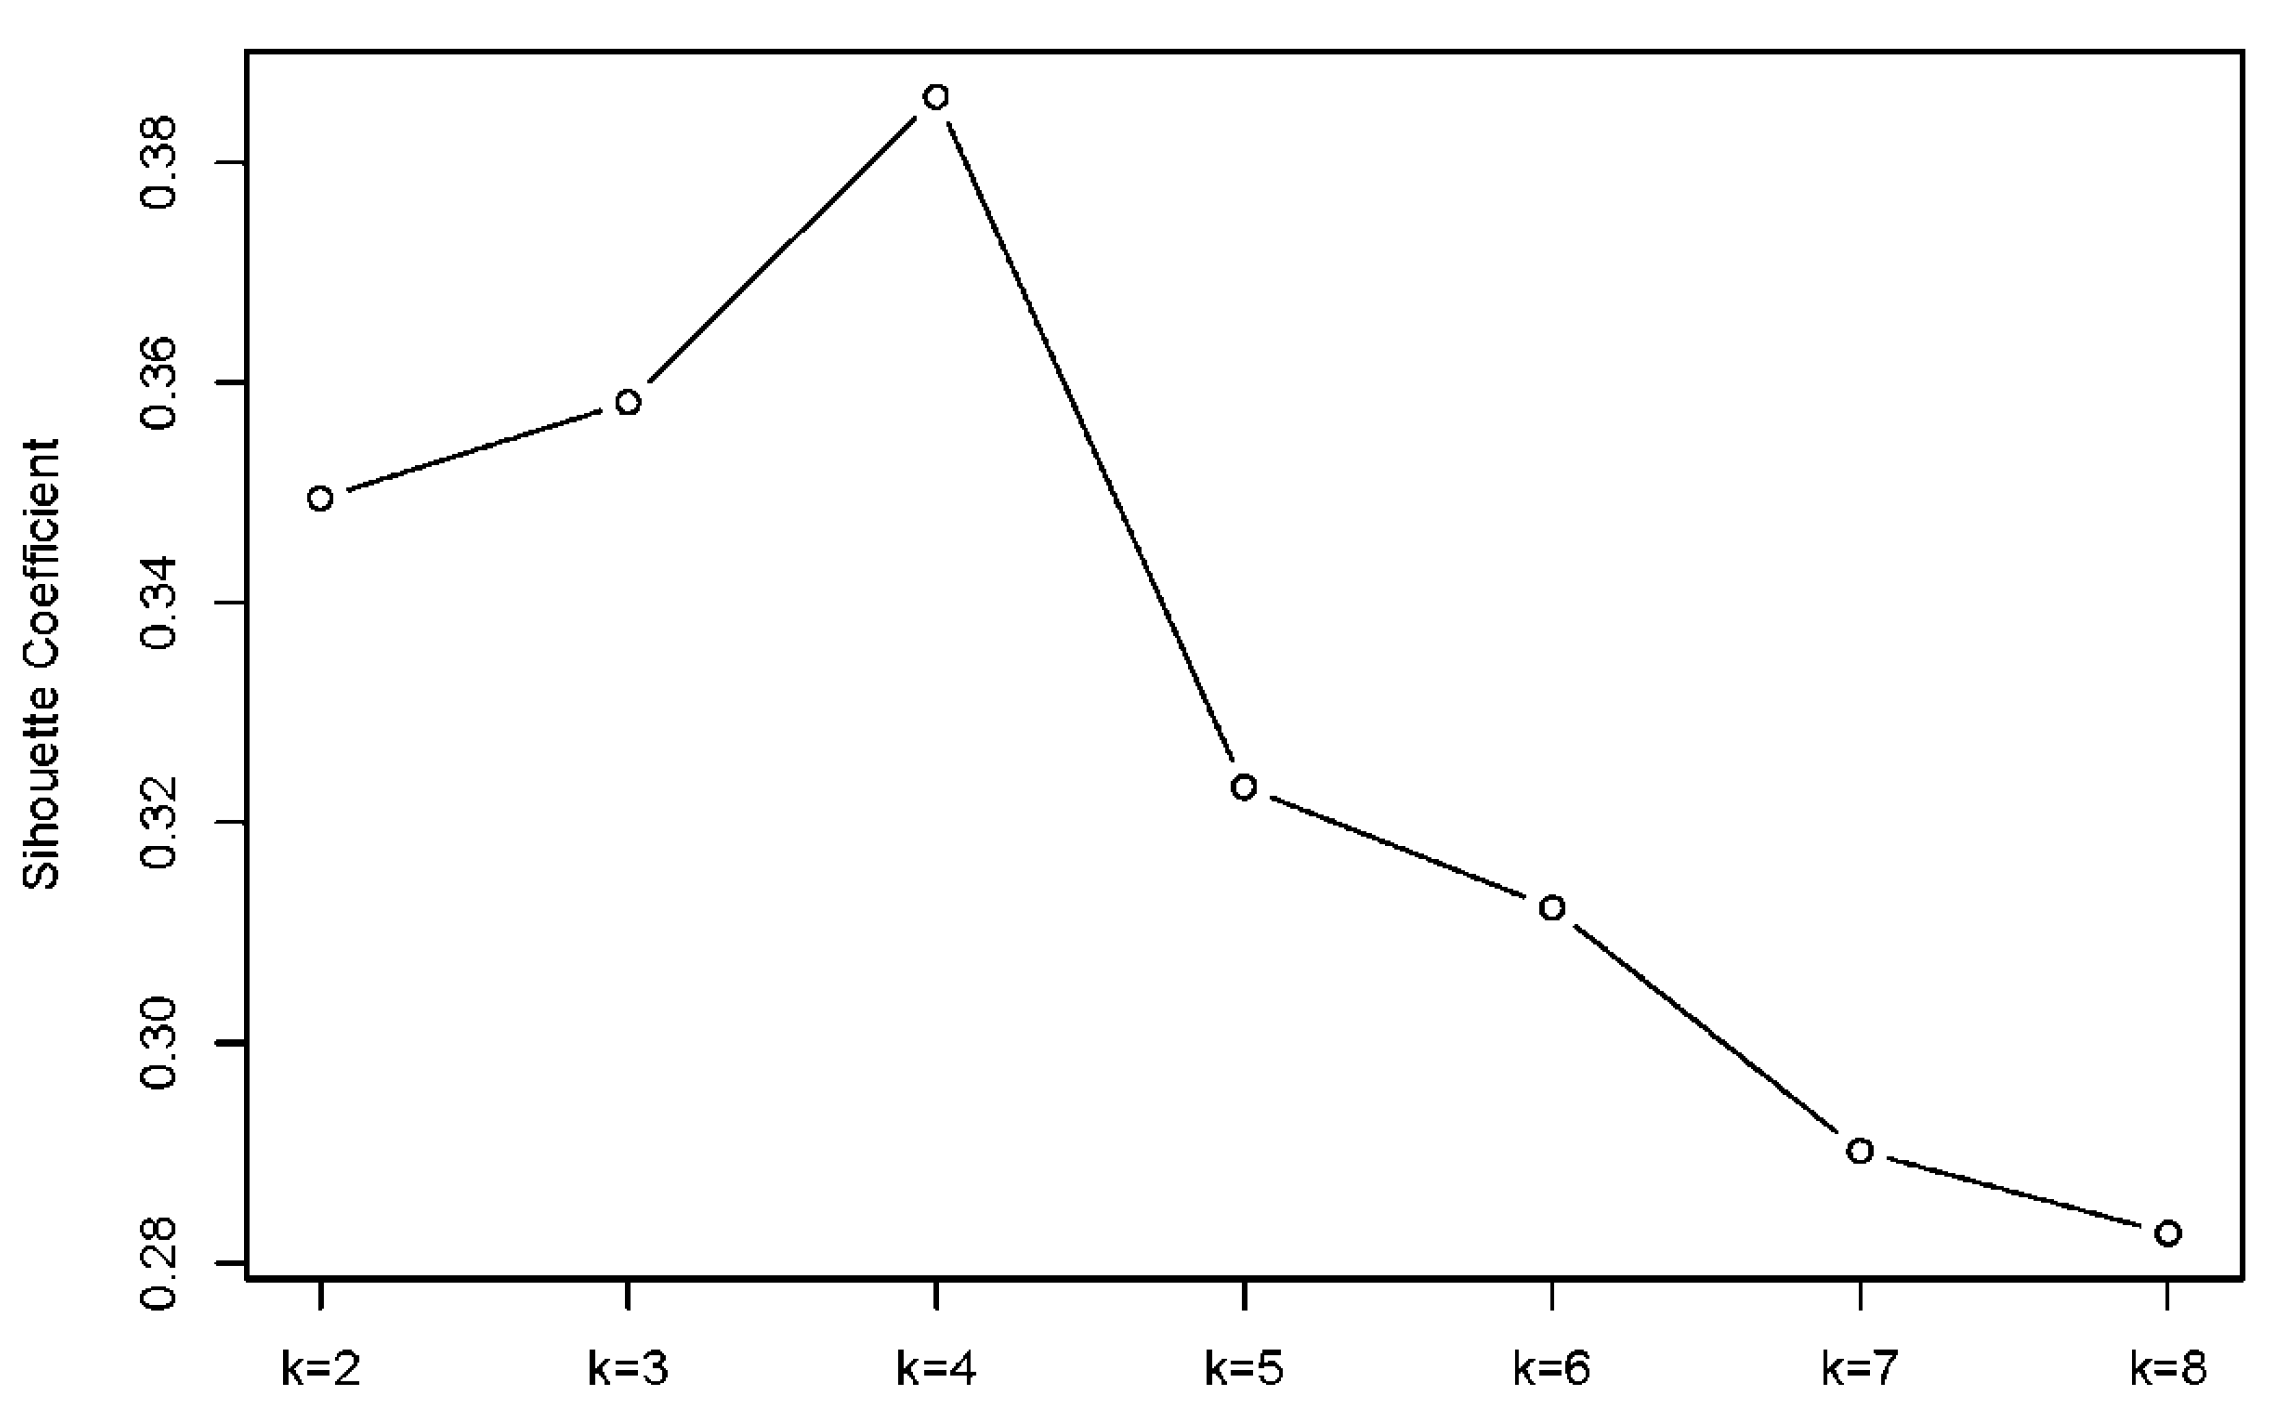
Figure 5.
Factor classifications from Student group of Macau passengers to Hengqin.
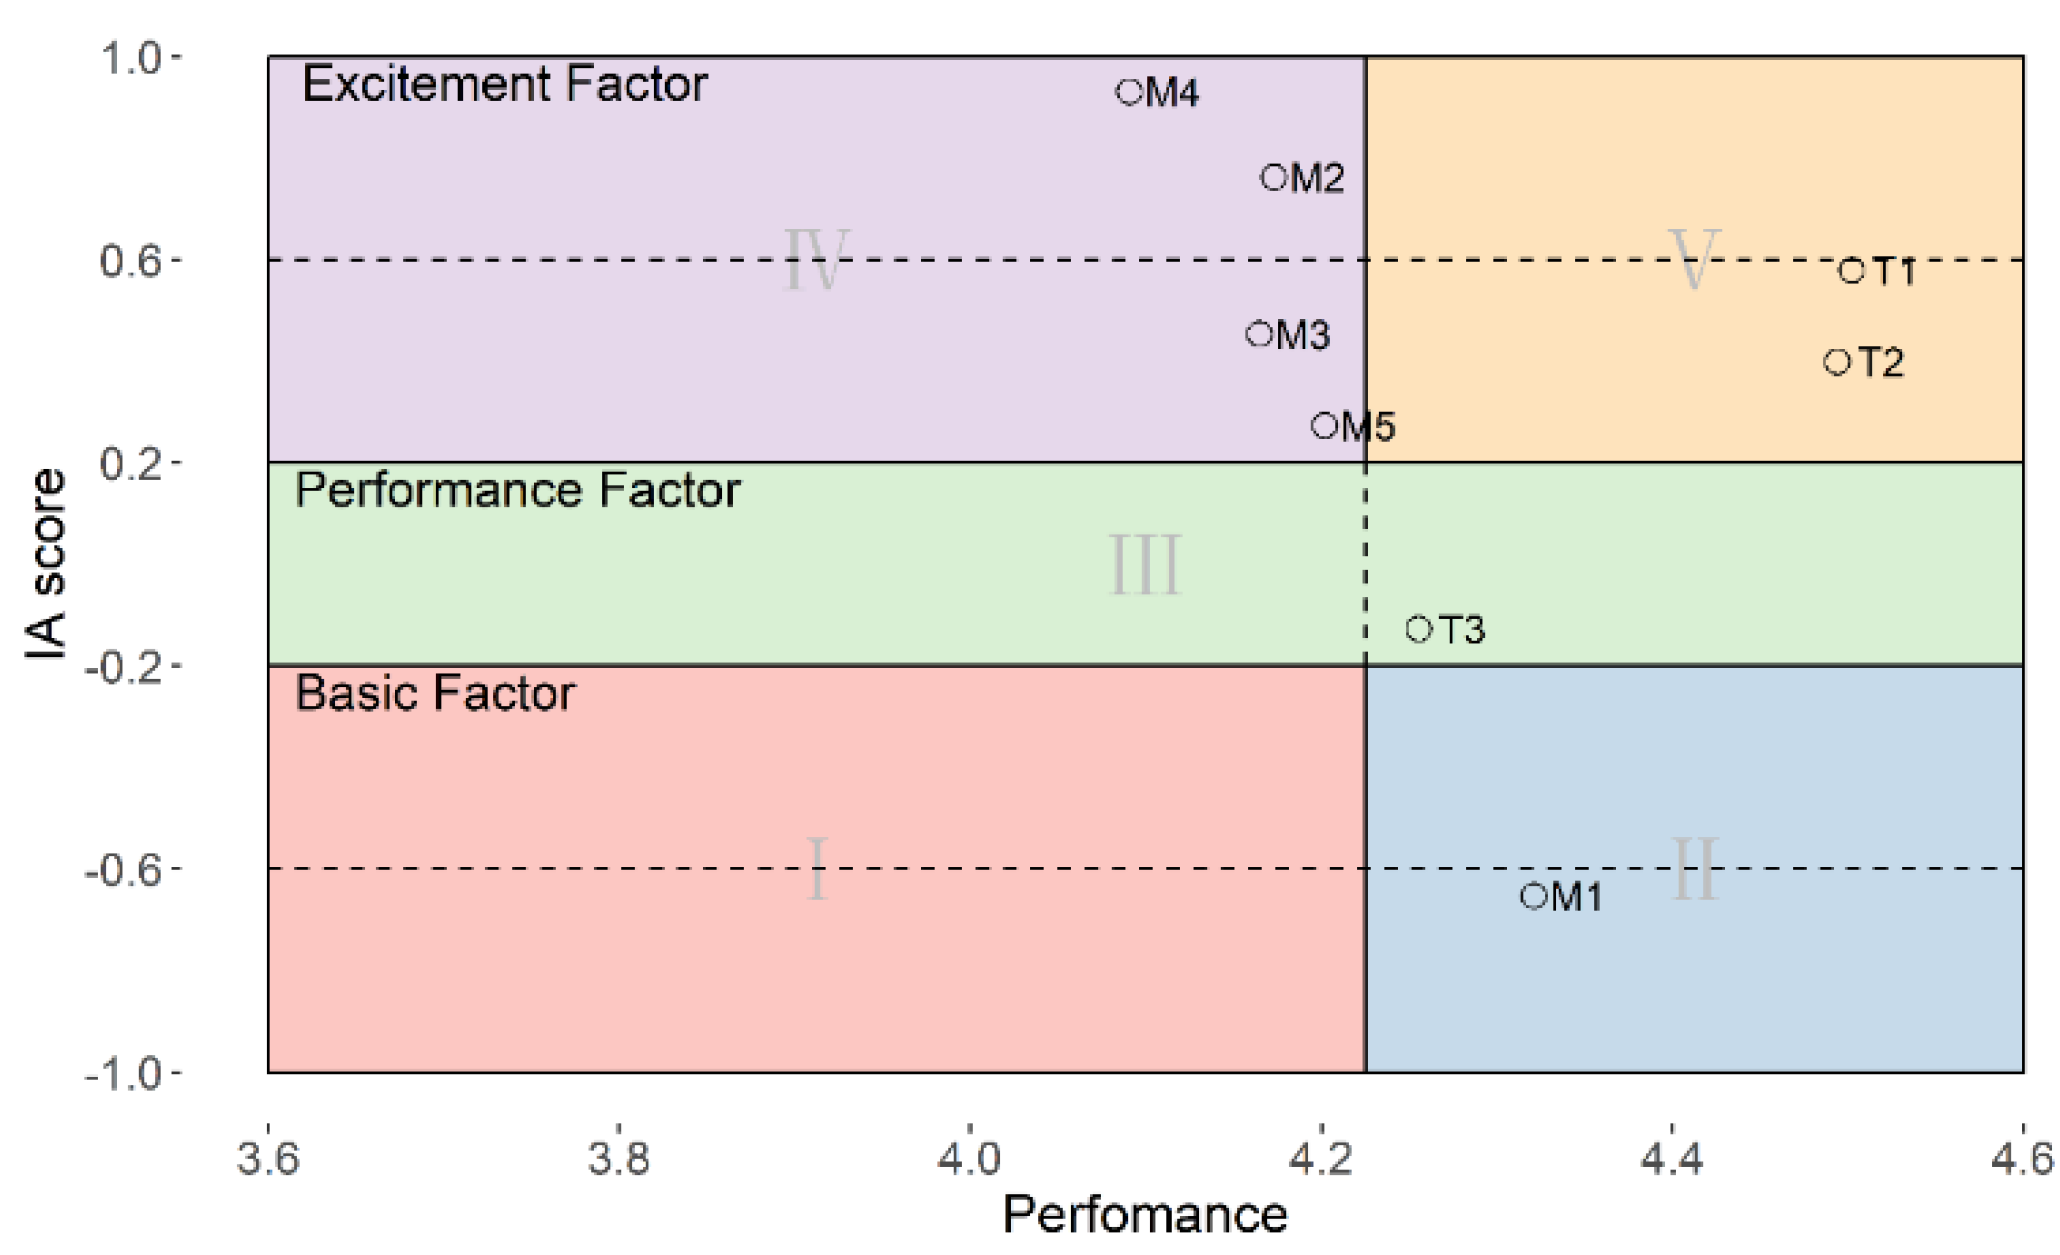
Figure 6.
Factor classifications from Tourist group of Macau passengers to Hengqin.
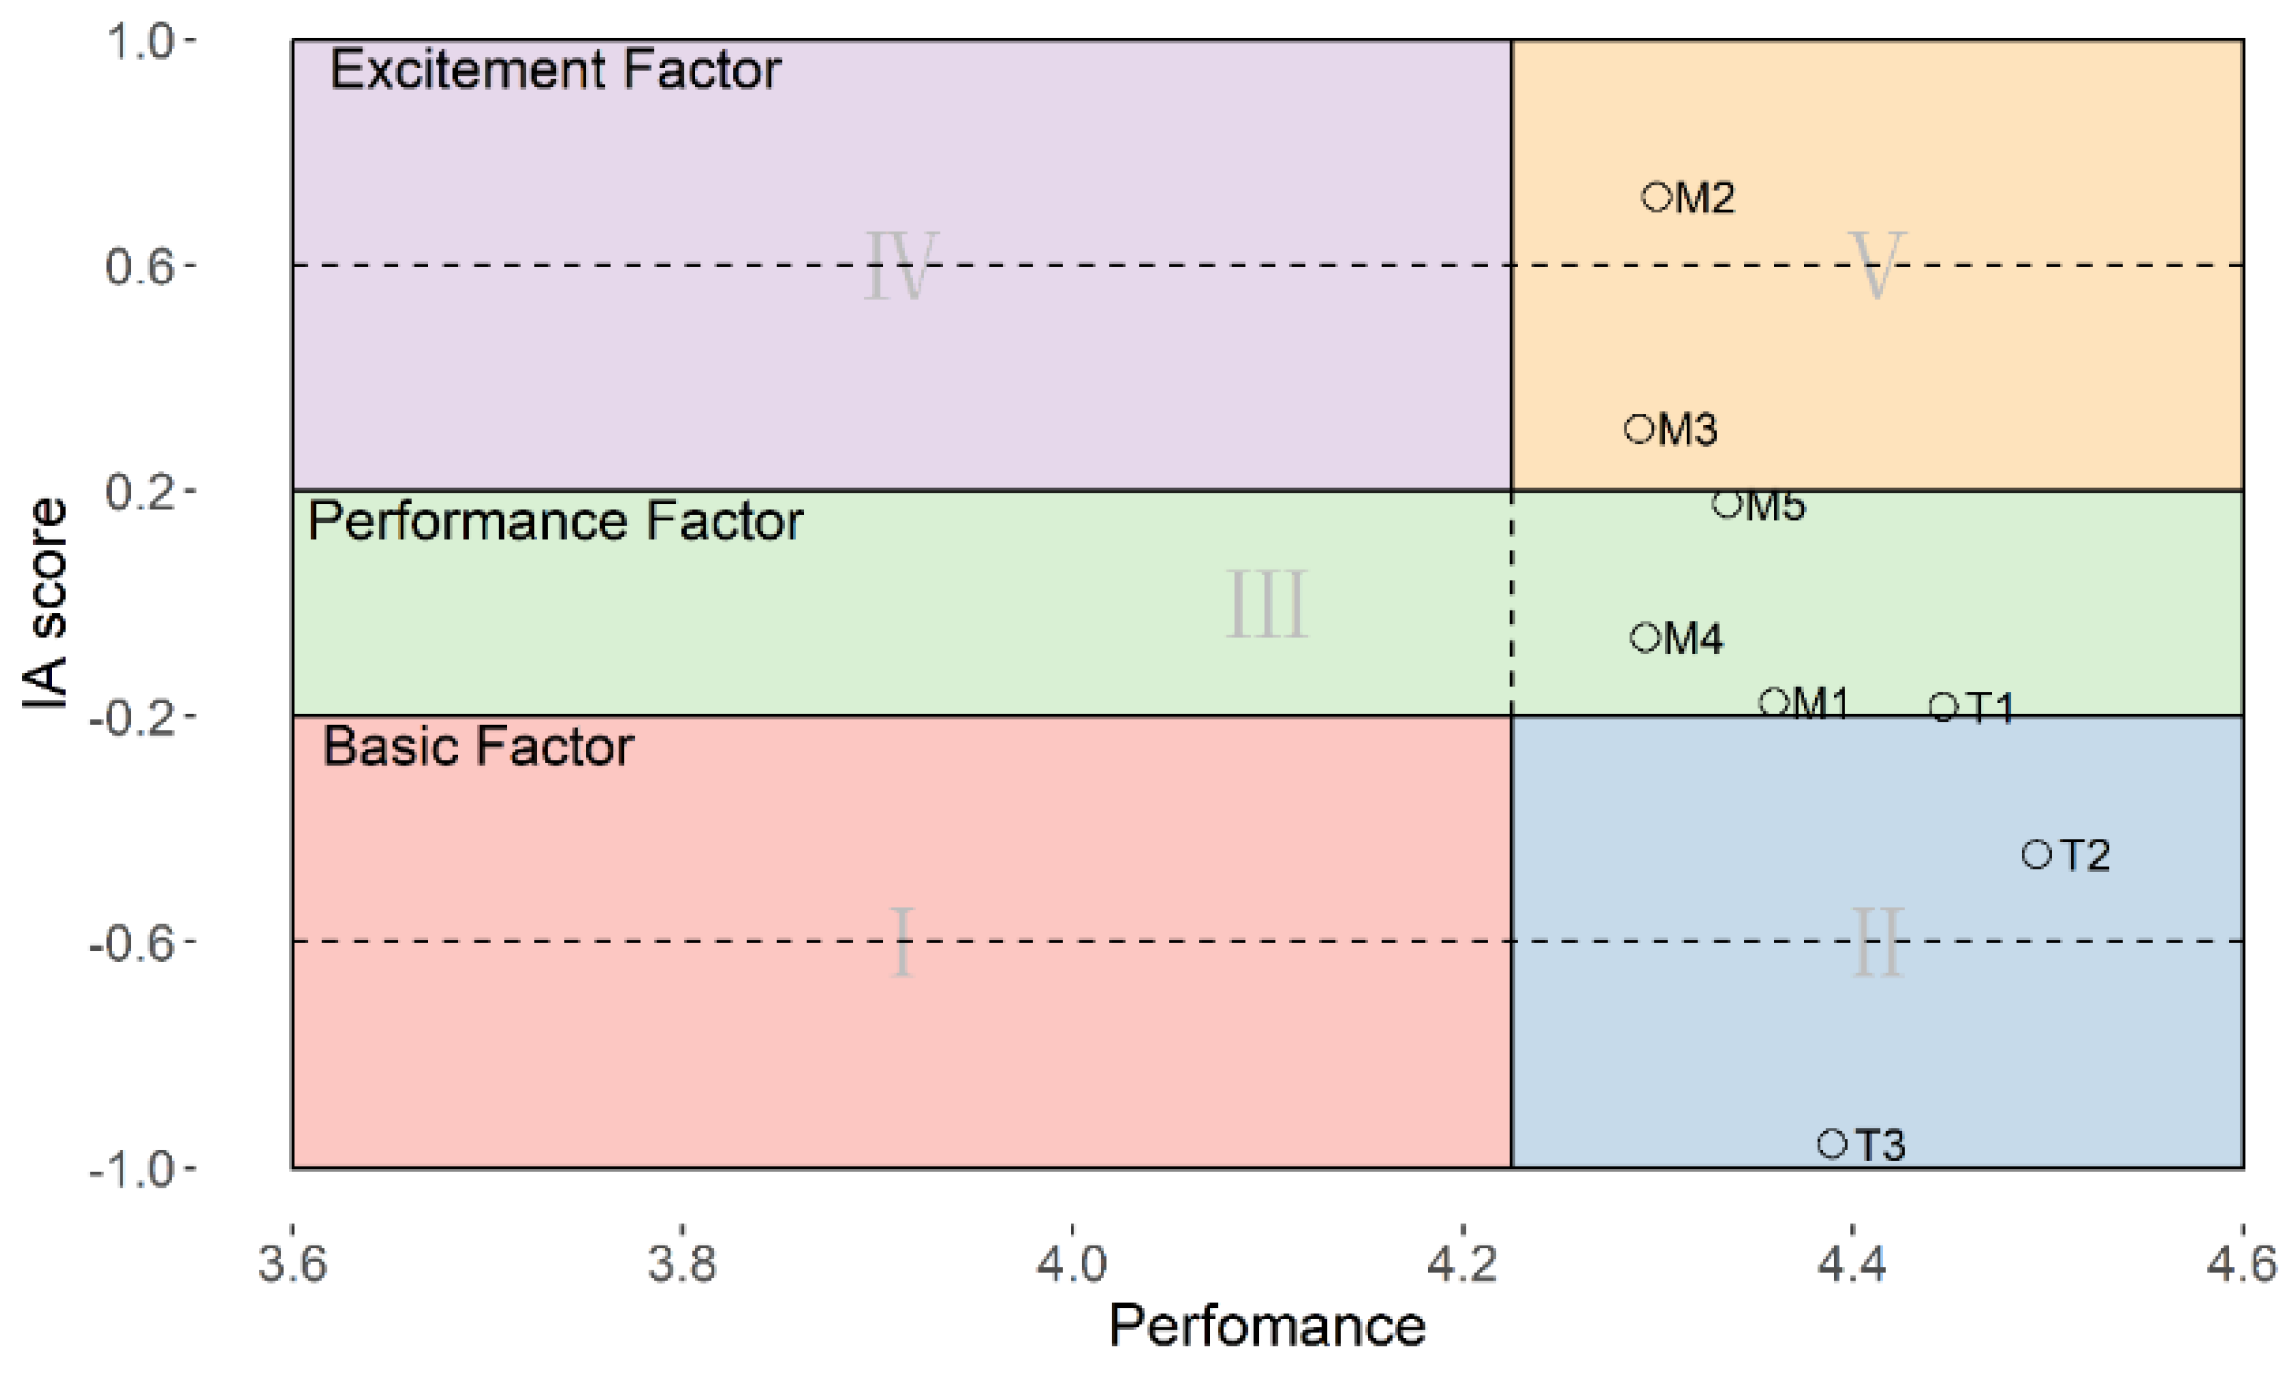
Figure 7.
Factor classifications from Retiree group of Macau passengers to Hengqin.
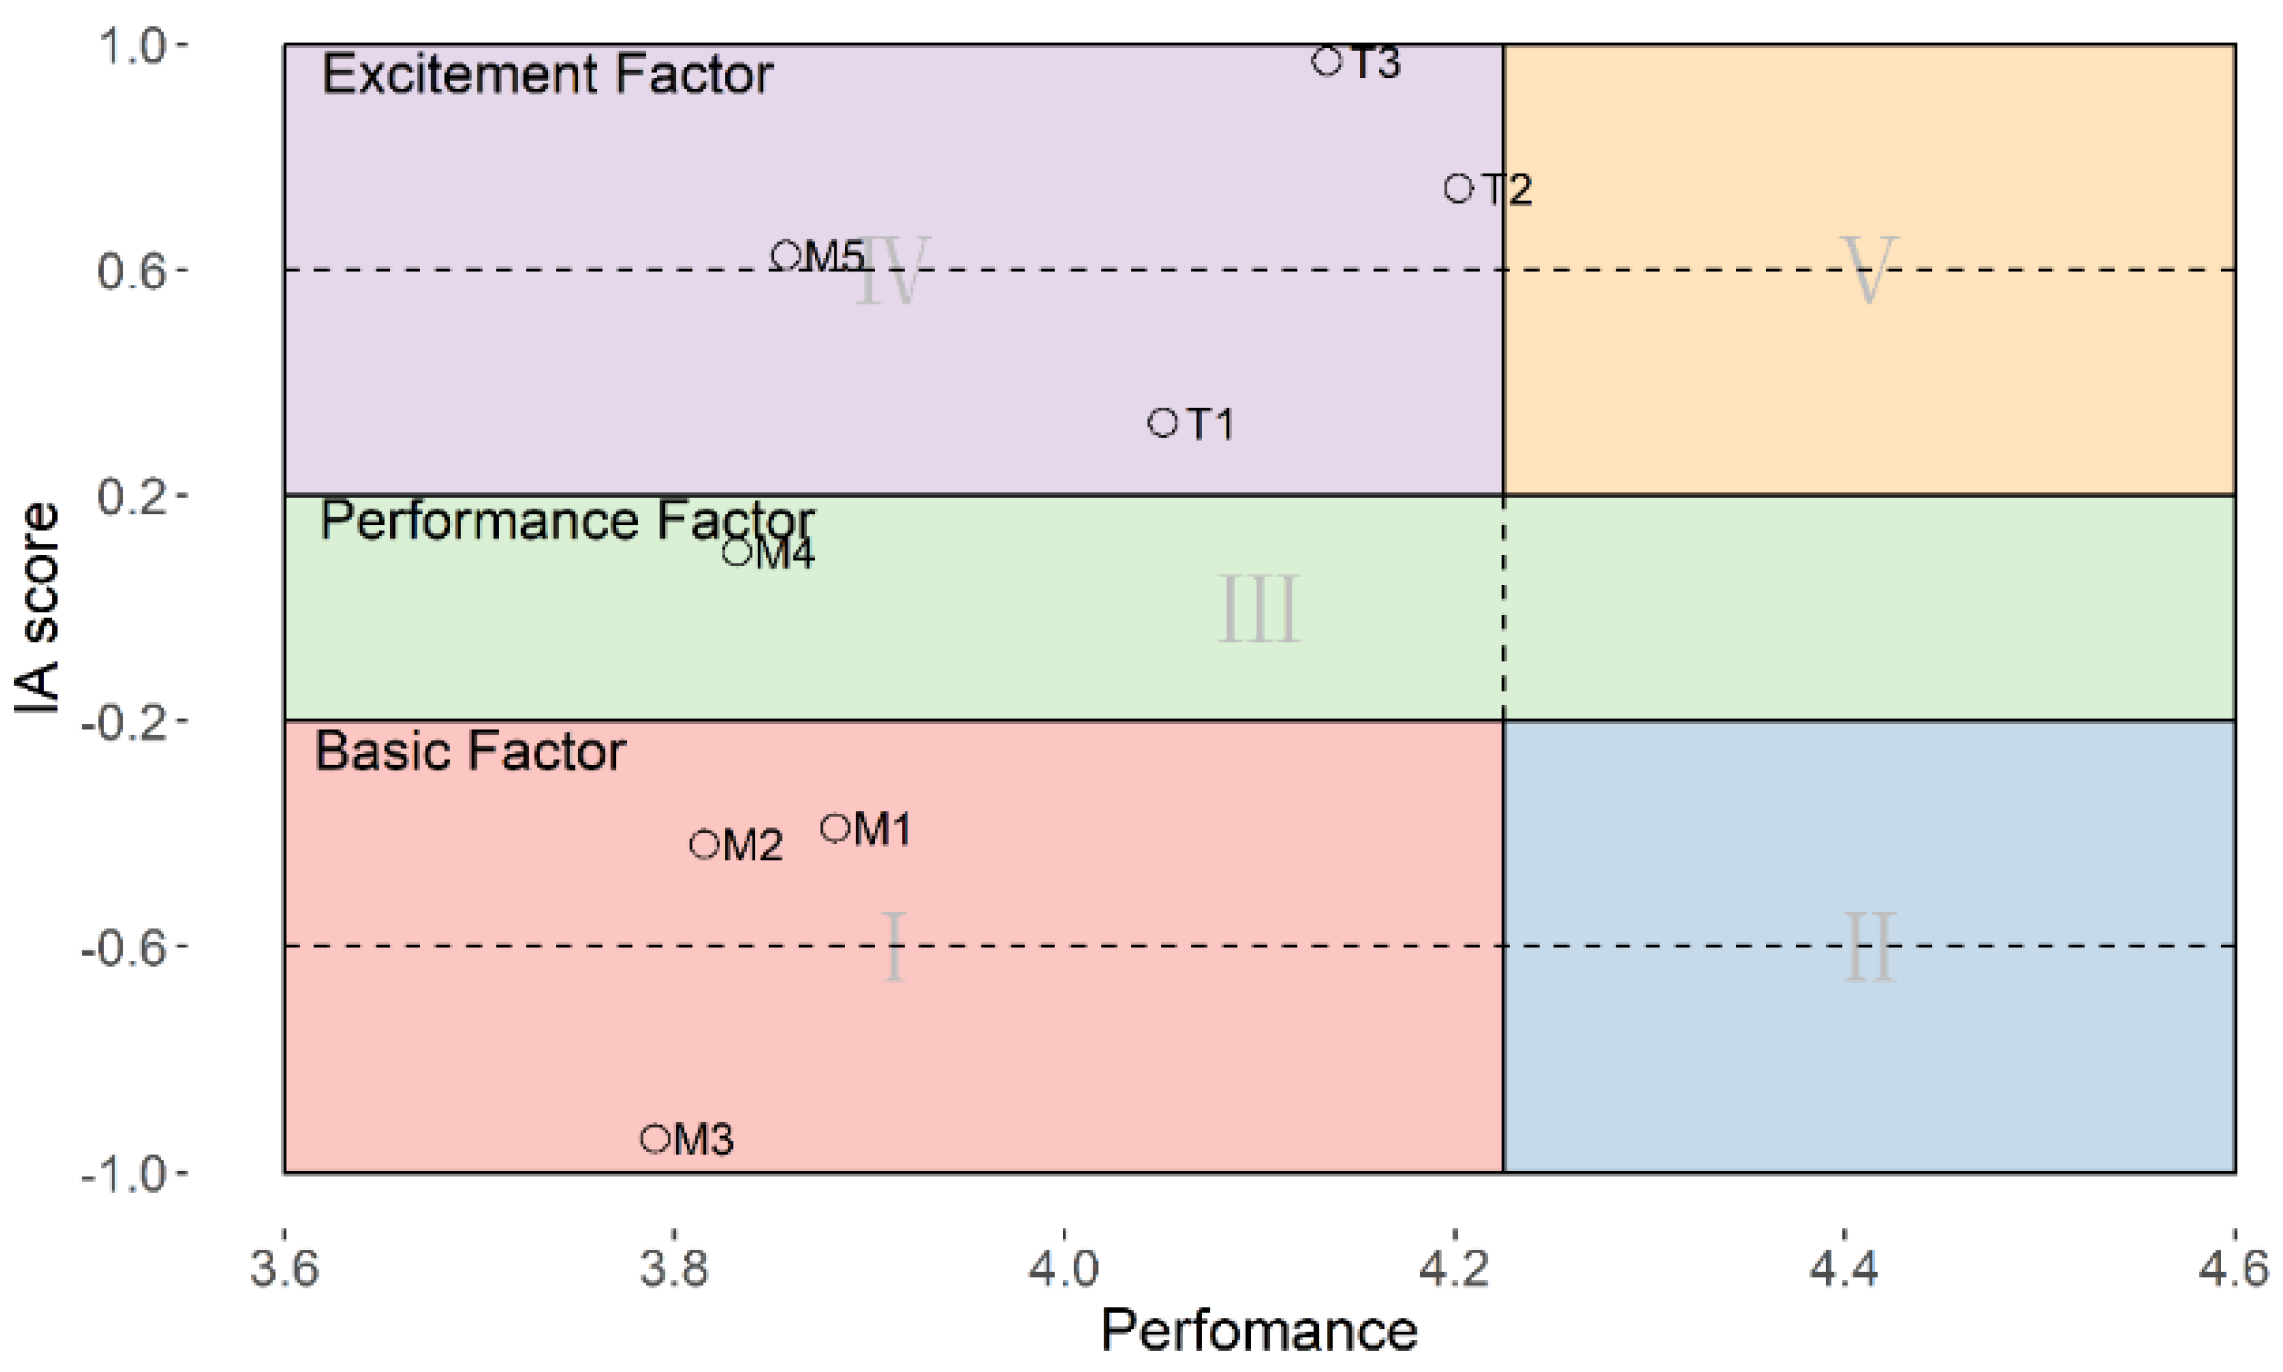
Figure 8.
Factor classifications from Commuter group of Macau passengers to Hengqin.
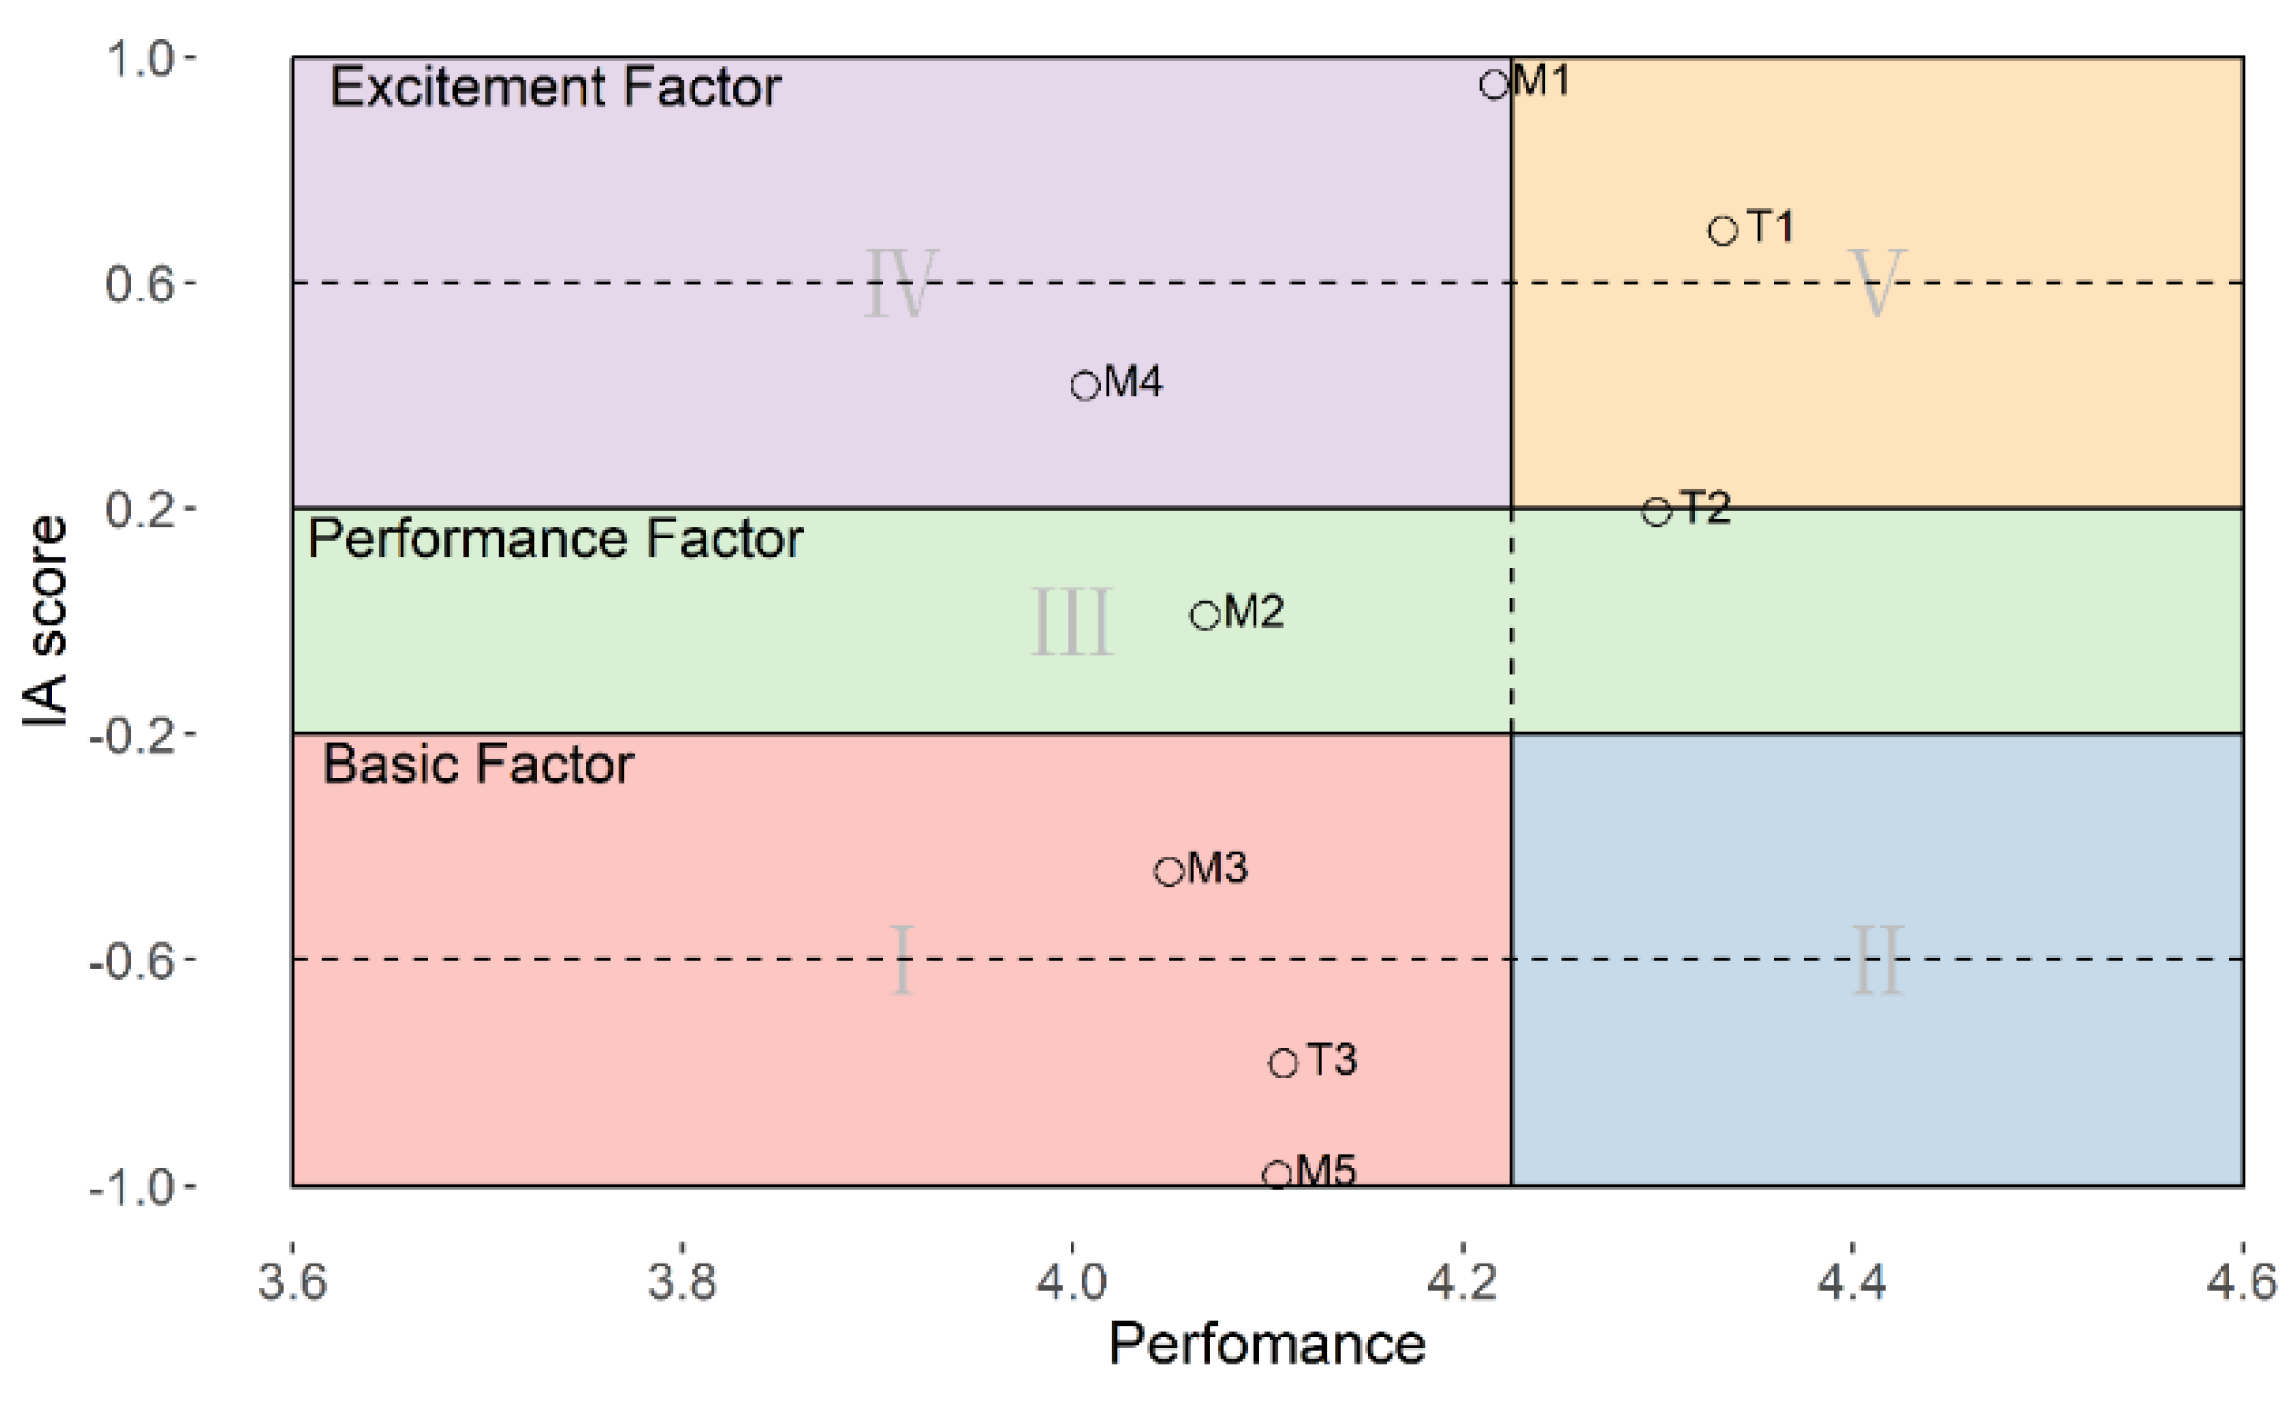
Figure 9.
Factor classifications from Student group of Hengqin passengers to Macau.
Figure 10.
Factor classifications from Tourist group of Hengqin passengers to Macau.
Figure 11.
Factor classifications from Retiree group of Hengqin passengers to Macau.
Figure 12.
Factor classifications from Commuter group of Hengqin passengers to Macau.
Table 1.
Overview of Studies on Intermodal Travel.
| Authors | Research area | Influence factors | Methodology |
|---|---|---|---|
| Yang et al.(2022) | Shijiazhuang Zhengding Airport-High Speed Railway | Operating lines, operating frequency, path indication, information service, real-time information | Bayesian network model |
| Li and Loo(2016) | Shanghai Hongqiao Comprehensive Transportation Hub | Transfer distance, transfer environment, path indication, information service, multi-language | Analysis of variance |
| Zhang et al.(2022) | Nanjing Lukou International Airport | Transfer distance, transfer flow management, path indication, efficiency of security, luggage service, information service | GBDT model |
| Zhou et al.(2022) | Nanjing South Station Comprehensive Transportation Hub | Operating lines, operating hours, path indication, luggage service | Rasch model |
| Yuan et al.(2021) | Shijiazhuang Zhengding Airport-High Speed Railway | Operating schedule, operating frequency, operation lines, information service, path indication, transfer efficiency, real-time information | SEM model |
| Zhou et al.(2024) | Jing-Jin-Ji Urban Agglomeration | Path indication, real-time information, luggage service, operation hours | SEM model |
| Yuan et al.(2022) | Operation frequency, operating hours, transfer distance, transfer fee | Generalized ordered logistic regression model | |
| Ren et al.(2024) | Transfer distance, transfer fee | XGBoost model |
Table 2.
Profile of socioeconomic and travel characteristics of survey respondents.
| Category | Description | Percentage | |
|---|---|---|---|
| Passengers from Macau to Hengqin | Passengers from Hengqin to Macau | ||
| Socioeconomic characteristics | |||
| Gender | Male | 50.20% | 49.95% |
| Female | 49.80% | 50.05% | |
| Age | 24 years or lower | 16.47% | 17.86% |
| 25-29 years | 19.22% | 20.15% | |
| 30-34 years | 19.41% | 21.01% | |
| 35-39 years | 19.51% | 19.87% | |
| 40-49 years | 11.76% | 11.17% | |
| 50 years or higher | 13.63% | 9.93% | |
| Education | High school or lower | 11.08% | 7.16% |
| High school | 12.94% | 9.07% | |
| Associate degree | 10.29% | 12.99% | |
| Bachelor degree | 48.24% | 48.23% | |
| Graduate degree | 17.45% | 22.54% | |
| Annual income (CNY) | <50,000 | 30.49% | 30.37% |
| 50,000-100,000 | 12.94% | 15.66% | |
| 100,000-150,000 | 23.92% | 20.82% | |
| 150,000-200,000 | 16.96% | 14.80% | |
| 200,000-300,000 | 9.02% | 11.56% | |
| >300,000 | 6.67% | 6.78% | |
| Occupation | Self-employees | 5.00% | 8.98% |
| Worker | 5.98% | 3.53% | |
| Enterprise staff | 48.43% | 46.42% | |
| Public institution Staff | 4.61% | 5.92% | |
| Student | 23.63% | 24.83% | |
| Retiree | 10.00% | 7.55% | |
| Other | 2.35% | 2.77% | |
| Travel characteristics | |||
| Main travelpurpose | Business | 1.96% | 3.15% |
| Reside | 8.73% | 2.01% | |
| Commute | 24.90% | 19.39% | |
| Study | 19.80% | 20.44% | |
| Visit | 4.02% | 4.97% | |
| Leisure | 40.59% | 50.05% | |
| Travelfrequency | ≤2 times per year | 26.37% | 33.91% |
| 1-3 times per month | 12.84% | 9.74% | |
| 1 time per week | 10.20% | 9.07% | |
| 2-3 times per week | 10.39% | 12.32% | |
| ≥4 times per week | 40.20% | 34.96% | |
Table 3.
Profile of overall satisfaction and factors of survey respondents.
| Category | Code | Description | Mean | Std | |
|---|---|---|---|---|---|
| Passengers from Macau to Hengqin | Overall Satisfaction | 4.45 | 0.69 | ||
| Macau side connecting transport | M1 | Path indication | 4.25 | 0.80 | |
| M2 | Operating lines | 4.14 | 0.88 | ||
| M3 | Operating hours | 4.13 | 0.87 | ||
| M4 | Operating frequency | 4.10 | 0.87 | ||
| M5 | Transfer distance | 4.17 | 0.82 | ||
| In the inspection hall | T1 | Path indication | 4.38 | 0.71 | |
| T2 | Customs inspection efficiency | 4.40 | 0.72 | ||
| T3 | Customs flow management | 4.24 | 0.82 | ||
| Passengers from Hengqin to Macau | Overall Satisfaction | 4.58 | 0.64 | ||
| Hengqin side connecting transport | H1 | Path indication | 4.28 | 0.81 | |
| H2 | Operating lines | 4.31 | 0.82 | ||
| H3 | Operating hours | 4.32 | 0.79 | ||
| H4 | Operating frequency | 4.26 | 0.84 | ||
| H5 | Transfer distance | 4.28 | 0.79 | ||
| In the inspection hall | T1 | Path indication | 4.45 | 0.68 | |
| T2 | Customs inspection efficiency | 4.51 | 0.68 | ||
| T3 | Customs flow management | 4.37 | 0.78 | ||
Table 4.
Distribution of samples from the clustering result.
| Cluster | Passengers from Macau to Hengqin | Passengers from Hengqin to Macau |
|---|---|---|
| Group 1 | 23.80% | 25.50% |
| Group 2 | 32.70% | 39.54% |
| Group 3 | 11.70% | 8.22% |
| Group 4 | 31.80% | 26.74% |
| Total Respondents | 1,020 | 1,047 |
Table 6.
Factor classification of factors.
| Category | Group | Factor | IA index | Factor classification | Mean performance |
|---|---|---|---|---|---|
| Passengers from Macau to Hengqin | Student group | M1 | -0.65 | Basic | 4.32 |
| M2 | 0.76 | Excitement | 4.17 | ||
| M3 | 0.45 | Excitement | 4.16 | ||
| M4 | 0.93 | Excitement | 4.09 | ||
| M5 | 0.27 | Excitement | 4.20 | ||
| T1 | 0.58 | Excitement | 4.50 | ||
| T2 | 0.40 | Excitement | 4.49 | ||
| T3 | -0.13 | Performance | 4.26 | ||
| Tourist group | M1 | -0.18 | Performance | 4.36 | |
| M2 | 0.72 | Excitement | 4.30 | ||
| M3 | 0.31 | Excitement | 4.29 | ||
| M4 | -0.06 | Performance | 4.29 | ||
| M5 | 0.18 | Performance | 4.34 | ||
| T1 | -0.18 | Performance | 4.45 | ||
| T2 | -0.44 | Basic | 4.49 | ||
| T3 | -0.96 | Basic | 4.39 | ||
| Retiree group | M1 | -0.39 | Basic | 3.88 | |
| M2 | -0.42 | Basic | 3.82 | ||
| M3 | -0.99 | Basic | 3.79 | ||
| M4 | 0.12 | Performance | 3.83 | ||
| M5 | 0.63 | Excitement | 3.86 | ||
| T1 | 0.33 | Excitement | 4.05 | ||
| T2 | 0.75 | Excitement | 4.20 | ||
| T3 | 0.99 | Excitement | 4.13 | ||
| Commuter group | M1 | 0.95 | Excitement | 4.22 | |
| M2 | 0.01 | Performance | 4.07 | ||
| M3 | -0.44 | Basic | 4.05 | ||
| M4 | 0.42 | Excitement | 4.01 | ||
| M5 | -0.98 | Basic | 4.10 | ||
| T1 | 0.69 | Excitement | 4.33 | ||
| T2 | 0.19 | Performance | 4.30 | ||
| T3 | -0.78 | Basic | 4.11 | ||
| Passengers from Hengqin to Macau | Student group | H1 | 0.00 | Performance | 3.87 |
| H2 | 0.96 | Excitement | 3.92 | ||
| H3 | -0.91 | Basic | 3.72 | ||
| H4 | -0.98 | Basic | 3.76 | ||
| H5 | 0.17 | Performance | 3.81 | ||
| T1 | -0.49 | Basic | 4.13 | ||
| T2 | 0.98 | Excitement | 4.22 | ||
| T3 | -0.56 | Basic | 4.09 | ||
| Tourist group | H1 | -0.84 | Basic | 4.37 | |
| H2 | 0.81 | Excitement | 4.38 | ||
| H3 | 0.95 | Excitement | 4.42 | ||
| H4 | 0.52 | Excitement | 4.34 | ||
| H5 | -0.07 | Performance | 4.38 | ||
| T1 | -0.52 | Basic | 4.58 | ||
| T2 | 0.93 | Excitement | 4.63 | ||
| T3 | 0.84 | Excitement | 4.37 | ||
| Retiree group | H1 | -0.03 | Performance | 4.15 | |
| H2 | 0.11 | Performance | 4.21 | ||
| H3 | 0.24 | Excitement | 4.22 | ||
| H4 | 0.60 | Excitement | 4.14 | ||
| H5 | 0.70 | Excitement | 4.20 | ||
| T1 | -0.27 | Basic | 4.33 | ||
| T2 | 0.16 | Performance | 4.39 | ||
| T3 | -0.72 | Basic | 4.26 | ||
| Commuter group | H1 | -0.67 | Basic | 4.40 | |
| H2 | 0.58 | Excitement | 4.42 | ||
| H3 | -0.53 | Basic | 4.44 | ||
| H4 | 0.59 | Excitement | 4.38 | ||
| H5 | -0.97 | Basic | 4.35 | ||
| T1 | 0.45 | Excitement | 4.52 | ||
| T2 | 0.70 | Excitement | 4.57 | ||
| T3 | -0.01 | Performance | 4.51 |
Disclaimer/Publisher’s Note: The statements, opinions and data contained in all publications are solely those of the individual author(s) and contributor(s) and not of MDPI and/or the editor(s). MDPI and/or the editor(s) disclaim responsibility for any injury to people or property resulting from any ideas, methods, instructions or products referred to in the content. |
© 2025 by the authors. Licensee MDPI, Basel, Switzerland. This article is an open access article distributed under the terms and conditions of the Creative Commons Attribution (CC BY) license (http://creativecommons.org/licenses/by/4.0/).
Copyright: This open access article is published under a Creative Commons CC BY 4.0 license, which permit the free download, distribution, and reuse, provided that the author and preprint are cited in any reuse.


