
Submitted:
03 April 2025
Posted:
04 April 2025
You are already at the latest version
Abstract
This paper presents a combined theoretical and experimental investigation of an innovative building material known as PVA Fiber Reinforced Composite - an advanced class of cement-based materials renowned for their exceptional flexibility and superior crack control, overcoming the limitations of traditional concrete. The study aimed to develop new compositions and conduct a comparative performance analysis. The proposed composites utilize locally available cement at conventional dosage levels, incorporating high volumes of fly ash, silica fume, PVA fibers, and a superplasticizer, while entirely omitting stone and sand aggregates. A total of nine compositions were designed and tested: four with uncoated PVA fibers at 1%, 1.5%, 2%, and 2.5%, four with oil-coated PVA fibers in the same proportions, one control mix containing sand aggregates. The research evaluated key experimental and design parameters, including bulk density, compressive strength and strain, secant modulus of elasticity, flexural tensile strength and deflection, fracture energy, and structural design applicability. As a novel building material aimed at enhancing both environmental sustainability and structural performance, the studied fiber-reinforced composites exhibit promising characteristics, positioning them as viable alternatives for practical construction applications.
Keywords:
fiber reinforced composite
; polyvinyl alcohol fibers
; high volume fly ash
; compressive strength
; flexural tensile strength
; ultimate limit state structural design
1. Introduction
Fiber Reinforced Cementitious Composites (FRCC) are an advanced class of cement-based materials designed to enhance flexibility and crack resistance, addressing the brittleness of traditional concrete. When FRC exhibits a tensile strain-hardening capacity exceeding 3-5%, it qualifies as an Engineered Cementitious Composite (ECC), also known as flexible concrete. ECC stands out for its exceptional tensile strength and ductility, allowing it to deform significantly without fracturing, like ductile steel. These properties make ECC ideal for applications requiring superior durability, seismic resilience, and energy absorption, gaining widespread interest in research and construction for its potential to improve infrastructure longevity and performance.
This study explores the initial development and performance evaluation of a high-volume fly ash FRC with a tensile strain-hardening capacity below 3%, aiming for future integration into the ECC category. The proposed composites use locally available cement in standard dosages, supplemented with silica fume, and PVA fibers. Unlike previous studies [1,2], the experimental formulations replace sand aggregates entirely with unprocessed fly ash, maintaining concrete-like behavior while offering structural, environmental, and economic advantages.
Careful selection of materials can transition an FRC into an ECC. ECC typically consists of cement, silica sand, water, and additives such as fly ash, slag, silica fume, lime, or metakaolin. Reinforcement with dispersed fibers, particularly PVA fibers, imparts multiple cracking and ductility characteristics [3,4]. The matrix design and fiber addition make ECC more flexible and lightweight than conventional concrete [3].
FRC and ECC rely on fiber performance within the cementitious matrix. When cracks form, fiber bridging occurs, distributing stress and enabling stable crack propagation. As crack propagation continues, the fibers separate from the matrix and elongate, causing the bridging stress to intensify, eventually leading to a stable cracking condition. If the bridging stress exceeds the matrix’s cracking stress, further loading does not widen the cracks. Matrix toughness significantly affects fiber bond strength: lower toughness facilitates pseudo strain-hardening behavior, but excessive reduction may compromise initial crack strength. Toughness depends on the water-cement ratio, aggregate properties, and admixtures [1].
The mechanical properties of FRC and ECC are also dependent on the constituents. FRC and ECC exhibit a broad range of compressive strengths, from low to high, influenced by component proportions, specimen size, and testing conditions. A 50% fly ash content with a 0.25 water/binder ratio yields approximately 60 MPa, while increasing the ratio to 0.35 reduces it to 35 MPa. 80% fly ash content drops compressive strength to 11 MPa, making it unsuitable for most structural applications. However, a 0.4 water/binder ratio with 80% fly ash can achieve 80 MPa, increasing to 100 MPa when substituting fly ash with rice husk ash [3,4]. Testing under negative temperatures or high moisture can elevate compressive strength from 70 to 110 MPa [5], 55 to 80 MPa [6], 25 to 45 MPa [7,8]. Long-term pozzolanic effects enhance strength over time. If other admixtures such as calcium carbonate are utilized, the compressive strength does not exceed 25-35 MPa [9].
Tensile strength and strain hardening behavior also depend on fiber type and matrix toughness. Basalt fibers provide 6-8 MPa tensile strength with 1-2% strain [10], while PE fibers range from 2.7-8 MPa with 1.95-14% strain [11,12,13,15]. PVA fibers typically offer 3-7 MPa tensile strength with 4-6% strain [11,14].
Among fiber types, PVA is most extensively studied for enhancing multiple cracking and ductility. Other options include polypropylene (PP), polyethylene (PE), basalt, glass, and plant-based or PET fibers [2]. While fiber type affects strain-hardening efficiency, PVA or PE fibers, typically added at 1.3-2% of cement weight, are most common, either alone or combined with basalt or steel fibers [15,16].
Portland Cement is crucial for early binding, with conventional concrete using 300-400 kg/m³ and ECC studies reporting 400-600 kg/m³, though lower amounts, 126-270 kg/m³ [14] have been explored to reduce costs and environmental impact [17].
To mitigate Portland Cement’s environmental effects, industrial by-products like fly ash, slag, and silica fume are used. Fly ash content typically ranges from 400 kg/m³ [6] to 700 kg/m³ [18,19,20,21] reaching up to 900 kg/m³ in some studies [19]. Although high fly ash levels slow down early strength gain, they reduce hydration heat, shrinkage stresses, and enhance workability, ductility, and strain-hardening behavior [2]. Slag is used in quantities of 200-700 kg/m³, while silica fume, essential for high-performance mixes, is added at 60-100 kg/m³ [5].
Sand aggregates improve matrix toughness, typically dosed at 400-500 kg/m³ [22,23,24]. Smaller aggregate sizes reduce matrix toughness, influencing strain-hardening behavior [1]. ECC water-binder ratios range from 0.25-0.4, necessitating high superplasticizer use, unlike ordinary concrete’s 0.5 ratio [22,23,24].
ECC’s modulus of elasticity (18-34 GPa) is lower than that of ordinary concrete [4]. Depending on mixture and testing conditions, values range from 20-40 GPa. Even with graphene oxide, it remains around 22 GPa [8]. However, ECC’s high strain capacity through fiber bridging allows structural elements to share loads with steel reinforcement after cracking, a feature absent in reinforced ordinary concrete. Thus, the actual value of the modulus of elasticity is not of great significance.
Despite variations in ECC compositions, all are designed to achieve strain-hardening failure with multiple microcracks, contrasting with the brittle failure of conventional concrete. This research develops a high-volume fly ash fiber-reinforced concrete (FRC) as a step toward future ECC integration. By replacing sand aggregates with unprocessed fly ash, the mix brings multiple advantages. It transforms traditional concrete into a lightweight material, reducing the dead load on structural elements while maintaining load-bearing capacity and service life, thereby minimizing seismic impact and foundation stress [25,26,27]. Additionally, it lowers the heat of hydration and shrinkage stress, reducing the likelihood of cracks in large structural elements and decreasing future repair costs [25].
The fly ash-based mix also improves workability by absorbing water during mixing and gradually releasing it during hydration, eliminating the need for vibration during casting and thereby reducing labor and execution costs [25]. It enhances durability by increasing resistance to chloride ingress and freeze-thaw cycles, which is particularly beneficial in aggressive environments such as those exposed to deicing salts, seawater, or chemical attack [15,26,31,32,33]. Moreover, the pozzolanic effect contributes to greater long-term mechanical strength.
Economic and environmental benefits further support the use of fly ash. As a readily available and cost-effective alternative to fine quarzitic sand, its use lowers production costs, particularly in Romania, where the material was sourced from a local thermal plant landfill without additional processing [25]. The approach also mitigates environmental and health risks associated with waste landslides from thermal plants [25,29]. Additionally, the mix promotes self-healing in fine cracks, a key feature of ECC that extends the durability and service life of structural elements [4,30]. Finally, by lowering matrix toughness, the material enables strain-hardening behavior with a low fiber content, a defining characteristic of ECC [25].
As an innovative, aggregate-free material, the studied fiber reinforced composite demonstrates remarkable potential. With further research, it is expected to fully achieve the properties of Engineered Cementitious Composites (ECC). This study examines its key physical and mechanical characteristics, including bulk density, compressive strength, strain at peak, modulus of elasticity, flexural tensile strength, and fracture energy. Additionally, its structural behavior in bending is simulated and compared to traditional reinforced concrete, revealing an increase in the compression zone—an advantage for both sustainability and cost efficiency.
2. Materials and Methods
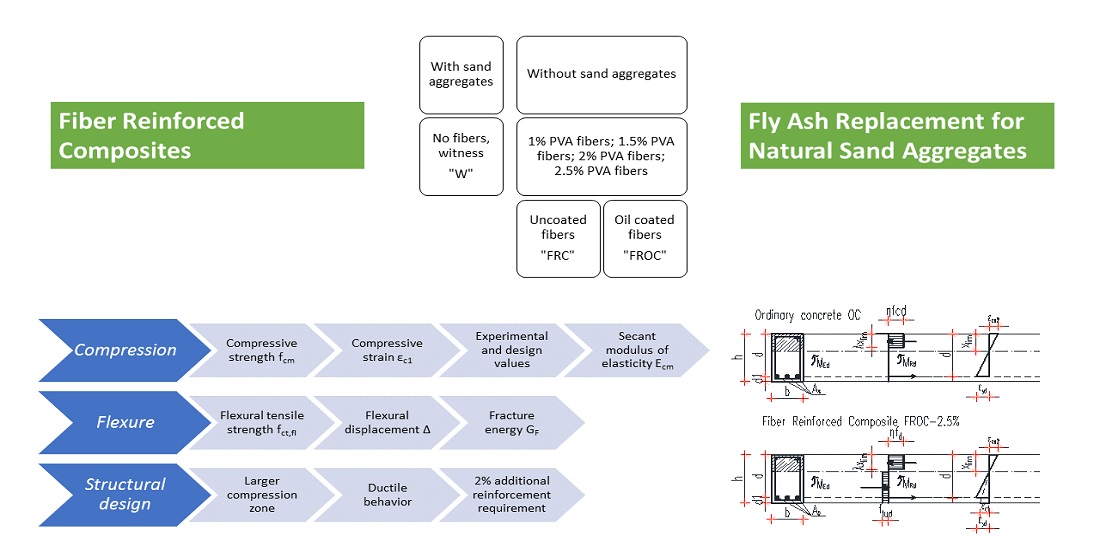
This research aimed to develop a Fiber Reinforced Composite (FRC) by entirely substituting natural sand aggregates with industrial fly ash and silica fume. Two factors were investigated: incorporating oil coated PVA fibers and uncoated PVA fibers. To determine the optimal mix, different fiber volumes were tested, yielding eight distinct concrete matrices. Additionally, a reference composition (W) was included, featuring fine aggregates and the same cement dosage as the FRC mixes, but without fibers. The W composition is designed to compare the performance of the FRC compositions against a traditional cementitious matrix with fine aggregates and to isolate the impact of aggregate replacement alone. In the end, there were nine experimental compositions. Their main characteristics are depicted in Figure 1.
The materials used in the experimental program are as follows: CEM II/42.5R StructoPlus from Holcim Romania, Elkem Microsilica Grade 940-U silica fume, fly ash sourced from the local coal power plant in Mintia, Romania [34], and PVA fibers of Masterfiber 401 type, both oil coated and uncoated. These fibers have a diameter of 8 μm and a length of 12 mm, with a tensile strength ranging from 790 to 1160 MPa and an elastic modulus of 30 GPa. Additionally, water and MAPEI Dynamon SX superplasticizer were used. For the witness composition "W" natural sand aggregates were incorporated. The components are illustrated in Figure 2.
Like self-compacting concrete, the fresh state compositions, except for the reference composition W, exhibited high workability. As a result, no vibration was required during casting for the FROC-FRC compositions. The precise workability values are not the primary focus of the present study. The FRC compositions and the reference composition are listed in Table 1 based on the weight of cement.
The researched compositions were mixed using a 5-liter automated mortar mixer. For each composition, 4 cubes measuring 50x50x50 mm and 3 prisms measuring 40x40x160 mm were cast, resulting in a total of 70 specimens. These specimens were then cured in water at a constant temperature of +20°C for 28 days.
The mechanical properties were investigated at the age of 28 days: bulk density (kg/m3), compressive strength fcm (MPa) and the compressive limit strain εc1 (‰), secant modulus of elasticity Ecm (MPa), flexural tensile strength fct,fl (MPa), and the displacement at peak Δ (mm). All tests were conducted in accordance with the European standards [35] and [36]. The testing machine was equipped with force and displacement sensors, connected to a computer (via CatmanEasy software), to collect the experimental data.
3. Results
3.1. Bulk Density
The density of each composition is depicted in Figure 4 in correlation with the compressive strength. The FRC compositions, which do not contain natural aggregates, exhibit significantly lower weights compared to the witness composition, ranging from 1500 kg/m3 to 1720 kg/m3. In contrast, the witness composition approaches the bulk density of ordinary concrete, with a value of 2140 kg/m3.
As for the fiber reinforced oil coated polymer compositions (FROC), their density is approximately 73% of the density of the witness material (W), while the density of the fiber reinforced uncoated polymers (FRC) is around 77% of the witness material's density (W). Minor variations in density are observed concerning the percentage of fibers. Specifically, at 1% PVA, the FROC density is 94% of the FRC density, at 1.5% PVA it decreases to 91%, at 2% PVA it increases to 98%, and at 2.5% PVA, it rises even further to 101%.
3.2. Compressive Strength fcm
The witness composition with natural aggregates displayed the highest compressive strength, which is also associated with the highest density matrix (Figure 4). However, there is only a negligible 1% difference in compressive strength between FRC - R4 - 2% and the witness composition, but FRC - R4 - 2% has a significantly lower density (-22.4%). In structural applications, such a major difference in self-weight, coupled with the same compressive strength, can lead to substantial advantages (e.g., economical use of reinforcement, slender elements, etc.). As for the other specimens, the composites with uncoated fibers exhibited a decrease in compressive strength compared to the witness composition: 31% for FRC – R2 - 1% and 26% for FRC – R3 – 1.5%. FRC – R9 – 2.5% displayed a significantly lower compressive strength of 57% compared to the witness composition. For oil coated fibers compositions, the decrease ranged from 22% to 30% compared to the witness. A more consistent pattern is observed with all four oil coated fiber compositions (FROC). In practice, for structural concrete, a difference in compressive strength of up to 5 MPa is typically considered within the same concrete grade and falls within tolerance limits.
3.3. Compressive Strain εc1
The presence of aggregates in the cementitious matrix is beneficial, and the compression curve is like the standardized curve of traditional concrete, even though the finesse of the material components is greater than that of traditional concrete. For 1%, 1.5%, and 2.5% PVA fiber additions, the compressive strain for oil coated fibers (FROC) is smaller than for uncoated fiber composites (FRC) by approximately 1-1.5‰. The strain at peak load ranges between 1.45‰ and 4.36‰. Figure 5b presents the selected compressive diagrams considered as testing deviations due to the gentler slopes compared to most of the specimens. For these specific specimens, W-R1-1 and 3, FRC-R3-1.5%-1 and 4, FRC-R4-2%-2, and FRC-R9-2.5%-2 and 4, the compressive strain at peak load ranges from 5.91‰ to 9.57‰.
Figure 6 illustrates the relationship between compressive strength (fcm) and compressive strain at peak (εc1) for all tested specimens, including the considered deviations. As observed in Figure 5b, a distinct group of results shows strains at peak that are more than twice the value of most test results. Moreover, FRC and FROC - 1% (shown in green) demonstrate predominant uniformity, with experimental results concentrated in a strain interval ranging from 0.0015 to 0.004 and a corresponding compressive strength interval from 22 to 26 MPa. The highest compressive strength is exhibited by FRC – 2% and the witness specimens.
The equation used for calculating εc1 out of fcm according to Eurocode 2 (EC2) [38] is:
εc1 (‰) = 0.7* fcm0.31
Figure 7 displays the relationship between the compressive strain at peak resulted from the experimental tests and the calculated compressive strain using equation (1) as a function of the compressive strength. FRCs with all PVA percentages have an average compressive strain of 23.46 MPa and a median of 23.53 MPa with a standard deviation of 6.62 MPa. Therefore, the design values of the compressive strain revolve around an average of 1.85‰, with a median of 1.86‰ and a standard deviation of 0.1697‰. Alike, FROC with all PVA percentages have an average compressive strain of 24.97 MPa and a median of 25.54 MPa with a standard deviation of 1.1 MPa. Therefore, the design values of the compressive strain resolve around average of 1.89‰, with a median of 1.91‰ and a standard deviation of 0.00264‰.
The calculated values are very dissimilar to the experimental results even if the deviances were removed from the analysis. In fact, the difference was expected due to fiber addition. For the witness composition, the ratio (εc1-exp)/(εc1-EC2) takes values between 0.92 and 1.12. For FRC compositions, the ratio (εc1-exp)/(εc1-EC2) depends on the fiber addition percentage: between 0.90 and 2.02 for 1%, 2.04 and 2.17 for 1.5%, 0.86 and 1.83 for 2%, and 2.74 and 3.37 for 2.5%. For FROC compositions, the ratios (εc1-exp)/(εc1-EC2) are as follows: 0.76 and 1.95 for 1%, 0.80 and 1.40 for 1.5%, 1.14 and 1.45 for 2%, and 1.05 and 2.06 for 2.5%.
3.4. Secant Modulus of Elasticity Ecm
Figure 8 indicates that the FRC–2% specimens 3 and 4, as well as witness specimens 2 and 4, exhibit the highest values in the relationship between compressive strength and secant elastic modulus. These characteristics are more pronounced in these specimens compared to the others, primarily due to the matrix toughness. The equation used for calculating the secant modulus of elasticity Ecm out of fcm according to Eurocode 2 (EC2) [38] is:
Ecm = 22*[(fcm)/10]0.3
Figure 9 displays the relationship between the compressive strain at peak resulting from the experimental tests and the calculated secant modulus of elasticity using equation (2) as a function of the compressive strength. For the witness composition, the ratio (Ecm-exp)/(Ecm-EC2) takes values between 0.36 and 0.32. Because of the complete lack of aggregates of the FRC and FROC compositions, the elastic modulus measured on the stress-strain curve is smaller than the design values calculated based on the compressive strength. For these, the ratio (Ecm-exp)/(Ecm-EC2) goes as low as 0.10 and as high as 0.40.
3.5. Flexural Tensile Strength fct,fl
The witness composition with natural aggregates displayed the largest flexural tensile strength, which is also associated with the highest density matrix (Figure 10). Nonetheless, there is a notable reduction of up to 1.5 MPa, roughly 5.6%, between the highest flexural strength observed in the FROC – R8 – 2.5% composition and the other FRC compositions. Furthermore, this same composition's strength is lower than the witness by 3.4 MPa, representing a significant difference of 38%.
The difference between the composites with uncoated fibers and oil coated fibers varies as follows: for 1% PVA uncoated fibers it is a surplus of 22.5%, for 1.5% PVA uncoated fibers it is a surplus of 3.7%, for 2% PVA uncoated fibers it is a surplus of 15% and for 2.5% PVA uncoated fibers it is a minus of 5.9%.
3.6. Flexural Displacement Δ and Fracture Energy GF
The equation (3) used for calculating the fracture energy in the experimental unnotched flexural tests is based on RILEM [39]. The Japanese standard JCI-S-001-2003 [40] indicates a similar equation with an additional reduction factor of 0.75.
The displacement can be measured either as CMOD (Crack Mouth Opening Displacement) or as vertical deformation, but it is recommended that GF be determined on unnotched beams with non-rotatable boundaries [37], which the experimental tests did.
whereas,
GF = (Wo + m * g * δ0)/Alig [N/m]
Wo=area under the load-displacement curve
m = combined weight of the specimen between the supports (kg)
g = acceleration of gravity = 9.8 N/kg
δ0= displacement corresponding to almost zero load in the softening portion of the load-displacement curve
Alig=area of crack ligament (are of the cross section without the notch)
The witness specimens present an average fracture energy of 0.515 (N/mm). For fiber reinforced composites (FRC), that value is 8.1% higher than for the composition with 1% PVA fibers, 55.7% higher than the one with 1.5%, 57.7% higher than the one with 2%, and 17.9% lower than the one with 2.5%. For oil coated fiber reinforced composites (FROC), the average fracture energy of the witness is 59.9% higher than for the composition with 1% PVA fibers, 48.5% higher than the one with 1.5%, 63.9% higher than the one with 2%, and 41.9% higher than the one with 2.5%.
In general, oil coating of the fibers leads to a smaller fracture energy compared to the compositions with uncoated fibers. For 1% PVA fibers, the ratio (GF,uncoated /GF,oil coated) is 2.23, for 2% PVA fibers is 1.17 and for 2.5% PVA fibers is 2.3. The exception is for 1.5% PVA fibers where the ratio is under 1: 0.86. In this case, the best performance is shown by the FRC-2.5%.
Figure 12 depicts the average flexural tensile strength (fct,fl) versus the peak displacement (Δ) for all the experimental compositions. The figure describes the pre-peak behaviour which corresponds to the initiation of the first crack. In Figure 13, only the displacements at peak are presented, along with their exact values. According to Eurocode 2 [38], the flexural tensile strength specific to the specimen size fctm,fl equals the direct tensile strength fctm or 1.56*fctm, whichever is greater. Hence, based on the experimental tests, a direct tensile strength can be estimated between a minimum of 2.16 MPa for FROC-1% specimen 3 and a maximum of 3.92 MPa for FROC-2.5% specimen 3. It is noteworthy that ordinary concrete falls within the limits of C12 and C45, with corresponding direct tensile strengths of fctm 1.6 MPa and 3.8 MPa, respectively. The test results demonstrate that the experimental compositions perform similarly in tension to ordinary concrete, despite the complete lack of aggregates. The witness composition exhibits a direct tensile strength of 6.47 MPa.
However, despite the relatively low tensile strength, the displacement at peak shows, as depicted in Figure 13, a significant "bendable" trait, similar to the behavior observed in traditionally reinforced structural elements during bending tests. For functionality reasons during the service life, a deformation limit of 4% of the clear span is usually imposed for reinforced concrete elements. For the experimental specimens, this equals 0.58 mm, with three specimens surpassing this limit and the others being in close proximity.
4. Discussion
4.1. Bulk Density
The replacement of natural aggregates with fly ash significantly reduces material density, making the FRC compositions lighter alternatives to traditional concrete. Fiber type and dosage influence density variations, though the overall impact remains relatively small.
4.2. Compressive Strength fcm
According to fib Bulletin 42 [37], the standardized compressive strength of 150 mm cubes is 96.8% of that measured on 100 mm cubes. Further extrapolation suggests that the compressive strength of 150 mm cubes is approximately 93.7% of that obtained for 50 mm cubes, which the present study used. The estimated values for 150 mm cubes of the experimental compositions and their corresponding concrete grades are as follows:
- Reference Concrete (W): 30.98 MPa – C25
- 1% PVA Fibers: Uncoated (FRC): 21.34 MPa - C16; Oil-coated (FROC): 21.62 MPa - C16;
- 1.5% PVA Fibers: FRC: 22.76 MPa - C16; FROC: 23.97 MPa - C16;
- 2% PVA Fibers: FRC: 30.65 MPa - C25; FROC: 23.88 MPa - C16
- 2.5% PVA Fibers: FRC: 13.17 MPa - C8; FROC: 24.11 MPa, C16
In this study, fiber type (coated vs. uncoated) had a minimal impact on compressive strength. Even when excluding extreme cases (FRC-2% and FRC-2.5%), the fiber volume fraction did not significantly influence the concrete grade. However, the presence of sand aggregates improves the concrete grade, leading to a stronger matrix while maintaining the same cement dosage, without requiring fly ash or fibers.
Using 2% uncoated PVA fibers (FRC-R4-2%) emerges as a viable alternative to conventional concrete, achieving a compressive strength comparable to W, but with significantly lower weight. However, increasing fiber content beyond 2% (e.g., 2.5%) negatively affects compressive strength, likely due to fiber clustering, poor dispersion, or increased porosity. While oil-coated fibers exhibit slightly more consistent performance, they do not significantly improve compressive strength.
This study highlights the potential of lightweight fiber-reinforced composites (FRC) for structural applications, particularly where reducing self-weight is a priority. However, further research is needed to optimize fiber content and dispersion for improved efficiency and structural performance.
4.3. Compressive Strain εc1
The variability in the strain and slope patterns observed in the experimental results can be attributed to the heterogeneity of high-volume fly ash and the distribution of PVA fibers within the matrix [25]. Research suggests that oil-coated fibers improve ductility by reducing fiber-matrix bond strength, leading to more uniform behavior [1,2,3,4].
These are the standardized values of compressive strength:
When compared to standardized values, the measured compressive strains in this study reached up to twice the expected limits, indicating a significantly different failure mechanism than that of traditional concrete. While witness specimens recorded compressive strains between 1.97‰ and 2.25‰—consistent with C25-C30 concrete—the fiber-reinforced composites (FRC) displayed notably higher ductility. At lower fiber content (1%), both strain and compressive strength showed greater consistency. However, as fiber content increased, so did variability, likely due to fiber clustering and its effect on the matrix.
Among the tested materials, oil-coated fibers (FROC) exhibited more uniform behavior than uncoated fibers, suggesting that improved dispersion and reduced local stress concentrations contribute to better performance. Additionally, the inherent heterogeneity of fly ash may have played a role in mechanical property variations, emphasizing the importance of controlling particle size for improved material reliability.
The discrepancies between experimental and theoretical values underscore the challenge of accurately modeling fiber-reinforced concrete. The presence of fibers alters material behavior in ways that standard models do not fully capture. As a result, further research is necessary to refine predictive models and establish a clearer understanding of the relationship between fiber content, strain behavior, and overall performance.
4.4. Secant Modulus of Elasticity Ecm
The modulus of elasticity, a key parameter in material behavior, is influenced by aggregate stiffness, cement paste, and the transition zone [37]. Defined as the tangent modulus at the origin of the stress-strain diagram, it corresponds to the slope of the unloading branch. The secant modulus of elasticity, which is used in service life calculations, is determined from the slope connecting the origin to 40% of the compressive strength value, marking the elastic limit where deformations remain reversible.
Experimental results reveal that all tested specimens exhibit tension softening behavior, differing from ECC’s characteristic hardening. The extent of this softening is influenced by fiber volume, material composition, and bond properties. The use of low elastic modulus PVA fibers, positioned perpendicular to the applied force, resulted in poor flexural performance, with low displacements at low flexural tensile strengths. Since testing was stopped before complete specimen separation, the measured fracture energy was limited by the imposed deformation threshold.
Aggregate type and size can alter the modulus of elasticity by approximately ±30%. For instance, traditional concrete with sandstone aggregates has an elastic modulus of around 14.4 GPa, while quartzitic aggregates increase this to 20.5 GPa [37]. In fiber-reinforced materials, microcracking and stress redistribution play a critical role in deformation behavior, particularly in the fracture zone. While ECC materials are designed to optimize these properties, FRC and FROC lower moduli of elasticity necessitates further structural deformation testing.
The relationship between compressive strain at peak and the secant modulus of elasticity reveals significant deviations from Eurocode 2 (EC2) predictions. The high fly ash content and absence of aggregates in FRC and FROC mixtures contribute to a lower-than-expected modulus, reducing the slope of the stress-strain curve. These compositions display greater variability in mechanical behavior than the witness mix, highlighting the challenges of predicting elastic properties in fiber-reinforced materials.
Ultimately, the lower modulus of elasticity in FRC/ECC suggests a fundamentally different stress redistribution mechanism compared to traditional concrete. Future research should focus on optimizing fiber content and dispersion to enhance load-bearing capacity and control long-term deformations.
4.5. Flexural Tensile Strength fct,fl, Displacement Δ and Fracture Energy Gf
Tensile failure of traditional concrete is a brittle phenomenon due to the formation of microcracking, followed immediately by a singular sudden large crack at approximately 90% of the tensile strength fct. Flexural tensile strength on unnotched specimens depends greatly on the same parameters as the compressive strength, especially on the type and size of the aggregates, though it increases more slowly with age. Water storage before testing also leads to a reduction of the tensile strength of concrete compared to the tensile strength determined on dry and sealed specimens [37].
Fiber addition has minimal impact on peak tensile and compressive strength [41], but its primary role emerges when cracking occurs—fibers limit crack opening and enhance post-cracking strength. According to [41], fibers contribute to either flexural hardening (ECC behavior) or flexural softening (typical of ordinary concrete and most FRCs).
Previous literature computed the post-cracking strength by considering the area under the load-displacement curve on the descending branch after the peak [42]. Other research focused on evaluating the strain energy density in tension using the area under the entire tensile stress-strain curves [43]. Nevertheless, the most generally utilized measure for tension hardening is the fracture energy.
Fracture energy (GF, N/mm) quantifies the energy required for crack propagation per unit area. While traditionally considered constant, it varies with specimen size and initial crack length [44]. For unreinforced concrete up to 140 MPa, fib 42 [37] suggests values between 0.10 and 0.25 N/mm.
In the experimental study, the fibers improved crack resistance and post-cracking strength, despite minimal effects on peak tensile and compressive strength. All compositions exhibited tension softening, with fiber volume, material type, and bond properties affecting performance. FRC mixtures generally outperformed FROC, though oil-coated fibers showed advantages at specific percentages. FROC-2.5% exhibited the best overall performance.
Despite relatively low tensile strength caused also by the curing conditions, the high displacement at peak indicates a “bendable” behaviour like traditionally reinforced elements. A 4% deformation limit (0.58 mm for test specimens) was met or exceeded in most cases, suggesting a delayed crack initiation compared to ordinary concrete. It can also mean there could be improved durability by reducing crack width and limiting penetration of aggressive substances. The compositions have the potential for structural applications, with FROC-2.5% recommended for further testing due to its superior performance in flexure.
4.6. Structural Design
In this chapter, a comparison is made between the properties of ordinary concrete and FROC-2.5% to evaluate the feasibility of using the experimental composition in structural applications. The results highlight the promising potential of FROC-2.5% for such applications, demonstrating its suitability and performance in comparison to conventional concrete.
4.6.1. General Considerations on Traditional and Fiber Reinforced Composite Structural Design
One of the most critical characteristics of traditional concrete is its compressive strength. In structural applications, this very attribute is balanced by the elasticity of steel to achieve internal equilibrium in the cross-section. At the ultimate limit state, both materials present in the cross-section reach their capacity; for instance, the reinforcement begins its yielding plateau in tension, while the concrete undergoes plasticization in compression before failing.
The more the concrete can withstand compression, resulting in higher compressive strength, the longer the reinforcement will yield, thus leading to a more pronounced ductility of the reinforced concrete element. Hence, not only the compressive strength but also the ultimate strain in compression governs the ductility of the structural element at the virtual failure point, also known as the ultimate limit state. According to Eurocode 2 [38], for ordinary concrete up to C50/60, an ultimate strain in compression of 3.5‰ is considered in bending behavior, while a limit strain at the peak ranging from 1.8 to 2.45‰ is often considered in compression.
FRC exhibits slightly different behavior in structural applications. The presence of fibers hardly improves the compressive strength, allowing the classification for ordinary concrete to be used, as per fib 105 [41]. However, its advantage lies in the post-cracking tensile strength, which in standard tests on specimens may exhibit tension softening. In a hybrid reinforced beam (combining traditional reinforcement with fibers), tension softening can transform into tension hardening. If FRC toughness is high, it can impact the flexural capacity of the beams. Otherwise, the main effects on structural behavior in bending are the enhancement of ductility in compression and the increased ductility due to higher energy absorption of FRC, provided that the bond between the bar and concrete does not lead to strain localization.
4.6.2. FROC-2.5% Simulation in Bending
A structural design simulation was performed on a reinforced ordinary concrete beam OC in bending in comparison with a hybrid FRC beam. For the latter, the experimental FROC-2.5 composition was chosen, although all the tested FRC compositions behaved rather similarly in compression and flexure.
The simulation helps assess how individual mechanical properties impact the overall structural behavior, such as bending moment capacity, crack propagation, and energy absorption when the experimental FROC is integrated with reinforcement. The simulation can also verify that the experimental composition adheres to design standards, such as those in Eurocode 2, and provides safety and durability under different loading conditions. It also ensures the new composition's compatibility with traditional reinforcement, as indicated by the similar design tensile strength (fctm) and necessary area of reinforcement (As) values for FROC-2.5% and OC.
Figure 16 depicts the design diagrams for both ordinary concrete and FRC hybrid beams subjected to bending.
Table 4 presents the design characteristics according to fib 42 [37], Eurocode 2 [38], and fib 105 [41].
The design simulation reveals a 7% difference in the height of the compression zone in bending, favoring the experimental composition FROC - 2.5%, when compared to ordinary concrete. Additionally, there is a 2% increase in the required area of reinforcement.
Larger compression zones usually translate into a more ductile behavior, thus ampler crack control and ductility, since both elements have the same dimensions. The small increase in reinforcement (2%) suggests that the additional compression capacity does not drastically change the tensile reinforcement needs, which could mean a more efficient material utilization.
While the design results already demonstrate an advantage in using the experimental composition, it is estimated that in real-life structural beams, the behavior of the proposed FRC will yield even more promising results, with enhanced ductility and very small crack widths. This hypothesis will be further tested experimentally.
4.7. Recommendations for Future Work
The current experimental program on FRC with high-volume fly ash replacing sand aggregates has revealed both advantages and disadvantages of this advanced class of materials.
- Replacing aggregates with fly ash resulted in a decrease in the mechanical properties of the composites, as indicated by generic material tests. However, the values remained suitable for use in structural applications. Nonetheless, relying solely on material testing to assess structural behavior may not be sufficient, and conducting large-scale tests is essential, which is a key recommendation for future studies. Structural elements in flexure with hybrid reinforcement can ultimately demonstrate the tension hardening or softening properties of the newly proposed material and its beneficial effects on structural ductility and durability.
- For the structural design simulation, FROC-2.5% was selected due to the uniformity of the test results, although there was considerable variation among the 9 compositions in all investigated properties. This inconsistency can be partly attributed to the variability in unprocessed fly ash particle size from the coal power plant, as well as to the small casting batches and testing procedures. Future examinations should aim for a constant particle size by carefully selecting fly ash batches and using larger casting batches. Implementing deformation control testing can further improve result accuracy. With these enhancements, the FRC compositions developed in this study have the potential to be classified as ECC.
5. Conclusions
Fiber Reinforced Cementitious Composites (FRC) represent an advanced category of cement-based materials renowned for their remarkable flexibility and superior crack control, surpassing the limitations of conventional concrete. The primary aim of this research was to initiate the development and assessment of a high-volume fly ash FRC, intended to eventually be classified as Engineered Cementitious Composites (ECC). These proposed composites incorporate locally available cement, silica fume, PVA fibers, and superplasticizer, while excluding stone or sand aggregates. The study involved 9 different compositions: 4 with uncoated PVA fibers (FRC) at 1%, 1.5%, 2%, and 2.5% by weight of cement; 4 with oil coated PVA fibers (FROC) in the same percentages; and 1 witness composition (W) which included natural sand aggregates. In FRC and FROC, sand aggregates were entirely replaced by local fly ash.
The research analyzed various experimental and design characteristics, including bulk density, compressive strength, limit strain at peak, secant modulus of elasticity, flexural tensile strength and displacements, fracture energy, reliability of tests, and structural design applicability.
Key findings from the study include:
- FRC compositions without natural aggregates are significantly lighter (ranging from 1500 kg/m3 to 1720 kg/m3) compared to the witness composition (2140 kg/m3).
- Compressive strengths of the compositions depend on matrix toughness, with the highest density composition (W) exhibiting the highest compressive strength (30.98 MPa). The average compressive strengths are W: 30.98 MPa; 1% PVA fibers - FRC: 21.34 MPa; FROC: 21.62 MPa; 1.5% PVA fibers – FRC: 22.76 MPa; FROC: 23.97 MPa; 2% PVA fibers - FRC: 30.65 MPa; FROC: 23.88 MPa; 2.5% PVA fibers - FRC: 13.17 MPa; FROC: 24.11 MPa. The addition of oil coated PVA fibers (FROC) at 1%, 1.5%, and 2.5% results in slightly lower compressive strain compared to the uncoated fibers in FRC, with a difference of approximately 1-1.5‰.
- The secant modulus of elasticity is affected by the large quantity of fly ash, resulting in lower values for FRC and FROC compositions compared to the witness.
- Tensile strength in flexure is influenced by similar parameters as compressive strength, with the witness composition displaying the highest flexural tensile strength due to its high-density matrix. The difference between the composites with uncoated fibers and oil coated fibers varies as follows: for 1% PVA uncoated fibers it is a surplus of 22.5%, for 1.5% PVA uncoated fibers it is a surplus of 3.7%, for 2% PVA uncoated fibers it is a surplus of 15% and for 2.5% PVA uncoated fibers the difference consists in a decrease of 5.9%.
- Fracture energy (GF) is influenced by the presence of oil-coated fibers, leading to smaller fracture energies compared to non-coated fibers, except for 1.5% PVA fibers where FRC-2.5% shows the best performance. The form of the flexural tensile strength – displacement curve indicates that all specimens, including the witness, present a tension softening behavior, as opposed to ECC’s hardening behavior.
- Equations were developed to relate various characteristics of FRC compositions, though experimental testing is necessary for each specific application due to variations in material components.
- Structural design in the ultimate limit state for FRC is comparable to ordinary concrete, with a slight increase of 7% in compression zone height favoring FROC-2.5%, while requiring 2% additional reinforcement area.
The experimental Fiber Reinforced Composites (FRC) created in this study lack the strain hardening behavior typically seen in Engineered Cementitious Composites (ECC), but they do share various similarities. The significant distinction lies in the complete replacement of sand aggregates, commonly found in ECC, with industrial waste fly ash in FRC while maintaining favorable properties suitable for structural applications. Ongoing efforts are dedicated to further research and development to bring FRC compositions closer to exhibiting ECC-like behavior.
6. Patents
A Romanian patent application has been filed based on the work presented in this manuscript. However, as of the manuscript's submission, the patent has not yet been officially granted.
Supplementary Materials
The following supporting information can be downloaded at the website of this paper posted on Preprints.org.
Author Contributions
Conceptualization, Camelia Maria Negrutiu; methodology, Camelia Maria Negrutiu and Ioan Sosa; validation, Camelia Maria Negrutiu, Ioan Sosa, Cristina Campian, and Maria Pop; formal analysis, Camelia Maria Negrutiu and Ioan Sosa.; investigation, Camelia Maria Negrutiu.; resources, Camelia Maria Negrutiu and Ioan Sosa; data curation, Camelia Maria Negrutiu; writing—original draft preparation, Camelia Maria Negrutiu.; writing—review and editing, Camelia Maria Negrutiu, Ioan Sosa, Cristina Campian, and Maria Pop; visualization, Camelia Maria Negrutiu.; supervision Camelia Maria Negrutiu; project administration, Camelia Maria Negrutiu; funding acquisition, Camelia Maria Negrutiu and Ioan Sosa. All authors have read and agreed to the published version of the manuscript.
Funding
This research received no external funding.
Acknowledgments
The authors would like to express their sincere thanks to Technical University of Cluj-Napoca for funding this study and to the staff of the Reinforced and Pre-stressed Concrete Laboratory, Faculty of Civil Engineering for rendering their assistance.
Conflicts of Interest
The authors declare no conflicts of interest.
Abbreviations
The following abbreviations are used in this manuscript:
| FRCC | Fiber Reinforced Cementitious Composite |
| ECC | Engineered Cementitious Composite |
| PVA | Polyvinyl Alcohol |
| W | Reference, witness, composition (experimental) |
| FRC | Fiber reinforced uncoated polymers composite (experimental) |
| FROC | Fiber reinforced oil coated polymers composite (experimental) |
| OC | Ordinary concrete |
References
- Prashanthi, R., Natarajan K. Engineered cementitious composites - a review. Materials Today: Proceedings, 2023, article in press. [CrossRef]
- Shoji, D., He, Z., Zhang, D., Li, V. C. The greening of engineered cementitious composites (ECC): A review. Construction and Building Materials, 2022, Volume 327 126701. [CrossRef]
- Gadhiya, S., Patel, T.N., Shah, D. Bendable concrete: a review. Int. J. Struct. & Civil Engg. Res. 2015, Volume 4, No. 1, ISSN 2319 – 6009, https://www.ijscer.com/uploadfile/2015/0421/20150421033908316.pdf.
- Li, V. C. Engineered Cementitious Composites (ECC) – Material, Structural, and Durability Performance. 2007, USA, Book available at https://deepblue.lib.umich.edu/bitstream/handle/2027.42/84661/ECC_Book_Chapter.pdf?sequence=1.
- Huo, Y., Sun, H., Chen, Z., Yang, Y. Mechanical properties and its reliability prediction of engineered /strain-hardening cementitious composites (ECC/SHCC) with different moisture contents at negative temperatures. Cement and Concrete Composites, 2022, Volume 134 104812. [CrossRef]
- Ma, K., Deng, H., Guo, X., Yin, J., Zhao, Y. The investigating on mechanical properties of engineered cementitious composites with high ductility and low cost, Journal of Building Engineering, 2022, Volume 57 104873. [CrossRef]
- Booya, E., Gorospe, K., Das, S., Loh, P. The influence of utilizing slag in lieu of fly ash on the performance of engineered cementitious composites. Construction and Building Materials, 2020, Volume 256 119412. [CrossRef]
- Lu, C., Pang, Z., Chu, H., Leung, C. K.Y. Experimental and numerical investigation on the long-term performance of engineered cementitious composites (ECC) with high-volume fly ash and domestic polyvinyl alcohol (PVA) fibers. Journal of Building Engineering, 2023, Volume 70 106324. [CrossRef]
- Mousavinejad, S. H. G., Alemi, M. P. Micro-structural and mechanical properties of PVA fiber reinforced engineered cementitious composite incorporating natural and artificial pozzolanic materials under different temperatures. Construction and Building Materials, 2022, Volume 346 128180. [CrossRef]
- Zhuang, J., Shen, S. , Yang, Y., Xu, K., Ni, P. Mechanical performance of basalt and PVA fiber reinforced hybrid-fiber engineered cementitious composite with superimposed basalt fiber content. Construction and Building Materials, 2022, Volume 353 129183. [CrossRef]
- Lu, C., Yuan, Z., Yang, C., Hou, D., Yao, Y. Tensile properties of PVA and PE fiber reinforced engineered cementitious composites containing coarse silica sand, Journal of Building Engineering, 2023, Volume 75 106913. [CrossRef]
- Shi, J., Han, J., Xu, J. Effect of fiber constituent in matrix on cyclic behaviour of PVA-Steel hybrid Fiber-Reinforced cementitious composites columns with mild steel rebar. Construction and Building Materials, 2022, Volume 359 129514. [CrossRef]
- Shen, Y., Li, Q., Huang, B., Liu, X., Xu, S. Effects of PVA fibers on microstructures and hydration products of cementitious composites with and without fly ash. Construction and Building Materials, 2022, Volume 360 129533. [CrossRef]
- Deng, Y., Yan, C., Zhang, J., Yin, L., Liu, S., Yan, Y. Preparation and mechanical characterization of engineered cementitious composites with high-volume fly ash and waste glass powder. Journal of Cleaner Production, 2022, Volume 333 130222. [CrossRef]
- Wang, J., Dong, H. PVA fiber-reinforced ultrafine fly ash concrete: Engineering properties, resistance to chloride ion penetration, and microstructure. Journal of Building Engineering, 2023, Volume 66 105858. [CrossRef]
- Zhu, H., Hu, W.-H., Mehthel, M., Villette, T., Salazar Vidal, O., Nasser, W. N., Li, V. C. Engineered cementitious composites (ECC) with a high volume of volcanic ash: Rheological, mechanical, and micro performance. Cement and Concrete Composites, 2023, Volume 139 105051. [CrossRef]
- Shen Y., Li, Q., Xu, S., Liu, X. Electromagnetic wave absorption of multifunctional cementitious composites incorporating polyvinyl alcohol (PVA) fibers and fly ash: Effects of microstructure and hydration. Cement and Concrete Research, 2021, Volume 143 106389. [CrossRef]
- Bheel, N., Ali, M. O. A., Kırgız, M. S., Shafiq, N., Gobinath, R. Effect of graphene oxide particle as nanomaterial in the production of engineered cementitious composites including superplasticizer, fly ash, and polyvinyl alcohol fiber. Materials Today: Proceedings, 2023, article in press. [CrossRef]
- Quan, X., Wang, S., Liu, K., Zhao, N., Xu, J., Xu, F., Zhou, J. The corrosion resistance of engineered cementitious composite (ECC) containing high-volume fly ash and low-volume bentonite against the combined action of sulfate attack and dry-wet cycles. Construction and Building Materials, 2021, Volume 303 124599. [CrossRef]
- Cai, X., Yang, D., Zhang, D., Cui, J., Wang, W., Liu, L. Development of high-early-strength low-carbon engineered cementitious composites with calcium sulfoaluminate cement incorporating high-volume fly ash. Case Studies in Construction Materials, 2023, 18 e01959. [CrossRef]
- Zhanga, Z., Yangb, F., Liuc, J.-C., Wanga, S. Eco-friendly high strength, high ductility engineered cementitious composites (ECC) with substitution of fly ash by rice husk ash. Cement and Concrete Research, 2020, Volume 137 106200. [CrossRef]
- Feng, H., Nie, S., Guo, A., Lv, L., Yu, J. Evaluation on the performance of magnesium phosphate cement-based engineered cementitious composites (MPC-ECC) with blended fly ash/ silica fume. Construction and Building Materials, 2022, Volume 341 127861. [CrossRef]
- Zhu, B., Pan, J., Zhang, M., Leung, C. K.Y. Predicting the strain-hardening behaviour of polyethylene fibre reinforced engineered cementitious composites accounting for fibre-matrix interaction. Cement and Concrete Composites, 2022, Volume 134 104770. [CrossRef]
- Shi, Y., Jing, H., Liu, B., Hou, C., Qian, H. Synergistic utilization of porous coral sand and fly ash for multifunctional engineered cementitious composites with polyethylene fibers: Intensified electromagnetic wave absorption and mechanism. Journal of Cleaner Production, 2023, 396 136497. [CrossRef]
- Minnick, L. J. G., Corson, W. H. Lightweight Concrete Aggregate From Sintered Fly Ash. 49th Annual Meeting, Plymouth, Pennsylvania, https://onlinepubs.trb.org/Onlinepubs/hrr/1970/307/307-003.pdf.
- Shanmugasundaram, S., Jayanthi, S., Sundararajan, R., Umarani, C., Jagadeesan, K. Study on Utilization of Fly Ash Aggregates in Concrete. Modern Applied Science, 2010, Volume 4, No. 5, https://ccsenet.org/journal/index.php/mas/article/view/6024.
- Krížová, K., Bubeník, J., Sedlmajer, M. Use of Lightweight Sintered Fly Ash Aggregates in Concrete at High Temperatures. Buildings, 2022, Volume 12 122090. [CrossRef]
- Ravisankar, K. L., Gowtham, S. K., Raghavan, T. R. Experimental Study on Artificial Fly Ash Aggregate Concrete. International Journal of Innovative Research in Science, Engineering and Technology, 2015, Volume 4, Issue 11, https://www.ijirset.com/upload/2015/november/35_Experimental.pdf.
- Vijay, P. Use of Fly Ash Aggregates in Concrete and its Applications in Structures. International Journal of Recent Development in Engineering and Technology), 2015, Volume 4, Issue 7, https://www.ijrdet.com/files/Volume4Issue7/IJRDET_0715_04.pdf.
- Pannem, R. M. R., Bashaveni, B., Kalaiselvan, S. The effect of fly ash aggregates on the self-healing capacity of bacterial concrete, Ain Shams Engineering Journal, 2024, Volume 15, Issue 1, 102261. [CrossRef]
- Domagała, L. Durability of Structural Lightweight Concrete with Sintered Fly Ash Aggregate. Materials, 2020, Volume 13 4565. [CrossRef]
- Behera, D., Liu, K.-Y., Gopalakrishnan, D. Experimental Prognostication of Ultra-High-Performance Lightweight Hybrid Fiber-Reinforced Concrete by Using Sintered Fly Ash Aggregate, Palm Oil Shell Aggregate, and Supplementary Cementitious Materials. Materials, 2022, Volume 15 5051. [CrossRef]
- Bhoi, K. C., Pattnaik, R. R. Investigation into low density fly ash aggregate in micro-concrete for lightweight concrete repair, Journal of Building Pathology and Rehabilitation, 2018, Volume 3, Article no. 10. [CrossRef]
- Termodeva. Available online: http://www.termodeva.ro/index.php (Accessed on 01 March 2025).
- SR EN 12390-3:2019 Testing hardened concrete - Part 3: Compressive strength of test specimens.
- SR EN 12390-5:2019 Testing hardened concrete - Part 5: Flexural strength of test specimens.
- fib Bulletin N° 42. Constitutive modelling for high strength / high performance concrete. State-of-art report, 2008, ISBN 978-2-88394-082-6.
- SR EN 1992-1-1:2004 - Eurocode 2 (EC2): Design of concrete structures - Part 1-1 : General rules and rules for buildings.
- RILEM TCS. Determination of the fracture energy of mortar and concrete by means of three-point bend tests on notched beams, Materials and Structures, 1985, Volume 18, Issue 106, ISSN: 1359-5997.
- JCI-S-001-2003. Method of test for fracture energy of concrete by use of notched beam. Japan Concrete Institute Standard.
- fib Bulletin No. 105. Fibre Reinforced Concrete. State-of-the-Art report, 2022, ISBN 978-2-88394-162-5.
- Said, S. H., Razak, H. A. The effect of synthetic polyethylene fiber on the strain hardening behavior of engineered cementitious composite (ECC). Materials and Design, 2015, Volume 86, pp. 447–457. [CrossRef]
- Xu, L.-Y., Huang, B.-T., Lao, J.-C., Dai, J.-G. Tailoring strain-hardening behavior of high-strength Engineered Cementitious Composites (ECC) using hybrid silica sand and artificial geopolymer aggregates. Materials & Design, 2022, Volume 220 110876. [CrossRef]
- Xu, P., Ma, J., Zhang, M., Ding, Y., Meng, L. Fracture Energy Analysis of Concrete considering the Boundary Effect of Single-Edge Notched Beams, Hindawi Advances in Civil Engineering, 2018, Article ID 3067236. [CrossRef]
Figure 1.
Fiber Reinforced Cementitious Composites developed in this study.
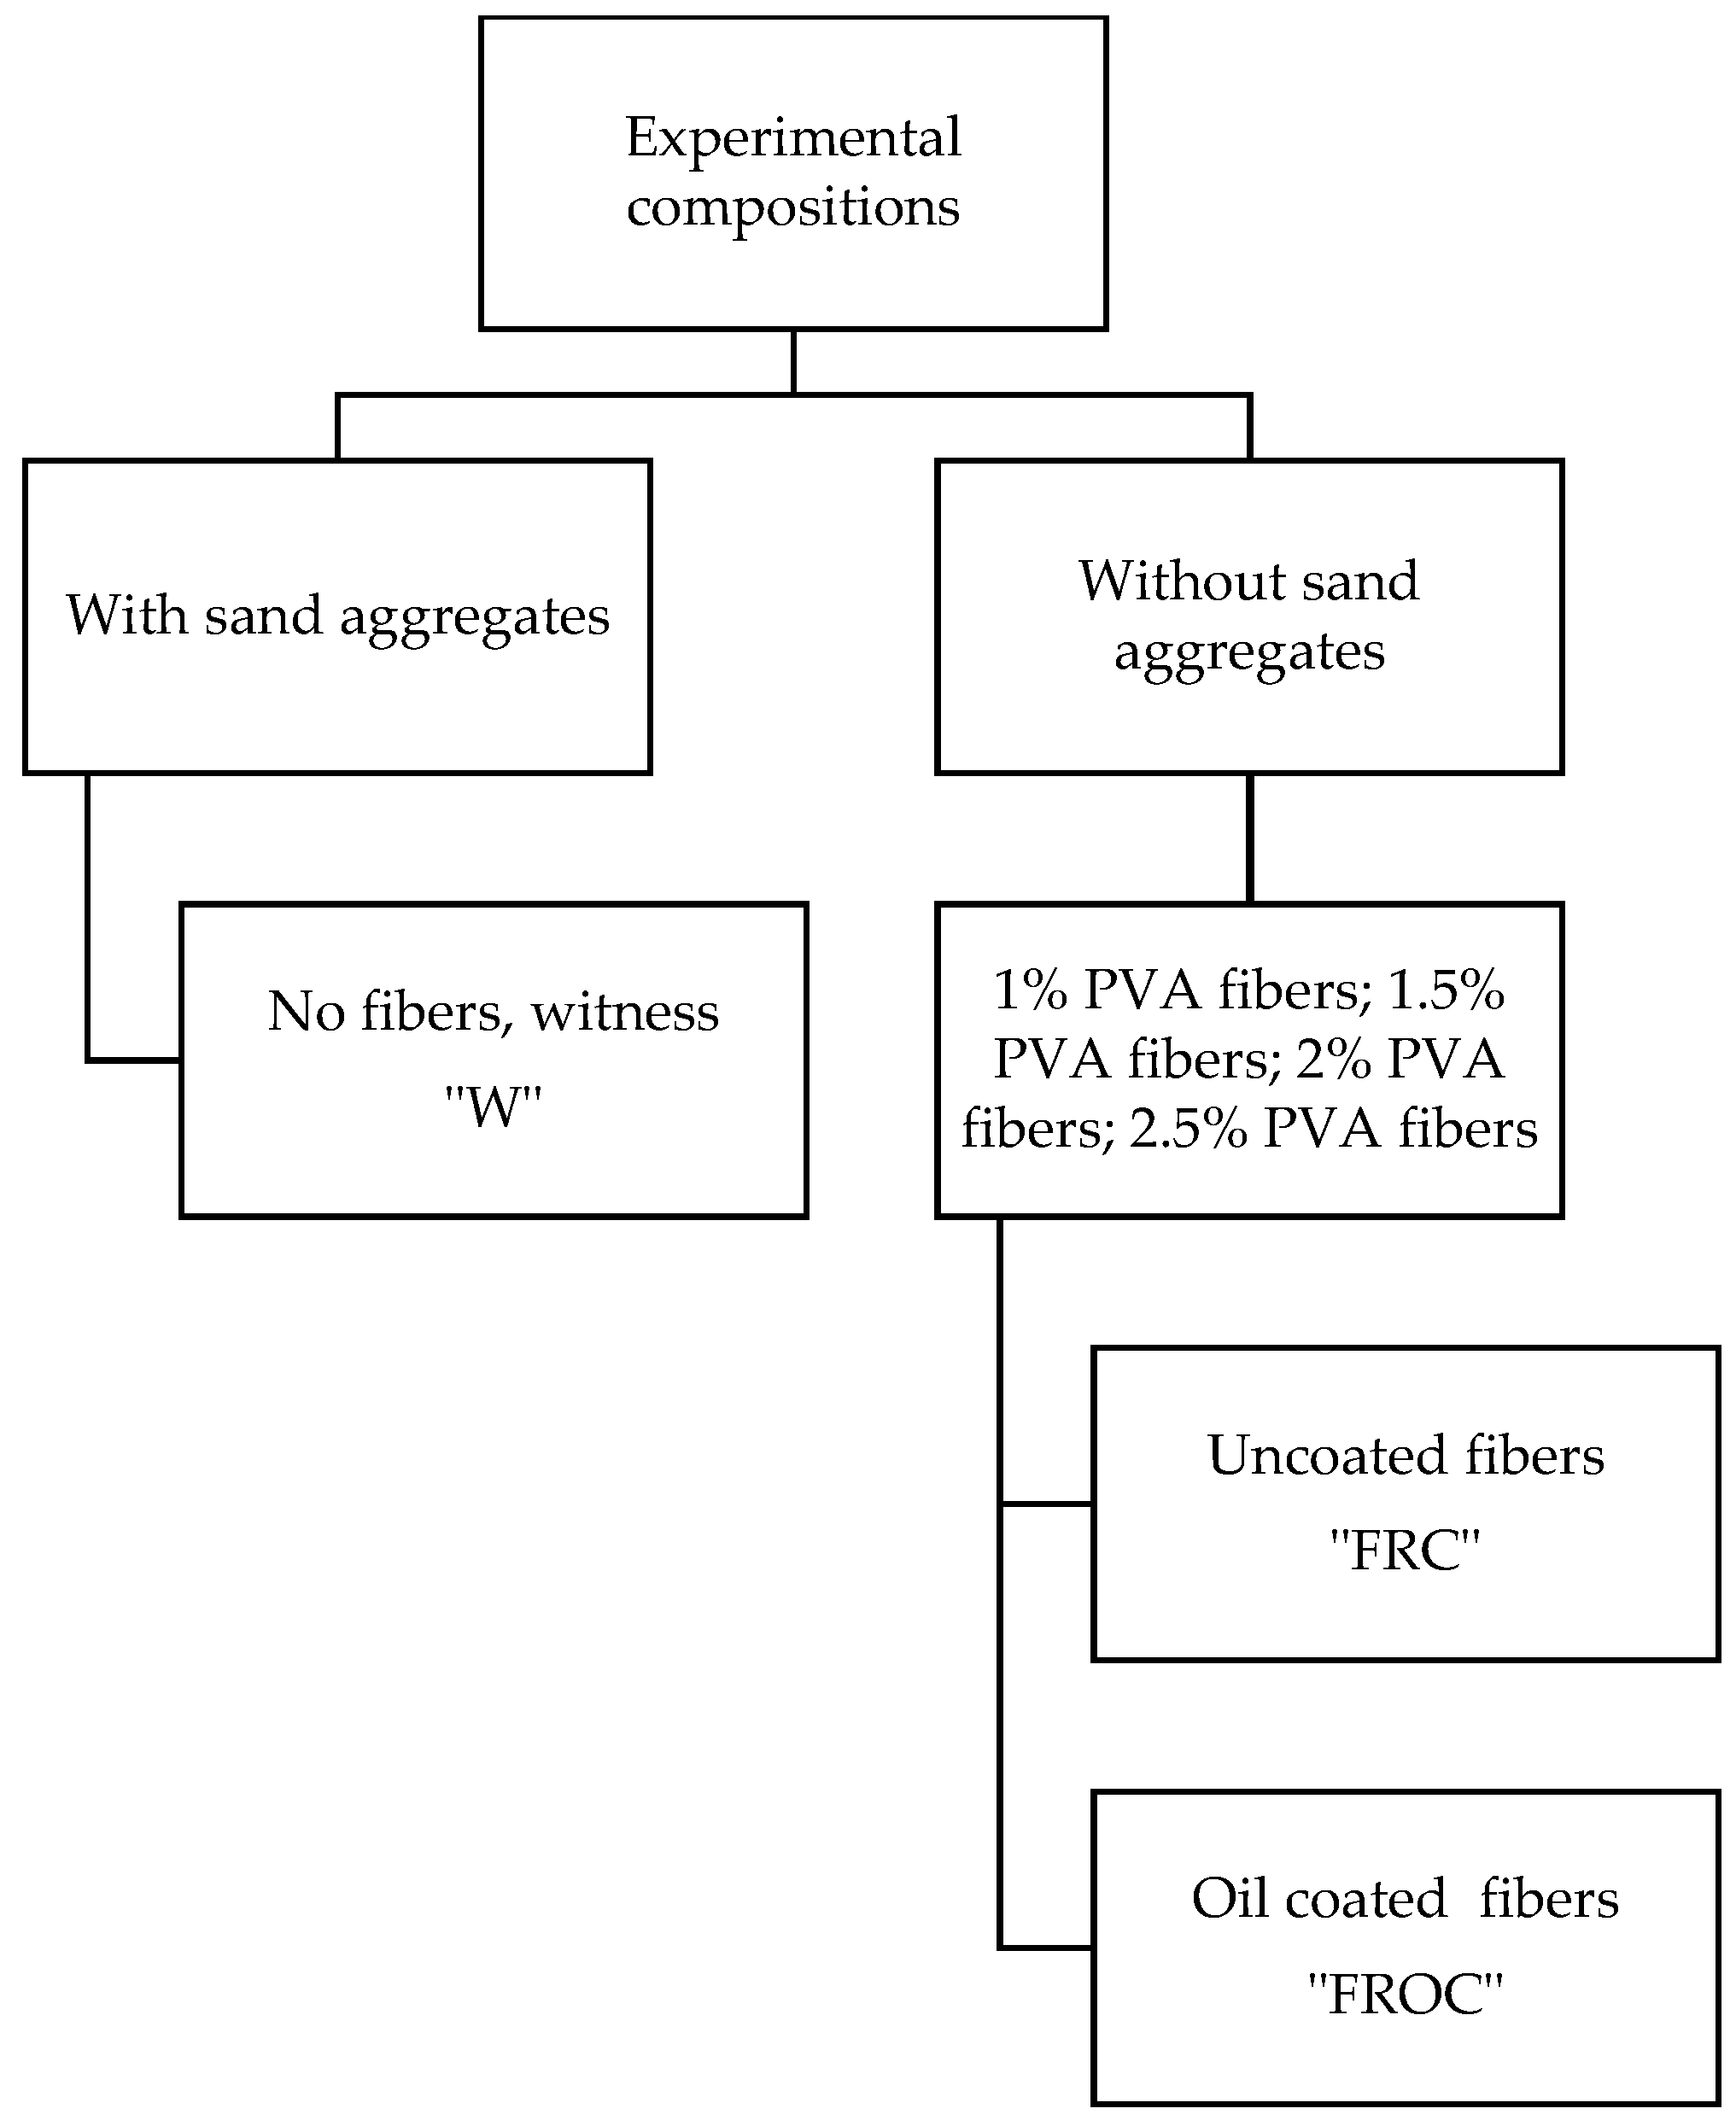
Figure 2.
Visual aspect of material components and composite structure.
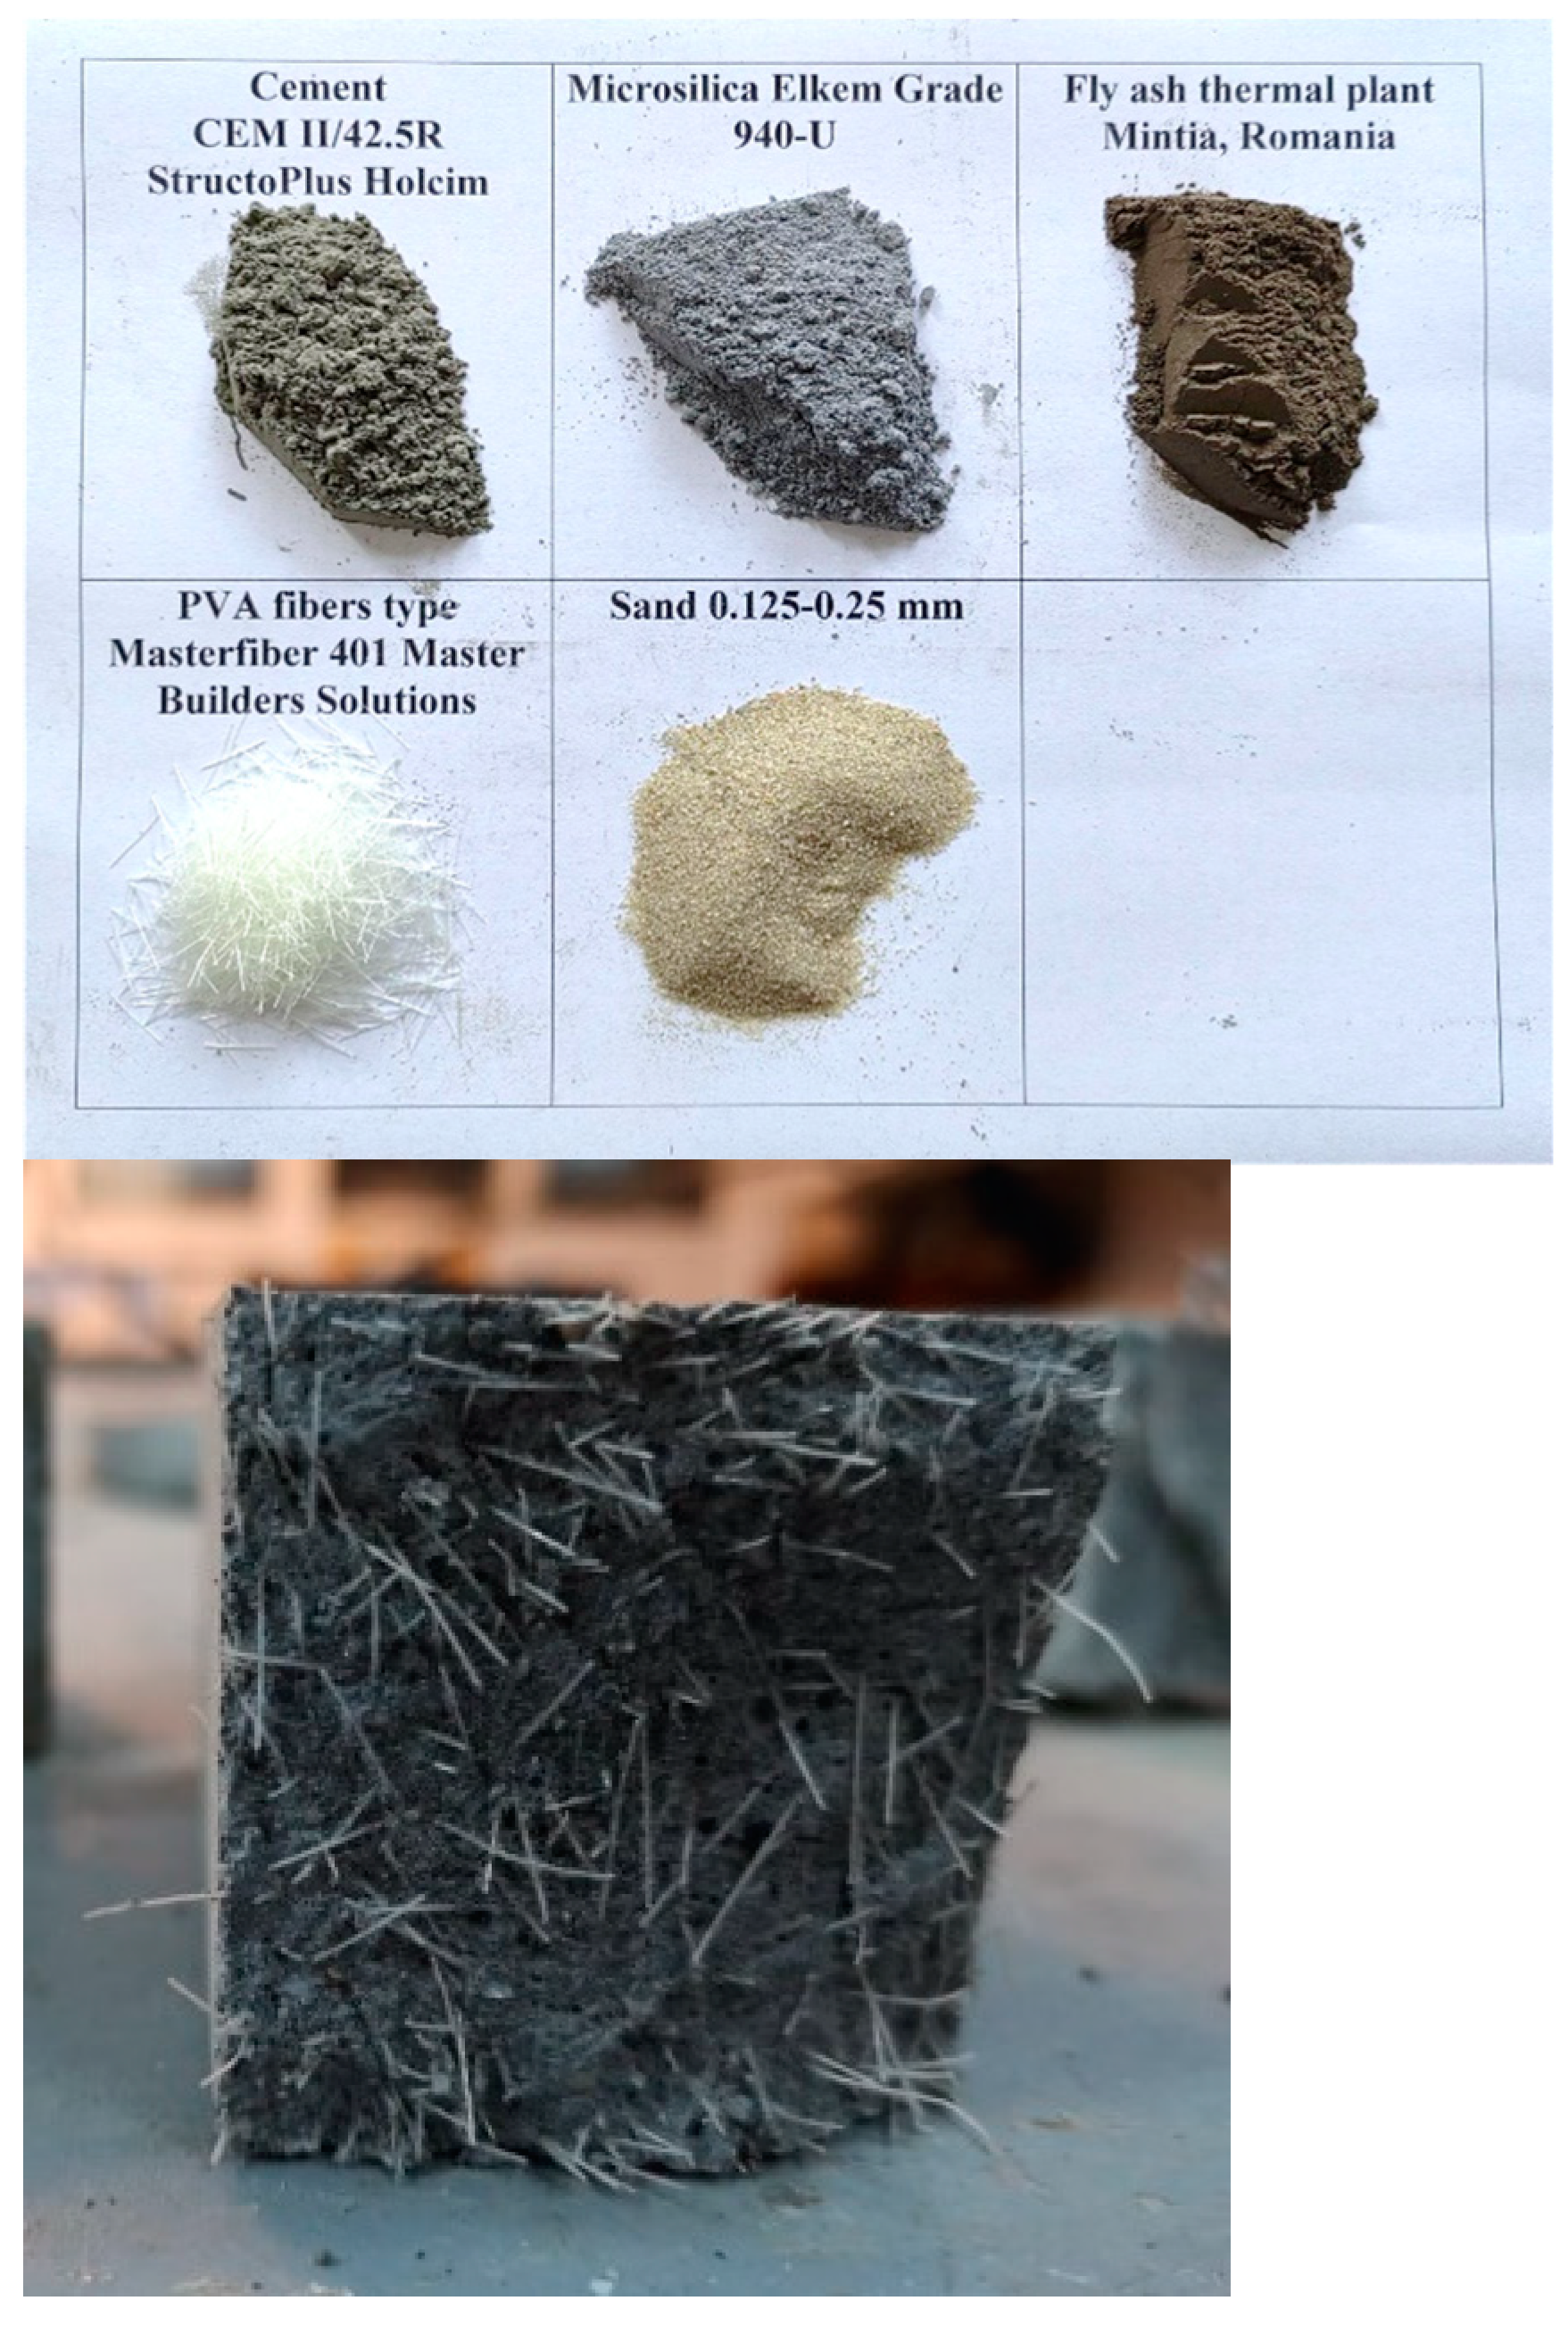
Figure 4.
(a) Compressive strength vs. matrix density. (b) Compressive strength of the experimental compositions – average values.
Figure 4.
(a) Compressive strength vs. matrix density. (b) Compressive strength of the experimental compositions – average values.
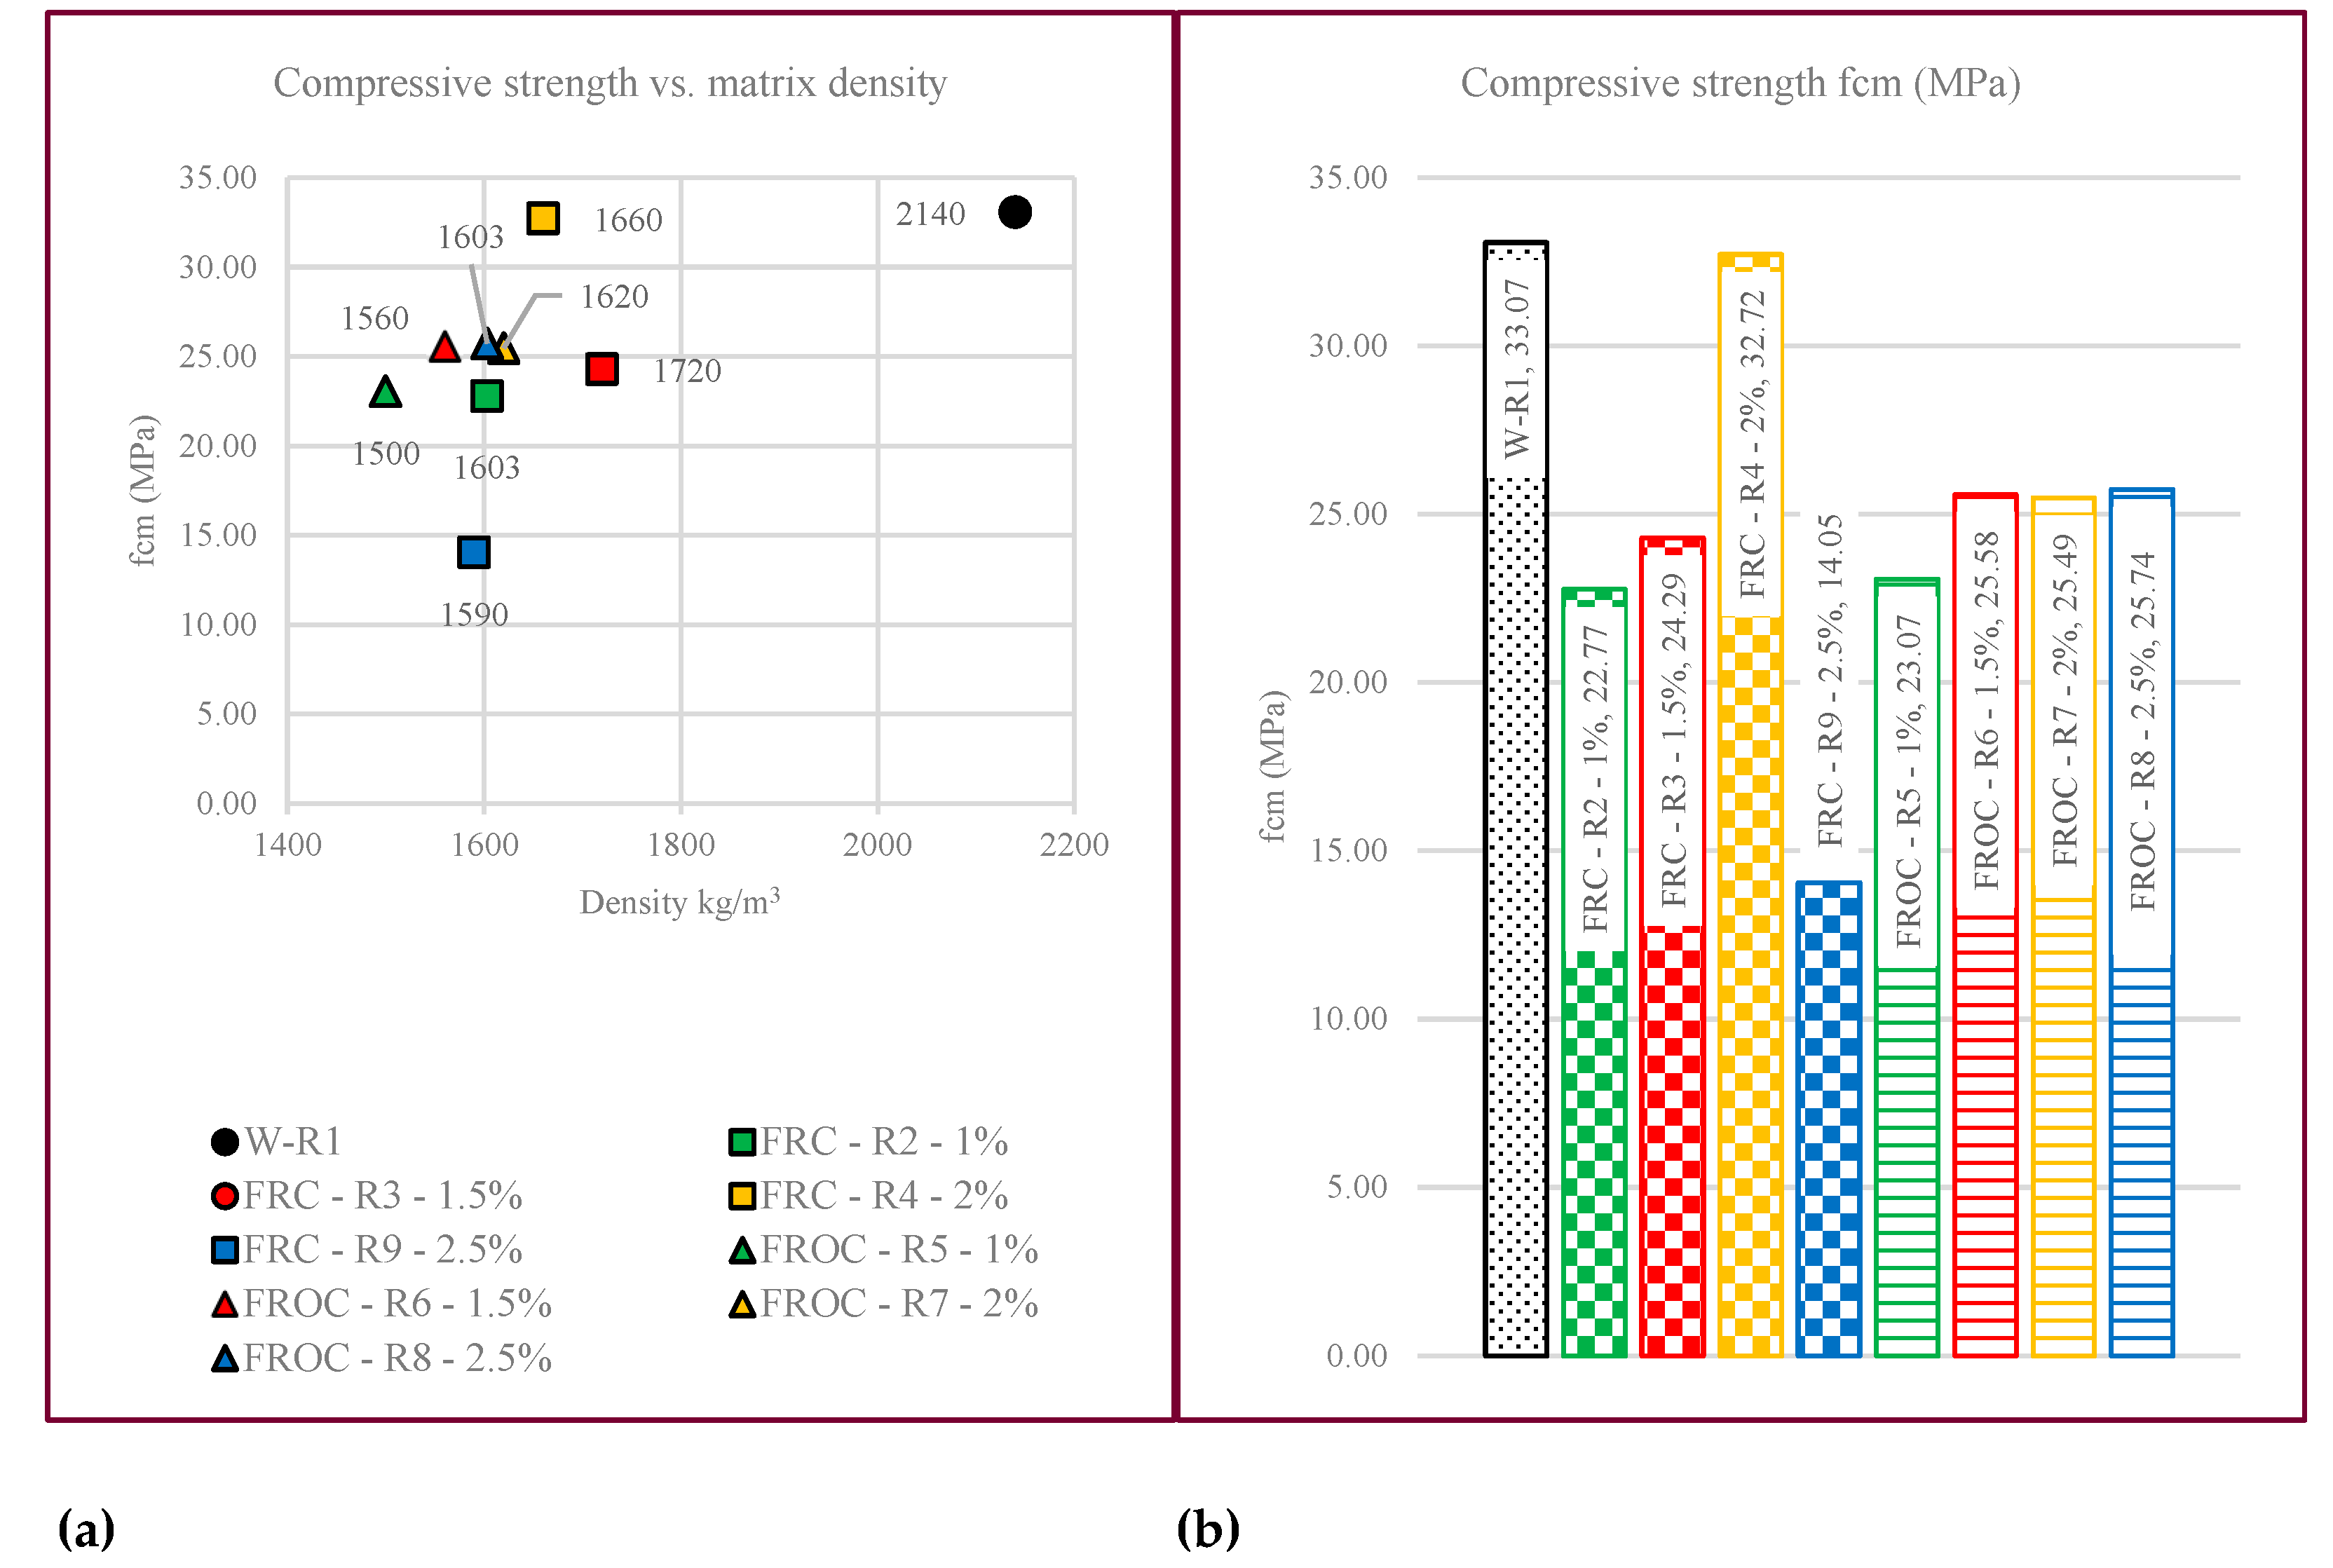
Figure 6.
Compressive strength (fcm) vs. strain at peak (εc1).
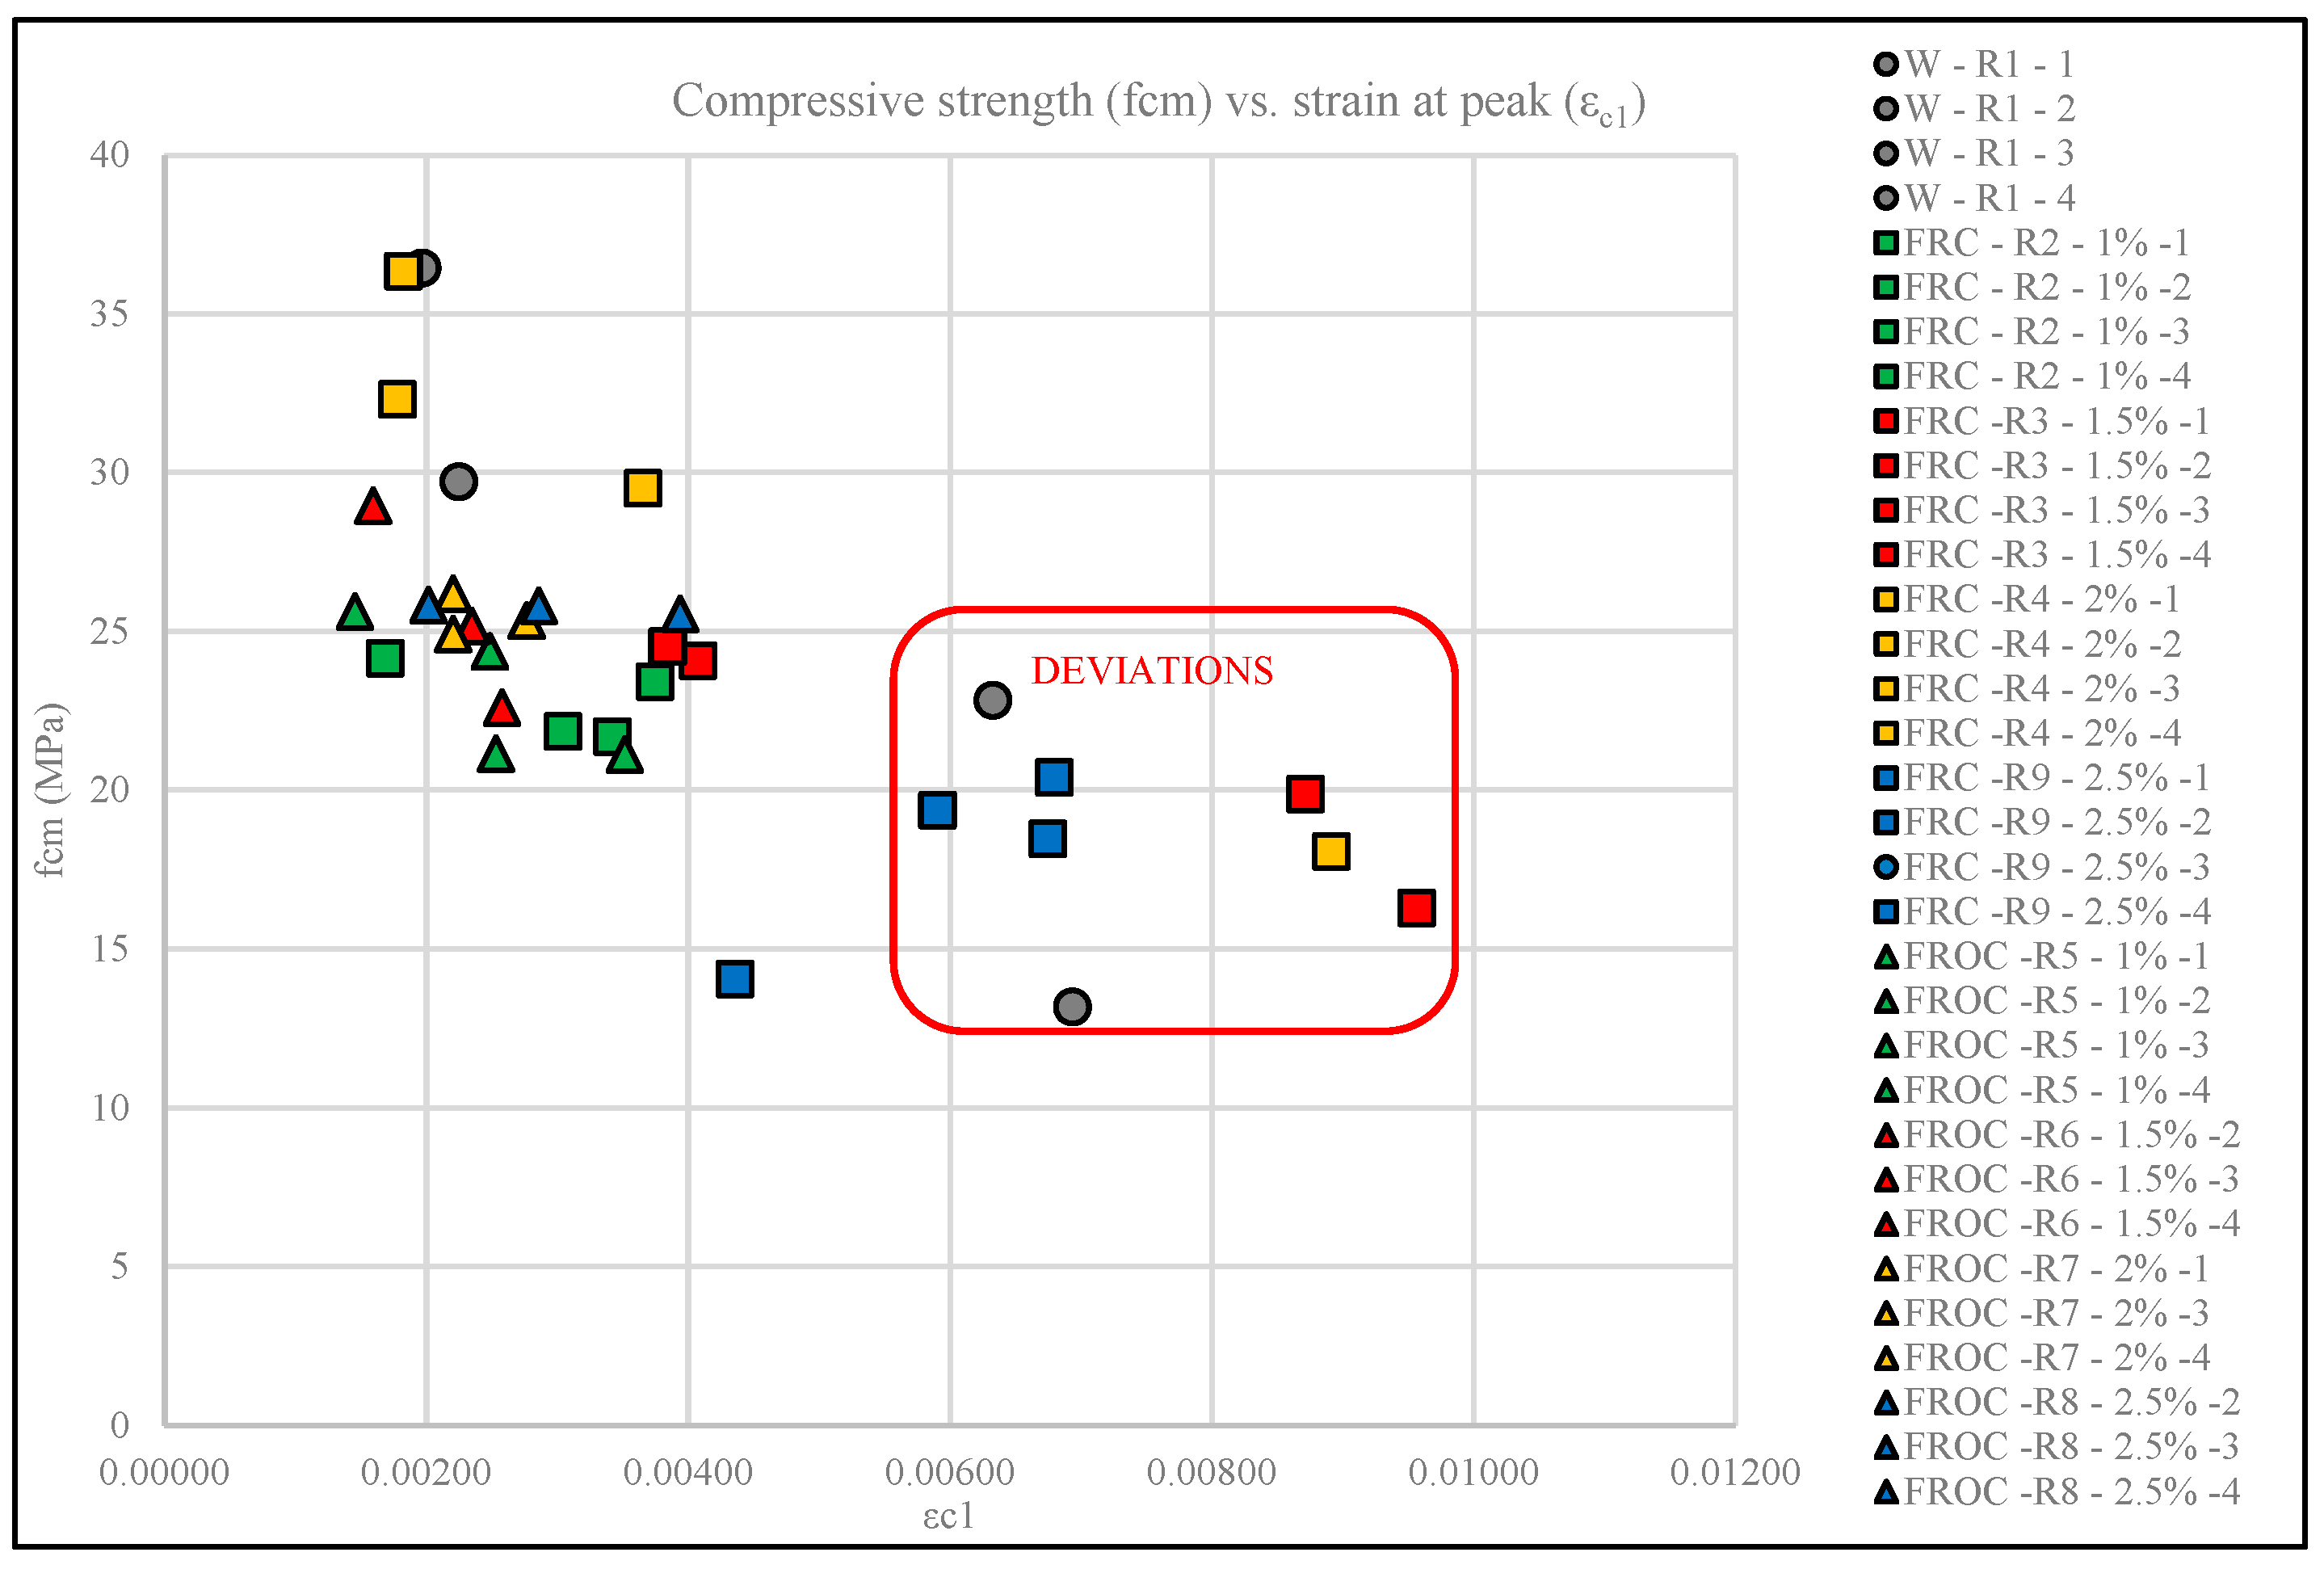
Figure 7.
Compressive limit strain εc1 (‰): experimental and design EC2 [38] values.
Figure 7.
Compressive limit strain εc1 (‰): experimental and design EC2 [38] values.

Figure 8.
Compressive strength (fcm) vs. secant modulus of elasticity (Ecm).
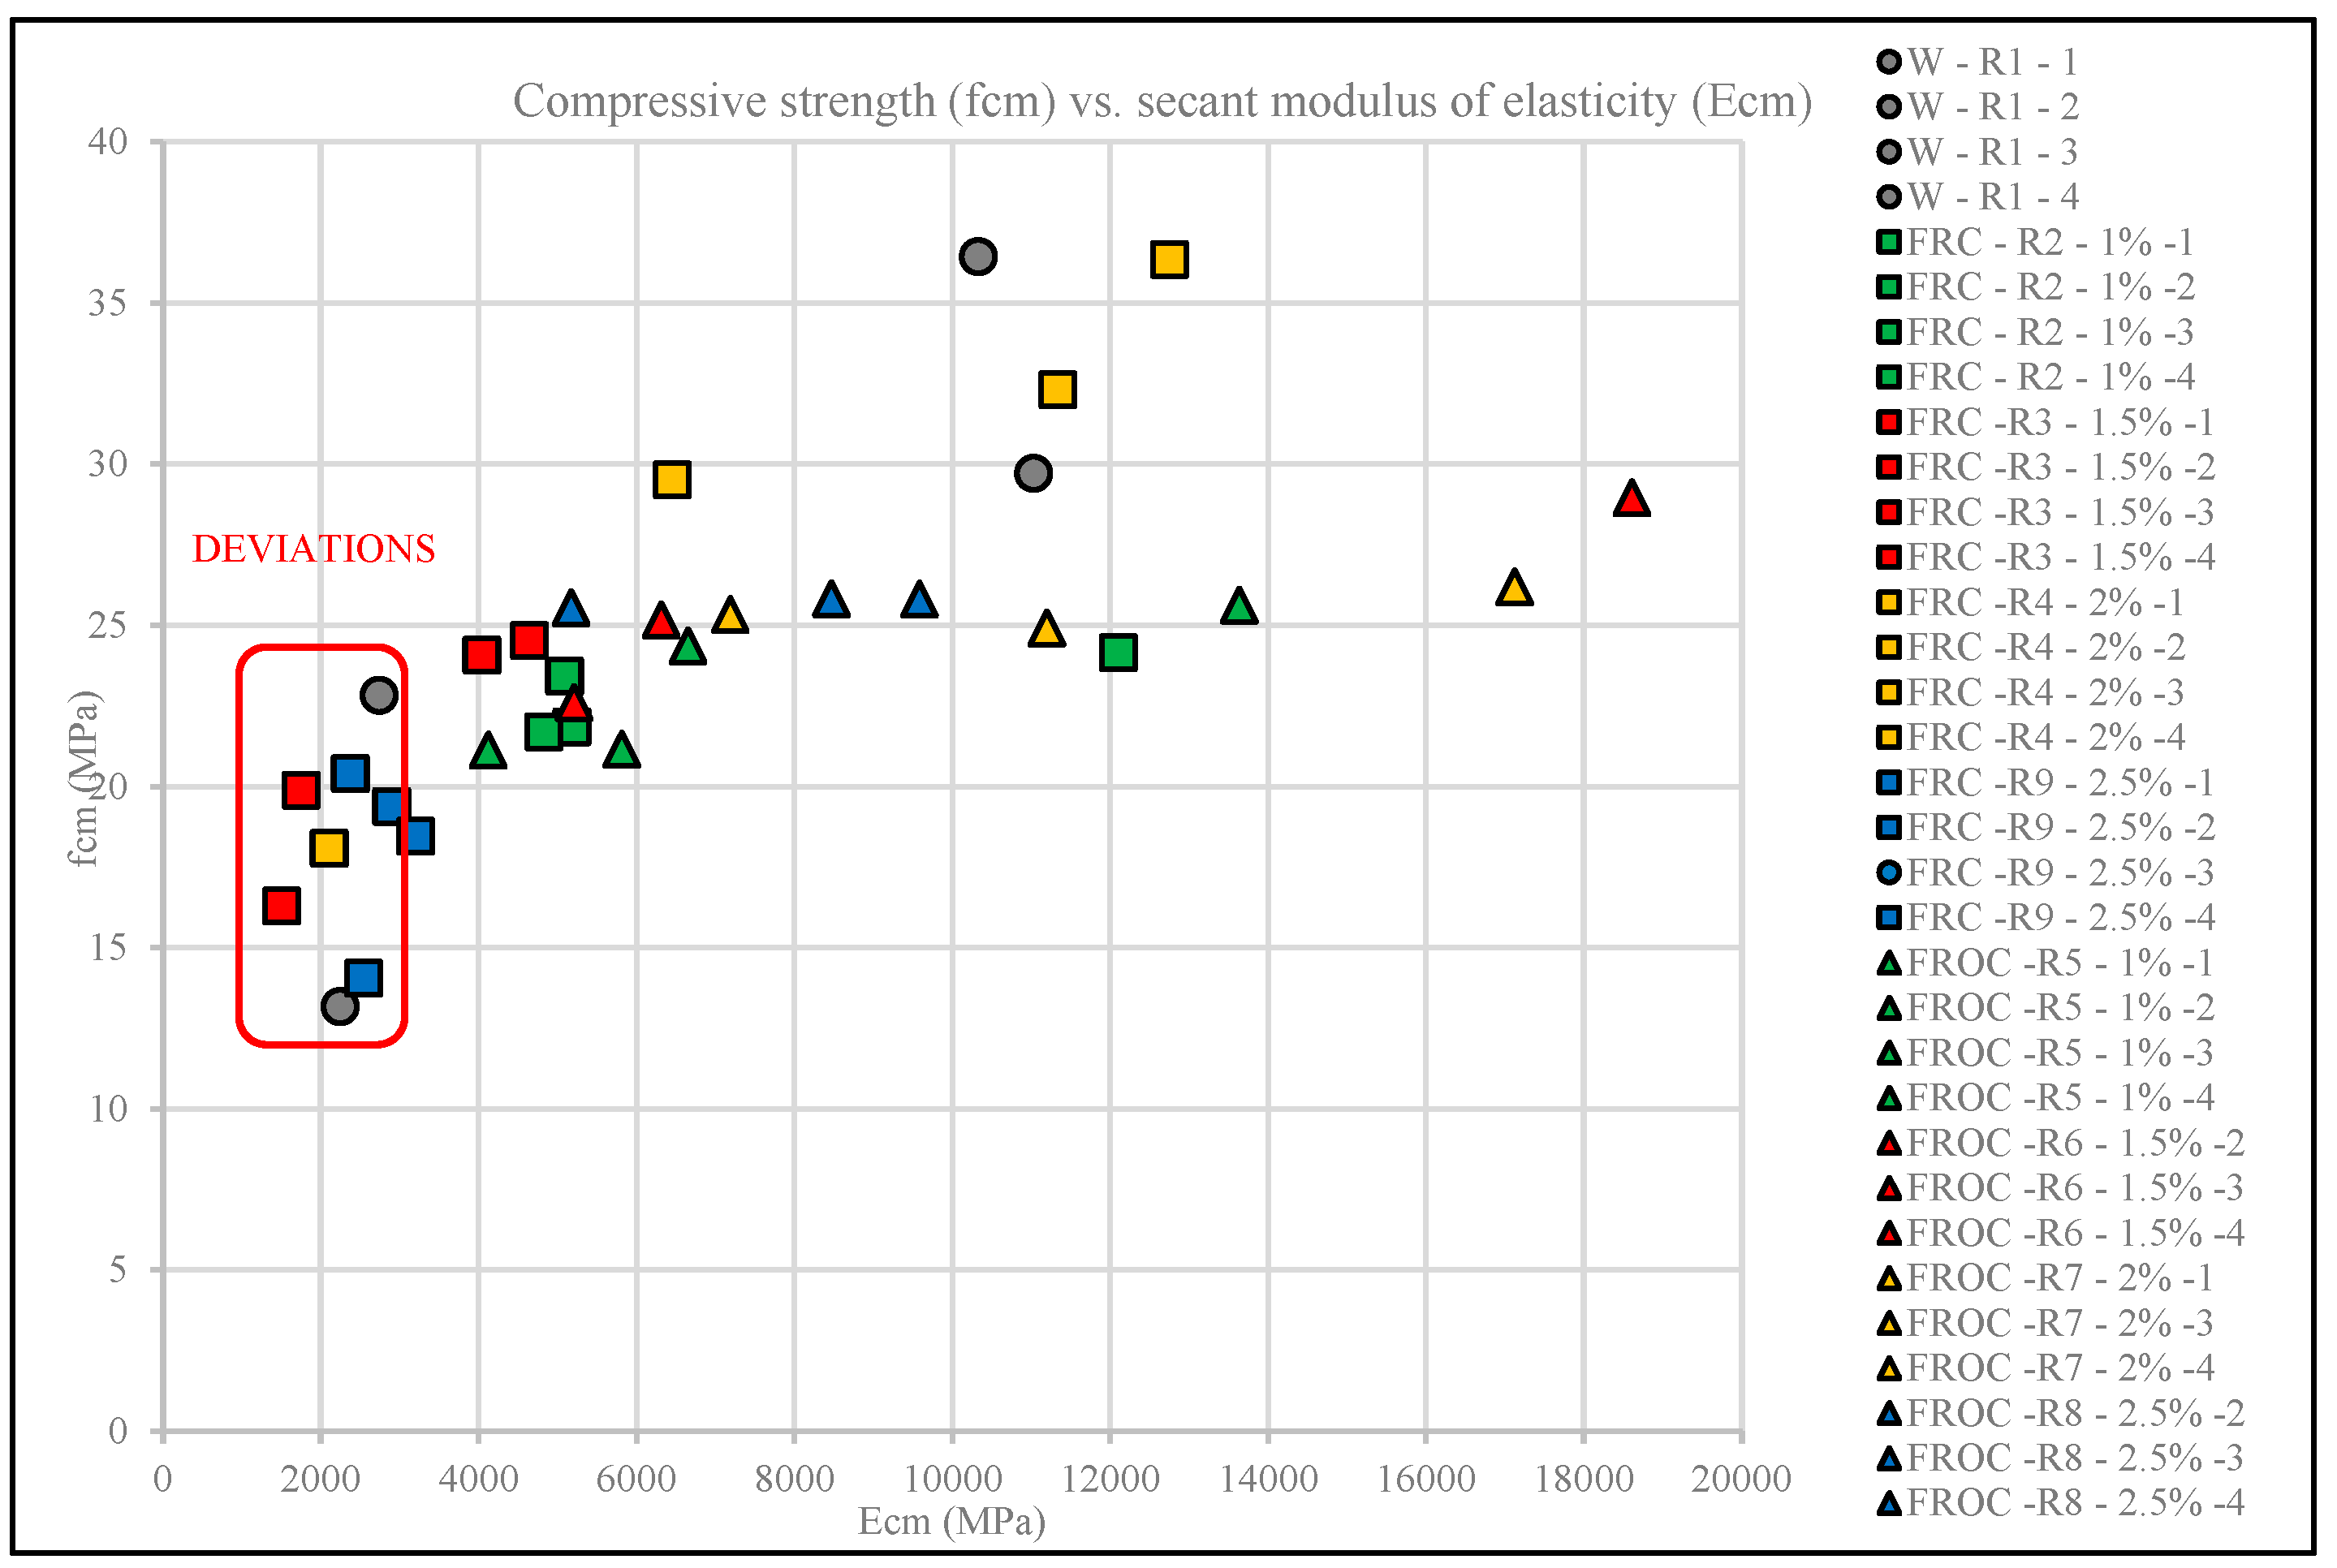
Figure 9.
Secant modulus of elasticity Ecm (MPa): experimental and design EC2 [38] values.
Figure 9.
Secant modulus of elasticity Ecm (MPa): experimental and design EC2 [38] values.
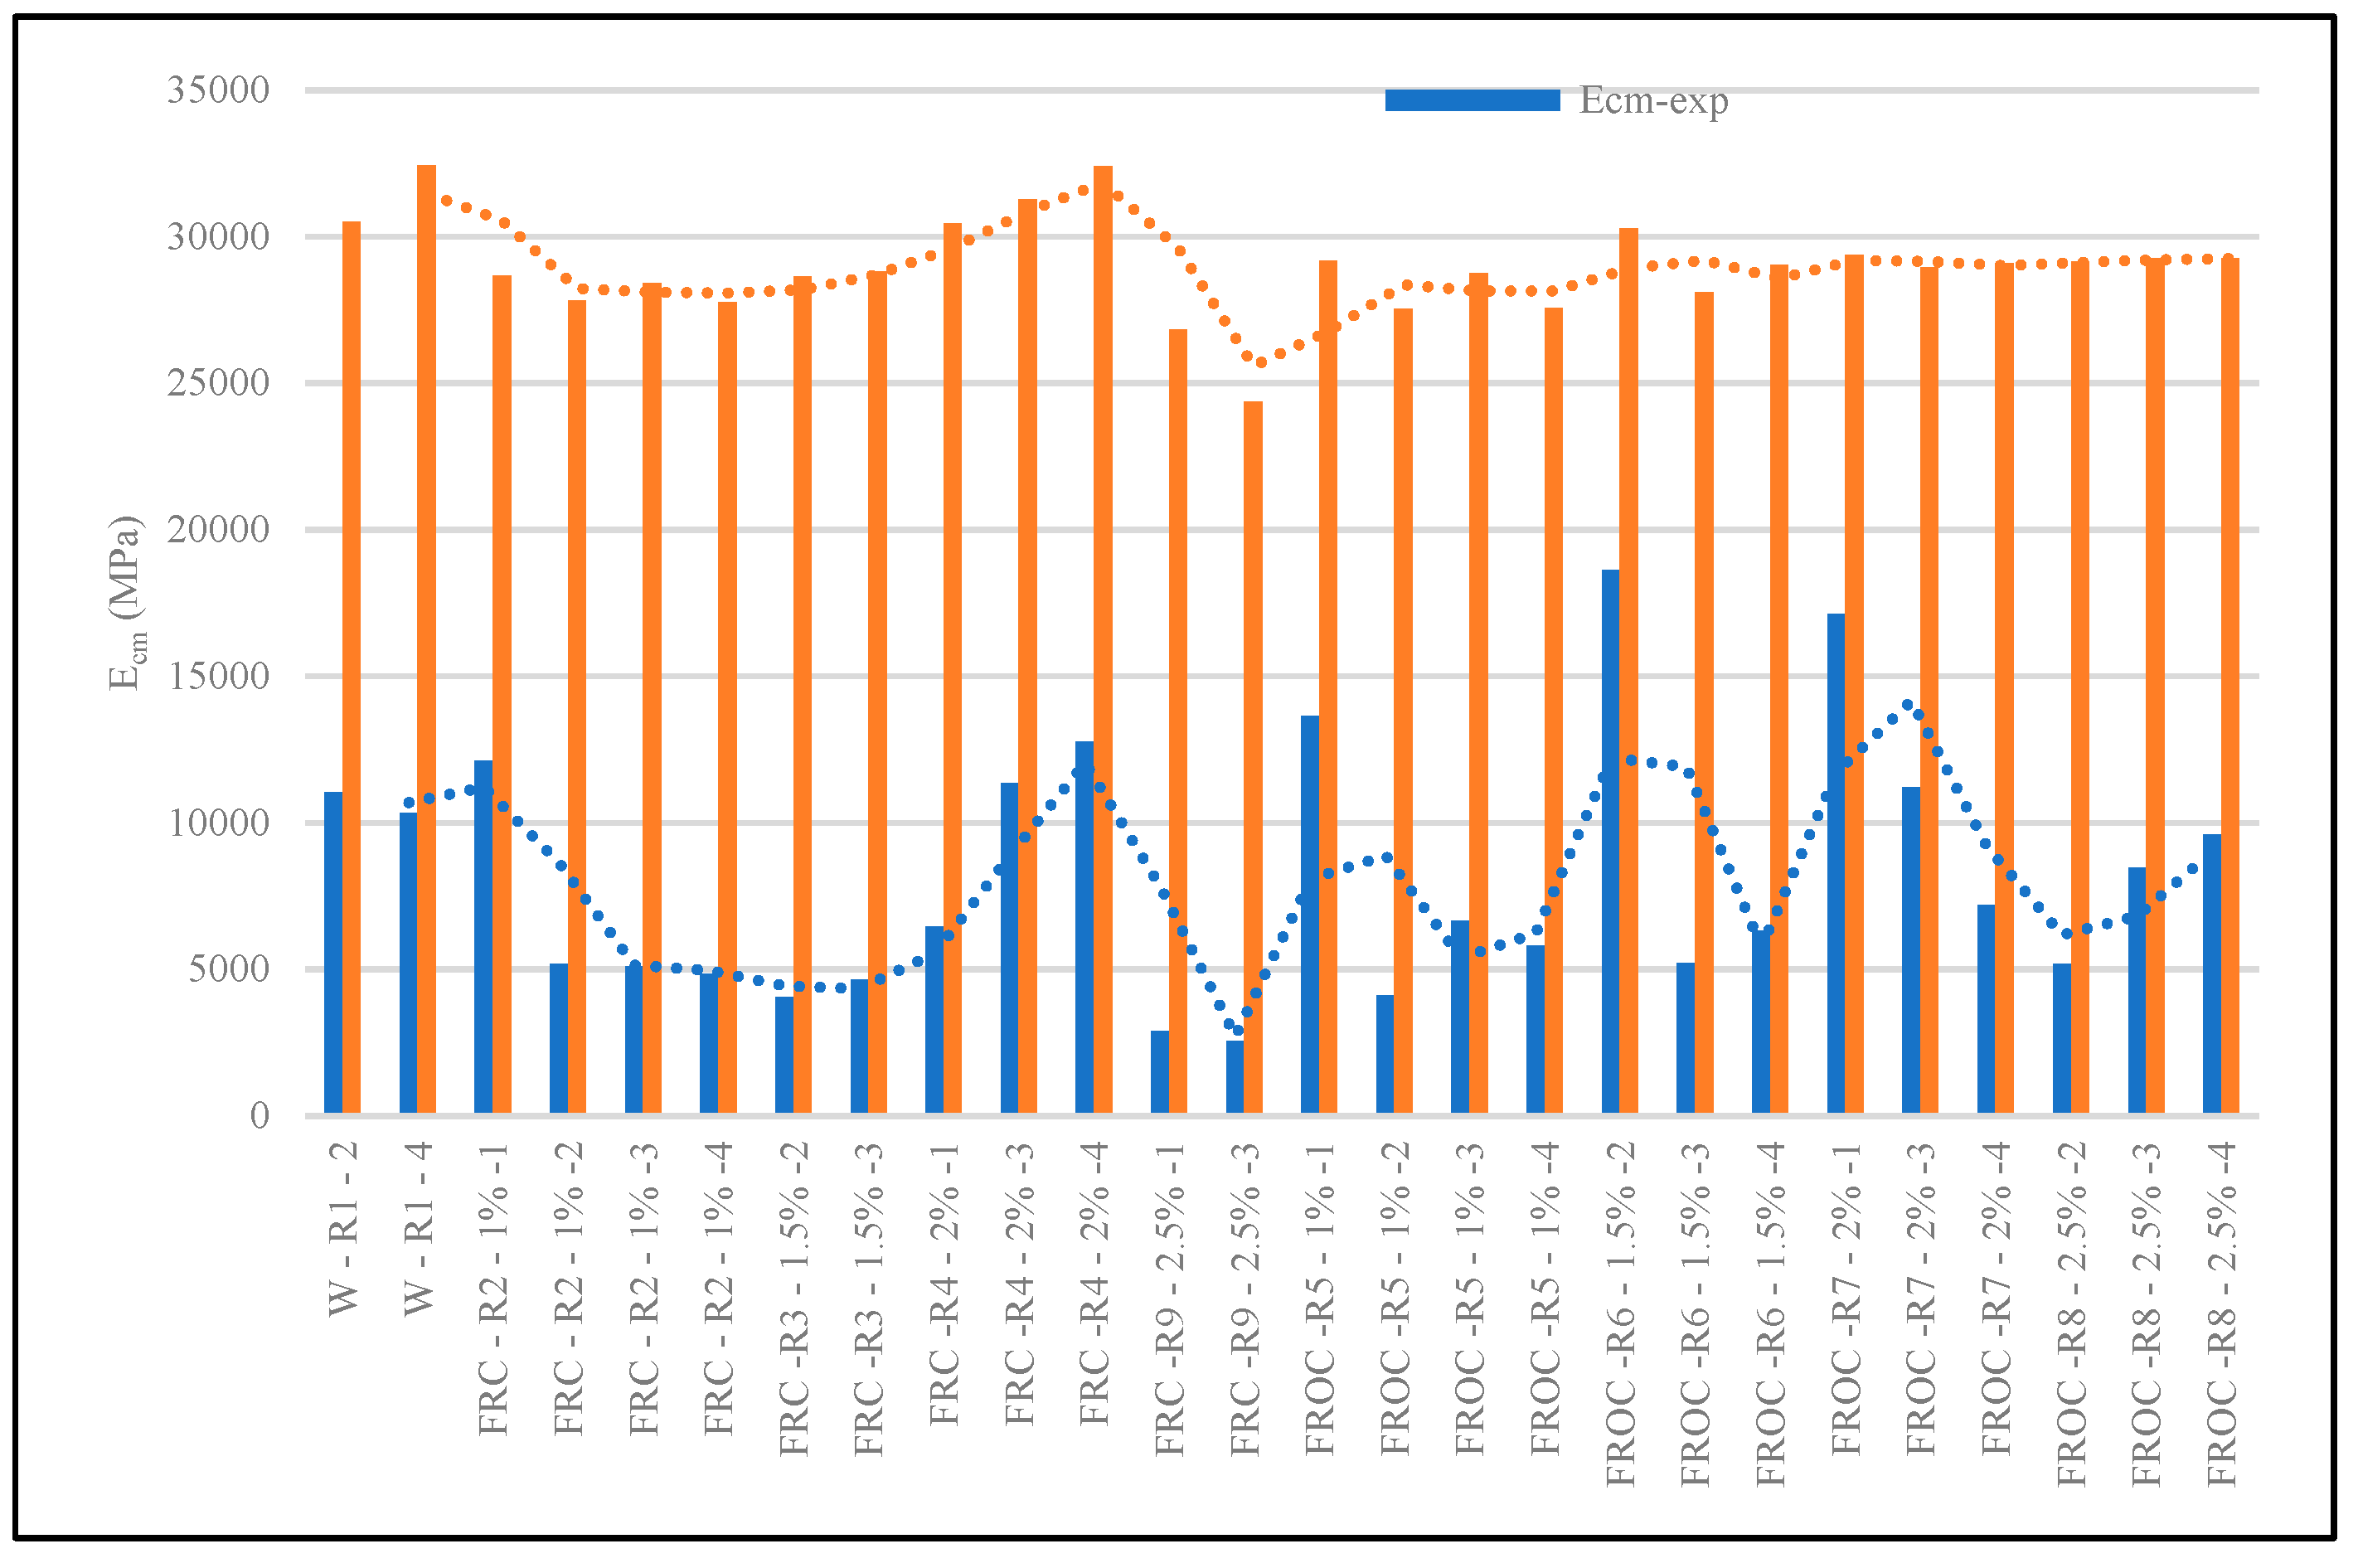
Figure 10.
(a) Flexural tensile strength vs. matrix density. (b) Flexural tensile strength of the experimental compositions – average values.
Figure 10.
(a) Flexural tensile strength vs. matrix density. (b) Flexural tensile strength of the experimental compositions – average values.
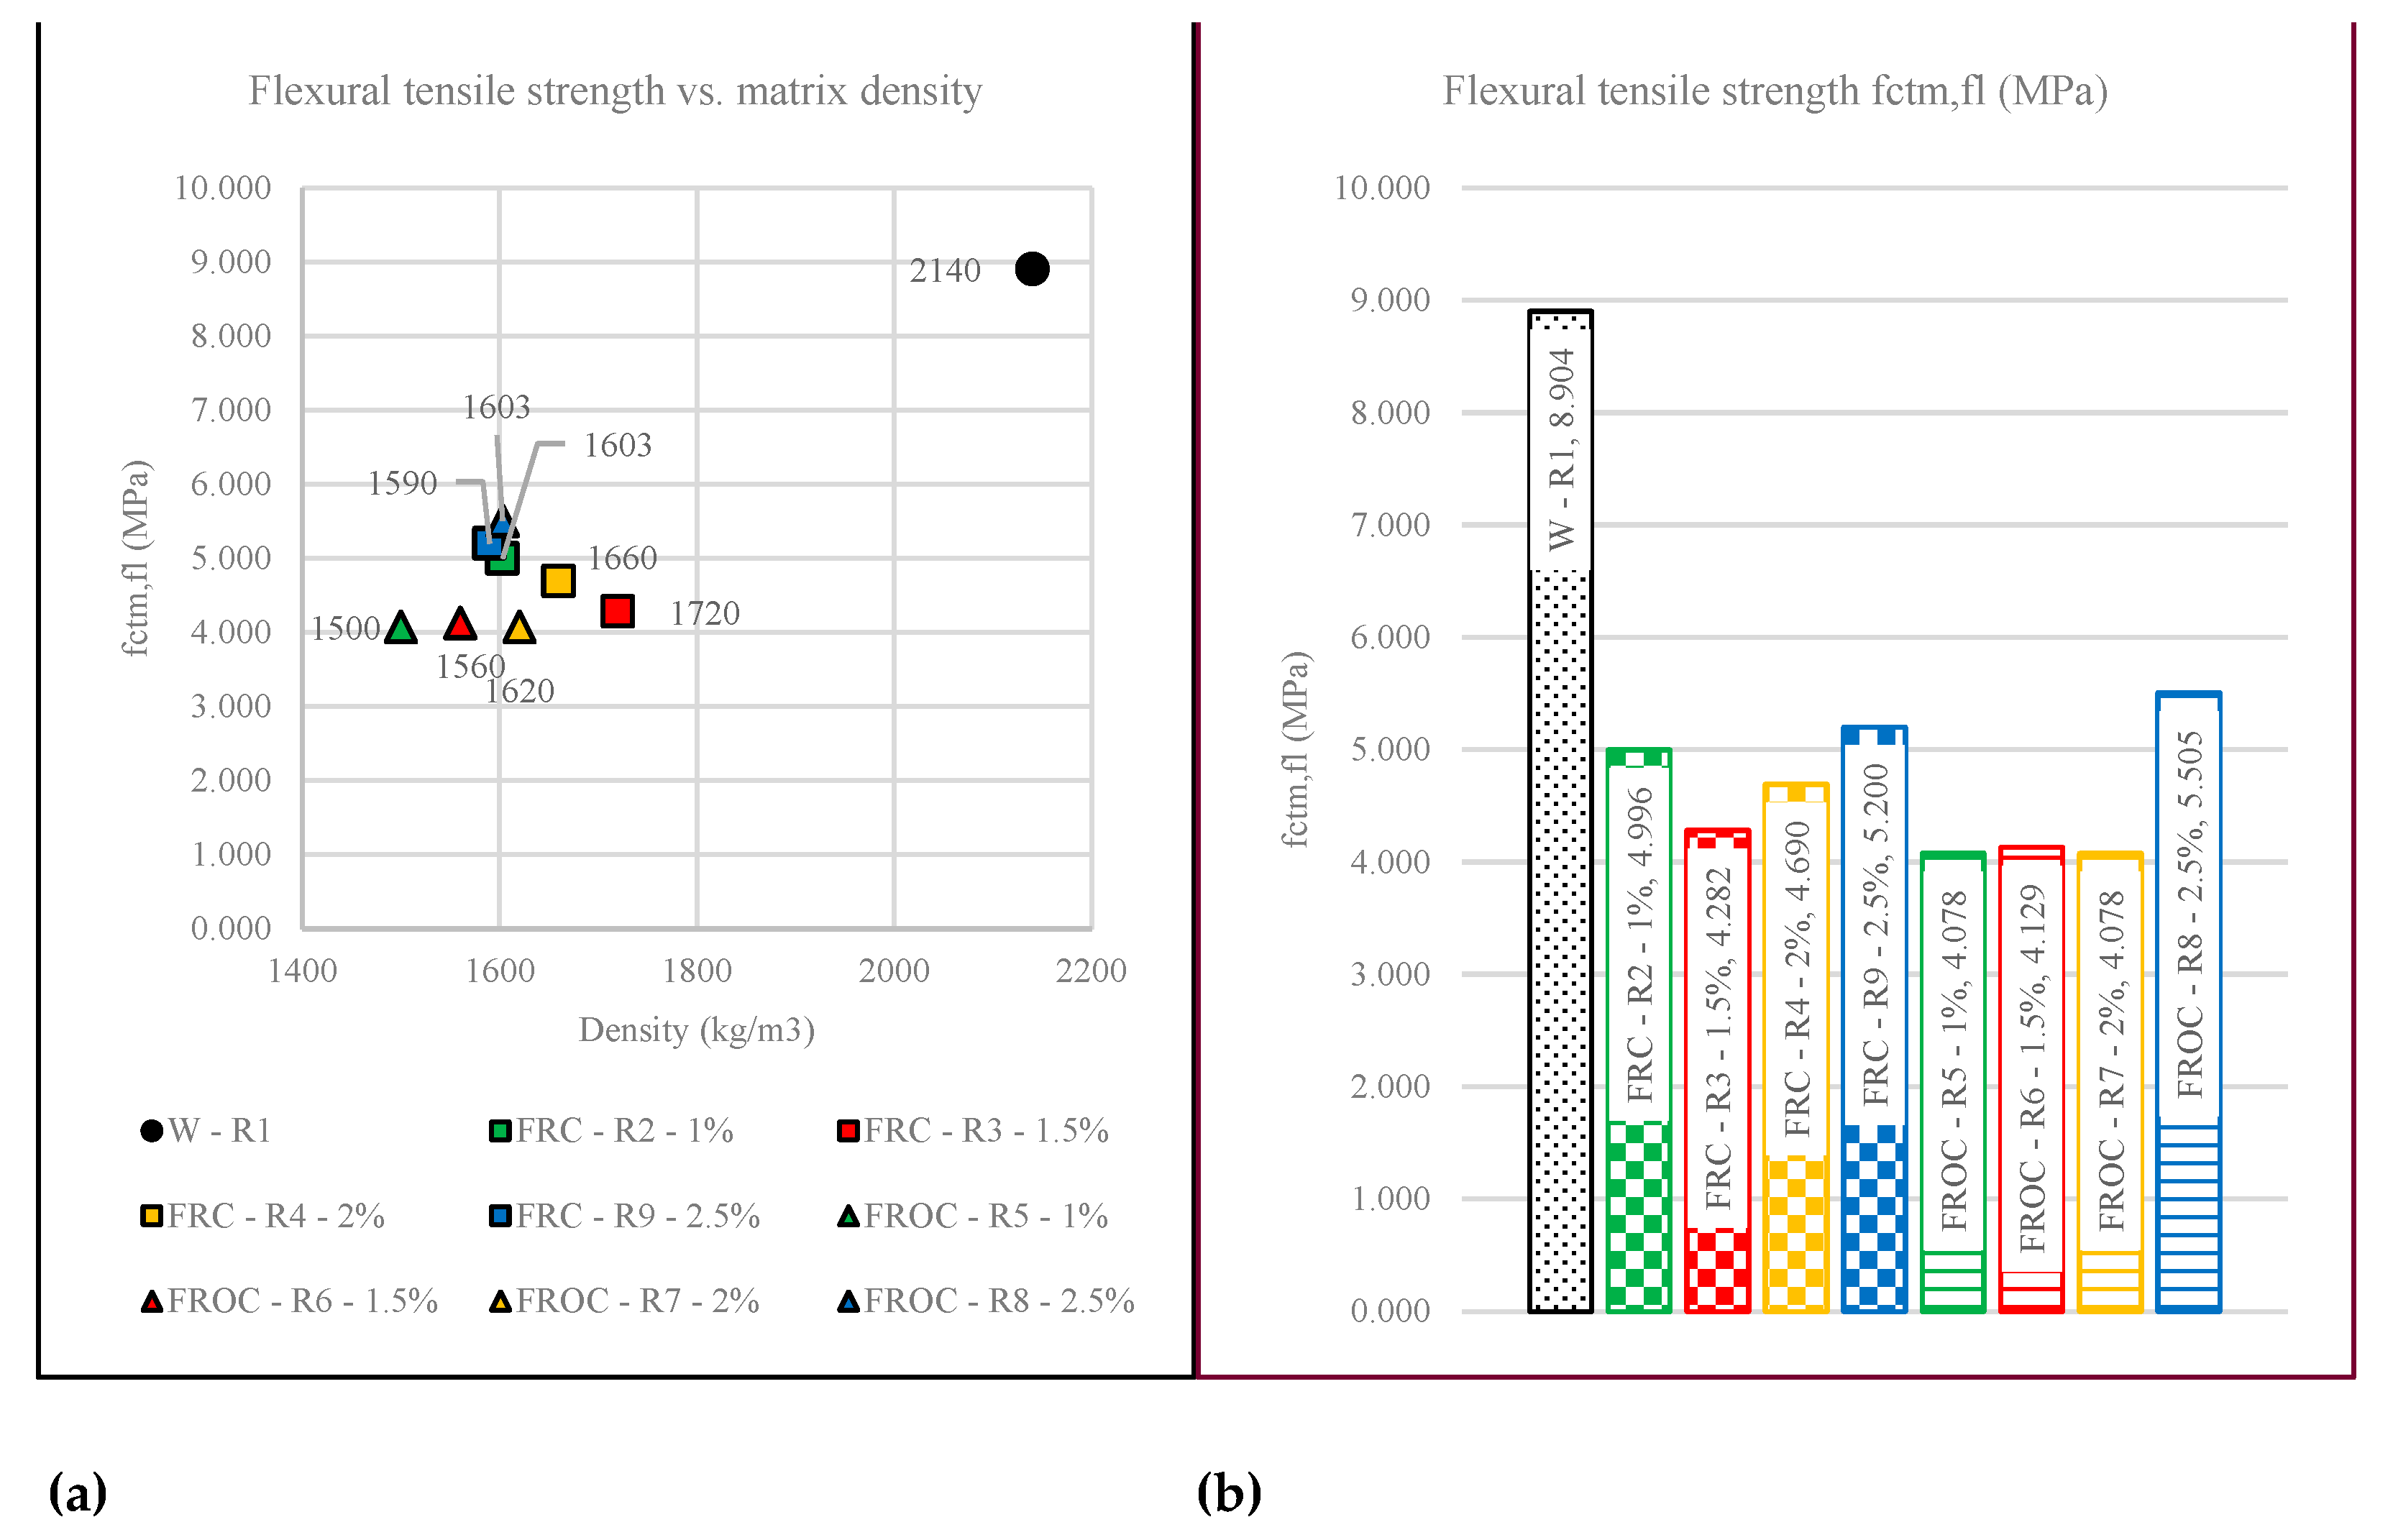
Figure 12.
Flexural tensile strength (fct,fl) vs. displacement (Δ).
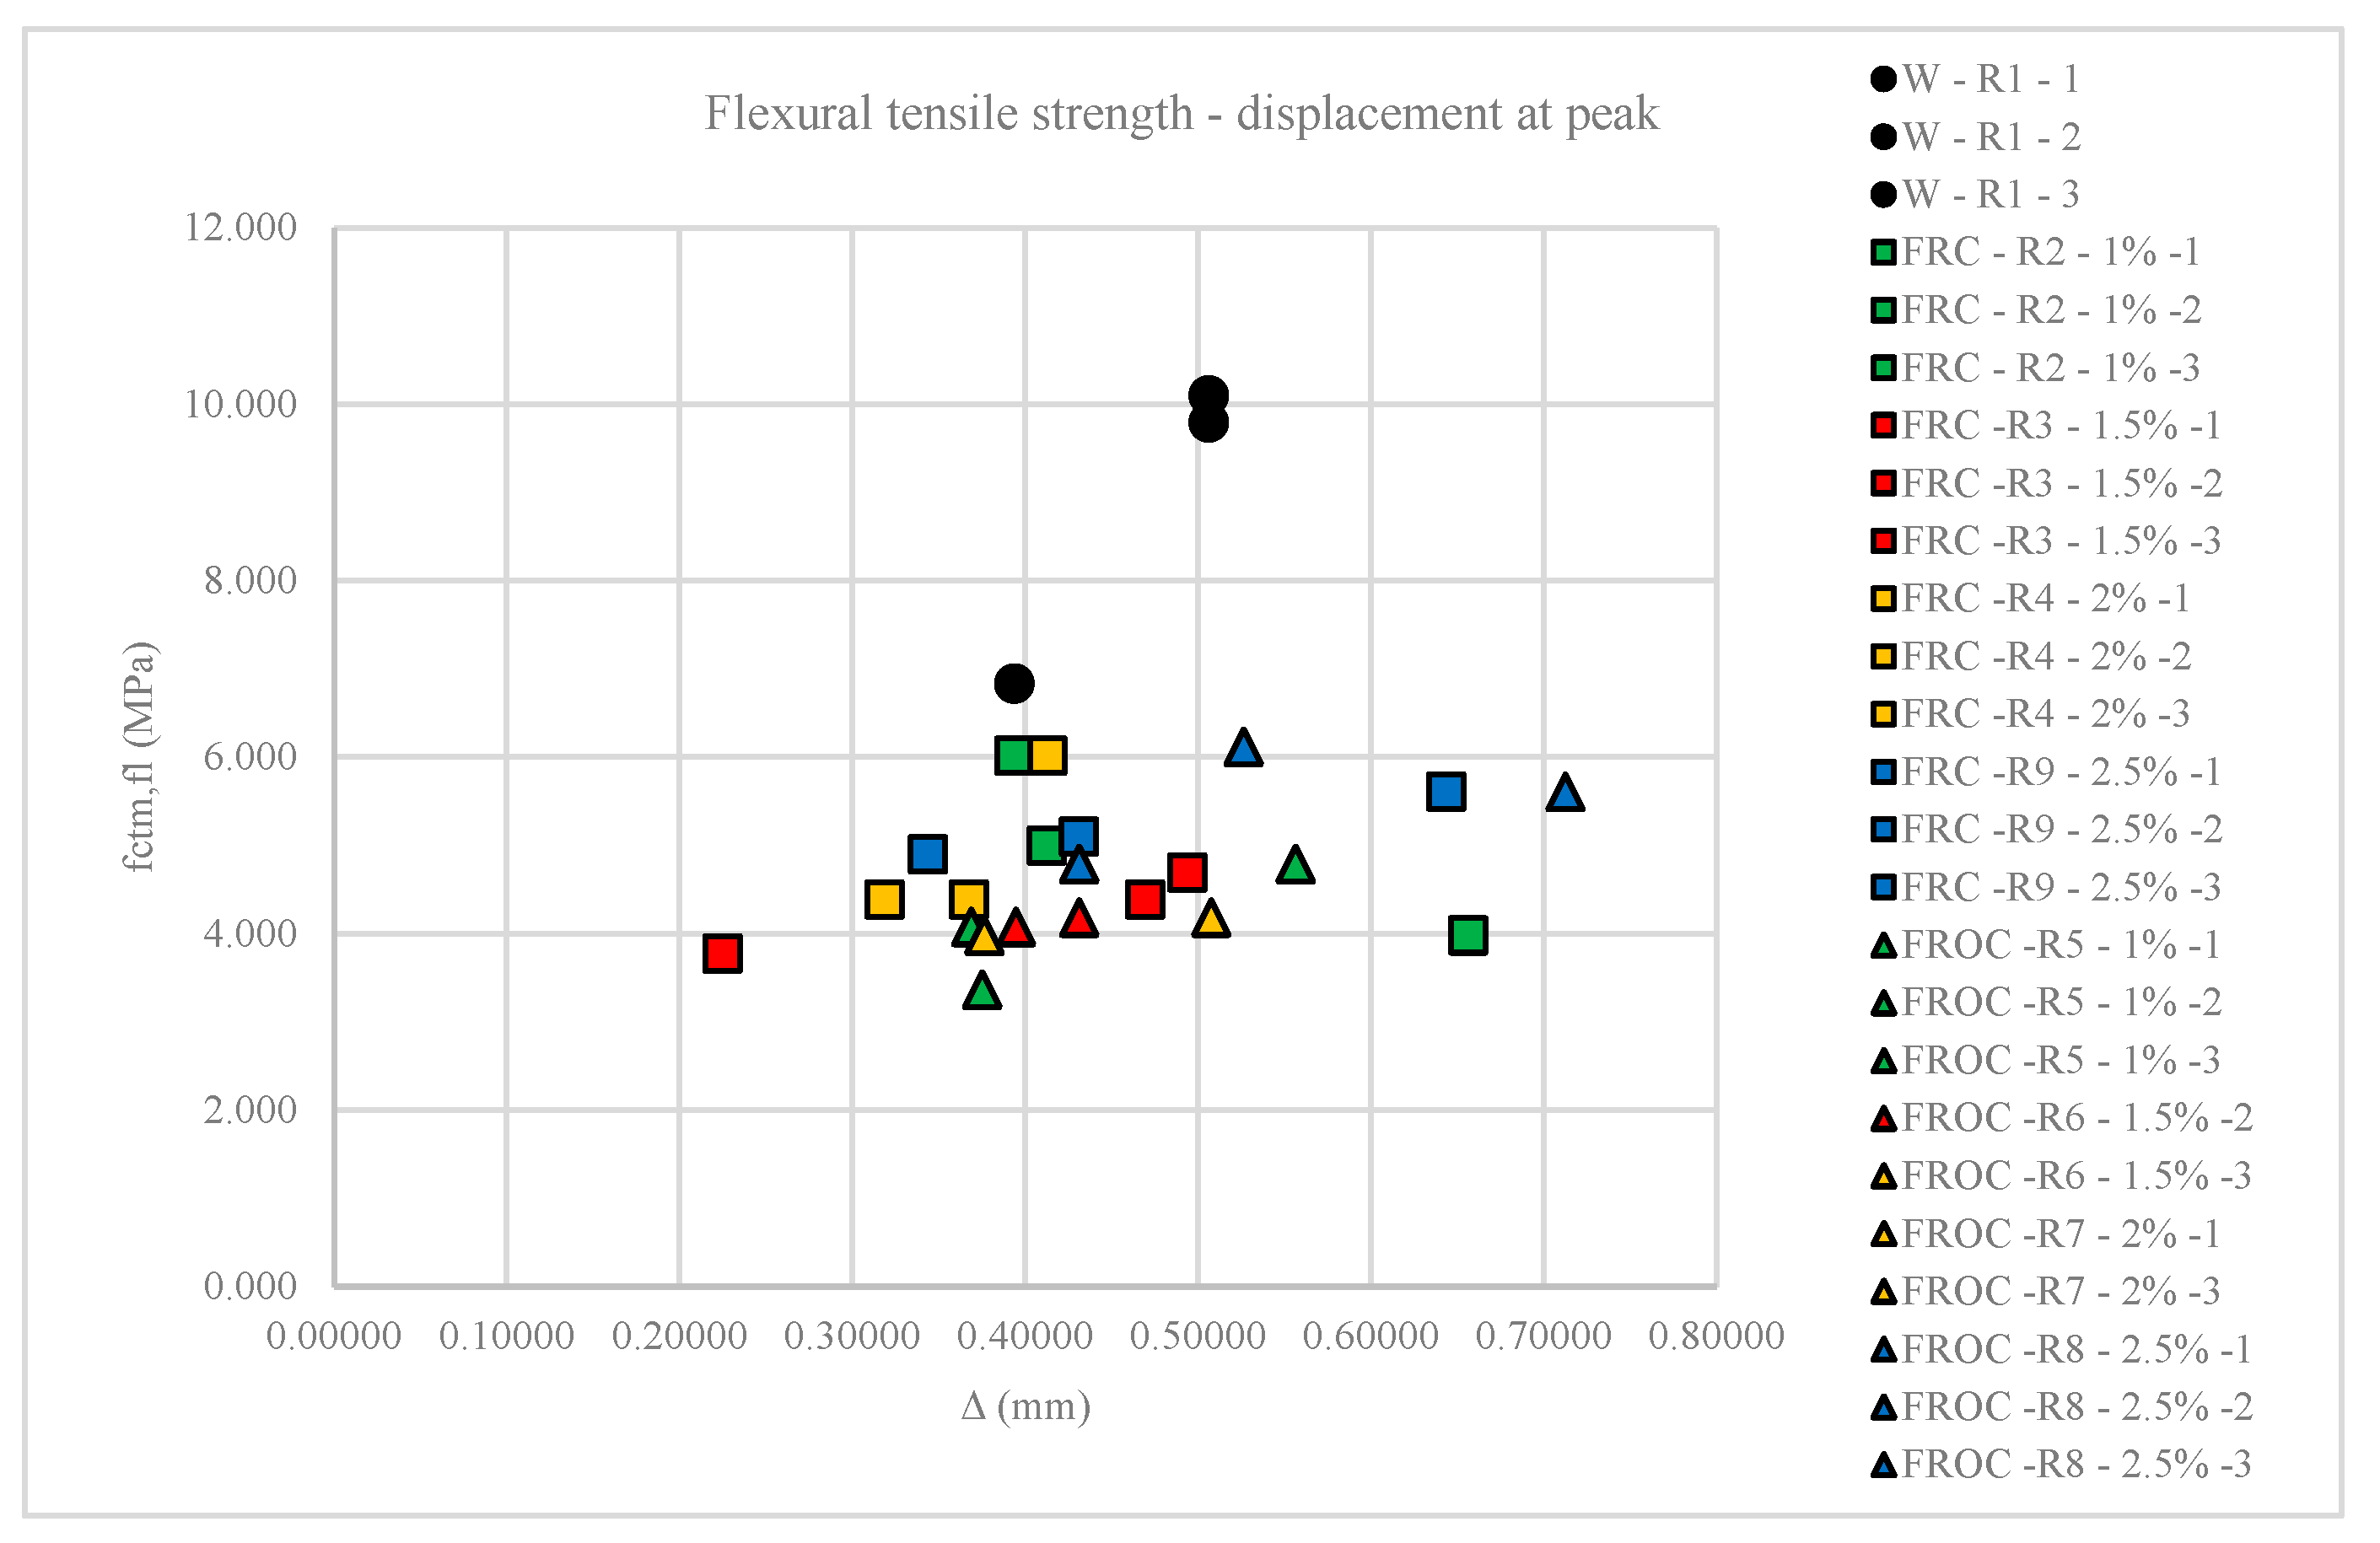
Figure 13.
Experimental displacement at peak Δ (mm).
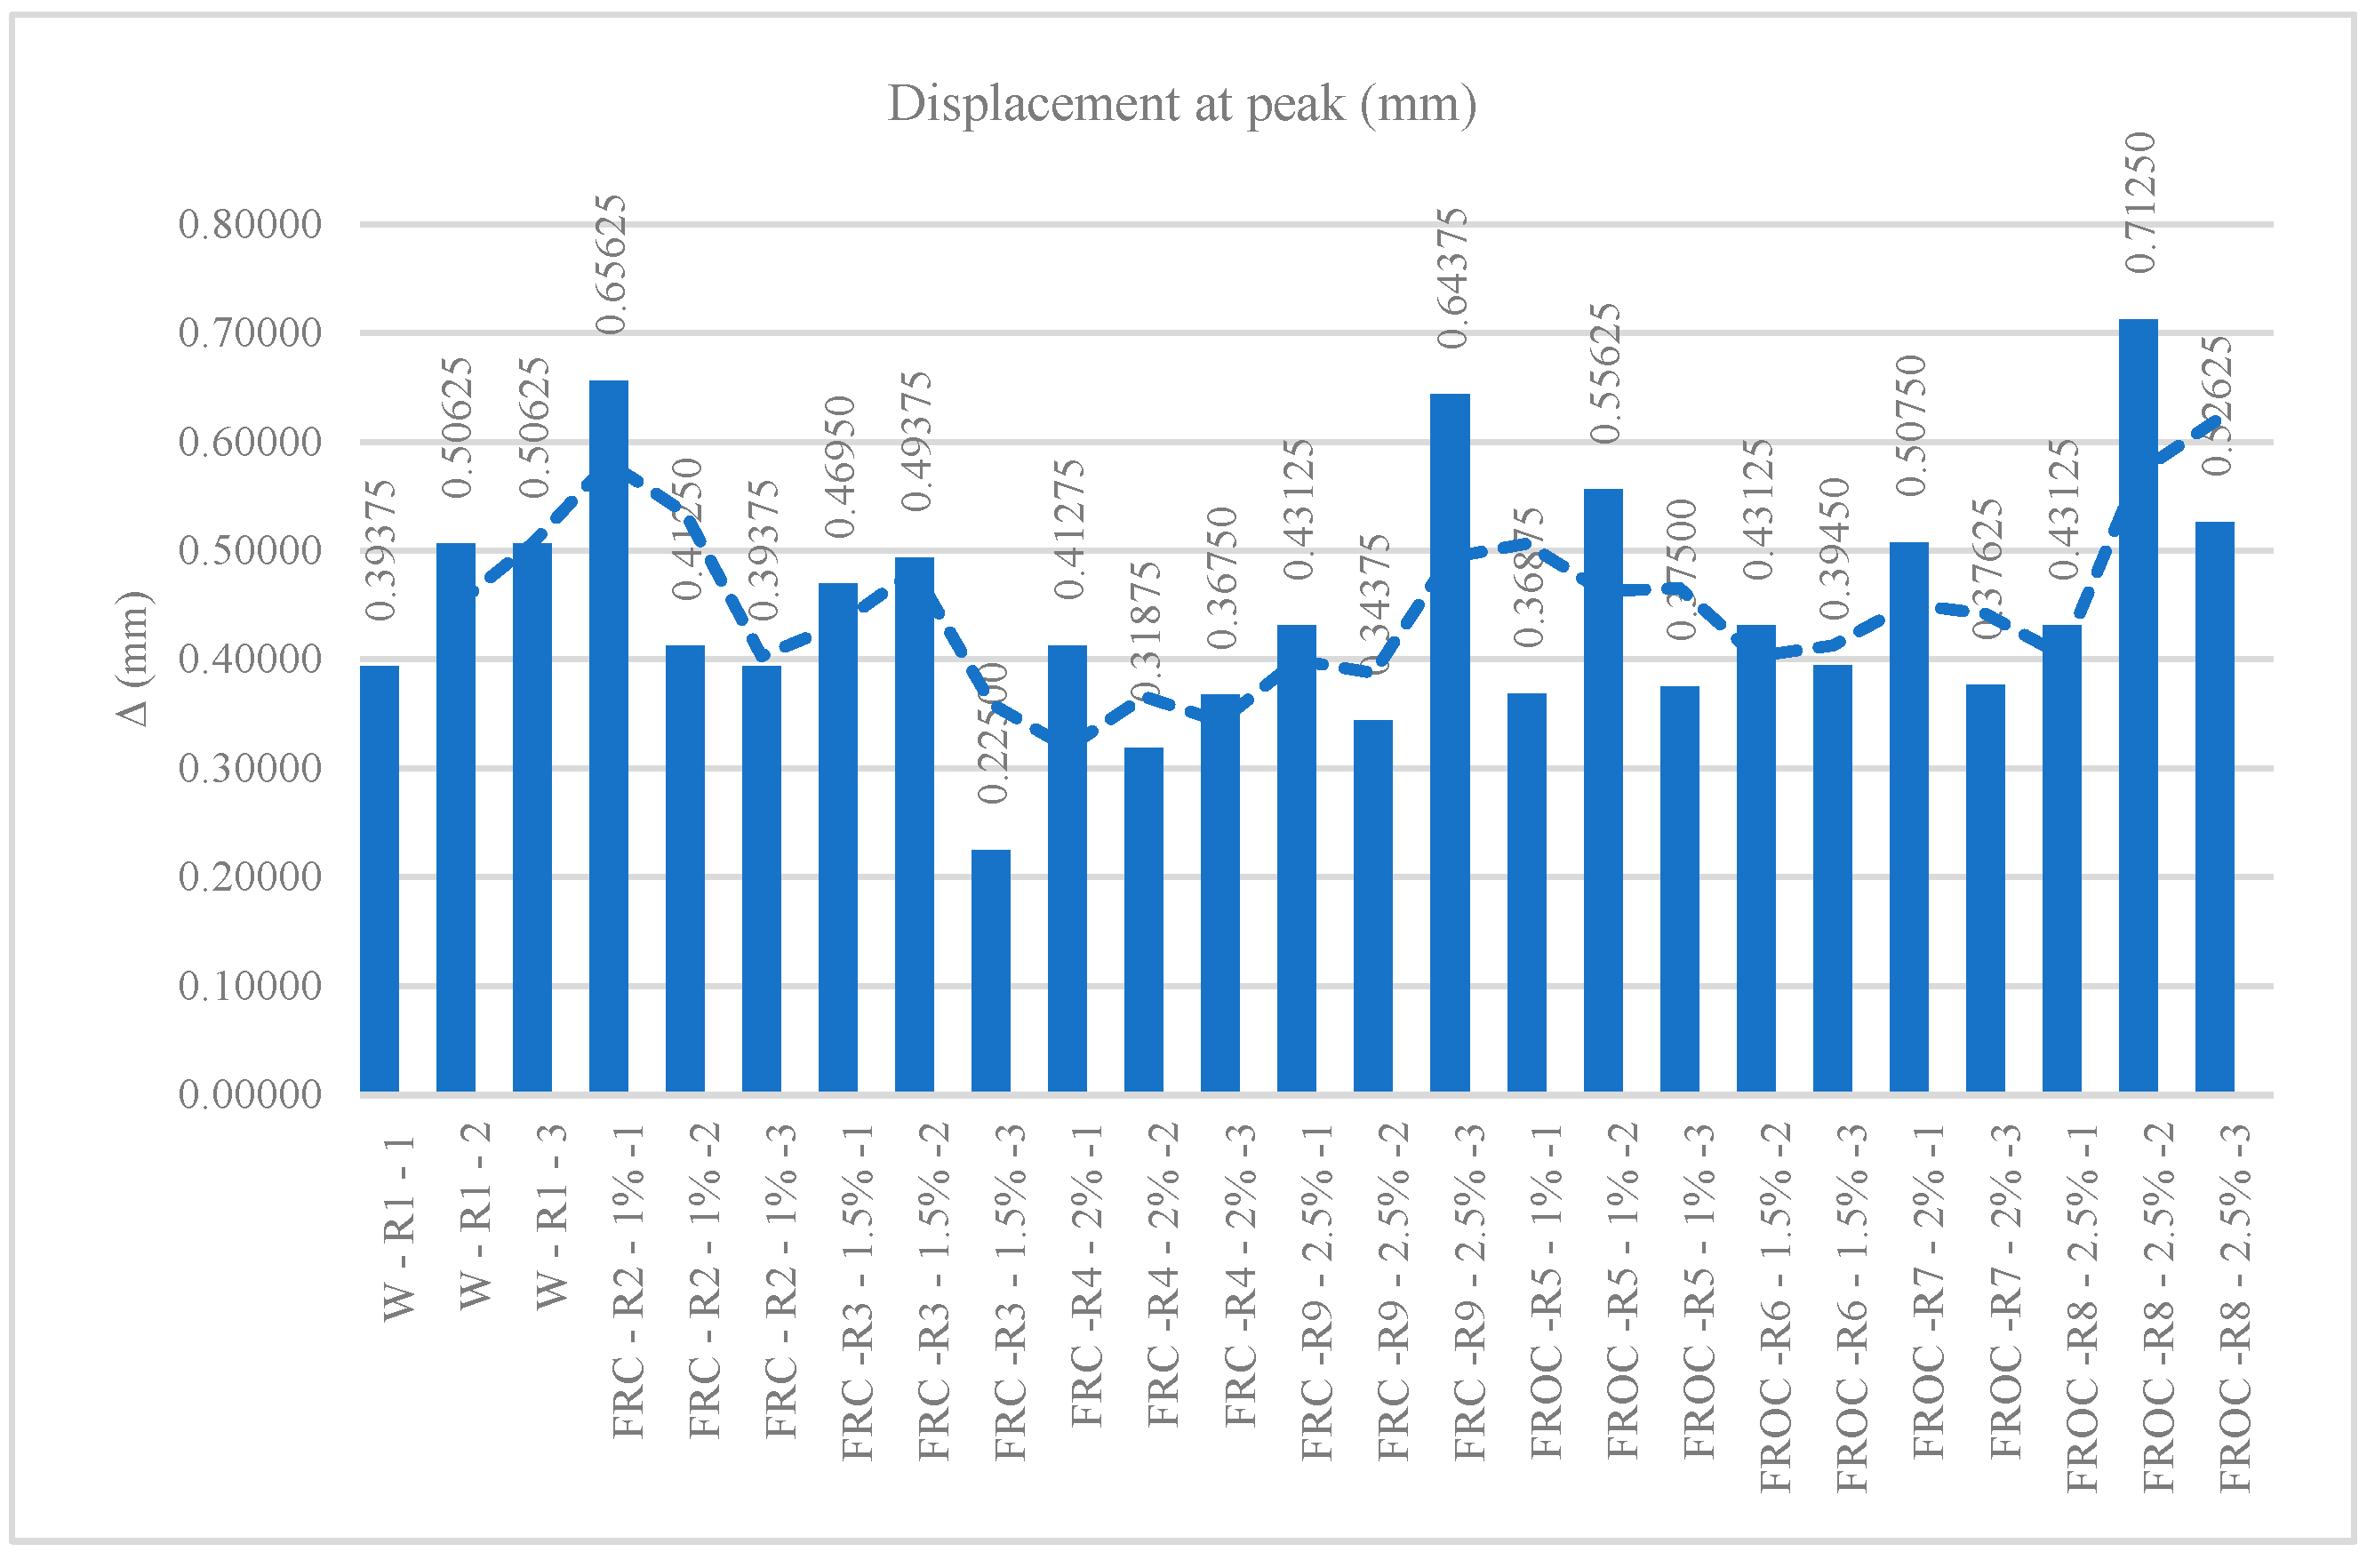
Figure 16.
Design diagrams for reinforced ordinary concrete and the hybrid reinforced FROC – 2.5% in bending in the ultimate limit state.
Figure 16.
Design diagrams for reinforced ordinary concrete and the hybrid reinforced FROC – 2.5% in bending in the ultimate limit state.
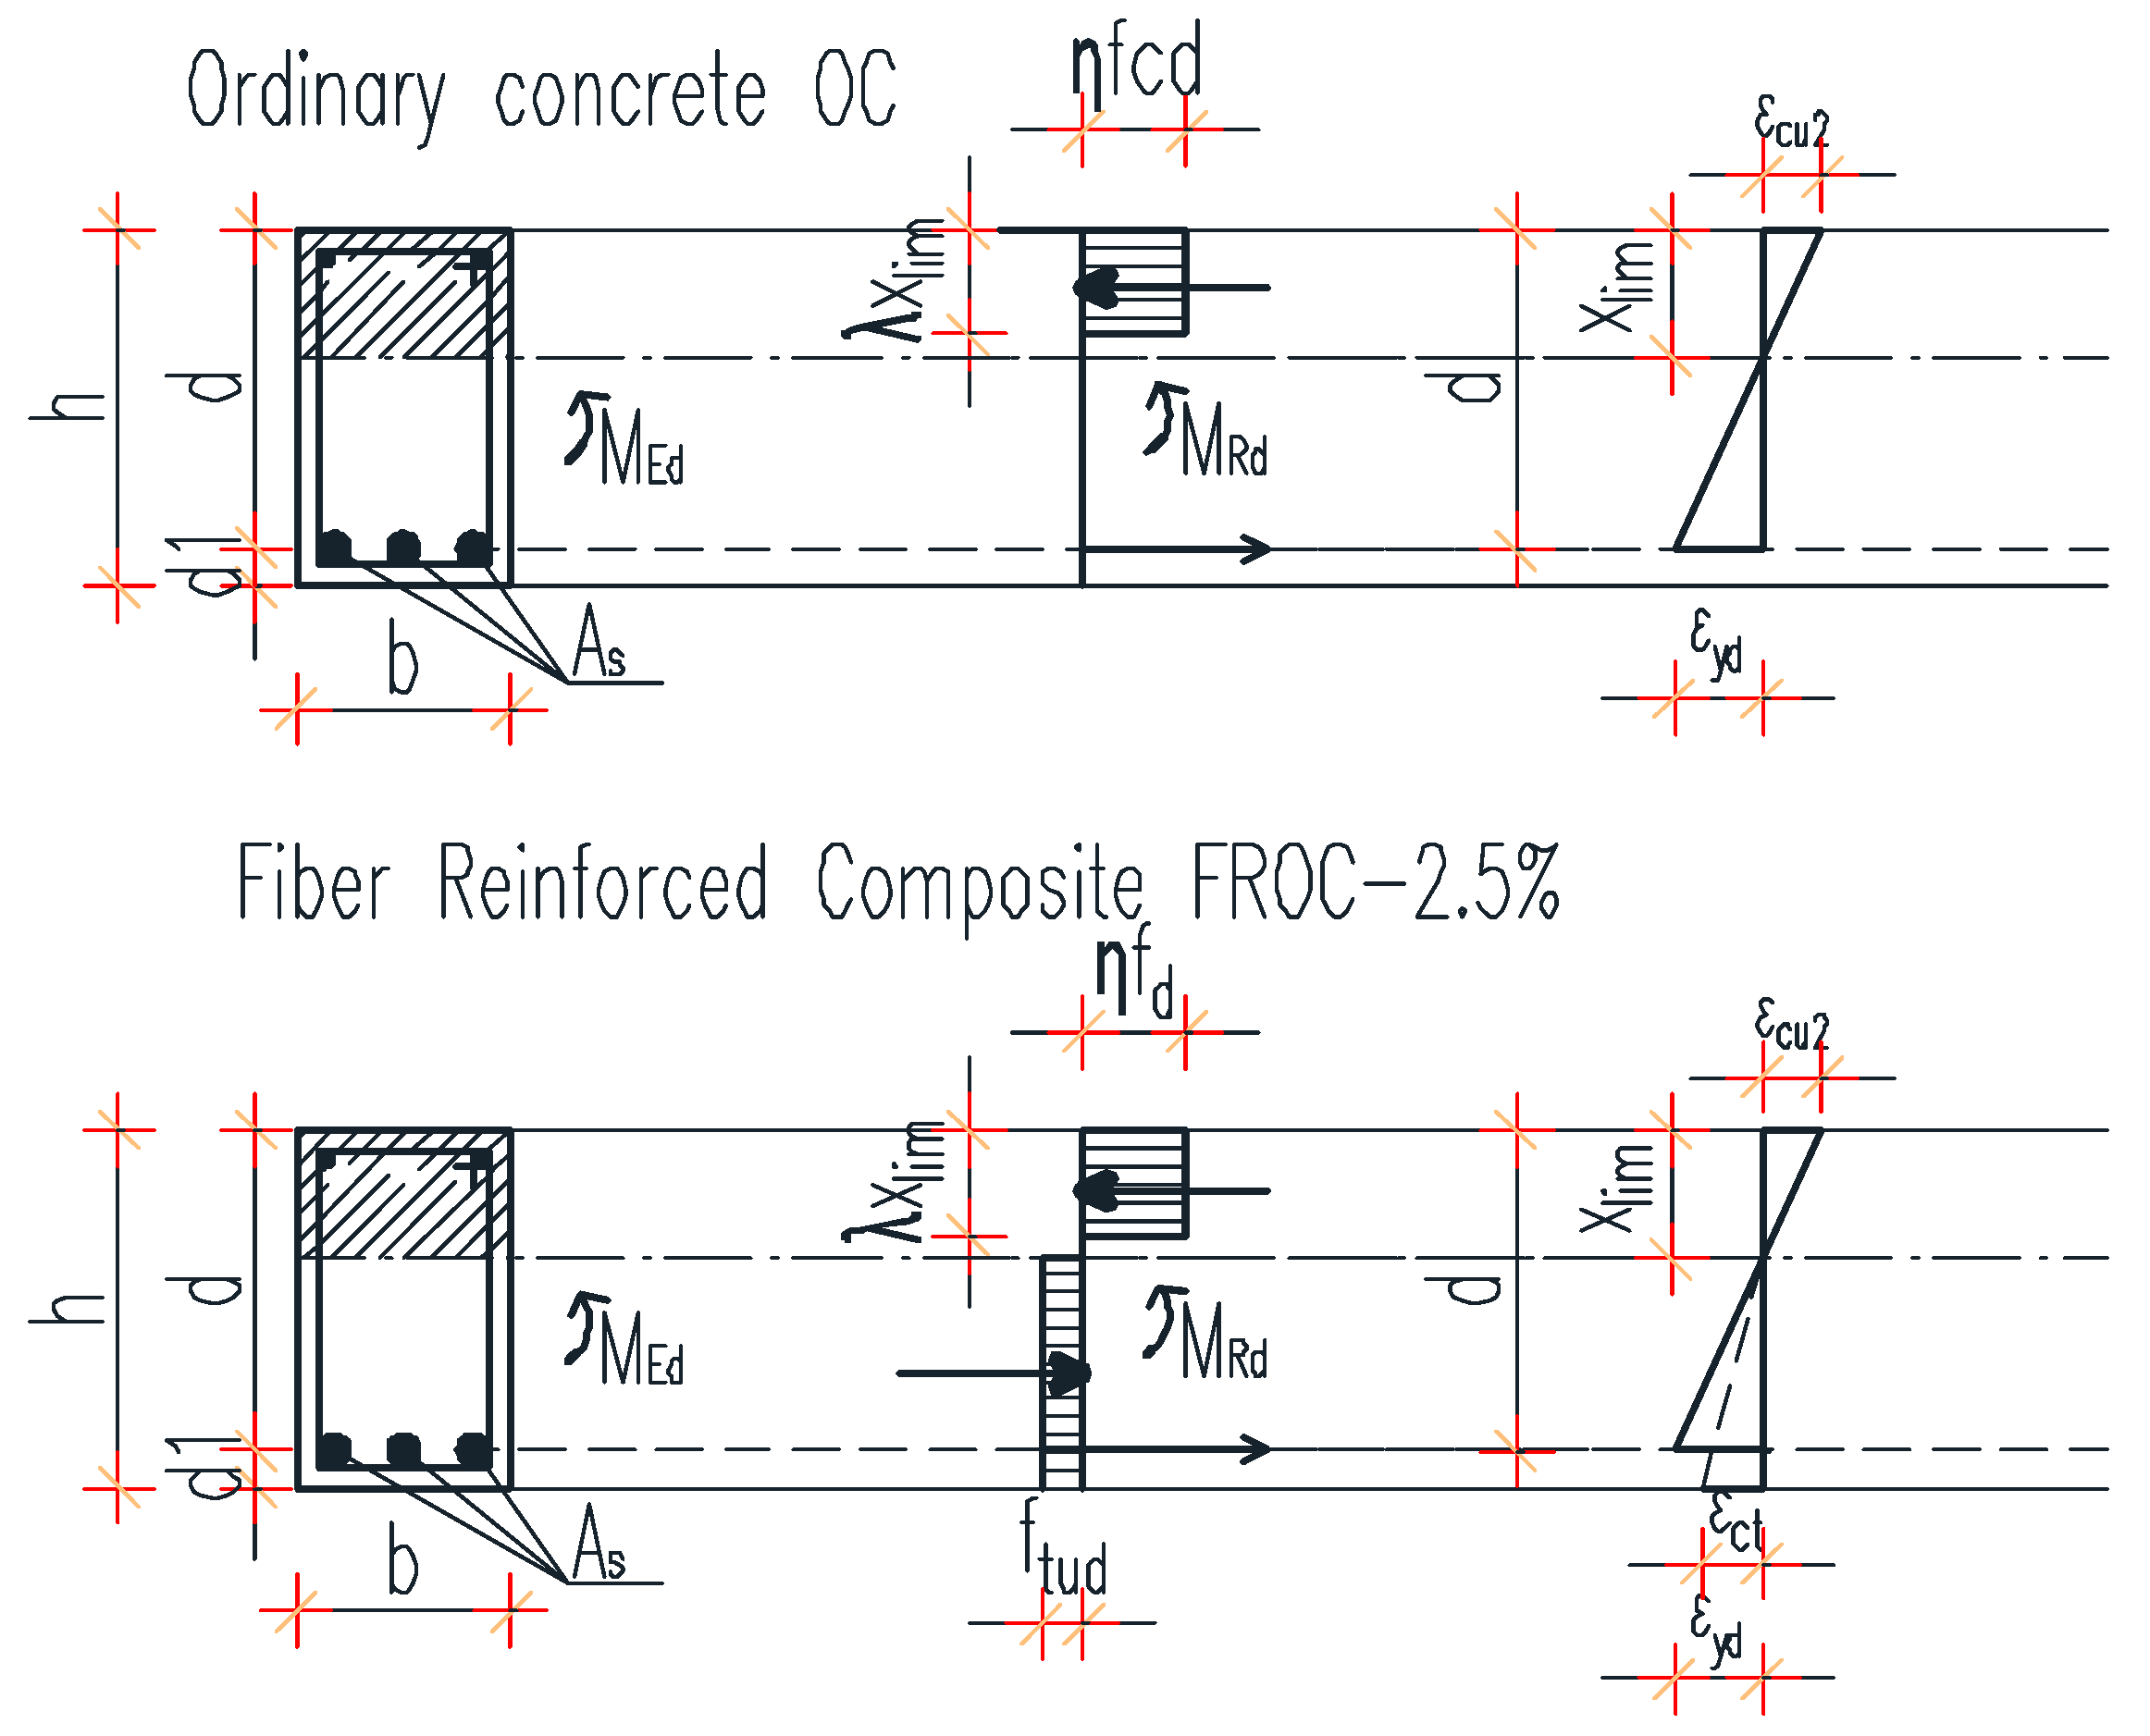

Table 1.
Experimental compositions-material components.
| Type | Sand aggregates | Uncoated fibers (FRC) | Oil coated fibers (FROC) | ||||||
|---|---|---|---|---|---|---|---|---|---|
| ID | W | FRC | FRC | FRC | FRC | FROC | FROC | FROC | FROC |
| R1 | R2 | R3 | R4 | R9 | R5 | R6 | R7 | R8 | |
| - | 1% | 1.5% | 2% | 2.5% | 1% | 1.5% | 2% | 2.5% | |
| Materials | kg/m3 | ||||||||
| Cement | 1 | 1 | 1 | 1 | 1 | 1 | 1 | 1 | 1 |
| Silica fume | 0.100 | 0.215 | 0.214 | 0.213 | 0.211 | 0.215 | 0.214 | 0.213 | 0.211 |
| Fly ash | 0.000 | 1.200 | 1.200 | 1.200 | 1.200 | 1.200 | 1.200 | 1.200 | 1.200 |
| PVA Fibers | 0.000 | 0.010 | 0.015 | 0.020 | 0.025 | 0.010 | 0.015 | 0.020 | 0.025 |
| Water | 0.500 | 0.550 | 0.550 | 0.550 | 0.550 | 0.550 | 0.550 | 0.550 | 0.550 |
| Superplasticizer | 0.010 | 0.012 | 0.012 | 0.012 | 0.012 | 0.012 | 0.012 | 0.012 | 0.012 |
| Sand 0.125-0.25 mm | 1.689 | 0.000 | 0.000 | 0.000 | 0.000 | 0.000 | 0.000 | 0.000 | 0.000 |
| (W+SP)/B | 0.46 | 0.23 | 0.23 | 0.23 | 0.23 | 0.23 | 0.23 | 0.23 | 0.23 |
Table 4.
Design characteristics according to fib 42 [37], Eurocode 2 [38], and fib 105 [41] in the ultimate limit state.
| Characteristics | Ordinary concrete OC | FROC – 2.5% |
|---|---|---|
| Bulk density (kg/m3) | 2350 | 1603 |
| Compressive strength fcm (MPa)1 1Equals the characteristic compressive strength fck after the age of 28 days |
25 | 25.74 |
| Compression limit strain εc1 (‰) | 2.2 | 2.94 |
| Ultimate compressive strain εcu1 (‰) | 3.5 | - |
| Secant modulus of elasticity Ecm (MPa) | 33000 | 7740 |
| Flexural tensile strength fctm,fl (MPa)2 2Equals max {(1.6 - h/1000)fctm; fctm}, whereas h is the height (mm) |
3.53 | 5.51 |
| Direct tensile strength fctm (MPa)3 3Equals max {(1.6 - h/1000)fctm; fctm}, whereas h is the height (mm) |
2.9 | 4.53 |
| Ultimate tensile strain εctu (‰) | 0.15 | - |
| Peak displacement Δ (mm) | - | 0.557 |
| Fracture energy GF (N/mm) | 0.18 | 0.299 |
| Design compression strength (MPa) 4OC: fcd = fck / γc Eurocode 2 [38] whereas γc = 1.5 - partial coefficient for ordinary concrete 5FRC: fcd = μ * (1 – α * β * V) fib 105 [39] whereas μ is the mean compression strength α = 0.8 - sensibility factor β = 3.8 – reliability index V = (standard deviation / μ) = 0.15 / 25.74 - coefficient of variation |
416.67 | 525.284 |
| Tensile steel characteristic yielding strength fyk (MPa) | 500 | |
| Tensile steel design yielding strength (MPa) fyd = fyk / γs whereas γs = 1.15 - partial coefficient for steel |
434.78 | |
| Design tensile strain (‰) εyd = fyd / Es whereas Es = 200 000 MPa - modulus of elasticity of steel |
2.17 | |
| Cross section b x h (mm) | 200 x 400 | |
| Concrete cover cnom (mm) | 30 | |
| Effective depth d (mm), considering a 20 mm diameter reinforcement | 350 | |
| Considered bending moment MEd (kNm) | 50 | |
| Compression zone (mm) |
215.9 | 201.2 |
| Reduced bending moment |
0.1225 | 0.0807 |
|
Whereas λ = 0.8 and η =1 for fck < 50 MPa |
0.3717 | 0.3541 |
| Mechanic reinforcement coefficient |
0.1311 | 0.0843 |
| Necessary area of reinforcement As = ω * b * d * fcd / fyd (mm2) |
351.62 | 343.02 |
| xlim FROC / xlim OC | 1.07 | |
| As FROC / As OC | 1.02 | |
Disclaimer/Publisher’s Note: The statements, opinions and data contained in all publications are solely those of the individual author(s) and contributor(s) and not of MDPI and/or the editor(s). MDPI and/or the editor(s) disclaim responsibility for any injury to people or property resulting from any ideas, methods, instructions or products referred to in the content. |
© 2025 by the authors. Licensee MDPI, Basel, Switzerland. This article is an open access article distributed under the terms and conditions of the Creative Commons Attribution (CC BY) license (http://creativecommons.org/licenses/by/4.0/).
Copyright: This open access article is published under a Creative Commons CC BY 4.0 license, which permit the free download, distribution, and reuse, provided that the author and preprint are cited in any reuse.


