
Submitted:
02 April 2025
Posted:
03 April 2025
You are already at the latest version
Abstract
This study introduces a novel Recency, Monetary, and Duration (RMD) model for customer classification in the hospitality industry. Using a hybrid approach that integrates data mining with multi-criteria decision-making techniques, the study aims to identify valuable customer segments and optimize marketing strategies.The research applies the K-means clustering algorithm to classify customers from a hotel in Iran based on RMD attributes. Cluster validation is performed using three internal indices, and hidden patterns are extracted through association rule mining. Customer segments are prioritized using the TOPSIS (Technique for Order of Preference by Similarity to Ideal Solution) method and Customer Lifetime Value (CLV) analysis. The outcomes revealed six distinct customer clusters identified as New customers; Loyal customers; Collective Buying Customers; Potential customers; Business customers and Lost customers. This study helps hotels to know different types of customers with spending patterns which enable hotels to tailor services and improve customer retention and provides managers appropriate tools to allocate resources efficiently. This study extends the traditional Recency, Frequency, and Monetary (RFM) model by incorporating Duration, an overlooked dimension of customer engagement. It is the first attempt to integrate data mining and multi-criteria decision-making for customer segmentation in Iran’s hospitality industry.
Keywords:
Hospitality Marketing
; Customer Retention
; RMD
; TOPSIS
; Association Rules
; K-means
; CLV
1. Introduction
The hospitality industry has become an increasingly competitive sector in the global economy. Fluctuating global hotel occupancy rates, driven by economic shifts and evolving consumer preferences, underscore the strategic importance of customer retention. Hotels generate vast amounts of customer data, yet many struggle to leverage this information for targeted marketing and service personalization. The demand for enhanced customer experience has led to a surge in the use of Customer Relationship Management (CRM) systems that store vast amounts of customer data [1]. However, simply collecting data is insufficient; the ability to extract actionable insights from these datasets is crucial. Data mining techniques have gained traction as they allow businesses to uncover hidden patterns in large datasets, enabling managers to make more informed strategic decisions [2]. Customer segmentation is an essential aspect of marketing planning, allowing businesses to target specific customer groups with tailored strategies. Traditional segmentation methods, such as Recency, Frequency, and Monetary (RFM) analysis, have been widely applied in various industries, including retail, banking, and hospitality [3]. However, these models have limitations, particularly in their ability to capture a customer’s overall engagement beyond purchase behavior [4]. While prior research has applied RFM in hospitality, existing studies often overlook engagement duration (D), an essential factor in customer value assessment. In the hospitality industry, a guest’s length of stay is a crucial determinant of their overall contribution to revenue and customer lifetime value. Unlike industries where transaction frequency is the primary measure of engagement (e.g., retail and banking), the duration of a guest’s visit influences pricing strategies, occupancy management, and service personalization [1,5]. Consequently, integrating “Duration” into customer segmentation provides a more holistic view of customer value. Few studies integrate clustering with multi-criteria decision-making to optimize segmentation strategies. This study addresses these gaps by introducing an RMD-based customer segmentation framework that enhances marketing decision-making. This study extends the conventional RFM model by introducing Recency, Monetary, and Duration (RMD) to better capture customer behaviors in the hospitality industry. The Duration attribute is a significant factor that reflects a customer’s engagement with a service provider, which is often overlooked in RFM-based analyses [1]. To address these limitations, this study employs a hybrid clustering approach that integrates data mining and decision-making techniques. While clustering methods such as K-means are commonly used in customer segmentation, they are often limited to descriptive categorization without integrating decision-support mechanisms for prioritization [6]. This study complements clustering with MCDM techniques, enabling a systematic approach to evaluating and ranking customer segments. Using the RMD framework, hotel customers are segmented based on recency, monetary value, and duration of stay. These clusters are then ranked using decision-making methods such as TOPSIS and CLV analysis. Further details on methodology are provided in Section 3. This study integrates clustering methods, association rule mining, and decision-making tools to propose a comprehensive framework for customer segmentation. Specifically, the research employs the K-means clustering algorithm, validated by three internal cluster indices—Silhouette, Calinski-Harabasz, and Davies-Bouldin—to ensure robust segmentation [7,48,49]. After clustering, association rule mining is used to extract hidden patterns, while TOPSIS and CLV (Customer Lifetime Value) analysis prioritize the most valuable customer segments. While data mining has been extensively used in various sectors, few studies have combined clustering, association rules, and MCDM for customer segmentation in the hospitality industry [1,10]. Prior research in hospitality has applied clustering methods independently or in combination with RFM analysis [11,12]. However, the integration of unsupervised machine learning (e.g., K-means), rule-based analysis (e.g., Apriori association rules), and multi-criteria decision-making remains underexplored. This study seeks to bridge this methodological gap by presenting a unified framework for data-driven customer segmentation. Previous research has explored clustering techniques in hotel management, but the integration of Shannon Entropy, TOPSIS, and Best Worst Method (BWM) for segmentation validation remains underdeveloped [13,14]. This study contributes to bridging this gap by presenting a novel hybrid approach that leverages both unsupervised machine learning (clustering) and multi-criteria decision-making to optimize customer classification. Furthermore, advancements in big data analytics and artificial intelligence have revolutionized customer segmentation strategies. The ability to analyze large datasets efficiently has led to improvements in segmentation accuracy and decision-making [15]. Machine learning algorithms, such as K-means, enhance traditional statistical methods by allowing dynamic pattern recognition in real time [6]. This paper highlights how integrating MCDM techniques with data mining can lead to more precise, actionable, and strategic customer segmentation models. This study seeks to answer the following research questions: 1. How does the RMD model improve customer segmentation compared to traditional RFM? 2. What are the key characteristics of customer segments identified through K-means clustering? 3. How can decision-making techniques like TOPSIS enhance customer prioritization for marketing strategies? The remainder of this paper is structured as follows: Section 2 reviews relevant literature on customer segmentation and data mining. Section 3 outlines the methodology, including data collection, clustering techniques, and decision-making approaches. Section 4 presents empirical results, followed by a discussion of implications in Section 5. Finally, Section 6 concludes the study with limitations and future research directions.
2. Literature Review
2.1. Data Mining in Hospitality Industry
With the rapid advancement of Information and Communication Technology (ICT), businesses have gained the ability to generate and analyze large datasets. In the hospitality industry, data mining has become a crucial tool for extracting customer insights, optimizing marketing strategies, and improving customer relationship management (CRM) [16].Data mining, which involves discovering patterns in large datasets through computational methods, is widely used in industries such as banking, healthcare, and marketing [17]. Within the hospitality sector, data mining techniques help analyze customer behavior to improve marketing strategies, loyalty programs, and revenue management [1,18]. CRM-based data mining can significantly enhance customer retention by identifying high-value customers and predicting future purchasing behaviors. The application of data mining in hospitality extends beyond marketing to include dynamic pricing strategies, operational efficiency improvements, and predictive analytics for demand forecasting [18,19]. By leveraging structured and unstructured customer data, hotels can develop targeted promotional campaigns, optimize pricing strategies, and enhance service customization, ultimately improving customer retention. The tourist industry comprises several sections such as hotels, travel agencies, and transportations [20]. Thus, hotels are a highlighted part of this package, and hotel managers have to offer developed services, which tailored their customers to this competitive market. However, by the advancement of the internet, the tourism industry has been reshaped considerably [21]. The Internet is an eminent tool to share information for both consumers and suppliers [22]. Consequently, people can widely access all hotels’ facilities and their customers’ experiences. This has led to documenting a wide range of transactions as bigdata which helps the hotels to present their service found on customers’ tastes. Identifying customers is crucial for all businesses to make profitable decisions in such a competitive epoch, Thus, clustering serves as an effective method. According to Table 1, a few papers were published in the hotel industry to identify customers and improve their services. Therefore, in this study, some methods are integrated to increase efficiency. To apply k-means algorithm, determining the number of clusters (k) is critical. Hence three internal indices are applied to evaluate k. In the following, their weights are calculated by Shannon entropy and the best number is defined with the TOPSIS algorithm. Apriori and RMD are combined to improve the accuracy of results and rendering patterns. Eventually, clusters are analyzed by TOPSIS and BWM.

Table 1.
Previous Related Research.
| Researcher(s)/Year | Target(s) | Tool(s) | Result(s) |
|---|---|---|---|
| (Mohammadrezapour et al., 2020) [23] | Comparing two clustering methods | K-means, C-means | C-means yielded higher accuracy than K-means |
| (Matz and Hermawan, 2020) [24] | Proposing a model for a cluster of a loyal customer | LRIFMQ, CLV, AHP, k-means | Customers were grouped into six clusters |
| (Mahdiraji et al., 2019) [25] | Clustering and ranking bank customers using RFM | RFM modeling, BWM, COPRAS | Classifying customers into six clusters and selected two groups as influential ones |
| (Syakur et al., 2018) [26] | Determining the best number of clusters | K-means, elbow method | Defining an appropriate number of clusters using the elbow method |
| (Doğan et al., 2018) [27] | Clustering retail customers | RFM modeling, K-means, Two-step | Comparing two types of clustering results |
| (Mosavi and Afsar, 2018) [11] | Analyzing bank customers’ value | FAHP, K-means, random forest classification | Presenting the model according to the applied attributes |
| (Peker et al., 2017) [28] | Developing services and increasing profits | LRFMP, K-means, Calinski-Harabasz, Davies-Bouldin, Silhouette | Clustering customers into five groups |
| (Dursun and Caber, 2016) [1] | Clustering hotel customers | RFM modeling, K-means | Offering proper strategies to each group |
| (Ansari and Riasi, 2016) [12] | Combining data mining methods to cluster steel industries’ customers | LRFM modeling, Two-step, genetic algorithm, C-means | Classifying customers into two groups, rendering tailored strategies |
| (Ganjali and Teimourpour, 2016) [29] | Clustering insurance customers | K-means, CLV, association rule, decision tree, Davies-Bouldin | Classifying customers into five clusters |
| (Sarvari and Ustundag, 2016) [30] | Clustering fast-food customers | Associated rules, RFML modeling, K-means | Having proper groups is critical to forming strong associations |
| (Abirami and Pattabiraman, 2016) [31] | Clustering customers | RFM modeling, K-means, Association Rules | Predicting customers’ behavior, improving customer satisfaction |
| (Srihadi et al., 2016) [10] | Clustering foreign customers | K-means | Identifying groups, proposing proper strategies |
| (Chang et al., 2009) [32] | Finding important variables influenced by customer loyalty | Decision tree analysis | Exploring customer behavior |
| (Mohammadian and Makhani, 2016) [33] | Analyzing data to identify customer intentions | RFM modeling, CLV | Grouping customers into eight clusters to understand customers |
| (You et al., 2015) [34] | Clustering customers | RFM modeling, K-means, CHAID decision trees, Pareto Values | Offering precision marketing strategies |
| (Dimitrovski and Todorović, 2015) [35] | Understanding customer behavior | K-means, chi-square test, Hierarchical method | Understanding visitor intentions, presenting appropriate promotions |
| (Wei et al., 2013) [36] | Clustering hairdressing industry customers | K-means, RFM modeling | Identifying customers, offering proper strategies |
| (Chen et al., 2012) [19] | Understanding retail customers | K-means, RFM modeling, decision tree | Classifying customers into five clusters |
| (Liao et al., 2012) [37] | Finding hidden patterns in data | K-means, Apriori algorithm | Exploring group-buying customer behavior |
| (Hosseini et al., 2010) [38] | Clustering SAPCO customers | K-means, WRFM, CLV | Assessing customers, proposing an effective model for understanding customers |
2.2. Customer Segmentation Techniques
Customer segmentation is a fundamental technique in marketing analytics, enabling businesses to classify customers based on their behavior, demographics, and purchasing patterns [3]. While traditional segmentation methods such as RFM have been widely adopted, recent advancements in machine learning and data analytics have led to the development of more sophisticated models, including behavioral and psychographic clustering [28]. These models incorporate real-time transaction data, customer engagement metrics, and external factors to refine segmentation strategies. Traditional segmentation models, such as Recency, Frequency, and Monetary (RFM) analysis, have been extensively used in various industries. However, these models often fail to account for customer engagement depth and behavioral dynamics [4]. The limitation of RFM stems from its exclusive focus on transactional activity, neglecting customer interaction longevity, seasonal patterns, and service usage intensity [3]. This gap is particularly evident in the hospitality industry, where the frequency of visits may not necessarily correlate with long-term customer value. For instance, a customer who stays in a hotel for ten nights annually might be more valuable than a frequent traveler staying for only one night per visit. The RMD framework addresses this gap by introducing “Duration” as a critical segmentation attribute. Predictive analytics, powered by machine learning algorithms, has further enhanced customer segmentation by allowing businesses to forecast customer lifetime value and retention likelihood [17]. Various tools are applied in data mining conducting divergent applications. Figure 1 has demonstrated some of the data mining techniques.
Clustering and association rules are introduced in the following due to their application in this research. Among various clustering methods, K-Means remains one of the most widely used due to its efficiency and adaptability. However, a critical limitation of K-Means is its reliance on predefined cluster numbers, which may lead to suboptimal segmentation if the correct value of K is not determined effectively [26]. To mitigate this issue, this study employs internal cluster validation indices such as Silhouette, Davies-Bouldin, and Calinski-Harabasz scores to ensure robust segmentation [7,9]. It partitions customers into distinct groups based on similarity, enabling businesses to identify and target different customer segments effectively. K-Means clustering was presented in an anthropology paper in 1954 [40] and it has been used in various fields such as machine learning and statistics. Items in a cluster are the most similar to each other while being the most different from items in other groups [6,41]. A key advantage of K-Means is its sensitivity to changes in data properties, making it a dynamic and adaptable clustering method.
2.3. RFM vs. RMD: The Need for an Enhanced Segmentation Model
The RFM model segments customers based on three attributes: Recency, Frequency, and Monetary value [3]. It is widely used due to its effectiveness in identifying high-value customers [4]. This segmentation enables businesses to develop targeted marketing strategies that enhance customer engagement and retention [42]. RFM has some advantages and disadvantages; first, RFM costs are affordable and let the companies owners understand customers’ behaviors readily [43,44]. Second, it helps firms to anticipate and enhance their profits [45]. Third, it is an effective model for customers’ behaviors purchasing with small variables [42]. However, RFM only focuses on profitable customers, which means that it applies limited variables to understand customers and does not have prospects for new customers [3]. RFM is mainly applied to K-means and SOM [46]. To develop some of the RFM features by strengthening the weaknesses, researchers add some other variables to RFM such as TRFM (Timely), RFD (duration), FRAT (Amount and Type of products). Given the mean of RFM, each index has a higher value than the average is indicated by ↑ and lower than the means is shown with ↓. Dursun and Caber (2016) announced, RFM method is applied in the hotels’ industry scarcely and symbolized loyal customers with R↑F↑M↑, lost customers with R↓F↓M↓, new customers with R↑F↓M↓, potential customers with R↑F↑M↓, loyal summer season customers with R↓F↑M, collective buying customers with R↑F↑M, winter season customers with R↑F↑M↓ and high potential customers with RF↓M↑ [1]. Their model can identify valuable customers to improve the services’ qualities. Notwithstanding, in other industries, RFM and K-means have been used to identify valuable customers [24]. RMD (Recently, Monetary, Duration) is presented in this study to cluster customers. RMD is defined as follows. • R (Recently): Defined as the number of days between the latest presence of a hotel’s customer and the date of analysis. It determines the most recent customers’ presence. The customers’ data is bounded between the dates 18.08.2017 and 18.08.2018 for RMD analysis; beginning with 1 from 18.08.2017. Each of the dates is numbered respectively, up to 366 for 18.08.2018. • M (Monetary): The amount of money each customer spends. • D (Duration): The number of days each individual stays at the hotel. Statistical indicators of each index are presented in Table (3).
3. Basic Concepts
3.1. K-Means
Although K-Means is a simple, fast, and efficient method, it is best suited for generating spherical clusters. One of the critical aspects of clustering is measuring distance between data points, which affects how clusters are formed. Various methods exist to calculate distance, with Euclidean distance being one of the most widely used techniques, as calculated using Equation (1)
The accuracy of the K-Means algorithm depends heavily on selecting the optimal number of clusters (K) [47]. In this research, the optimal K value is determined using Multi-Criteria Decision-Making (MCDM) tools. To ensure the reliability of clustering results, various validation indices are used. These measures evaluate the quality of clusters by assessing intra-cluster cohesion and inter-cluster separation. Three widely adopted indices include the Silhouette Score, the Calinski-Harabasz Index, and the Davies-Bouldin Index, each of which provides insights into the optimal number of clusters. The quality of clustering results can be assessed using these internal validation indices, which will be discussed in the following below:
Silhouette Analysis The Silhouette method is a widely used technique for evaluating clustering performance [7]. A higher silhouette score indicates better clustering quality. To compute the Silhouette Score, two key concepts are introduced:
Mean distance of points to other points within the same cluster: Suppose xi belongs to the Cj cluster. The mean intra-cluster distance (how close xi is to other points in its own cluster) is computed by (2).
Notably, ni is the size of the cluster. Moreover, an (i) represents the belonging value of the xi to its cluster which is more for the lower values. This distance can be determined by various methods such as Manhattan and Euclidean.
Minimum mean distance of a point to other clusters: Suppose that is a point belonging to cluster . The mean inter-cluster distance to cluster is computed by (3).
Mention that ym are the points belonging to Ck and nl is the number of measured distances. A cluster that has the lowest mean distance to the point xi is referred to as an adjacent cluster to this point. Thus, the value of the Silhouette criterion for point xi is calculated by (4).
Calinski-Harabasz Index Calinski- Harabasz Index is measured by (5).
Notably, SSB is the sum of variance between clusters and SSW is the sum of variance within clusters. N and K in order are the numbers of observations and the number of clusters [8].
Davies-Bouldin Index To calculate this index, first, the criteria must be introduced [9]:
The measure of scatter within cluster: Suppose that Si is the measure of scattering corresponding to the cluster Ci and d is also a distance function. The scattering rate for this cluster is obtained by (6).
Notice that Ci is the centroid of the cluster i.
Cluster separation: The separation between the two clusters is also measured by the distance between their centroids. The distance between two clusters is shown by Dij and is computed by (7).
Note that, Vi and Vj are the centroids of the clusters i and j, Considering s(i) for tightness and Dij for separation, Rij can be calculated by (8).
To attain the Davis-Bouldin index for a clustering method, the maximum distance of each cluster relative to the other clusters is computed by (9).
The mean of the maximum distances (Davies- Bouldin) is computed for all clusters by (10).
It is noteworthy that k is the number of clusters. The lower the DB index, the better the clustering.
3.2. Association Rules and Customer Behavior Analysis
Association rule mining identifies relationships and recurring patterns within a database. It helps managers develop tailored marketing strategies and improve service offerings, ultimately enhancing customer satisfaction and competitiveness in the market. In a data set, a rule, which is shown by X →Y, means if items belong to X, they would tend to belong to Y. Association rule has two parameters to be measured; support and confidence. Support X →Y shows the percentage of X and Y in all transactions and confidence X →Y indicates the possibility that Y tends to be in the transaction if a transaction includes X [50]. Association rules help managers to find valuable customers [29]. Association rule was used for a diagnostic possible disease which was obtained from features from hospital information and patients’ keyword [51]. Ganjali has employed the association rule to find the insurer’s behavior [29]. After applying the clustering process, the association algorithm is applied to find rules in each cluster.
3.3. Multi-Criteria Decision-Making (MCDM) Approaches for Customer Prioritization
3.3.1. Shannon Entropy
Shannon entropy as an objective method is applied to determine the weights of the validation indices. The entropy of each criterion is calculated by Equation (12) based on the normalized matrix. Notice that k is constant and is defined by Equation (11) and m is defined as the number of alternatives.
The division degree is calculated found on the entropy values by Equation (13).
Finally, the weights are computed by Equation (14):
3.3.2. TOPSIS
TOPSIS was first developed by Hwang and Yoon in 1981 to rank alternatives based on decision criteria [52]. The principle of this method is selecting the alternative with the shortest distance from the ideal criteria and the longest distance from the anti-ideal indices. The TOPSIS method is defined below.
Step1: The decision-making matrix is formed: The decision-making matrix is a matrix for evaluating alternatives (,,…) based on some criteria (,,…, ) (15).
It is notable that, is the value of the alternative found on the criteria.
Step2: The Decision-making matrix is normalized by Equation (16):
Step3: The weights of the criteria are extracted by a method. In this study, Shannon Entropy is applied to determine the weights.
Step4: The weighted normalized decision matrix is formed by the multiplication of the normalized matrix (R) with their relative weight by Equation (17).
Step5: The TOPSIS method is employed to prioritize the number of clusters. On this subject, the ideal and anti- ideal solutions are elected by Equation (18) and Equation (19).
Next, Equation (20) is used to measure the Euclidean distance of each alternative from the ideal () and anti-ideal (), known as and respectively.
Consequently, the closeness ratio is calculated by Equation (21).
The appropriate alternative has the highest value of . The TOPSIS method has been used in many types of research. As an illustration, TOPSIS and Shannon entropy were employed to find the optimal technology among the waste-to-energy technological choices using the waste stream of Lagos, Nigeria [53]. Moreover, Wang applied TOPSIS to evaluate 22 symbiotic technologies in the iron and steel industrial network [54].
3.3.3. BWM
BWM is an efficient technique introduced by Rezaie to solve MCDM problems. This technique determines the weights of criteria [55]. This algorithm is defined in the following steps.
1. A set of decision criteria is chosen.
2. Focus groups or experts determine the best and worst criteria. Moreover, no comparison is applied to them.
3. Focus group or experts elect the preference of the best criteria over other criteria throughs number among 1 and 9 ((,,…).
4. Focus group or experts elect the preference of the worst criteria over other criteria throughs number among 1 and 9 ((,,…).
5. The proper weights are found by solving the nonlinear (NLP) model with the following Formula (21):
6. In this section, the compatibility rate (CR) of the comparisons is computed by Equation (22). In this paper, CRs less than 0.2 are reasonable.
It should be mentioned that CI is the compatibility index, that is calculated based on the preference of the best criteria over the worst criteria (ABW) [56]. BWM has been applied in many studies recently. BWM was applied to extract the weights of water resources security indicators (Tu et al., 2020). Çalık used BWM to determine the weights of social media platforms for reaching customers by travel agencies [14]. Khalilzadeh employed BWM in the bank industry to identify risks’ weights which affect the loss of bankings’ projects [57].
3.3.4. CLV
Knowing customers’ characteristics and their differences is a crucial issue in an organization [58]. Customer Lifetime Value (CLV), a concept introduced by Kotler, represents the total expected revenue a business can generate from a customer over the duration of their relationship [59]. CLV is defined as revenue that companies can achieve from a single customer or group of customers over time [60]. CLV intends to ealuate value of specific parts of markets’ customers; therefore, it is a primary tool to demonstrate the merit segmentation strategy [61]. Managers could ameliorate client segmentation by computing the CLV of each customers and marketing resource allocation achivements [5]. Customers with long lives are a profitable segment for companies. CLV, as a tool for leading all companies’ assets, is an efficient method for assessing the relationships between customers and firms. Maintaining customers is considered as increasing the customers’ profit over time [62]. CLV has three beneficial consequences. First, it identifies loyal and potential customers. Second, it helps companies to know different customers with hidden patterns. Third, it aids managers to propose suitable strategies for each segment. One of the most highlighted outcomes of CLV is that companies can predict the future of valuable customers. Based on their information, they can both make proper decisions and present appropriate strategies [63]. CLV has various models e.g., scoring model, probability model, an econometric model [32]. In this study, the scoring model, which is based on customers’ purchase attributes (RMD) is applied. CLV is calculated by Equation 23 (Note that is the weight of Monetary and the is the normalized duration.)
4. Research Methodology
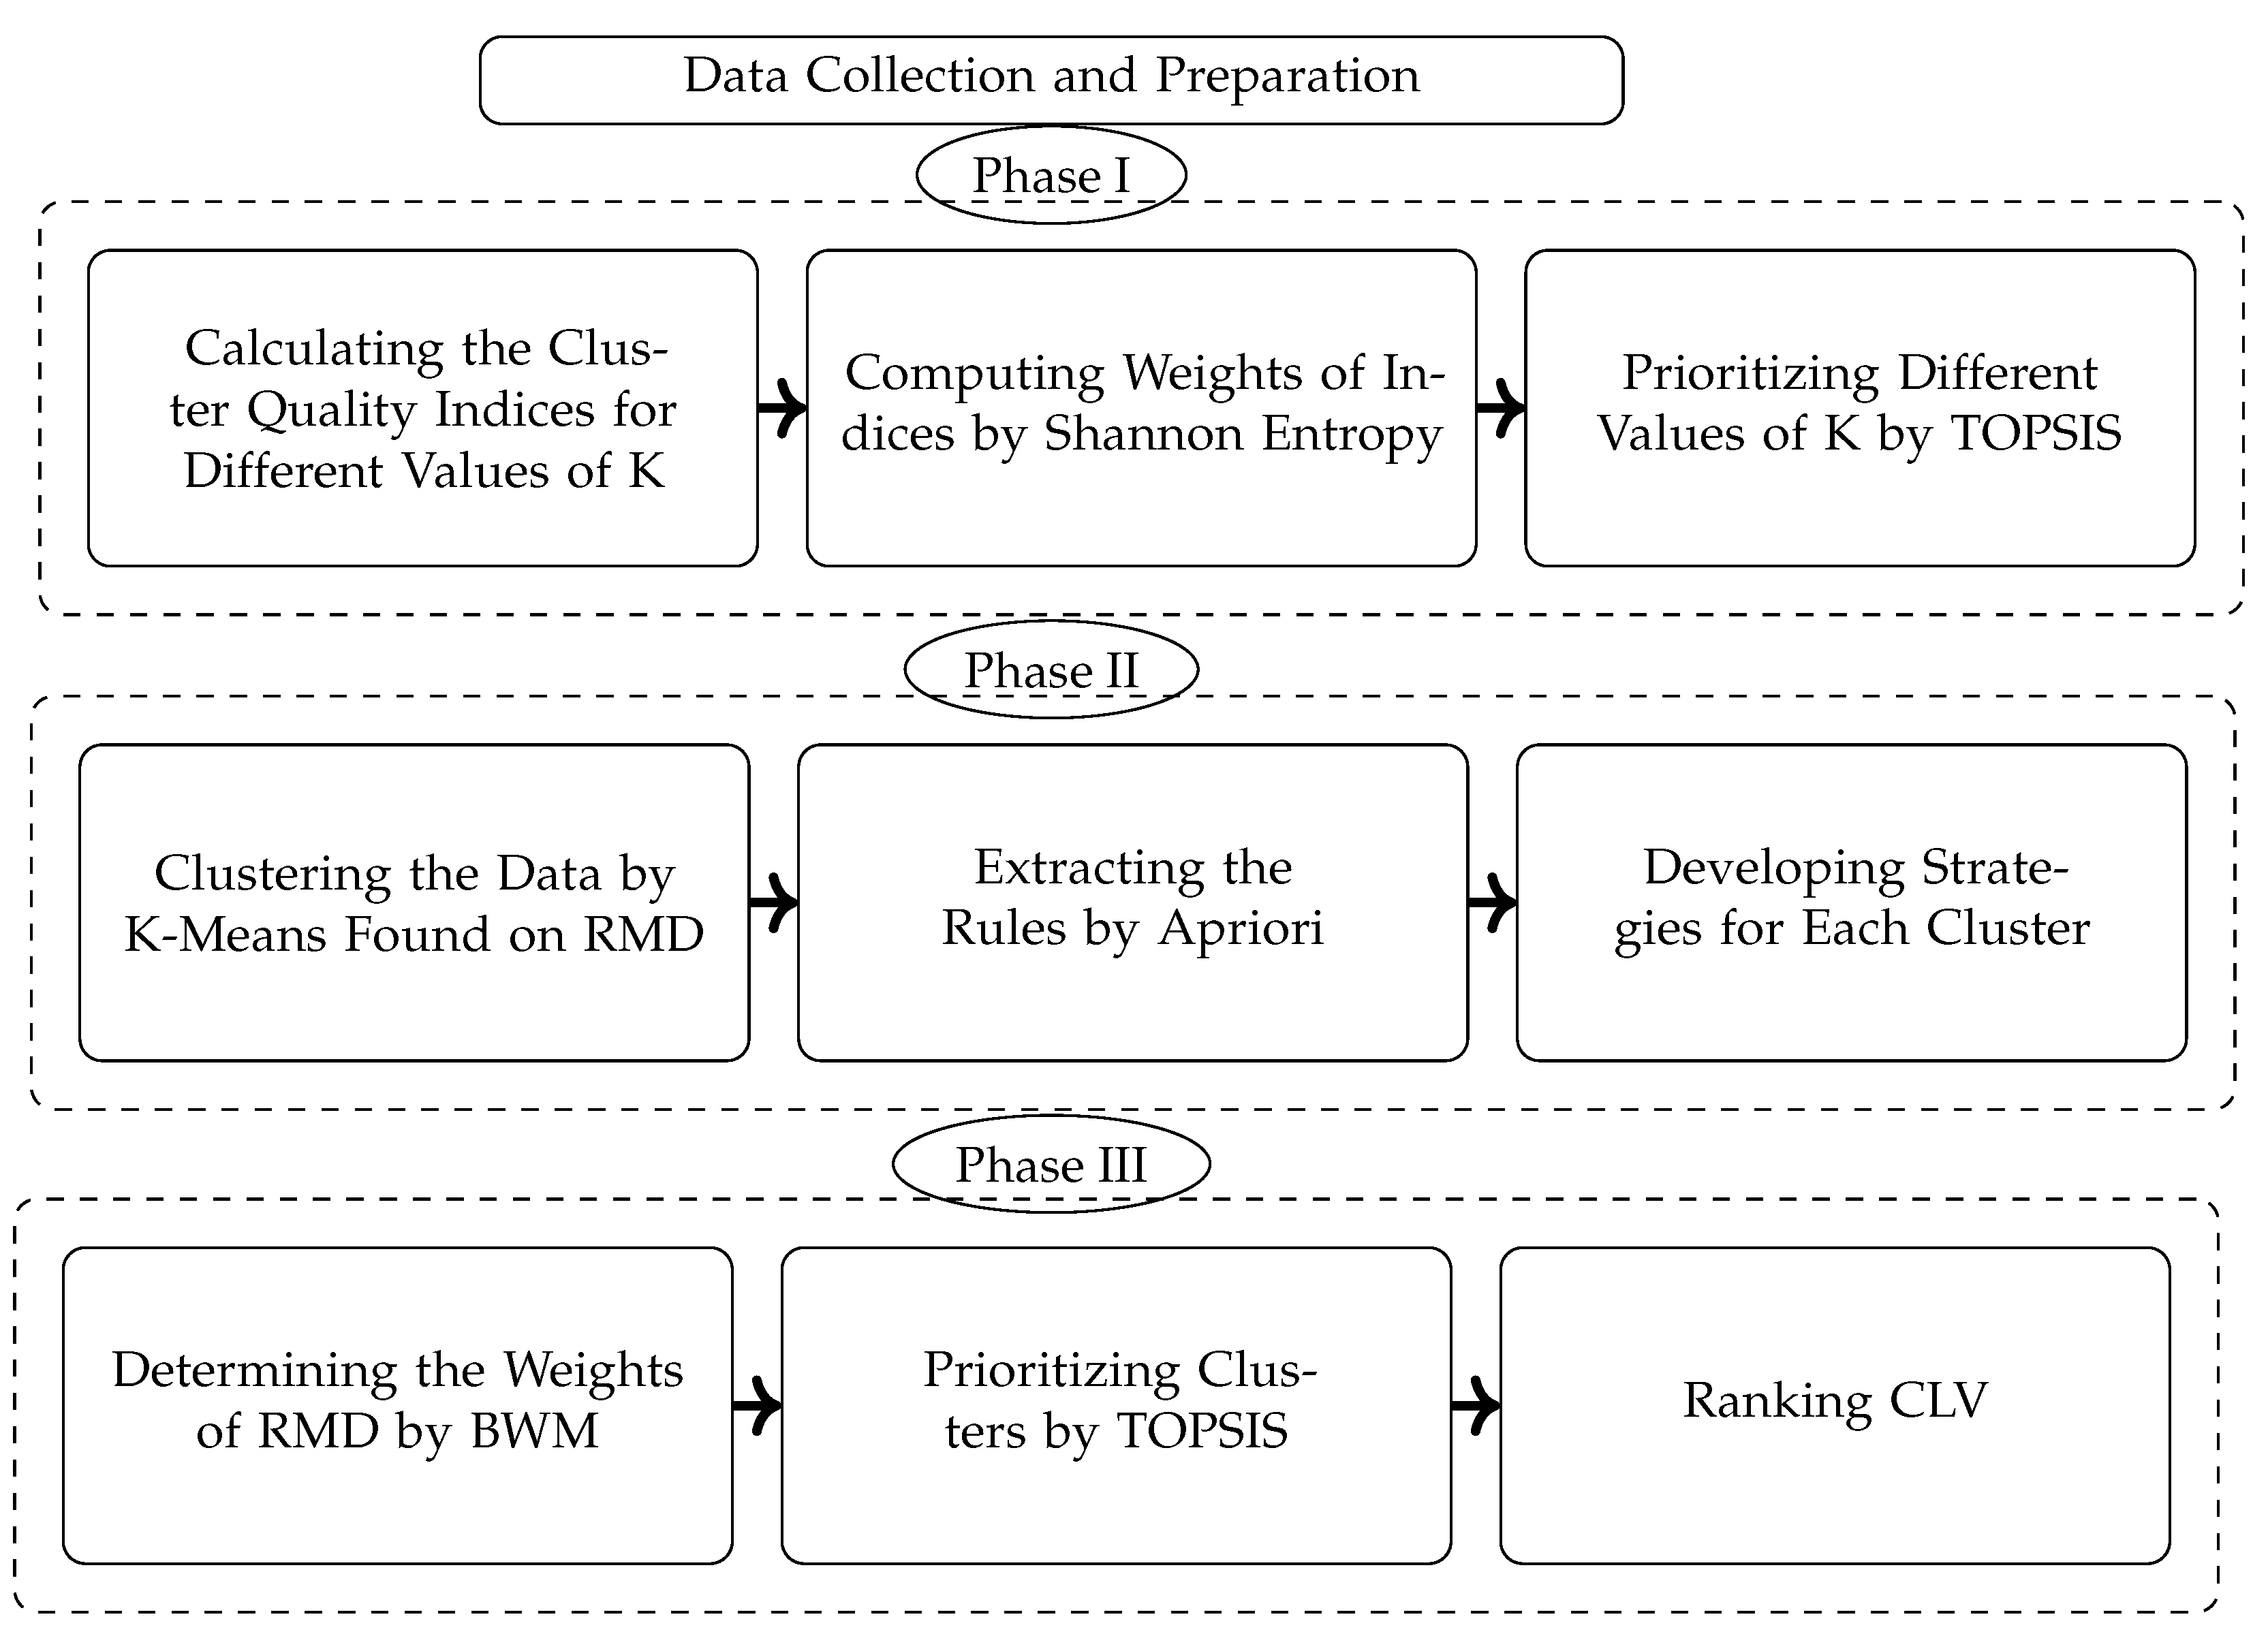
This research attempts to distinguish 1171 customers of a hotel. Three phases of this study include:
1- K determination, after data preparation.
2- Customer classifications, and rules extractions.
3- Clusters evaluations by CLV, and decision-making methods (TOPSIS and BWM).
These processes have been depicted in Figure 2.
Phase I
In phase I, the optimal number of clusters (K) is determined by the below steps.
1- The clusters are evaluated based on cluster quality indices including Silhouette Analysis (Equation 2 to 4), Calinski-Harabasz (Equation 5) and, Calinski-Harabasz (Equation 6 to 10).
2- These indices are considered as decision criteria and their weights are extracted by Shannon Entropy (Equation 11 to 14).
3- Different values of k are considered as decision Alternatives which are prioritized by TOPSIS (Equation 15 to 21).
Phase II
1- Customers are clustered by the K-Mean algorithm found on RMD attributes. The optimal obtained number of phase I is considered as the number of clusters. To measure the distance, Euclidean distance (Equation 1).
2- Apriori as a method of an association rule is employed to extract the rules.
3- Tailored strategies are developed for each cluster based on its characteristics.
Phase III
1- RMD attributes are considered as the criteria to assess clusters and the weights are determined by BWM (Equation 21 to 22).
2- Clusters are prioritized by TOPSIS (Equation 15 to 21).
3- CLV is computed for each cluster (Equation 23).
Figure 2.
Research process to evaluate hotels’ customers
5. Case study and Results
Tehran, the capital of Iran, owns nearly 8.737 million population, (City population statics, 2016) with 101 hotels (www.hoteldari.com). As a political center, Tehran attracts a large number of tourists who travel having businesses and medical treatment intentions. The customers’ profiles are belonging to 3-star Hally Hotel, located downtown. The research population was 1121 hotel customers who visited the hotel at least once; however, after data preparation, the number of customers reached 1107, between the dates 18.08.2017 and 18.08.2018. Dispersal of customers shows 60.4% female (f = 386), and 34. 9% male (f = 720) customers. They were mainly between the ages of 31-40 (26.7%, f=296) and 41-60 (19.4%, f=215). The large parts of them were Iraqi (22.89%) and Chinese (7.33%) and travel alone (61.12%; f = 676) or non-alone (31.55%; f = 349).
5.1. Clustering Model
After data preparations, three validity indices are (Calinski-Harabasz, Davies-Bouldin, Silhouette) computed for the evaluation of clusters from 2 to 10, which has been shown in Table 2. Moreover, the weights of these indices, which were determined by Shannon entropy, are presented in Table 2. According to this table, Davies-Bouldin with a value of 0.36 has the highest value among the others. Thereafter, customers were clustered by RMD indicators defined in the former sections. The descriptive statistics of RMD are presented in Table 3. The mean of RMD is computed in each cluster and their values were compared with the total mean of RMD. Their scores are presented in Table 4.
Table 2.
Validity indices value
| Number of k | Silhouette | Davies-Bouldin | Calinski-Harabasz |
|---|---|---|---|
| Weight of validity indices | 0.34 | 0.36 | 0.28 |
| 2 | 0.74 | 0.63 | 831.2 |
| 3 | 0.82 | 0.62 | 1096.65 |
| 4 | 0.78 | 0.66 | 1287.77 |
| 5 | 0.70 | 0.63 | 1347.64 |
| 6 | 0.73 | 0.61 | 1602.60 |
| 7 | 0.70 | 0.67 | 1484.12 |
| 8 | 0.74 | 0.70 | 1654.36 |
| 9 | 0.73 | 0.68 | 1613.19 |
| 10 | 0.73 | 0.71 | 1652.56 |
Table 3.
Descriptive statistics of RMD table
| RMD Indices | Minimum | Maximum | St. dev. | |
|---|---|---|---|---|
| R (Recency) | 10 | 365 | 126.8 | 97.0 |
| M (Monetary) | 667 | 4724 | 1252.3 | 501.6 |
| D (Duration) | 1 | 12 | 3.4 | 1.6 |
Table 4.
RMD Scores
| Clusters | N | RMD Value | |||
|---|---|---|---|---|---|
| 1 | 579 | 1.00 | 414.10 | 211.60 | R↑M↓D↓ |
| 2 | 24 | 8.45 | 3221.50 | 202.58 | R↑M↑D↑ |
| 3 | 81 | 3.66 | 1214.61 | 185.40 | R↑M↓D↑ |
| 4 | 26 | 2.76 | 1314.88 | 14.00 | R↓M↑D↓ |
| 5 | 315 | 3.57 | 806.17 | 114.01 | R↓M↓D↑ |
| 6 | 81 | 1.32 | 542.76 | 33.75 | R↓M↓D↓ |
| Total | 1107 | 3.46 | 1252.34 | 126.84 |
5.2. Clustering Analysis
The overall average of RMD was calculated (R=126.854, D=3.46, M=1252.34). The first cluster has an R↑M↓D↓ score; thus, this cluster is called ‘new customers’. Customers of this cluster stayed in the hotel one night and traveled alone. New customers were mostly men (68%), Iraqi (24%), and aged 31-40 (26%). They had freelance jobs, and their travel intention was tourism. These customers should be motivated not only to stay more but also to spend more money in the hotel. The second cluster is known as loyal customers with the score of R↑M↑D↑. These customers were Iraqi (45%) and 41-50 (41%) years old. Loyal customers traveled with two people, and the number of men and women in this group was equal. They stayed at the hotel for seven days, and their travel intention was tourism. The third cluster is called Collective Buying Customers, with the R↑F↓M↑ score. Collective Buying Customers traveled with two people, they were mostly men (69%) and aged 31-40 (28%). These customers were mostly Chinese internationals with a freelance job, and their travel intentions were tourism. Collective Buying Customers spent three days in the hotel. The fourth cluster scored R↓M↑D↓ and named potential customers. Potential customers were 31-40 (38%), both Chinese and Iraqi (15.3%), and stayed one night. They were employees and they traveled for work purposes, and they were equal in their genders. The customers, who mainly traveled alone, spent large amounts of money, and the hotel should propose special services for this cluster to make them stay more. The fifth cluster has R=114.02, M=806.17, and D=3.57; thus, this group is scored R↓M↓D↑ and called business customers. Business customers were Iraqi (23%) and 31-40 (28%) years old and men (65%). They had freelance jobs and traveled alone for office works. These customers stayed at the hotel for two nights. The sixth cluster is known as lost customers with R↓M↓D↓. These customers were Iraqi (18.5%), 21-30 (27%) years old, and stayed one night. Low price offerings should be used to attract this group. The overall descriptions are summarized in Table 5.
5.3. Association Rule Results
Association rule was performed in each cluster to find relationships between demographic variables. For instance, if a visitor is a male, he is Iraqi with a freelance job. Another rule for the first cluster is that the customers’ jobs should be a tourist before their travel intentions were tourism. The rules in each cluster are shown in Table 6.
5.4. Comparison and Evaluation of Clusters
Evaluation of customers is an important task to identify profitable groups. In this study, two solutions are presented to recognize customers by decision-making algorithm and CLV ranking. The weights of RMD are extracted by BWM (R= 0.25, M= 0.68, D= 0.06). Thus, loyal customers have the highest score and are the most precious group among the other., these results are demonstrated in Table 7. By the evaluation of CLV for each cluster, it can be understood that the most valuable group is the second cluster with 2.6% of all customers; on the other hand, the sixth cluster is the most invaluable group; eventually, other clusters are prioritized in Table 7.
6. Discussion and Implications
This study showcases a hybrid data mining and multi-criteria decision-making (MCDM) approach to enhance customer relationship management (CRM) in hospitality, using Hally Hotel in Tehran, Iran, as a case study. By extending the RFM model to RMD (Recency, Monetary, Duration) and integrating K-means clustering with TOPSIS and CLV analysis, we identified six distinct customer segments—New, Loyal, Collective Buying, Potential, Business, and Lost—offering actionable insights for an emerging economy facing unique market dynamics.
6.1. Theoretical Contributions
Theoretically, this study refines customer segmentation by incorporating Duration into the RMD framework, addressing a limitation of RFM’s transaction-centric focus [3]. In hospitality, where stay length drives revenue more than visit frequency (unlike retail or banking), RMD provides a superior lens for valuing guests like Loyal Customers (R↑M↑D↑). This builds on prior models like LRFMP [28] but emphasizes duration’s hospitality-specific relevance. Moreover, combining K-means with association rules and MCDM tools (TOPSIS, BWM) marks a methodological leap. While Dursun and Caber (2016) used RFM with clustering, our use of three validation indices (Silhouette, Davies-Bouldin, Calinski-Harabasz) and decision-making prioritization is novel, bridging unsupervised learning with strategic ranking [1]—a rare integration in hospitality research.
6.2. Practical Implications
Practically, these findings empower hotel managers to tailor marketing with precision. Loyal Customers (Cluster 2, 2.16% of the sample) topped CLV (0.59) with long stays (7 days) and high spending (M=3221.5), warranting loyalty programs like multi-night discounts or partnerships with travel agencies for curated tours. Potential Customers (Cluster 4, R↓M↑D↓) spent generously (M=1314.88) but stayed briefly (1 night); incentives like free upgrades for extended bookings could boost their value. New Customers (Cluster 1, 52.3%) showed low engagement (M=211.6, D=1), suggesting targeted ads with perks like free breakfast or installment payments. Lost Customers (Cluster 6, CLV=0.01) need re-engagement via low-cost seasonal offers. For Collective Buying Customers (Cluster 3), group discounts with Chinese tour operators could leverage their 44% four-day stays. These strategies, informed by association rules (e.g., male Iraqi freelancers tied to tourism in Cluster 1), enhance CRM efficiency, enabling hotels to allocate resources effectively in a competitive landscape.
6.3. Contextual Insights
Iran’s geopolitical context—marked by U.S. sanctions limiting Western tourism—shapes the dominance of Iraqi (22.3%) and Chinese (7.3%) guests. Iraqi Business Customers (Cluster 5) reflect commerce-driven travel, while Chinese Collective Buying Customers (Cluster 3) highlight group tourism, tied to Iran’s trade ties with China (e.g., oil and mineral exports). This contrasts with tourism-heavy markets like Turkey, underscoring the need for adaptive CRM in sanctioned economies. As Dursun and Caber (2016) argued, robust CRM amplifies data-driven insights, a critical advantage when guest pools are niche yet diverse. In a broader sense, this RMD framework offers a scalable model for hospitality firms to navigate competition, merging analytics with decision-making to elevate customer-centric strategies in resource-constrained settings.
7. Conclusion
This study introduces a novel Recency, Monetary, and Duration (RMD) model to segment hotel customers, validated through a hybrid approach combining K-means clustering, association rule mining, and multi-criteria decision-making (MCDM) techniques (TOPSIS, BWM). Applied to 1,107 guests of Hally Hotel in Tehran, Iran, between August 2017 and August 2018, the framework identified six distinct clusters—New, Loyal, Collective Buying, Potential, Business, and Lost—prioritized by Customer Lifetime Value (CLV) and TOPSIS rankings. Loyal Customers emerged as the most valuable segment (CLV=0.59), while Lost Customers ranked lowest (CLV=0.01), offering clear guidance for targeted marketing strategies. By extending the RFM model with Duration and integrating advanced analytics, this study provides a robust tool for hospitality firms to enhance CRM, optimize resource allocation, and improve retention in competitive markets. Limitations include the absence of Frequency data due to privacy constraints, restricting comparisons with traditional RFM models. The one-year dataset precluded seasonal analysis, and the focus on foreign guests excluded domestic customer insights. Future research could address these gaps by incorporating longitudinal data to capture seasonal trends, adding variables like booking channels or travel modes for richer segmentation, and extending the model to other hospitality contexts or emerging economies. Despite these constraints, the RMD framework stands as a scalable, data-driven solution, bridging analytics and decision-making to elevate customer-centric strategies in the hospitality industry.
Author Contributions
Conceptualization, Maryam Deldadehasl; methodology, Maryam Deldadehasl; software, Maryam Deldadehasl and Houra Hajian Karahroodi; formal analysis, Maryam Deldadehasl, Pouya Haddadian Nekah, Houra Hajian Karahroodi; data curation, Hoira Hajian Karahroodi and Pouya Haddadian Nekah; writing—original draft preparation, Maryam Deldadehasl and Pouya Haddadian Nekah; writing—review and editing, Houra Hajian Karahroodi and Pouya Haddadian Nekah; visualization, Houra Hajian Karahroodi and Pouya Haddadian Nekah. All authors have read and agreed to the published version of the manuscript.
Funding
This research was supported by the department of industrial management, university of Tehran, Tehran, Iran.
Data Availability Statement
The data presented in this study are available on request from the corresponding author due to restrictions set by the private entity that provided the data.
Conflicts of Interest
The authors declare no conflicts of interest.
References
- A. Dursun and M. Caber, (2016), Using data mining techniques for profiling profitable hotel customers: An application of RFM analysis, Tour Manag Perspect, 18, 153-160.
- P. Ristoski and H. Paulheim, (2016), Semantic Web in data mining and knowledge discovery: A comprehensive survey, Journal of Web Semantics, 36, 1-22, Accessed: Feb. 27, 2025, [Online]. Available: https://www.sciencedirect.com/science/article/pii/S1570826816000020.
- J. A. McCarty and M. Hastak, (2007), Segmentation approaches in data-mining: A comparison of RFM, CHAID, and logistic regression, J Bus Res, 60, 6, 656-662.
- Y. H. Hu and T. W. Yeh, (2014), Discovering valuable frequent patterns based on RFM analysis without customer identification information, Knowl Based Syst, 61, 76-88.
- V. Kumar, Y. Bhagwat, and X. Zhang, (2015), Regaining ‘lost’ customers: The predictive power of first-lifetime behavior, the reason for defection, and the nature of the win-back offer, J Mark, 79, 4, 34-55, Jul. [CrossRef]
- A. K. Jain, (2010), Data clustering: 50 years beyond K-means, Pattern Recognit Lett, 31, 8, 651-666, Accessed: Feb. 24, 2025, [Online]. Available: https://www.sciencedirect.com/science/article/pii/S0167865509002323.
- P. Rousseeuw, (1987), Silhouettes: A graphical aid to the interpretation and validation of cluster analysis, J Comput Appl Math, 20, 53-65, Nov., Accessed: Feb. 27, 2025, [Online]. Available: https://www.sciencedirect.com/science/article/pii/0377042787901257.
- T. Calinski and J. Harabasz, (1974), A dendrite method for cluster analysis, Communications in Statistics, 3, 1, 1-27, Accessed: Mar. 02, 2025.
- D. Davies and D. W. Bouldin, (1979), A cluster separation measure, IEEE Trans Pattern Anal Mach Intell, 1, 2, 224-227, Accessed: Mar. 02, 2025, [Online]. Available:.
- T. F. Srihadi, D. Sukandar, and A. W. Soehadi, (2016), Segmentation of the tourism market for Jakarta: Classification of foreign visitors’ lifestyle typologies, Tour Manag Perspect, 19, 32-39.
- A. B. Mosavi and A. Afsar, (2018), Customer value analysis in banks using data mining and fuzzy analytic hierarchy processes, Int J Inf Technol Decis Mak, 17, 03, 819-840.
- A. Ansari and A. Riasi, (2016), Customer clustering using a combination of fuzzy c-means and genetic algorithms, International Journal of Business and Management, 11, 7, 59.
- Y. Tu, K. Chen, H. Wang, and Z. Li, (2020), Regional Water Resources Security Evaluation Based on a Hybrid Fuzzy BWM-TOPSIS Method, Int J Environ Res Public Health, 17, 14, 4987.
- A. Çalık, S. L. Sain, and K. Guo, (2020), Evaluation of Social Media Platforms using Best Worst Method and Fuzzy VIKOR Methods: A Case Study of Travel Agency, Iranian Journal of Management Studies, 19, 3, 197-208. [CrossRef]
- G. George, M. R. Haas, and A. Pentland, (2014), Big data and management, Academy of Management Journal, 57, 2, 321-326.
- C. H. Cheng and Y. S. Chen, (2009), Classifying the segmentation of customer value by the RFM model and RS theory, Expert Syst Appl, 36, 3, 4176-4184.
- S. Erevelles, N. Fukawa, and L. Swayne, (2016), Big Data consumer analytics and the transformation of marketing, J Bus Res, 69, 2, 897-904, Accessed: Mar. 02, 2025, [Online]. Available: https://www.sciencedirect.com/science/article/pii/S0148296315002842.
- G. D. Samarasinghe and D. S. R. Samarasinghe, (2013), Green decisions: Consumers’ environmental beliefs and green purchasing behaviour in Sri Lankan context, International Journal of Innovation and Sustainable Development, 7, 2, 172-184. [CrossRef]
- D. Chen, Sai. L. Sain, and K. Guo, (2012), Data mining for the online retail industry: A case study of RFM model-based customer segmentation using data mining, Journal of Database Marketing & Customer Strategy Management, 19, 3, 197-208, Sep. [CrossRef]
- M. Ostovare and M. R. Shahraki, (2019), Evaluation of hotel websites using the multicriteria analysis of PROMETHEE and GAIA: Evidence from the five-star hotels of Mashhad, Tour Manag Perspect, 30, 107-116.
- C.-I. Ho and Y.-L. Lee, (2007), The development of an e-travel service quality scale, Tour Manag, 28, 6, 1434-1449.
- R. Law, S. Qi, and D. Buhalis, (2010), Progress in tourism management: A review of website evaluation in tourism research, Tour Manag, 31, 3, 297-313.
- O. Mohammadrezapour, O. Kisi, and F. Pourahmad, (2020), Fuzzy c-means and K-means clustering with genetic algorithm for identification of homogeneous regions of groundwater quality, Neural Comput Appl, 32, 8, 3763-3775.
- A. Matz and A. T. Hermawan, (2020), Customer Loyalty Clustering Model Using K-Means Algorithm with LRIFMQ Parameters, Inform, 5, 2, 54-61.
- H. A. Mahdiraji, E. K. Zavadskas, A. Kazeminia, and A. A. Kamardi, (2019), Marketing strategies evaluation based on big data analysis: A CLUSTERING-MCDM approach, Economic Research-Ekonomska Istraživanja, 32, 1, 2882-2898.
- M. A. Syakur, B. K. Khotimah, E. M. S. Rochman, and B. D. Satoto, (2018), Integration k-means clustering method and elbow method for identification of the best customer profile cluster, IOP Conf Ser Mater Sci Eng, 336, 1.
- O. Doğan, E. Ayçin, and Z. A. Bulut, (2018), Customer Segmentation by Using RFM Model and Clustering Methods: A Case Study in Retail Industry, International Journal of Contemporary Economics and Administrative Sciences, 8, 1, 1-19.
- S. Peker, A. Kocyigit, and P. E. Eren, (2017), LRFMP model for customer segmentation in the grocery retail industry: A case study, Marketing Intelligence & Planning.
- M. Ganjali and B. Teimourpour, (2016), Identify Valuable Customers of Taavon Insurance in Field of Life Insurance with Data Mining Approach, UCT Journal of Research in Science, Engineering and Technology, 4, 1, 1-10.
- P. A. Sarvari, A. Ustundag, and H. Takci, (2016), Performance evaluation of different customer segmentation approaches based on RFM and demographics analysis, Kybernetes.
- M. Abirami and V. Pattabiraman, (2016), Data mining approach for intelligent customer behavior analysis for a retail store, The 3rd International Symposium on Big Data and Cloud Computing Challenges, 283-291.
- H. H. Chang, Y. H. Wang, and W. Y. Yang, (2009), The impact of e-service quality, customer satisfaction and loyalty on e-marketing: Moderating effect of perceived value, Total Quality Management and Business Excellence, 20, 4, 423-443, Apr. [CrossRef]
- M. Mohammadian and I. Makhani, (2016), RFM-Based customer segmentation as an elaborative analytical tool for enriching the creation of sales and trade marketing strategies, International Academic Journal of Accounting and Financial Management, 3, 6, 21-35.
- Z. You, Y.-W. Si, D. Zhang, X. Zeng, S. Leung, and T. Li, (2015), A decision-making framework for precision marketing, Expert Syst Appl, 42, 7, 3357-3367.
- D. Dimitrovski and A. Todorovic, (2015), Clustering wellness tourists in spa environment, Tour Manag Perspect, 16, 259-265, Accessed: Mar. 02, 2025, [Online]. Available: https://www.sciencedirect.com/science/article/pii/S2211973615300040.
- J. T. Wei, M. C. Lee, H. K. Chen, and H. H. Wu, (2013), Customer relationship management in the hairdressing industry: An application of data mining techniques, Expert Syst Appl, 40, 18, 7513-7518.
- S. H. Liao, Y. J. Chen, and M. Y. Deng, (2010), Mining customer knowledge for tourism new product development and customer relationship management, Expert Syst Appl, 37, 6, 4212-4223.
- S. M. Hosseini, A. Maleki, and M. R. Gholamian, (2010), Cluster analysis using a data mining approach to develop CRM methodology to assess customer loyalty, Expert Syst Appl, 37, 5259-5264.
- H. A. Mahdiraji, E. Kazimieras Zavadskas, A. Kazeminia, and A. Abbasi Kamardi, (2019), Marketing strategies evaluation based on big data analysis: A CLUSTERING-MCDM approach, Economic Research-Ekonomska Istraživanja, 32, 1, 2882-2898, Jan. [CrossRef]
- W. Y. Loh and Y. S. Shih, (1997), Split selection methods for classification trees, Statistica Sinica, 815-840.
- G. H. Laursen, (2011), Business analytics for sales and marketing managers: How to compete in the information age, 41, John Wiley & Sons.
- J. T. Wei, S. Y. Lin, and H. H. Wu, (2010), A review of the application of the RFM model, African Journal of Business Management, 4, 19, 4199.
- R. Kahan, (1998), Using database marketing techniques to enhance your one-to-one marketing initiatives, Journal of Consumer Marketing, 15, 5, 491-493.
- J. Miglautsch, (2000), Thoughts on RFM scoring, Journal of Database Marketing & Customer Strategy Management, 8, 1, 67-72.
- P. Baecke and D. Poel, (2011), Data augmentation by predicting spending pleasure using commercially available external data, J Intell Inf Syst, 36, 3, 367-383.
- P. Hanafizadeh and M. Mirzazadeh, (2011), Visualizing market segmentation using self-organizing maps and the Fuzzy Delphi method-ADSL market of a telecommunication company, Expert Syst Appl, 38, 1, 198-205.
- A. Mesforoush and M. J. Tarokh, (2013), Customer profitability segmentation for SMEs case study: Network equipment company, International Journal of Research in Industrial Engineering, 2, 1, 30-44.
- T. Calinski and J. Harabasz, (1974), A dendrite method for cluster analysis, Commun Stat Theory Methods, 3, 1, 1-27. [CrossRef]
- D. L. Davies and D. W. Bouldin, (1979), A Cluster Separation Measure, IEEE Trans Pattern Anal Mach Intell, PAMI-1, 2, 224-227. [CrossRef]
- X. Zhang, W. Gong, and Y. Kawamura, (2004), Customer behavior pattern discovering with web mining, Asia-Pacific Web Conference, 844-853.
- S. Ramasamy and K. Nirmala, (2020), Disease prediction in data mining using association rule mining and keyword-based clustering algorithms, International Journal of Computers and Applications, 42, 1, 1-8.
- P. Yoon and C.-L. Hwang, (1995), Multiple attributes decision making: An introduction, 31, 8, Sage Publications.
- M. A. Alao, T. R. Ayodele, A. S. O. Ogunjuyigbe, and O. M. Popoola, (2020), Multi-criteria decision-based waste to energy technology selection using entropy-weighted TOPSIS technique: The case study of Lagos, Nigeria, Energy, 117675.
- Y. Wang, Z. Wen, and H. Li, (2020), Symbiotic technology assessment in iron and steel industry based on entropy TOPSIS method, J Clean Prod, 120900.
- J. Rezaei, (2015), Best-worst multi-criteria decision-making method, Omega (Westport), 53, 49-57.
- S. Guo and H. Zhao, (2017), Fuzzy best-worst multi-criteria decision-making method and its applications, Knowl Based Syst, 121, 23-31.
- M. Khalilzadeh, L. Katoueizadeh, and E. K. Zavadskas, (2020), Risk identification and prioritization in banking projects of payment service provider companies: An empirical study, Frontiers of Business Research in China, 14, 1, 1-27.
- M. Khajvand and M. J. Tarokh, (2011), Estimating customer future value of different customer segments based on adapted RFM model in retail banking context, Procedia Comput Sci, 3, 1327-1332, Accessed: Mar. 04, 2025.
- P. Kotler, (1973), Atmospherics as a marketing tool, Journal of Retailing, 49, 4, 48-64, Accessed: Mar. 04, 2025.
- A. Kasprova, (2020), Customer Lifetime Value for Retail Based on Transactional and Loyalty Card Data, Ukrainian Catholic Institution.
- Z. Kahreh, A. Shirmohammadi, and M. Kahreh, (2017), Explanatory study towards analysis the relationship between Total Quality Management and Knowledge Management, Procedia-Social and Behavioral Sciences, 600-604, Accessed: Mar. 04, 2025.
- F. F. Reichheld and J. Sasser, (1996), Zero defections: Quality comes to services, Harv Bus Rev, 68, 5, 105-111, Accessed: Mar. 04, 2025.
- C. Gurau and A. Ranchhod, (2002), How to calculate the value of a customer–Measuring customer satisfaction: A platform for calculating, predicting and increasing customer profitability, Journal of Targeting, Measurement & Analysis for Marketing, 10, 3, 203, Accessed: Mar. 04, 2025.
Figure 1.
Data Mining Techniques (Source: [25])
Figure 1.
Data Mining Techniques (Source: [25])
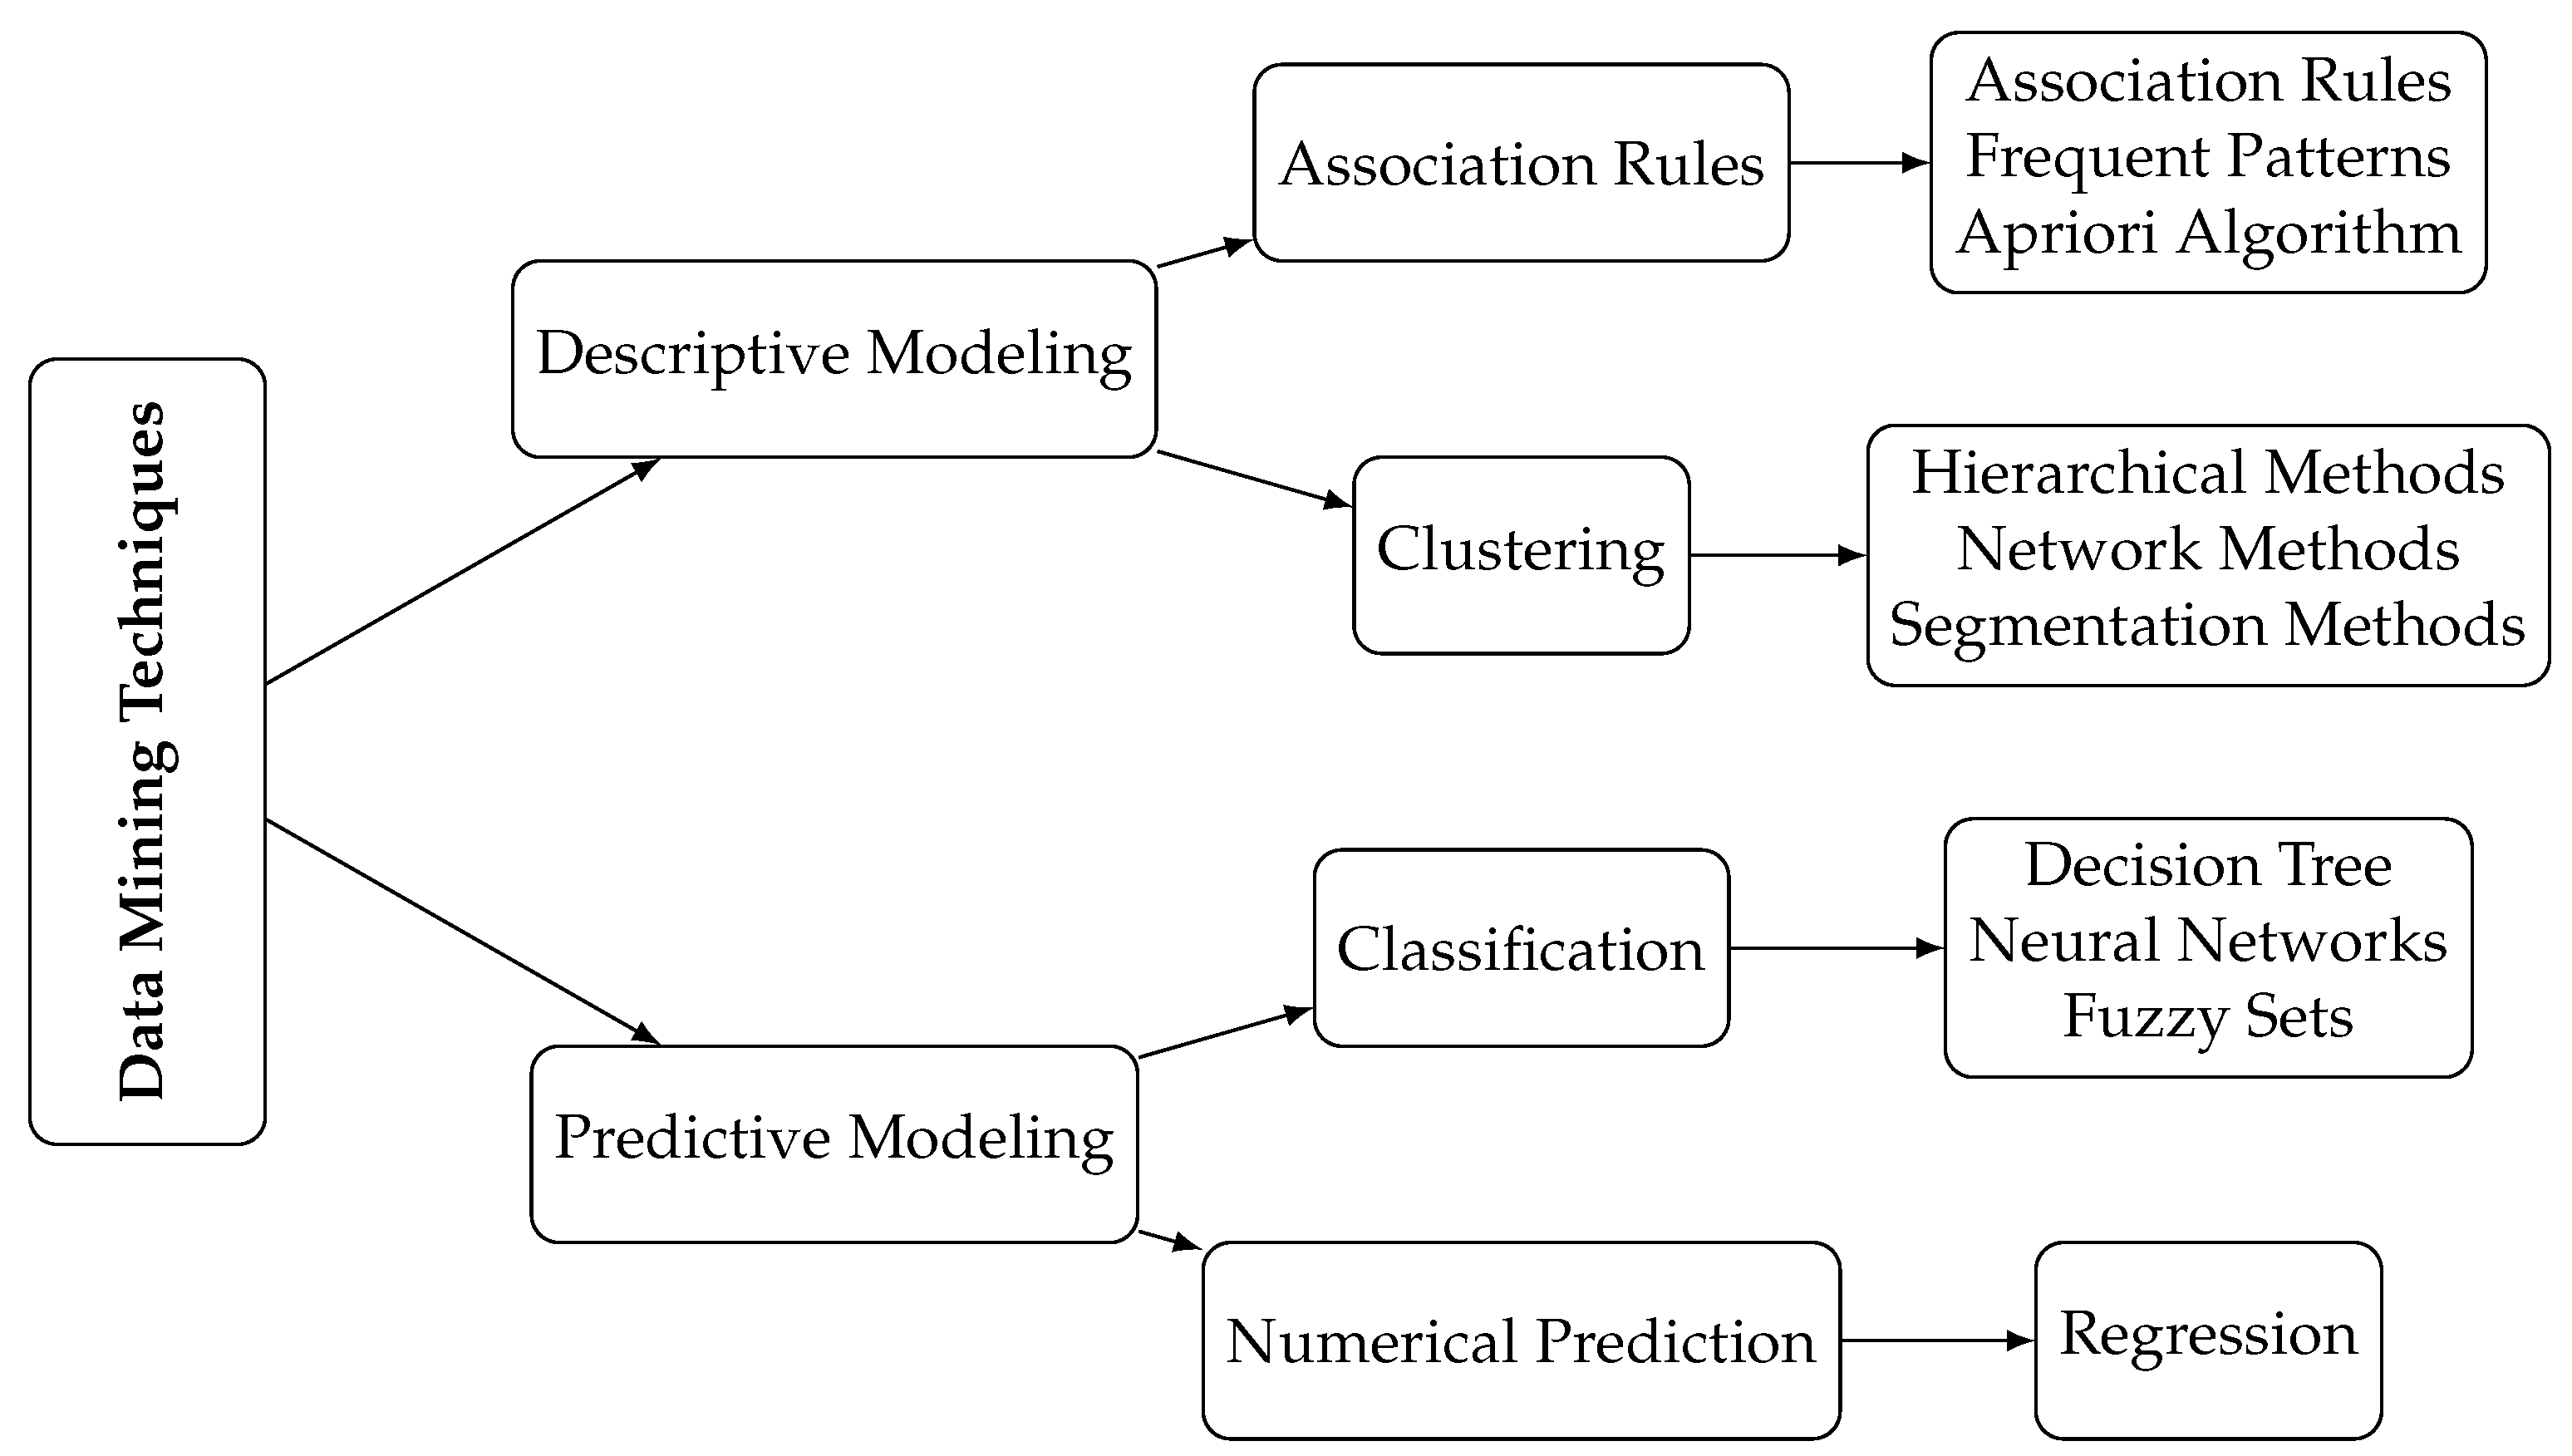
Table 5.
Attributes of Clusters.
| Attributes | NC | LC | CBC | PC | BC | LoC |
|---|---|---|---|---|---|---|
| RMD scores | R↑M↓D↓ | R↑M↑D↑ | R↑M↓D↑ | R↓M↑D↓ | R↓M↓D↑ | R↓M↓D↓ |
| N | 579 (52.3%) | 24 (2.16%) | 81 (7.31%) | 26 (2.34%) | 315 (28.45%) | 81 (7.31%) |
| Gender | Male (68%) | Male & Female (50%-50%) | Male (69%) | Male & Female (50%-50%) | Male (65%) | Male (66%) |
| Age group | 21-30 (26%) | 41-50 (41%) | 31-40 (28%) | 31-40 (38%) | 31-40 (28%) | 21-30 (27%) |
| Nationality | Iraqi (24%) | Iraqi (45%) | Chinese (17.3%) | Iraqi & Chinese (15.3%-15.3%) | Iraqi (23%) | Iraqi (18.5%) |
| Travel companion | Alone (68.22%) | Two people (20%) | Two (38.2%) | Alone (38%) | Alone (65.7%) | 1 (51.1%) |
| Job | Freelance (64.7%) | Freelance (41.6%) | Freelance (39.5%) | Employee (38%) | Freelance (62.2%) | Tourist (72.8%) |
| Travel intentions | Tourism (58.5%) | Tourism (43%) | Tourism (49.38%) | Office work (34.6%) | Office work (34.9%) | Tourism (50.6%) |
| Duration (days) | 1 (100%) | 7 (33.33%) | 4 (44%) | 1 (50%) | 2 (74.3%) | 1 (76.5%) |
Note: NC: New Customers, LC: Loyal Customers, CBC: Collective Buying Customers, PC: Potential Customers, BC: Business Customers, LoC: Lost Customers
Table 6.
Association rule results
| Clusters | Rule | Confidence | Support |
|---|---|---|---|
| New customers | [male → Iraqi, freelance] | 94.5% | 16.5% |
| [tourism → tourist] | 93.5% | 11.3% | |
| Loyal customers | [freelance → Iraqi, men] | 100% | 12.5% |
| [tourism → tourist] | 100% | 12.5% | |
| Collective Buying Customers | [men → freelance, 41-50] | 100% | 11.11% |
| [tourism → Chinese, 31-40] | 100% | 11.11% | |
| Potential customers | [men → Chinese] | 100% | 15.3% |
| [employee → women, 31-40, office work] | 83.87% | 23.4% | |
| Business customers | [men → Iraqi, freelance] | 94.11% | 10.7% |
| [men → office work, Freelance] | 100% | 12.5% | |
| Lost customers | [tourism → 61-90, tourist] | 88% | 12.3% |
Table 7.
CLV Ranking
| Clusters | Cluster Ranking By TOPSIS | N | D | M | R | CLV | CLV Ranking |
|---|---|---|---|---|---|---|---|
| C1 | 0 | 52.3 | 0.009 | 0.012 | 0.33 | 0.09 | CLV4 |
| C2 | 0.86 | 2.16 | 0.66 | 0.7 | 0.3 | 0.59 | CLV1 |
| C3 | 0.13 | 7.3 | 0.12 | 0.1 | 0.25 | 0.13 | CLV2 |
| C4 | 0.21 | 2.34 | 0.07 | 0.11 | 0.001 | 0.07 | CLV3 |
| C5 | 0.12 | 28.45 | 0.11 | 0.04 | 0.097 | 0.05 | CLV5 |
| C6 | 0.14 | 7.31 | 0.01 | 0.02 | 0.008 | 0.01 | CLV6 |
Disclaimer/Publisher’s Note: The statements, opinions and data contained in all publications are solely those of the individual author(s) and contributor(s) and not of MDPI and/or the editor(s). MDPI and/or the editor(s) disclaim responsibility for any injury to people or property resulting from any ideas, methods, instructions or products referred to in the content. |
© 2025 by the authors. Licensee MDPI, Basel, Switzerland. This article is an open access article distributed under the terms and conditions of the Creative Commons Attribution (CC BY) license (http://creativecommons.org/licenses/by/4.0/).
Copyright: This open access article is published under a Creative Commons CC BY 4.0 license, which permit the free download, distribution, and reuse, provided that the author and preprint are cited in any reuse.


