Submitted:
01 April 2025
Posted:
02 April 2025
You are already at the latest version
Abstract
This study aims to examine the spatiotemporal distribution of air temperature in a Mediterranean region with rugged topography, dominated by anabatic and katabatic breezes. The thermal breeze is studied using data from four fixed Davis-type stations installed in 2022 and 2023, as well as air temperature data from Tinytag sensors. This network allows us to spatialize the thermal breeze on a half-hourly temporal scale. Thermal inversion is measured in the Zahlé Valley, where an average inversion layer of 400 m is observed at the valley floor. The urban heat island (UHI) is studied using satellite imagery, along with fixed and mobile air temperature measurements conducted in 2022 and 2023. A mean difference reaching a maximum of 7.7ºC between urban and rural areas is observed. This difference is confirmed by satellite, fixed, and mobile measurements.
Keywords:
Thermal breeze
; thermal inversion
; UHI
; Zahlé Valley
1. Introduction
Topoclimate refers to local climatic variations influenced by the topographic characteristics of a region, such as relief, altitude, and slope orientation [1]. These factors modify local weather conditions and play a crucial role in the formation of thermal breezes [2]. Thermal breezes, well known for their defined mechanisms (Simpson, 1994; Carrega, 1995; Beltrando et al., 2008),[3,4,5], are winds "of thermal origin and local scale, with horizontal extension ranging from a few hundred meters to several tens of kilometers" [4]. These winds, with low to moderate speeds, control ventilation, can enhance high concentrations of atmospheric pollutants [3, 6, 7], and influence thermal comfort by bringing cool and humid air [8].
In regions with contrasting topography, breezes and thermal inversions are frequent. The characteristics of the relief, such as altitude, slope, and exposure, as well as terrain forms like valleys, strongly influence these local meteorological phenomena [2]. These phenomena can be considered as topoclimates, specific to a local scale and affecting the lower layers of the troposphere in contact with the Earth's surface. Several studies show that thermal breezes play a fundamental role in air dynamics in regions with contrasting topography [9, 10, 11]. In Zahlé, breezes result from the thermal contrast between the surrounding mountains and the Bekaa Valley, regulating ventilation and air temperature distribution. Additionally, thermal inversions are observed at the bottom of the Zahlé Valley, favoring the stagnation of cool air near the surface and forming a thick layer of cold air.
Furthermore, in urban areas, various elements contribute to the UHI, including the thermal properties of construction materials, urban configuration (urban canyons), human activities, and modifications in land cover. Construction materials, often low-reflective, absorb more heat, increasing surface temperatures. Although these materials quickly release heat due to their high re-emission values, common materials like tar, asphalt, brick, and concrete accumulate solar energy during the day and release it at night, making the UHI more intense at night. Urban geometry, with narrow streets and tall buildings forming canyons, reduces air circulation and increases reflective surfaces that trap heat. Anthropogenic factors, such as heat emitted by vehicles and buildings and land cover transformation where porous vegetation is replaced by impermeable materials, hinder evaporative cooling [12, 13]. Compared to the more vegetated countryside of the Zahlé Valley, the urbanized areas of Zahlé, dominated by impermeable surfaces and low albedo, store more heat during the day and release it at night as terrestrial radiation [14, 15]. This additional urban heat becomes concerning during heatwaves, with health impacts [16]. UHI is of interest to many researchers [15, 17, 18, 19, 20, 21], who emphasize the importance of urban design and environmental policies to mitigate UHI effects and improve urban quality of life. Measures such as increasing urban vegetation, using reflective construction materials, and promoting sustainable architecture are essential to reducing UHI impact and adapting to climate change challenges [22, 20]. In the current context of climate change, an increase in these extreme situations is expected in the short and medium term, according to the IPCC [23].
This study aims to analyze the spatiotemporal distribution of air temperature in the urbanized areas of Zahlé, influenced by breezes, thermal inversions, and UHI. To achieve this, we use fixed measurements, mobile measurements, and satellite imagery to spatialize temperature. "Davis" weather stations were installed during the summers of 2022 and 2023, along with Tinytag sensors in the Zahlé region. The collected data allow us to study the characteristics of thermal breezes: speed, direction, and duration. Additionally, mobile air temperature measurement campaigns cover the urban areas of Zahlé and the rural areas of the Zahlé Valley. We also measure vertical air temperature using radiosondes under calm and radiative conditions to study the thermal inversion layer at the valley bottom. Finally, ASTER TIR satellite images are used to spatialize nocturnal surface temperature, providing information on nocturnal UHI. These images, combined with fixed and mobile measurements, help determine nocturnal UHI intensity in the urbanized areas of Zahlé.
2. Location, Materials and Methods
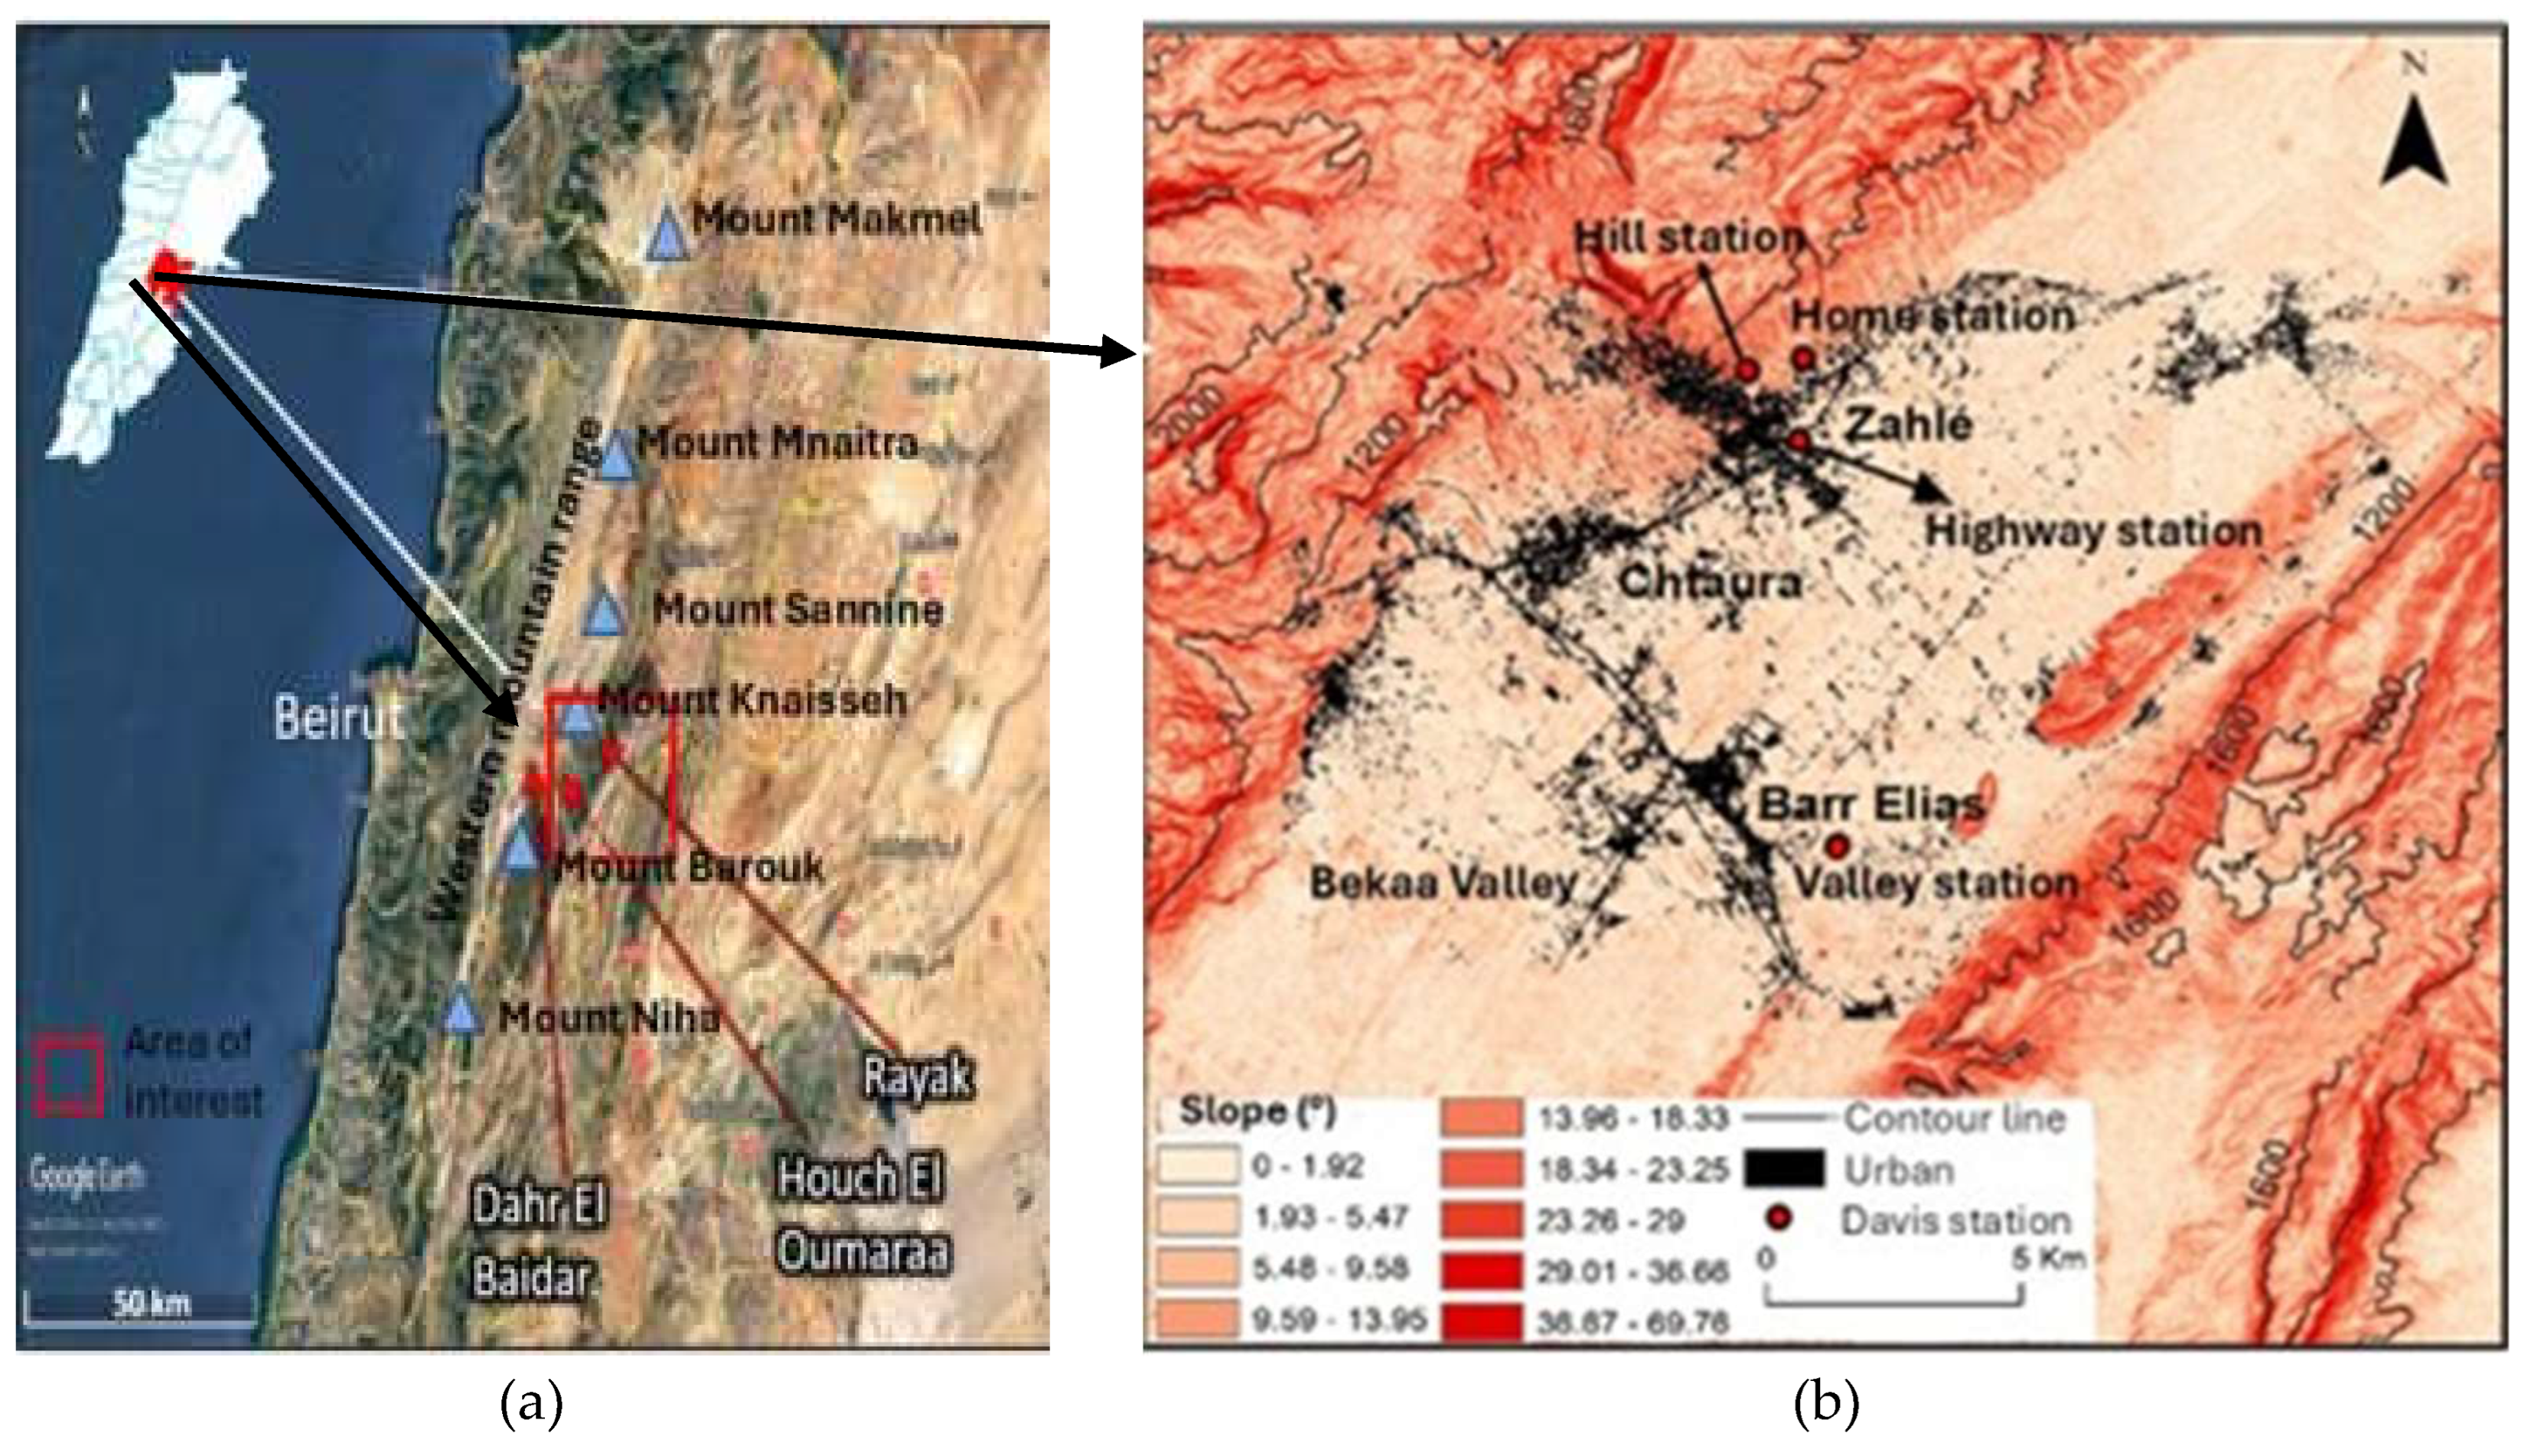
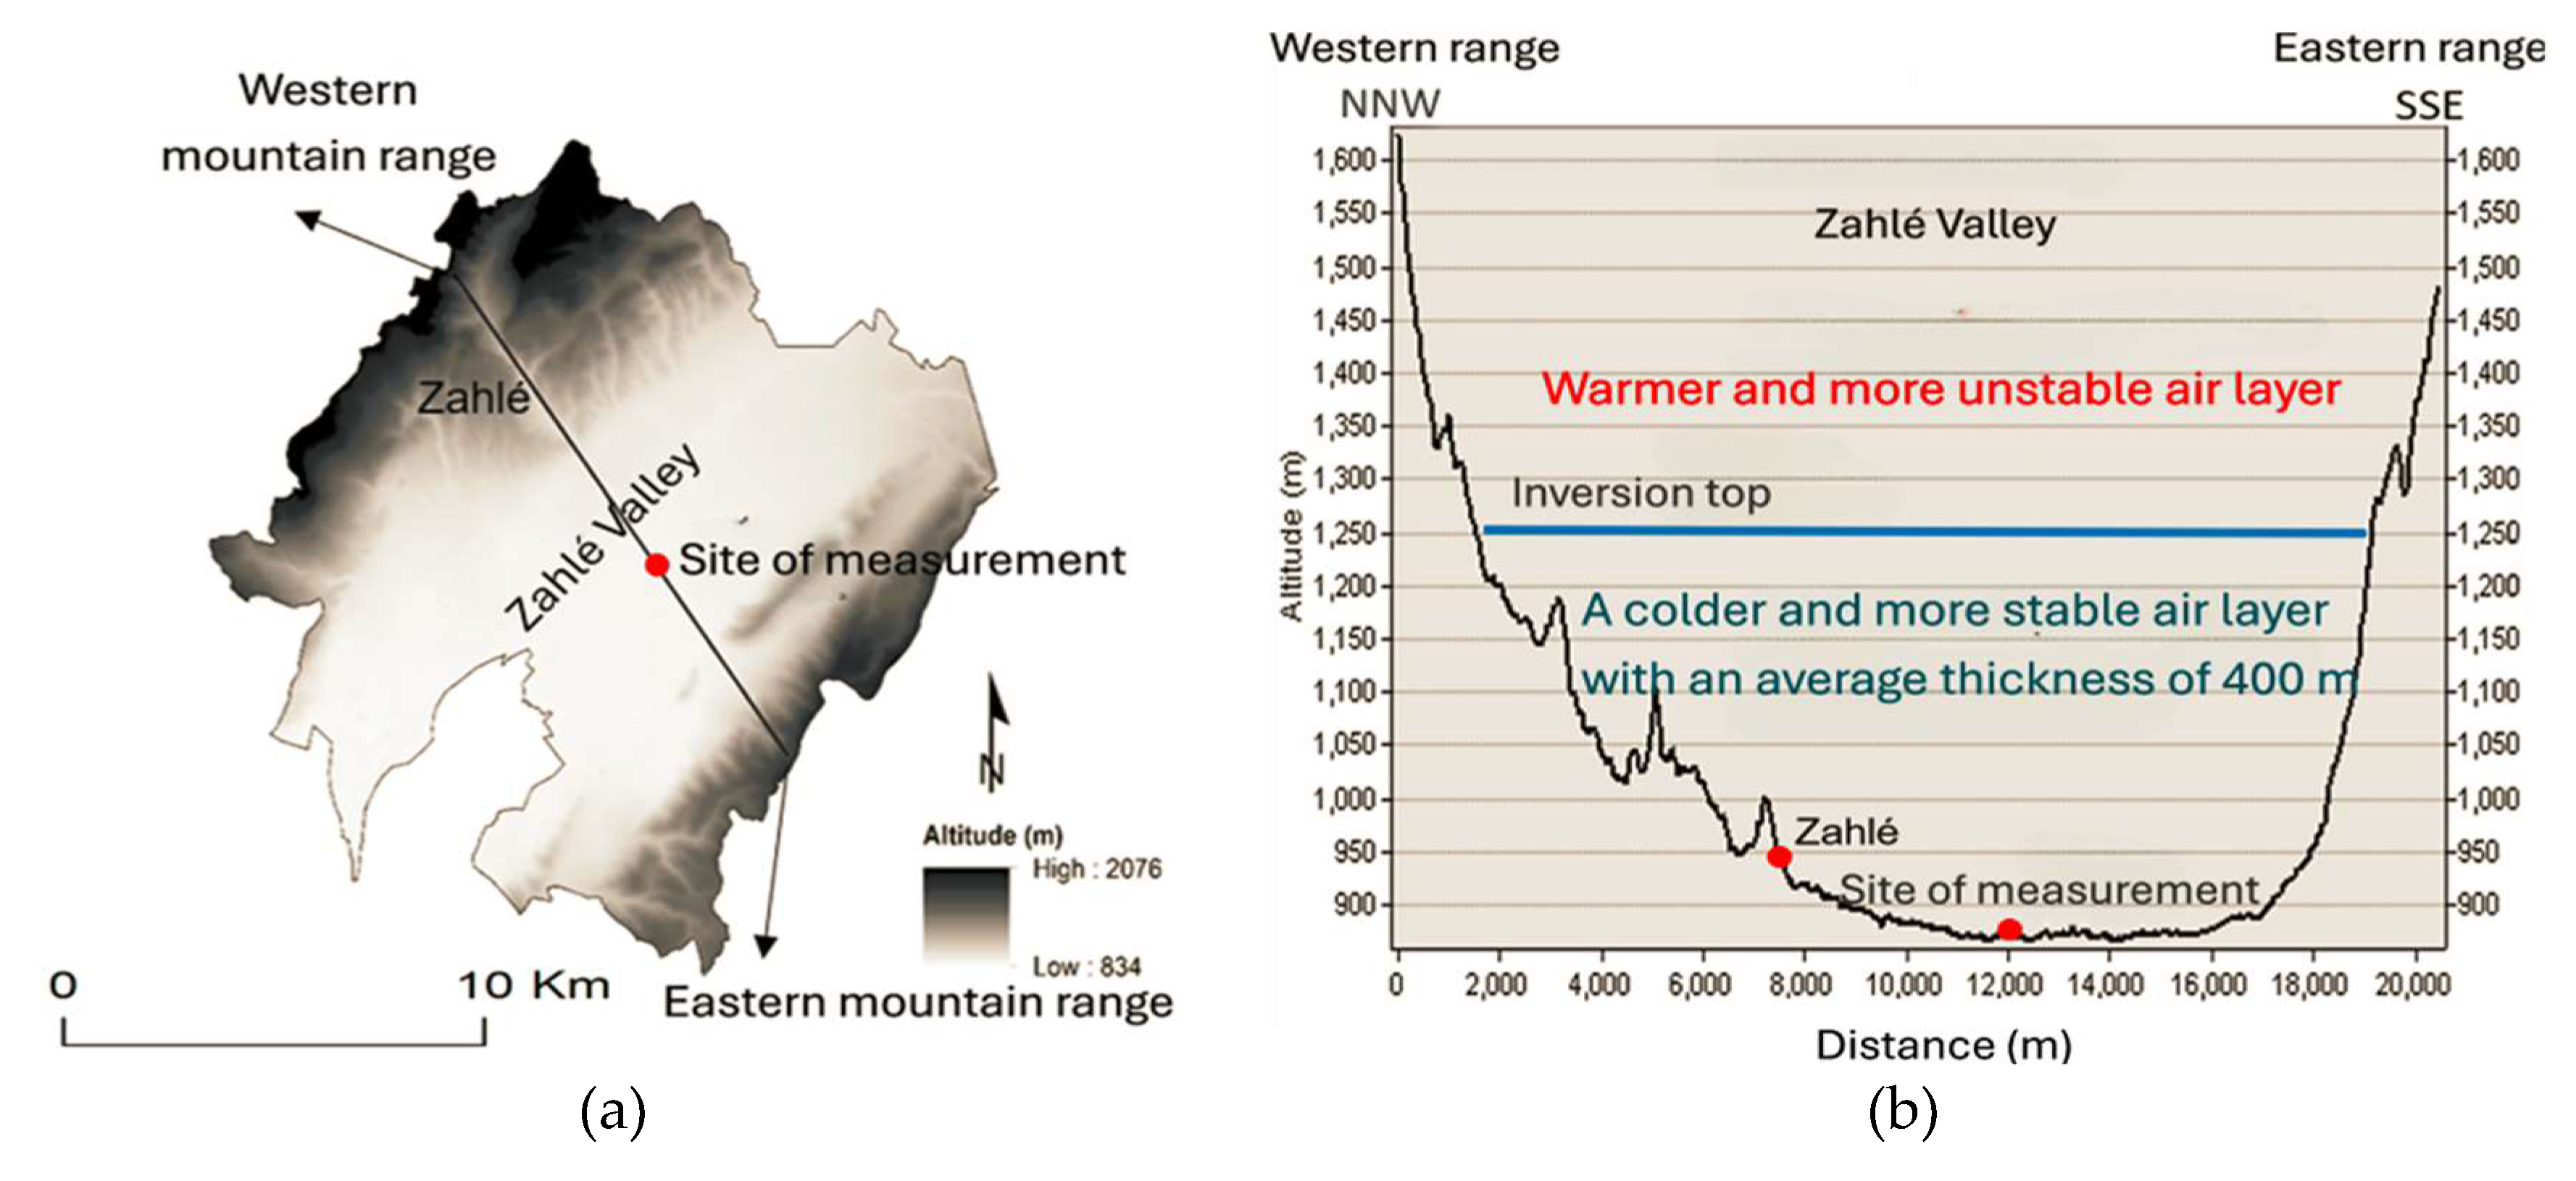
Zahlé is located at 33º50’N and 35º55’E (Fig. 1a). It is the capital of the Bekaa Governorate and stands out as one of Lebanon’s largest cities. The municipality covers 425 square kilometers according to data from the geographical department of the Lebanese Army. More than 30% of this area consists of irrigated agricultural lands. Topographically, the Zahlé region comprises a broad valley, the Bekaa Valley, flanked by two mountain ranges: the Eastern and Western Lebanon Mountains. The terrain is rugged, with elevations ranging from 870 m in the valley to 1,920 m at the peaks of the western mountain range. The valley’s slope is gentle, between 0 and 5 degrees, increasing towards the mountain ranges to the east and west. The eastern slopes of the western chain are steep, with inclines reaching up to 60° and a peak of 1,920 m (Fig. 1b).
Figure 1.
Location (a) and topography (b) of the Zahlé region. Sources: Google Earth and Lebanon's DEM (SRTM image).
Figure 1.
Location (a) and topography (b) of the Zahlé region. Sources: Google Earth and Lebanon's DEM (SRTM image).
First, half-hourly temporal resolution data of wind (speed and direction) and air temperature from 4 Davis stations, installed in the Zahlé region in 2022 and 2023 during the summer season, were used. The precision of the data from the Davis stations is as follows (according to the brochure of the Davis stations available on this site: https://8820531.fs1.hubspotusercontent-na1.net/hubfs/8820531/Vue_Spec.pdf):
• Atmospheric pressure: ± 0.1 hPa
• Dew point temperature: ± 1.5 ℃
• Relative humidity: ± 3%
• Air temperature: ± 0.5 ℃
• Wind direction: ± 3º
• Wind speed: ± 1 m/s
This type of station is frequently used in climatology [24, 4, 6]. These automatic stations are connected to a computer. Initial configurations include data transfer, measurement units, parameters to be measured, and recording frequency. Sensor heights and standard distances from obstacles were adhered to. The anemometer and wind vane were placed 10 meters above the ground, more than 10 meters away from roads, and over 300 meters from any obstacles to avoid the impact of nearby buildings on the measurements. Temperatures were recorded by a probe protected by a white plastic shelter, installed at a height of 2 meters in an open environment. The stations are new, and their calibration has been verified. They were installed for a 14-day period at the same location, and the data were compared against each other without significant discrepancies. The stations are powered by solar panels and batteries.
To select days conducive to thermal breezes, we relied on data recorded by the Davis stations covering the period from 2022 to 2023. Initially, rainy and cyclonic days were eliminated by applying filters on precipitation and atmospheric pressure. Days with atmospheric pressure below 1005 hPa were excluded. Then, days with mountain and valley breezes were identified based on wind direction. We selected days where the wind blows from the 120º-220º sector during the day (at 12:00 PM) and from the 340º-45º sector during the night (at 12 AM). Days where mountain and valley breezes alternate were chosen. In the second step, only days with wind speeds not exceeding 11 m/s were retained. Breeze days correspond to anticyclonic conditions or barometric marshes. This data filtering method was used by several researchers, including [25, 26, 27, 6].
Additionally, Tinytag sensors were used as fixed stations for stationary measurements, as well as for mobile and vertical air measurements, including radiosondes. According to the technical sheet (https://assets.geminidataloggers.com/pdfs/original/3746-tgp-4017.pdf), these sensors have a temperature accuracy of <0.01 ℃. The calibration of these sensors was verified by comparing them with the Davis stations over a 14-day period, with a negligible difference of 0.01 ℃, indicating no correction was necessary.
Mobile surveys were conducted at a height of 2 meters above the ground, at a minimum distance of 5 meters from structures, with an average waiting time of one minute per point. Movement was done by car or motorcycle. The measured parameters were air temperature and wind speed. Mobile surveys during mountain breeze periods took place during radiative nights between 5:30 AM and 7:00 AM, and between 8:30 PM and 9:30 PM. Mobile surveys during valley breeze periods occurred between 12:00 PM and 1:30 PM, and between 4:00 PM and 6:00 PM. These mobile observations covered both urban and peri-urban areas and were conducted over 80 days during the summer seasons of 2022 and 2023.
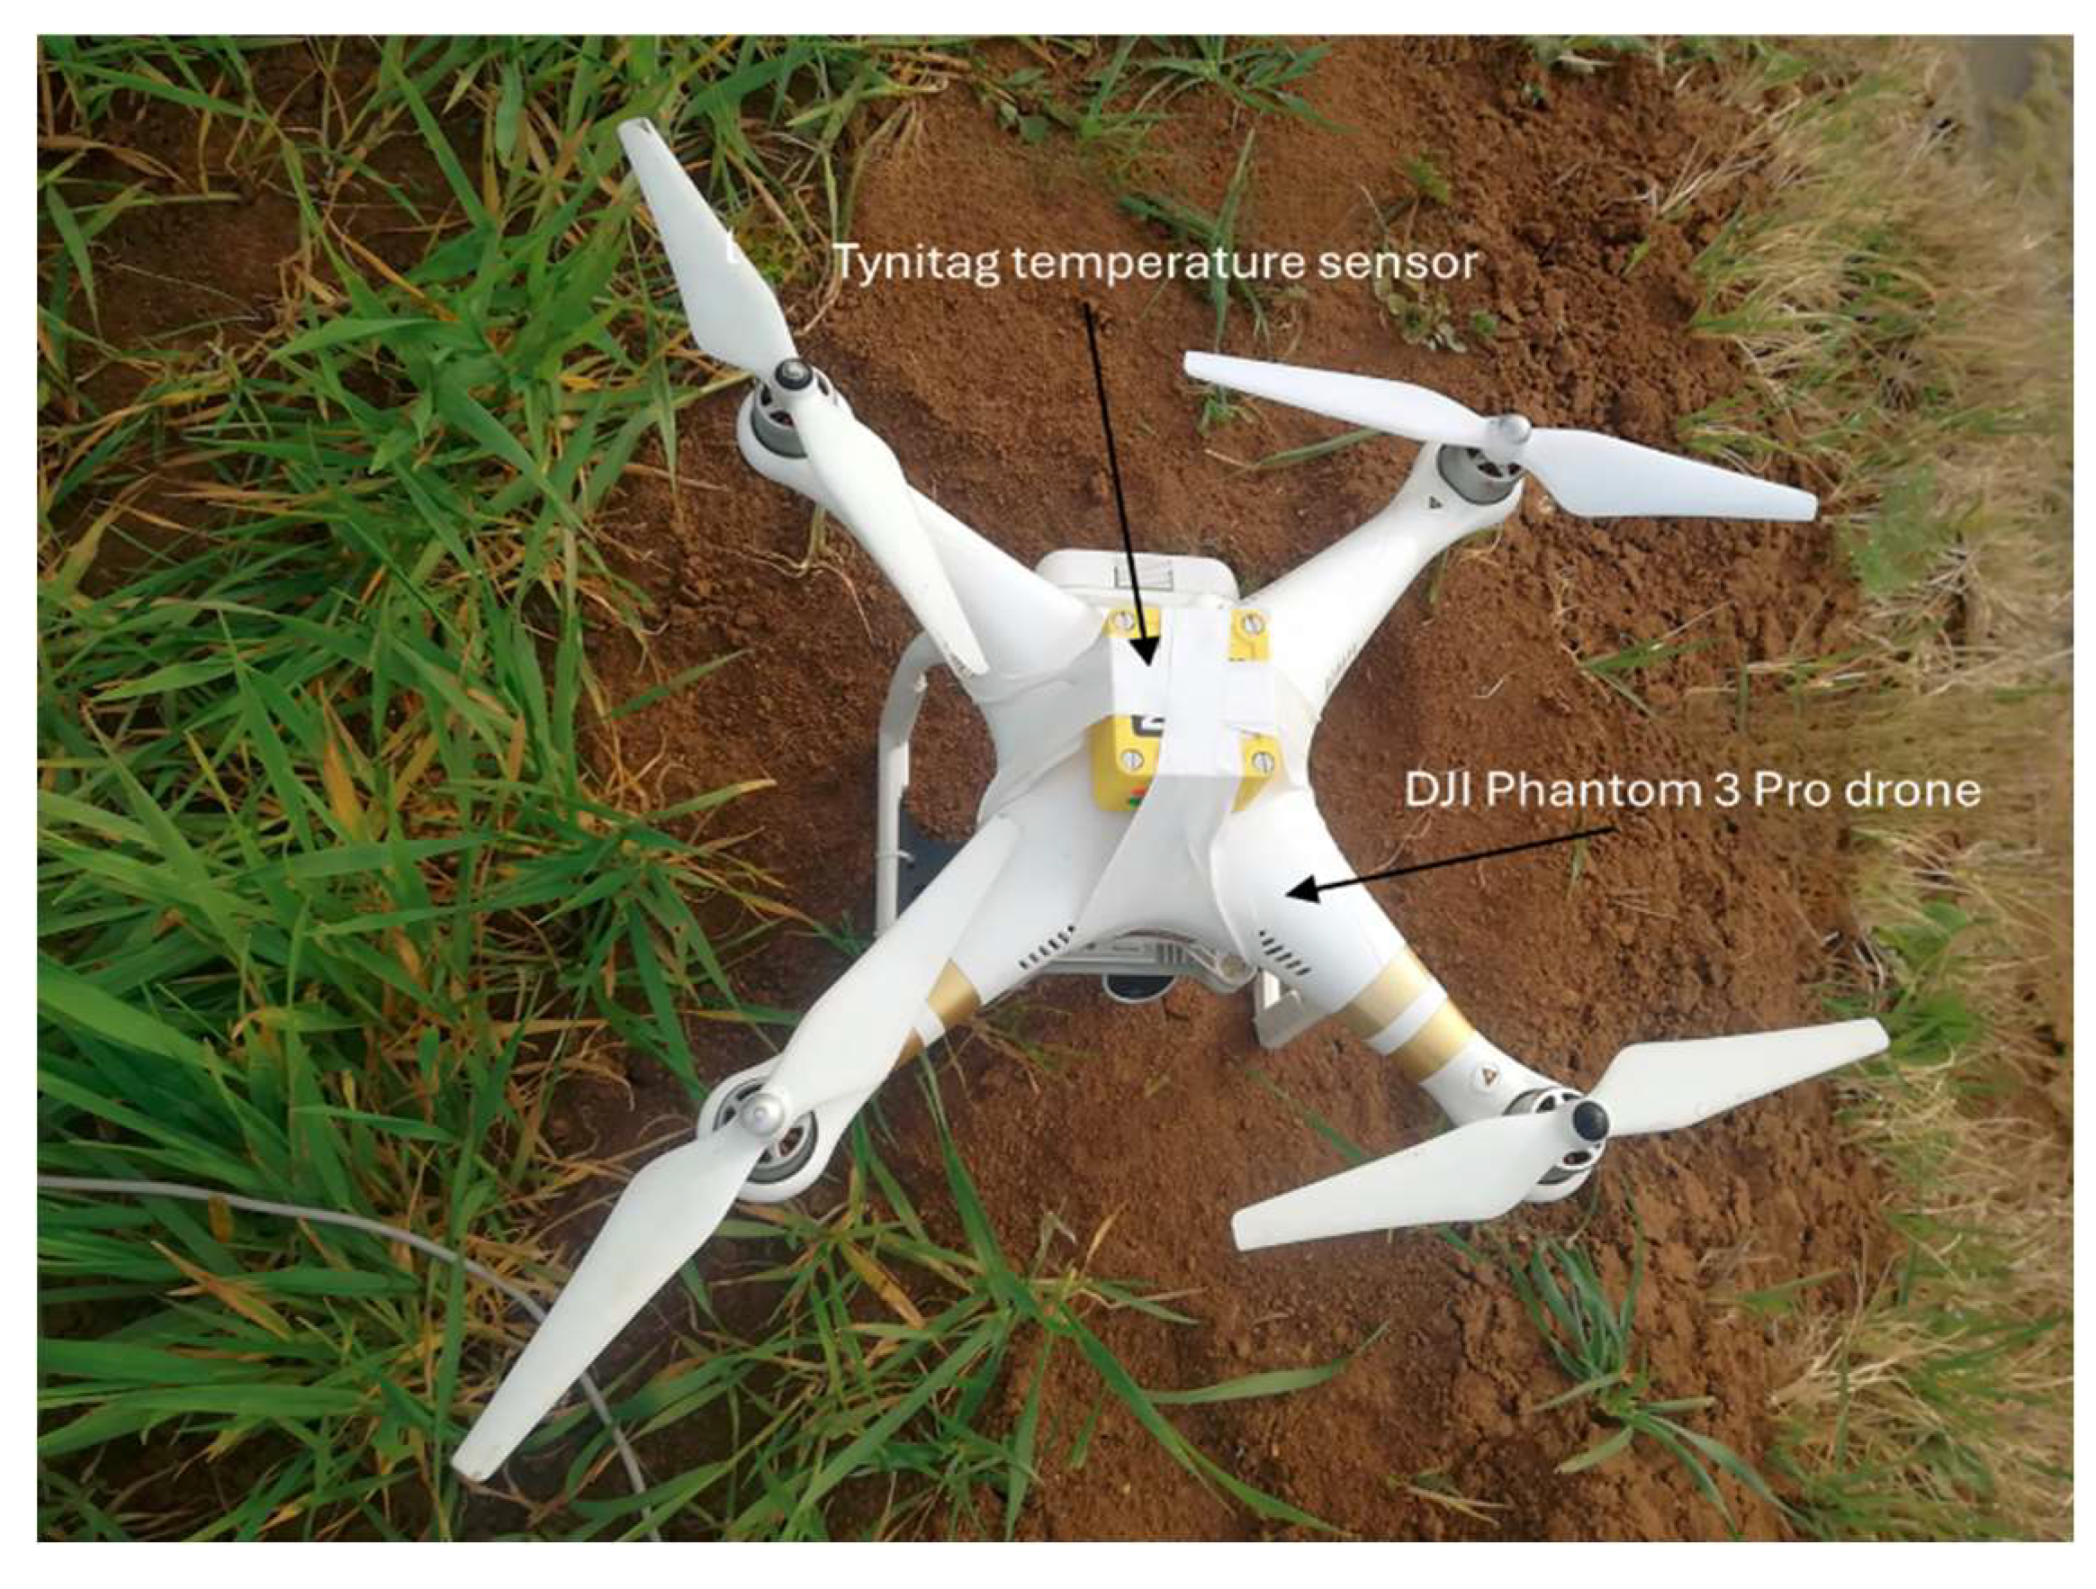
To study thermal inversions in the valley, vertical air temperature measurements were taken using a Tinytag sensor mounted on a "DJI Phantom 3 Pro" drone (Fig. 2). This technique was used by Cordeiro et al. [28] where researchers mounted a Tinytag sensor on a "DJI Mavic" drone to measure vertical atmospheric temperature. After programming the sensor to record temperature every 2 seconds, a flight was performed with a 15-second pause every 20 meters. These data, collected during the summer season under radiative conditions and clear skies, are analyzed to estimate the thickness of the inversion layer.
Figure 2.
Tinytag sensor mounted on a drone, used in the vertical measurement of air temperature (photo by the author).
Figure 2.
Tinytag sensor mounted on a drone, used in the vertical measurement of air temperature (photo by the author).
Moreover, nighttime satellite imagery was used in this study. ASTER images (thermal bands) were used on various dates during the summer seasons of 2022 and 2023. These images allow for the spatialization of the surface thermal field and the delineation of the hottest areas marking an UHI. The processing of ASTER images concerns thermal bands 10, 11, 12, 13, and 14 (8.125-11.65 μm), using 7 steps designed in the "ENVI" software:
1. Radiometric calibration
2. Thermal correction
3. Calculation of brightness temperature using the following equation:
BT = K2 / ln(1 + K1 / L(λ)) [29].
Where K1 and K2 are constants. Their values are shown in the Table 1 below.
4. Calculation of NDVI using the equation:
NDVI = (near infrared - red) / (near infrared + red)
Band 3 is near infrared, and band 2 is the red band in ASTER [30].
5. Calculation of vegetation proportion (Pv) using the equation:
Pv = ((NDVI - NDVImin) / (NDVImax - NDVImin))²
6. Calculation of emissivity using the equation:
E = mPv + n
Where m = 0.004 and n = 0.986 [31].
7. Calculation of surface temperature using the equation:
LST = BT / (1 + (λ * BT / ρ) ln(E)) (Abrams et al., 2015)
Where λ = 11.3, BT = brightness temperature, ρ = 1.438 × 10⁻² mK, E = emissivity.
The surface temperature value is in Kelvin and is converted to ℃ using the following equation:
T(℃) = T(K) - 273.15
The meteorological and satellite data used are presented in the table below:

Table 1.
The meteorological and satellite data used in the study.
| Meteorological Data | |||||||
| Station Name | Coordinates | Data Type | Resolution | Period | |||
| Davis Station "Valley" | 33°45'33.65"N 35°55'43.83"E Bekaa Valley (Rural) |
Wind speed Wind direction Air temperature |
Half hourly | 2022 Summer season |
|||
| Davis Station « Highway » | 33°50'17.12"N 35°55'6.64"E Urban area of Zahlé |
Wind speed Wind direction Air temperature |
Half hourly | 2022 Summer season |
|||
| Davis Station « Hill » | 33°50'59.68"N 35°54'33.55"E Slope Peri-urban |
Wind speed Wind direction Air temperature |
Half hourly | 2022 Summer season |
|||
| Davis Station « Home » | 33°51'10.67"N 35°55'17.01"E Peri-urban |
Wind speed Wind direction Air temperature |
Half hourly | 2023 Summer season |
|||
| Mobile Measurements | Zahlé Region (Urban and rural areas) | Air temperature, wind speed, vertical atmospheric temperature | - | 2022-2023 Summer season |
|||
| Satellite data | |||||||
| Satellite | Band | Spatial Resolution | Spectral Resolution | ||||
| Aster-TIR | Thermal bands (B10 to B14) | 90 m | 8.125 – 11.65 μm | ||||
3. Results
3.1. Thermal Breezes Types and Characteristics
An analysis of the wind direction and speed data recorded every half-hour by the Davis "Home" station installed in the Zahlé region in 2023 reveals the presence of two types of breezes: a daytime anabatic breeze and a nocturnal katabatic breeze. The anabatic breeze primarily blows from the south (180º), but can also come from the SSW, SW, and W (Fig. 3). It ascends the western mountain slopes at a speed of up to 2.6 m/s before reaching the Davis "Home" station (Fig. 4). The katabatic breeze in Zahlé is a very light breeze, characterized by low speed (≤ 0.5 m/s) and a dominant NNE direction (Fig. 3). It descends the western mountain slopes before reaching the Davis "Home" station (Fig. 4). The anabatic breeze starts around 9 AM (local time) and persists until 7 PM. The katabatic breeze occurs during the night, beginning around 9 PM and continuing throughout the night until the morning, around 6 AM. A morning reversal (MR), which can last for 3 hours, separates the two breezes in the morning, during which a direction transition occurs from NNE to S. In contrast, a nocturnal reversal (NR) separates the two breezes during the night, lasting 2 hours, and during which the wind direction changes from SW to NNE.
Figure 3.
Thermal breezes in Zahlé. Representation on a chart showing the wind speed and the wind direction. Half-hourly data from the summer months of the Davis "Home" station installed in 2023 in Zahlé - local time.
Figure 3.
Thermal breezes in Zahlé. Representation on a chart showing the wind speed and the wind direction. Half-hourly data from the summer months of the Davis "Home" station installed in 2023 in Zahlé - local time.
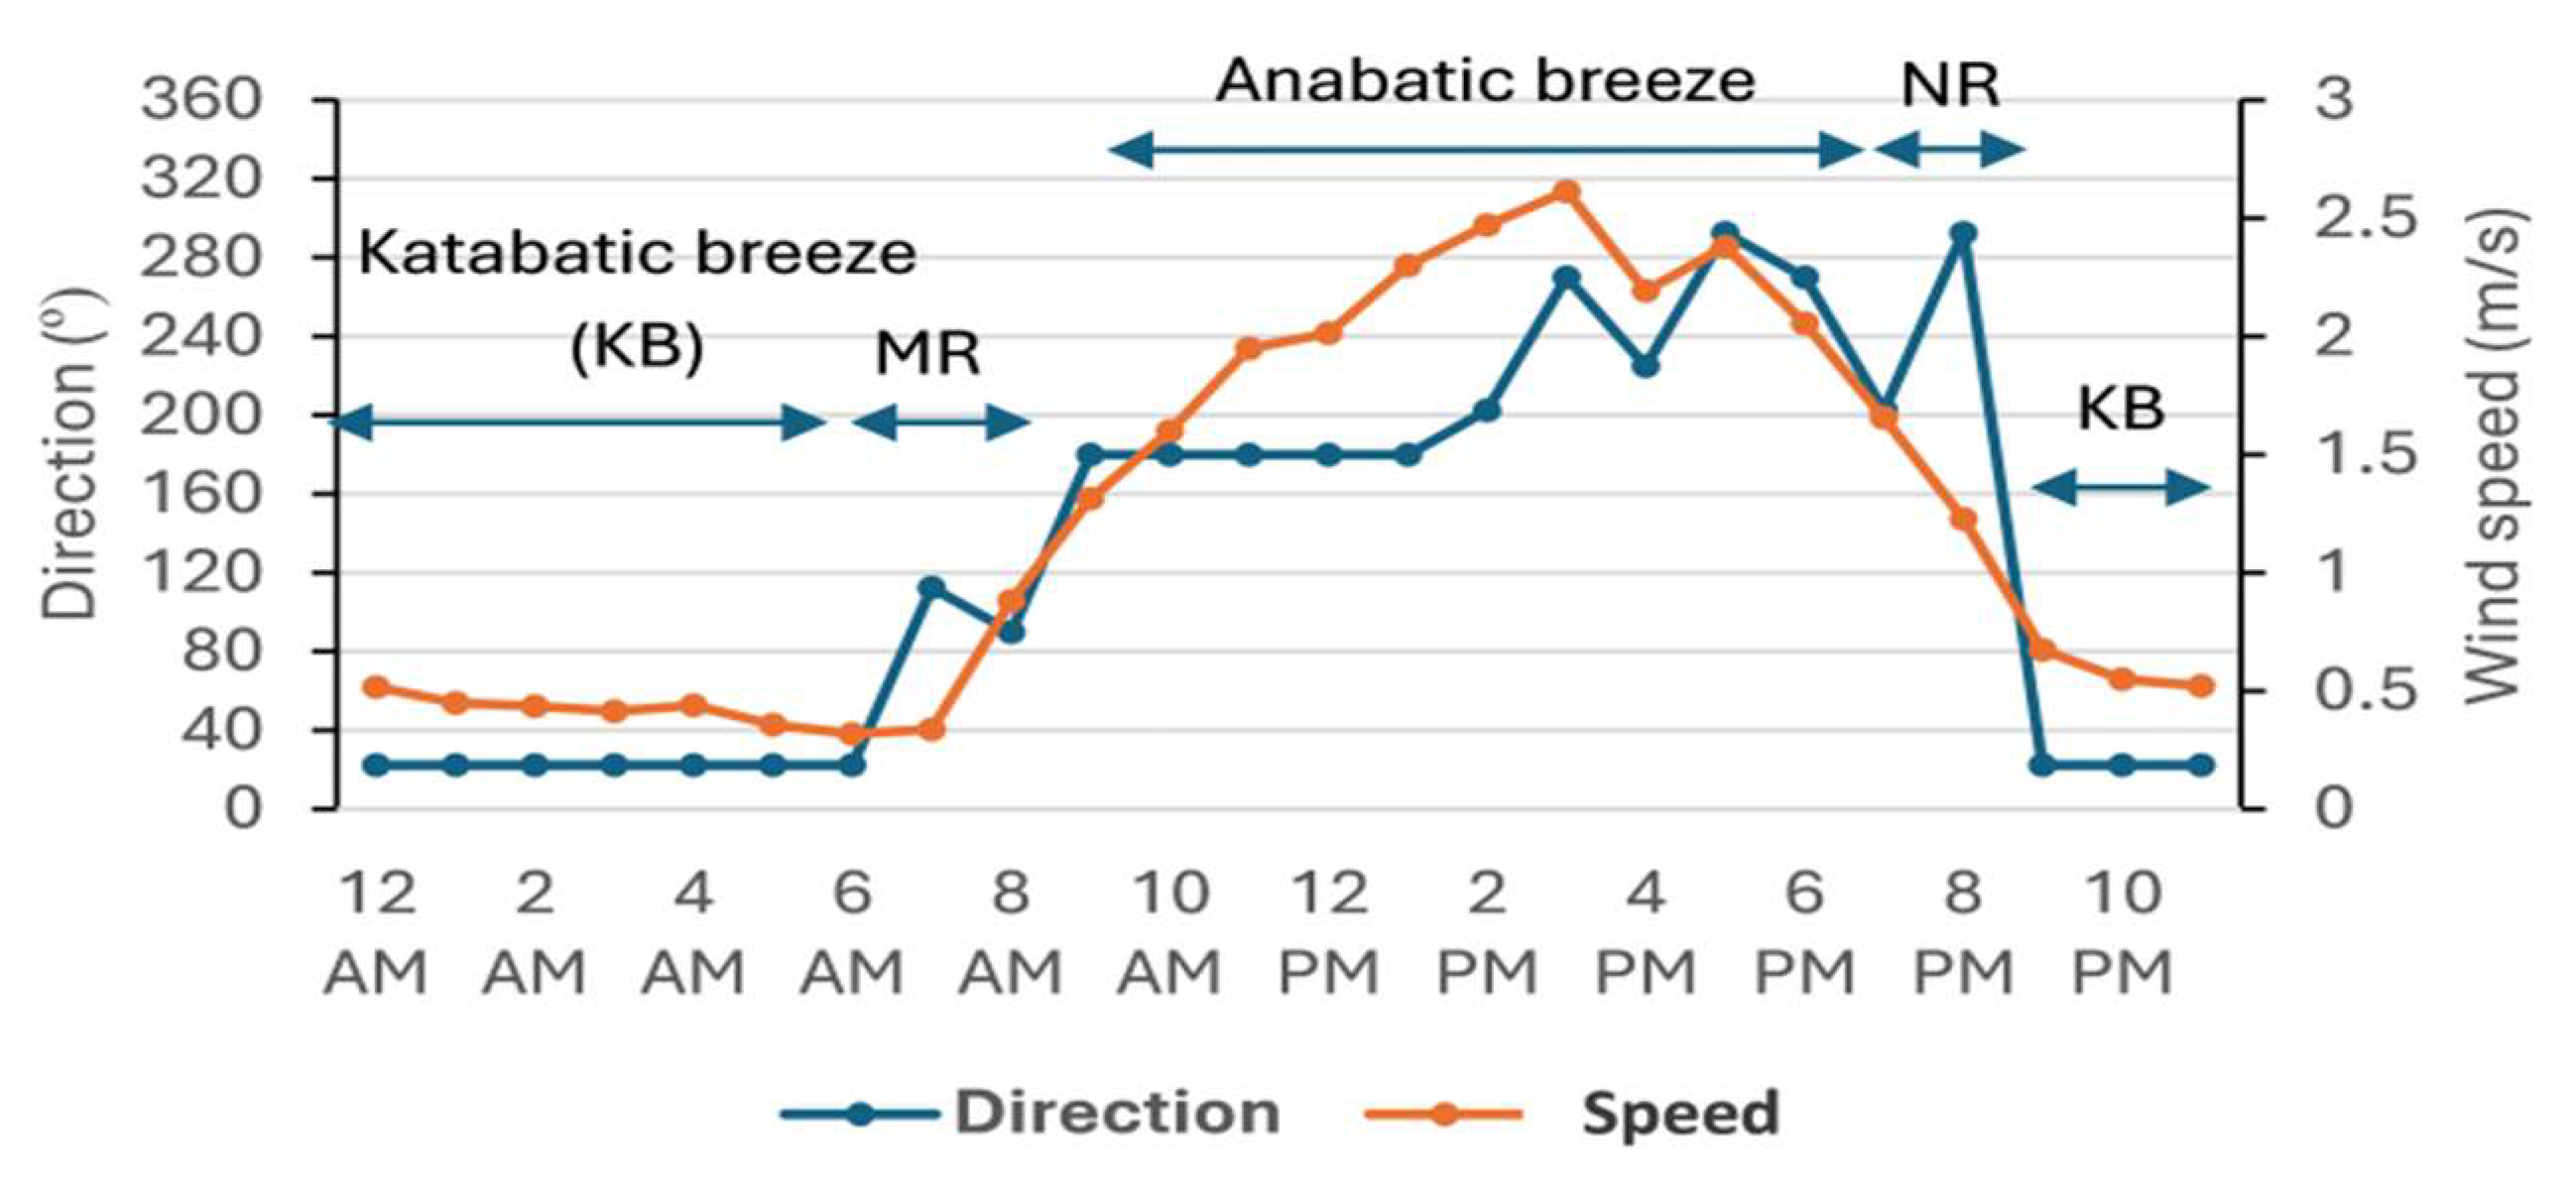
Figure 4.
Anabatic breeze (top) and katabatic breeze (bottom) in Zahlé.
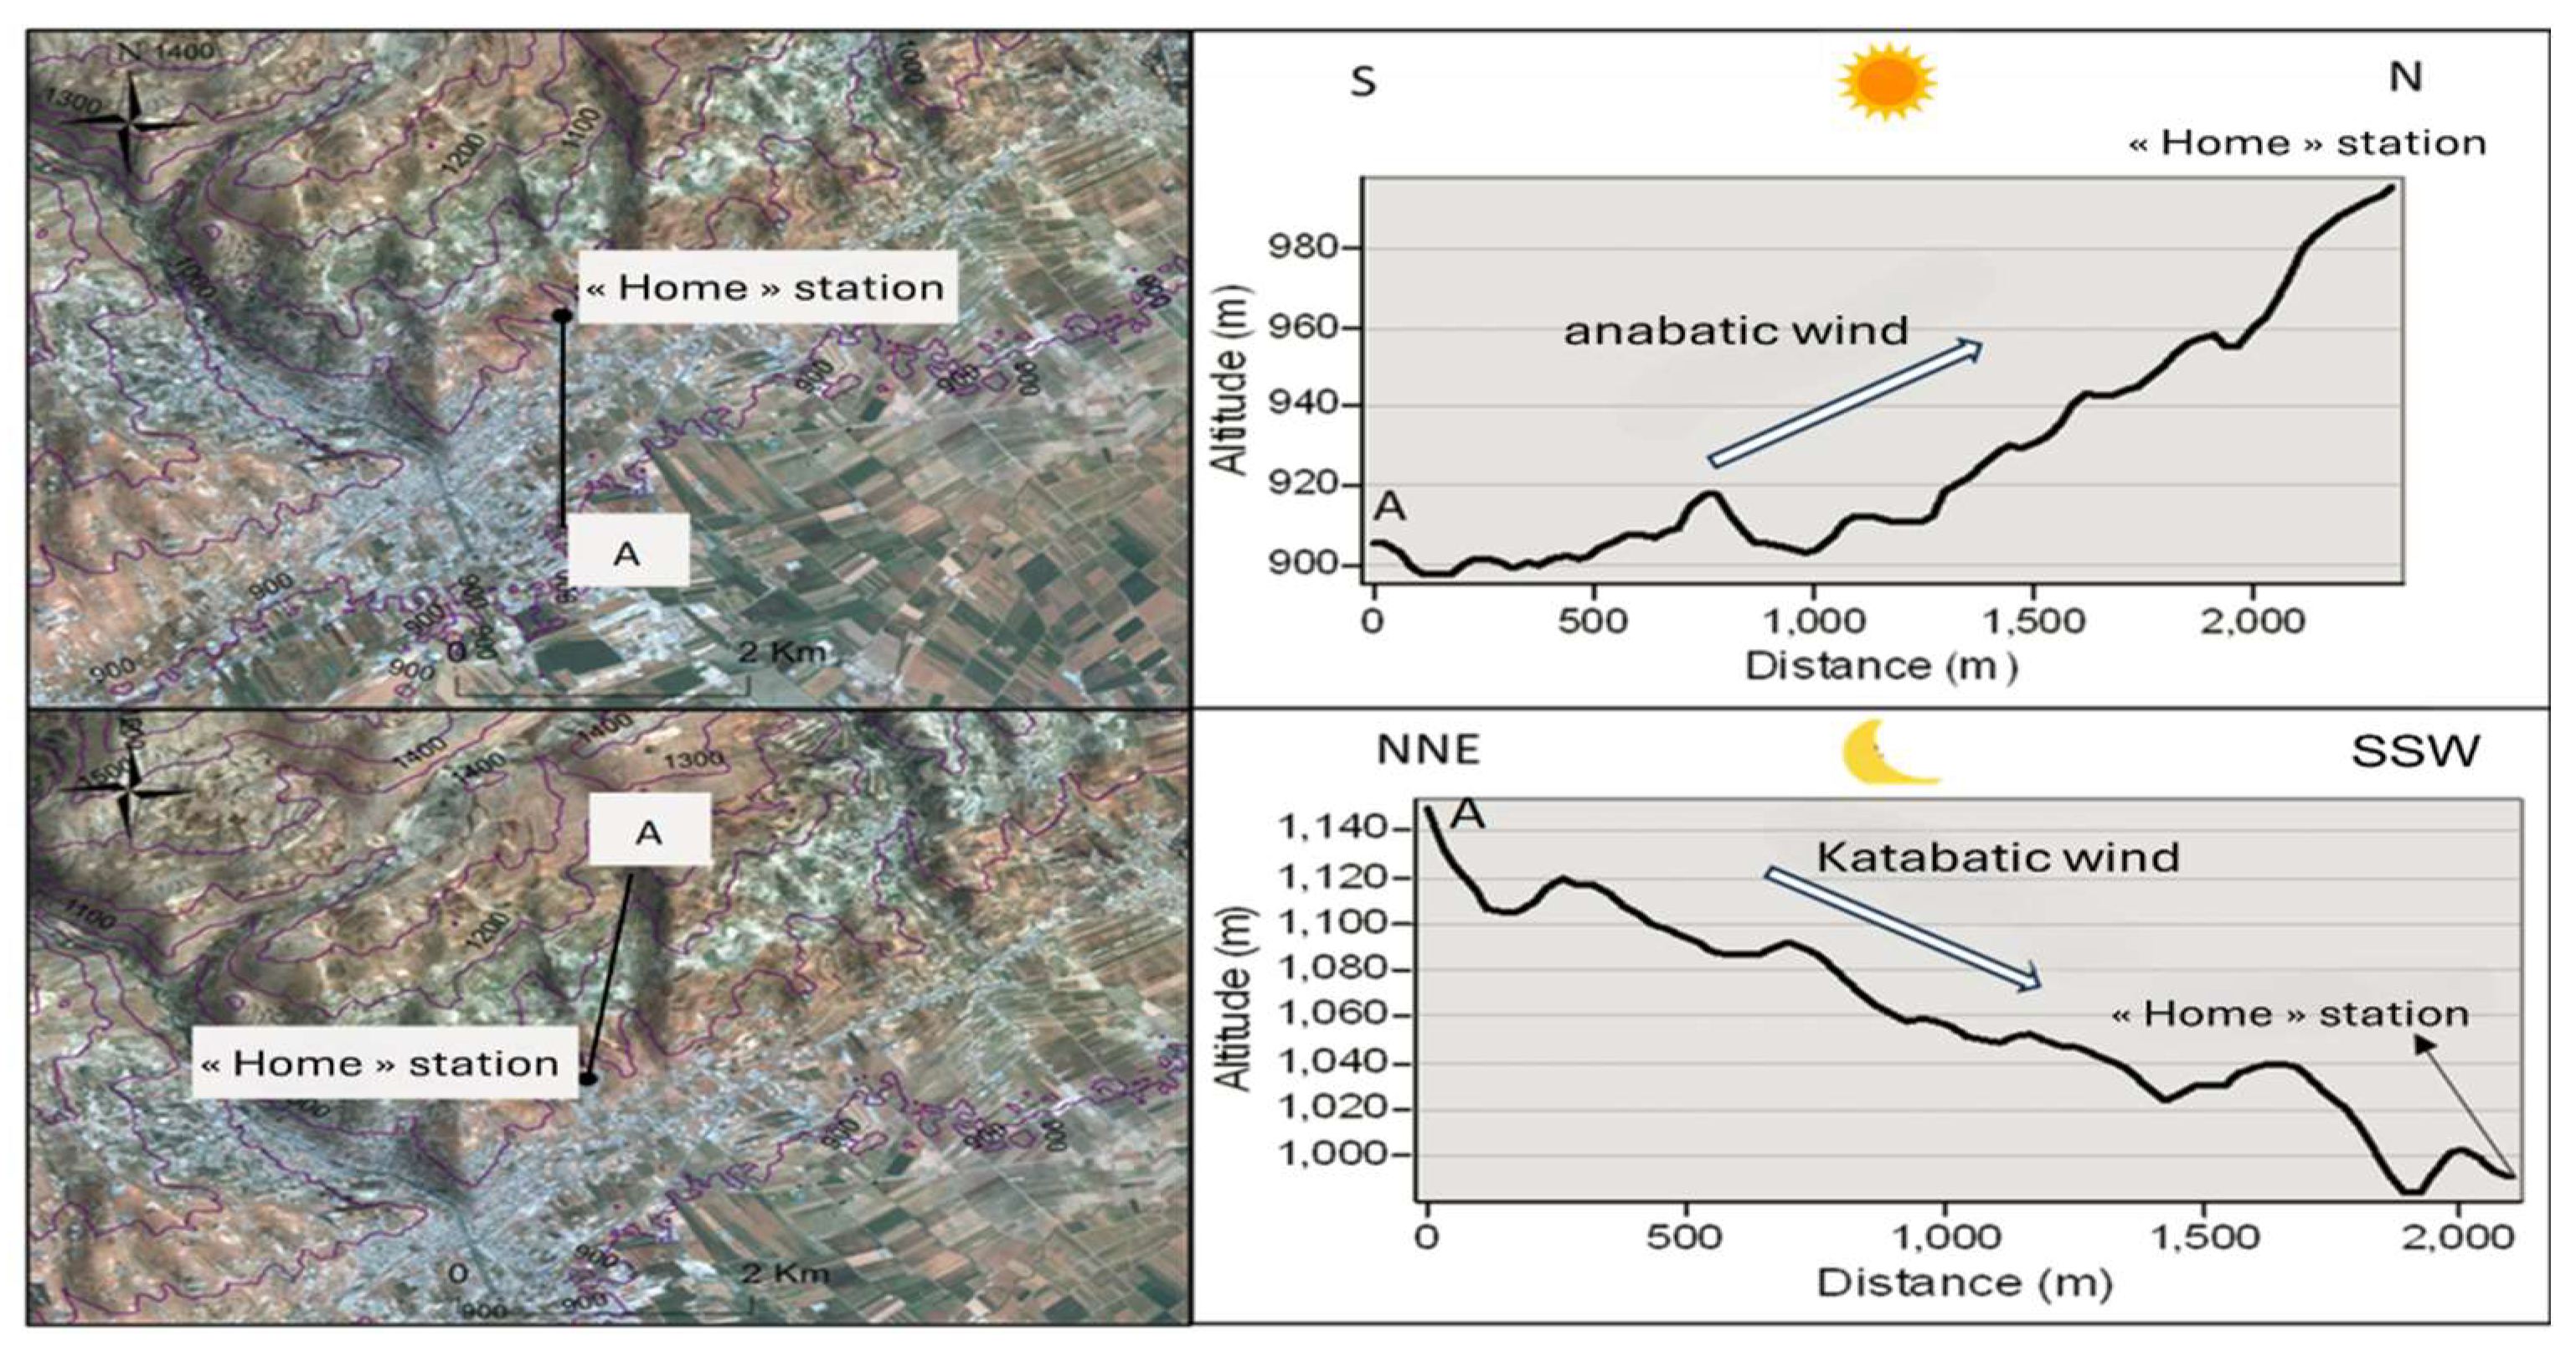
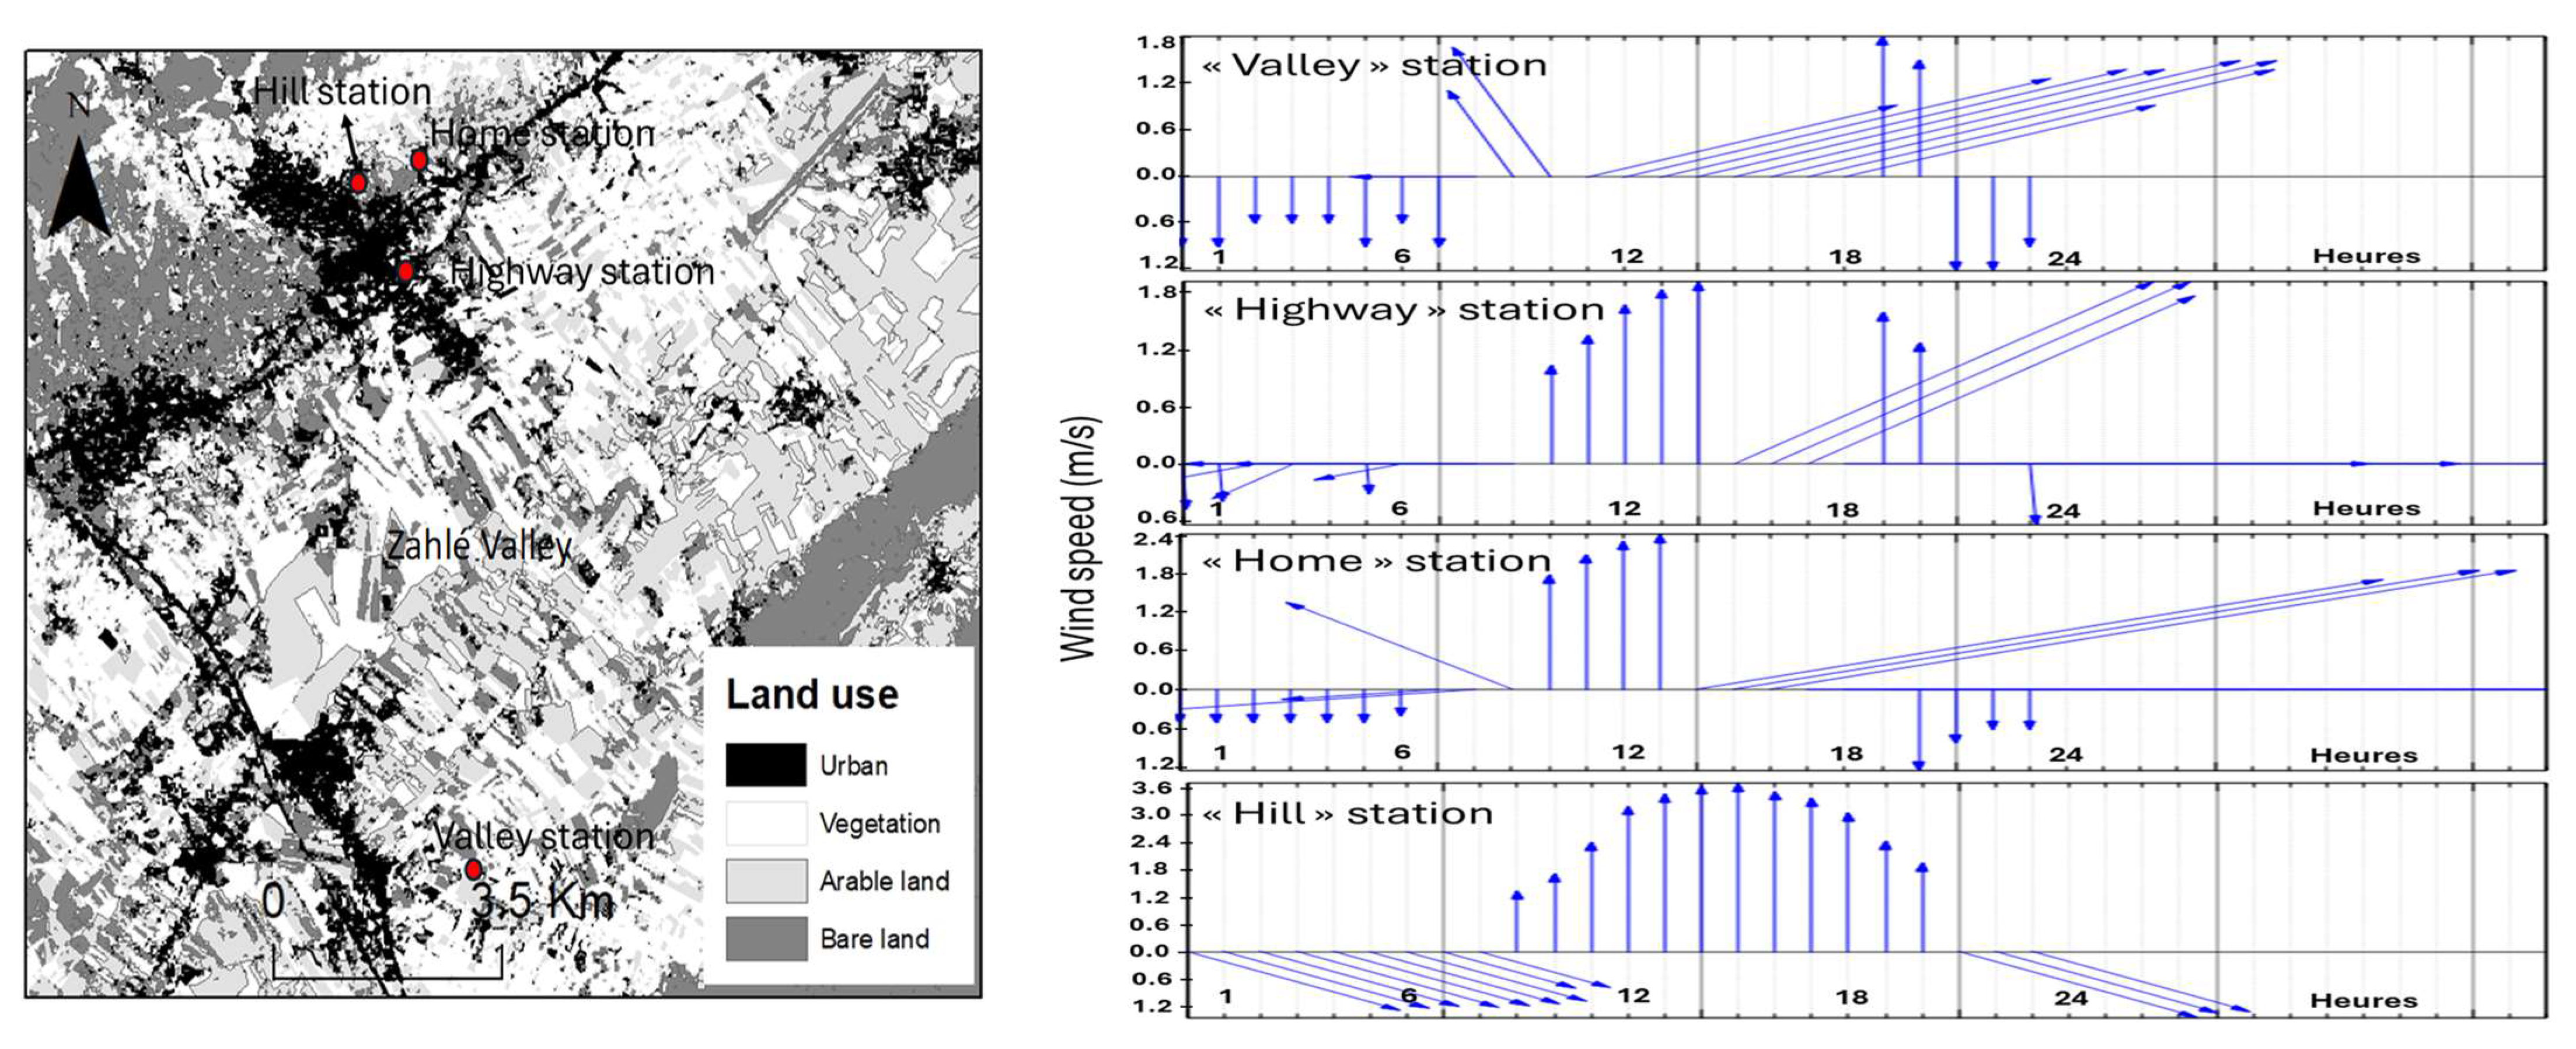
The wind distribution in the Zahlé region mainly depends on the altitude of the terrain. The effect of altitude is studied using measurements taken by fixed Davis meteorological stations, installed 12 meters above the ground at different altitudes. The stations are as follows:
- The Davis "Highway" station, installed in 2022 in the Zahlé urban area. This is an urban station located at an altitude of 914 meters above sea level;
- The Davis "Valley" station, installed in 2022 in the Bekaa Valley, in a rural site within the rural area of the Bar Elias municipality. This station is located at an altitude of 870 meters;
- The Davis "Hill" station, established in 2022 on a peri-urban hill around the Zahlé agglomeration. This station is situated at an altitude of 1010 meters above sea level;
- The Davis "Home" station, installed in 2023 on a slope in a peri-urban site at an altitude of 990 meters above sea level.
The analysis of the average wind speeds recorded at these stations during the summer season (June, July, and August) reveals that the nocturnal katabatic breeze is the strongest at the "Hill" station, located at a higher altitude, blowing from the northwest (NW) at an average speed of 1.2 m/s. This breeze is significantly weaker at the other stations, around 0.6 m/s at the "Home," "Highway," and "Valley" stations. On the other hand, the daytime anabatic breeze is the fastest at the "Hill" station, blowing from the south (S) and reaching a maximum speed of 3.6 m/s at 3 PM. At the "Home" station, this breeze blows from the SE, S, and SSW directions, with a maximum speed of 2.4 m/s. At the "Highway" station, this breeze is slower than at the two stations located on slopes (Home and Hill), with the dominant direction being S. Finally, at the "Valley" station, the daytime breeze is the slowest, with a maximum average speed of 1.8 m/s (Fig. 5).
Figure 5.
Hourly variations of the average wind speed and mean wind direction recorded by 4 Davis weather stations in June 2022 for the hill, valley, and highway stations, and in June 2023 for the house station (direction: blowing toward).
Figure 5.
Hourly variations of the average wind speed and mean wind direction recorded by 4 Davis weather stations in June 2022 for the hill, valley, and highway stations, and in June 2023 for the house station (direction: blowing toward).
3.2. Air Temperature
The analysis of the spatial distribution of air temperature is carried out using mobile measurement campaigns at 2 meters above the ground, as well as fixed measurements taken by stationary weather stations distributed throughout the region. The vertical variation of air temperature was studied using drone-based measurements, mobile readings at different altitudes, and fixed measurements at various heights.
3.2.1. Thermal Inversion
Temperature inversions, a well-known climatological phenomenon, have garnered increasing interest in recent decades due to their association with pollution peaks [32]. There are various types of thermal inversions [1], with radiative inversions being the most frequent. These are primarily caused by a radiative deficit at the surface during the night. They typically occur under calm weather conditions and clear skies and often dissipate in the early morning [33]. However, under certain atmospheric conditions, they can persist for several consecutive days [34]. Local topography amplifies this inversion phenomenon: cold air moves downslope by advection and accumulates in depressions [35, 36].
Thermal inversions are frequently observed in the Bekaa Valley. They occur during radiative nights under clear skies and is intensified by the topographic effect, which promotes cold air accumulation at the valley floor.
Between May and August 2022, we conducted 40 vertical measurement sessions. These measurements were taken during radiative nights and under clear conditions. We scheduled the measurements between 5:30 and 6:00 AM, just before sunrise, to precisely capture the end of the radiative night. This time frame was specifically chosen to assess thermal inversions at this critical moment before the sun rises and daytime heating begins to weaken the inversion effect. It is also crucial to take these measurements before sunrise to avoid any influence of direct solar radiation on the "Tynitag" sensors installed on the drone, which could distort the recorded temperature data. We selected a measurement site at the valley floor, at an altitude of 880 meters (Fig. 6a). All observations confirmed the presence of a thermal inversion, although its intensity varied. The data reveal the existence of a cold and stable air layer below, with an average thickness estimated at 400 meters. Above this layer, a warmer and unstable air layer is present (Fig. 6b).
Figure 6.
Vertical air temperature measurement site at the bottom of the Bekaa Valley (a); average thickness of the inversion layer observed in the Zahlé Valley between May and August 2022 (b).
Figure 6.
Vertical air temperature measurement site at the bottom of the Bekaa Valley (a); average thickness of the inversion layer observed in the Zahlé Valley between May and August 2022 (b).
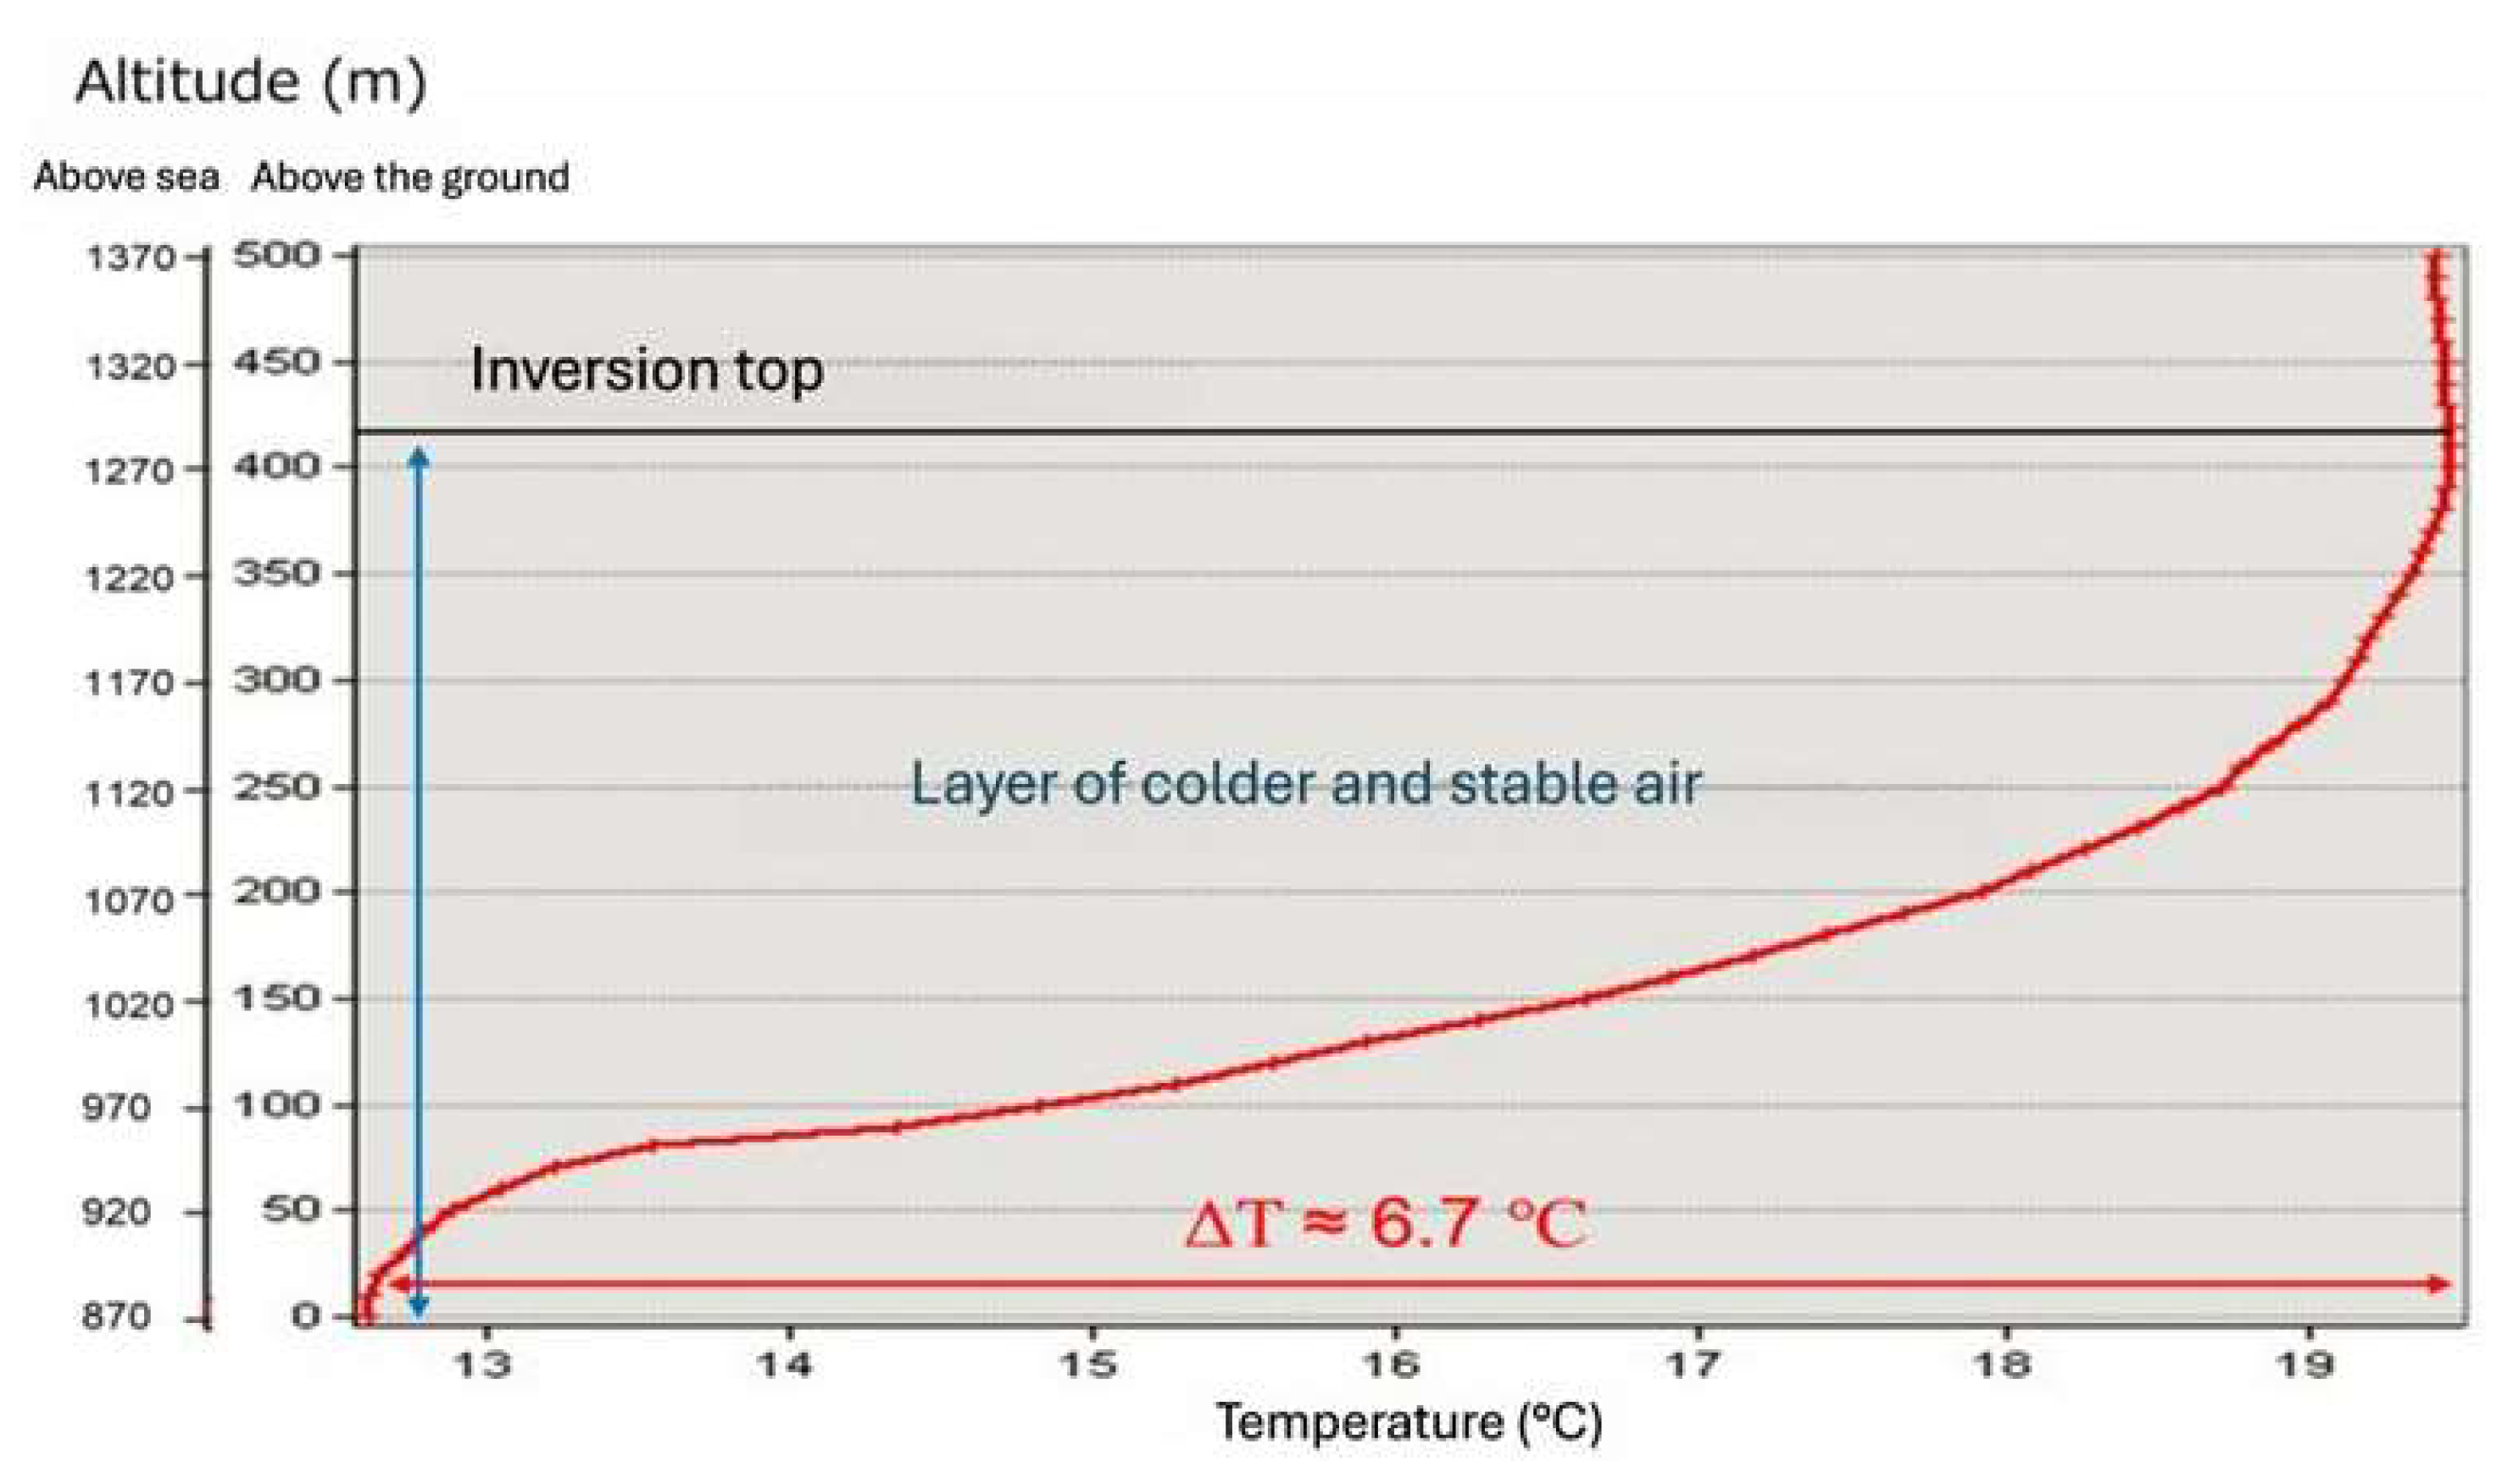
Thermal inversions are characterized by a temperature variation between ground level and higher altitudes, illustrated by a positive temperature gradient. In other words, the temperature increases with altitude.
Vertical air temperature measurements conducted on June 4, 11, and 12, July 16, and August 6, 2022, show a temperature difference of 6.7°C between ground level and an altitude of 400 meters (Fig. 7). These data are corroborated by fixed station measurements: at 6:00 AM, during the vertical temperature measurement, the "valley" station recorded a temperature of 10.7°C at the valley floor (870 meters altitude), while the "hill" station recorded a temperature of 17.6°C on the slope at 1010 meters altitude.
Figure 7.
Average of thermal inversion layers measured on June 4, June 11, June 12, July 16, and August 6, 2022, at 6 AM in the Zahlé Valley.
Figure 7.
Average of thermal inversion layers measured on June 4, June 11, June 12, July 16, and August 6, 2022, at 6 AM in the Zahlé Valley.
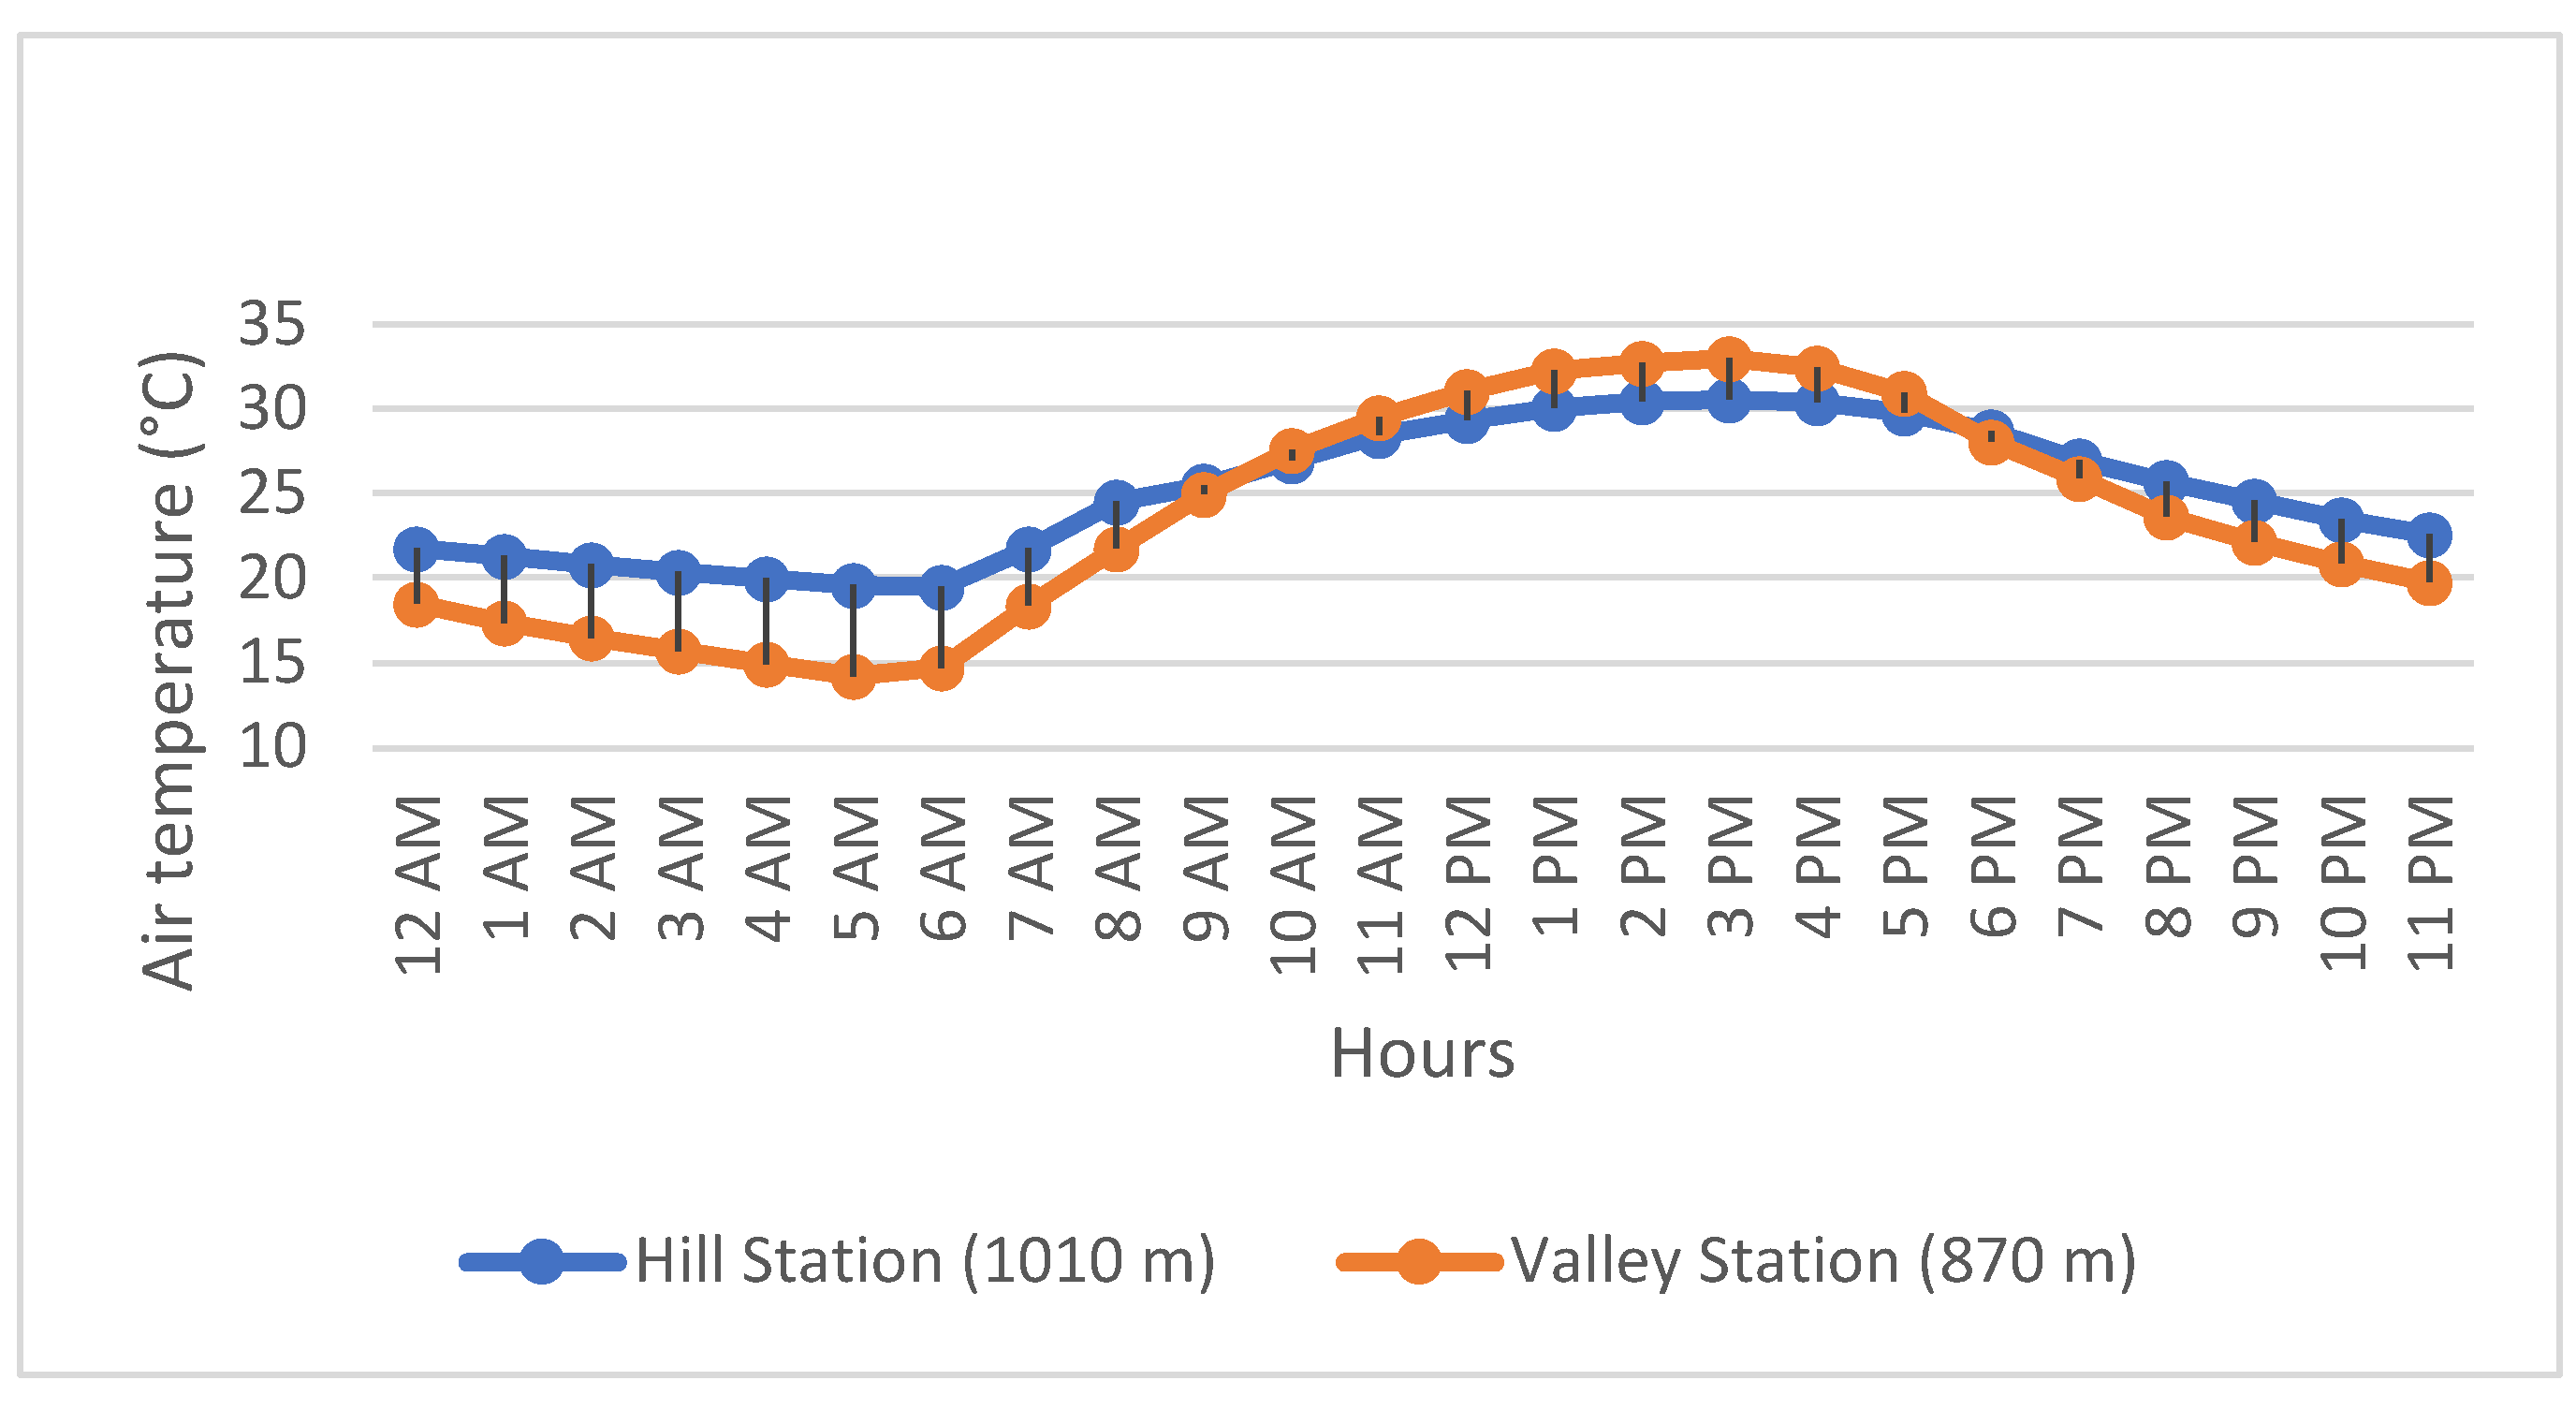
Weather stations located at different altitudes provide information on temperature inversions. The average temperature is lower at the valley station throughout the night, until 9:30 AM. At that point, due to solar warming, the temperature in the valley surpasses that on the slope. The thermal inversion resumes its influence after 6:00 PM, and the valley becomes colder than the slope again (Fig. 8). The maximum average temperature difference measured between these two stations occurs at 5:00 AM, reaching 5.35°C.
Figure 8.
Evolution of the hourly average temperature at the "valley" and "hill" stations during the summer season (June, July, and August) of 2022.
Figure 8.
Evolution of the hourly average temperature at the "valley" and "hill" stations during the summer season (June, July, and August) of 2022.
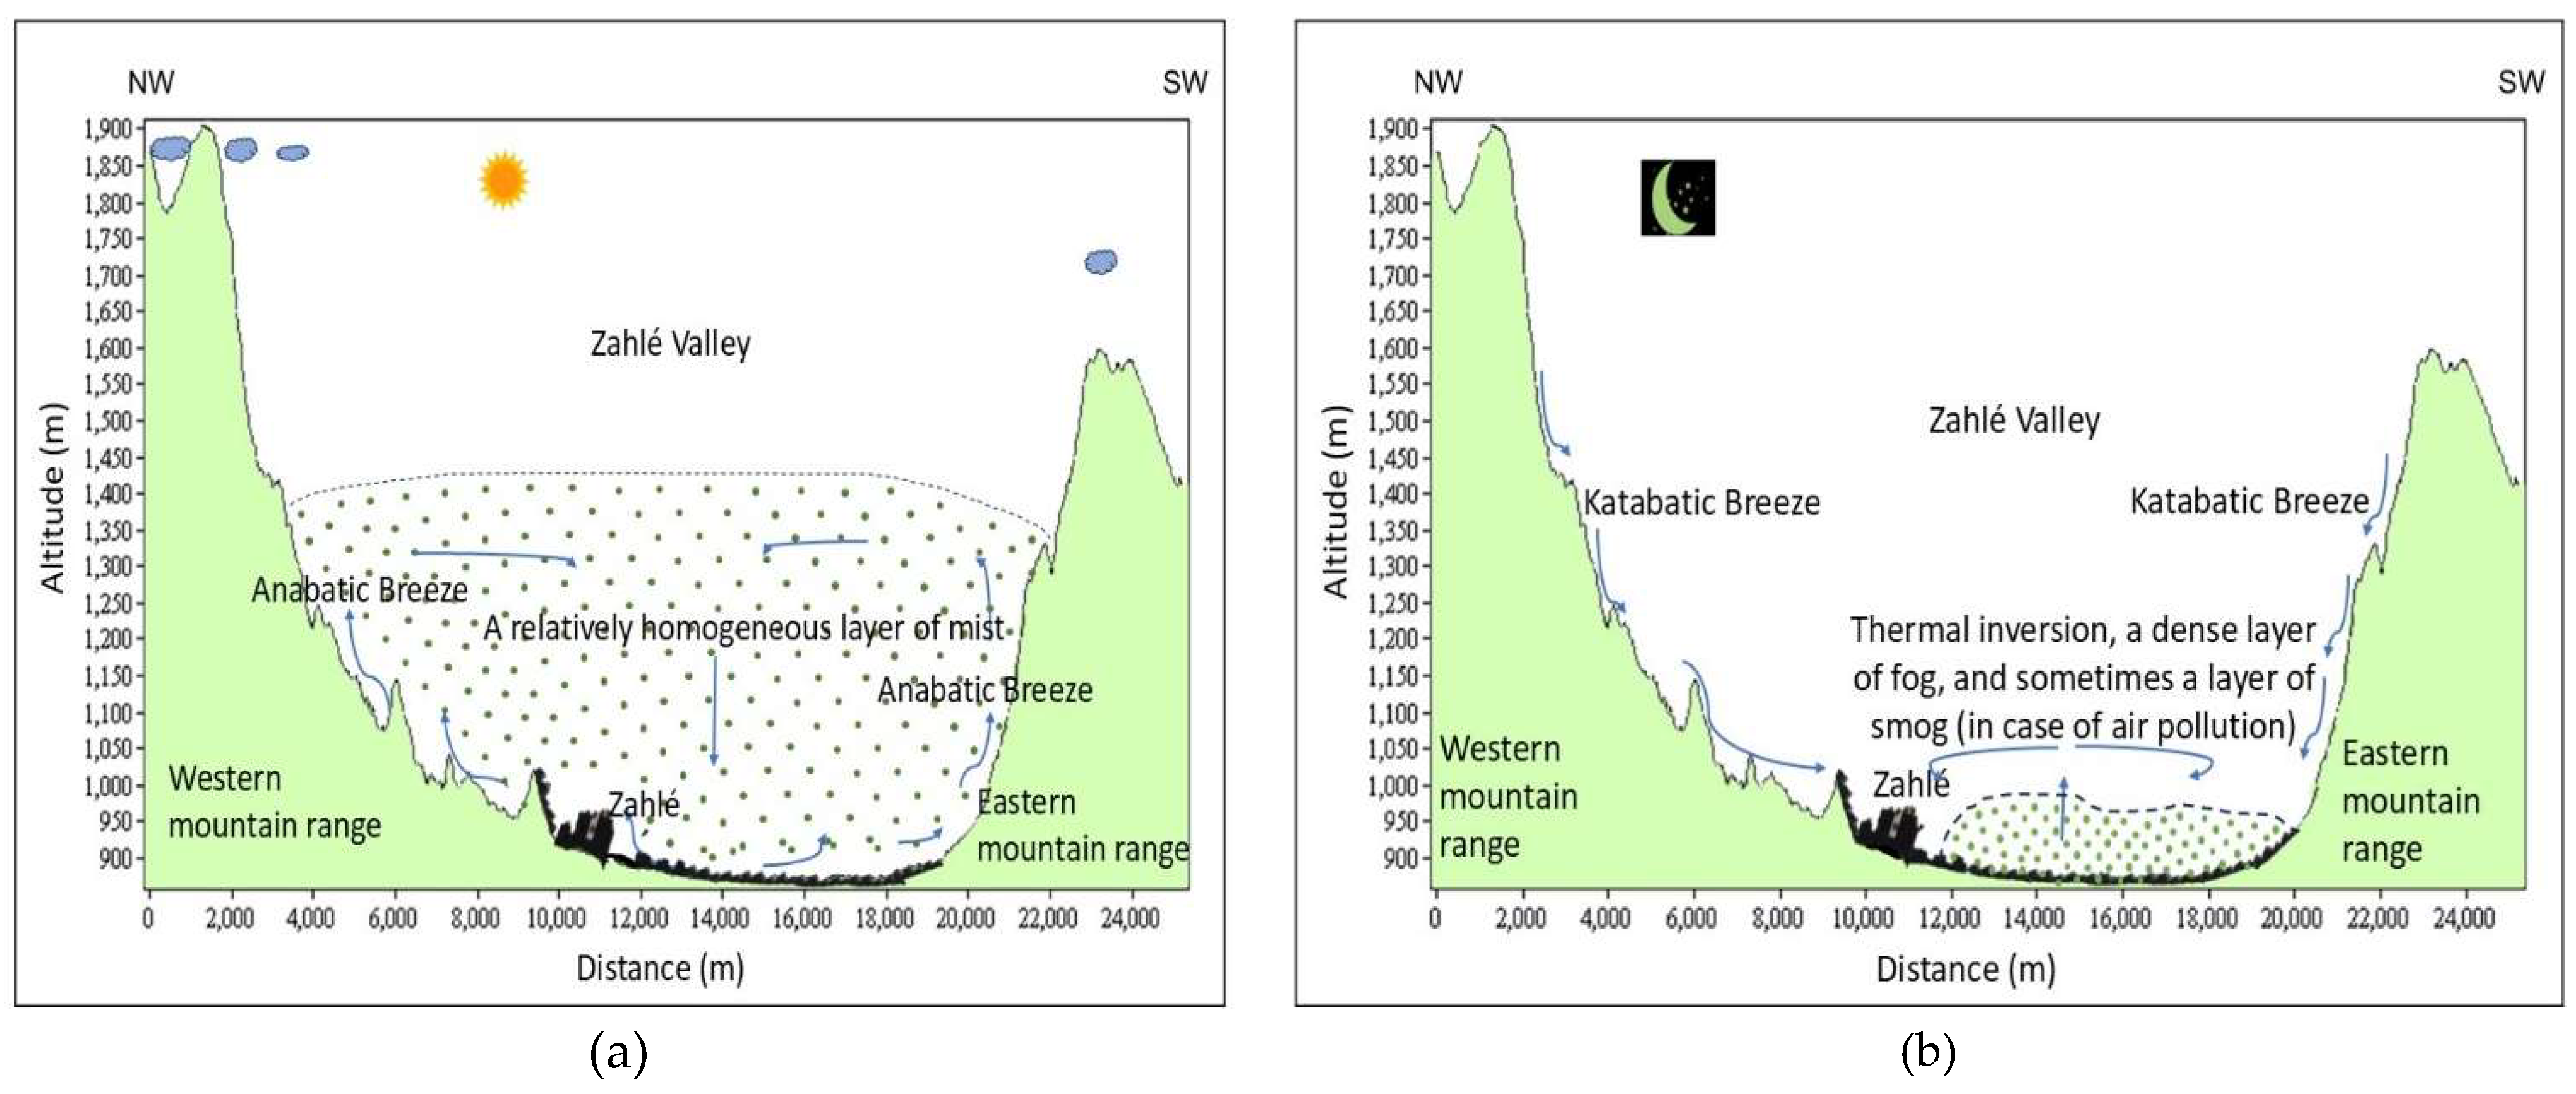
The phenomena of thermal breezes and thermal inversions are frequently observed in the Zahlé Valley during the summer season. Figure 9 shows their development across a cross-section of the valley.
3.2.2. Urban Heat Island (UHI)
The UHI was studied in 2022 and 2023 using satellite imagery, mobile temperature measurements, and fixed-station air temperature monitoring.
Satellite imagery and fixed-station measurements
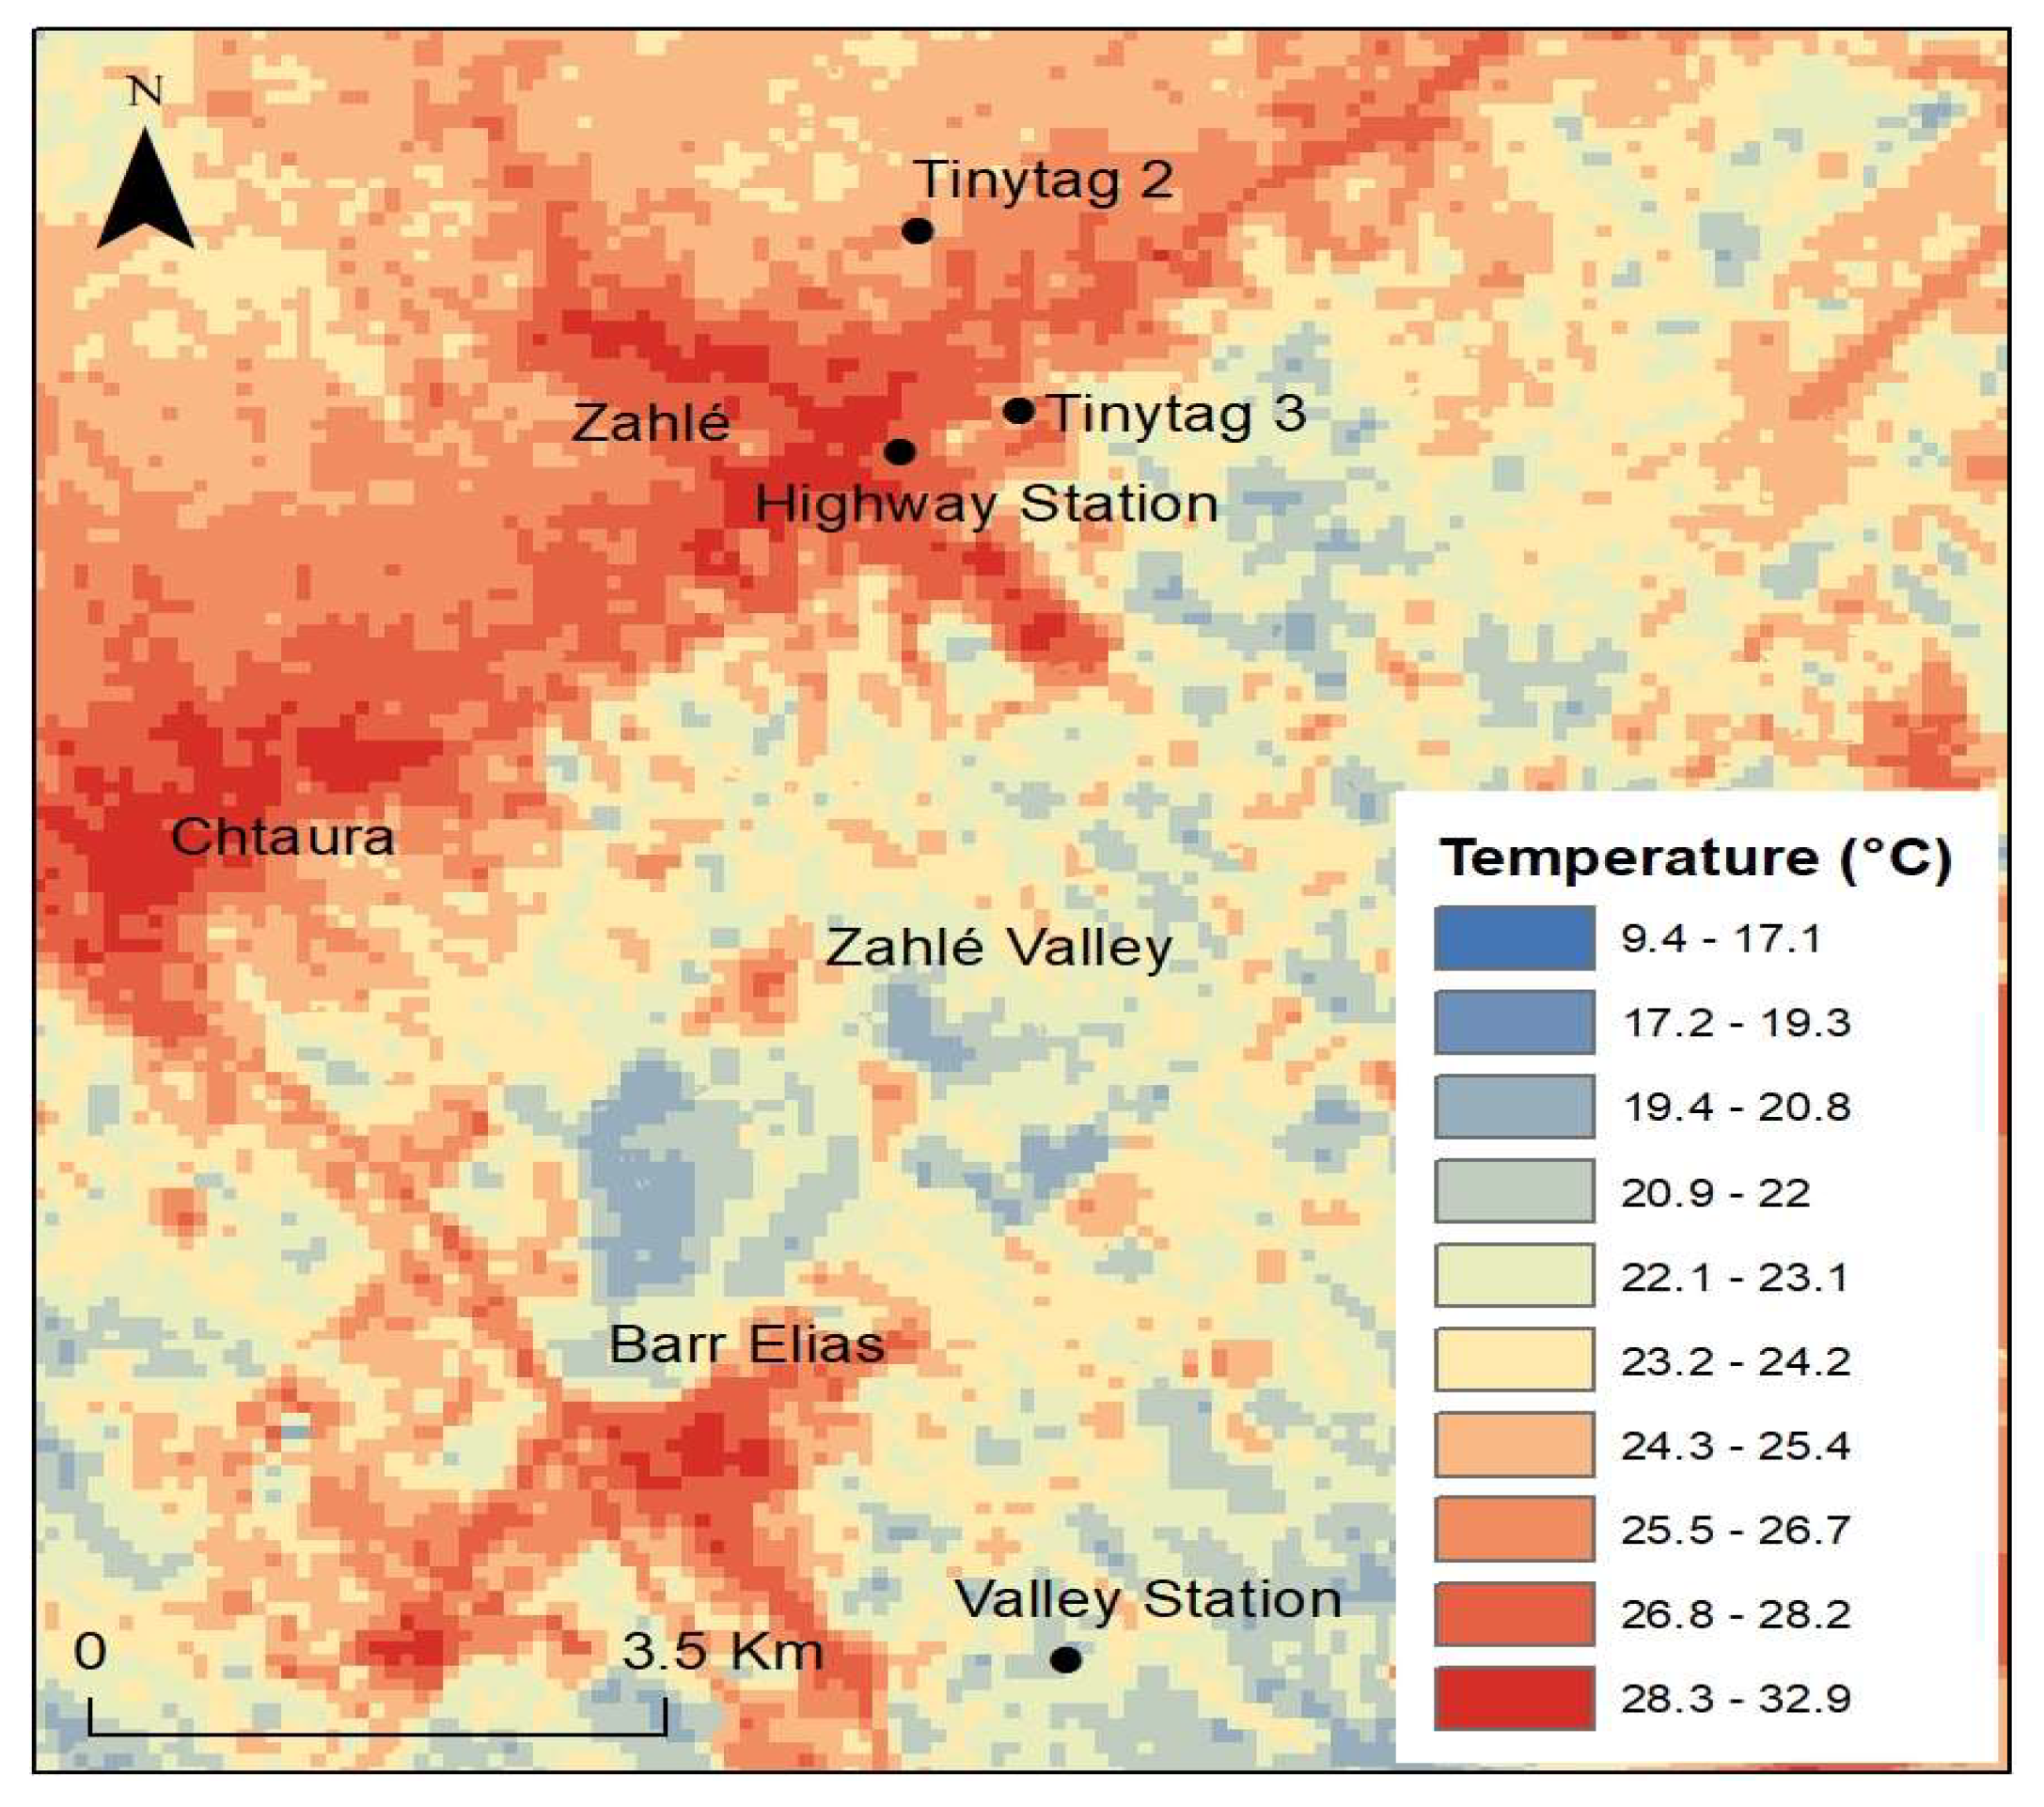
In 2022, the thermal field was analyzed using an ASTER-TIR image captured on June 17, 2022, at 22:30 (local time) (Fig. 10). The selected image represents a summertime high-pressure condition, characterized by clear skies, calm winds, and a diurnal temperature range of approximately 16°C (recorded air temperatures at the "Highway" station ranged from 20.5°C at night to 36.6°C during the day). This weather pattern had persisted for the 10 preceding days.
Processing the five thermal bands (B10 to B14) allowed for the distinction of three approximate brightness temperature classes, based on surface types:
- The hottest areas (26.67-32.92°C) include the densely populated urban centers of Zahlé, Chtaura, and Barr Elias, as well as the peaks of the eastern mountain range (SE of the map). These heights, ranging between 1100 m and 1500 m in altitude, are warmer than the lower regions at the valley floor (870 m in altitude) due to nocturnal thermal inversion. Urban surfaces store heat during the day and remain relatively warm at night. The city absorbs 15 to 30% more energy than a non-urban area [37].
- The coolest areas (<24°C) correspond to the agricultural lands in the Valley, where vegetable farming still dominates. These lands do not overheat during the day due to evapotranspiration. At night, surface cooling is enhanced by the nocturnal breeze, which carries cooler air to the valley floor, as well as by the irrigation of these agricultural areas. Due to the relatively high amount of latent heat, sensible heat remains low in rural areas.
- Finally, these two zones are separated by intermediate temperature areas. This consists of an urban fabric of more or less dispersed single-family houses, including both mineralized surfaces such as roads and buildings, as well as some natural spaces like orchard-gardens and unpaved paths.
Figure 10.
Spatial Distribution of Nocturnal Surface Temperatures in the Zahlé Region on June 17, 2022, at 10:30 PM Local Time (Source: Processed thermal bands B10, B11, B12, B13, and B14 from an ASTER-TIR image).
Figure 10.
Spatial Distribution of Nocturnal Surface Temperatures in the Zahlé Region on June 17, 2022, at 10:30 PM Local Time (Source: Processed thermal bands B10, B11, B12, B13, and B14 from an ASTER-TIR image).
The UHI in the Zahlé agglomeration covers an area of approximately 6.46 km² and adopts a cruciform shape that follows the urbanized areas. This configuration is more pronounced in the center, where the urban density is the highest, and diminishes on the periphery, which is bordered by agricultural and arable land in the Zahlé Valley to the south and southeast, as well as by the slopes of the mountain range to the west and northwest.
As for the UHI in the Barr Elias agglomeration, it consists of three segments representing the main roads, it is more pronounced in the urbanized areas and is surrounded by the agricultural lands of the Zahlé Valley. It is also smaller than that of Zahlé (area ≈ 3.42 km²). The UHI in the Chtaura agglomeration has a size similar to that of Barr Elias (area ≈ 3.47 km²), with increased intensity in the center, where shopping centers and the densest residential areas are concentrated.
In addition to the building density that defines these areas, the gases emitted by cars and polluting industrial facilities, such as carbon monoxide and nitrogen oxides, stimulate photochemical processes in the urban air. These physicochemical reactions, by altering the local radiative balance, can amplify the effect of the thermal dome. Satellite images allow for the estimation of surface temperature, which is confirmed by fixed stations installed in the region. The "Tynitag 2" sensor records a temperature of 25.8°C. The "Tynitag 3" sensor measures a temperature of 25.6°C at 10:19 PM. The "Highway" station records a temperature of 27.8°C at 10:30 PM. Finally, the "Valley" station records a temperature of 21.7°C at 10:30 PM.
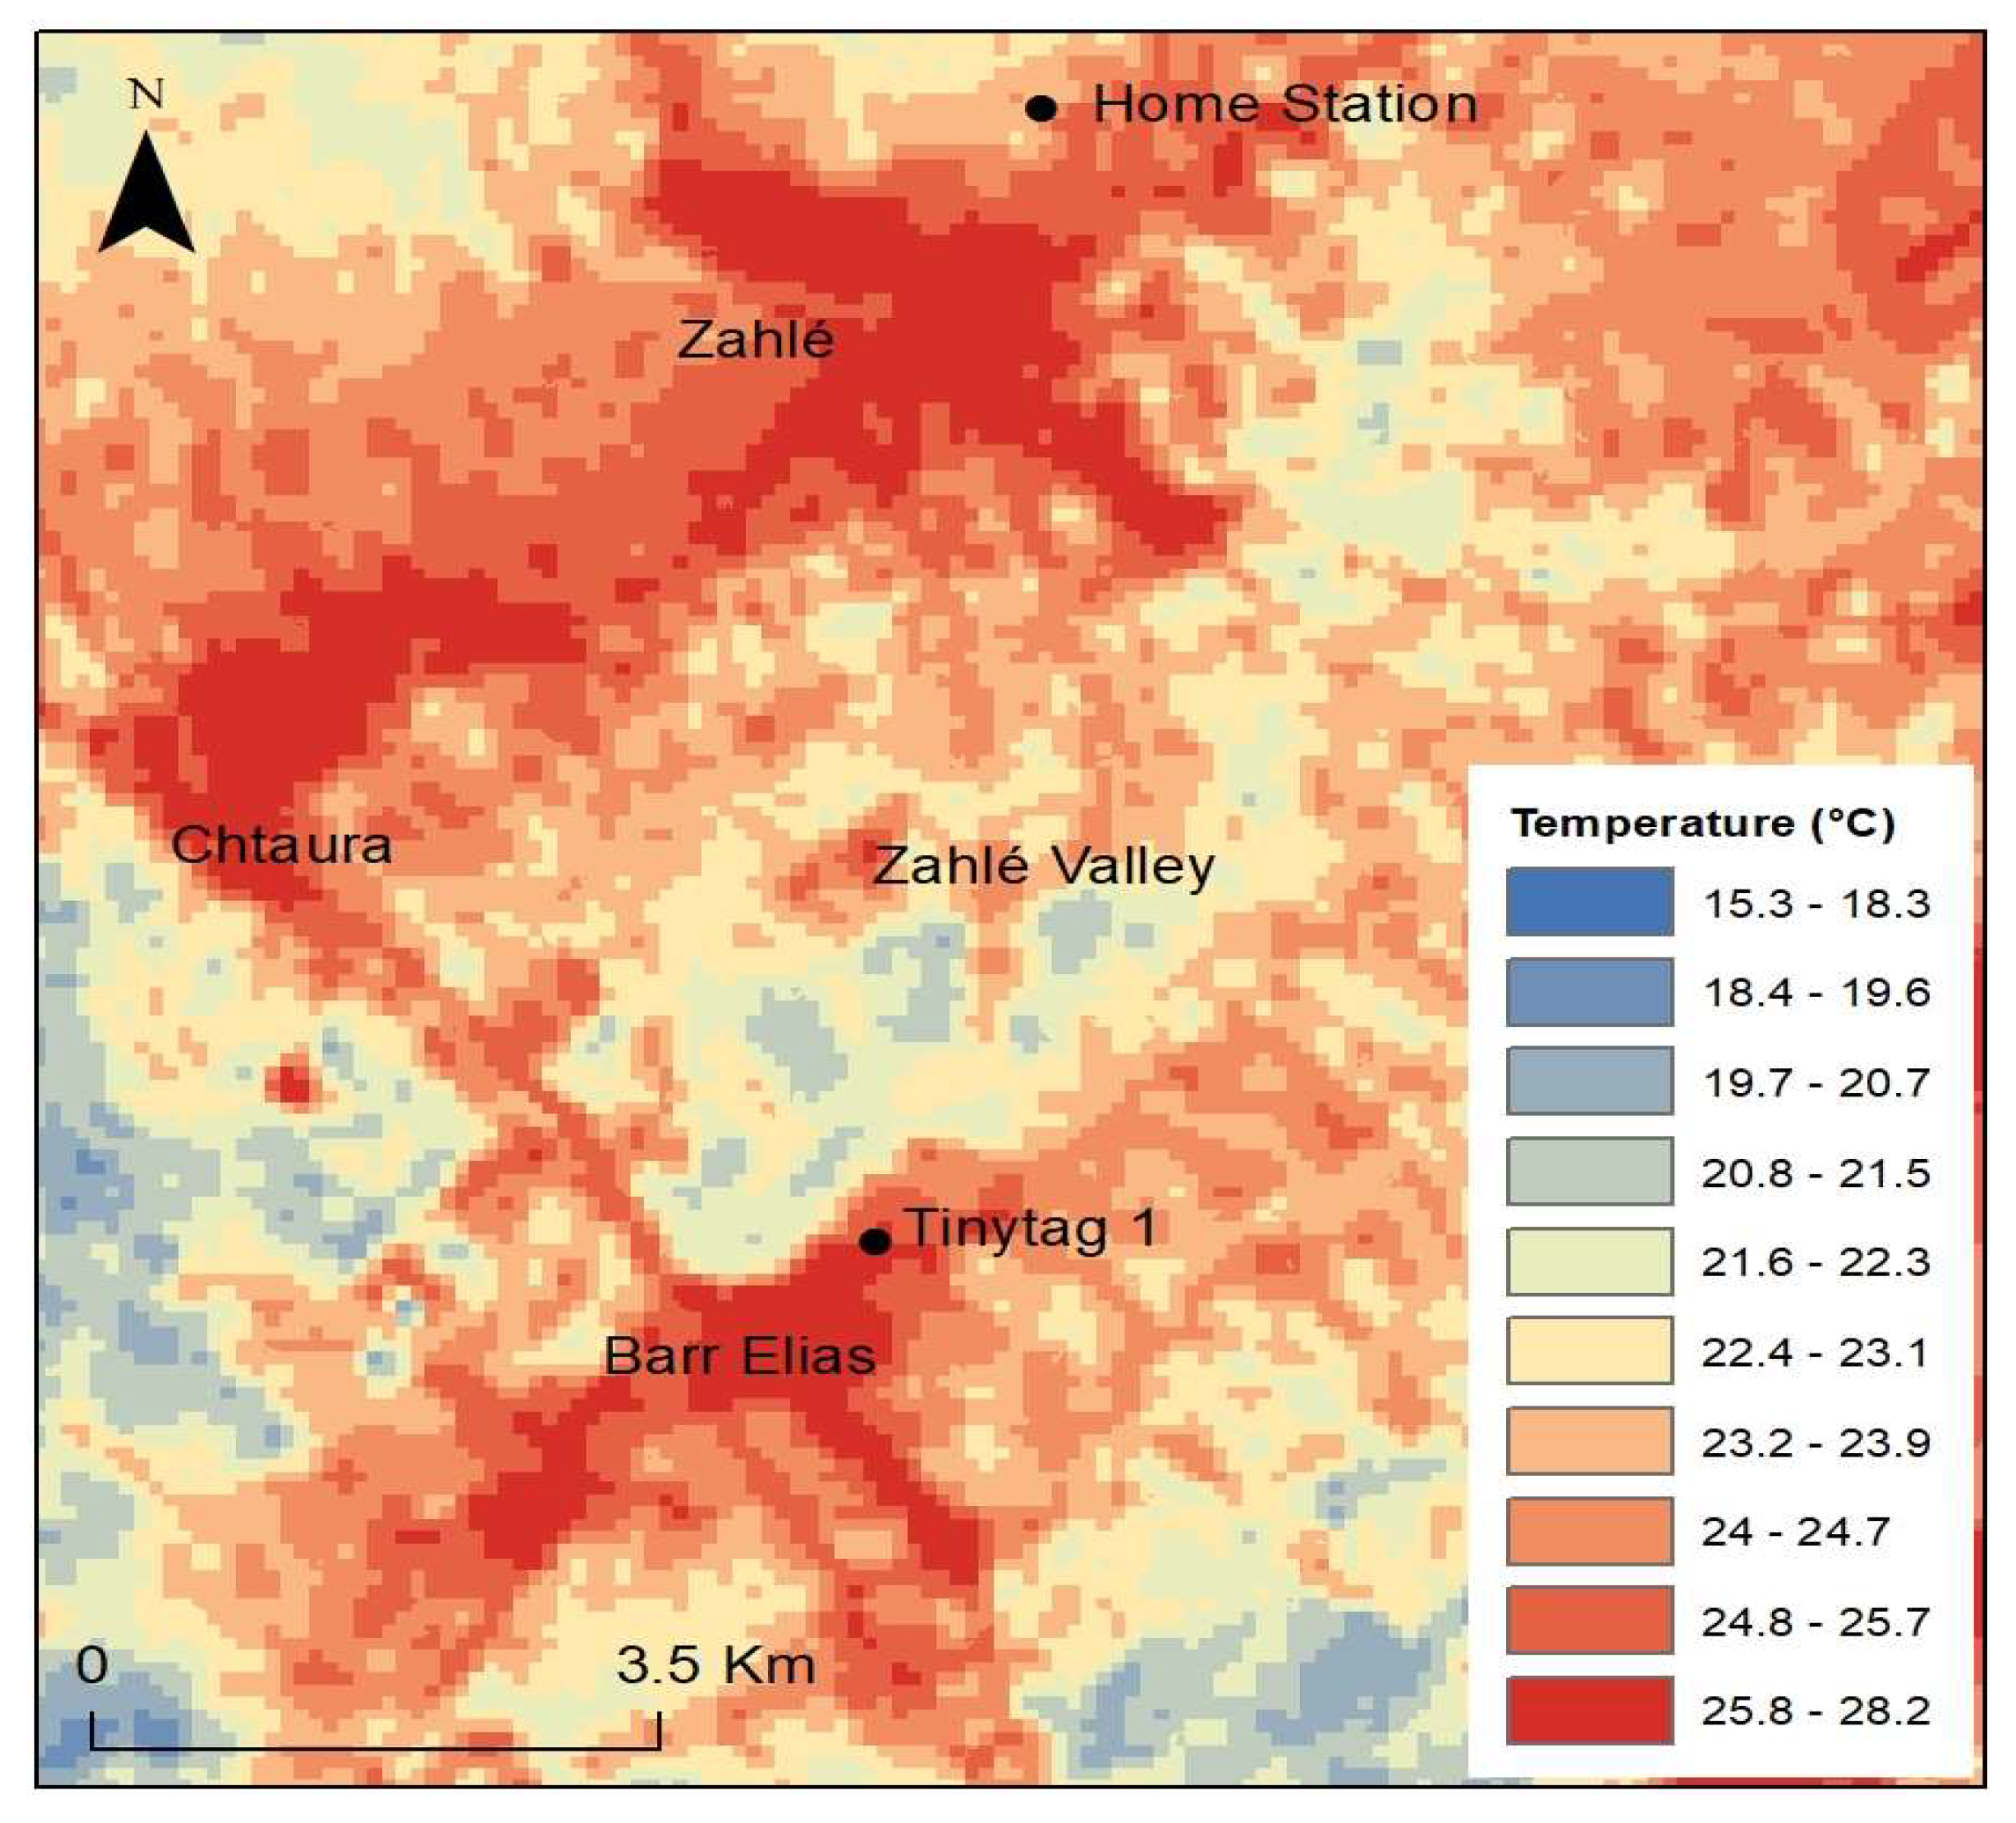
In 2023, an image dated July 11, 2023, at 10:19 PM (local time) was selected (Fig. 11). The image was taken in anticyclonic conditions with clear skies. Thermal breezes were well established both day and night, with very low wind speeds at night. The thermal amplitudes were around 13°C on this day (according to data from the Davis "home" station installed in 2023).
The hottest areas (between 23.2 and 28.2°C) correspond to the urban agglomerations of Zahlé, Chtaura, and Barr Elias. The temperatures are higher at the center of these agglomerations, where the population density is greater. Cooler areas correspond to agricultural surfaces in the Zahlé Valley, including either cultivable land without vegetation cover or plantations. Areas with intermediate temperatures are those with less dense urban fabric. These results confirm the previous findings from 2022.
Data from fixed stations installed in the region in 2023 confirm the estimates provided by the satellite images. For example, the air temperature recorded at the "home" station at 10:30 PM is 23.7°C. The Tynitag sensor records a temperature of 24.2°C at 10:22 PM.
Figure 11.
Spatial distribution of nighttime surface temperatures in the Zahlé region on July 11, 2023, at 10:19 PM (local time) (source: processing of thermal bands B10-B11-B12-B13 and B14 from an ASTER-TIR image).
Figure 11.
Spatial distribution of nighttime surface temperatures in the Zahlé region on July 11, 2023, at 10:19 PM (local time) (source: processing of thermal bands B10-B11-B12-B13 and B14 from an ASTER-TIR image).
Car surveys
To partially validate the results obtained from the processing of ASTER-TIR satellite images, mobile campaigns measuring nighttime air temperatures at 2 meters above the ground were conducted. These measurements were taken at the beginning of the night, between 8:30 PM and 9:30 PM, as well as at the end of the night (the early morning), between 5:30 AM and 6:45 AM.
- 1.
- Zahlé agglomeration
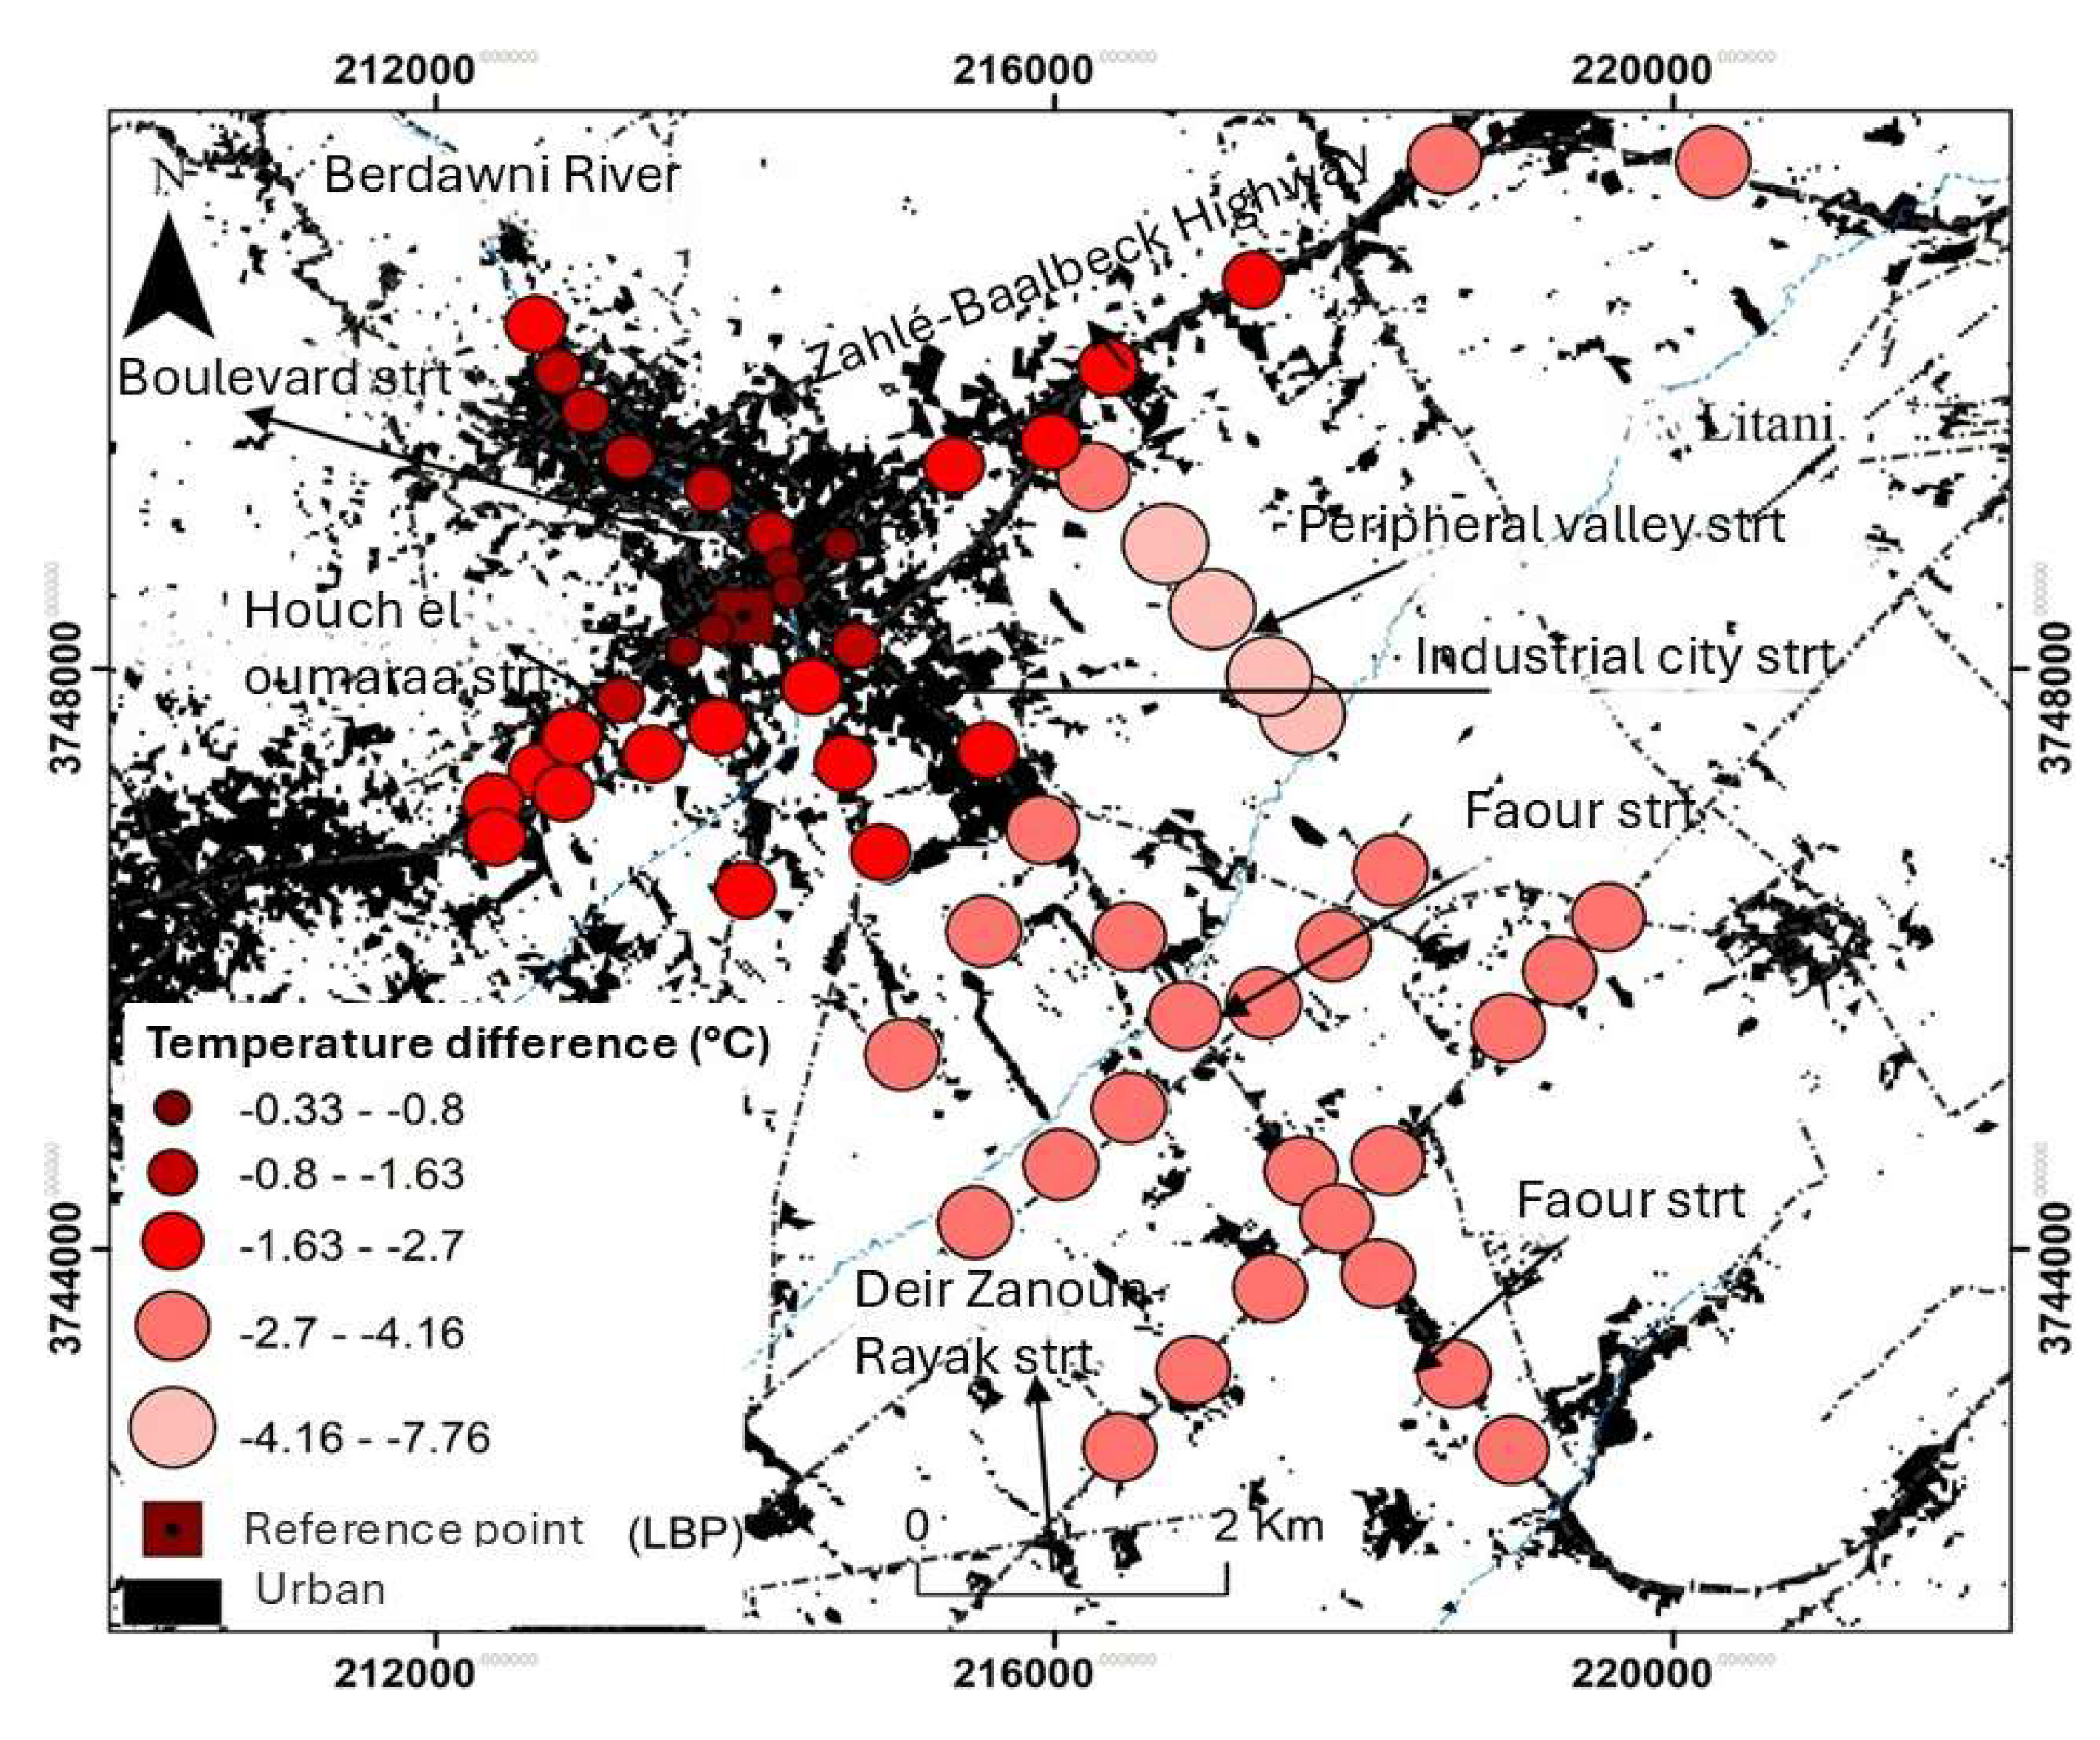
Between 5:30 AM and 6:45 AM, the measurements indicate a temperature difference ranging from 2.7°C to 7.7°C between the reference point (LBP) located on Houch El Oumaraa Street and the surrounding rural areas (the vast agricultural expanse of the Zahlé Valley) (Fig. 12). The urban fabric retains more heat than the surrounding countryside, releasing this heat during the night.
The LBP point records the highest temperatures due to the lack of ventilation caused by the 100% building density. The hottest areas (with a temperature difference of less than 2.7°C compared to LBP) correspond to commercial centers, banks, and public services, identified by satellite images as the warmest spots. Moving toward the NNW of LBP, the temperature difference increases, reaching between 0.8 and 2.7°C.
The city of Zahlé, located in the Berdawni Valley and traversed by the river of the same name, shows a temperature drop and an increase in humidity as one moves toward the NNW, where the valley becomes more enclosed and the measurement points are closer to the river. Moving toward the ENE of LBP along the Zahlé-Baalbeck highway, building density decreases, leading to a temperature difference that can reach 2.7°C.
Toward the WSW of LBP, Houch El Oumaraa Street is relatively narrow, with high building density, including restaurants and public service centers, where the temperature difference can reach a maximum of 2°C. Moving toward the SE of LBP along the industrial city street, building density decreases, but industrial centers are present, with a temperature difference of up to 2.7°C in certain points.
Further SE, along Faour Street, which crosses arable lands either without vegetation or cultivated, the temperature difference compared to LBP increases, reaching up to 4°C. The coldest street is the peripheral valley street, where the temperature difference can reach 7.7°C compared to LBP, crossing vast irrigated agricultural areas during the night.
Figure 12.
Spatial distribution of average air temperatures at 2 m above ground level (in °C) in the Zahlé agglomeration, based on five series of mobile measurement campaigns conducted under radiative conditions on 06/12/2022, 06/15/2022, 07/02/2022, 07/09/2022, and 07/16/2022, between 5:30 AM and 6:45 AM (1-minute average per point, measurements taken by car; background: built-up surfaces of the Zahlé agglomeration derived from the processing of a 2017 LANDSAT 8 image).
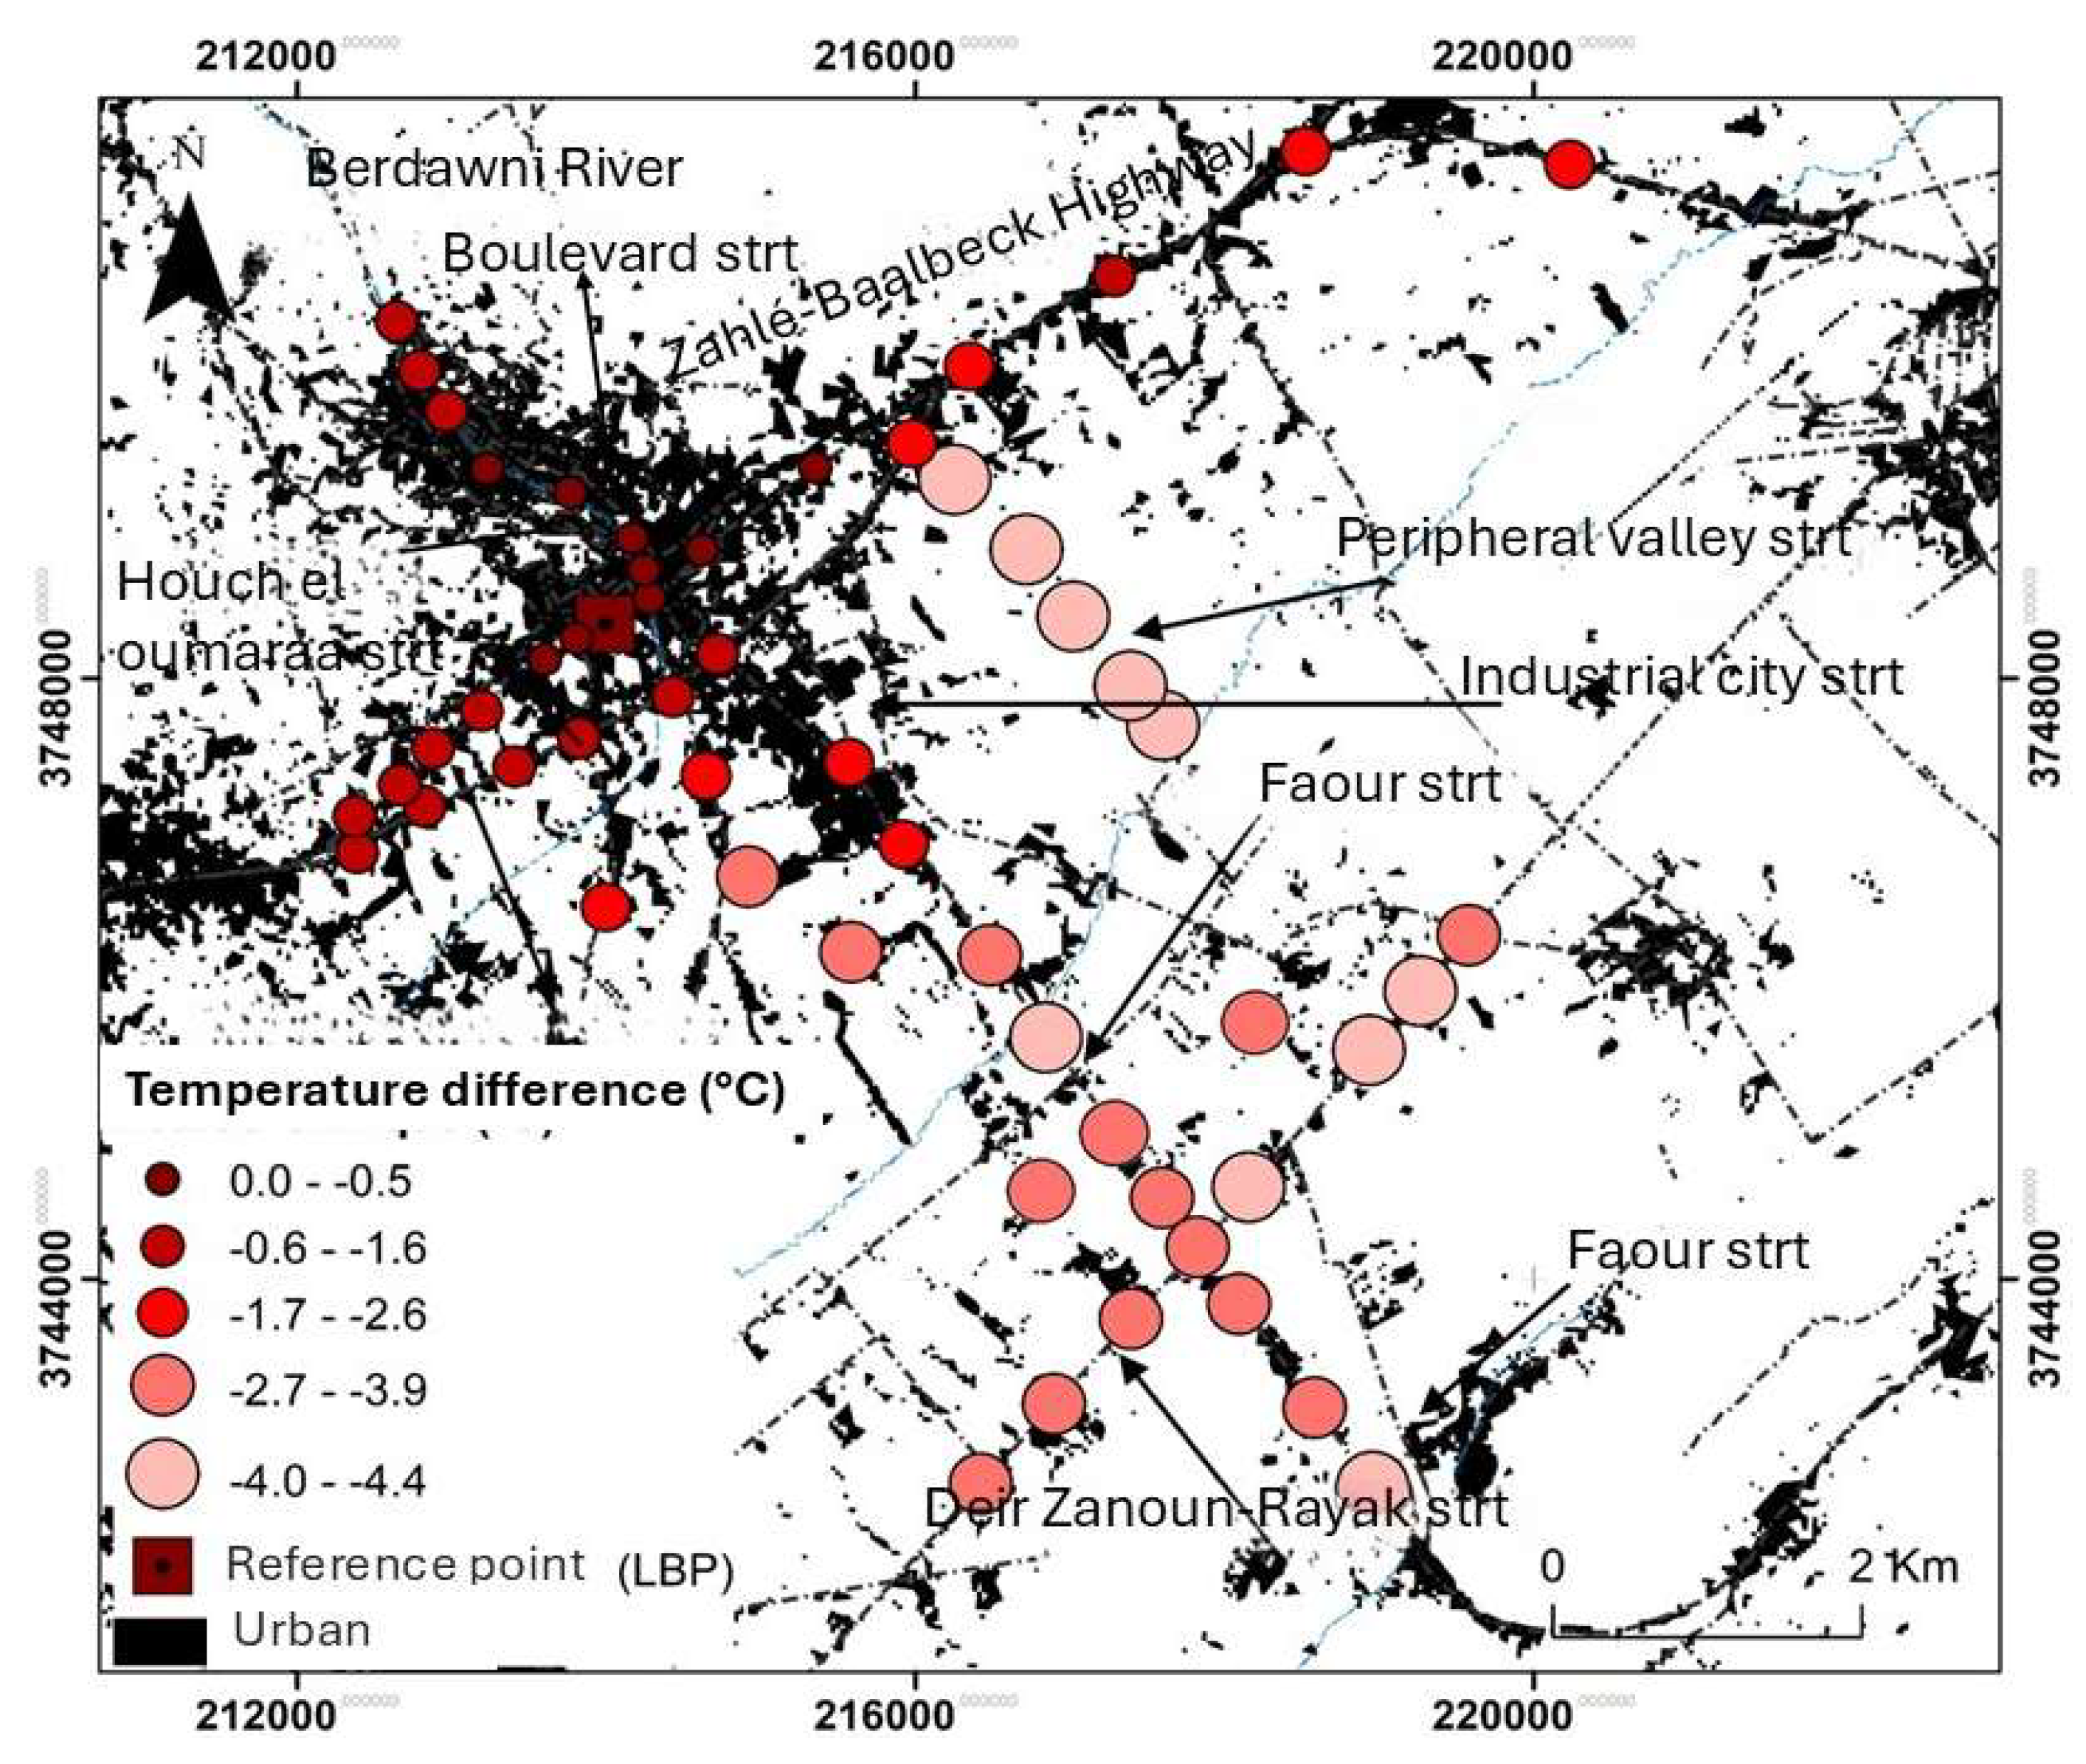
Between 8:30 PM and 9:45 PM at the beginning of the night during the summer seasons of 2022 and 2023, mobile measurement campaigns were conducted. These measurements reveal a temperature difference ranging from 2.7°C to 4.4°C between the reference point (LBP) and the surrounding rural areas.
Boulevard Street, the Zahlé-Baalbeck highway, and Houch El Oumaraa Street are among the warmest, showing a temperature difference of 0 to 1.6°C compared to LBP. In contrast, the Peripheral Valley Street, Faour Street, and Deir Zanoun-Rayak Street are the coldest, with a temperature difference reaching up to 4.4°C compared to LBP (Fig. 13).
It has been observed that the temperature difference is more significant at the end of the night (early morning). The nocturnal mountain breeze, active throughout the night under clear skies, promotes the accumulation of cool air at the bottom of the valley, forming a cold-air pool. This phenomenon amplifies the temperature contrast with urban surfaces located at relatively higher altitudes, as seen in Zahlé.
Figure 13.
Spatial distribution of average nighttime air temperatures at 2 m above ground level (in °C) in the Zahlé agglomeration and the Bekaa Valley, based on five series of mobile measurement campaigns conducted under radiative conditions on 07/20/2022, 07/22/2022, 07/25/2022, 07/30/2023, and 08/02/2023, between 8:30 PM and 9:45 PM (1-minute average per point, measurements taken by car; background: built-up surfaces of the Zahlé agglomeration derived from the processing of a 2017 LANDSAT 8 image).
- 2.
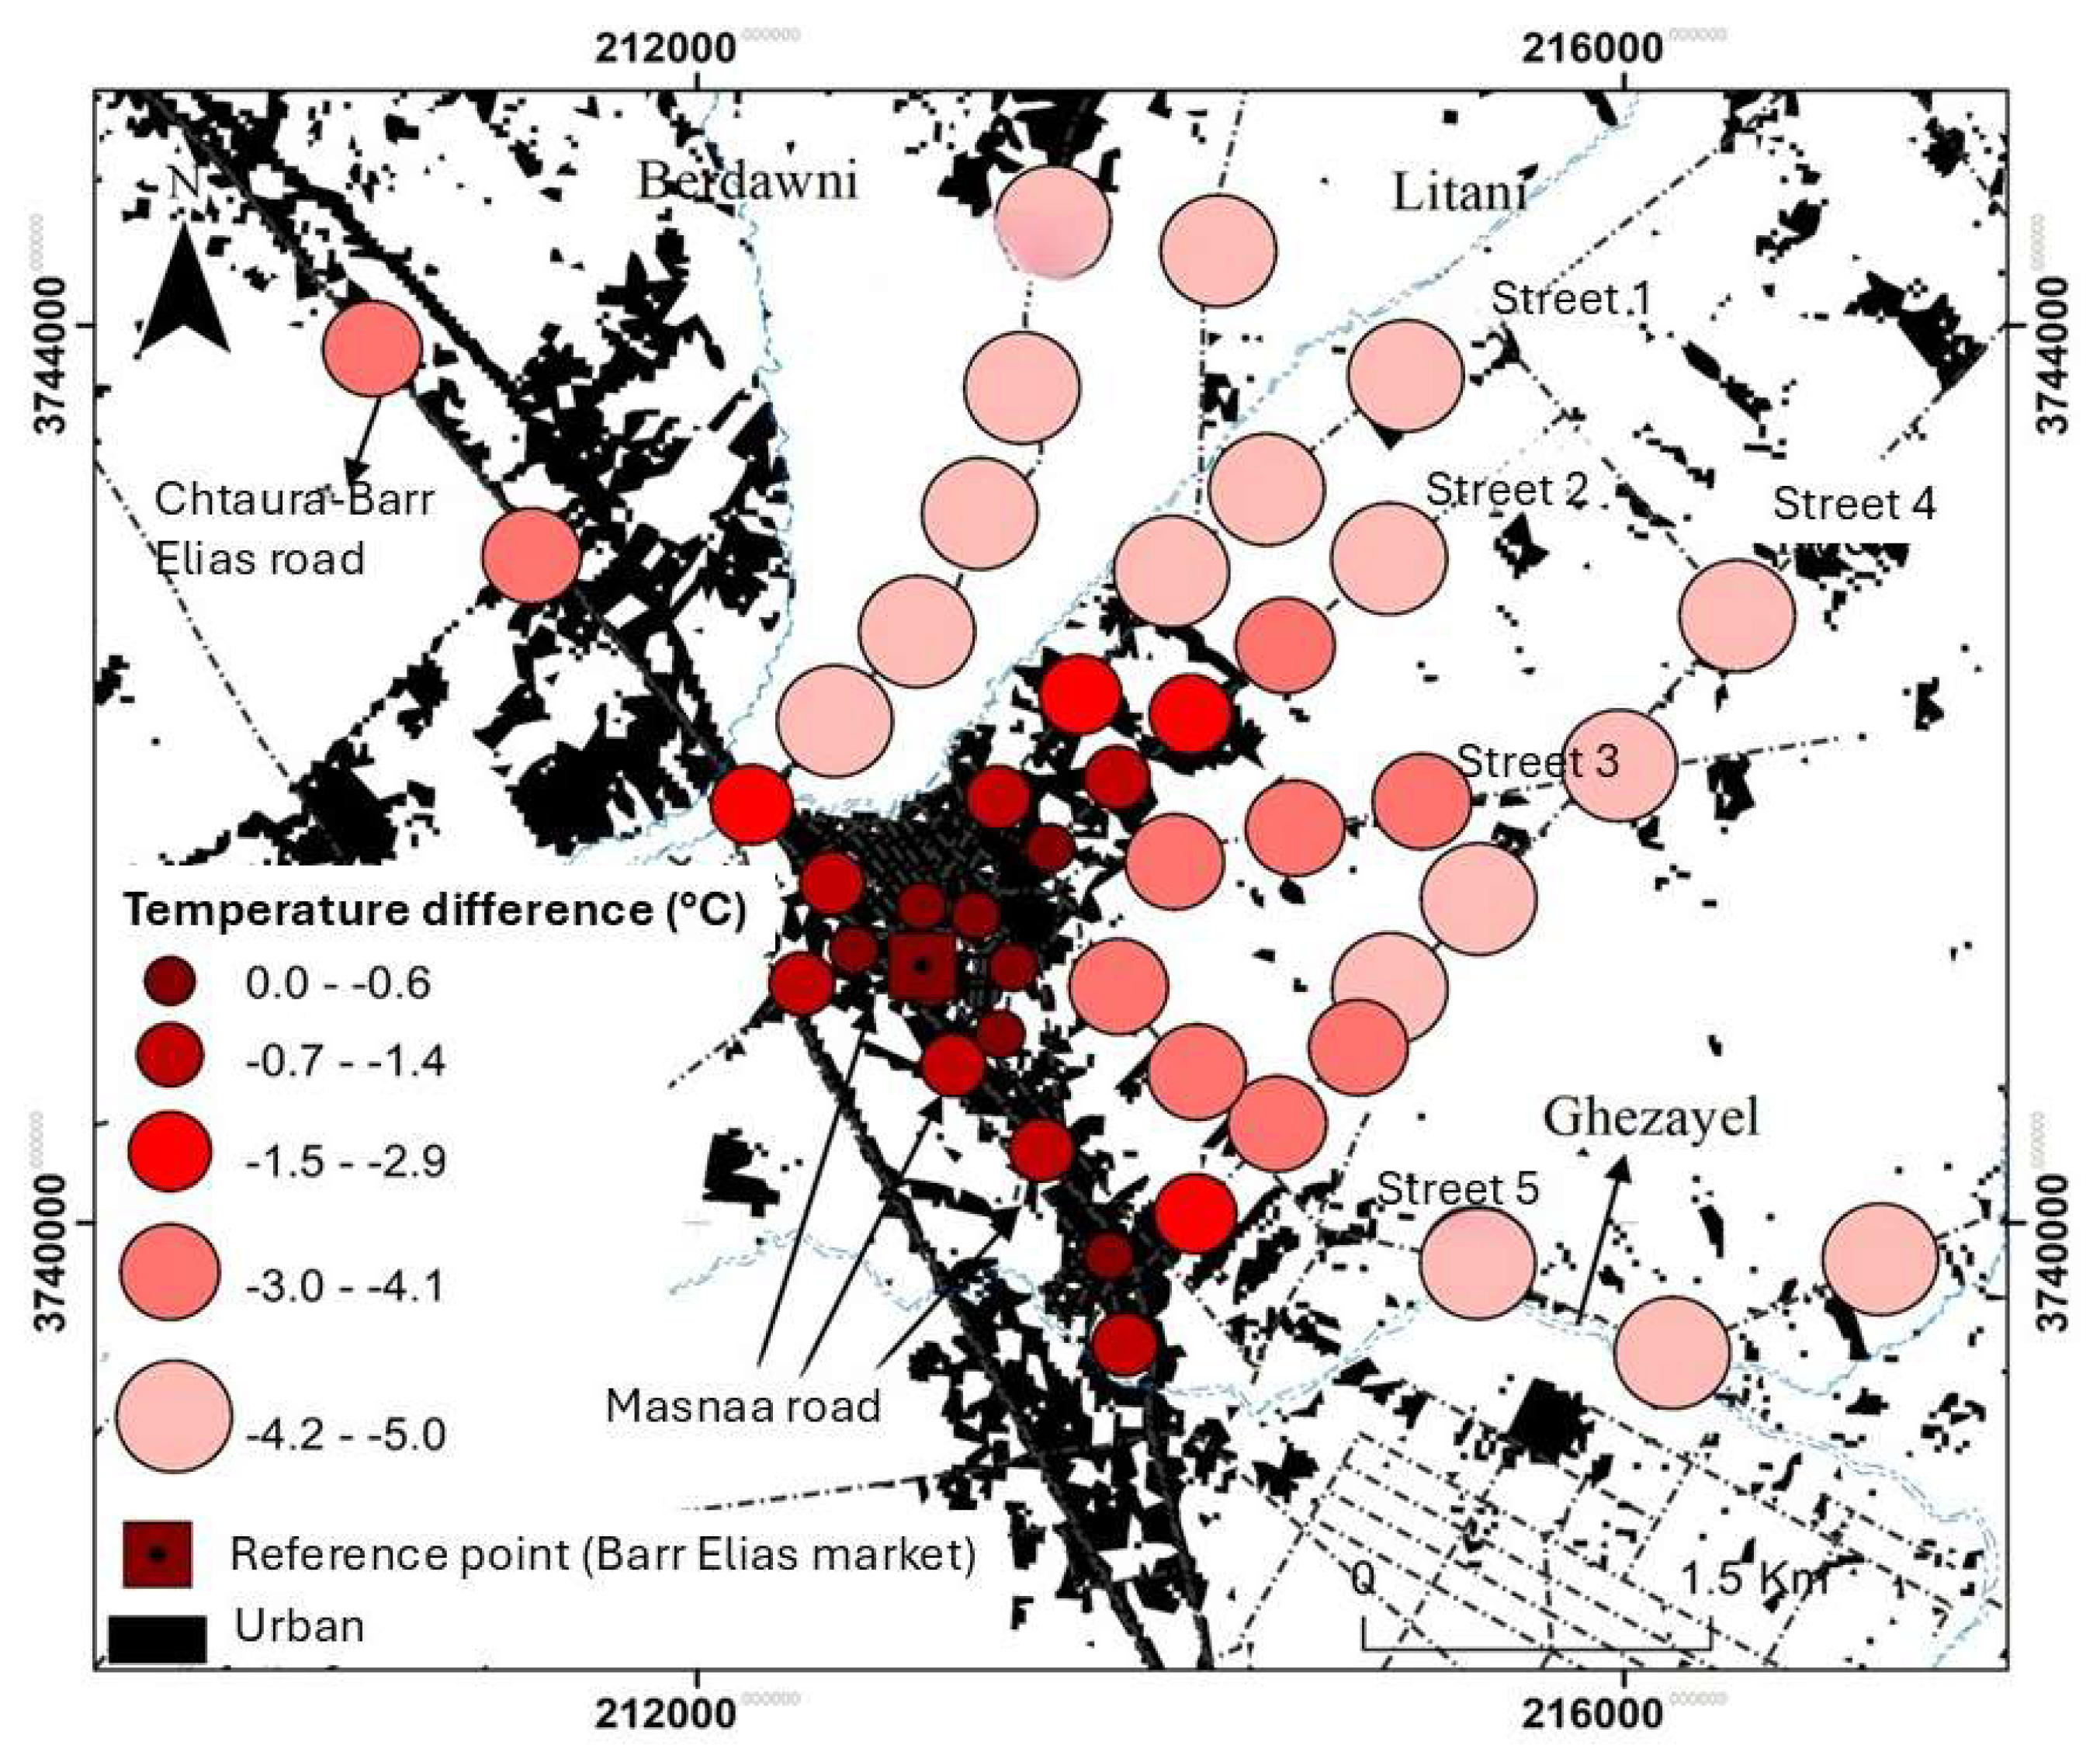
- Barr Elias agglomeration
Between 8:30 PM and 10:00 PM, mobile measurements show a temperature difference of 3 to 5°C between the reference point (the popular market of Barr Elias) and the surrounding countryside (Fig. 15). The measurement points within the Barr Elias urban area and along the main Masnaa road record the highest temperatures. These are the densest urban zones, home to commercial centers, restaurants, hospitals, the Barr Elias market, and working-class neighborhoods. As we move northeast along streets 1, 2, 3, 4, 5, and Fayda Street, the thermal gradient increases. In fact, this increase corresponds to the transition from urban areas to the agricultural lands of the Bekaa Valley. These streets pass through vegetable crop fields. The houses along these streets gradually become detached single-family homes.
Figure 14.
Spatial distribution of average nighttime air temperatures at 2 m above ground level (in °C) in the Barr Elias agglomeration, based on five series of mobile measurement campaigns conducted under radiative conditions on 06/27/2022, 06/28/2022, 07/01/2022, 07/10/2023, and 08/10/2023, between 8:30 PM and 10:00 PM (1-minute average per point, measurements taken by car; background: built-up surfaces of the Zahlé agglomeration derived from the processing of a 2017 LANDSAT 8 image).
The results of the mobile measurement campaigns corroborate those obtained through remote sensing. These findings are consistent with the conclusions of several researchers [38, 39, 40], who also utilized ASTER imagery in the study of the UHI. Their studies demonstrate that the spatial distribution of nighttime air temperatures under radiative conditions, at the agglomeration scale, is strongly linked to the built environment configuration.
4. Discussion
The study of thermal breezes in rugged terrain is of significant interest for understanding local climate dynamics and their environmental impacts. The anabatic and katabatic winds play a crucial role in heat and moisture distribution in mountainous regions, thereby influencing local microclimates [2]. Additionally, several studies have demonstrated that these phenomena can affect air quality and living conditions in urban areas, particularly in steep valleys where thermal inversions are frequent [3, 21, 41].
This study presents original findings in a relatively understudied field. However, conventional station data on wind and temperature are limited due to gaps in meteorological records from the standard network. Moreover, these tri-hourly data do not allow precise determination of breeze onset times, necessitating the installation of fixed weather stations with finer temporal resolution (30 minutes). Davis stations, known for their high accuracy, enabled us to spatially analyze thermal breezes and study the UHI phenomenon.
Furthermore, the lack of radiosonde procedures and the impossibility of conducting such measurements with specialized balloons in an unstable country like Lebanon compelled us to explore more practical techniques for measuring vertical atmospheric temperature. Consequently, we opted for drone-based measurements. This method, employed in recent studies, has yielded reliable results [28].
Wind speeds measured by fixed stations installed at various altitudes revealed that breezes manifest at higher speeds at elevated altitudes. These findings align with other studies [9].
Regarding the UHI, satellite imagery is a valuable data source for studying surface thermal fields, but these data are limited and do not cover extended time series. These datasets must be supplemented with field measurements, as done in this study. The observed thermal contrast between rural and urban areas in the Zahlé region can reach up to 7.7°C by the end of the radiative night, according to mobile measurements. This difference is amplified by the thermal inversion effect in the valley, formed by the nocturnal advection of cold air and its accumulation at the valley floor. The measured contrast early in the radiative night (between 8:30 PM and 10:00 PM) is lower, reaching up to 5°C. This value is close to the difference observed in Sfax, Tunisia, where Dahech (2007) [6] found a 4–5°C contrast between the Sfax urban area and its surrounding countryside.
5. Conclusions
The Zahlé region is dominated by thermal breezes. These breezes are anabatic and katabatic winds. The katabatic breeze occurs at night, with low speed (generally ≤ 0.5 m/s) and a prevailing NNE direction. The anabatic breeze occurs during the day, ascending the slopes of the eastern and western mountain ranges. Its prevailing direction is S (south). The speed of the thermal breeze in Zahlé depends mainly on elevation and surface roughness. The "hill" station, installed on a hill at an altitude of 1010 m, records an average speed of 3.6 m/s for the anabatic breeze and 1.2 m/s for the katabatic breeze. These speeds are lower at the less elevated "valley" station, located at 880 m.
A nocturnal thermal inversion forms in the Bekaa Valley and lasts until 9:30 AM. The average thickness of this layer reaches 400 m during the summer season. The katabatic breeze contributes to the formation of the thermal inversion by advecting cool, humid air into the valley during radiative nights.
The study of the UHI in the urban areas of Zahlé and Barr Elias reveals a more intense UHI toward the end of a radiative night, reaching up to 7.7°C according to mobile measurements. This temperature difference is accentuated by the thermal inversion effect. ASTER satellite imagery provides high precision. The air temperature measurements from fixed weather stations are consistent with the satellite data.
Author Contributions
The authors contributed to all parts of this work. All authors have read and agreed to the published version of the manuscript.
Funding
This research received no external funding.
Data Availability Statement
Not applicable.
Acknowledgments
The authors want to thank the laboratory PRODIG UMR 8586 for providing the Davis weather stations and the equipment needed for car survey measurements.
Conflicts of Interest
The authors declare no conflict of interest.
References
- Barry, R. G. Mountain weather and climate. Routledge. 2013. https://www.taylorfrancis.com/books/mono/10.4324/9780203416020/mountain-weather-climate-roger-barry.
- Whiteman, C. D. Diurnal Mountain Wind. In C. D. Whiteman (Éd.), Mountain Meteorology : Fundamentals and Applications. Oxford University Press 2000. [CrossRef]
- Simpson, J. E. Sea Breeze and Local Winds. Cambridge University Press 1994.
- Carrega, P. Approches de la structure thermique et hygrométrique d’une brise de mer par mesures aéroportées. Climat, pollution atmosphérique, santé 1995. Hommage à Gisèle Escourrou, 165-175. https://pascal-francis.inist.fr/vibad/index.php?action=getRecordDetail&idt=6322224.
- Beltrando, G., Dahech, S., & Madelin, M. L’intérêt de l’étude des brises thermiques : Exemples des brises littoraux et orographiques. Bulletin de la Société géographique de Liège 2008, 51, 49-61.
- Dahech, S. Le vent à Sfax (Tunisie) : Impact sur le climat et la pollution atmosphérique. These de doctorat, Paris 7 2007. https://www.theses.fr/2007PA070002.
- Samar, S. C. Analyse de l’aérologie locale dans la région de Beyrouth durant la période estivale. ГЕОИНФОРМАЦИОННОЕ ОБЕСПЕЧЕНИЕ УСТОЙЧИВОГО РАЗВИТИЯ ТЕРРИТОРИЙ 2018, 281.
- Dahech, S. Impact de la brise de mer sur le confort thermique au Maghreb oriental durant la saison chaude. Cybergeo 2014. [CrossRef]
- Fallot, J. Etude de la ventilation de la vallée de la Sarine en Gruyère. Geographica Helvetica 1991, 46(1), 32-41. [CrossRef]
- Sakr, S. Thermal mechanisms in the wade Jamajem valley. journal of the college of basic education, وقائع المؤتمر الدولي العلمي الافتراضي الاول للعلوم الاجتماعية/الجزء الثانية/الجغرافية 2020. https://www.iasj.net/iasj/download/90997bd557164118.
- Zeinaldine, R., & Dahech, S. Topoclimatic characteristics of Zahlé (Eastern Lebanon) : Thermal breezes and urban heat island phenomenon – Preliminary results. Theoretical and Applied Climatology 2023, 154(3), 1075-1098. [CrossRef]
- King, V. J., & Davis, C. A case study of urban heat islands in the Carolinas. Environmental Hazards 2007, 7(4), 353-359. [CrossRef]
- Lai, L.-W., & Cheng, W.-L. Air quality influenced by urban heat island coupled with synoptic weather patterns. Science of The Total Environment 2009, 407(8), 2724-2733. [CrossRef]
- Dettwiller, J. Deep Soil Temperature Trends and Urban Effects at Paris. Journal of Applied Meteorology (1962-1982) 1970, 9(1), 178-180.
- Oke, T. R. Boundary Layer Climates. Psychology Press 1987.
- Bourque, A. Les changements climatiques et leurs impacts. VertigO - la revue électronique en sciences de l’environnement 2000, Volume 1 Numéro 2, Article Volume 1 Numéro 2. [CrossRef]
- Oke, T. R., & Cleugh, H. A. Urban heat storage derived as energy balance residuals. Boundary-Layer Meteorology 1987, 39(3), 233-245.
- Arnfield, A. J. Two decades of urban climate research : A review of turbulence, exchanges of energy and water, and the urban heat island. International Journal of Climatology 2003, 23(1), 1-26. [CrossRef]
- Kastendeuch, P., Najjar, G., Lacarrere, P., & Colin, J. Modélisation de l’îlot de chaleur urbain à Strasbourg. Climatologie 2010, 7, 21-37. [CrossRef]
- Acero, J. A., Arrizabalaga, J., Kupski, S., & Katzschner, L. Urban heat island in a coastal urban area in northern Spain. Theoretical and Applied Climatology 2013, 113(1), 137-154. [CrossRef]
- Oke, T. R., Mills, G., Christen, A., & Voogt, J. A. Urban Climates. Cambridge University Press 2017.
- Voogt, J. A., & Oke, T. R. Thermal remote sensing of urban climates. Remote Sensing of Environment 2003, 86(3), 370-384. [CrossRef]
- Masson-Delmotte, V. P., Zhai, P., Pirani, S. L., Connors, C., Péan, S., Berger, N., Caud, Y., Chen, L., Goldfarb, M. I., & Scheel Monteiro, P. M. IPCC, 2021 : Summary for Policymakers. In: Climate Change 2021: The Physical Science Basis. Contribution of Working Group I to the Sixth Assessment Report of the Intergovernmental Panel on Climate Change [Report]. Cambridge University Press, Cambridge, United Kingdom and New York, NY, USA 2021. https://researchspace.csir.co.za/dspace/handle/10204/12710.
- Charabi, Y. L’ilôt de chaleur urbain de la métropole lilloise : Mesures et spatialisation. These de doctorat, Lille 1 2001. https://theses.fr/2001LIL10079.
- Neumann, J., & Mahrer, Y. A Theoretical Study of the Land and Sea Breeze Circulation. Journal of the Atmospheric Sciences 1971, 28(4), 532-542. [CrossRef]
- Simpson, J. E., Mansfield, D. A., & Milford, J. R. Inland penetration of sea-breeze fronts. Quarterly Journal of the Royal Meteorological Society 1977, 103(435), 47-76. [CrossRef]
- Borne, K., Chen, D., & Nunez, M. A method for finding sea breeze days under stable synoptic conditions and its application to the Swedish west coast. International Journal of Climatology 1998, 18(8), 901-914. [CrossRef]
- Cordeiro, A., Ornelas, A., & Lameiras, J. The Thermal Regulator Role of Urban Green Spaces : The Case of Coimbra (Portugal). Forests 2023, 14, 2351. [CrossRef]
- Markham, B. L., & Barker, J. L. Radiometric properties of U.S. processed landsat MSS data. Remote Sensing of Environment 1987, 22(1), 39-71. [CrossRef]
- Gillespie, A., Rokugawa, S., Matsunaga, T., Cothern, J. S., Hook, S., & Kahle, A. B. A temperature and emissivity separation algorithm for Advanced Spaceborne Thermal Emission and Reflection Radiometer (ASTER) images. IEEE Transactions on Geoscience and Remote Sensing 1998, 36(4), 1113-1126. [CrossRef]
- Griend, A. a. V. D., & Owe, M. On the relationship between thermal emissivity and the normalized difference vegetation index for natural surfaces. International Journal of Remote Sensing 1993, 14(6), 1119-1131. [CrossRef]
- Zhang, Z., Gong, D., Mao, R., Kim, S.-J., Xu, J., Zhao, X., & Ma, Z. Cause and predictability for the severe haze pollution in downtown Beijing in November–December 2015. Science of The Total Environment 2017, 592, 627-638. [CrossRef]
- Anquetin, S., Guilbaud, C., & Chollet, J.-P. The Formation and Destruction of Inversion Layers within a Deep Valley. Journal of Applied Meteorology and Climatology 1998, 37(12), 1547-1560. [CrossRef]
- Vitasse, Y., Klein, G., Kirchner, J. W., & Rebetez, M. Intensity, frequency and spatial configuration of winter temperature inversions in the closed La Brevine valley, Switzerland. Theoretical and Applied Climatology 2017, 130(3), 1073-1083. [CrossRef]
- Mahrt, L., Richardson, S., Seaman, N., & Stauffer, D. Non-stationary drainage flows and motions in the cold pool. Tellus A: Dynamic Meteorology and Oceanography 2010, 62(5), 698-705. [CrossRef]
- Michelot, N., & Carrega, P. Topoclimatogie et pollution de l’air dans les Alpes-Maritimes : Mécanismes et conséquences en images. EchoGéo 2014. [CrossRef]
- Dubreuil, V., & Marchand, J.-P. Le climat, l’eau et les hommes (p. 330). Presses Universiatires de Rennes 1997. https://hal.science/hal-00318453.
- Abutaleb, K., Ngie, A., Darwish, A., Ahmed, M., Arafat, S., & Ahmed, F. Assessment of Urban Heat Island Using Remotely Sensed Imagery over Greater Cairo, Egypt. Advances in Remote Sensing 2015, 4, 35-47. [CrossRef]
- Dahech, S., & Ghribi, M. Réchauffement climatique en ville et ses répercussions énergétiques. Méditerranée. Revue géographique des pays méditerranéens / Journal of Mediterranean geography 2017, 128, Article 128. [CrossRef]
- Zhang, N., & Wang, Y. Mechanisms for the isolated convections triggered by the sea breeze front and the urban heat Island. Meteorology and Atmospheric Physics 2021, 133(4), 1143-1157. [CrossRef]
- Dahech, S., Beltrando, G., & Bigot, S. Utilisation des données NOAA-AVHRR dans l’étude de la brise thermique et de l’Ilot de chaleur. Exemple de Sfax (se tunisien). Cybergeo: European Journal of Geography 2005. [CrossRef]
Figure 9.
A cross-section of thermal circulations in the Zahlé Valley. During the day (A), the anabatic breeze rises along the slopes, promoting the formation of a homogeneous air layer. At night (B), the katabatic breeze transports cold air down to the valley floor, contributing to the formation of a dense, humid thermal inversion layer.
Disclaimer/Publisher’s Note: The statements, opinions and data contained in all publications are solely those of the individual author(s) and contributor(s) and not of MDPI and/or the editor(s). MDPI and/or the editor(s) disclaim responsibility for any injury to people or property resulting from any ideas, methods, instructions or products referred to in the content. |
© 2025 by the authors. Licensee MDPI, Basel, Switzerland. This article is an open access article distributed under the terms and conditions of the Creative Commons Attribution (CC BY) license (http://creativecommons.org/licenses/by/4.0/).
Copyright: This open access article is published under a Creative Commons CC BY 4.0 license, which permit the free download, distribution, and reuse, provided that the author and preprint are cited in any reuse.


