Submitted:
01 April 2025
Posted:
02 April 2025
You are already at the latest version
Abstract
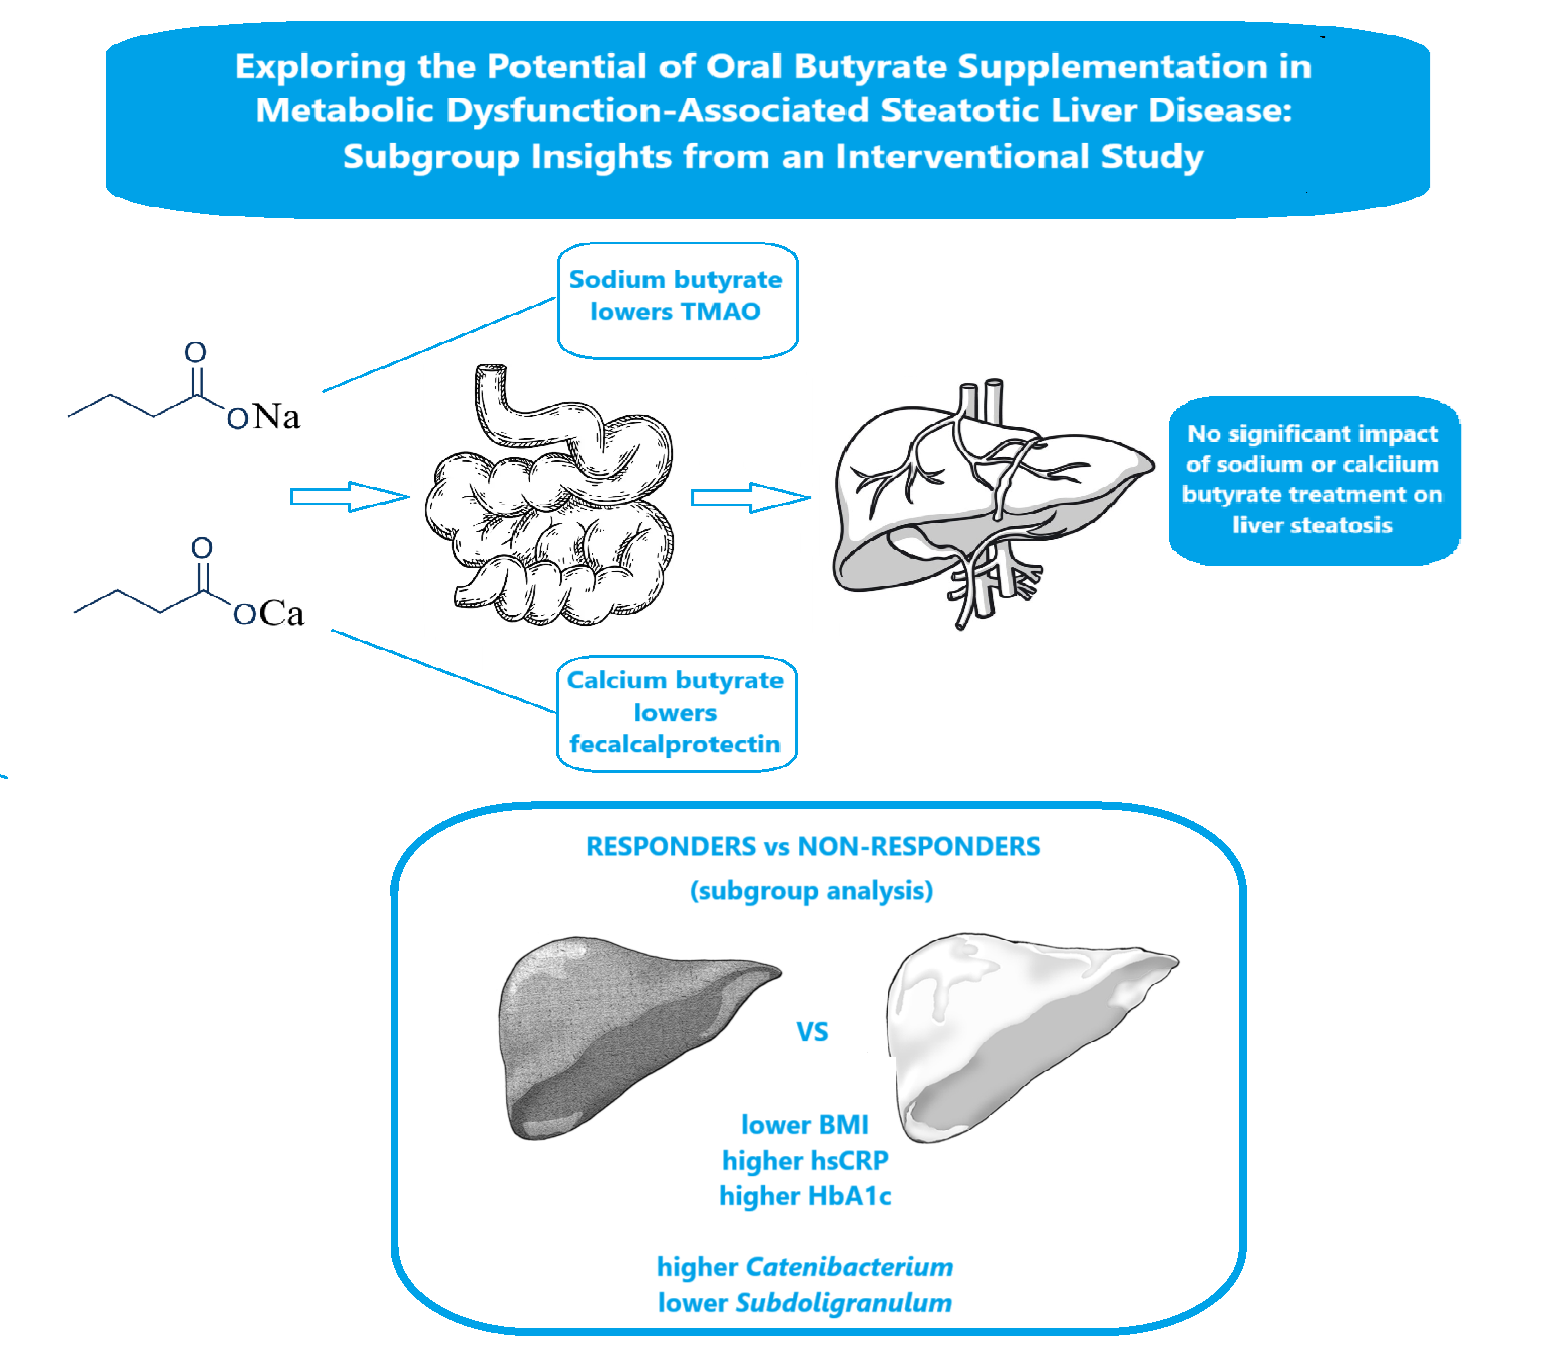
Background: Metabolic dysfunction-associated steatotic liver disease (MASLD) is a common cause of chronic liver disease and is closely associated with metabolic ab-normalities and cardiovascular risks. Butyrate, a short-chain fatty acid produced by gut microbiota, has the potential to enhance liver health by modulating inflammation and supporting gut barrier integrity. This study aimed to investigate and compare the effects of sodium butyrate and calcium butyrate in patients with MASLD. Methods: In this single-center, randomized clinical trial, 181 patients with MASLD were enrolled and assigned to receive either sodium butyrate (n=121) or calcium butyrate (n=60) supplementation at a daily dose of 1000 mg. The primary endpoint was the change in liver steatosis, measured using the Controlled Attenuation Parameter (CAP) via Fi-broScan®. Secondary endpoints included liver stiffness, biochemical parameters, se-rum and fecal calprotectin levels, stool short-chain fatty acid levels, and microbiome composition. A subgroup analysis compared responders (a ≥5% reduction in CAP) to non-responders. Results: There were no significant changes in CAP values for either group (ΔCAP: sodium butyrate, 0.84; calcium butyrate, –0.23; p=0.70). Sodium butyrate significantly reduced serum trimethylamine N-oxide, while calcium butyrate led to a decrease in fecal calprotectin levels. Responders demonstrated a lower body mass in-dex, higher levels of high-sensitivity C-reactive protein and HbA1c, and distinct mi-crobiome profiles, characterized by lower abundance of Subdoligranulum and higher abundance of Catenibacterium. Conclusions: Although butyrate supplementation did not significantly improve liver steatosis as measured by CAP, the differing effects on metabolic and inflammatory markers suggest that there may be potential benefits for specific subgroups of patients with MASLD.
Keywords:
metabolic dysfunction-associated steatotic liver disease
; butyrate supplementation
; microbiome
; inflammation
1. Introduction
Metabolic syndrome-related steatotic liver disease (MASLD) is a leading cause of chronic liver disease worldwide, affecting nearly 30% of adults. Its significance is amplified by its strong association with other metabolic conditions, such as obesity, hyperlipidemia, diabetes mellitus, and cardiovascular disease, which is the primary cause of mortality among patients with MASLD [1]. MASLD encompasses a range of pathological conditions, from simple steatosis to non-alcoholic steatohepatitis, and can ultimately progress to liver fibrosis and hepatocellular carcinoma [2]. The exact pathogenesis of MASLD is not fully understood, although several molecular mechanisms have been proposed to explain its development. Multiple factors likely contribute to the onset of MASLD, resulting in various clinical manifestations. Recent research has increasingly highlighted a connection between MASLD and disturbances in gut microbiota [3]. Researchers suggest that abnormalities in the communication system between the intestine and the liver—often referred to as the "gut-liver axis"—may play a significant role in the onset and progression of liver disease [4]. The gut and liver are interconnected through the portal venous system, meaning the liver is constantly exposed to intestinal bacteria and their byproducts, such as endotoxins and lipopolysaccharides (LPS). The innate immune system, particularly in the liver, recognizes pathogen-associated molecular patterns primarily through Toll-like receptors (TLRs). TLR-mediated signaling is crucial for both liver physiology and pathology. However, hyperactivation of these pathways can lead to liver damage and fibrosis via the NF-κB intracellular pathway. For instance, LPS, one of the primary bacterial byproducts, is a potent stimulant of innate immune responses because it binds to the TLR4 complex. Various liver cells—including hepatocytes, sinusoidal endothelial cells, biliary epithelial cells, Kupffer cells, hepatic stellate cells, and hepatic dendritic cells—all express TLR4, making them susceptible to LPS [4]. Other proposed mechanisms involved in the pathophysiology of MASLD include the toxic effects of gut-synthesized ethanol, secondary bile acids, and the gut production of trimethylamine N-oxide (TMAO), all of which significantly impact hepatocyte lipid metabolism [5].
These observations suggest that supporting the integrity of the gut wall could positively influence liver health. Short-chain fatty acids (SCFAs)— mainly acetate, propionate, butyrate and valerate—are bacterial metabolites produced through fiber fermentation [6]. Several bacterial families are primarily associated with fiber fermentation and SCFA synthesis: Bifidobacteriaceae, Prevotellaceae, Akkermansiaceae, Lachnospiraceae, and Fusobacteriaceae [7]. They may play a crucial role in maintaining the intestinal barrier by enhancing epithelial tight junctions and regulating the crosstalk between the gut and liver. Their protective effect on gut wall integrity is primarily driven through hypoxia-induced factor mechanisms, but SCFAs also have the potential to upregulate tight junction proteins such as claudin-1 and zonula occludens-1 independently [8]. Furthermore, SCFA activity is not limited to the gut wall, it also has significant effects at the liver level. Animal models have shown that SCFAs can influence cholesterol metabolism in hepatocytes and activate autophagy- a necessary process for regulating MASLD by maintaining lipid homeostasis and suppressing hepatic inflammation [9,10]. Recently, studies have demonstrated that SCFAs regulate liver metabolic processes by modulating the expression of microRNAs as signaling molecules [11].
Supplementing with short-chain fatty acids (SCFAs) may be a promising therapeutic approach for treating metabolic dysfunction-associated steatotic liver disease (MASLD). Butyrate, in particular, has established itself as a safe and potentially beneficial treatment for irritable bowel syndrome. However, the experience with SCFA supplementation specifically for MASLD is limited, as most studies have been conducted on animal models [6]. To date, only one recent study has investigated this treatment in humans, showing its benefits for reducing liver steatosis in this population [12]. Therefore, our study aims to expand knowledge in the field and evaluate the potential benefits and safety of oral butyrate supplementation in subjects diagnosed with MASLD. We also aimed to investigate whether there is a difference in the efficacy between sodium butyrate and calcium butyrate supplements. Additionally, we examined the clinical and laboratory factors that may predispose patients to respond to therapy, with the goal of reducing liver steatosis and inflammatory markers.
2. Results
After initially assessing 221 patients, 181 individuals completed the screening process and provided informed consent to participate in the study. They were randomly assigned to two groups in a 2:1 ratio, favoring sodium butyrate. The first group, which received sodium butyrate, included 121 patients, while the second group, treated with calcium butyrate, consisted of 60 patients. The difference in the number of patients between the groups was primarily due to the availability of the drugs supplied by the sponsors. However, both groups met the minimum sample size recommended by Raosoft software. A total of 4 patients from the calcium butyrate group dropped out of the study: 2 did not take the minimal amount of provided tablets, and the contact with another 2 patients from the same group was lost (Figure 1). That led to a count of 177 patients completing the study.
Figure 1.
Study flow diagram.
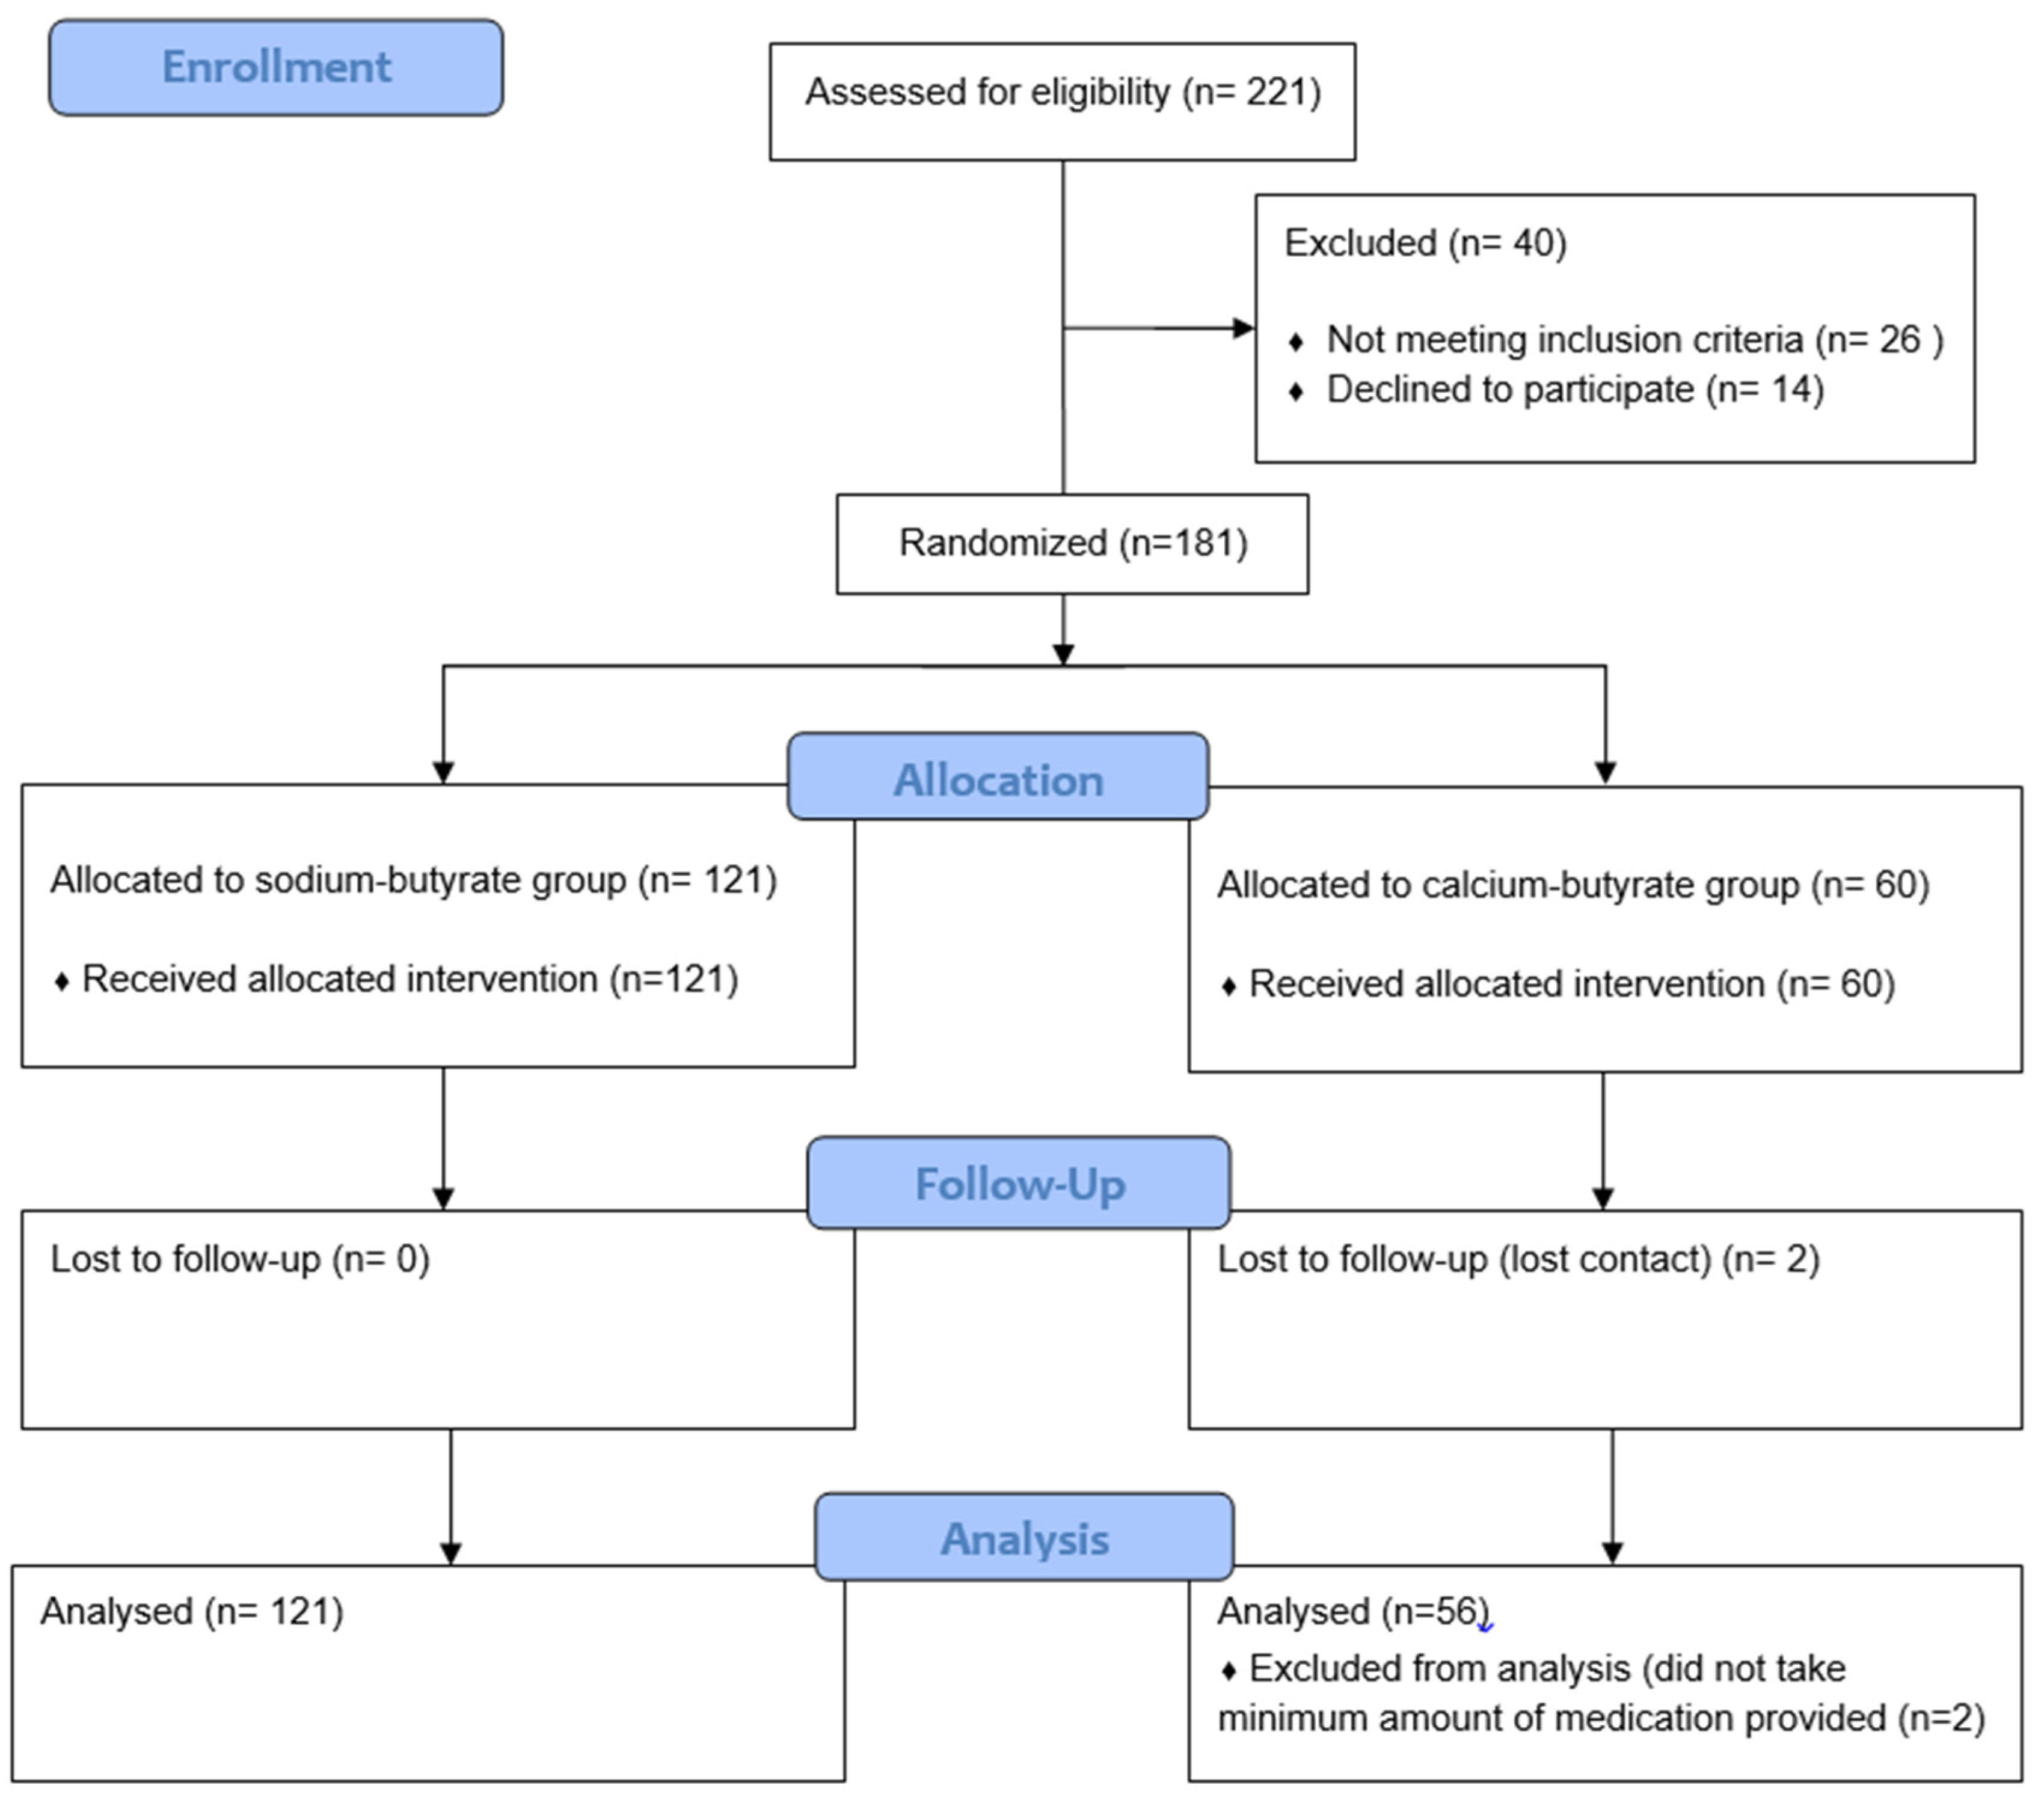

Table 1.
Baseline characteristics of both groups of patients.
| Parameter | Sodium-butyrate | Calcium-butyrate | p |
|---|---|---|---|
| N | 121 | 56 | - |
| Age | 51 ± 15 | 50 ± 16 | 0.68 |
| BMI | 27.8 ± 1.4 | 27.5 ± 1.8 | 0.19 |
| ALT (U/L) | 59 ± 10 | 61 ± 10 | 0.2 |
| AST (U/L) | 56 ± 11 | 57 ± 11 | 0.34 |
| GGT (U/L) | 70 ± 18 | 69 ± 19 | 0.9 |
| Total cholesterol (mg/dl) | 355 ± 18 | 351 ± 18 | 0.24 |
| Triglycerides (mg/dl) | 166 ± 38 | 167 ± 36 | 0.86 |
| HbA1c (%) | 6.5 ± 0.5 | 6.6 ± 0.5 | 0.09 |
| hsCRP (mg/L) | 3.2 (1.1-9.1) | 4 (1.1-9.2) | 0.9 |
| Interleukin 6 (pg/ml) | 42.2 ± 9.2 | 40.7 ± 8.5 | 0.31 |
| CK18F (U/L) | 248 ± 38 | 248 ± 32 | 0.93 |
| TMAO (μmol/L) | 4.3 ± 2 | 4 ± 2.1 | 0.4 |
| Stool SCFA (mmol/L) | 176 ± 36 | 167 ± 36 | 0.13 |
| Fecal Calprotectin (μg/g) | 100 (70-130) | 90 (70-120) | 0.23 |
| Baseline CAP (dB/m) | 290 ± 21 | 289 ± 19 | 0.82 |
| Baseline LSM (kPA) | 4.3 ± 2.4 | 4.9 ± 2.6 | 0.09 |
BMI- Body mass index, ALT- alanine aminotransferase, AST- aspartate aminotransferase, GGT- gamma-glutamyl transferase, HDL-C- high-density lipoprotein cholesterol, HbA1c- hemoglobin A1C, hsCRP- high-sensitivity C-reactive protein, CKF18- cytokeratin 18 fragment, TMAO- trimethylamine N-oxide, SCFA- short chain fatty acids, CAP- Controlled Attenuation Parameter, LSM- liver stiffnes measurement.
No significant differences were detected between the groups regarding the measured parameters at the study's starting point.
After completing the treatment protocol for 177 patients, we found that butyrate supplementation did not have a significant impact on Controlled Attenuation Parameter (CAP) dynamics in either group. For sodium butyrate, the baseline and endpoint CAP measurements were 290 dB/m and 291 dB/m, respectively (p=0.81). For calcium butyrate, the measurements remained constant at 289 dB/m for both baseline and endpoint (p=0.70). Furthermore, there was no notable difference in the effects of sodium butyrate compared to calcium butyrate on CAP dynamics throughout the study, with change in CAP (ΔCAP) values of 0.84 for sodium butyrate and -0.23 for calcium butyrate (p=0.70). The same could be said for liver stiffness measurements and inflammatory parameters (see Table S1). However, we observed a significant effect of sodium butyrate on trimethylamine N-oxide (TMAO) dynamics and of calcium-butyrate on fecal calprotectin levels (Figure 2). No significant adverse events were observed during the study, and the tolerability of treatment was high in both the sodium butyrate and calcium butyrate patient groups (8.4 vs. 8.7, p=0.74). Adherence to a specific diet and physical activity regimen was high in both groups of patients and over 80% for all patients included in the analysis.
2.1. Insights from a Subgroup Analysis
A reduction of at least 5% in CAP was considered an adequate response to the treatment. Of the participants, 30 patients met this threshold, which included 16 from the sodium-butyrate group and 14 from the calcium-butyrate group. A comparison was conducted between the baseline characteristics of both the responder and non-responder groups to identify factors that could predict a positive response to butyrate treatment.
One notable difference was in Body Mass Index (BMI), with responders having significantly lower BMI values than non-responders. The average BMI for responders was 26.1 ± 1.7, while for non-responders it was 27.8 ± 1.7 (p < 0.001). Additionally, a higher proportion of patients with a normal BMI (≤25 kg/m²) was found in the responder group, at 33.3%, compared to 13.6% in the non-responder group.
Another important distinction between the two groups was their baseline high-sensitivity C-reactive protein (hsCRP) levels, which were statistically significantly higher in the responder group. The average hsCRP level for responders was 7.7 ± 4.2 mg/L, whereas it was 4.9 ± 4.4 mg/L for non-responders (p = 0.006). We also observed a statistically significant difference in the starting Hemoglobin A1c (HbA1c) values between responders and non-responders, with HbA1c values being higher in the responder group (6.7 ± 0.4 vs 6.4 ±0.5, p=0.037). No significant effect of baseline cytokeratin 18 fragment (CKF18), stool SCFA, or other biochemical tests on butyrate response was observed (see Table 2).
The alpha- and beta-diversity indices of the microbiome were similar for both groups of patients. However, there were some differences in microbiome composition between responders and non-responders. The abundance of the bacterium genus Subdoligranulum was significantly lower among responders (p=0.047). Conversely, the abundance of Catenibacterium was higher among responders compared to non-responders (p=0.028). No other significant distinctions in bacterial genera and families between the groups were observed (Figure 3).
3. Discussion
Both sodium and calcium butyrate did not significantly affect the level of liver steatosis in the treated patient groups. However, sodium butyrate significantly reduced the level of TMAO, while calcium butyrate significantly decreased the levels of fecal calprotectin. In the group of patients who responded to butyrate treatment, lower BMI, higher hsCRP, and higher HbA1c levels were identified as positive predictors of treatment response. Additionally, a lower abundance of Subdoligranulum and a higher abundance of Catenibacterium in the stool microbiome may predispose patients to respond positively to butyrate supplementation. Overall, the tolerability of butyrate treatment was good, with no significant adverse events reported.
Despite the theoretical advantages and promising results from preclinical studies, our research found that supplementation with sodium or calcium butyrate did not significantly impact CAP dynamics or liver stiffness. The only randomized clinical trial examining the benefits of a calcium butyrate-based formula in patients with fatty liver was conducted by Fogacci et al. Our study closely resembles this trial in terms of the formulation and dosage of the butyrate formula, the similar diet followed, and the duration of the treatment period [12]. However, the key difference lies in the method used to assess liver steatosis. Fogacci's study demonstrated positive effects of butyrate supplementation on standardized liver steatosis indices, such as the hepatic steatosis index (HSI) and the fatty liver index (FLI). These findings were based on clinical and laboratory parameters as well as subjective assessments of echo-sonographic liver hyperechogenicity. In contrast, we employed FibroScan®, a more objective method for evaluating liver steatosis. This difference in assessment methods may explain why we did not observe significant effects, as laboratory exam results and FibroScan® findings regarding liver steatosis could yield differing results.
Some benefits of butyrate supplementation have been observed, particularly the positive effects of sodium butyrate on TMAO levels and calcium butyrate on fecal calprotectin levels. TMAO, which is produced by the microbiome, has gained significant attention due to its correlation with atherosclerosis and cardiovascular risk [13]. For instance, incorporating TMAO into models of traditional cardiovascular risk factors enhances the assessment of five-year all-cause mortality in individuals with stable coronary artery disease [14]. TMAO contributes to the progression of MASLD primarily by promoting the expression of sterol regulatory element-binding protein-1c (SREBP-1c), a critical regulator of liver lipid metabolism that increases triglyceride synthesis and favors the progression of hepatic steatosis [15]. Lately TMAO has emerged as a potential pharmacodynamic or response biomarker in microbiota-targeted therapies for cardiovascular and metabolic diseases [13]. However, no literature links butyrate therapy or stool SCFA levels to serum TMAO levels and MASLD development. For an example, study by Calderon-Perez did not identify an indirect correlation between stool SCFA levels and serum TMAO levels. Nevertheless, a more detailed microbiome analysis uncovered an inverse relationship between serum TMAO levels and the abundance of SCFA-producing bacteria, such as Faecalibacterium prausnitzii, in the microbiomes of hypertensive patients [16]. Based on our study, we can hypothesize that by butyrate supplementation we can lower TMAO levels over an extended period and by doing that we may improve cardiovascular health and slow the progression of MASLD.
Fecal calprotectin is a widely recognized marker of intestinal inflammation and is used both as a diagnostic tool and a treatment indicator, particularly for individuals with inflammatory bowel disease (IBD). During episodes of intestinal inflammation, neutrophils migrate to the intestinal mucosa and release calprotectin, a protein complex found within these cells [17]. In healthy individuals, fecal calprotectin levels typically range from 10 to 50 μg per gram of feces. However, in cases of gut inflammation, these levels can rise significantly, often exceeding 100 to 200 μg/g [17]. Such elevations can be associated with various conditions, including MASLD [18]. Pathological conditions affecting the lower parts of the digestive tract are more likely to increase fecal calprotectin levels. Currently, there is no consensus on the thresholds that differentiate normal fecal calprotectin levels from those that are considered pathological. Multiple studies have demonstrated the beneficial effects of butyrate supplementation on fecal calprotectin levels, primarily focusing on the IBD population [19]. However, only one study conducted by Tougaard assessed the impact of butyrate on fecal calprotectin levels in individuals with metabolic diseases, specifically type 1 diabetes mellitus. In that study, the authors found no significant benefits of sodium butyrate on fecal calprotectin levels [20]. Our findings align with the Tougaard study regarding sodium butyrate; however, we observed substantial positive effects of calcium butyrate. We hypothesize that these effects may be related to the slower solubility of calcium butyrate compared to sodium butyrate [21]. This slower solubility may enhance the impact of calcium butyrate in the lower parts of the digestive tract, thereby influencing fecal calprotectin levels more significantly.
In our study, we demonstrated the significant impact of butyrate supplementation on liver steatosis in patients with a near-normal or normal BMI. It is important to recognize that liver steatosis is not limited to obese individuals- 19-40% of MASLD patients have a normal BMI [22]. Lean patients with MASLD share several pathophysiological mechanisms with their obese counterparts, but there are distinct features that differentiate the two groups. One hypothesis suggests that insulin resistance plays a key role in non-obese MASLD patients by increasing de novo lipogenesis and the delivery of free fatty acids to the liver [23]. Several studies have indicated that the contribution of high visceral fat and sarcopenia to MASLD is more significant than that of total body mass [24,25]. In this context, lean individuals with MASLD have relatively higher amounts of visceral adipose tissue and lower skeletal mass compared to healthy controls. Furthermore, numerous studies have reported an association between sarcopenia and complications related to MASLD, such as steatohepatitis and liver fibrosis, independent of obesity [26,27]. Finally, it is important to highlight that visceral adiposity and sarcopenia seem to act synergistically with chronic inflammation in the pathogenesis and progression of MASLD in lean patients [26]. Notably, CRP levels correlate directly with the level of visceral adiposity and negatively with appendicular muscle mass [28]. This context helps explain the observed results of our study, where the group of responders had significantly lower BMI, higher inflammatory markers, and elevated HbA1c values compared to non-responder individuals.
An important aspect of our study is the analysis of the stool microbiome. While we did not monitor the microbiome's dynamics throughout the study, our goal was to understand the baseline differences between the microbiomes of patients who responded to treatment and those who did not show significant improvement in liver steatosis. Although the microbiome characteristics were mostly similar between the two groups, we identified two key differences: the responder group exhibited a lower abundance of Subdoligranulum and a higher abundance of Catenibacterium. Many experimental studies have recognized the beneficial effects of Subdoligranulum on metabolic health [29]. Some of these studies suggest that its correlation with improved metabolic parameters may be coincidental or due to its tendency to thrive in healthier microbial communities and in the presence of undigested fibers [29]. However, we cannot overlook the fact that this bacterial genus is one of the primary butyrate-producing bacteria in the human microbiome [30]. These bacteria play a crucial role in gut barrier function. A study by Leclercq demonstrated an indirect correlation between the presence of Subdoligranulum and the influx of bacterial byproducts, especially in individuals with liver cirrhosis [31]. Furthermore, Louis established a negative correlation between Subdoligranulum abundance and CRP levels, as well as the Homeostasis Model Assessment of Insulin Resistance (HOMA-IR) [32]. Zhang also noted a negative correlation between Subdoligranulum levels and HbA1c, while showing a direct correlation with high-density lipoprotein chlesterol [33]. Additionally, we can observe the connection of Subdoligranulum to metabolic health through microbiome enrichment with this bacterium during fasting periods and the initiation of metformin therapy [34]. Catenibacterium is a Gram-positive, anaerobic genus belonging to the Erysipelotrichidae family, with one known species - Catenibacterium mitsuokai. This bacteria also have an ability to synthetize SCFA. There is limited literature on its metabolic functions, and the data regarding its role in disease development is mixed. Some studies suggest that it may play an important role in the elderly, providing a protective effect against frailty development [35]. Conversely, research involving patients with human immunodeficiency virus infection and chronic renal disease indicates that it could have a detrimental effect on gut barrier integrity, potentially facilitating the transfer of other bacteria and bacterial products into the bloodstream [36,37].
4. Materials and Methods
Our single-center study was conducted as a randomized clinical trial comparing two types of butyrate supplementation: 1000 mg of sodium- and 1000 mg of calcium-butyrate. The study involved 170 patients diagnosed with MASLD. This diagnosis was established using a FibroScan® (Echosens, Paris, France) with a Controlled Attenuation Parameter (CAP) score greater than 248 dB/m, assessed by two independent gastroenterologists (DZ, MM) [38]. Additionally, alanine aminotransferase (ALT) levels above 40 U/L for men and 35 U/L for women were required at the initial visit. Also, patients had to fulfill at least one of the cardiometabolic criteria, such as obesity, high blood pressure, or dyslipidemia. Exclusion criteria included the unwillingness to provide informed consent, alcohol consumption exceeding 30 grams per day for the six months prior to enrollment, viral hepatitis, liver cancer, bowel or liver resection, previous inflammatory bowel disease (IBD), hypothyroidism, pregnancy, and breastfeeding. Patients who had taken different probiotic or antibiotic therapies within two weeks before or during the study were also excluded. The study complied with the ethical guidelines in the Declaration of Helsinki. The protocol was approved by the Institutional Ethical Committee and filed under a number 1/XI/24.
4.1. Intervention
After signing the informed consent, all patients met with a qualified dietitian. A specific diet was implemented four weeks before treatment and continued throughout the study. The diet plan required patients to consume 20-30 kcal per kilogram of body weight, divided into 4-5 meals. It specified that 35-40% of the caloric intake should come from fats, 20% from proteins, and 40-45% from carbohydrates. Patients were provided with a cookbook containing 150 Mediterranean diet recipes. Additionally, they were asked to complete the MedQ-Sus questionnaire online or on-site to assess adherence to the planned diet [39]. All patients were encouraged to take regular daily walks, aiming for over 8,000 steps. Adherence to this walking goal was monitored using the Walkmeter GPS® app (Abvio Inc., San Francisco, CA).
After the four-week run-in period on the specific diet, patients were randomly divided into two groups. One group received tablets containing 500 mg of sodium butyrate, which they took twice daily. The other group was given identical-looking tablets containing 500 mg of calcium butyrate, following the same dosing protocol. Computerized block randomization was performed off-site by a statistician. After randomization, the number of the therapeutic package was sent to the researchers, and the patients were issued the appropriate therapeutic package. Therapeutic packages were distributed to the patients during visits that were scheduled every four weeks on-site. The randomization data was stored on a secure server that was not accessible to patients or trial personnel until all results were finalized. Kit packaging and numbering were conducted offsite. After completing the study, patients were asked to return all unused tablets to the center. Their compliance with the therapy was evaluated by counting the returned tablets, with a maximum allowance of 20% for unused tablets.
4.2. Assessment
The primary objective of the study was to evaluate the effect of the treatment on the CAP dynamics. To quantify liver steatosis, transient elastography with CAP determination was utilized. The examinations were conducted with the patient in a supine position, starting from the mid-axillary line and using a FibroScan® 502 Touch system (Echosens), with the choice of probe guided by the system’s software. Each patient underwent a minimum of 10 valid examinations performed by two board-certified hepatologists (DZ and MM). The average of the two CAP values was calculated for each patient. Patients were examined at two time points: at baseline—on the day the first therapeutic package was issued—and at the endpoint—within 48 hours of receiving the last therapeutic dose.
Biochemical analyses were conducted on venous blood collected after an overnight fast. The following parameters were assessed: Alanine aminotransferase (ALT), aspartate aminotransferase (AST), gamma-glutamyl transferase (GGT), total cholesterol (TC), triglycerides (TG), hemoglobin A1C (HbA1C), high-sensitivity C-reactive protein (hs-CRP), interleukin 6 (IL-6), and cytokeratin 18 fragment (CK18F).
A 2-ml serum sample from each patient was used to analyze levels of TMAO. Ultrahigh performance liquid chromatography-tandem mass spectrometry using an UPLC Acquity coupled to a MicroMassQuattro Premier XE mass spectrometer (Waters Corporation, Milford, MA, USA) was performed in order to determine the total serum levels of TMAO, according to the procedure described by Awwad et al [40]. The samples were separated using a gradient mobile phase with a mixture of 15 mmol/L ammonium formate (pH 3.5) as solvent A and acetonitrile as solvent B. Gradient conditions were: 0.0–2.0 min, 10–30% A; 2.0–3.5 min, 30% A; 3.6–4.6 min, 40% A; and 4.7–6.0 min, 10% A. We used the following settings- flow rate: 0.4 mL/min, sample injection volume: 3 μL (partial loop mode), column temperature: 30°C, sample temperature: 4°C; total runtime: 6 min. Blood samples for biochemical analysis and TMAO were collected at two time points: baseline and endpoint.
During the initial visit, patients were asked to provide fresh stool samples on the day the therapeutic packages were issued. Part of the stool was used for the biochemical measurement of fecal calprotectin. A portion of the stool sample was freeze-dried and subsequently used for short-chain fatty acid (SCFA) determination through capillary gas chromatography, following the method first described by Scheppach [41]. Briefly, approximately 80 mg of the dried sample was mixed with 1 ml of an extraction solution containing 0.1 mol/L oxalic acid, 40 mmol/L sodium azide, and 0.1 mmol/L caproic acid as an internal standard. SCFA concentrations were measured in the resulting supernatant using an Agilent 6890N gas chromatograph equipped with flame ionization detection and an Innowax capillary column measuring 30 m × 530 µm × 0.1 µm. Data were processed using ChemStation software [42].
Another portion of the stool sample was used for microbiome analysis through 16S rRNA deep gene sequencing. Genomic deoxyribonucleic acid (DNA) was isolated from the samples using the ZR Fecal DNA MiniPrep™ kit (Zymo Research Corp., CA, USA). After dilution to a concentration of 5 ng/µl, 10 µl samples were used for 16S rRNA amplicon sequencing, targeting the V3-V4 hypervariable region. Sequencing was performed using the NovaSeq 6000 PE250-Illumina platform (Novogene Co Ltd, Hong Kong). The obtained data were filtered using Trimmomatic™ software and then analyzed using Quantitative Insights Into Microbial Ecology™ software according to the protocol described by Caporaso [43]. The composition of the microbiome was defined using Uparse software (Uparse v7.0.1001) [44]. Using R statistical software, the Shannon and Simpson indices of alpha diversity were calculated, and beta diversity was estimated using a weighted UniFrac measurement.
The principal investigator consistently monitored the adverse events, clinical safety parameters, laboratory findings, and results from physical examinations. These findings were reported to the Institutional Ethics Committee. The subjective tolerability of the treatments was assessed using a Visual Analogue Scale ranging from 1 to 10 [45].
4.3. Statistical Analysis
The minimal sample size of the intention-to-treat population (n=120, 60 per group) was calculated using Raosoft Software and based on the count of the population of MASLD outpatients regularly followed-up (n=400), the power of 90% to detect a 10% change of CAP, with an error level of 5% and predicted drop-out of about 10% [46].
A T-test or chi-squared test for two paired samples was conducted to identify any statistically significant differences between the baseline and endpoint CAP values, along with the biochemical parameters, TMAO, stool SCFA and microbiome. We also analyzed the dynamics of CAP by calculating the absolute change between the baseline and endpoint values (endpoint CAP minus baseline CAP). A decrease in CAP of at least 5% was considered a positive clinical response to treatment. Subsequently, we compared the baseline clinical, biochemical, and microbiome characteristics, as well as stool SCFA levels, between patients who showed a positive treatment response and those who did not.
5. Conclusions
MASLD has emerged as one of the leading healthcare problems worldwide. There is much discussion surrounding the therapy and prevention of MASLD, with new and effective therapeutic modalities currently in the pipeline. However, the potential role of butyrate supplementation may be overlooked. Our study suggests that certain subgroups of patients with MASLD may benefit from this type of treatment, particularly non-obese individuals, those with insulin resistance, markerd inflammation, or specific gut microbiome compositions. Butyrate supplementation could serve as a cost-effective and readily available complementary therapeutic option
Supplementary Materials
The following supporting information can be downloaded at the website of this paper posted on Preprints.org. Table S1: Dynamic of measured parameters at baseline and endpoint of the study.
Author Contributions
Conceptualization MM, PS and VSP.; methodology MM and MPM.; software, MPM.; formal analysis, MPM, SE; investigation, AS, PV, DZ.; resources, MPM, MM.; data curation, AS, PV, DZ.; writing—original draft preparation, MM, MPM; writing—review and editing, VSP, PS.; visualization, MM.; supervision, VSP, PS.; project administration, MM.; funding acquisition, MPM. All authors have read and agreed to the published version of the manuscript.
Funding
This research received no external funding.
Institutional Review Board Statement
The study was conducted in accordance with the Declaration of Helsinki, and approved by the Institutional Review Board of University Medical Center Zvezdara (1/XI/24) on 18th of November, 2024.
Informed Consent Statement
Informed consent was obtained from all subjects involved in the study.
Data Availability Statement
Study data available at 10.6084/m9.figshare.28509464.
Acknowledgments
I would like to thank Pontus Pharma, Belgrade, Serbia and ADOC Pharma, Belgrade Serbia for support of the project.
Conflicts of Interest
The authors declare no conflicts of interest.
Abbreviations
MASLD- Metabolic syndrome-related steatotic liver disease LPS- lipopolysaccharide TLR- Toll-like receptor SCFA- Short-chain fatty acid BMI- Body mass index, ALT- alanine aminotransferase, AST- aspartate aminotransferase, GGT- gamma-glutamyl transferase, HDL-C- high-density lipoprotein cholesterol, HbA1c- hemoglobin A1C, hsCRP- high-sensitivity C-reactive protein, CKF18- cytokeratin 18 fragment, TMAO- trimethylamine N-oxide, SCFA- short chain fatty acids, CAP- Controlled Attenuation Parameter, LSM- liver stiffnes measurement.
Appendix A: Appendix A.1
Table A1.
Dynamic of measured parameters at baseline and endpoint of the study.
| Parameter | Sodium-butyrate | Calcium-butyrate | p |
|---|---|---|---|
| N | 121 | 56 | - |
| ALT (U/L) | -0.3 ± 9.7 | -0.2 ± 9.4 | 0.95 |
| AST (U/L) | 0.6 ± 8.6 | 0.8 ± 7.1 | 0.88 |
| GGT (U/L) | -0.3 ± 6.3 | 0.6 ± 6.4 | 0.34 |
| hsCRP (mg/L) | 0.5 ± 2.1 | 0.8 ± 2.4 | 0.36 |
| Interleukin 6 (pg/ml) | 1.5 ± 9.6 | 0.8 ± 10.8 | 0.68 |
| CK18F (U/L) | 1.3 ± 22.4 | -5.5 ± 22.8 | 0.065 |
| TMAO (μmol/L) | 10 ± 6 | ± 1.3 | 0.001 |
| Fecal Calprotectin (μg/g) | 3 ± 26.6 | 9 ± 31.9 | 0.16 |
| Baseline CAP (dB/m) | 2 ± 11.8 | 0.2 ± 18.1 | 0.42 |
| Baseline LSM (kPA) | -0.09 ± 0.6 | 0.2 ± 0.6 | 0.22 |
References
- Le, M.H.; Yeo, Y.H.; Li, X.; Li, J.; Zou, B.; Wu, Y.; et al. 2019 Global NAFLD prevalence: a systematic review and meta-analysis. Clin Gastroenterol Hepatol. 2022, 20, 2809–17. [Google Scholar] [CrossRef] [PubMed]
- Targher, G.; Byrne, C.D.; Tilg, H. MASLD: a systemic metabolic disorder with cardiovascular and malignant complications. Gut. 2024, 73, 691–702. [Google Scholar] [CrossRef] [PubMed]
- Schwärzler, J.; Grabherr, F.; Grander, C.; Adolph, T.E.; Tilg, H. The pathophysiology of MASLD: an immunometabolic perspective. Expert Rev Clin Immunol. 2024, 20, 375–386. [Google Scholar] [CrossRef] [PubMed]
- Vallianou, N.G.; Kounatidis, D.; Psallida, S.; Vythoulkas-Biotis, N.; Adamou, A.; Zachariadou, T.; Kargioti, S.; Karampela, I.; Dalamaga, M. NAFLD/MASLD and the Gut-Liver Axis: From Pathogenesis to Treatment Options. Metabolites. 2024, 14, 366. [Google Scholar] [CrossRef] [PubMed]
- Li, X.; Hong, J.; Wang, Y.; Pei, M.; Wang, L.; Gong, Z. Trimethylamine-N-Oxide Pathway: A Potential Target for the Treatment of MAFLD. Front Mol Biosci. 2021, 8, 733507. [Google Scholar] [CrossRef]
- Amiri, P.; Arefhosseini, S.; Bakhshimoghaddam, F.; Jamshidi Gurvan, H.; Hosseini, S.A. Mechanistic insights into the pleiotropic effects of butyrate as a potential therapeutic agent on NAFLD management: A systematic review. Front Nutr. 2022, 9, 1037696. [Google Scholar] [CrossRef] [PubMed] [PubMed Central]
- Fusco, W.; Lorenzo, M.B.; Cintoni, M.; Porcari, S.; Rinninella, E.; Kaitsas, F.; Lener, E.; Mele, M.C.; Gasbarrini, A.; Collado, M.C.; Cammarota, G.; Ianiro, G. Short-Chain Fatty-Acid-Producing Bacteria: Key Components of the Human Gut Microbiota. Nutrients. 2023, 15, 2211. [Google Scholar] [CrossRef] [PubMed] [PubMed Central]
- Yan, H.; Ajuwon, K.M. Butyrate modifies intestinal barrier function in IPEC-J2 cells through a selective upregulation of tight junction proteins and activation of the Akt signaling pathway. PLoS One. 2017, 12, e0179586. [Google Scholar] [CrossRef] [PubMed] [PubMed Central]
- Li, X.; He, M.; Yi, X.; Lu, X.; Zhu, M.; Xue, M.; Tang, Y.; Zhu, Y. Short-chain fatty acids in nonalcoholic fatty liver disease: New prospects for short-chain fatty acids as therapeutic targets. Heliyon. 2024, 10, e26991. [Google Scholar] [CrossRef] [PubMed] [PubMed Central]
- Qian, H.; Chao, X.; Williams, J.; Fulte, S.; Li, T.; Yang, L.; Ding, W.X. Autophagy in liver diseases: A review. Mol Aspects Med. 2021, 82, 100973. [Google Scholar] [CrossRef] [PubMed] [PubMed Central]
- Pant, K.; Yadav, A.K.; Gupta, P.; Islam, R.; Saraya, A.; Venugopal, S.K. Butyrate induces ROS-mediated apoptosis by modulating miR-22/SIRT-1 pathway in hepatic cancer cells. Redox Biol. 2017, 12, 340–349. [Google Scholar] [CrossRef] [PubMed] [PubMed Central]
- Fogacci, F.; Giovannini, M.; Di Micoli, V.; Grandi, E.; Borghi, C.; Cicero, A.F.G. Effect of Supplementation of a Butyrate-Based Formula in Individuals with Liver Steatosis and Metabolic Syndrome: A Randomized Double-Blind Placebo-Controlled Clinical Trial. Nutrients. 2024, 16, 2454. [Google Scholar] [CrossRef] [PubMed]
- Jaworska, K.; Kopacz, W.; Koper, M.; Ufnal, M. Microbiome-Derived Trimethylamine N-Oxide (TMAO) as a Multifaceted Biomarker in Cardiovascular Disease: Challenges and Opportunities. Int J Mol Sci. 2024, 25, 12511. [Google Scholar] [CrossRef]
- Eyileten, C.; Jarosz-Popek, J.; Jakubik, D.; Gasecka, A.; Wolska, M.; Ufnal, M.; Postula, M.; Toma, A.; Lang, I.M.; Siller-Matula, J.M. Plasma Trimethylamine-N-Oxide Is an Independent Predictor of Long-Term Cardiovascular Mortality in Patients Undergoing Percutaneous Coronary Intervention for Acute Coronary Syndrome. Front Cardiovasc Med. 2021, 8, 728724. [Google Scholar] [CrossRef]
- Ferslew, B.C.; Xie, G.; Johnston, C.K.; Su, M.; Stewart, P.W.; Jia, W.; Brouwer, K.L.; Barritt, A.S. , 4th. Altered Bile Acid Metabolome in Patients with Nonalcoholic Steatohepatitis. Dig Dis Sci. 2015, 60, 3318–28. [Google Scholar]
- Calderón-Pérez, L.; Gosalbes, M.J.; Yuste, S.; Valls, R.M.; Pedret, A.; Llauradó, E.; Jimenez-Hernandez, N.; Artacho, A.; Pla-Pagà, L.; Companys, J.; Ludwig, I.; Romero, M.P.; Rubió, L.; Solà, R. Gut metagenomic and short chain fatty acids signature in hypertension: a cross-sectional study. Sci Rep. 2020, 10, 6436. [Google Scholar] [CrossRef]
- Jukic, A.; Bakiri, L.; Wagner, E.F.; Tilg, H.; Adolph, T.E. Calprotectin: from biomarker to biological function. Gut. 2021, 70, 1978–1988. [Google Scholar] [CrossRef]
- Heinzel, S.; Jureczek, J.; Kainulainen, V.; Nieminen, A.I.; Suenkel, U.; von Thaler, A.K.; Kaleta, C.; Eschweiler, G.W.; Brockmann, K.; Aho, V.T.E.; Auvinen, P.; Maetzler, W.; Berg, D.; Scheperjans, F. Elevated fecal calprotectin is associated with gut microbial dysbiosis, altered serum markers and clinical outcomes in older individuals. Sci Rep. 2024, 14, 13513. [Google Scholar] [CrossRef]
- Firoozi, D.; Masoumi, S.J.; Mohammad-Kazem Hosseini Asl, S.; Labbe, A.; Razeghian-Jahromi, I.; Fararouei, M.; Lankarani, K.B.; Dara, M. Effects of short-chain fatty acid-butyrate supplementation on expression of circadian-clock genes, sleep quality, and inflammation in patients with active ulcerative colitis: a double-blind randomized controlled trial. Lipids Health Dis. 2024, 23, 216. [Google Scholar] [CrossRef]
- Tougaard, N.H.; Frimodt-Møller, M.; Salmenkari, H.; Stougaard, E.B.; Zawadzki, A.D.; Mattila, I.M.; Hansen, T.W.; Legido-Quigley, C.; Hörkkö, S.; Forsblom, C.; Groop, P.H.; Lehto, M.; Rossing, P. Effects of Butyrate Supplementation on Inflammation and Kidney Parameters in Type 1 Diabetes: A Randomized, Double-Blind, Placebo-Controlled Trial. J Clin Med. 2022, 11, 3573. [Google Scholar] [CrossRef]
- Smith, D.J.; Barri, A.; Herges, G.; Hahn, J.; Yersin, A.G.; Jourdan, A. In Vitro Dissolution and in Vivo Absorption of Calcium [1-14C]Butyrate in Free or Protected Forms. J of Agri and Food Chem 2012, 60, 3151–3157. [Google Scholar] [CrossRef] [PubMed]
- Njei, B.; Ameyaw, P.; Al-Ajlouni, Y.; Njei, L.P.; Boateng, S. Diagnosis and Management of Lean Metabolic Dysfunction-Associated Steatotic Liver Disease (MASLD): A Systematic Review. Cureus. 2024, 16, e71451. [Google Scholar] [CrossRef]
- Freeman, A.M.; Acevedo, L.A.; Pennings, N. Insulin Resistance. 2023 Aug 17. In: StatPearls [Internet]. Treasure Island (FL): StatPearls Publishing; 2025.
- Steffl, M.; Bohannon, R.W.; Sontakova, L.; Tufano, J.J.; Shiells, K.; Holmerova, I. Relationship between sarcopenia and physical activity in older people: a systematic review and meta-analysis. Clin Interv Aging. 2017, 12, 835–845. [Google Scholar] [CrossRef]
- Premkumar, M.; Anand, A.C. Lean Fatty Liver Disease: Through Thick and Thin. J Clin Exp Hepatol. 2021, 11, 523–527. [Google Scholar] [CrossRef]
- Lee, Y.H.; Kim, S.U.; Song, K.; Park, J.Y.; Kim, D.Y.; Ahn, S.H.; Lee, B.W.; Kang, E.S.; Cha, B.S.; Han, K.H. Sarcopenia is associated with significant liver fibrosis independently of obesity and insulin resistance in nonalcoholic fatty liver disease: Nationwide surveys (KNHANES 2008-2011). Hepatology. 2016, 63, 776–86. [Google Scholar] [CrossRef]
- Crişan, D.; Avram, L.; Morariu-Barb, A.; Grapa, C.; Hirişcau, I.; Crăciun, R.; Donca, V.; Nemeş, A. Sarcopenia in MASLD-Eat to Beat Steatosis, Move to Prove Strength. Nutrients. 2025, 17, 178. [Google Scholar] [CrossRef]
- Saijo, Y.; Kiyota, N.; Kawasaki, Y.; Miyazaki, Y.; Kashimura, J.; Fukuda, M.; Kishi, R. Relationship between C-reactive protein and visceral adipose tissue in healthy Japanese subjects. Diabetes Obes Metab. 2004, 6, 249–58. [Google Scholar] [CrossRef]
- Van Hul, M.; Le Roy, T.; Prifti, E.; Dao, M.C.; Paquot, A.; Zucker, J.D.; Delzenne, N.M.; Muccioli, G.; Clément, K.; Cani, P.D. From correlation to causality: the case of Subdoligranulum. Gut Microbes. 2020, 12, 1–13. [Google Scholar] [CrossRef]
- Van Immerseel, F.; Ducatelle, R.; De Vos, M.; Boon, N.; Van De Wiele, T.; Verbeke, K.; Rutgeerts, P.; Sas, B.; Louis, P.; Flint, H.J. Butyric acid-producing anaerobic bacteria as a novel probiotic treatment approach for inflammatory bowel disease. J Med Microbiol. 2010, 59, 141–143. [Google Scholar] [CrossRef]
- Leclercq, S.; Matamoros, S.; Cani, P.D.; Neyrinck, A.M.; Jamar, F.; Stärkel, P.; Windey, K.; Tremaroli, V.; Bäckhed, F.; Verbeke, K.; de Timary, P.; Delzenne, N.M. Intestinal permeability, gut-bacterial dysbiosis, and behavioral markers of alcohol-dependence severity. Proc Natl Acad Sci U S A. 2014, 111, E4485–93. [Google Scholar] [CrossRef]
- Louis, S.; Tappu, R.M.; Damms-Machado, A.; Huson, D.H.; Bischoff, S.C. Characterization of the Gut Microbial Community of Obese Patients Following a Weight-Loss Intervention Using Whole Metagenome Shotgun Sequencing. PLoS One. 2016, 11, e0149564. [Google Scholar] [CrossRef] [PubMed]
- Zhang, X.; Fang, Z.; Zhang, C.; Xia, H.; Jie, Z.; Han, X.; Chen, Y.; Ji, L. Effects of Acarbose on the Gut Microbiota of Prediabetic Patients: A Randomized, Double-blind, Controlled Crossover Trial. Diabetes Ther. 2017, 8, 293–307. [Google Scholar] [CrossRef] [PubMed]
- Lee, C.B.; Chae, S.U.; Jo, S.J.; Jerng, U.M.; Bae, S.K. The Relationship between the Gut Microbiome and Metformin as a Key for Treating Type 2 Diabetes Mellitus. Int J Mol Sci. 2021, 22, 3566. [Google Scholar] [CrossRef] [PubMed]
- Cui, G.; Li, S.; Ye, H.; Yang, Y.; Jia, X.; Lin, M.; Chu, Y.; Feng, Y.; Wang, Z.; Shi, Z.; Zhang, X. Gut microbiome and frailty: insight from genetic correlation and mendelian randomization. Gut Microbes. 2023, 15, 2282795. [Google Scholar] [CrossRef]
- Pérez-Matute, P.; Íñiguez, M.; Villanueva-Millán, M.J.; Oteo, J.A. Chapter 32—The oral, genital and gut microbiome in HIV infection. Microbiome metabolome diagnosis 307–323 (Academic Press, 2019).
- Borges, N.A.; Mafra, D. (2018). The Gut Microbiome in Chronic Kidney Disease. Microbiome and Metabolome in Diagnosis, Therapy, and Other Strategic Applications, 349-356.
- da Silva, L.C.M.; de Oliveira, J.T.; Tochetto, S.; de Oliveira, C.P.M.S.; Sigrist, R.; Chammas, M.C. Ultrasound elastography in patients with fatty liver disease. Radiol Bras. 2020, 53, 47–55. [Google Scholar] [CrossRef] [PubMed] [PubMed Central]
- Ruggeri, S.; Buonocore, P.; Amoriello, T. New Validated Short Questionnaire for the Evaluation of the Adherence of Mediterranean Diet and Nutritional Sustainability in All Adult Population Groups. Nutrients. 2022, 14, 5177. [Google Scholar] [CrossRef] [PubMed] [PubMed Central]
- Awwad, H.M.; Geisel, J.; Obeid, R. Determination of trimethylamine, trimethylamine N-oxide, and taurine in human plasma and urine by UHPLC-MS/MS technique. J Chromatogr B Analyt Technol Biomed Life Sci. 2016, 1038, 12–18. [Google Scholar] [CrossRef] [PubMed]
- Scheppach, W.M.; Fabian, C.E.; Kasper, H.W. Fecal short-chain fatty acid (SCFA) analysis by capillary gas-liquid chromatography. Am J Clin Nutr. 1987, 46, 641–6. [Google Scholar] [CrossRef] [PubMed]
- Fiers, T.; Maes, V.; Sevens, C. Automation of toxicological screenings on a Hewlett Packard Chemstation GC-MS system. Clin Biochem. 1996, 29, 357–61. [Google Scholar] [CrossRef] [PubMed]
- Caporaso, J.G.; Lauber, C.L.; Walters, W.A.; Berg-Lyons, D.; Huntley, J.; Fierer, N.; Owens, S.M.; Betley, J.; Fraser, L.; Bauer, M.; Gormley, N.; Gilbert, J.A.; Smith, G.; Knight, R. Ultra-high-throughput microbial community analysis on the Illumina HiSeq and MiSeq platforms. ISME J. 2012, 6, 1621–4. [Google Scholar] [CrossRef] [PubMed] [PubMed Central]
- Edgar, R.C. UPARSE: highly accurate OTU sequences from microbial amplicon reads. Nat Methods. 2013, 10, 996–8. [Google Scholar] [CrossRef] [PubMed]
- Murphy, D.F.; McDonald, A.; Power, C.; Unwin, A.; MacSullivan, R. Measurement of pain: a comparison of the visual analogue with a nonvisual analogue scale. Clin J Pain. 1987, 3, 197–9. [Google Scholar] [CrossRef]
- Raosoft Software. Calculate Your Sample Size. Online- Available from: http://www.raosoft.com/samplesize.html Accessed on 1st 23. 20 December.
Figure 2.
Pane A- Trimethylamine N-oxide (TMAO) and pane B- Fecal calprotectin (Fcal) dynamic during study period in both groups of patients.
Figure 2.
Pane A- Trimethylamine N-oxide (TMAO) and pane B- Fecal calprotectin (Fcal) dynamic during study period in both groups of patients.
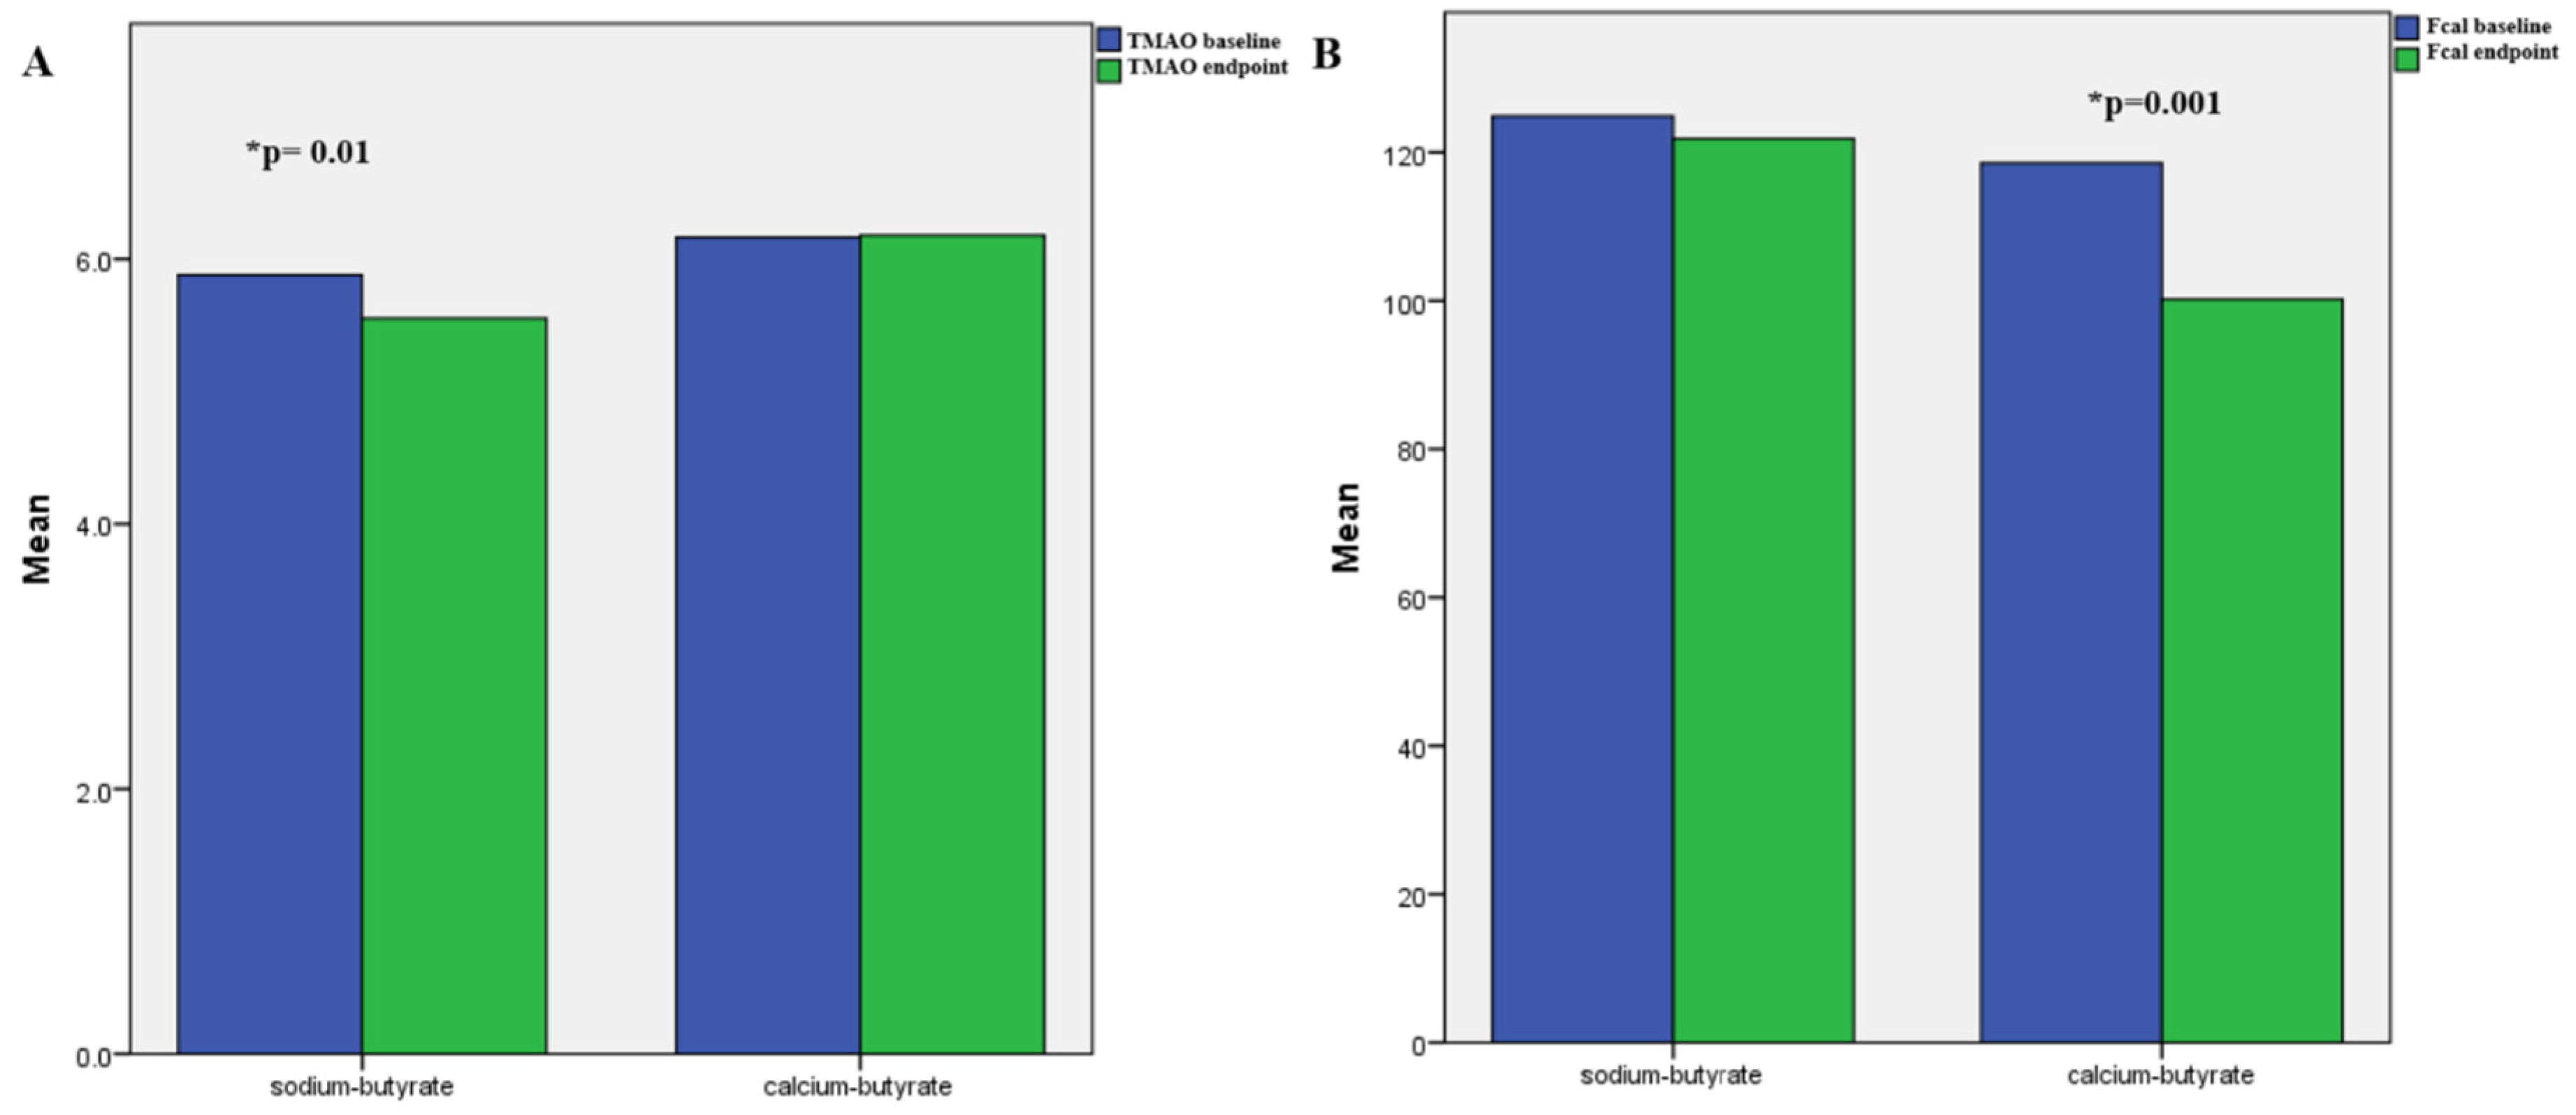
Figure 3.
Comparison of the abundance of the top 20 bacterial genera in responder and non-responder stool samples.
Figure 3.
Comparison of the abundance of the top 20 bacterial genera in responder and non-responder stool samples.
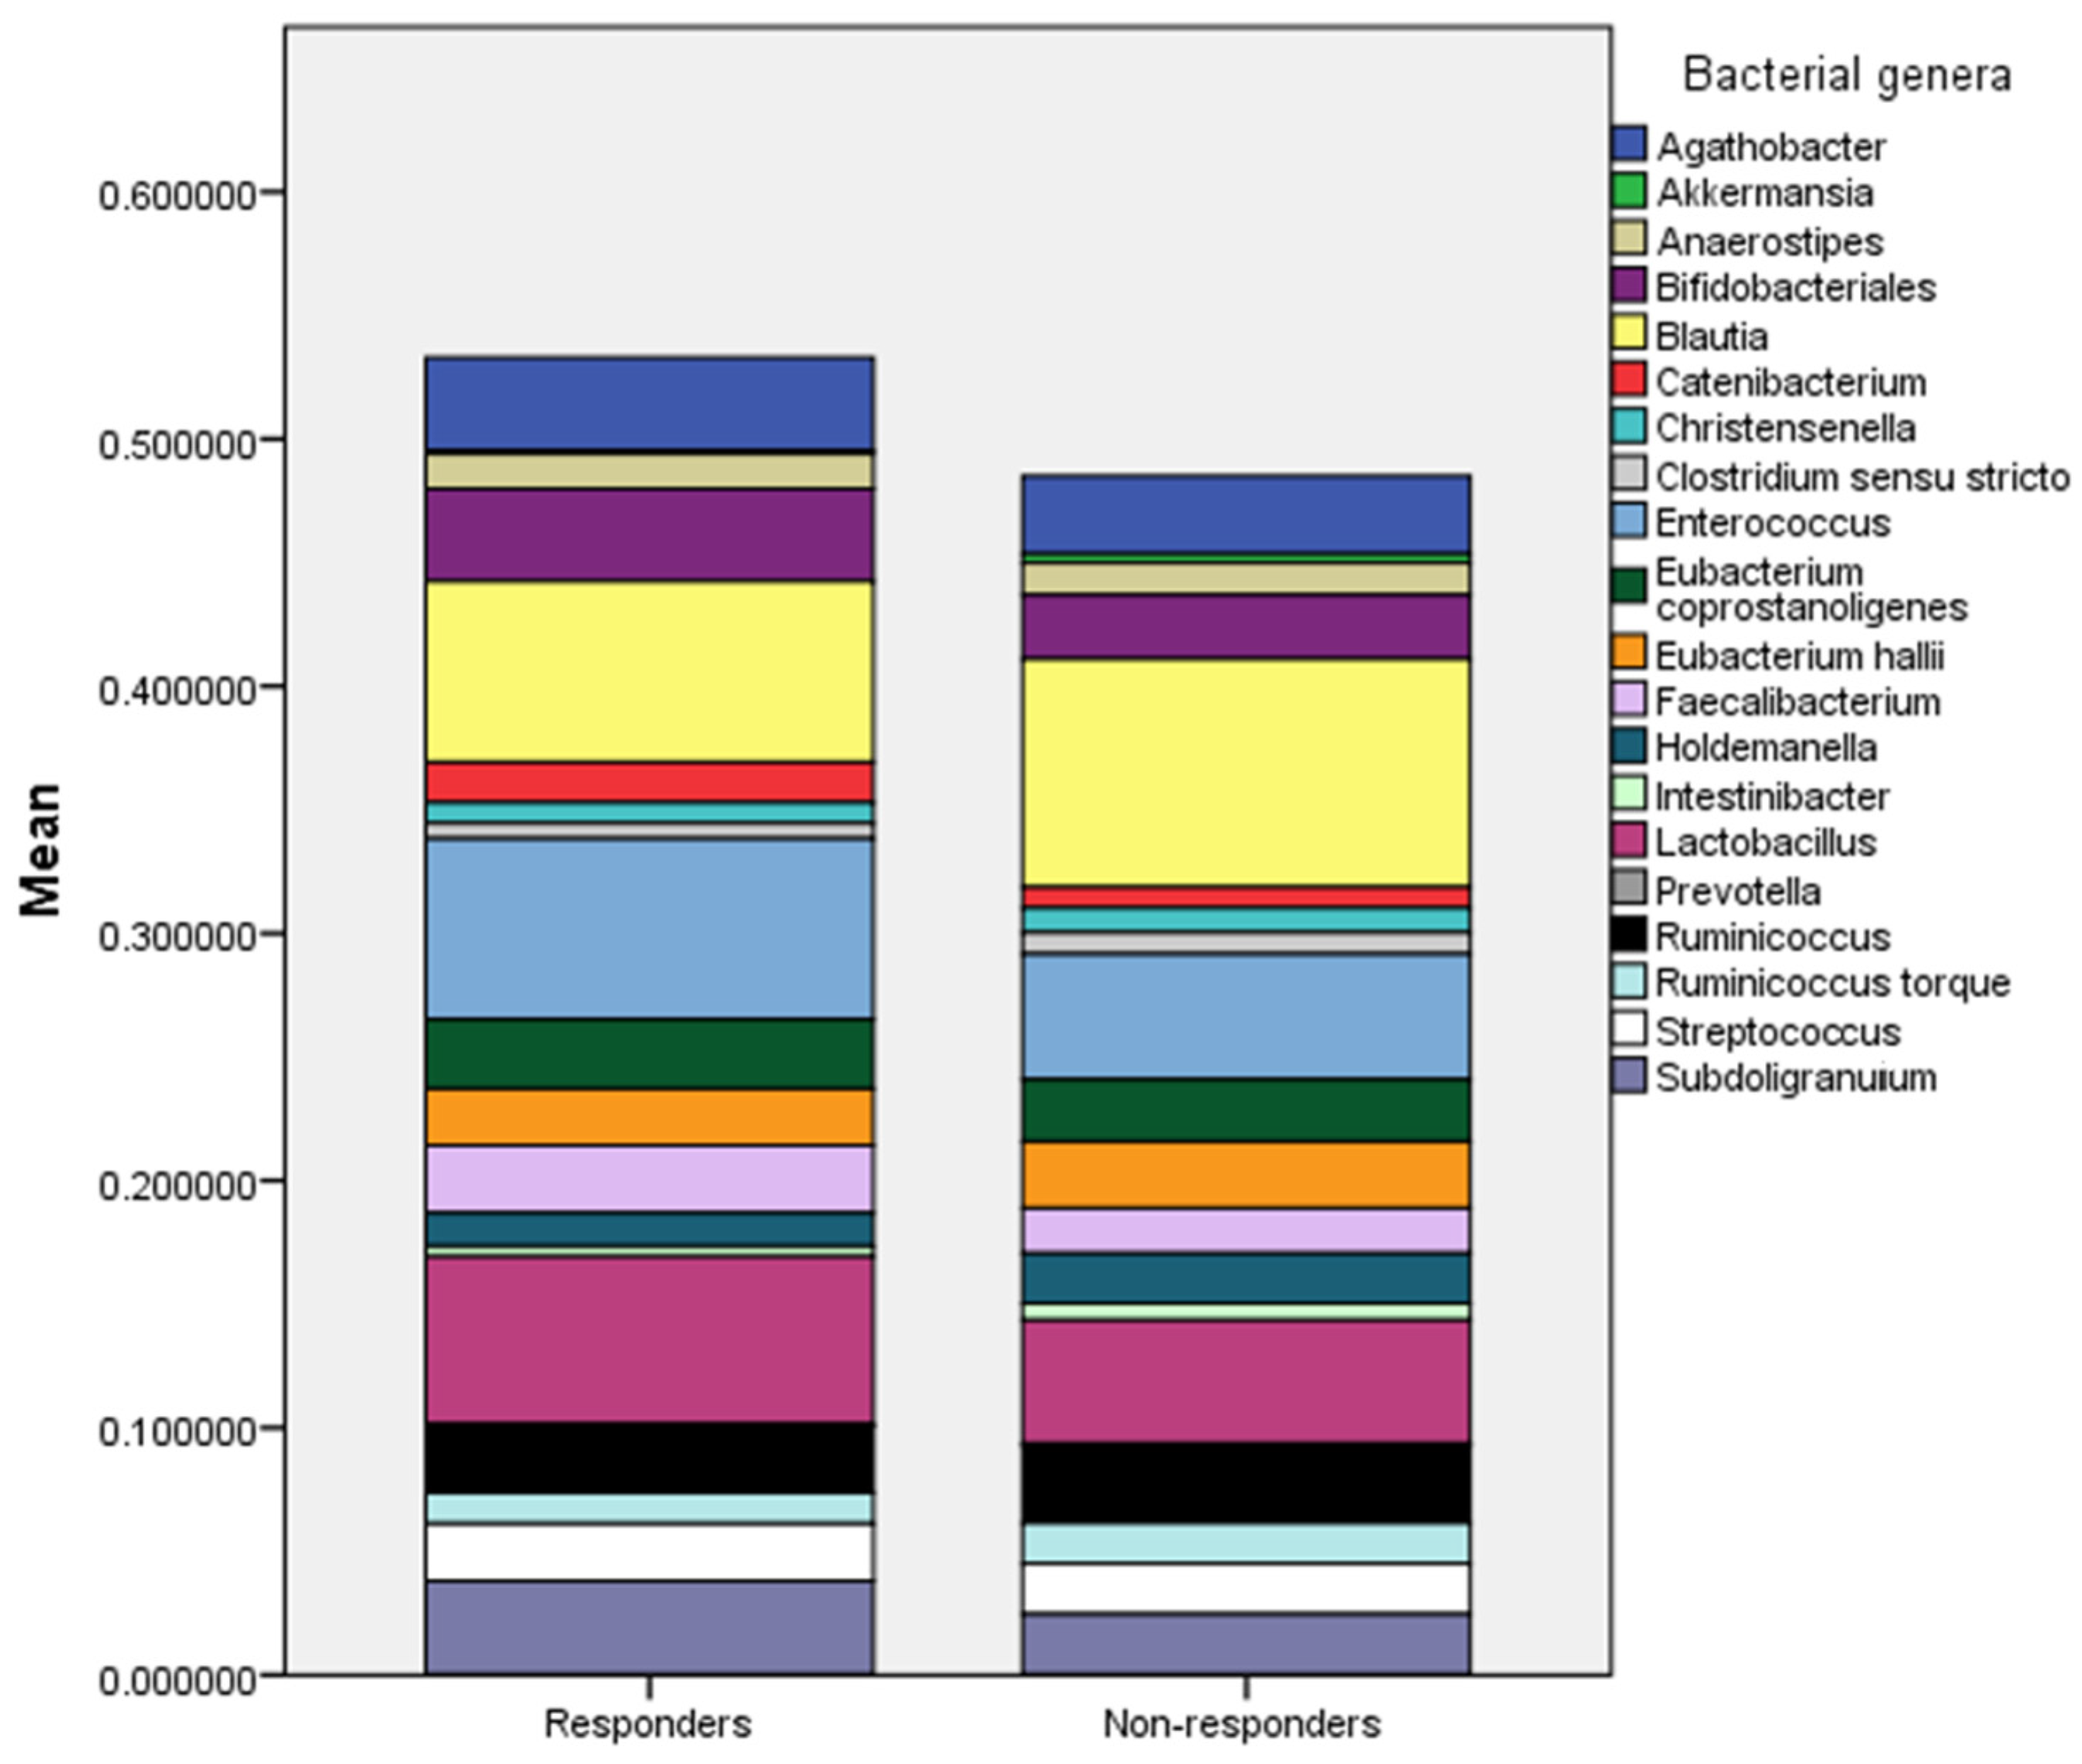
Table 2.
Comparison in baseline characteristics between the responder and non-responder groups.
| Parameter | Responder | Non-responder | p |
|---|---|---|---|
| N | 30 | 147 | - |
| BMI | 26.1 ± 1.7 | 27.8 ± 1.7 | *0.001 |
| ALT (U/L) | 60 ± 13 | 60 ± 9 | 0.87 |
| AST (U/L) | 57 ± 12 | 57±11 | 0.74 |
| GGT (U/L) | 68 ± 20 | 71 ± 18 | 0.583 |
| Total cholesterol (mg/dl) | 350 ± 20 | 354 ± 17 | 0.27 |
| Triglycerides (mg/dl) | 166 ± 38 | 167 ± 36 | 0.54 |
| HbA1c (%) | 6.7 ± 0.4 | 6.4 ± 0.5 | *0.037 |
| hsCRP (mg/L) | 7.7 (6-9.6) | 4.2 (4-5.6) | *0.002 |
| Interleukin 6 (pg/ml) | 41 ± 8 | 42 ± 9 | 0.47 |
| CK18F (U/L) | 247 ± 30 | 248 ± 37 | 0.8 |
| TMAO (μmol/L) | 3.9 ± 2.4 | 4.2±1.9 | 0.42 |
| Stool SCFA (mmol/L) | 176 ± 36 | 174 ± 37 | 0.24 |
| Fecal Calprotectin (μg/g) | 140 ± 90 | 120 ± 80 | 0.3 |
| Baseline CAP (dB/m) | 295 ± 19 | 288 ± 21 | 0.1 |
| Baseline LSM (kPA) | 5±2.5 | 4.4±2.5 | 0.18 |
BMI- Body mass index, ALT- alanine aminotransferase, AST- aspartate aminotransferase, GGT- gamma-glutamyl transferase, HDL-C- high-density lipoprotein cholesterol, HbA1c- hemoglobin A1C, hsCRP- high-sensitivity C-reactive protein, CKF18- cytokeratin 18 fragment, TMAO- trimethylamine N-oxide, SCFA- short chain fatty acids, CAP- Controlled Attenuation Parameter, LSM- liver stiffnes measurement.
Disclaimer/Publisher’s Note: The statements, opinions and data contained in all publications are solely those of the individual author(s) and contributor(s) and not of MDPI and/or the editor(s). MDPI and/or the editor(s) disclaim responsibility for any injury to people or property resulting from any ideas, methods, instructions or products referred to in the content. |
© 2025 by the authors. Licensee MDPI, Basel, Switzerland. This article is an open access article distributed under the terms and conditions of the Creative Commons Attribution (CC BY) license (http://creativecommons.org/licenses/by/4.0/).
Copyright: This open access article is published under a Creative Commons CC BY 4.0 license, which permit the free download, distribution, and reuse, provided that the author and preprint are cited in any reuse.


