
Submitted:
01 April 2025
Posted:
02 April 2025
You are already at the latest version
Abstract
Windbreaks are crucial in landscape management, contributing to erosion control, biodiversity conservation, and carbon sequestration. Their effectiveness depends on careful planning, including species selection, location, and internal structure. Optical porosity (OP) is a key indicator of windbreak permeability, but different OP calculation methods may yield varying results. This study aims to (i) compare different OP expressions, (ii) assess whether windbreak classification by permeability is justified based on OP analysis, and (iii) examine OP variability depending on foliage condition. Using four OP expressions (MAX_OP, CUM15_OP, MEAN_OP, CONT_OP), we demonstrate that MAX_OP and CUM15_OP exhibit the greatest variability, while MEAN_OP and CONT_OP provide more stable distinctions between windbreak categories. Although WB_P generally shows the highest OP and WB_IP the lowest, WB_SP overlaps with both categories in certain metrics, indicating that permeability-based classification is not always clear-cut. Seasonal differences are also significant, with OP values consistently lower in the fully fo-liated state, particularly in WB_P. Our study highlights the importance of selecting appropriate OP assessment methods for windbreak analysis. Using MATLAB-based windbreak software, we provide an automated approach for evaluating windbreak structure, offering insights applicable to large-scale assessments and remote sensing applications.
Keywords:
soil degradation
; wind erosion
; windbreak structure
; wood phenology
; green infrastructure
; landscape management
Introduction
Definition of Windbreaks and Their Importance in Climate Change Era
A windbreak in general is a linear planting of trees, shrubs, or other vegetation strategically designed to reduce wind velocity and mitigate soil erosion. Its structural characteristics, including height, width, species composition, and spatial arrangement, determine its effectiveness in modifying airflow patterns. Their net plays a crucial role in agricultural landscapes by reducing wind erosion of soil, protecting roads, providing habitats for wildlife, enhancing landscape aesthetics, and mitigating the dispersion of odors, dust, and pesticides from agricultural operations [1,2]. Additionally, they are considered an effective strategy for sequestering larger amounts of carbon in agricultural soils [3,4,5]. According to [6], based on the relationship between soil organic carbon accumulation and climatic factors, it is possible to estimate soil carbon stocks in existing windbreaks and predict potential carbon sequestration in future plantings, with more cool and moist climate conditions being more favourable for carbon accumulation in the surface soil. A concept of windbreaks integrates trees and shrubs into agricultural landscapes making them effective agroforestry systems, which provide various ecosystem services while mitigating the effects of climate change [7]. Compared to cropland and pasture systems, agroforestry stores significantly higher amounts of carbon in both aboveground and belowground biomass. Globally, 630 million hectares of unproductive arable land could be utilized for agroforestry as part of ecological engineering practices, potentially sequestering 586,000 MgC annually by 2040 [8]. Although the global potential of agroforestry is well-documented, research on agroforestry systems in Europe remains limited, with only a few studies focusing on their role in the region [9,10]. Windbreaks are thus increasingly recognized as part of "climate-smart landscapes" [11], as the effect of woody vegetation contributes to reducing temperature extremes, creating a wetter environment with lower fluctuations, intercepting precipitation, decreasing air speed, diffusing solar radiation, and altering air composition [12]. Regarding the significance of windbreaks in the context of climate change, the Web of Science Core Collection database contains 66 publications on the topic. The majority of 38% (14 publications) fall within the field of environmental sciences, followed by forestry with 33% (20 publications) and environmental sciences with 23% (15 publications). Agronomy accounts for 21% (14 publications), Ecology with 14% (9 publications) and other additional research areas represented below (see Figure 1).
Windbreak Structure and Optical Porosity
The effect of windbreaks on wind dynamics is largely determined by their structural characteristics, which influence airflow patterns and turbulence. Windbreak structure is defined by the amount and arrangement of plant elements and open spaces between them [13,14]. While field trials provide real-world insights into windbreak performance, their effectiveness assessment remains challenging [15] due to limitations such as unstable weather, instrumentation constraints, and sample shortages [16]. A key descriptor of windbreak structure is optical porosity (OP), defined as the percentage of open space within a windbreak relative to its total volume [17,18] or ratio of the pore space to the total space occupies by branches, leaves, stems according to Tamang et al, 2015. OP is widely used to evaluate windbreak efficiency, as it serves as a reliable predictor of wind speed reduction [19,20]. By analyzing OP, it is possible to estimate a windbreak’s impact on airflow, and when combined with wind data, this approach reduces the need for extensive field measurements. Full summer foliage (10% OP) can reduce wind speed by 60% at 50 meters and by 30% at 150 meters on the leeward side. These values decrease to 80–90% in defoliated windbreaks, indicating the importance of seasonal variations in structural density [21]. However, when optimizing species composition in windbreak design, it is crucial to consider the long-term impacts of climate change on tree phenology [22,23]. Similarly, forest ecosystems face a growing range of threats, including prolonged droughts, extreme temperatures, strong winds, invasive insect outbreaks, and the rapid spread of pathogens [24]. To ensure windbreaks maintain their protective functions, regular assessments and corrective measures will be essential. Research by [20] demonstrated that wind speed reduction can be predicted based on the OP of the lower half of a windbreak, making it a valuable tool for field assessments. [25] evaluated three types of windbreaks in the Czech Republic and found a significant correlation between structural diversity, wind speed reduction, and OP. OP significantly correlated with wind speed reduction, particularly in the lower part of the windbreak. For each windbreak type, a significant dependence was observed between windbreak efficiency and the dominant tree height. Among structural indices, the most significant influence on wind speed reduction was found for the total diversity index and the Arten-profile index, which describes vertical structures. These indices, along with OP, are recommended for assessing windbreak effectiveness.
Methodological Advances in Windbreak Assessment
OP can be effectively derived from frontal images of windbreaks by converting them into a black-and-white spectrum, where vegetation appears as black and open spaces as white. This transformation allows for the quantification of open space relative to the total windbreak volume, providing a reliable estimate of porosity. OP is inversely proportional to the protective function of the windbreak – the lower the OP value, the denser the windbreak and the higher its protective function. Several studies have successfully applied this method, using digital image analysis to assess windbreak structure and its impact on airflow [18,20]. However, despite its reliability, this approach requires field image collection, which can be time-consuming and influenced by weather conditions. To address these limitations, remote sensing (RS) data offer an alternative means of assessing windbreak porosity. High-resolution satellite imagery, aerial photographs, and LiDAR (Light Detection and Ranging) provide consistent and large-scale observations, eliminating the need for direct field measurements. These techniques enhance the efficiency of windbreak evaluation while reducing logistical constraints. Advancements in RS and geographic information system (GIS) technologies further improve windbreak analysis by enabling the extraction of key structural attributes such as spatial distribution, optical porosity, and vegetation diversity. Researchers have developed spatial models using RS and GIS to predict wind speed reduction based on windbreak characteristics [26]. Comprehensive method for estimating the porosity indicator of windbreaks performed by gap mapping using 3D LiDAR (Light Detection and Ranging) data was proposed by [27]. The method allows for the diagnosis of spatial structure and can also be used to maximize the positive effect of windbreaks on agricultural production. While these models may not fully capture wind dynamics, they serve as valuable indicators of windbreak efficiency across different spatial scales, offering a scalable and cost-effective approach to windbreak assessment. Before deploying RS, it is always necessary to assess the actual variability of OP using ground measurements, and this is where our study proves highly valuable.
Research Gaps and Aim of This Study
Despite increasing interest in windbreaks and their positive roles not only in climate adaptation, studies on optical porosity and windbreak efficiency remain limited, particularly in European agroforestry contexts. Since 2012, the Web of Science database has recorded only 18 scientific articles on this topic, including one review article [28]. The findings from many of these studies are summarized above. This study aims to address existing gaps by evaluating OP, we seek to develop a more comprehensive approach to understanding windbreak functionality in agricultural landscapes. Our objectives are: i) Comparison of Different OP expressions; ii) verify whether the superficial classification of windbreaks according to their permeability is justified by OP analysis; iii) define OP variability Depending on Foliage Condition.
2. Materials and Methods
Model windbreaks
Our survey covers a total of 16 windbreaks A1 to D4 (Table 1) located in area with wind erosion risk in the southeastern part of the Czech Republic (Figure 2) with specific locations (Figure 3):
- Location A (GPS: 48.8135347N, 16.7514300E): A1 to A4
- Location B (GPS: 48.8322958N, 16.5939950E): B1
- Location C (GPS: 48.7647197N, 16.1589622E): C1 to C7
- Location D (GPS: 48.8500761N, 16.1760425E): D1 to D4
All windbreaks were superficially categorized according to [29] and [30] and then divided into 278 segments in total, with each segment representing a 30meter long section of the windbreak (see Figure 4) in order to meet software for OP evaluation requirements described by [31].
• Permeable (WB_P), 87 segments: A2 (16 segments), C1 (15 segments), C2 (22 segments), C5 (20 segments), D4 (14 segments)
• Semi-permeable (WB_SP), 59 segments: A1 (18 segments), C7 (6 segments), D1 (14 segments), D2 (8 segments), D3 (13 segments)
• Impermeable (WB_IP),132 segments: A3 (22 segments), A4 (21 segments), B1 (26 segments), C3 (19 segments), C4 (21 segments), C6 (23 segments)
The boundary points of individual segments were geodetically surveyed and marked with wooden stakes for future reassessment. The OP evaluation was conducted in two periods:
• Spring period (s) – when the windbreaks were without foliage
• Fully foliated period (f) – when the windbreaks were in full leaf
Evaluation of OP from Digital Images
OP of windbreaks was evaluated using “Windbreak software” developed in MathWorks MATLAB R2024a methodologically introduced by [31]. The software processes digital RGB photographs of windbreaks taken from the frontal view in .png or .tiff format (image size: wideness of the segment x theoretically maximum windbreak height, i.e. 30 x 35 m). These images contain segment boundaries and numbering, allowing the program to accurately identify segments and calculate their height. Automated segmentation techniques are applied to distinguish vegetation from background using advanced machine learning to improve accuracy. Algorithm K-means cluster RGB color space pixels into two categories - windbreak and background. If needed, a manual segmentation allows global (entire image) or local (specific sections) adjustment. Different vegetation layers, specifically the shrub layer and tree canopy may be evaluated separately, ensuring a more detailed and precise analysis of windbreak structure. The software employs batch processing, enabling the automatic analysis of multiple images at once. The input is a folder containing images, and the output is data on OP. Figure 5 demonstrates transformation of original image (left) into black (= windbreak) and white (=background) spectrum (right) for C3 - segment 2.
The software automatically evaluates optical porosity (OP) using a grid resolution of 30 x 0.5 m, meaning it assesses OP in 0.5-meter height increments along a 30-meter-wide segment of a windbreak. The study considers three OP expressions:
• CUM_OP (OP up to a defined height, typically 15 m, i.e. CUM15_OP)
o This parameter aggregates OP values of the grids up to 15 m, which is considered a general reference height for windbreaks (if a windbreak is taller than 15 m, the portion exceeding that height is ignored).
o The evaluated image size for this metric is 30 x 15 m.
• MEAN_OP (OP up to the mean height of the windbreak)
o Here, OP is evaluated for all grids up to the mean height of the specific windbreak.
o The evaluated image size varies, being 30 x mean height (in meters) of the given windbreak.
• MAX_OP (OP up to the maximum height of the windbreak)
o This expression considers OP values for all grids up to the maximum height of the specific windbreak.
o The evaluated image size is 30 x maximum height (in meters) of the windbreak (see green line in Fig 5).
• CONT_OP (OP measured up to the actual top edge/contour of the windbreak)
o Unlike CUM_OP, which evaluates OP up to a predefined height (e.g., 15 m, mean, or max height), CONT_OP follows the real shape of the windbreak.
o The top boundary is not a straight line, but a curved contour that mathematically represents the true height variation of the windbreak (see red line in Figure 5); the bottom boundary remains constant at 30 m width, ensuring consistency in the evaluation area.
o This method provides a more realistic representation of windbreak structure by considering height variability rather than imposing an artificial height limit.
Each OP expression is further distinguished between spring (s) and fully foliaged (f) conditions. These seasonal variations are indexed accordingly, for example, CUM15_OP_s and CUM15_OP_f.
3. Results and discussion
One of the objectives of our study is to demonstrate how OP results vary depending on the methodology used to determine windbreak height (and consequently, the image size within which OP is assessed. There are several reasons for introducing such a complexity:
• Practical reasons – to ensure a simple and widely applicable approach.
• Research accuracy – to achieve the most precise measurements possible.
• Comparability – to allow for standardized comparisons across different windbreaks and study areas.
• Scalability – to facilitate the use of OP assessment in large-scale studies or remote sensing applications.
Figure 6 provides an overview of windbreak height parameters. With minor exceptions in WB_P, the mean, maximum and contour heights (MEAN, MAX, CONT) do not exceed 15 m. This justifies one of our approaches - assessing OP based on a fixed artificial height of 15 m (CUM15_OP), regardless of the actual windbreak height. However, while a 15 m threshold may be appropriate for wind erosion control, other windbreak functions may require different height considerations. [1] emphasize that for odor mitigation in livestock operations, shelterbelts of 6–9 m may be optimal, as odor plumes tend to remain close to the ground. This suggests that OP assessment should be adapted depending on the specific function of a windbreak, whether for wind speed reduction, odor interception, or snow redistribution. Future research should explore how windbreak effectiveness varies across different height thresholds and how OP interacts with specific windbreak functions beyond erosion control. This will allow for more function-specific windbreak design and management strategies.
Another objective is to determine how well the detailed OP results correspond to the preliminary categorization of windbreaks based on their structure into WB_P, WB_SP, and WB_IP groups. These categories are generally recognized but only roughly distinguished, so our analysis aims to assess their validity with more precise OP measurements. For this purpose, the following Figures (8 to 11) evaluate windbreaks and their segments collectively based on their classification into one of these categories. We also look into the effect of state of foliage on OP.
Figure 7 presents the results of CUM15_OP, highlighting differences in optical porosity (OP) across windbreak categories. WB_P exhibits the highest overall OP but also the greatest variability, particularly in the fully foliated state (CUM15_OP_f ranging from 15.3 to 74.9). This suggests that individual segments differ in structure, likely due to species composition or irregular foliage distribution. WB_SP, despite having slightly lower OP than WB_P_s, shows reduced variability across segments, indicating a more uniform structure. WB_IP displays the widest range of CUM15_OP_f, with some segments maintaining moderate permeability (up to 73.4) while others are nearly opaque (down to 2.7). This variability suggests heterogeneity within this category, possibly due to differences in tree density or canopy gaps.
Overall, WB_P consistently allows the most wind penetration, whereas WB_IP is the most effective at blocking wind, particularly during the fully foliated period. The seasonal contrast is most pronounced in WB_IP, where full foliage drastically reduces OP, reinforcing its function as a dense wind barrier. WB_SP maintains an intermediate role, offering a relatively stable level of permeability throughout the year.
Figure 8 illustrates the variability of MAX_OP across windbreaks’ categories and foliage conditions. WB_P exhibits the highest internal variability, with MAX_OP_s ranging from 49.3 to 95.9 and MAX_OP_f from 15.4 to 91.0. The wide range in MAX_OP_f suggests that foliage has an inconsistent impact across segments, leading to notable differences in OP within this group. WB_SP shows more stable MAX_OP values, with MAX_OP_s between 48.6 and 83.9 and MAX_OP_f ranging from 28.2 to 60.6. The reduction in porosity due to foliage is evident but less variable than in WB_P, suggesting that WB_SP has a more uniform internal structure. WB_IP has the lowest MAX_OP_s (42.0–81.1) and MAX_OP_f (8.3–59.3), with a sharp decline in porosity in the foliated state (median MAX_OP_f = 27.0). This confirms that foliage plays a crucial role in reducing permeability in this category.
Across all windbreaks, foliage decreases porosity, but the extent varies. The differences in MAX_OP between WB_P, WB_SP, and WB_IP support their classification by permeability. WB_P displays the greatest variability, WB_SP maintains moderate and stable MAX_OP values, while WB_IP remains the least permeable, particularly when fully foliated.
Figure 9 shows the range of MEAN_OP values across windbreaks. WB_P has the widest range, with MEAN_OP_s averaging 70.1 (38.2–91.1), indicating an overall open structure. In the foliated period, MEAN_OP_f drops significantly to an average of 49.0 (7.7–85.0), reflecting increased canopy density. The overall MEAN_OP_mean across both conditions is 55.9. WB_SP is more stable, with MEAN_OP_s between 39.8 and 76.2 (average 65.8), confirming a moderately open structure. In full foliage, MEAN_OP_f decreases to 26.5, showing a significant reduction in permeability. The overall MEAN_OP_mean of 46.7 highlights a more consistent structure compared to WB_P. WB_IP has the lowest MEAN_OP_s (36.9–74.9, average 56.4). In full foliage, MEAN_OP_f drops sharply to 15.7 (range 3.9–42.7), confirming their dense structure. The overall MEAN_OP_mean of 38.3 highlights their low permeability year-round.
These results suggest that WB_P exhibits high MEAN_OP variability, with an open structure in the leafless period and increased density in full foliage. WB_SP shows moderate porosity, maintaining openness without foliage but becoming denser when foliated. WB_IP remains the densest, ensuring limited permeability year-round.
Figure 10 presents CONT_OP values, showing seasonal porosity differences. WB_P exhibits a notable contrast, with CONT_OP_s averaging 62.9%, allowing significant light and air penetration. In full foliage, this drops to 34.4%, indicating increased density. The mean CONT_OP across both states is 50.0%, with a median CONT_OP_s of 63.9%, reinforcing the trend of high porosity within this group. WB_SP follows a similar pattern but with lower overall values. The mean CONT_OP_s (63.9%) is slightly lower than in WB_P, and CONT_OP_f decreases to 26.1%, suggesting reduced porosity even in full foliage. The overall mean CONT_OP is 48.5%, and the median CONT_OP_s is 64.3%, placing WB_SP between the other two categories. WB_IP shows the lowest values, with CONT_OP_s averaging 53.6% and dropping to 22.5% in the foliated period. The overall mean CONT_OP is 38.05%, confirming that WB_IP has the lowest porosity among all categories. The median CONT_OP_s of 53.0% supports their classification as the least permeable windbreak type.
Overall, WB_P shows high porosity variation, WB_SP maintains intermediate permeability, and WB_IP remains the most impenetrable, particularly in full foliage, ensuring strong wind protection.
Our findings confirm that OP is a critical parameter for assessing windbreak permeability and functional effectiveness. The high variability in OP observed in WB_P, particularly in the foliated state, aligns with [21], who also reported significant seasonal OP differences. Their assessment of "OP reduced" highlights the importance of considering windbreak height and structure when evaluating permeability, a factor that may influence the observed internal variability in our study.
A key practical implication of windbreaks OP is its relationship wind speed reduction. [33] demonstrated a strong negative correlation between OP and wind speed at various distances, reinforcing the role of OP in defining wind protection effectiveness. Our results further support this link, particularly with the differences observed across windbreak categories. The overlap of WB_SP with both WB_P and WB_IP suggests that permeability-based classification may not always directly correspond to wind reduction efficiency, as noted in [20]. Their findings suggest that OP, particularly in the lower portion of windbreaks, may serve as a reliable predictor of windspeed reduction, a factor that could be further refined in future studies.
Methodological differences in OP assessment also present challenges in comparability, as highlighted by [27]. Their introduction of 3D LiDAR for windbreak porosity estimation addresses a major limitation of 2D image-based analyses. While our MATLAB-based approach provides a standardized and automated evaluation method, it is limited to 2D data, which may not fully capture spatial OP variations. Future research could explore integrating 3D LiDAR to enhance accuracy in OP estimation, particularly in complex or heterogeneous windbreak structures.
The aerodynamic implications of OP were further explored by [34], who proposed a semiempirical model incorporating aerodynamic porosity and additional factors such as surface roughness and wind direction. Their model suggests that OP alone may not fully capture windbreak efficiency, emphasizing the need for a more holistic approach. Our results indicate that OP metrics such as MAX_OP and CUM15_OP exhibit high internal variability, while MEAN_OP and CONT_OP provide more consistent classification. This suggests that combining OP metrics with aerodynamic modeling could refine windbreak performance assessments.
A key challenge in OP estimation is the reliance on different data sources. [26] demonstrated that OP estimation using remote sensing techniques showed weak correlations with commonly used vegetation indices. This is likely because OP is inherently a horizontally measured parameter, whereas satellite imagery provides a vertical perspective and lacks direct horizontal structural information [15]. In contrast, their study found strong linear relationships between OP and structural windbreak parameters, such as barrier height (h), average canopy length (CL), leaf area index (LAI), and windbreak width (w). These findings suggest that OP should be analyzed in conjunction with structural characteristics rather than relying solely on spectral vegetation indices, a consideration that further supports the need for precise, ground-based OP measurement techniques.
Structural descriptors such as crown density and vegetative surface area density, as discussed by [17], provide further insight into windbreak efficiency. Similarly, [35] proposed a three-dimensional crown (3D) density approach, which incorporates windbreak height, width, and crown/stem area ratios to assess its structure. This framework aligns with our findings, where OP values correlate with windbreak structure, but also emphasizes the need for more detailed 3D analysis to improve permeability classification.
Our study demonstrates that WB_IP consistently shows the lowest OP, reinforcing its function as the most effective wind barrier. However, the substantial seasonal OP changes in WB_P highlight the influence of canopy structure on permeability. The findings suggest that OP assessment methods should account for both spatial and seasonal variability to ensure accurate windbreak classification.
Overall, our study supports the use of OP as a key metric for windbreak evaluation but highlights the need for methodological consistency. While OP-based classification broadly aligns with structural expectations, the overlap of WB_SP with other categories suggests that permeability-based distinctions may require additional parameters, such as aerodynamic porosity or structural descriptors, to improve classification accuracy. Future research should explore integrating OP assessments with advanced 3D analysis and windflow modeling to enhance windbreak design and management strategies.
We confirmed that optical porosity (OP) is a key indicator of windbreak permeability, though its variability depends on the calculation method used. While WB_P generally exhibits the highest OP and WB_IP the lowest, the overlap of WB_SP with both categories suggests that permeability-based classification is not always clear-cut. Foliage significantly reduces OP across all windbreak types, particularly in WB_P.
While our analysis relies on frontal perspective OP assessment, future research will explore how these values compare with OP derived from aerial (satellite) imagery. Previous studies indicate that OP correlates more strongly with structural parameters than with vegetation indices [26]. However, the relationship between ground-based and satellite-derived OP remains largely unexamined. By integrating these perspectives, we aim to refine OP assessment methods and improve large-scale windbreak analysis. This future direction will enhance windbreak evaluation for landscape management, erosion control, and wind protection strategies, providing a more comprehensive framework for decision-making.
5. Conclusions
• The various OP expressions (MAX_OP, CUM15_OP, MEAN_OP, CONT_OP) show differences in variability:
o MAX_OP generally has the highest values and the widest percentile range, indicating greater internal variability within each windbreak category.
o CUM15_OP follows a similar trend but with slightly lower values and less variability than MAX_OP.
o MEAN_OP shows more stable differences between categories, with lower internal variability than MAX_OP and CUM_OP.
o CONT_OP has the lowest absolute OP values and the least internal variability, suggesting that it is the most conservative OP measurement method.
o Overall, different OP calculation methods produce consistent trends among windbreak types, but MAX_OP and CUM_OP display greater internal variability compared to MEAN_OP and CONT_OP.
• There are observable differences in OP values between the three types of windbreaks (permeable – WB_P, semi-permeable – WB_SP, and impermeable – WB_IP), but these differences are not always sharp:
o WB_P generally exhibit the highest OP values across all measurement methods, confirming their more open structure.
o WB_SP show intermediate OP values, but in some metrics (e.g., MAX_OP_s, CUM_OP_s), their values overlap with those of WB_P, making their distinction less clear.
o WB_IP tend to have the lowest OP values, in line with their denser structure. However, certain values (e.g. MAX_OP_s) indicate some overlap with WB_SP.
o Overall, while the differences between categories are noticeable, the WB_SP overlap with other types in some OP measures, suggesting that categorization based purely on permeability might not always be definitive.
• Foliage proved a significant impact on OP values:
o Across all windbreak categories and OP calculation methods, OP values are lower in the fully foliated state (f) compared to the leafless state (s), confirming that vegetation significantly reduces optical porosity.
o The most substantial OP decrease due to foliage occurs in WB_P, where, for example, median MAX_OP drops from 66 to 39.
o WB_IP, the OP reduction is less dramatic but still evident, such as in median CONT_OP_s: 53 vs. CONT_OP_f 12.
o In general, the higher the initial OP value in the leafless condition, the greater the observed decrease after foliage is present. This confirms that vegetation density plays a crucial role in determining windbreak OP.
• Evalutation of the spatial structure of windbreaks (optical porosity) by Windbreak software created in the Mathworks MATLAB R2024a allowed for automatic data analysis based on inserted photographs of windbreaks.
Author Contributions
Conceptualization: Josef Kučera, Jana Podhrázská and Hana Středová; methodology: Josef Kučera, Jana Podhrázská, Hana Středová; software:, Josef Kučera, Hana Středová; validation: Hana Středová, Petra Fukalová, Tomáš Středa, Martin Blecha; formal analysis: Hana Středová, Josef Kučera; investigation: Petra Fukalová, Jan Szturc; resources: Petra Fukalová; data curation: Josef Kučera, Martin Blecha; writing—original draft preparation: Josef Kučera, Jana Podhrázská and Hana Středová; writing—review & editing: Hana Středová and Jana Podhrázská; visualization, Josef Kučera; supervision: Josef Kučera, Hana Středová; project administration: Josef Kučera, Jana Podhrázská and Hana Středová; funding acquisition: Josef Kučera. All authors have read and agreed to the published version of the manuscript.
Funding
This research was funded by Technology agency of the Czech Republic, grant number SS05010211 and Institutional support of MACR – number RO0223. The APC was funded by a publisher.
Data Availability Statement
The raw data supporting the conclusions of this article will be made available by the authors on request.
Acknowledgments
The authors would like to acknowledge all the reviewers and editors.
Conflicts of Interest
The funders had no role in the design of the study; in the collection, analyses, or interpretation of data; in the writing of the manuscript; or in the decision to publish the results.
References
- Tyndall, J. & Colletti, J. Mitigating swine odor with strategically designed shelterbelt. systems: a review, Agroforest Syst. 2007, 69:45-65. [CrossRef]
- Brandle, J.R., Hodges, L., Tyndall, J. & Sudmeyer, R.A. Windbreak practices. In: Garrett, H.E. (ed.). North American Agroforestry, an integrated science and practice. 2009, pp. 75-104. 2nd edition. Madison: American Society of Agronomy.
- Follet, R., Mooney, S., Morgan, J., Paustian, K., Allen, L.H., Archibelgue, S., Baker, J.M., Del Grosso, S.J., Derner, J., Dijkstra, F.; Franzlubbers, A.J.; Jansen, H., Kurkalova, L.A., McCarl., Ogle, S., Parton, W.J., Rice, C.W., Roberston, G.P., Schoenenberger, M., West, T.O. & Williams, J. Carbon sequestration and green-house gas fluxes in agriculture: Challenges and opportunities. 2011, First edition. Ames, Iowa, USA: Council for Agricultural Science and Technology- CAST-. 106 p.
- Schoeneberger, M.M. Agroforestry: working trees for sequestering carbon on agricultural lands. Agroforest Syst. 2009, 75:27-37. [CrossRef]
- Possú, W.B., Brandle, J.R., & Ordóñez, H.R. Carbon storage potential of windbreaks in the United States. Revista de Ciencias Agrícolas. 2019, 36(E), 108-123.
- Chendev, Y.G., Novykh, L.L., Sauer, T.J., Petin, A.N., Zazdravnykh, E.A., & Burras, C.L. Evolution of Soil Carbon Storage and Morphometric Properties of Afforested Soils in the U.S. Great Plains. Soil Carbon 2014, 475-482.
- Hernández-Morcillo, M., Burgess, P., Mirck, J., Pantera, A., Plieninger, T. Scanning agroforestry-based solutions for climate change mitigation and adaptation in Europe. Environmental Science and Policy. 2018, 80: 44–52.
- Abbas, F. , Hammad, H. M., Fahad, S. et al. Agroforestry: a sustainable environmental practice for carbon sequestration under the climate change scenarios - a review. Environ Sci Pollut Res. 2017, 24, 11177–11191. [Google Scholar]
- Campi, P., Palumbo, A.D., Mastrorilli, M. Effects of tree windbreak on microclimate and wheat productivity in a Mediterranean environment. European Journal of Agronomy. 2009, 30: 220–227.
- Kanzler, M., Böhm, C., Mirck, J., Schmitt, D., Veste, M. Microclimate effects on evapotranspiration and winter wheat (Triticum aestivum L.) yield within a temperate agroforestry system. Agroforestry Systems. 2019, 93: 1821–1841.
- Veste, M., Littmann, T., Kunnecke, A., du Toit, B., Seifert, T. Windbreaks as part of climate-smart landscapes reduce evapotranspiration in vineyards, Western Cape Province, South Africa. Plant Soil Environ. 2020, 66: 119–127.
- Středa, T.; Středová, H.; Rožnovský, J. Orchards microclimatic specifics. In Bioclimate: Source and Limit of Social Development, Topolčianky, Slovakia; Slovak University of Agriculture: Nitra, Slovakia, 2011; pp. 132–133. [Google Scholar]
- Sturrock, J.W. Aerodynamic studies of shelterbelts in New Zealand-1: low to medium height shelterbelts in Mid-Canterbury. New Zealand J Sci. 1969, 12: 754–776.
- Zhang, H., Brandle, J.R., Meyer, G.E. and Hodges, L. The relationship between open windspeed and windspeed reduction in shelter. Agrofor Syst. 1995, 32: 297–311.
- Yang XG, Yu, Y. Estimating soil salinity under various moisture conditions: an experimental study. IEEE Trans Geosci Remote Sens. 2017, 55:2525–2533.
- Bitog JP et al. Numerical simulation study of a tree windbreak. Biosyst Eng. 2012, 111:40–48.
- Jiang, F., Zhou, X., Fu, M., Zhu, J., Lin, H. Shelterbelt porosity model and its application. Chin. J. Appl. Ecol. 1994, 5, pp. 251-255.
- Nosek, S. , Kellnerova, R. , Jurcakova, K., Janour, Z., Chaloupecka, H., Jakubcova, M. Effect of shelter porosity on downwind flow characteristics. EPJ Web of Conferences. 2016, 114, p 02084. [Google Scholar]
- Streda, T. , Malenova, P. ; Pokladnikova, H.; Roznovsky, J. The efficiency of windbreak on the basis of wind field and optical porosity measurement. Acta Universitatis Agriculturae et Silviculturae Mendelianae Brunensis. 2008, 56, pp. 281–288. [Google Scholar]
- Loeffler, A.E. , Gordon, A. M. & Gillespie, T.J. Optical porosity and windspeed reduction by coniferous windbreaks in Southern Ontario. Agroforest Syst. 1992, 17, 119–133. [Google Scholar]
- Stredova, H.; Podhrazska, J.; Litschmann, T.; Streda, T. Roznovsky. J. Aerodynamic parameters of windbreak based on its optical porosity. Contrib. Geophys. Geod. 2012, 42, pp. 213–226. [Google Scholar]
- Lukasová, V. , Vido, J. , Škvareninová, J., Bičárová, S., Hlavatá, H., Borsányi, P., Škvarenina, J. Autumn phenological response of European beech to summer drought and heat. Water. 2020, 12, 2610. [Google Scholar]
- Mrekaj, I., Lukasová, V., Rozkošný, J., Onderka, M. Significant phenological response of forest tree species to climate change in the Western Carpathians. Central European Forestry Journal. 2024, 70: 107-121. [CrossRef]
- Středová, H. , Fukalová, P. , Chuchma, F., Středa, T. A Complex Method for Estimation of Multiple Abiotic Hazards in Forest Ecosystems. Water. 2020, 12, 2872. [Google Scholar] [CrossRef]
- Vacek, Z. , Řeháček, D. , Cukor, J. et al. Windbreak Efficiency in Agricultural Landscape of the Central Europe: Multiple Approaches to Wind Erosion Control. Environmental Management. 2018, 62, 942–954. [Google Scholar]
- Yang, X. , Li, F. , Fan, W. et al. Evaluating the efficiency of wind protection by windbreaks based on remote sensing and geographic information systems. Agroforest Syst. 2021, 95, 353–365. [Google Scholar] [CrossRef]
- Nowak, M.M., Pedziwiatr, K., & Bogawski, P. Hidden gaps under the canopy: LiDAR-based detection and quantification of porosity in tree belts. Ecological Indicators. 2022, 142.
- Clarivate. Citation report: "optical porosity" (Topic) AND "windbreak" (Topic) Web of Science. , 2025. Available from: https://www.webofscience.
- Podhrázská, J., Novotný, I., Rožnovský J., Hradil, M., Toman, F.; Dufková, J., Macků. J., Krejčí, J., Pokladníková, H., Středa, T. Optimizing the functions of windbreakers in agricultural landscape. 2008, Prague: Research Institute for Soil and Water Conservation. 39 p. ISBN 978-80-904027-1-3.
- Podhrázská, J. , Kučera, J. , Doubrava, D., Doležal, P. Functions of Windbreaks in the Landscape Ecological Network and Methods of Their Evaluation. Forests, 2021, 12, 67. [Google Scholar]
- Kučera, J., Fukalová, P., Středová, H., Blecha, M., Jakubíček, R., Chmelík, J., Podhrázská, J., Středa, T. Evaluation of the spatial structure of windbreaks from digital photography. Journal of Ecological Engineering. 2024, 25(10), 381- 391. ISSN 2299-8993.
- Středová, H., Podhrazská, J., Chuchma, F., Středa, T., Kučera, J., Fukalová, P., Blecha, M. The Road Map to Classify the Potential Risk of Wind Erosion. Isprs International Journal of Geo-Information. 2021, 10(4), 269. [CrossRef]
- Středa, T. , Malenová, P. , Pokladniková, H., Rožnovský, J. The efficiency of windbreak on the basis of wind field and optical porosity measurement. 2008. Acta Universitatis Agriculturae et Silviculturae Mendelianae Brunensis. 2008, 56, pp. 281–288. [Google Scholar]
- Yuan, F. , Wu, J. , Wang, A. et al. A semiempirical model for horizontal distribution of surface wind speed leeward windbreaks. Agroforest Syst. 2020, 94, 499–516. [Google Scholar] [CrossRef]
- Van Thuyet, D. , Van Do, T. , Sato, T. et al. Effects of species and shelterbelt structure on wind speed reduction in shelter. Agroforest Syst. 2014, 88, 237–244. [Google Scholar] [CrossRef]
Figure 1.
Tree map chart for search field Topic for "windbreaks" and "climate change" (Web of Science Categories), Clarivate, 2025.
Figure 1.
Tree map chart for search field Topic for "windbreaks" and "climate change" (Web of Science Categories), Clarivate, 2025.
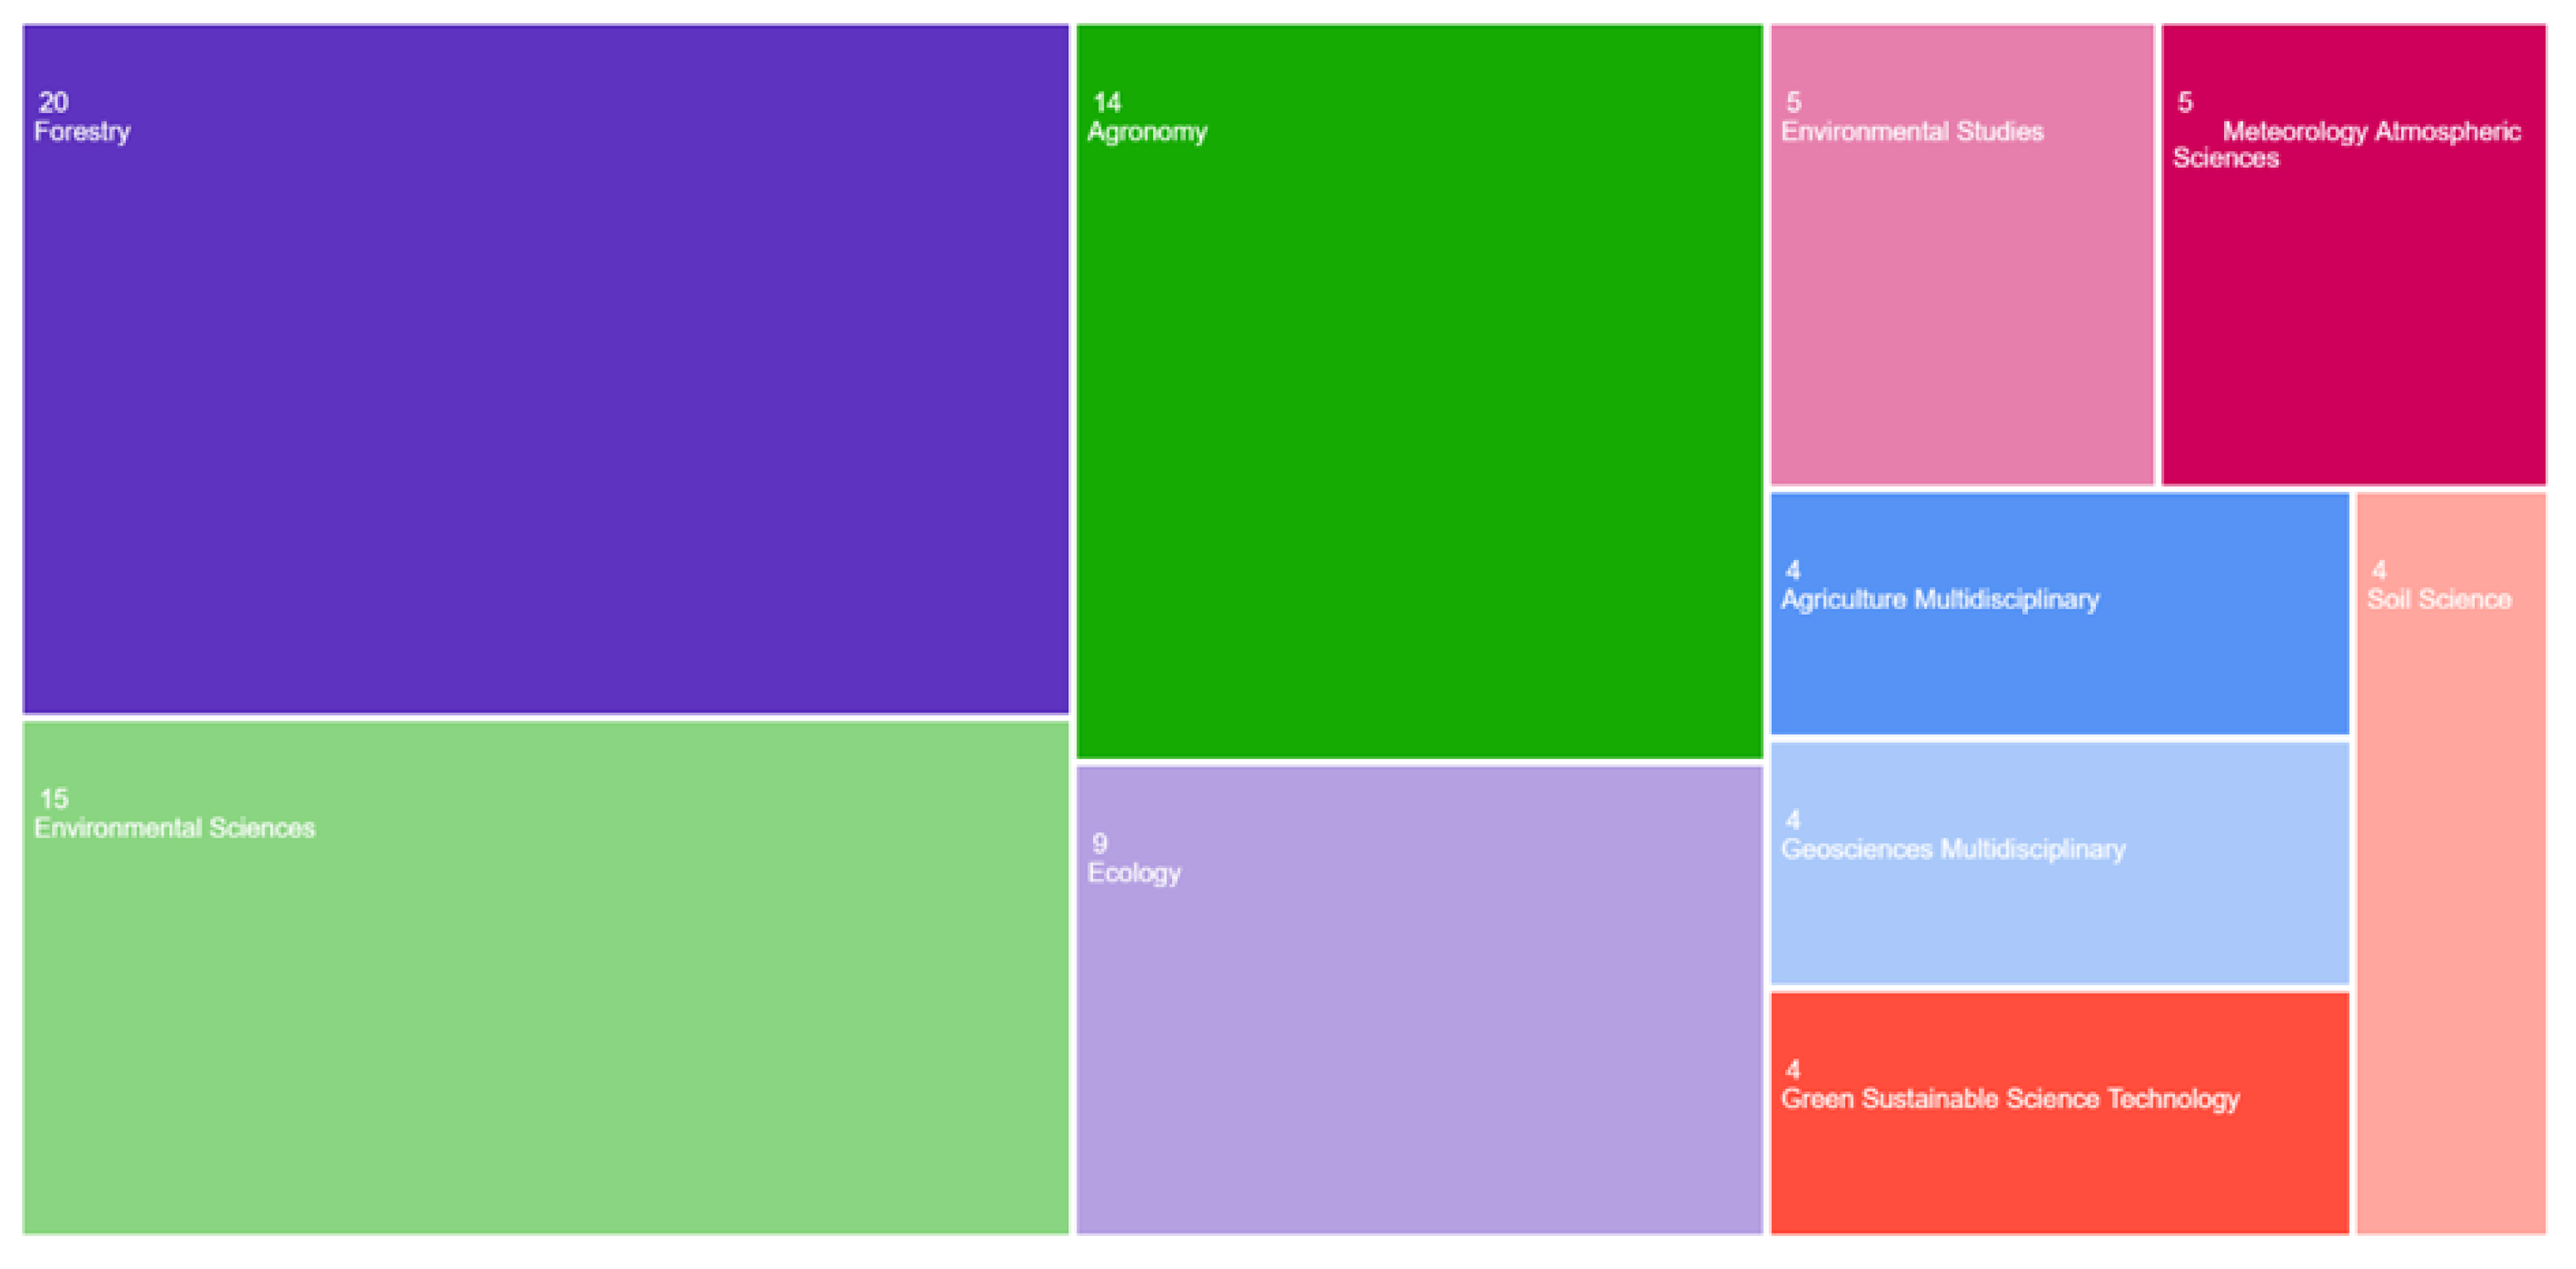
Figure 2.
Specific locations of windbreaks on potential wind erosion (PWE) risk map of the Czech Republic [32] (modified by authors).
Figure 2.
Specific locations of windbreaks on potential wind erosion (PWE) risk map of the Czech Republic [32] (modified by authors).
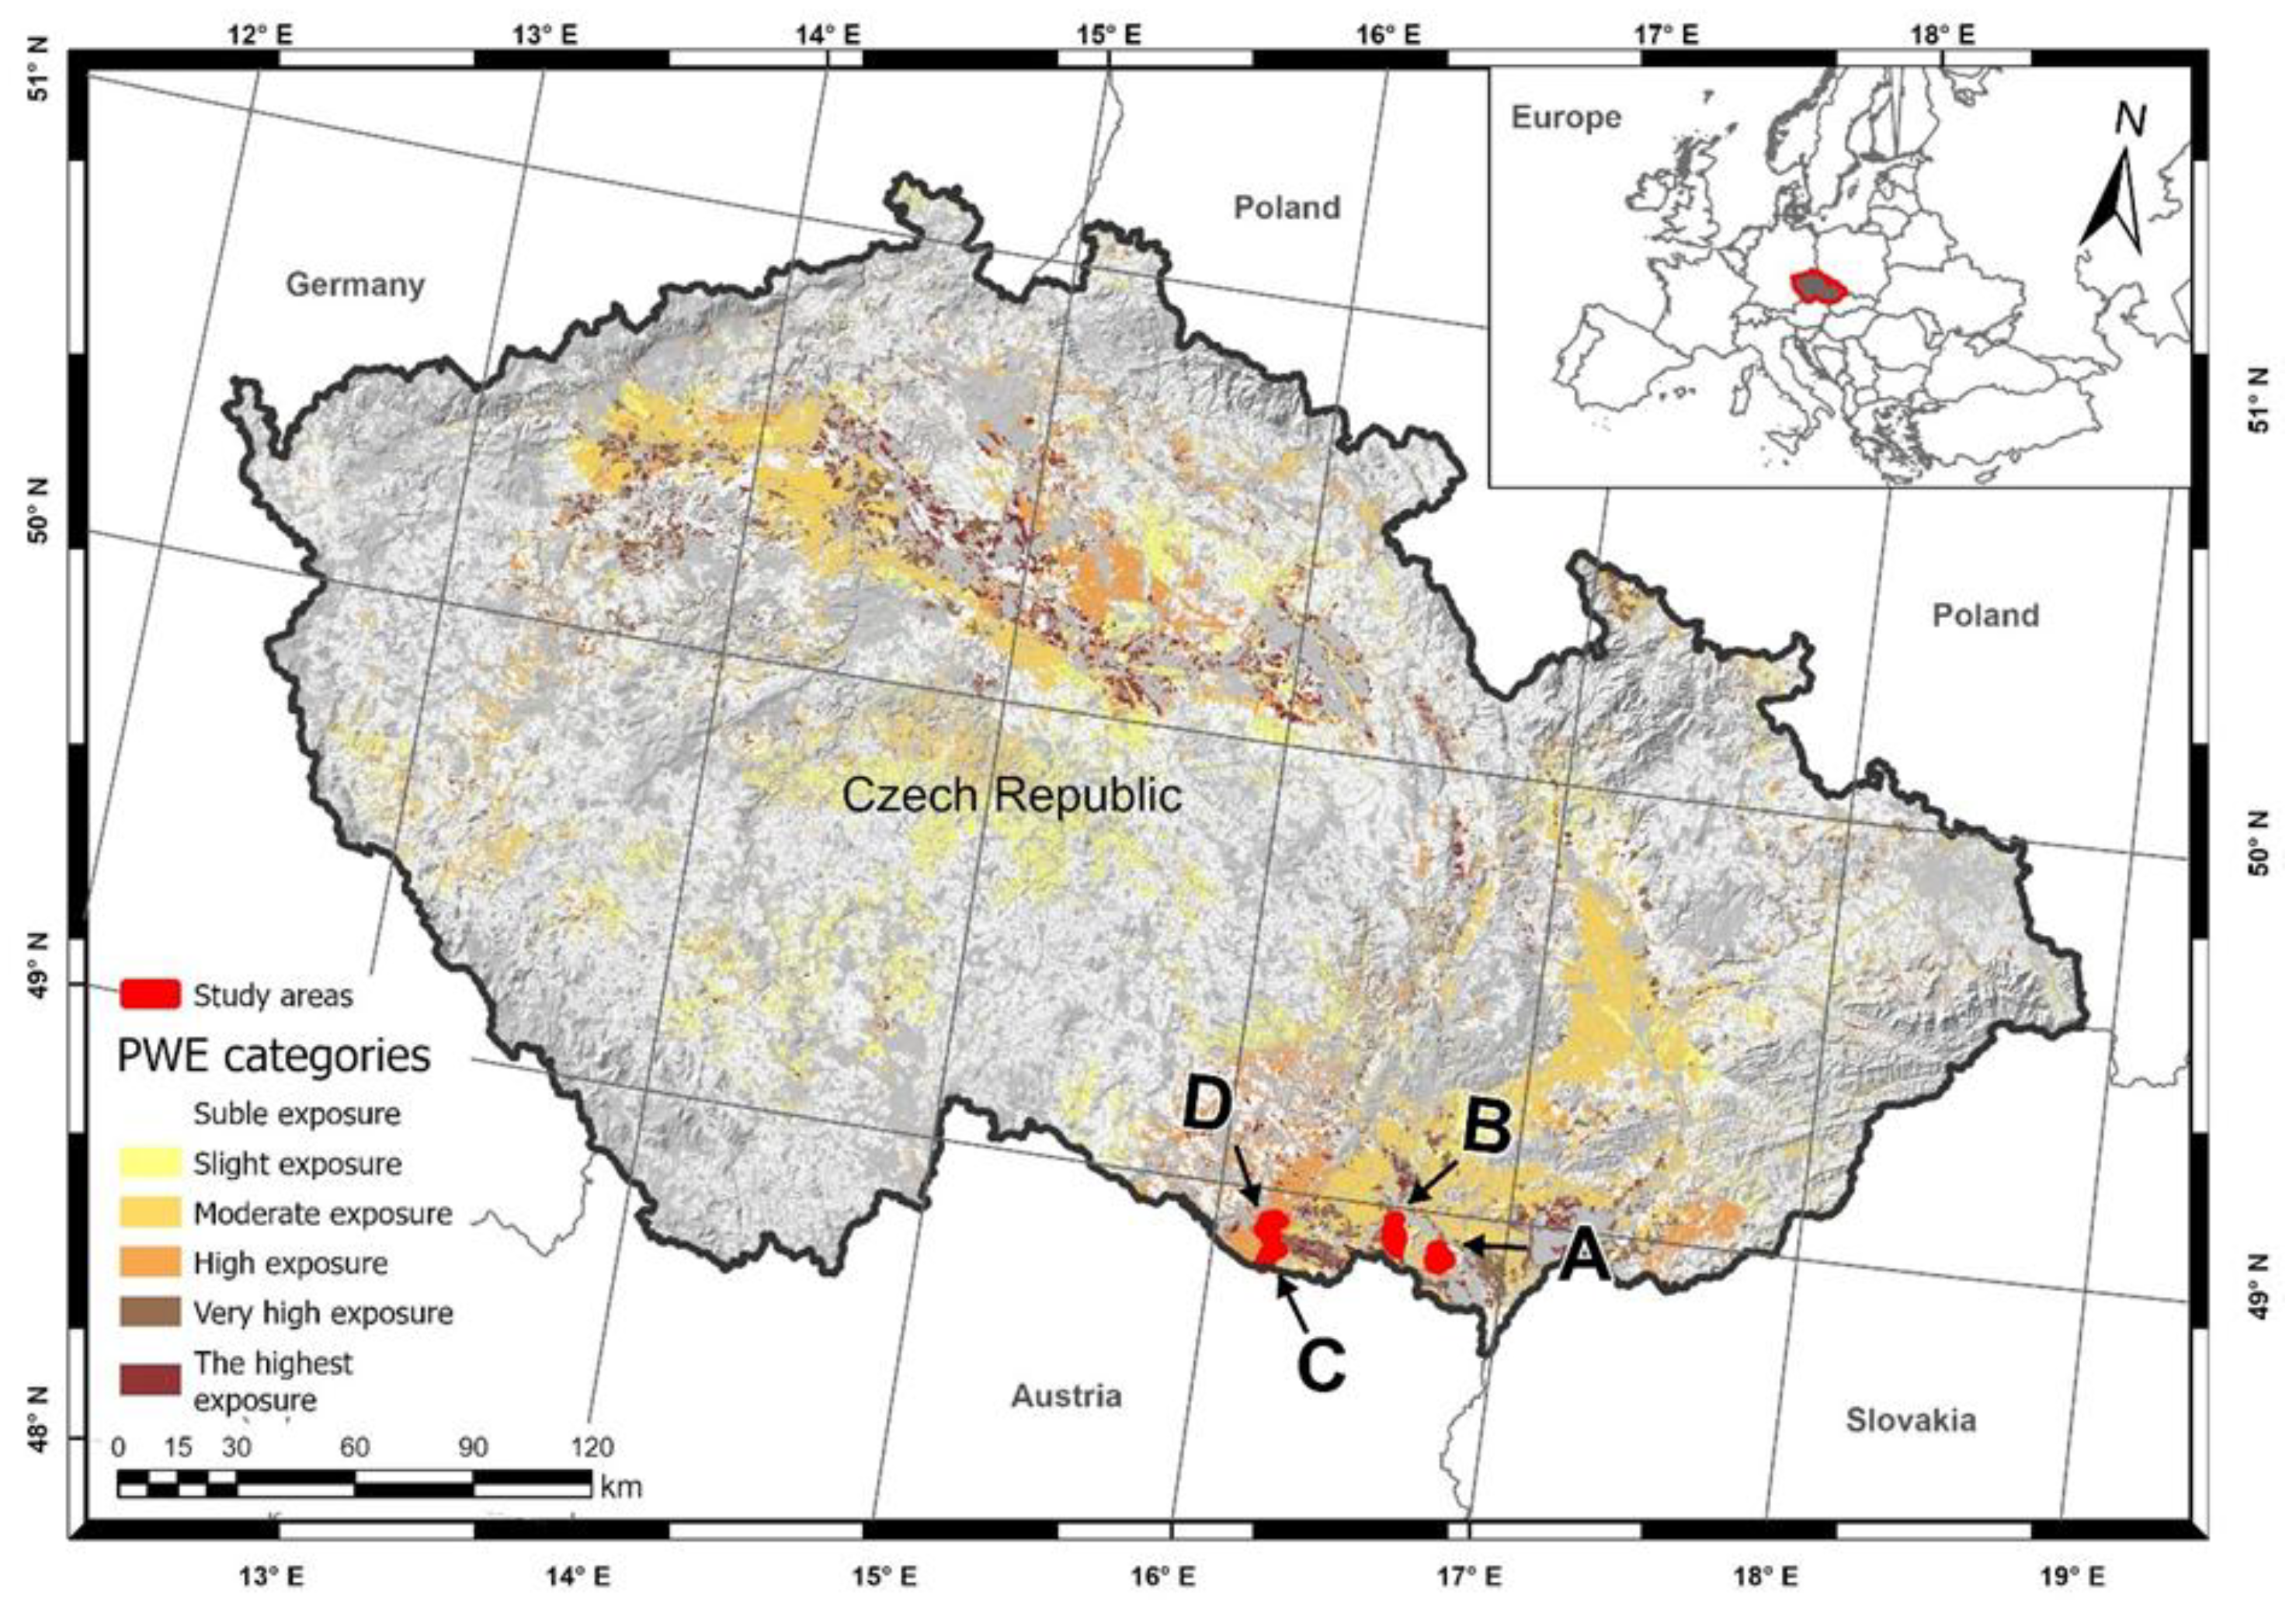
Figure 3.
Maps of the individual locations (A – D) with marking of the particular windbreaks.
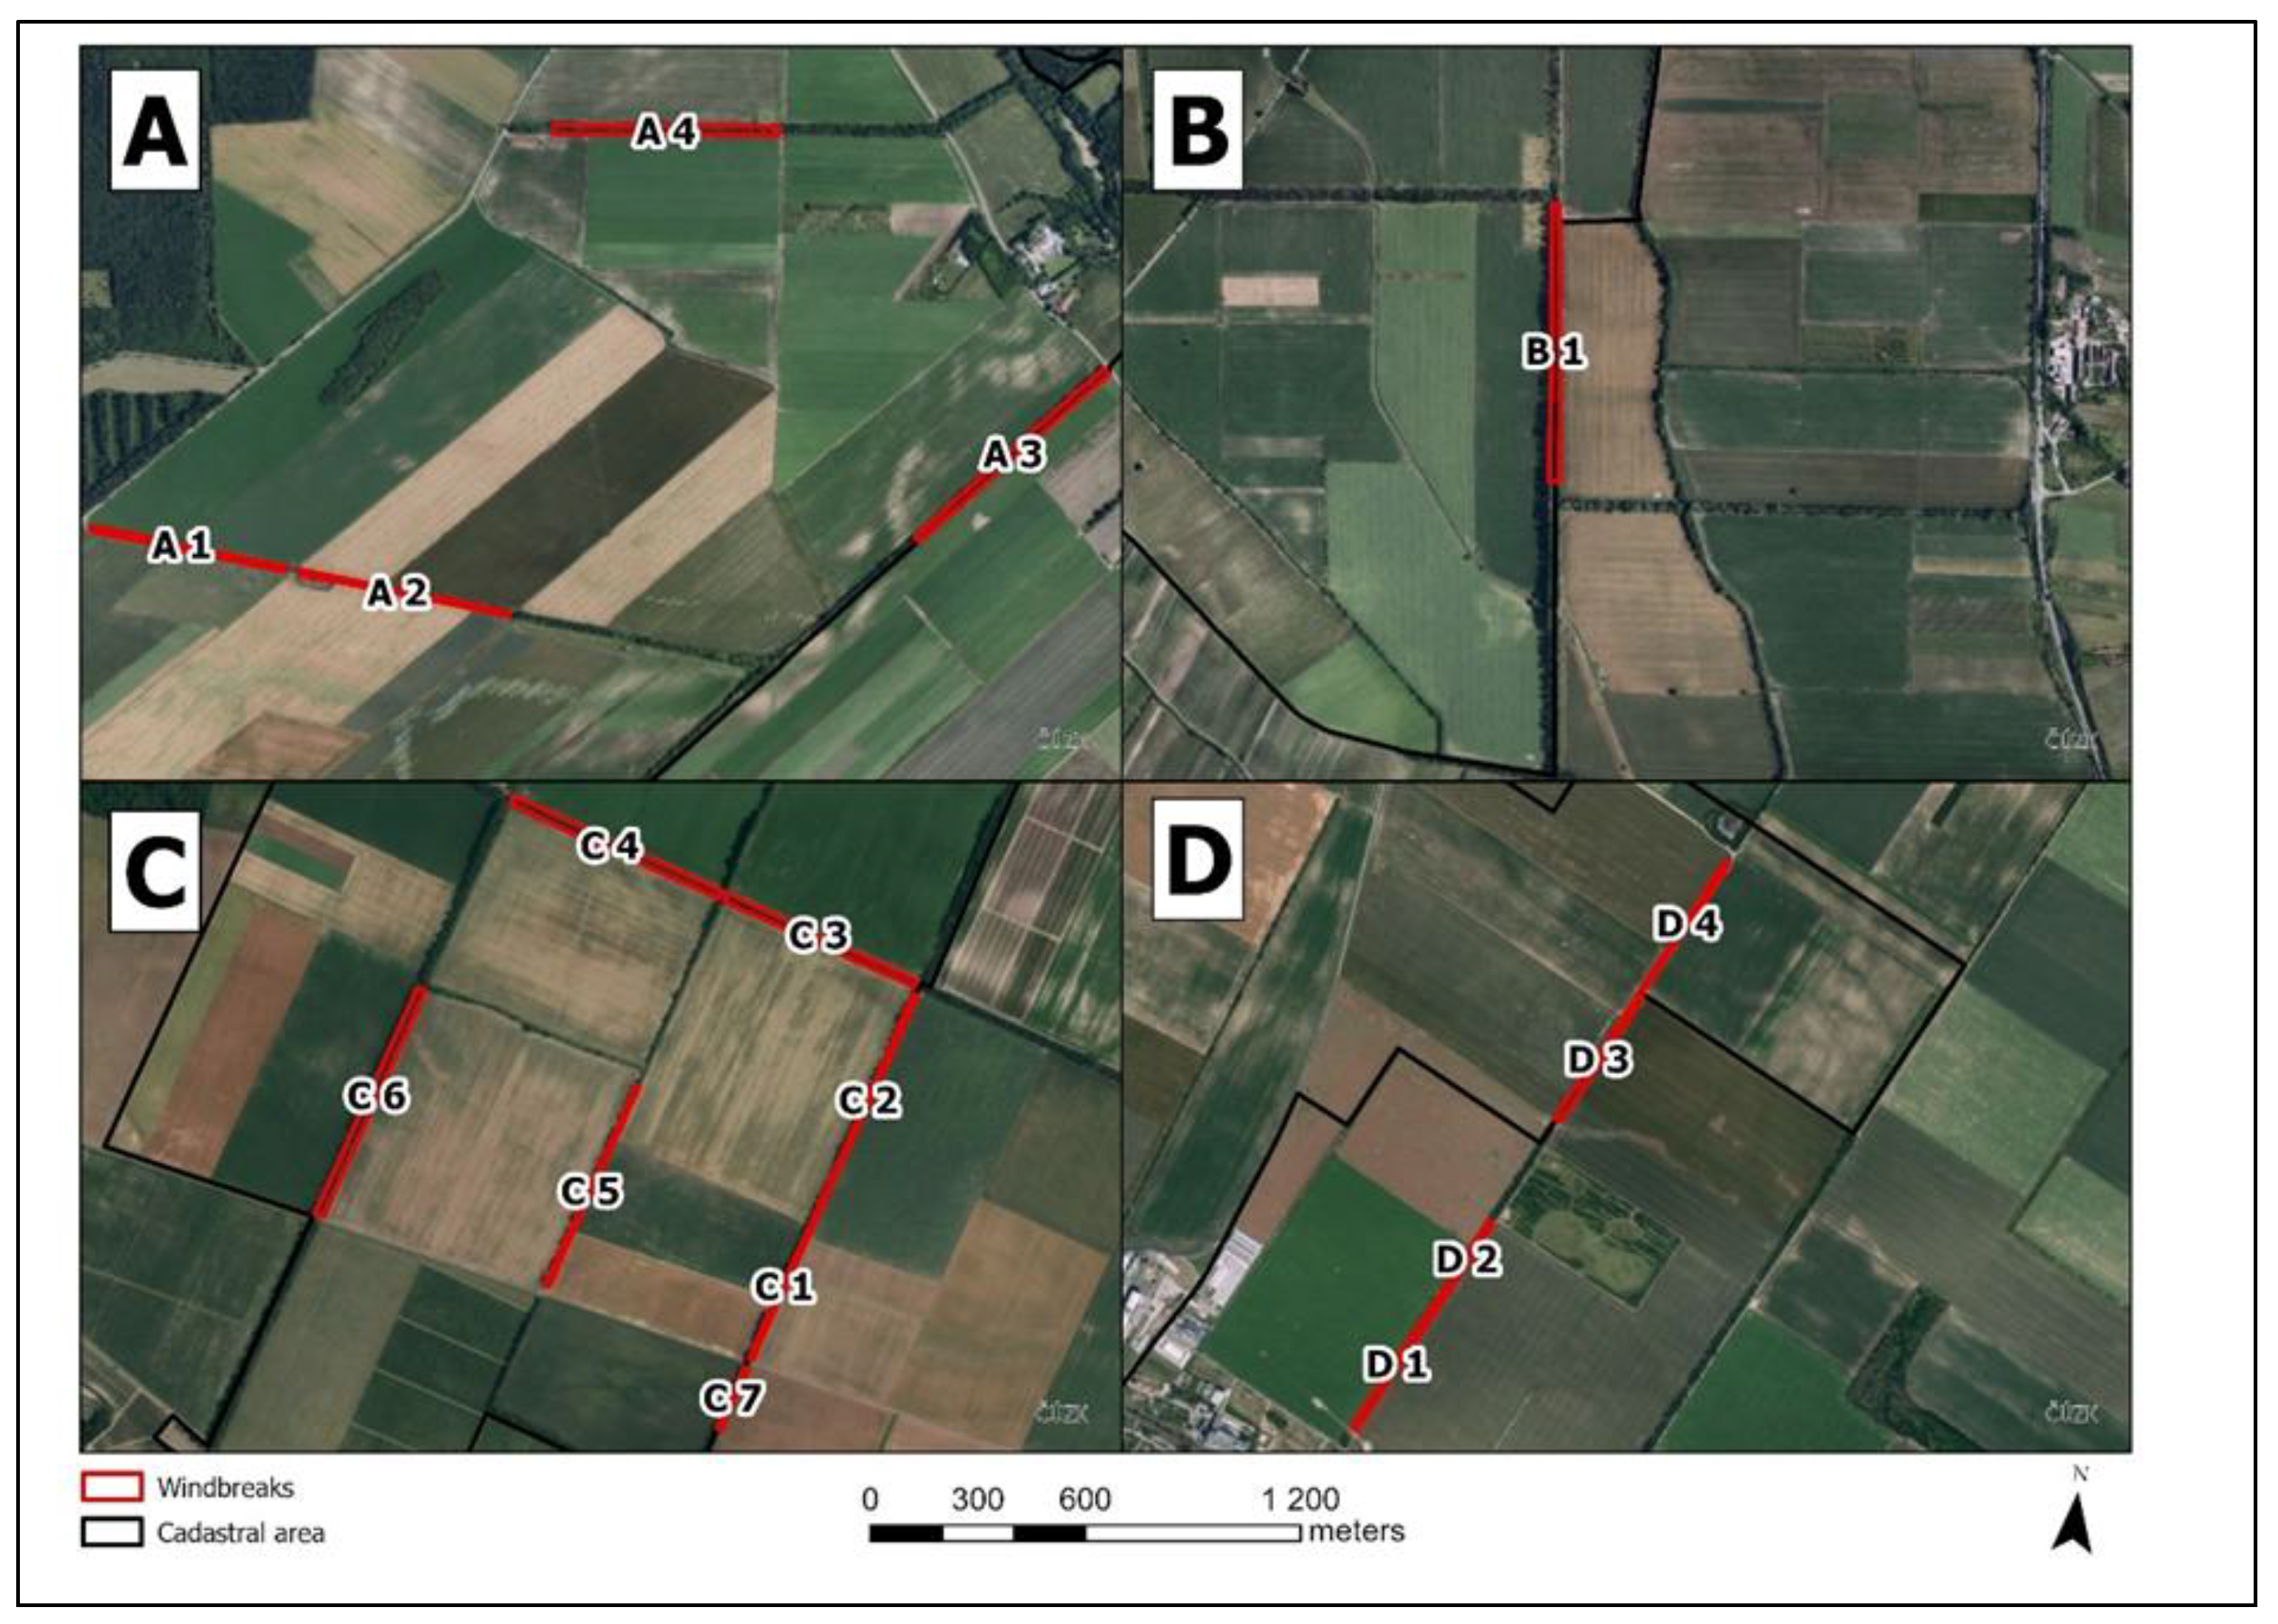
Figure 4.
Location A4 divided to segments 30 m wide.
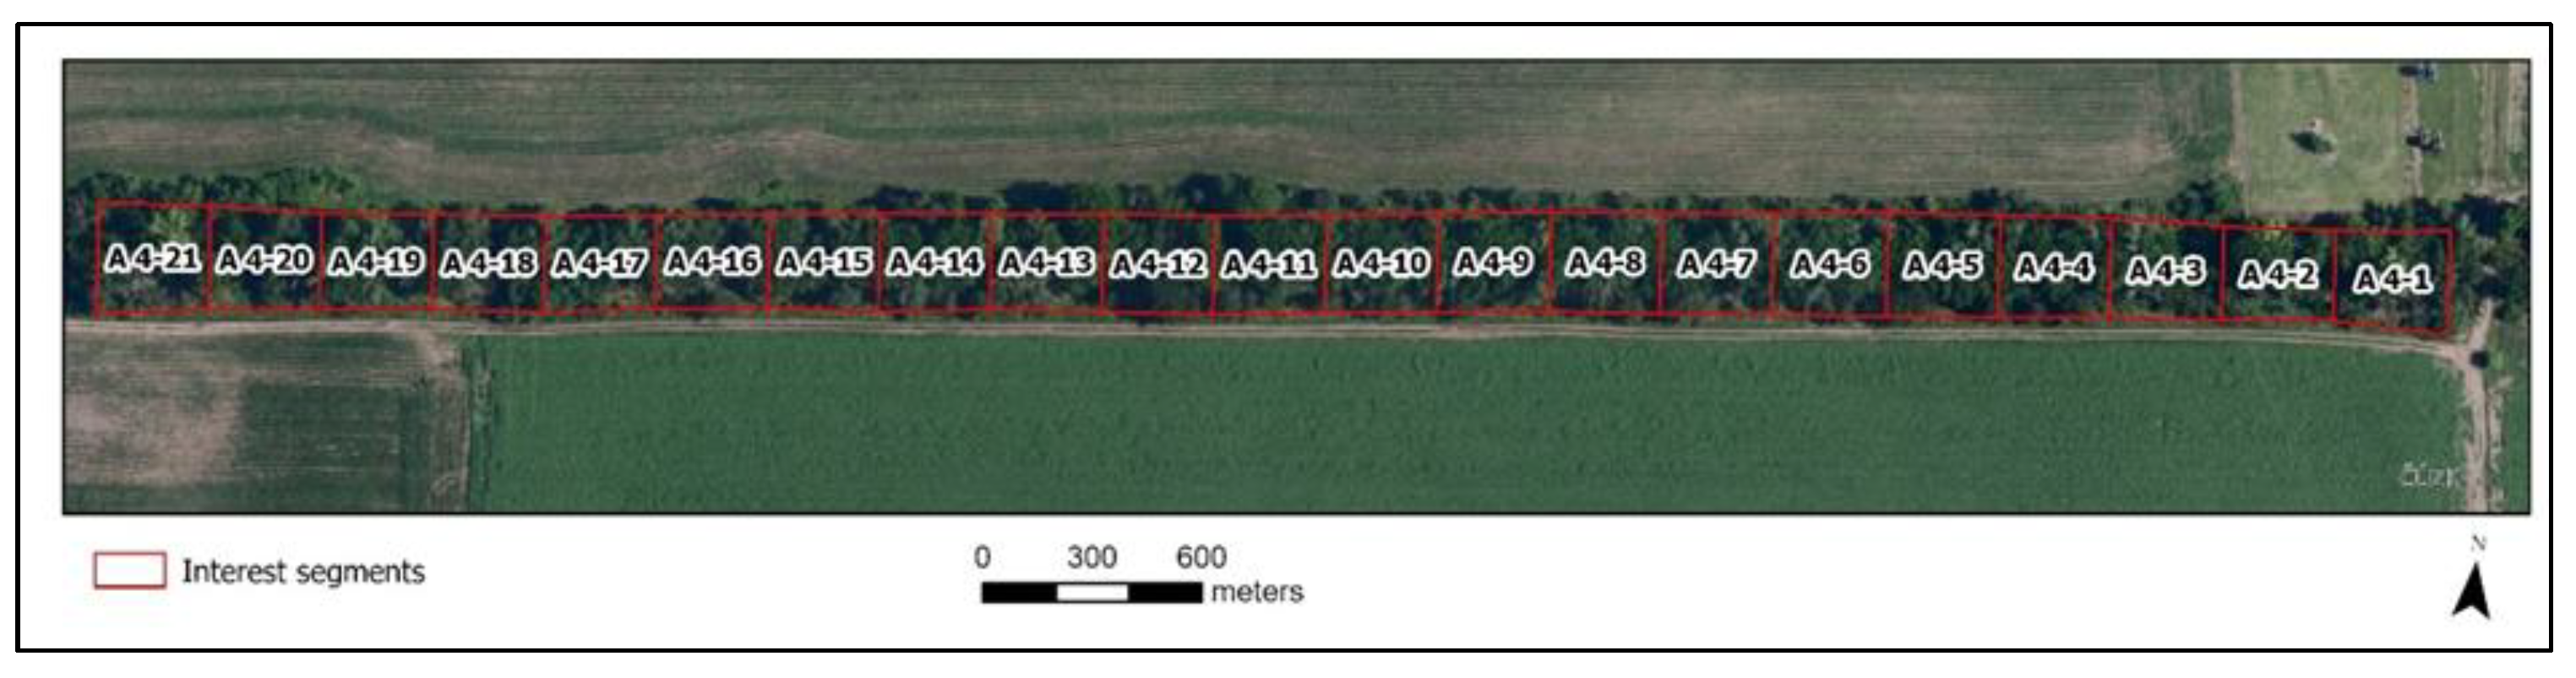
Figure 5.
Original image of evaluated windbreak (left) transformed into black-white version (right); red line represents windbreak’s contour and green its maximum height.
Figure 5.
Original image of evaluated windbreak (left) transformed into black-white version (right); red line represents windbreak’s contour and green its maximum height.
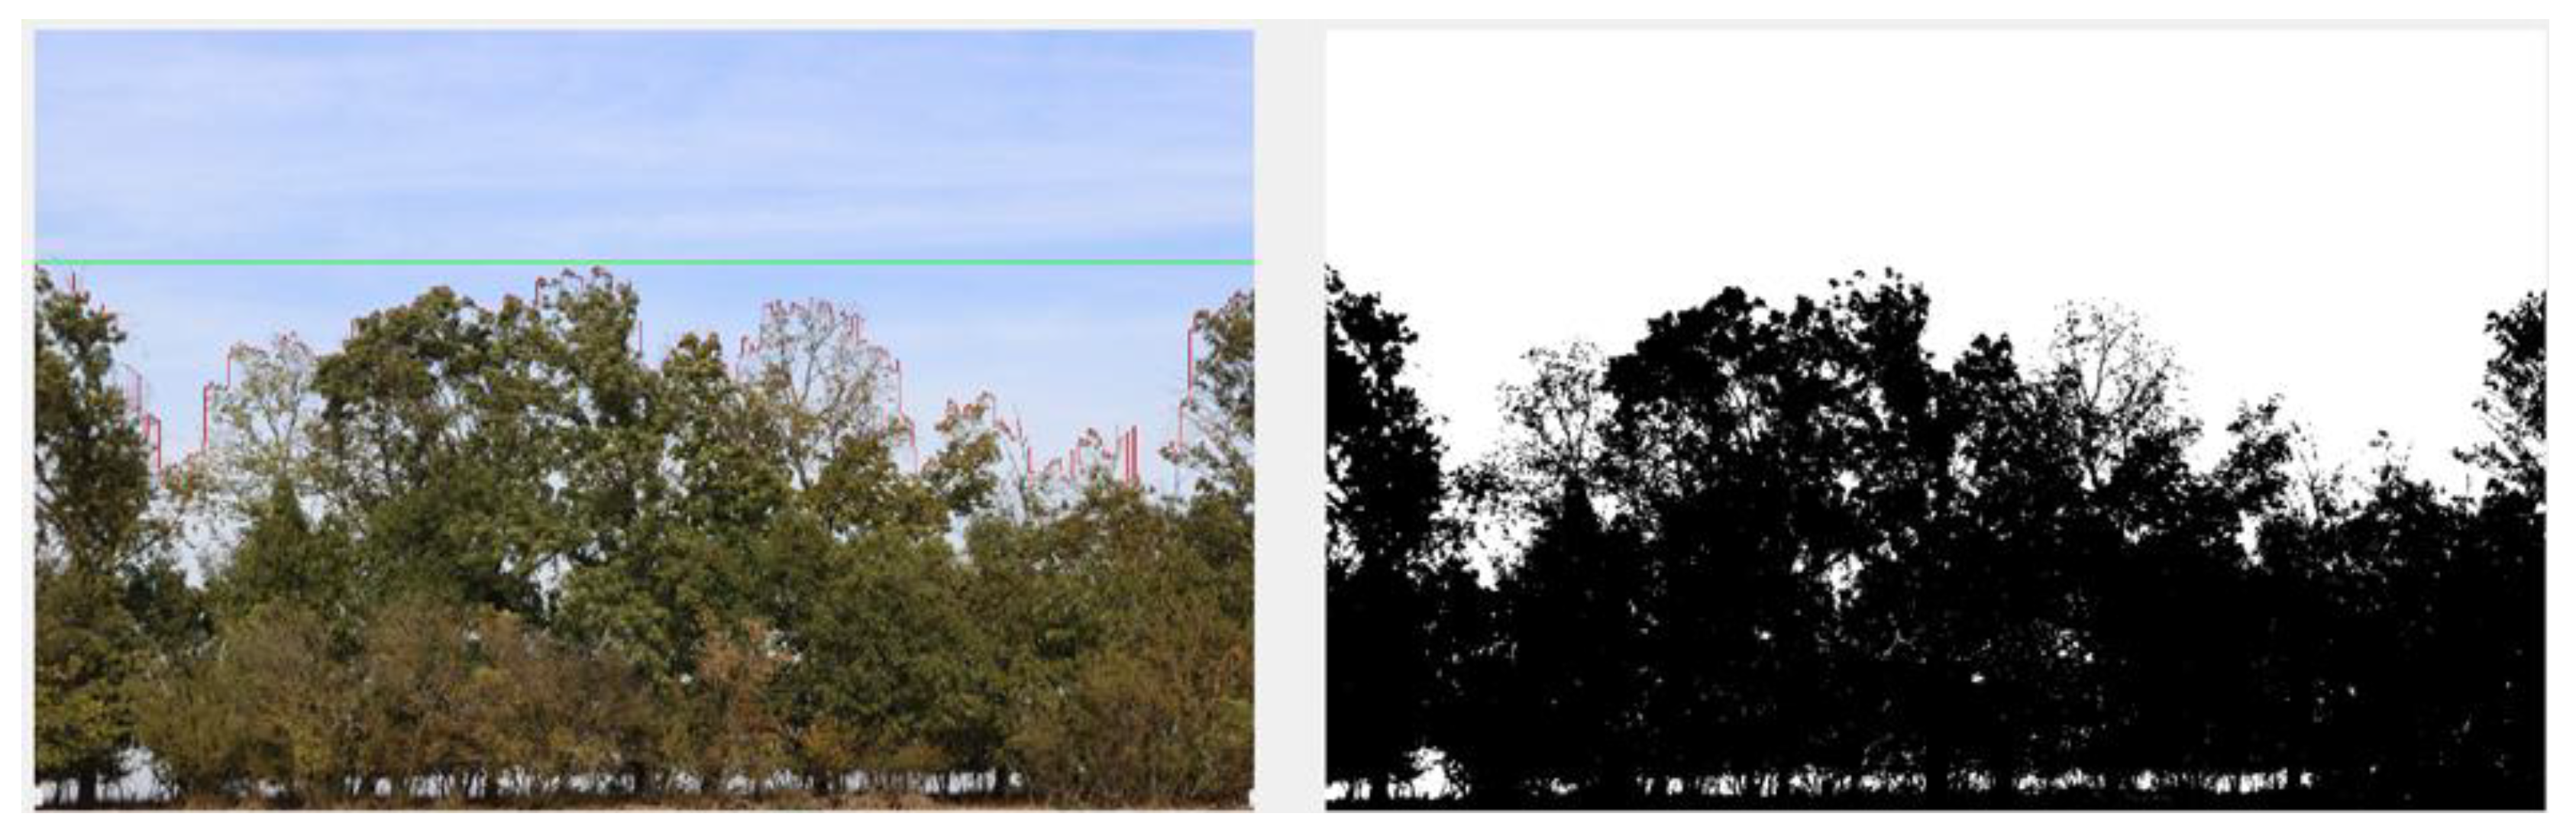
Figure 6.
Heights of evaluated windbreaks: maximum height (MAX), average height (MEAN) and height according to the windbreak contour (CONT).
Figure 6.
Heights of evaluated windbreaks: maximum height (MAX), average height (MEAN) and height according to the windbreak contour (CONT).
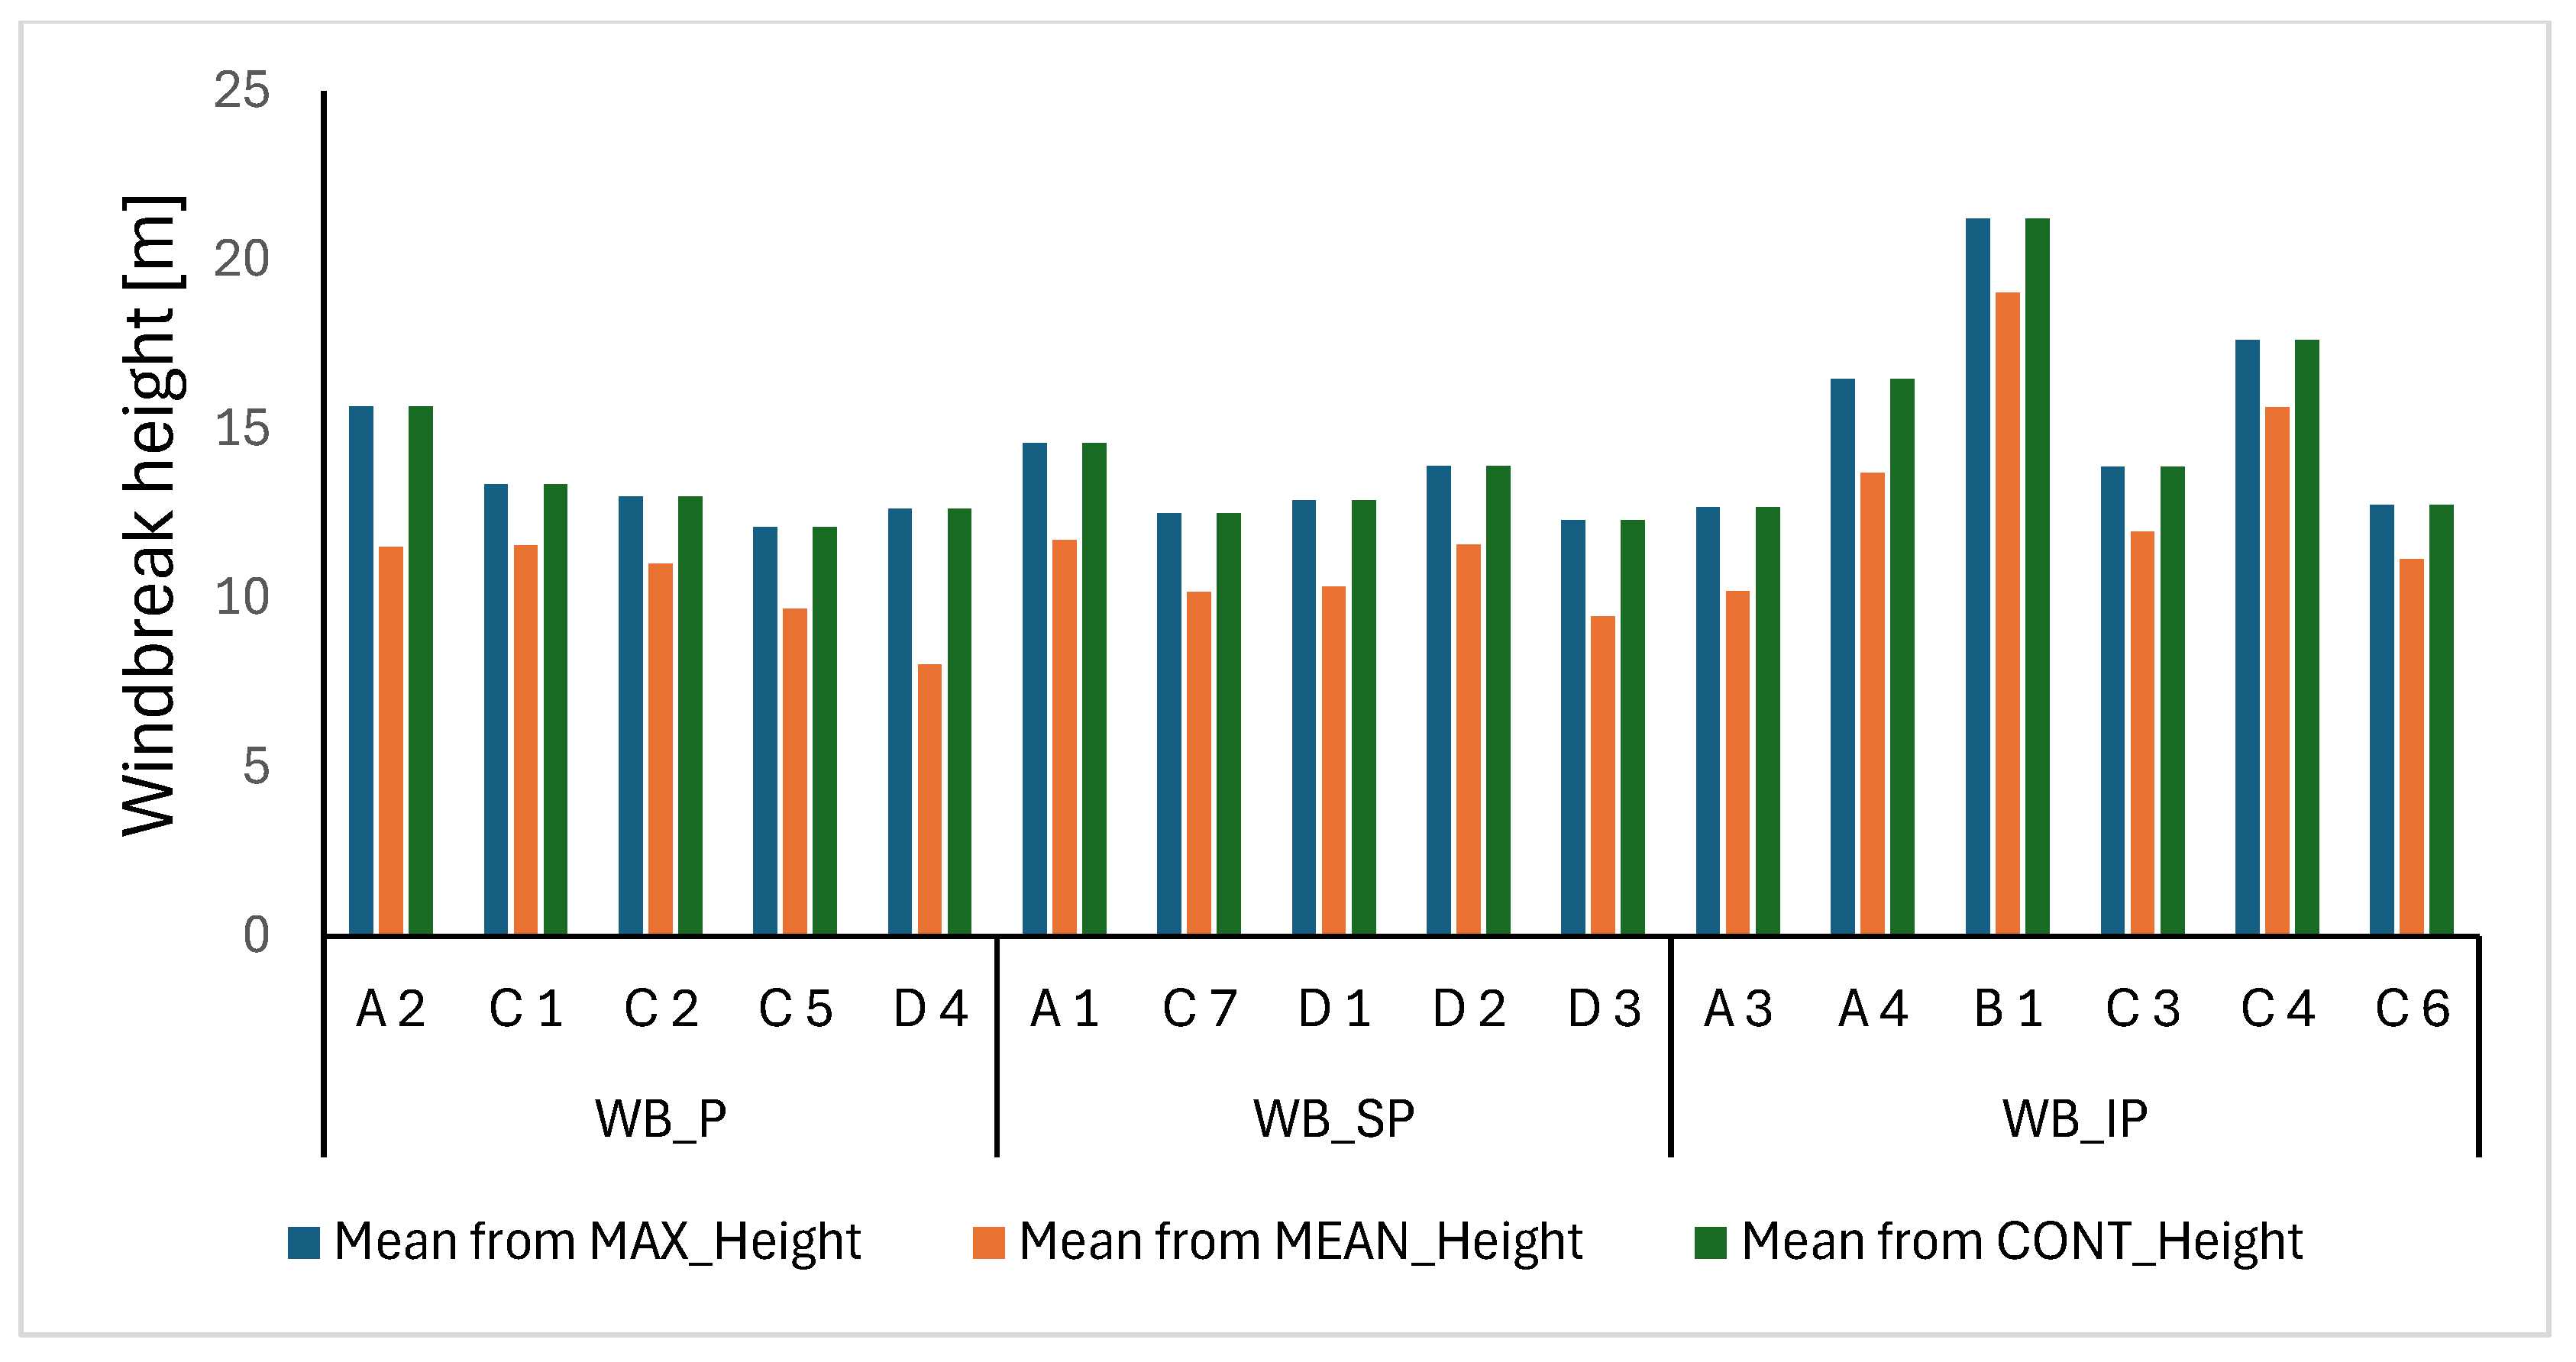
Figure 7.
CUM15_OP for different types of windbreaks and different states of foliage.
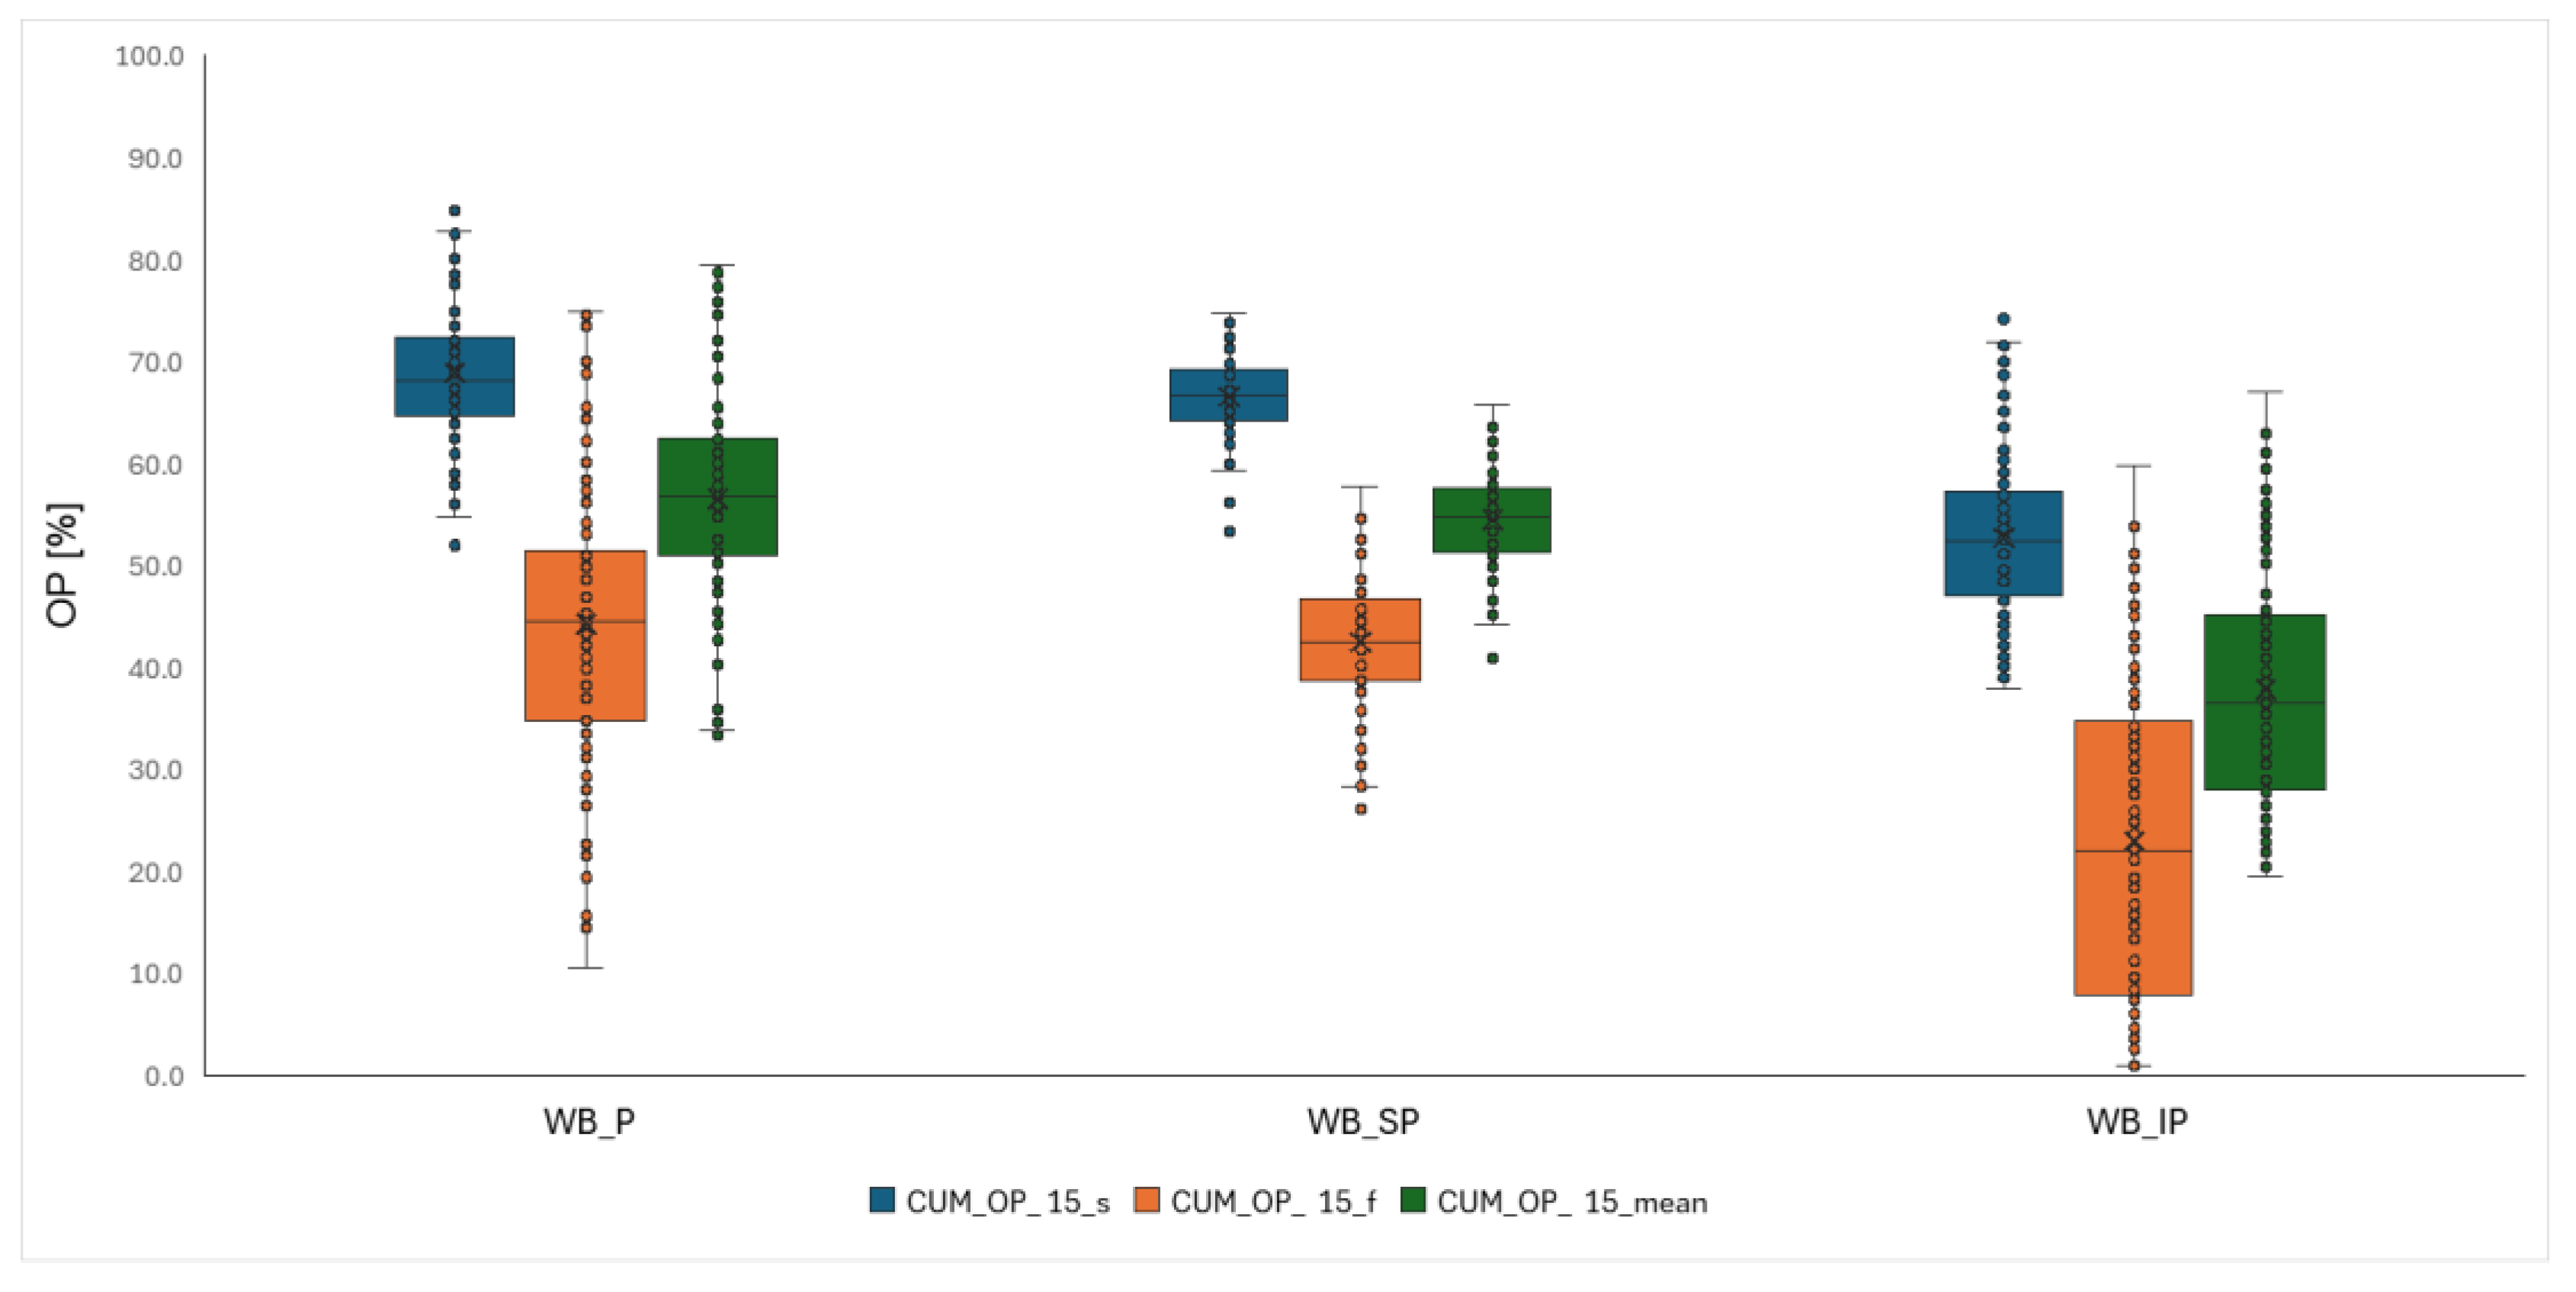
Figure 8.
MAX_OP for different types of windbreaks and different states of foliage.
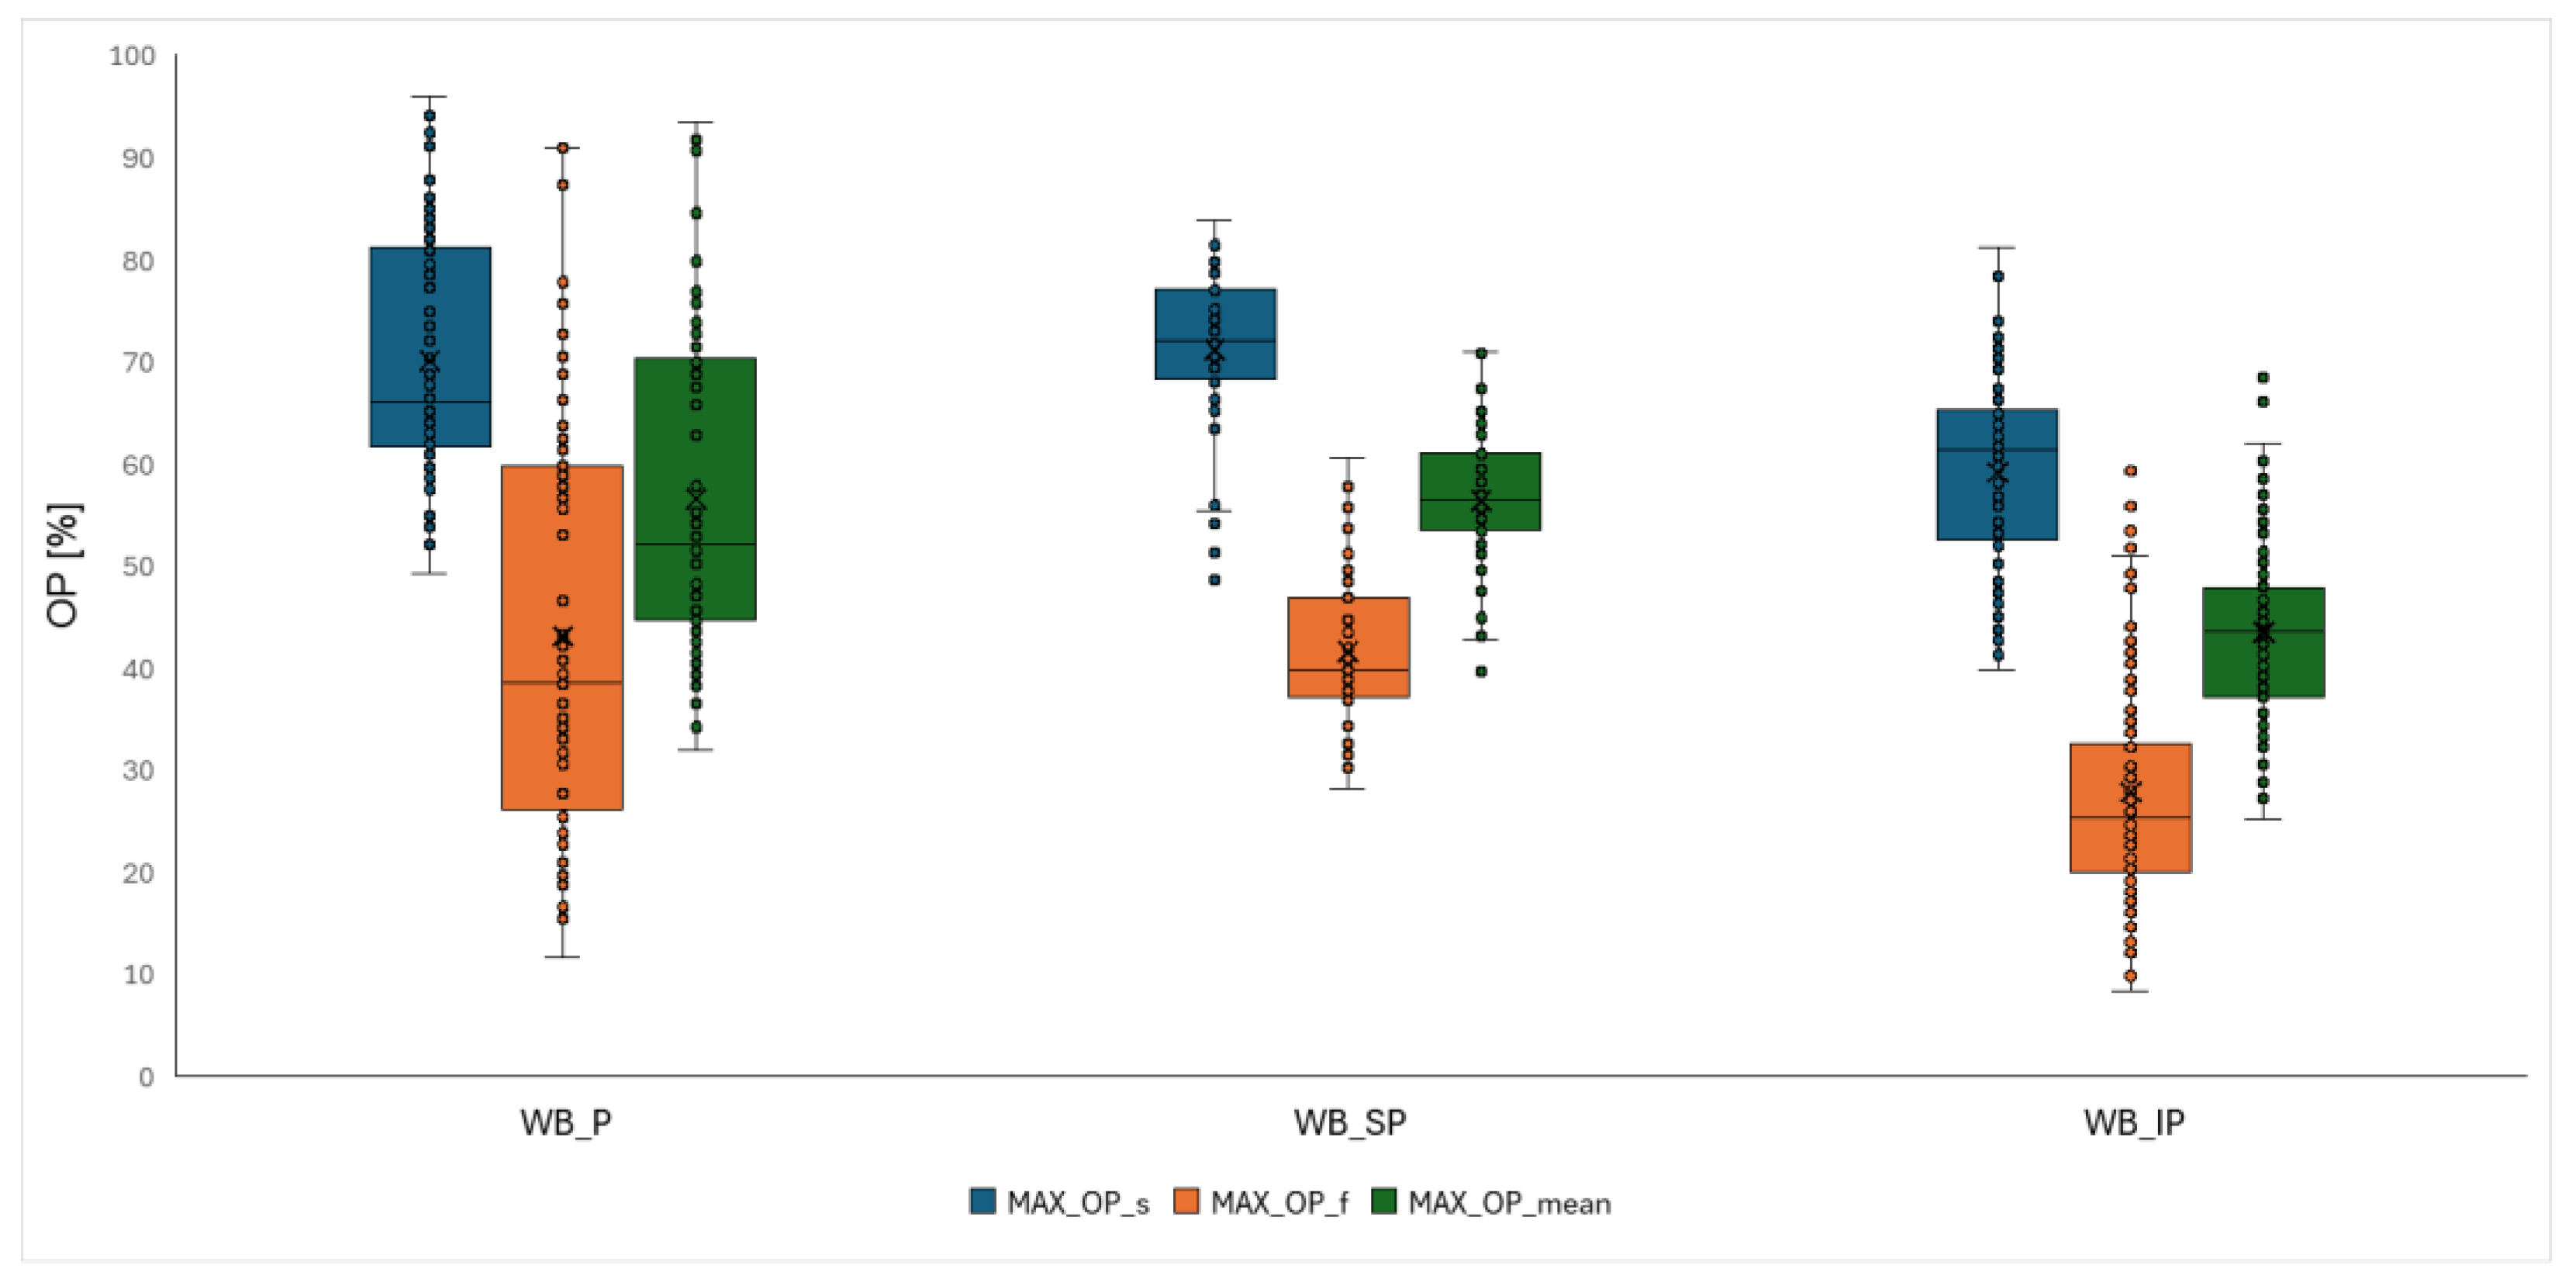
Figure 9.
MEAN_OP for different types of windbreaks and different states of foliage.
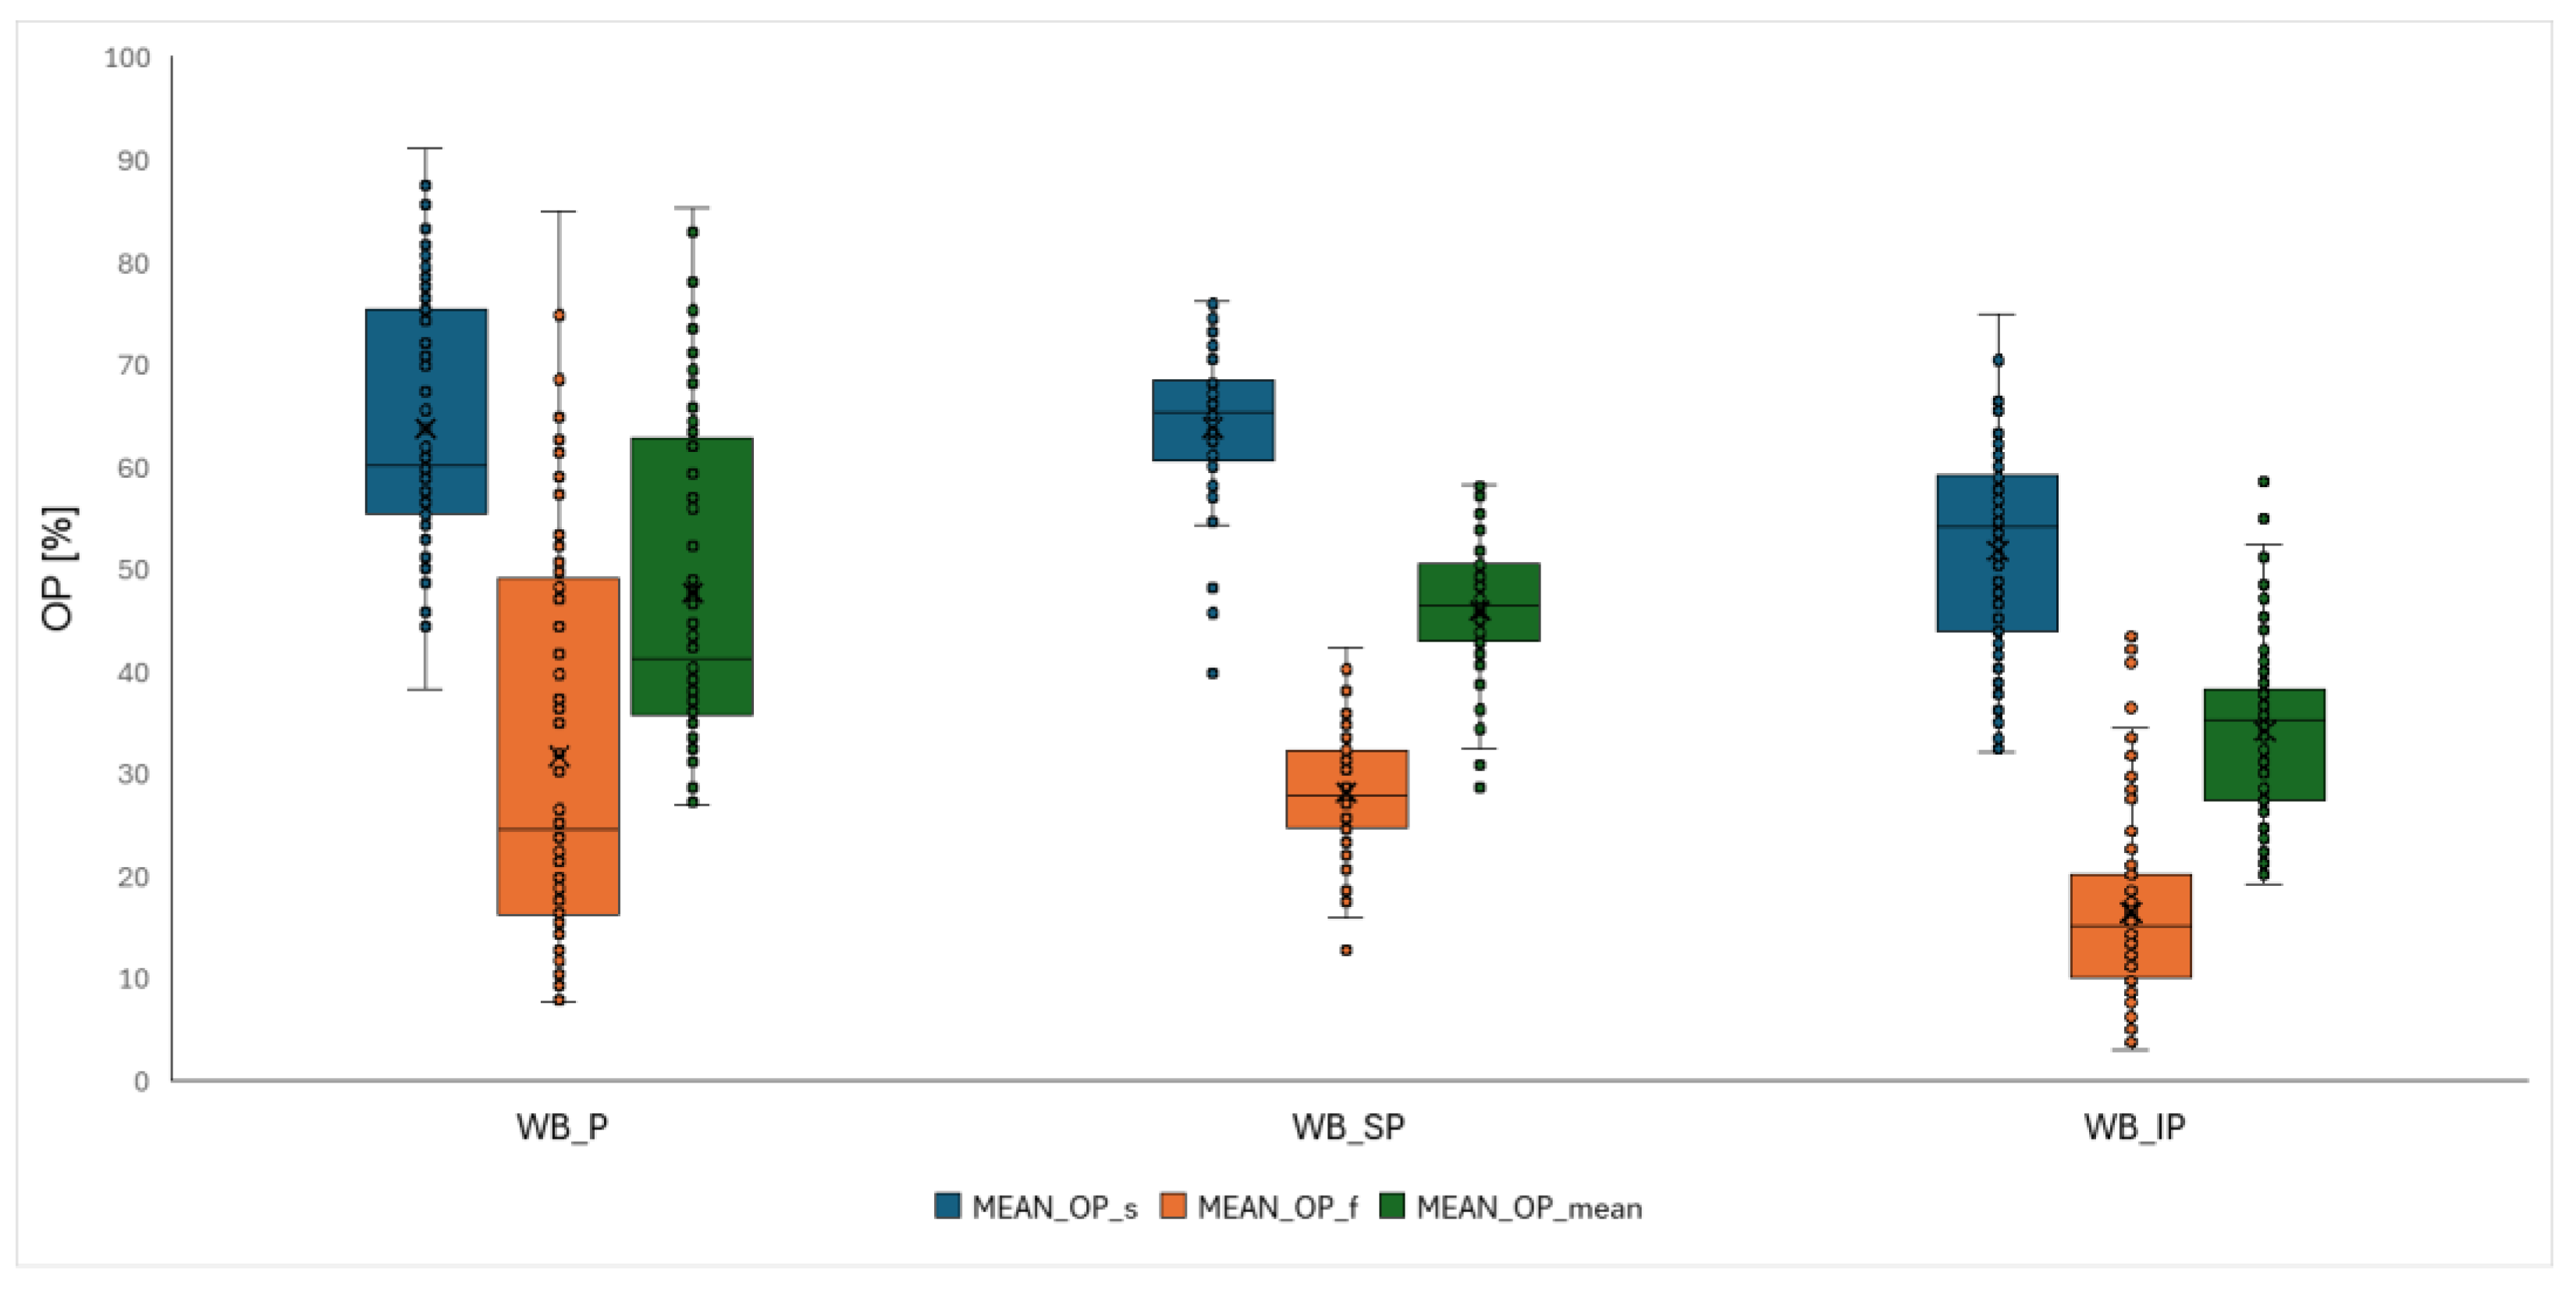
Figure 10.
CONT_OP for different types of windbreaks and different states of foliage.
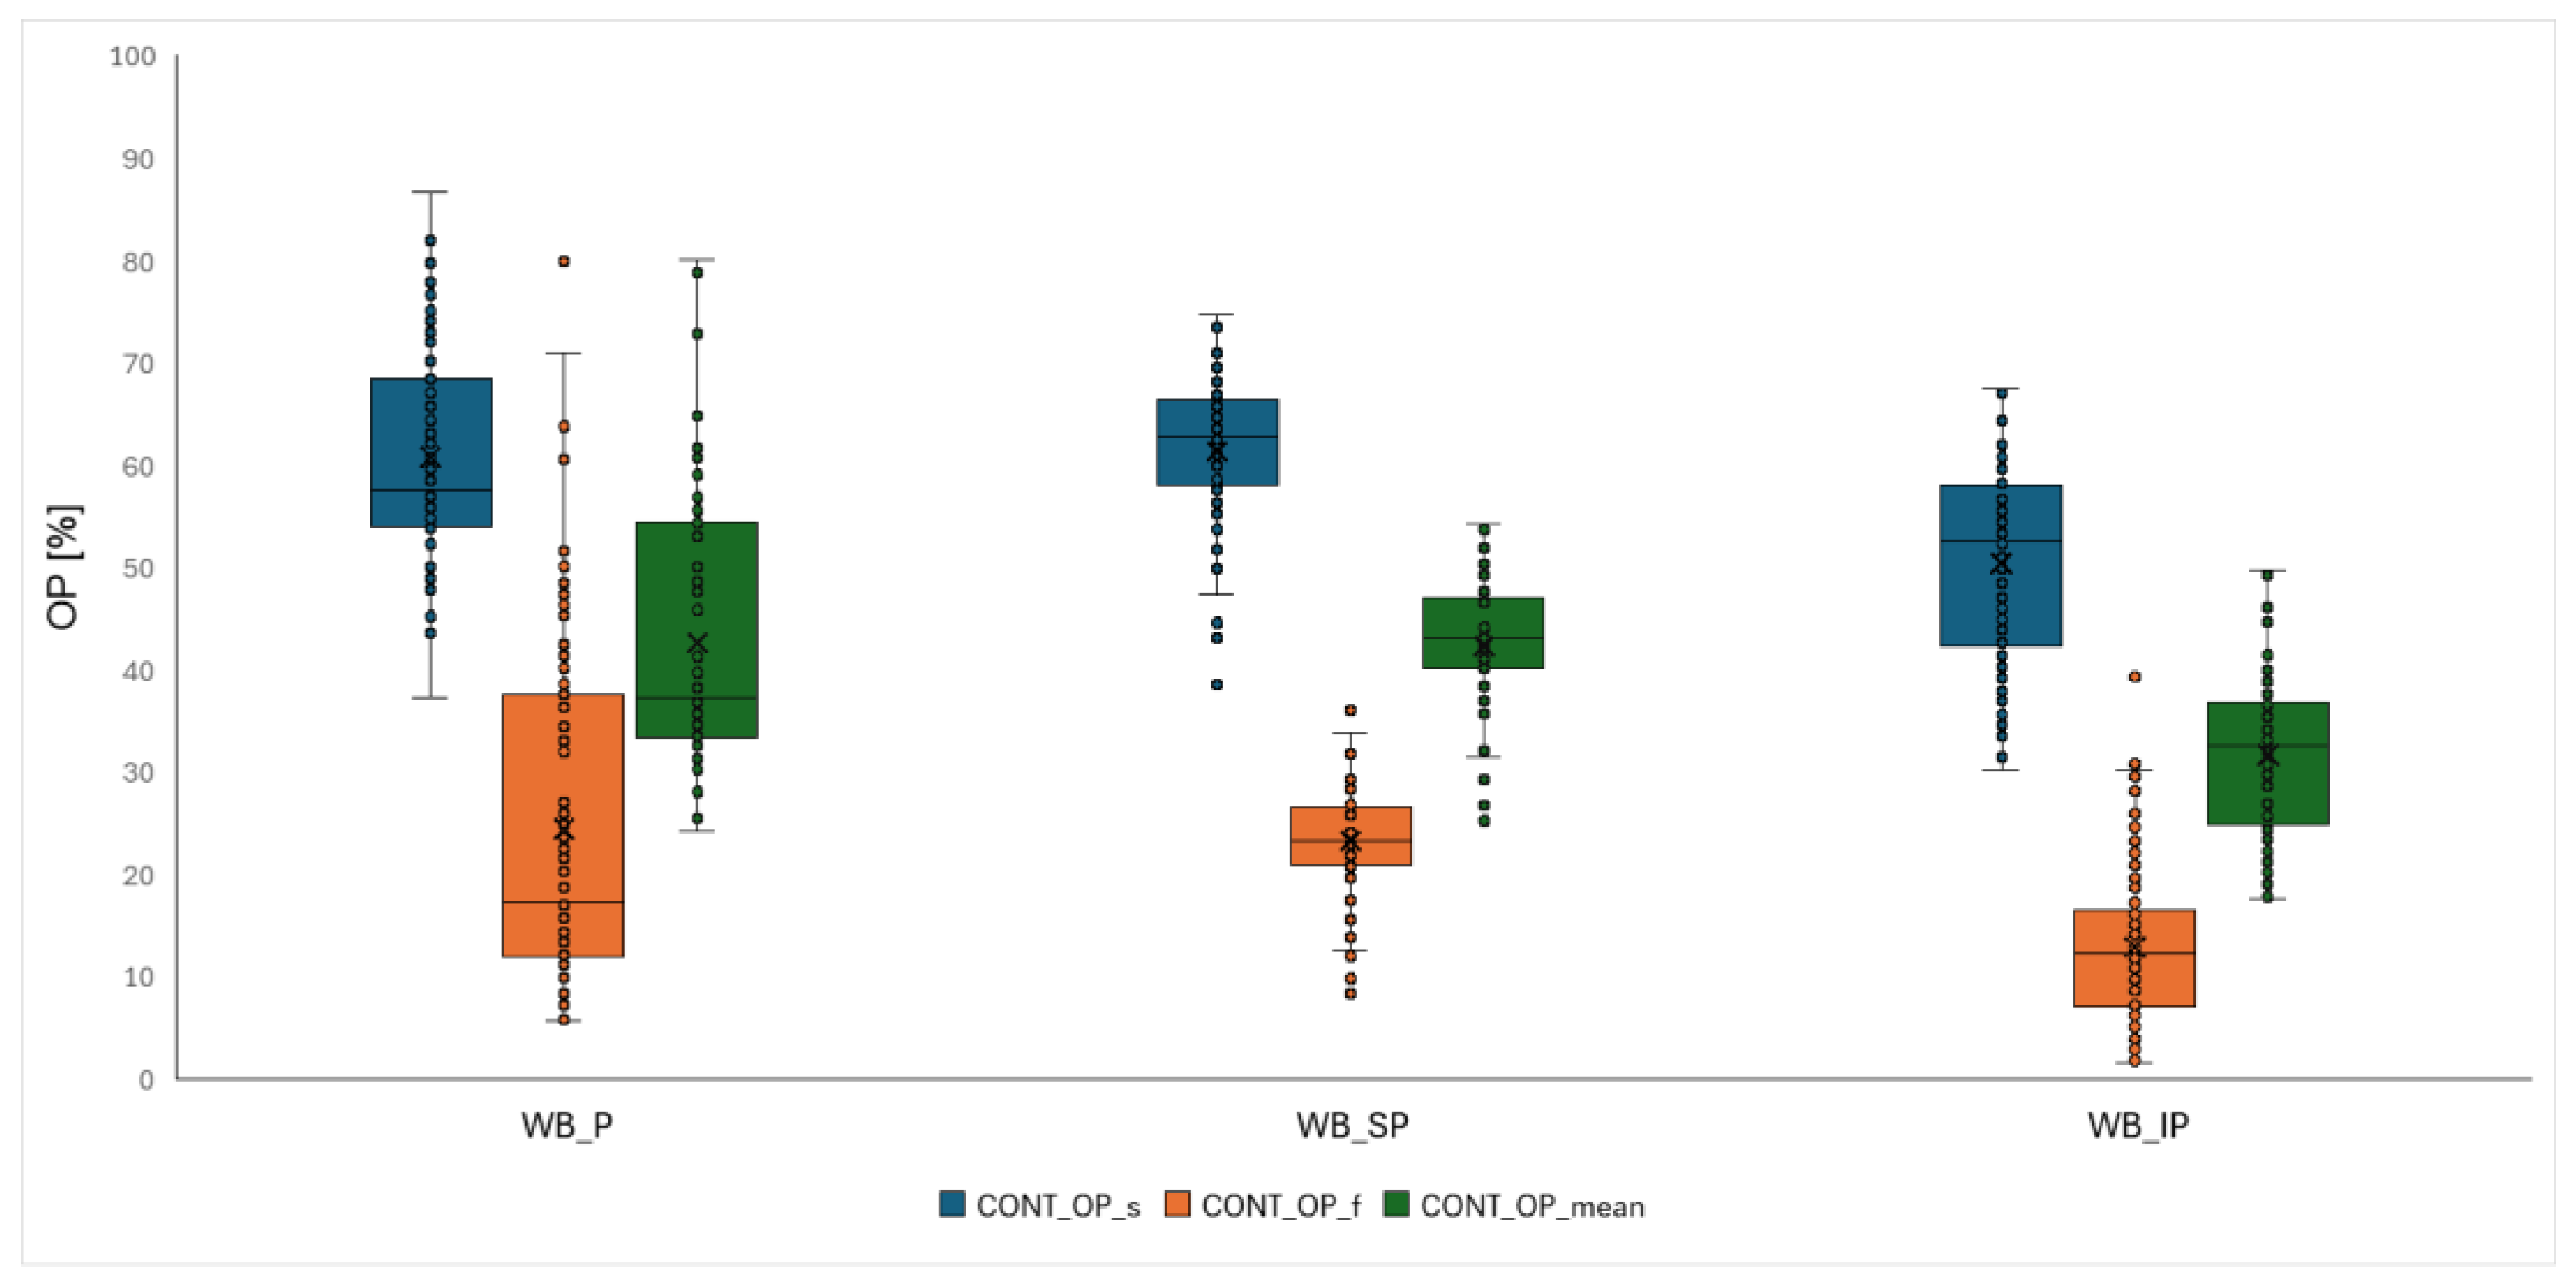

Table 1.
Detail specification of individual windbreaks.
| WB | Wood species | Shrub species | Age cat.1 | Age avg |
|---|---|---|---|---|
| A 1 | Populus × canadensis Moench, Fraxinus excelsior L., Quercus robur L. | Caragana arborescens Lam. | 5 | 60 |
| A 2 | Populus × canadensis Moench, Juglans nigra L. | Caragana arborescens Lam. | 5 | 60 |
| A 3 | Quercus robur L., Tilia cordata Mill., Juglans nigra L. | Euonymus europaeus L., Chamaecytisus spp. | 4 | 60 |
| A 4 | Juglans nigra L., Populus × canadensis Moench, Ulmus minor Mill. | Chamaecytisus spp. | 4 | 60 |
| B 1 | Juglans nigra L., Populus × canadensis Moench | Sambucus nigra L. | 4 | 50 |
| C 1 | Acer platanoides L., Fraxinus excelsior L. | Caragana arborescens Lam. | 4 | 50 |
| C 2 | Acer platanoides L., Fraxinus excelsior L., Acer negundo L. | Caragana arborescens Lam. | 4 | 55 |
| C 3 | Fraxinus excelsior L., Acer negundo L., Ulmus minor Mill. | Caragana arborescens Lam. | 4 | 50 |
| C 4 | Acer platanoides L., Fraxinus excelsior L., Acer negundo L. | 4 | 55 | |
| C 5 | Acer platanoides L., Acer negundo L., Fraxinus excelsior L. | Caragana arborescens Lam. | 4 | 50 |
| C 6 | Acer platanoides L., Tilia cordata Mill. | 4 | 45 | |
| C 7 | Populus × canadensis Moench, Juglans nigra L., Acer negundo L. | Caragana arborescens Lam. | 4 | 45 |
| D 1 | Juglans nigra L., Quercus robur L. | Rosa canina L., Euonymus europaeus L. | 4 | 55 |
| D 2 | Fraxinus excelsior L., Acer platanoides L., Quercus robur L. | Rosa canina L., Euonymus europaeus L. | 4 | 55 |
| D 3 | Quercus robur L., Juglans nigra L., Acer platanoides L. | Euonymus europaeus L., Ligustrum vulgare L. | 4 | 55 |
| D 4 | Quercus robur L., Ulmus minor Mill., Acer negundo L. | Ligustrum vulgare L., Euonymus europaeus L. | 5 | 55 |
1 Age cat. (categories) estimate the physiological age of the predominant part of the skeletal trees in the windbreak and are defined as: 1) Young trees in the acclimatization phase (seedlings up to 1 m tall or newly planted trees in the establishment phase); 2) acclimatized young trees - Young established trees in the crown architecture formation phase pending completion of the nurse pruning; 3) Adolescent trees - Mature individuals with a continued preference for height growth. 4) Mature trees (adult trees with a completed height growth phase); 5) Senescent trees (trees showing signs of senescence, circumferential crown dieback with replacement of the assimilative apparatus by development of secondary growths lower in the crown, obvious signs of colonization by other organisms, proportion of dead and dying wood in the crown, and frequent occurrence of elements with increased biological potential).
Disclaimer/Publisher’s Note: The statements, opinions and data contained in all publications are solely those of the individual author(s) and contributor(s) and not of MDPI and/or the editor(s). MDPI and/or the editor(s) disclaim responsibility for any injury to people or property resulting from any ideas, methods, instructions or products referred to in the content. |
© 2025 by the authors. Licensee MDPI, Basel, Switzerland. This article is an open access article distributed under the terms and conditions of the Creative Commons Attribution (CC BY) license (http://creativecommons.org/licenses/by/4.0/).
Copyright: This open access article is published under a Creative Commons CC BY 4.0 license, which permit the free download, distribution, and reuse, provided that the author and preprint are cited in any reuse.


