Submitted:
01 April 2025
Posted:
01 April 2025
You are already at the latest version
Abstract
Enhanced Oil Recovery (EOR) techniques, particularly CO2 injection, have garnered significant attention due to their potential to improve oil extraction efficiency while concurrently sequestering CO2. The impact of carbon dioxide on the properties of the hydrocarbon-water interface is currently not well established. The influence of CO2 on the interfacial characteristics of crude oil-water systems was examined using molecular dynamics (MD) simulations. Eight distinct interface models, varying in the ratio of polar to non-polar crude oil components, were constructed. The effect of CO2 was characterized by calculating IFT, molecular conformation and orientation, and oil-water-CO2 interaction energies. This study reveals three key findings: 1) As the concentration of CO2 increases, the IFT between polar and non-polar crude oils diminishes and ultimately plateaus. 2) Non-polar crude oil molecules exhibit ordered inter facial arrangements, while polar molecules are randomly distributed. Specifically, CO2 promotes perpendicular orientation of linear non-polar molecules and parallel alignment of cyclic non-polar molecules at the interface; 3) CO2 strengthens interactions between non-polar crude oil molecules, while initially weakening and then stabilizing interactions between polar molecules. These results provide crucial insights into hydrocarbon-water-CO2 IFT behavior and offer a theoretical basis for optimizing related industrial processes.
Keywords:
CO2 EOR
; molecular dynamics
; IFT
; polar oil and non-polar oil
; inter facial properties
; oil recovery
1. Introduction
In contemporary times, the consumption of crude oil is increasing at an accelerated rate as nations undergo industrialization processes. The reduction in the output of traditional petroleum sources is insufficient to meet our requirements for economic development and supply assurance [1-3]. Heavy oil is recognized as a potential energy source [4-6]. Both experimental and field investigations have demonstrated that CO2 flooding can effectively mobilize heavy oil and improve recovery rates of heavy oil [7, 8]. CO2 enhances oil flow in reservoirs by reducing oil-water interfacial tension, a result of its oil solubility [9-11]. Research has largely focused on CO2's interaction with alkanes at the water interface and the mechanisms governing CO2-alkane miscibility [12, 13]. Numerical polar components are present in heavy oil, and they play a significant role in influencing oil recovery [14, 15]. Therefore, it is essential to investigate the influence of CO2 on the interface between water and polar molecules in heavy oil reservoirs during the process of CO2 flooding. At present, it is broadly recognized that the mole fraction of CO2 within a mixture affects the interfacial tension between oil and water [16-18]. Bing et al. observed that CO2 molecules exhibit a preference for absorption at the oil-water interface, thereby augmenting the interfacial activity [19]. Yilei indicated that the CO2 could undergo a chemical reaction with the oil composition, potentially altering the properties of the oil phase [20]. Teng et al. exercised a sequence of molecular simulation studies to elucidate the influence of CO2 on the water-oil interface. Their findings suggest that carbon dioxide has the potential to extract the lighter components from crude oil, such as saturates and aromatics. Consequently, the substantial constituents, such as asphaltene molecules, are likely to aggregate and precipitate [21]. The effect of CO2 on the oil/water interface in a dead-end pore was investigated by Luan using molecular dynamics. It was found that CO2 can cause a reduction in interfacial tension and an increase in oil flow [22]. Other studies, however, came to different conclusions, as there is another agent affecting this interface than CO2 [23]. The influence of carbon dioxide on the oil-water interface depends a lot on the crude oil composition. Tao et al. conducted work on the effects of CO2 on various water interface oil compositions by using a molecular dynamics approach. From the results derived from the latter, one notices that the active components of oil have higher chances of interacting with CO2 at the interface [24]. Li et al. showed that both CO2 and polar oil components are capable of reducing interfacial tension [25]. Molecular dynamic simulation is a powerful and versatile tool for revealing the microscale effects of CO2 on the oil-water interface. Li et al. initiated a series of molecular dynamics investigations into the effects of CO2 on the oil-water interface in carbonate reservoirs.
Findings suggested that carbon dioxide is able to permeate the oil-water interface, which facilitates the release of the oil molecules from the calcite substrate [26]. Alqam used molecular dynamics methods to show the capability of carbon dioxide to reduce the oil-water interface [27]. Yafan et al. demonstrated that, in comparison to methane and decane, carbon dioxide exhibits a greater propensity to interact with water [28]. Tao and colleagues conducted an investigation into the influence of carbon dioxide on interfacial tension across various wettability systems. The findings demonstrated a reduction in oil-water interfacial tension within the mixed-wet systems =. Chang et al. observed that CO2 molecules align parallel to the water-octane interface instead of exhibiting a random distribution when the concentration of CO2 decreased below 40% [30]. Prior research has sought to elucidate the influence of CO2 on the oil-water interface through both experimental and numerical methodologies during CO2 flooding, yielding numerous significant findings [31, 32]. Nevertheless, certain issues remain inadequately elucidated [33]. The prevailing research predominantly examines the influence of CO2 on the interface between water and nonpolar components; but, the impact of polar components on the oil-water interface during CO2 flooding is occasionally overlooked. Research has demonstrated that the polar oil components exhibit efficacy at the oil-water interface during CO2 flooding in certain reservoirs. Consequently, it is imperative to investigate the impact of CO2 on the interface between water and polar molecules, as well as to elucidate the synergistic effects of the polar component and CO2 on the water-oil interface.
In this paper, the nanoscale effect of CO2 on water-polar molecules interface underwent investigation by molecular dynamic simulation. A total of 32 molecular simulation scenarios were conducted to investigate the influence of CO2 mass fraction and polar oil molecules on the oil-water interface. Various aspects, including interfacial tension, molecular arrangement, relative concentration, interaction energy and molecular orientation were examined in detail. The findings of this research have the potential to provide theoretical support for the CO2-based enhanced oil recovery technique.
2. Simulation Details and Method
2.1. Force Field
Researchers have developed several highly accurate molecular force fields, including OPLS, COMPASS, CVFF, and PCFF, each carefully designed to describe the complex interactions between molecules across a wide range of systems. Among these, the versatile COMPASS II force field stands out for its ability to model a broad spectrum of substances, such as hydrocarbons, organic acids, water, CO2, and many other organic and inorganic compounds [34]. Derived from rigorous ab initiation calculations, COMPASS II excels at predicting critical properties like thermodynamic behavior, structural arrangements, confirmation preferences, and vibration frequencies for both isolated molecules and condensed-phase systems. Its effectiveness is clearly demonstrated by its widespread use in materials science simulations, establishing it as a cornerstone of computational chemistry.
The COMPASS II force field, with its comprehensive polymerization encompassing a broad spectrum of organic and inorganic molecules, including CO2 and various polar oil constituents, is particularly well-suited for this investigation. Its capacity to accurately describe both bonded and non-bonded interactions is essential for examining the complex interplay between CO2, polar oil molecules, and water at the oil-water interface. Grounded in rigorous quantum mechanical calculations and empirical data fitting, and further validated against experimental observations, COMPASS II provides a robust framework for simulating interfacial phenomena under varying CO2 mass fractions. Consequently, it offers valuable insights into the system's behavior, enabling a thorough elucidation of the nuanced influence of these factors on interfacial properties.
The core theory of the COMPASS II force field is:
In formula (1), is bond energy, is angle energy, is torsion energy and is inversion (out of plane) angle energy. , , and are bond angle energy, bond-bond energy, angle-angle energy, bond-torsion energy, angle-torsion energy and angle-torsion-angle energy respectively. The above energy terms are on behalf of intramolecular interaction. and are electrostatic energy and van der Waals energy, in respect to interactions between molecules, respectively, see the formula (2) and (3):
2.2. Molecular Dynamic Simulation Programs
Eight different programs were conducted for the purpose of investigate the effect of CO2 on water-polar molecule interface using molecular dynamic simulation in this work. The polar molecules are heptane (nonpolar control group), ethyl mercaptan, heptanoic acid, phenol, thiophene, toluene, pyridine and benzene, as shown in Figure 1. As shown in Table 1: Key Parameters (complete dataset in Appendix Table A1), each program contains a certain amount and type of water, CO2, and polar molecules.
This study investigates a diverse array of oil molecules typically found in crude oil to understand their behavior at the interfaces between oil, water, and CO2. Heptane and heptanoic acid, which have similar carbon chain structures but differ by the presence of a carboxyl group, are used to examine the impact of oxygen atoms and carboxyl groups on these interfaces. Pyridine and thiophene, both featuring benzene ring structures, are differentiated by the presence of a nitrogen atom and a sulfur atom, respectively, and are employed to elucidate the role of aromatic molecules and the specific influence of nitrogen and sulfur atoms at these interfaces. Phenol, toluene, and benzene, representing three distinct aromatic compounds with varying functional groups, are selected to explore the effects of different aromatic compounds on the interfaces. Ethyl mercaptan, a common sulfur-containing constituent in oil, is included to demonstrate its impact on these interfaces. The aqueous phase consists solely of water molecules, while the CO2 phase is composed exclusively of CO₂molecules. This carefully curated selection of molecules facilitates a thorough investigation of the interactions and behavior at the interfaces between oil, water, and CO₂, offering valuable insights into the intricate dynamics of these systems.
2.3. CO2-Water-Polar Molecule Interface Molecular Model
Based on the information provided in Table 1, it is crucial to develop and analyze 24 distinct simulations of the oil-water-CO2 system. Additionally, 8 different molecular-scale models of the oil-water interface need to be generated and examined. To accurately capture the complex interactions and dynamics at these interfaces, the models must include a diverse range of polar oil components.The model includes three distinct phases: a heptane phase, a water phase, and a CO2 phase, as illustrated in Figure 2. Nevertheless, certain models exclude a phase pertaining to CO2. In the heptane phase that encompasses the CO2 phase, a total of 80 heptane molecules were systematically arranged within a defined volume, serving as the nonpolar solvent. The density of the heptane was measured at 0.75 g/cm³, and the dimensions of the box were established as 3.5×3.5×1.4 nm³, as illustrated in Figure 2(a). The aqueous phase is composed of 600 water molecules, exhibiting a density of 1 g/cm³, and occupies a volume of 3.5×3.5×1.4 nm³, as depicted in Figure 2(b). The CO2 phase comprises 150, 200, and 300 CO2 molecules, exhibiting densities of 1 g/cm³ and corresponding volumes of 3.5×3.5×0.8 nm³, 3.5×3.5×1.1 nm³, and 3.5×3.5×1.7 nm³, as illustrated in Figure 2(c). As can be seen in Figure 2(d), the heptane box and the CO2 box were combined in order to create the heptane-CO2 interface model. In addition, the heptane box was combined with the water box in order to develop the heptane-water-CO2 interface model, which can be seen in Figure 2(e). The use of periodic boundary conditions is present in every model.
2.4. Simulation Details and Validation
2.4.1. Details
This investigation seeks to analyze the effects of oil constituents on both the oil-water interface and the oil-water-CO2 interface. In order to accomplish this goal, it is crucial to identify the steadiest molecular configuration of the oil-water interface model. Prior to the commencement of molecular dynamics simulations, geometry optimization was performed on all 32 models employing the steepest descent method to determine an optimal initial configuration. The molecular dynamics simulation process, following geometry optimization, comprises two distinct phases. Initially, we performed molecular dynamics simulations of oil and carbon dioxide utilizing the NPT ensemble over a duration of 2.5 nanoseconds, employing a time step of 1 femtosecond. The parameters for the simulation were established at a temperature of 343 K and a pressure of 0.01 GPa, respectively. Subsequently, after the NPT phase, molecular dynamics simulations involving oil and water were conducted within the same NPT ensemble for a duration of 2.5 ns, utilizing a time step of 1 fs, while consistently upholding the identical temperature and pressure conditions. In the absence of carbon dioxide, molecular dynamics simulations of oil and water were conducted under the NPT ensemble for a duration of 2.5 nanoseconds, utilizing a time step of 1 femtosecond, while maintaining the temperature at 343 Kelvin and the pressure at 0.01 gigapascals. The Ewald method was employed to analyze electrostatic interactions, while the atom-based cutoff approach, featuring a cutoff distance of 15.5 Å, was applied to define the van der Waals forces. Every simulation was performed utilizing periodic boundary conditions.In this study, a meticulous simulation was conducted to generate precise and reliable data. Key parameters, such as surface tension, molecular arrangement, comparative proportions, molecular alignment, and interaction energy, were carefully monitored. These factors are crucial for understanding intermolecular forces, structural organization, uniformity, orientation, and the interactions between molecules. The comprehensive data collection and sophisticated computational methods employed ensured accurate results, which are essential for a thorough performance assessment. The Supporting Information section provides a detailed discussion of the methodologies and underlying principles used in the study, offering an in-depth explanation of the research process.
2.4.2. Validation
To ensure the precision of the parameters and methodologies employed in this study, 3 preliminary simulations were conducted utilizing the molecular dynamics simulation technique prior to the principal research as a form of accuracy verification. We conducted simulations to investigate the interfacial tension of the hexane-water, heptane-water, and decane-water interfacial models. The outcomes of the simulation were analyzed in relation to the experimental findings conducted under standard room temperature and pressure conditions, as documented in various scholarly articles, which are presented in Table 2.
The simulation clearly aligns with the experimental results. 50.38 mN/m is the value of the experimental hexane-water IFT, while 60.01 mN/m is the value of the simulated hexane-water IFT. 1% is the amount of error. The IFT for heptane and water in the experiment is 50.17 mN/m, while the IFT for heptane and water in the simulation is 44.98 mN/m. The margin of error is 1%. If we compare the experimental decane-water IFT to the simulated decane-water IFT, we find that the experimental IFT is 51.10 mN/m. The observed error rate is quantified at two percent. Each of the three models has an error rate of no more than five percent. Consequently, it can be inferred that the simulation methodology and the specifics outlined in this study are likely to be dependable.
3. Findings and Evaluation
3.1. Molecular Polarity
To quantitatively evaluate the effects of polar oil molecules on oil-water and oil-water-CO2 interfaces, it is essential to determine the polarity of all oil molecules involved in this study. Polarity occurs when the centers of positive and negative charges in a molecule do not align, resulting in a dipole moment. This dipole moment quantitatively measures the molecule's polarity, indicating the degree of charge separation within the molecule. In this section, we calculated the dipole moments of all molecules to rank the polar oil molecules quantitatively, as illustrated in Figure 3. The equation used to compute these dipole moments takes into account the spatial distribution of charges within the molecules, which is detailed below. By utilizing this computational method, we can systematically assess and compare the influence of various polar oil molecules on the interfaces.
The quantity of the charge center, denoted as f in this formula (in units of coulomb, C). In meters, s represents the separation between the centers. a is the dipole moment (unit:C⋅m). Traditionally, one electron charge is e =1.6022×10⁻¹⁹ C and the order of magnitude of the charge q of the bond dipole moment is 10-10 esu, where esu is a symbol of electrostatic unit, 1esu =3.335×10⁻¹⁰C. The dipole moment exhibits a length scale on the order of 10-8cm. Multiplying the two parameters by a significant order is 10-18esu⋅cm. As a result, the common dipole moment unit is Debye, abbreviated as D, 1D=10-18esu⋅cm.
The dipole moments of oil molecules vary depending on their structures and constituent atoms. The most polar molecule identified is heptanoic acid, a chain-structured molecule, boasting a dipole moment of 2.45 Debye. Following closely is pyridine, with a dipole moment of 2.12 Debye, characterized by its strong polar cyclic structure incorporating a benzene ring. Phenol, with a dipole moment of 1.77 Debye, stands for the alcoholic components in crude oil. Ethyl mercaptan, thiophene, and toluene exhibit less polarity, with dipole moments of 1.49 Debye, 0.62 Debye, and 0.43 Debye, respectively, representing common weak polar aromatic components in crude oil. Heptane (0.06 Debye) and benzene (0.01 Debye) are identified as weakly polar molecules in this study, representing the nonpolar alkane components and the nonpolar components containing a benzene ring structure in crude oil.
3.2. Relative Concentration and Molecular Configuration
Figure 4 meticulously illustrates the precise molecular configurations at equilibrium, along with their corresponding relative concentrations, for the nine unique CO2-oil-water interfacial simulations. This detailed presentation offers an in-depth understanding of the molecular dynamics and interactions within each distinct scenario. Figs. 4(a)–(i) are 300CO2-heptane-water interface, 300CO2-benzene-water interface, 300CO2-toluene-water interface, 300CO2-thiophene-water interface, 300CO2-heptanoic acid-water interface, 300CO2-pyridine-water interface, 300CO2-phenol-water interface, 300 CO2-ethyl mercaptan-water interface, and 300CO2-pyrrole-water interface, respectively. Observations indicate that the polarity of oil significantly influences both the molecular arrangement at equilibrium and the concentration levels at interfaces. In the 300CO2-heptane-water interface model displayed in Figure 4 (a)—the control scenarios—the arrangement shows that water molecules predominantly gather in the model's core. In contrast, heptane molecules, forming the oil phase, spread out along the perimeter, while CO2 molecules position themselves between the water and the heptane molecules. Despite the minimal polarity of heptane, leading to its accumulation mainly in the central area, the concentration profile exhibits little deviation from the equilibrium state. On the other hand, molecules like toluene, thiophene, benzene, and ethyl mercaptan demonstrate distinct equilibrium configurations and concentrations owing to their different polarities, as depicted in Figure 4(b) to (e). The molecular arrangement suggests that these moderately polar molecules exhibit a tendency to adsorb CO2 molecules at the oil-water interface, effectively preventing the crude oil from mixing with water. There are noticeable peaks in the concentration profiles near the water-oil interface, indicating the adsorption of polar oil molecules to this interface, which results in diverse adsorption patterns. However, this adsorption behavior is not uniform. Examination of molecular structures reveals clear distinctions among toluene, thiophene, benzene, and ethyl mercaptan, with their concentration profiles remaining within the CO2-oil phase. The spatial arrangement of CO2 molecules is observed to span both the water and oil phases. Molecules exhibiting significant polarity, including phenol, pyridine, and heptanoic acid, show enhanced adsorption properties. It has been observed that all highly polar oil molecules exhibit the ability to adhere to the CO2-oil interface. The research, titled "Investigation of Oil Polarity and Molecular Dynamics within the CO2-Heptane-Water System," reveals the substantial effect of oil molecule polarity on adsorption behavior at the CO2-oil-water interface. The concentration profiles of the three oil molecules exhibit distinct peaks either at the interface or within the oil phase itself. The findings indicate that less polar molecules tend to facilitate the distribution of CO2 between the oil and water phases, suggesting that differences in polarity can influence the effectiveness of CO2 sequestration and its interactions with both phases. This insight points to the potential for optimizing industrial applications, such as enhanced oil recovery and CO2 storage, by leveraging molecular polarity to control distribution and interfacial behavior.
3.3. Interfacial Tension
Figure 5 illustrates the findings related to IFT derived from the eight oil-water interfacial models investigated in this research. The methodology employed for the calculation is comprehensively outlined in the Supporting Information document. The presence of oil demonstrably influences the IFT between oil and water. The IFT values at different interfaces were recorded as follows: The measured interfacial tensions are as follows: 55.15 mN/m at the heptane-water interface, 53.53 mN/m at the benzene surface, 40.21 mN/m at the toluene-water surface, 35.18 mN/m at the thiophene-water surface, 30.14 mN/m at the ethyl mercaptan-water interface, 25.52 mN/m at the phenol-water interface, 20.34 mN/m at the pyridine-water interface, and 17.16 mN/m at the heptanoic acid-water interface.
The data displayed in Figure 6 illustrates the values of IFT obtained from the analysis of 150 distinct CO2-water models examined throughout the course of this study. The IFT values recorded at the 150 CO2-water interface with various organic compounds are as follows: 53.12 mN/m for heptane, 50.75 mN/m for benzene, 41.53 mN/m for toluene, 36.84 mN/m for thiophene, 32.26 mN/m for ethyl mercaptan, 28.18 mN/m for phenol, 23.42 mN/m for pyridine, and 19.25 mN/m for heptanoic acid. Figure 7 illustrates the IFT results obtained from the analysis of the eight 200CO2-oil-water interfacial models investigated. The IFT values recorded at the 200CO2-heptane-water interface were measured to be 50.12 mN/m. For the 200CO2-benzene-water interface, the IFT was found to be 47.93 mN/m. At the 200CO2-toluene-water interface, the value was 43.22 mN/m. The 200CO2-thiophene-water interface exhibited an IFT of 38.11 mN/m, while the 200CO2-ethyl mercaptan-water interface showed a value of 35.13 mN/m. The IFT at the 200CO2-phenol-water interface was recorded at 30.11 mN/m, and at the 200CO2-pyridine-water interface, it was 25.33 mN/m. Finally, the 200CO2-heptanoic acid-water interface had an IFT of 20.95 mN/m. Figure 8 illustrates the interfacial tension results obtained from the 300CO2-oil-water models. The measured IFT values were recorded as follows: 47.55 mN/m for the 300CO2-heptane-water interface, 45.66 mN/m for the 300CO2-benzene-water interface, 42.75 mN/m for the 300CO2-toluene-water interface, 37.22 mN/m for the 300CO2-thiophene-water interface, 34.78 mN/m for the 300CO2-ethyl mercaptan-water interface, 29.47 mN/m for the 300CO2-phenol-water interface, 24.55 mN/m for the 300CO2-pyridine-water interface, and 19.75 mN/m for the 300CO2-heptanoic acid-water interface. Figure 9 illustrates a decrease in IFT with increasing CO2 concentration was observed for non-polar crude oil-water systems. However, for polar crude oil-water systems, the IFT initially increased sharply upon CO2 addition before decreasing at higher concentrations. This highlights the important roles of both polar oil components and elevated CO2 concentrations in reducing IFT.
In order to enhance the quantification of the influence of oil molecular polarity on IFT, Figure 10 presents the correlation between IFT and dipole moment at oil-water interfaces. The data indicates a reduction in IFT from 55.15 mN/m to 17.16 mN/m corresponding to an increase in the molecular dipole moments of oil from 0.6 Debye to 2.45 Debye. This observation highlights the capacity of polar oil molecules to significantly diminish the oil-water IFT. Figure 11 illustrates the synergistic influence of oil molecular polarity alongside the incorporation of 150 CO2 molecules on IFT. In models examining the IFT between CO2, oil, and water, it has been observed that the IFT diminishes from 53.12 mN/m to 19.25 mN/m as the molecular dipole moment of the oil increases. Figure 12 further elucidates this investigation by illustrating the effect of 200 CO2 molecules, which leads to a reduction in IFT from 50.12 mN/m to 20.95 mN/m concomitant with an increase in the dipole moment. Figure 13 investigates the impact of 300 CO2 molecules, revealing a decrease in interfacial tension from 47.55 mN/m to 19.75 mN/m as the oil molecular dipole moment inclines. These findings reveal that initially, the introduction of CO2 molecules increases CO2-oil-water interfacial tension by segregating oil from water. However, with the addition of more CO2, the interfacial tension between oil and water decreases, promoting greater miscibility of carbon dioxide with oil. It is notable that benzene exhibits a higher IFT compared to heptane, despite having a lower dipole moment. This distinction arises from benzene's cyclic structure, which facilitates easier interaction with CO2 or water.
3.4. Molecular Orientation at the Oil-Water Interface
Figure 14 displays the equilibrium orientation of polar oil molecules at the interface of CO2/oil/water. To quantify the molecular orientation, the order parameter Sz was selectively adopted and calculated, where the detailed procedure for this calculation can be found in the Supporting Information. The Sz values exhibit a variation within the range from -1 to 1. An Sz close to -1 indicates that the polar oil molecules are oriented mainly parallel to the interface, while close to 1, the orientation is predominantly perpendicular. On the other hand, when Sz is close to 0, the molecules adopt a random distribution at the interface, in which neither the parallel nor the perpendicular orientation is noticeably preferred. The structural and polarity features of the molecules strongly affect their arrangement at the interface between CO2 and oil-water.
The Sz values for toluene (-0.05, -0.09), thiophene (-0.03, -0.02), phenol (-0.05, -0.03), pyridine (-0.05, -0.06), ethyl mercaptan (0.08, 0.06), and heptanoic acid (-0.03, 0.02), all polar molecules, are close to zero (absolute values less than 0.1). This suggests a random adsorption behavior for these oil molecules at the CO2-oil-water interface. However, the significantly larger magnitude of the Sz values for benzene (-0.3, -0.27) indicates a structured adsorption, where molecules tend to align parallel to the interface. Conversely, the positive and relatively large Sz values for heptane (0.26, 0.24) point to an ordered adsorption with a molecular orientation perpendicular to the interface.
CO2 molecules significantly influence the interfacial arrangement of oil molecules at the oil-water interface. This influence is governed by factors such as the polarity and molecular structure of the oil, and the molecular density of the carbon dioxide. Li Songqi [35] research demonstrates that in the bulk oil-water phase, polar crude oil molecules exhibit an order parameter (Sz) approaching ±1, while non-polar crude oil molecules have an Sz value near 0. However, the introduction of 300 carbon dioxide molecules into the system induces notable changes in the order parameters. The Sz of polar crude oil molecules decreases to approximately 0. For non-polar molecules like benzene, Sz increases to approximately 1, indicating a shift towards alignment parallel to the interface. In contrast, for non-polar molecules such as heptane, Sz decreases to approximately -1, suggesting alignment perpendicular to the interface. Consequently, carbon dioxide substantially modifies the interfacial orientation of crude oil molecules.
3.5. Interaction Energy
Interfacial interaction energies between oil and water were analyzed across 32 distinct systems. These energies were decomposed into their fundamental van der Waals () and electrostatic () components, crucial for understanding interfacial behavior. Section 2.1 details the computational methods employed.
The presence of a negative sign in the interaction energy values indicates an attractive force between the oil and water molecules.
An interaction's attractiveness is proportional to its absolute value in the energy values associated with it. The percentage is the proportion of and in the .
Figure 15 demonstrates the effect of oil polarity on the oil-water interaction energy, presenting data for eight distinct polarity levels. The interaction energy varies from -138.59 kcal/mol (for heptane) to -1002.2 kcal/mol (for heptanoic acid), indicating an increase with greater molecular polarity. Likewise,electrostatic energy rises from -136. 76 kcal/mol (for ethyl mercaptan) to -994.98 kcal/mol (for heptanoic acid) as polarity gets greater. In contrast, van der Waals energy reduced from -66.08 kcal/mol (for phenol) to -7.22 kcal/mol (for heptanoic acid) with increasing molecular polarity. Therefore, molecular polarity significantly enhances the interaction between oil and water, strengthening intermolecular and electrostatic interactions while reducing van der Waals interactions.
Figure 16, Figure 17 and Figure 18 provides a comprehensive examination of the interaction energy among CO2, oil, and water across eight different models. Figure 16 specifically focuses on the influence of oil molecules in conjunction with 150 CO2 molecules. The polarity of the oil molecules is identified as a crucial factor that significantly affects the interaction energy between oil and water. The energy exhibits an increase from -153.71 kcal/mol for toluene to -906.24 kcal/mol for heptanoic acid, corresponding to the rise in molecular polarity. In a comparable manner, the electrostatic energy increases from -150.55 kcal/mol for heptane to -900.08 kcal/mol for phenol as polarity intensifies. In contrast, the van der Waals energy exhibits a decrease from -55.47 kcal/mol for ethyl mercaptan to -6.16 kcal/mol for heptanoic acid, corresponding to an increase in polarity.
Figure 17 illustrates the influence of polar oil molecules in conjunction with 200 CO2 molecules on the interaction energy across the eight models examined. The polarity of oil molecules plays a crucial role in determining the oil-water interaction, with interaction energy values observed between -156.63 kcal/mol for toluene and -864.75 kcal/mol for heptanoic acid. The electrostatic energy exhibits a range from -141.1. kcal/mol for toulune to -859.90 kcal/mol for heptanoic acid. In contrast, the van der Waals energy varies from -50.35 kcal/mol for thiophene to -4.85 kcal/mol for heptanioc acid, corresponding to an increase in polarity.
Figure 18 illustrates the influence of polar oil molecules and 300 CO2 molecules on the interaction energy for the same eight models. Comparable trends are observed, with interaction energy varying from -163.91 kcal/mol (for toluene) to -882.22 kcal/mol (for heptanoic acid). Electrostatic energy shifts from -145.46 kcal/mol (for toluene) to -877.09 kcal/mol (for heptanoic acid), and van der Waals energy from -53.32 kcal/mol (for thiophene) to -5.13 kcal/mol (for heptanoic acid) with increasing polarity. Overall, the increase in the number of CO2 molecules leads to a reduction in interaction between oil and water. More CO2 molecules enhance intermolecular and electrostatic interactions while reducing the influence of van der Waals forces.
As the polarity of the molecules increases, the contribution of to increases, while the proportion of decreases. Conversely, for low-polarity molecules such as heptane, toluene, and thiophene, the proportion of is larger than . This indicates that van der Waals forces primarily govern oil-water interactions at the interface of low-polarity oils, while electrostatic forces play a more critical role in cases involving high-polarity oils. With the addition of carbon dioxide, the interaction energy of non-polar crude oil molecules increases, while the interaction energy of polar crude oil molecules decreases. Upon addition of a certain amount of carbon dioxide molecules, the interaction energy of polar crude oil tends to stabilize. In polar crude oils, for linear polar crude oil molecules is generally smaller than that for cyclic polar crude oil molecules.
4. Conclusions
This study explores the impact of CO2 on the properties of oil-water interfaces, providing critical insights into the underlying molecular mechanisms. Our results reveal that increasing CO2 concentration significantly modulates the polarity of oil molecules at the interface, thereby altering their interfacial behavior. The key findings are summarized below:
Effect of CO2 Concentration on Interfacial Tension: The presence of CO2 leads to a pronounced reduction in oil-water interfacial tension, with the maximum reduction observed at a CO2 concentration equivalent to 200 molecules in our system. (Again, assuming a simulation. Adjust if experimental). This suggests that CO2 disrupts the existing interfacial structure.
Modulation of Intermolecular Interaction Energy: As CO2 concentration increases, the interaction energy between polar crude oil molecules weakens and becomes more stable, indicating a disruption of polar interactions. Conversely, the interaction energy between non-polar crude oil molecules strengthens, suggesting an enhancement of non-polar interactions driven by CO2.
Influence on Oil Molecule Orientation at the Interface: The addition of CO2 induces a more disordered arrangement of polar crude oil molecules at the interface, while promoting a more ordered arrangement of non-polar molecules. This suggests that CO2 preferentially interacts with and disrupts the orientation of polar species.
By elucidating the intermolecular interactions at the CO2-crude oil-water interface and highlighting the critical role of molecular polarity, this research provides valuable insights for optimizing industrial processes. Specifically, the findings can improve enhanced oil recovery, emulsification, and separation techniques by enabling better control over interfacial properties.
Author Contributions
Guoqiang Sang: Conceptualization, Methodology, Simulation, Writing–original draft. Songqi Li: Resources, Funding acquisition. Hengfei Yin: Writing–Review & Editing. Haowei Chen: Project administration. Ninghong Jia: Writing–Review & Editing. Ming Gao: Writing–Review & Editing. ShanYan Zhang: Writing–Review & Editing. Yingying Sun: Writing–Review & Editing. Chuanfeng Zhao: Writing–Review & Editing. Dehao Zhang: Writing–Review & Editing.
Funding
This study was supported by CNPC Science and Technology Project “Research on New Methods and Technologies of Enhanced Oil Recovery” Project 10 “Research on Enhanced Oil Recovery Technology of Multi-Dynamic Flooding” (2023ZZ0410).
Conflicts of Interest
The authors declare that they have no known competing financial interests or personal relationships that could have appeared to influence the work reported in this paper.
Appendix

Table 1.
Types and quantities of the basic molecules in the models.
| Case | Quantity and types of oil molecules | Water | CO2 | Total | |||
|---|---|---|---|---|---|---|---|
| Nonpolar molecules | Polar molecules | ||||||
| 1 | heptane | 80 | - | 0 | 600 | 0 | 680 |
| 2 | heptane | 80 | - | 0 | 600 | 150 | 830 |
| 3 | heptane | 80 | - | 0 | 600 | 200 | 880 |
| 4 | heptane | 80 | - | 0 | 600 | 300 | 980 |
| 5 | benzene | 100 | - | 0 | 600 | 0 | 700 |
| 6 | benzene | 100 | - | 0 | 600 | 150 | 850 |
| 7 | benzene | 100 | - | 0 | 600 | 200 | 900 |
| 8 | benzene | 100 | - | 0 | 600 | 300 | 1000 |
| 9 | - | 0 | Toluene | 100 | 600 | 0 | 700 |
| 10 | - | 0 | Toluene | 100 | 600 | 150 | 850 |
| 11 | - | 0 | Toluene | 100 | 600 | 200 | 900 |
| 12 | - | 0 | Toluene | 100 | 600 | 300 | 1000 |
| 13 | - | 0 | Thiophene | 100 | 600 | 0 | 700 |
| 14 | - | 0 | Thiophene | 100 | 600 | 150 | 850 |
| 15 | - | 0 | Thiophene | 100 | 600 | 200 | 900 |
| 16 | - | 0 | Thiophene | 100 | 600 | 300 | 1000 |
| 17 | - | 0 | heptanoic acid | 100 | 600 | 0 | 700 |
| 18 | - | 0 | heptanoic acid | 100 | 600 | 150 | 850 |
| 19 | - | 0 | heptanoic acid | 100 | 600 | 200 | 900 |
| 20 | - | 0 | heptanoic acid | 100 | 600 | 300 | 1000 |
| 21 | - | 0 | Pyridine | 100 | 600 | 0 | 700 |
| 22 | - | 0 | Pyridine | 100 | 600 | 150 | 850 |
| 23 | - | 0 | Pyridine | 100 | 600 | 200 | 900 |
| 24 | - | 0 | Pyridine | 100 | 600 | 300 | 1000 |
| 25 | - | 0 | Phenol | 100 | 600 | 0 | 700 |
| 26 | - | 0 | Phenol | 100 | 600 | 150 | 850 |
| 27 | - | 0 | Phenol | 100 | 600 | 200 | 900 |
| 28 | - | 0 | Phenol | 100 | 600 | 300 | 1000 |
| 29 | - | 0 | ethyl mercaptan | 100 | 600 | 0 | 700 |
| 30 | - | 0 | ethyl mercaptan | 100 | 600 | 150 | 850 |
| 31 | - | 0 | ethyl mercaptan | 100 | 600 | 200 | 900 |
| 32 | - | 0 | ethyl mercaptan | 100 | 600 | 300 | 1000 |
References
- Dahlia A. Al-Obaidi, Watheq J. Al-Mudhafar, Mohammed S. Al-Jawad. Experimental evaluation of Carbon Dioxide-Assisted Gravity Drainage process (CO2-AGD) to improve oil recovery in reservoirs with strong water drive. Fuel, Volume 324, Part A, 2022, 124409, ISSN 0016-2361. [CrossRef]
- Maryam Mohdsaeed H.I. Abdulla, Shaligram Pokharel. Analytical models for predicting oil recovery from immiscible CO2 injection: A literature review. Journal of Petroleum Science and Engineering, Volume 219, 2022, 111131, ISSN 0920-4105. [CrossRef]
- Yongsheng Tan, Qi Li, Liang Xu, Abdul Ghaffar, Xiang Zhou, Pengchun Li. A critical review of carbon dioxide enhanced oil recovery in carbonate reservoirs. Fuel, Volume 328, 2022, 125256, ISSN 0016-2361. [CrossRef]
- Xiang Zhou, Qingwang Yuan, Xiaolong Peng, Fanhua Zeng, Liehui Zhang. A critical review of the CO2 huff ‘n’ puff process for enhanced heavy oil recovery, Fuel, Volume 215, 2018, Pages 813-824, ISSN 0016-2361. [CrossRef]
- Kun Guo, Hailong Li, Zhixin Yu. In-situ heavy and extra-heavy oil recovery: A review. Fuel, Volume 185, 2016, Pages 886-902, ISSN 0016-2361. [CrossRef]
- Randy Agra Pratama, Tayfun Babadagli. A review of the mechanics of heavy-oil recovery by steam injection with chemical additives. Journal of Petroleum Science and Engineering, Volume 208, Part D, 2022, 109717, ISSN 0920-4105. [CrossRef]
- Yi Zhang, Lei Yuan, Shezhan Liu, Jingru Zhang, Mingjun Yang, Yongchen Song. Molecular dynamics simulation of bubble nucleation and growth during CO2 Huff-n-Puff process in a CO2-heavy oil system. Geoenergy Science and Engineering, Volume 227, 2023, 211852, ISSN 2949-8910. [CrossRef]
- Zihan Gu, Chao Zhang, Teng Lu, Haitao Wang, Zhaomin Li, Hongyuan Wang. Experimental analysis of the stimulation mechanism of CO2-assisted steam flooding in ultra-heavy oil reservoirs and its significance in carbon sequestration. Fuel, Volume 345, 2023, 128188, ISSN 0016-2361. [CrossRef]
- Di Zhu, Binfei Li, Lei Zheng, Wenshuo Lei, Boliang Li, Zhaomin Li. Effects of CO2 and surfactants on the interface characteristics and imbibition process in low-permeability heavy oil reservoirs. Colloids and Surfaces A: Physicochemical and Engineering Aspects, Volume 657, Part A, 2023, 130538, ISSN 0927-7757. [CrossRef]
- Xiang Zhou, Xiuluan Li, Dehuang Shen, Lanxiang Shi, Zhien Zhang, Xinge Sun, Qi Jiang. CO2 huff-n-puff process to enhance heavy oil recovery and CO2 storage: An integration study. Energy, Volume 239, Part B, 2022, 122003, ISSN 0360-5442. [CrossRef]
- Hao Chen, Bowen Li, et al. Empirical correlations for prediction of minimum miscible pressure and near-miscible pressure interval for oil and CO2 systems. Fuel, Volume 278, 2020, 118272, ISSN 0016-2361. [CrossRef]
- Timing Fang, Yingnan Zhang, Jie Liu, Bin Ding, Youguo Yan, Jun Zhang. Molecular insight into the miscible mechanism of CO2/C10 in bulk phase and nanoslits. International Journal of Heat and Mass Transfer, Volume 141, 2019, Pages 643-650, ISSN 0017-9310. [CrossRef]
- Makimura Dai, Kunieda Makoto, Liang Yunfeng, Matsuoka Toshifumi, Takahashi Satoru, and Hiroshi Okabe. Application of Molecular Simulations to CO2-EOR: Phase-Equilibria and Interfacial Phenomena. Paper presented at the International Petroleum Technology Conference, Bangkok, Thailand, November 2011. [CrossRef]
- Seng, Lee Yeh, and Berna Hascakir. Role of Intermolecular Forces on Surfactant-Steam Performance into Heavy Oil Reservoirs. SPE J. 26 (2021): 2318–2323. [CrossRef]
- Qian-Hui Zhao, Shuai Ma, et al . Chung, Quan Shi. Molecular composition of naphthenic acids in a Chinese heavy crude oil and their impacts on oil viscosity. Petroleum Science, Volume 20, Issue 2, 2023, Pages 1225-1230, ISSN 1995-8226. [CrossRef]
- Chang-Yu Sun and Guang-Jin Chen. Measurement of Interfacial Tension for the CO2 Injected Crude Oil + Reservoir Water System. Journal of Chemical & Engineering Data, 2005, 50 (3), 936-938. [CrossRef]
- Luo, C., Liu, H. Q., Wang, Z. C., Lyu, X. C., Zhang, Y. Q., & Zhou, S. (2024). A comprehensive study on the effect of rock corrosion and CO2 on oil-water interfacial tension during CO2 injection in heavy oil reservoirs. Petroleum Science and Technology, 1–13. [CrossRef]
- Binfei Li, Lei Zheng, Aiqing Cao, Hao Bai, Chuanbao Zhang, Zhaomin Li. Effect of interaction between CO2 and crude oil on the evolution of interface characteristics. Colloids and Surfaces A: Physicochemical and Engineering Aspects, Volume 647, 2022, 129043, ISSN 0927-7757. [CrossRef]
- Bing Liu, Junqin Shi, et al. Reduction in interfacial tension of water–oil interface by supercritical CO2 in enhanced oil recovery processes studied with molecular dynamics simulation. The Journal of Supercritical Fluids, Volume 111, 2016, Pages 171-178, ISSN 0896-8446. [CrossRef]
- Yilei Song, Zhaojie Song, Yufan Meng, Zhangxin Chen, Xiao Han, Dong Feng. Multi-phase behavior and pore-scale flow in medium-high maturity continental shale reservoirs with Oil, CO2, and water. Chemical Engineering Journal, Volume 484, 2024, 149679, ISSN 1385-8947. [CrossRef]
- Teng Lu, et al. Stability and enhanced oil recovery performance of CO2 in water emulsion: Experimental and molecular dynamic simulation study. Chemical Engineering Journal, Volume 464, 2023, 142636, ISSN 1385-8947. [CrossRef]
- Luan Yalin, et al. Oil displacement by supercritical CO2 in a water cut dead-end pore: Molecular dynamics simulation. Journal of Petroleum Science and Engineering, Volume 188, 2020, 106899, ISSN 0920-4105. [CrossRef]
- Lu Wang, Yifan Zhang, Rui Zou, Run Zou, Liang Huang, Yisheng Liu, Zhan Meng, Zhilin Wang, Hao Lei. A systematic review of CO2 injection for enhanced oil recovery and carbon storage in shale reservoirs. International Journal of Hydrogen Energy, Volume 48, Issue 95, 2023, Pages 37134-37165, ISSN 0360-3199. [CrossRef]
- Tao Huang, Linsong Cheng, Renyi Cao, Xiaobiao Wang, Pin Jia, Chong Cao. Molecular simulation of the dynamic distribution of complex oil components in shale nanopores during CO2-EOR. Chemical Engineering Journal, Volume 479, 2024, 147743, ISSN 1385-8947. [CrossRef]
- Songqi Li, Yuetian Liu, Liang Xue, Dongdong Zhu. Theoretical insight into the effect of polar organic molecules on heptane-water interfacial properties using molecular dynamic simulation. Journal of Petroleum Science and Engineering, Volume 212, 2022, 110259, ISSN 0920-4105. [CrossRef]
- Li Songqi, Yi Pan, Shuangchun Yang, Zhaoxuan Li. A molecular insight into the mechanism of organic molecule detachment by supercritical CO2 from a water invasion calcite surface: Effect of water film and molecular absorbability. Geoenergy Science and Engineering, Volume 231, Part A, 2023, 212290, ISSN 2949-8910. [CrossRef]
- Alqam, Mohammad H., Abu-Khamsin, Sidqi A., Alafnan, Saad F., Sultan, Abdullah S., Al-Majed, Abdulaziz, and Taha Okasha. The Impact of Carbonated Water on Wettability: Combined Experimental and Molecular Simulation Approach. SPE J. 27 (2022): 945–957. [CrossRef]
- Yafan Yang, Arun Kumar Narayanan Nair, Mohd Fuad Anwari Che Ruslan, and Shuyu Sun. Bulk and Interfacial Properties of the Decane Water System in the Presence of Methane, Carbon Dioxide, and Their Mixture. The Journal of Physical Chemistry B, 2020, 124 (43), 9556-9569. [CrossRef]
- Tao Yu, Qi Li, et al. Characterization of the effects of wettability and pore pressure on the interfacial behavior of CO2 interacting with oil-water two-phase on pore walls. Geoenergy Science and Engineering, Volume 231, Part A, 2023, 212329, ISSN 2949-8910. [CrossRef]
- Chang Qiuhao, Huang Liangliang, and Xingru Wu. A Molecular Dynamics Study on Low-Pressure Carbon Dioxide in the Water/Oil Interface for Enhanced Oil Recovery. SPE J. 28 (2023): 643–652. [CrossRef]
- Saira, Ajoma, Emmanuel, and Furqan Le-Hussain. A Laboratory Investigation of the Effect of Ethanol-Treated Carbon Dioxide Injection on Oil Recovery and Carbon Dioxide Storage. SPE J. 26 (2021): 3119–3135. [CrossRef]
- Yueliang Liu, Zhenhua Rui, Tao Yang, Birol Dindoruk. Using propanol as an additive to CO2 for improving CO2 utilization and storage in oil reservoirs. Applied Energy, Volume 311, 2022, 118640, ISSN 0306-2619. [CrossRef]
- Osman, A.I., Hefny, M., Abdel Maksoud, M.I.A. et al. Recent advances in carbon capture storage and utilization technologies: a review. Environmental Chemistry Letters, 19, 797–849 (2021). [CrossRef]
- Sun, H., Zhao, et al., 2016. Compass II: extended coverage for polymer and drug-like molecule databases [J]. J. Mol. Model. [CrossRef]
- Songqi L, Yuetian L, et al. Theoretical insight into the effect of polar organic molecules on heptane-water interfacial properties using molecular dynamic simulation[J]. Journal of Petroleum Science and Engineering, 212, (2022). [CrossRef]
Figure 1.
The molecular structure of oil at the oil-water interface is a subject of investigation. The color coding is as follows: red represents oxygen atoms, blue denotes nitrogen atoms, yellow indicates sulfur atoms, gray signifies carbon atoms, and white corresponds to hydrogen atoms. For a comprehensive understanding of the color references presented in this figure legend, it is recommended that the reader consult the online version of this article.
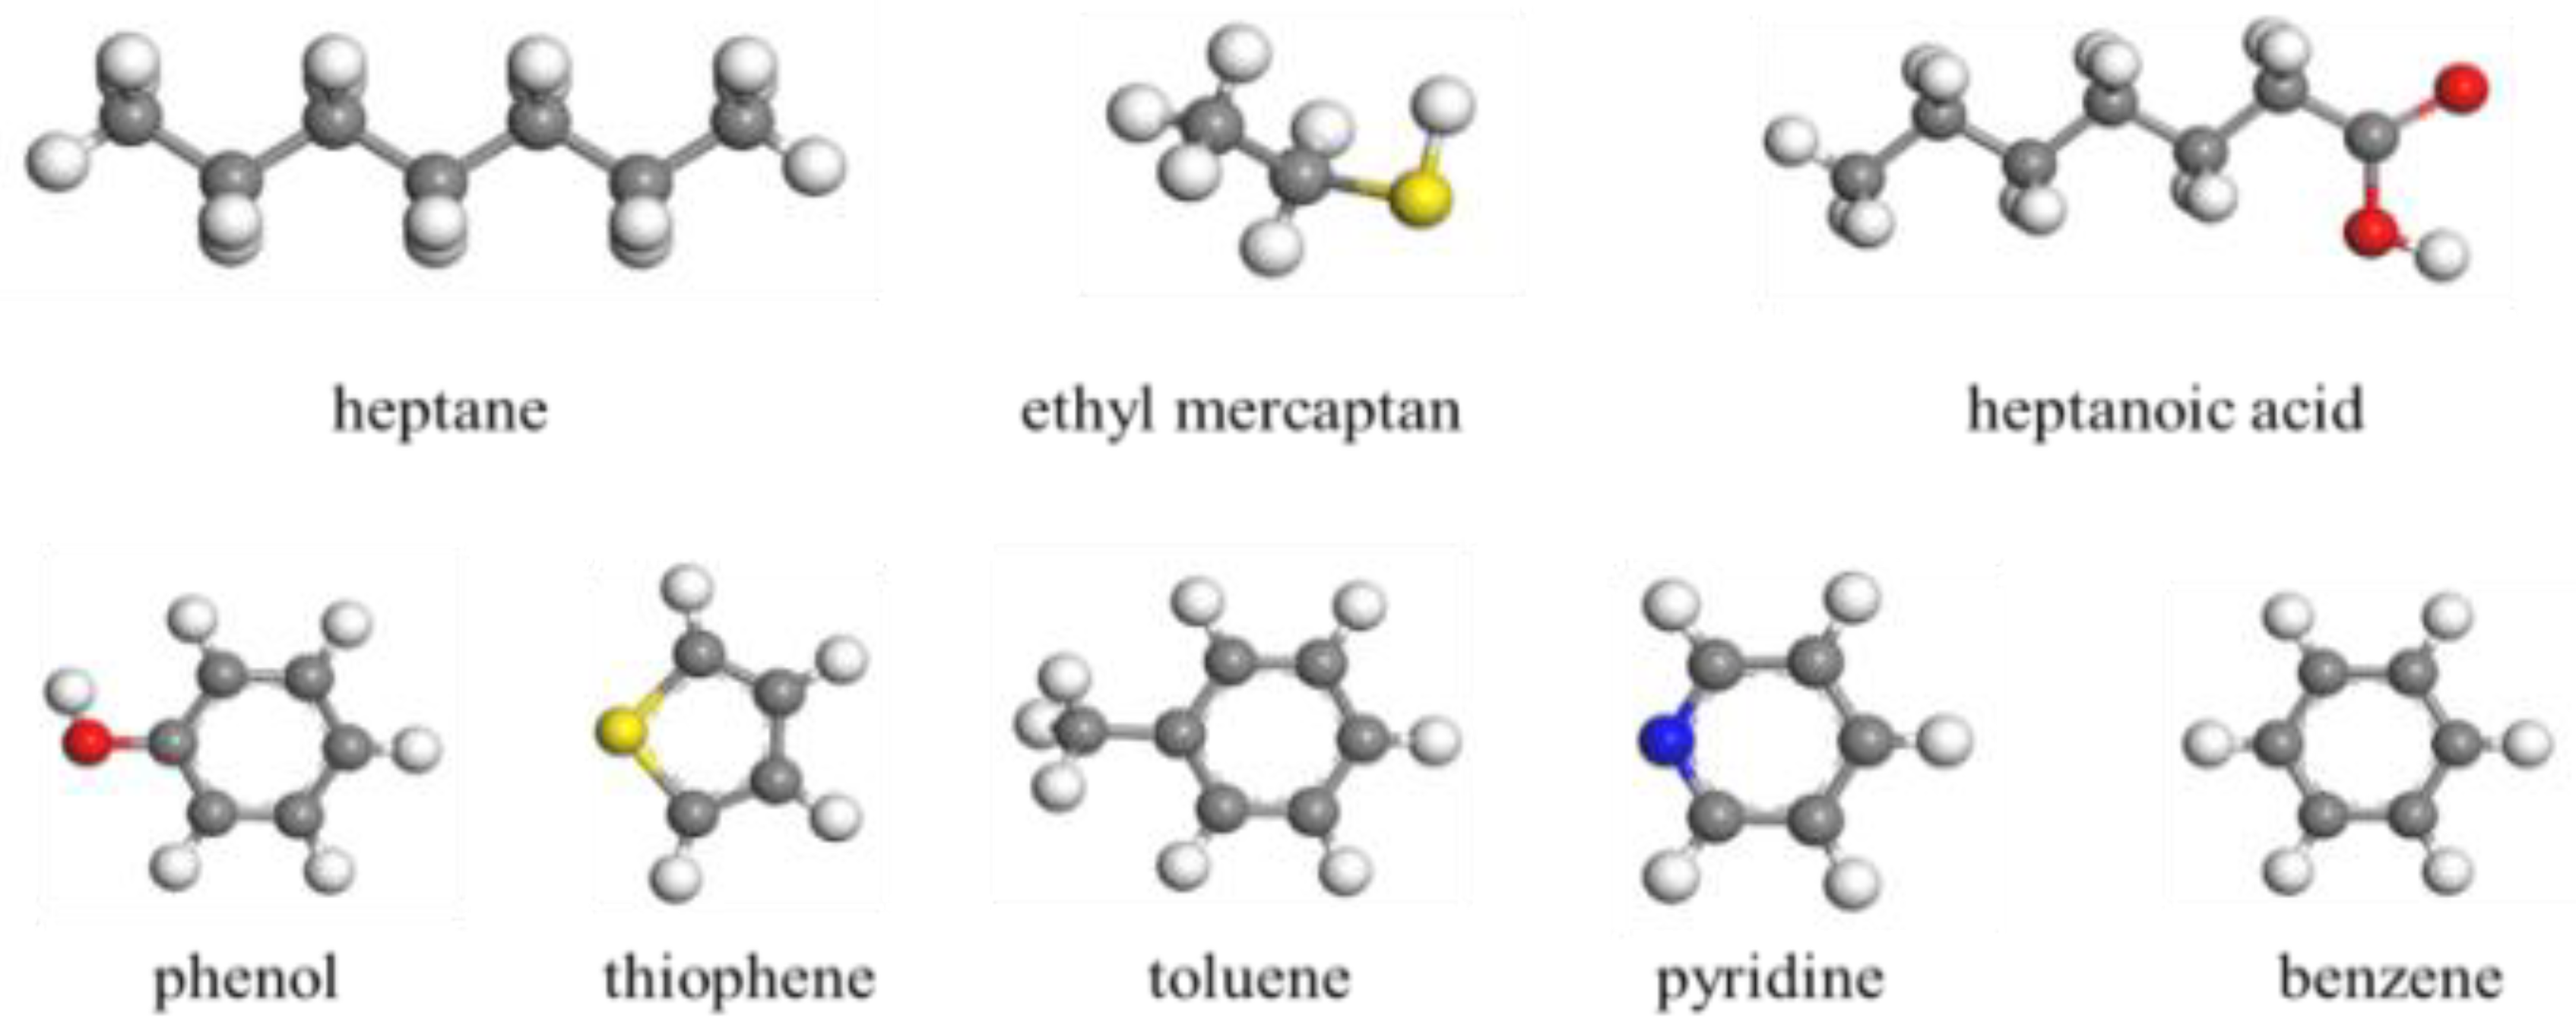
Figure 2.
Models of the oil-water-CO2 interface.
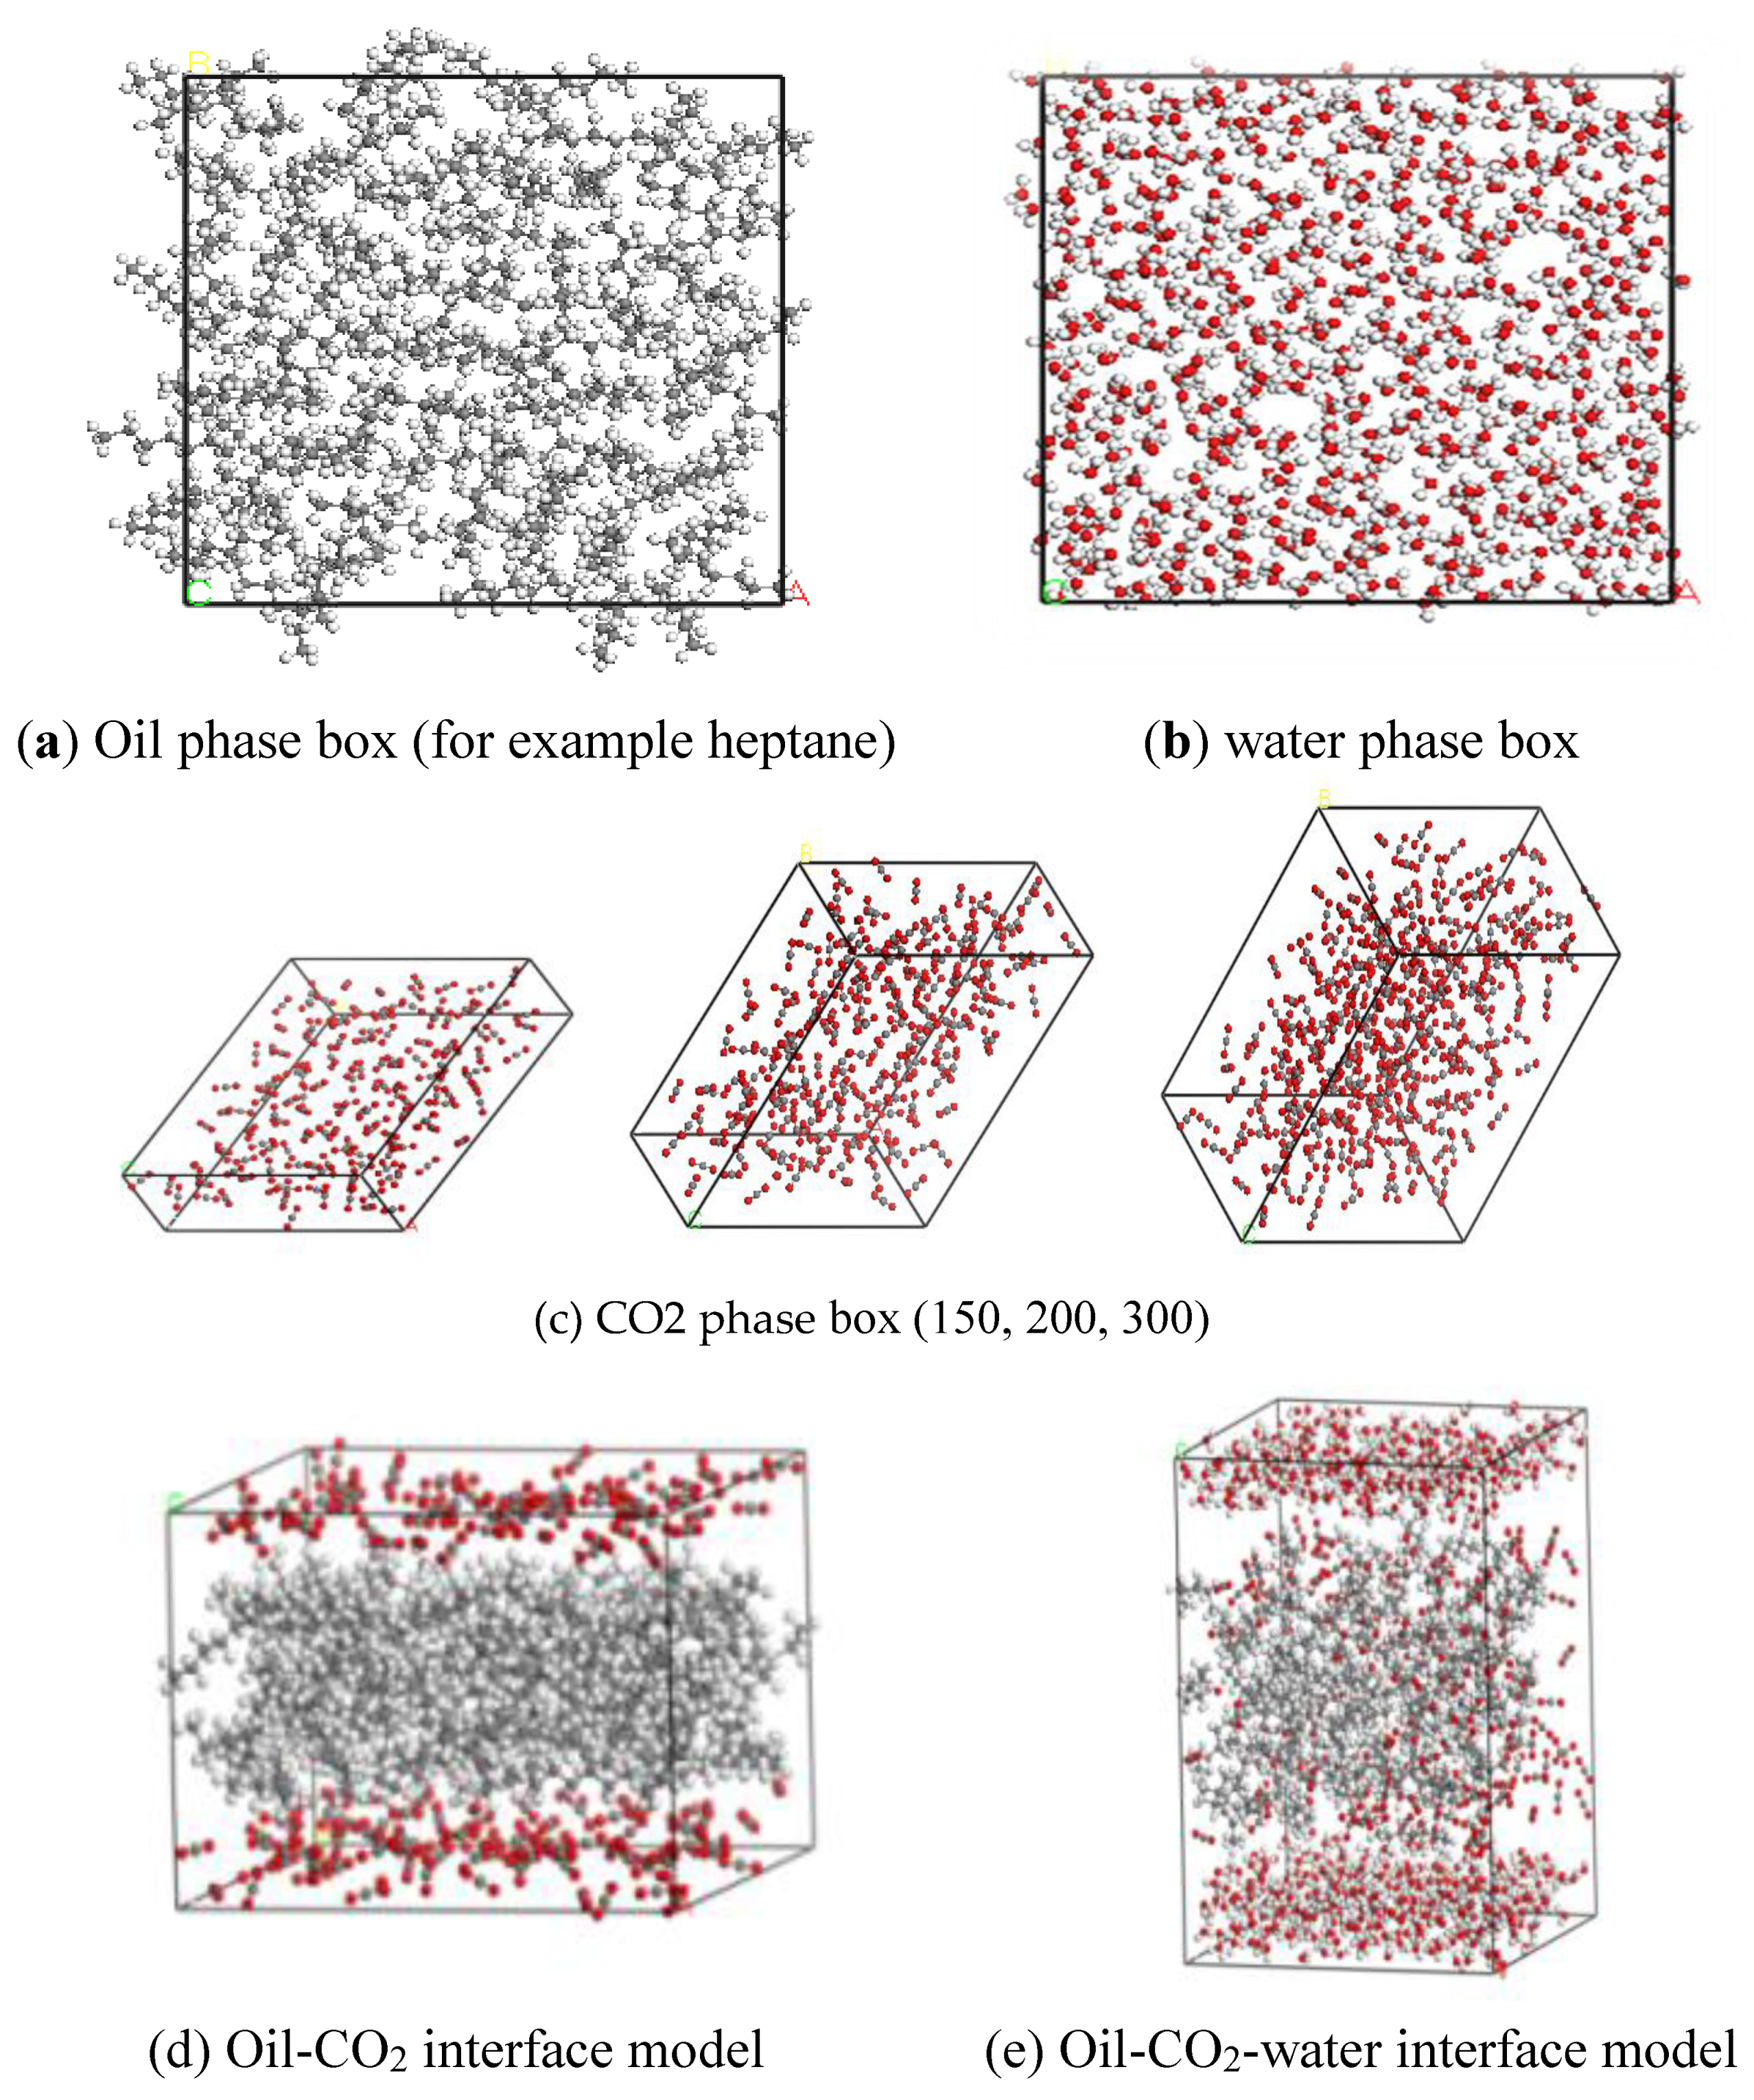
Figure 3.
Molecular dipole moment of oil.
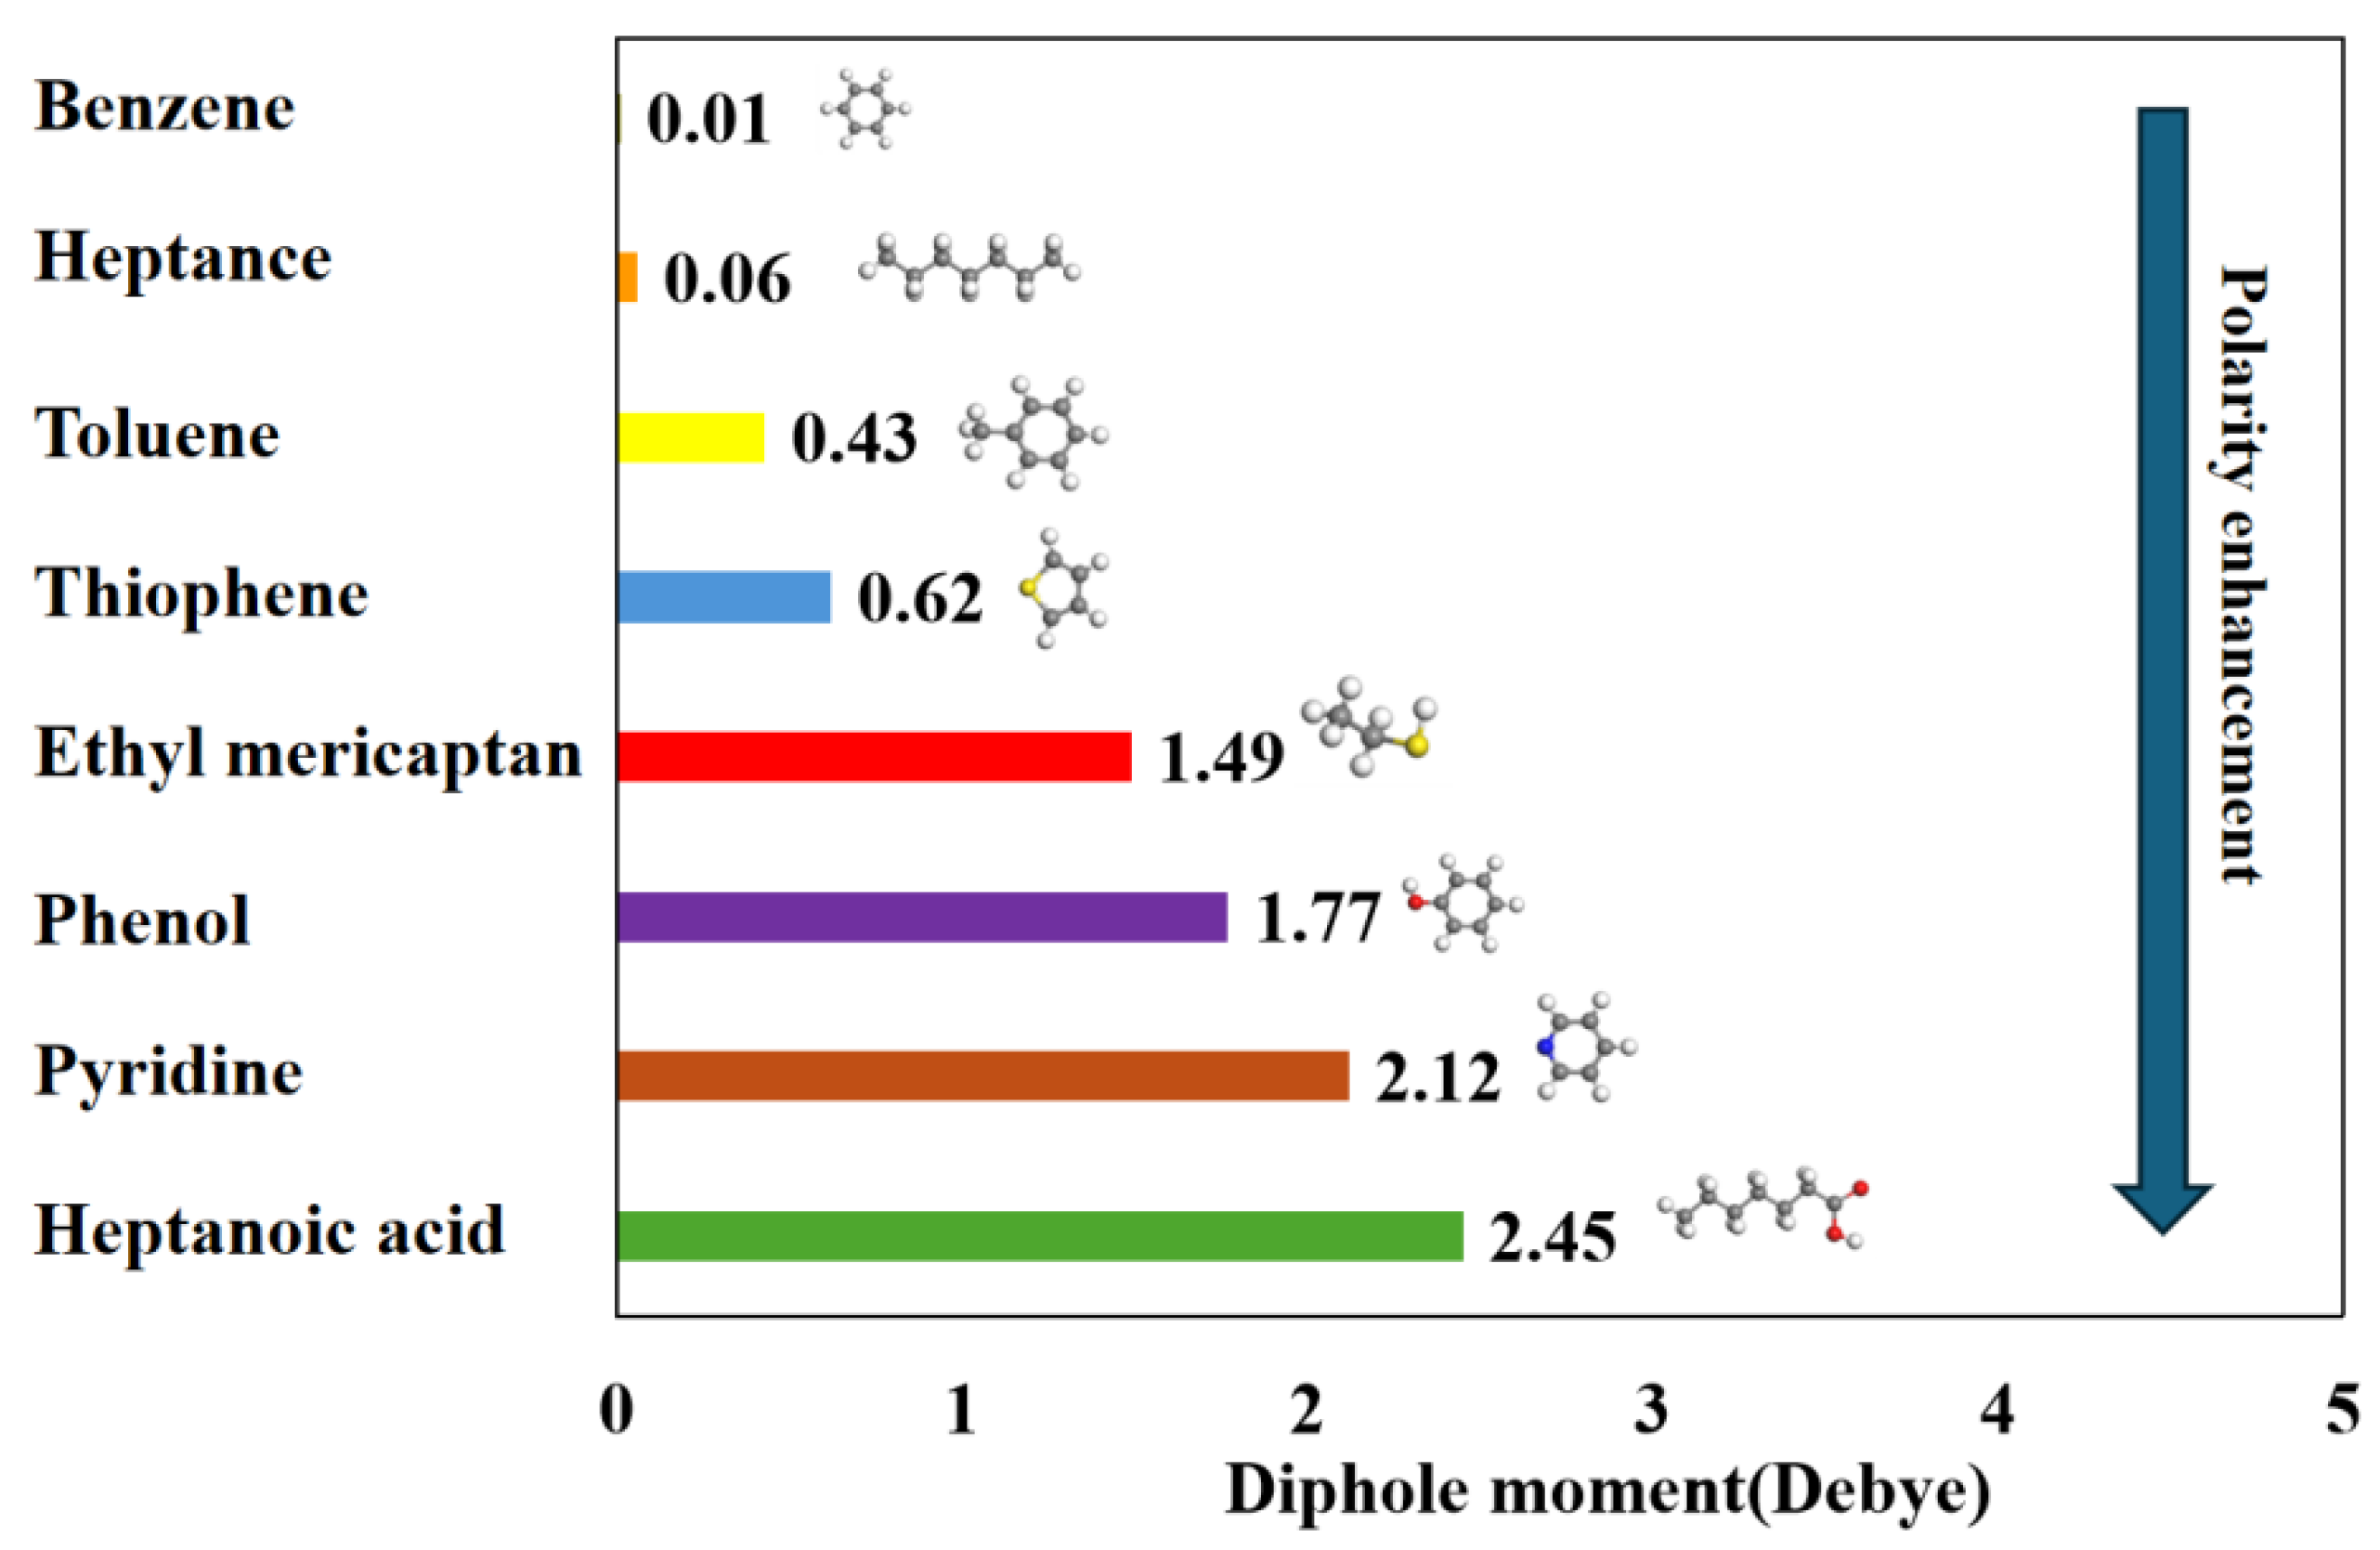
Figure 4.
Eight distinct types of dynamic equilibrium at 300CO2-oil-water interfaces are analyzed, with their relative concentrations and molecular structures characterized. (Water and crude oil molecules are depicted by a line model, while carbon dioxide molecules are explicitly labeled.).
Figure 4.
Eight distinct types of dynamic equilibrium at 300CO2-oil-water interfaces are analyzed, with their relative concentrations and molecular structures characterized. (Water and crude oil molecules are depicted by a line model, while carbon dioxide molecules are explicitly labeled.).
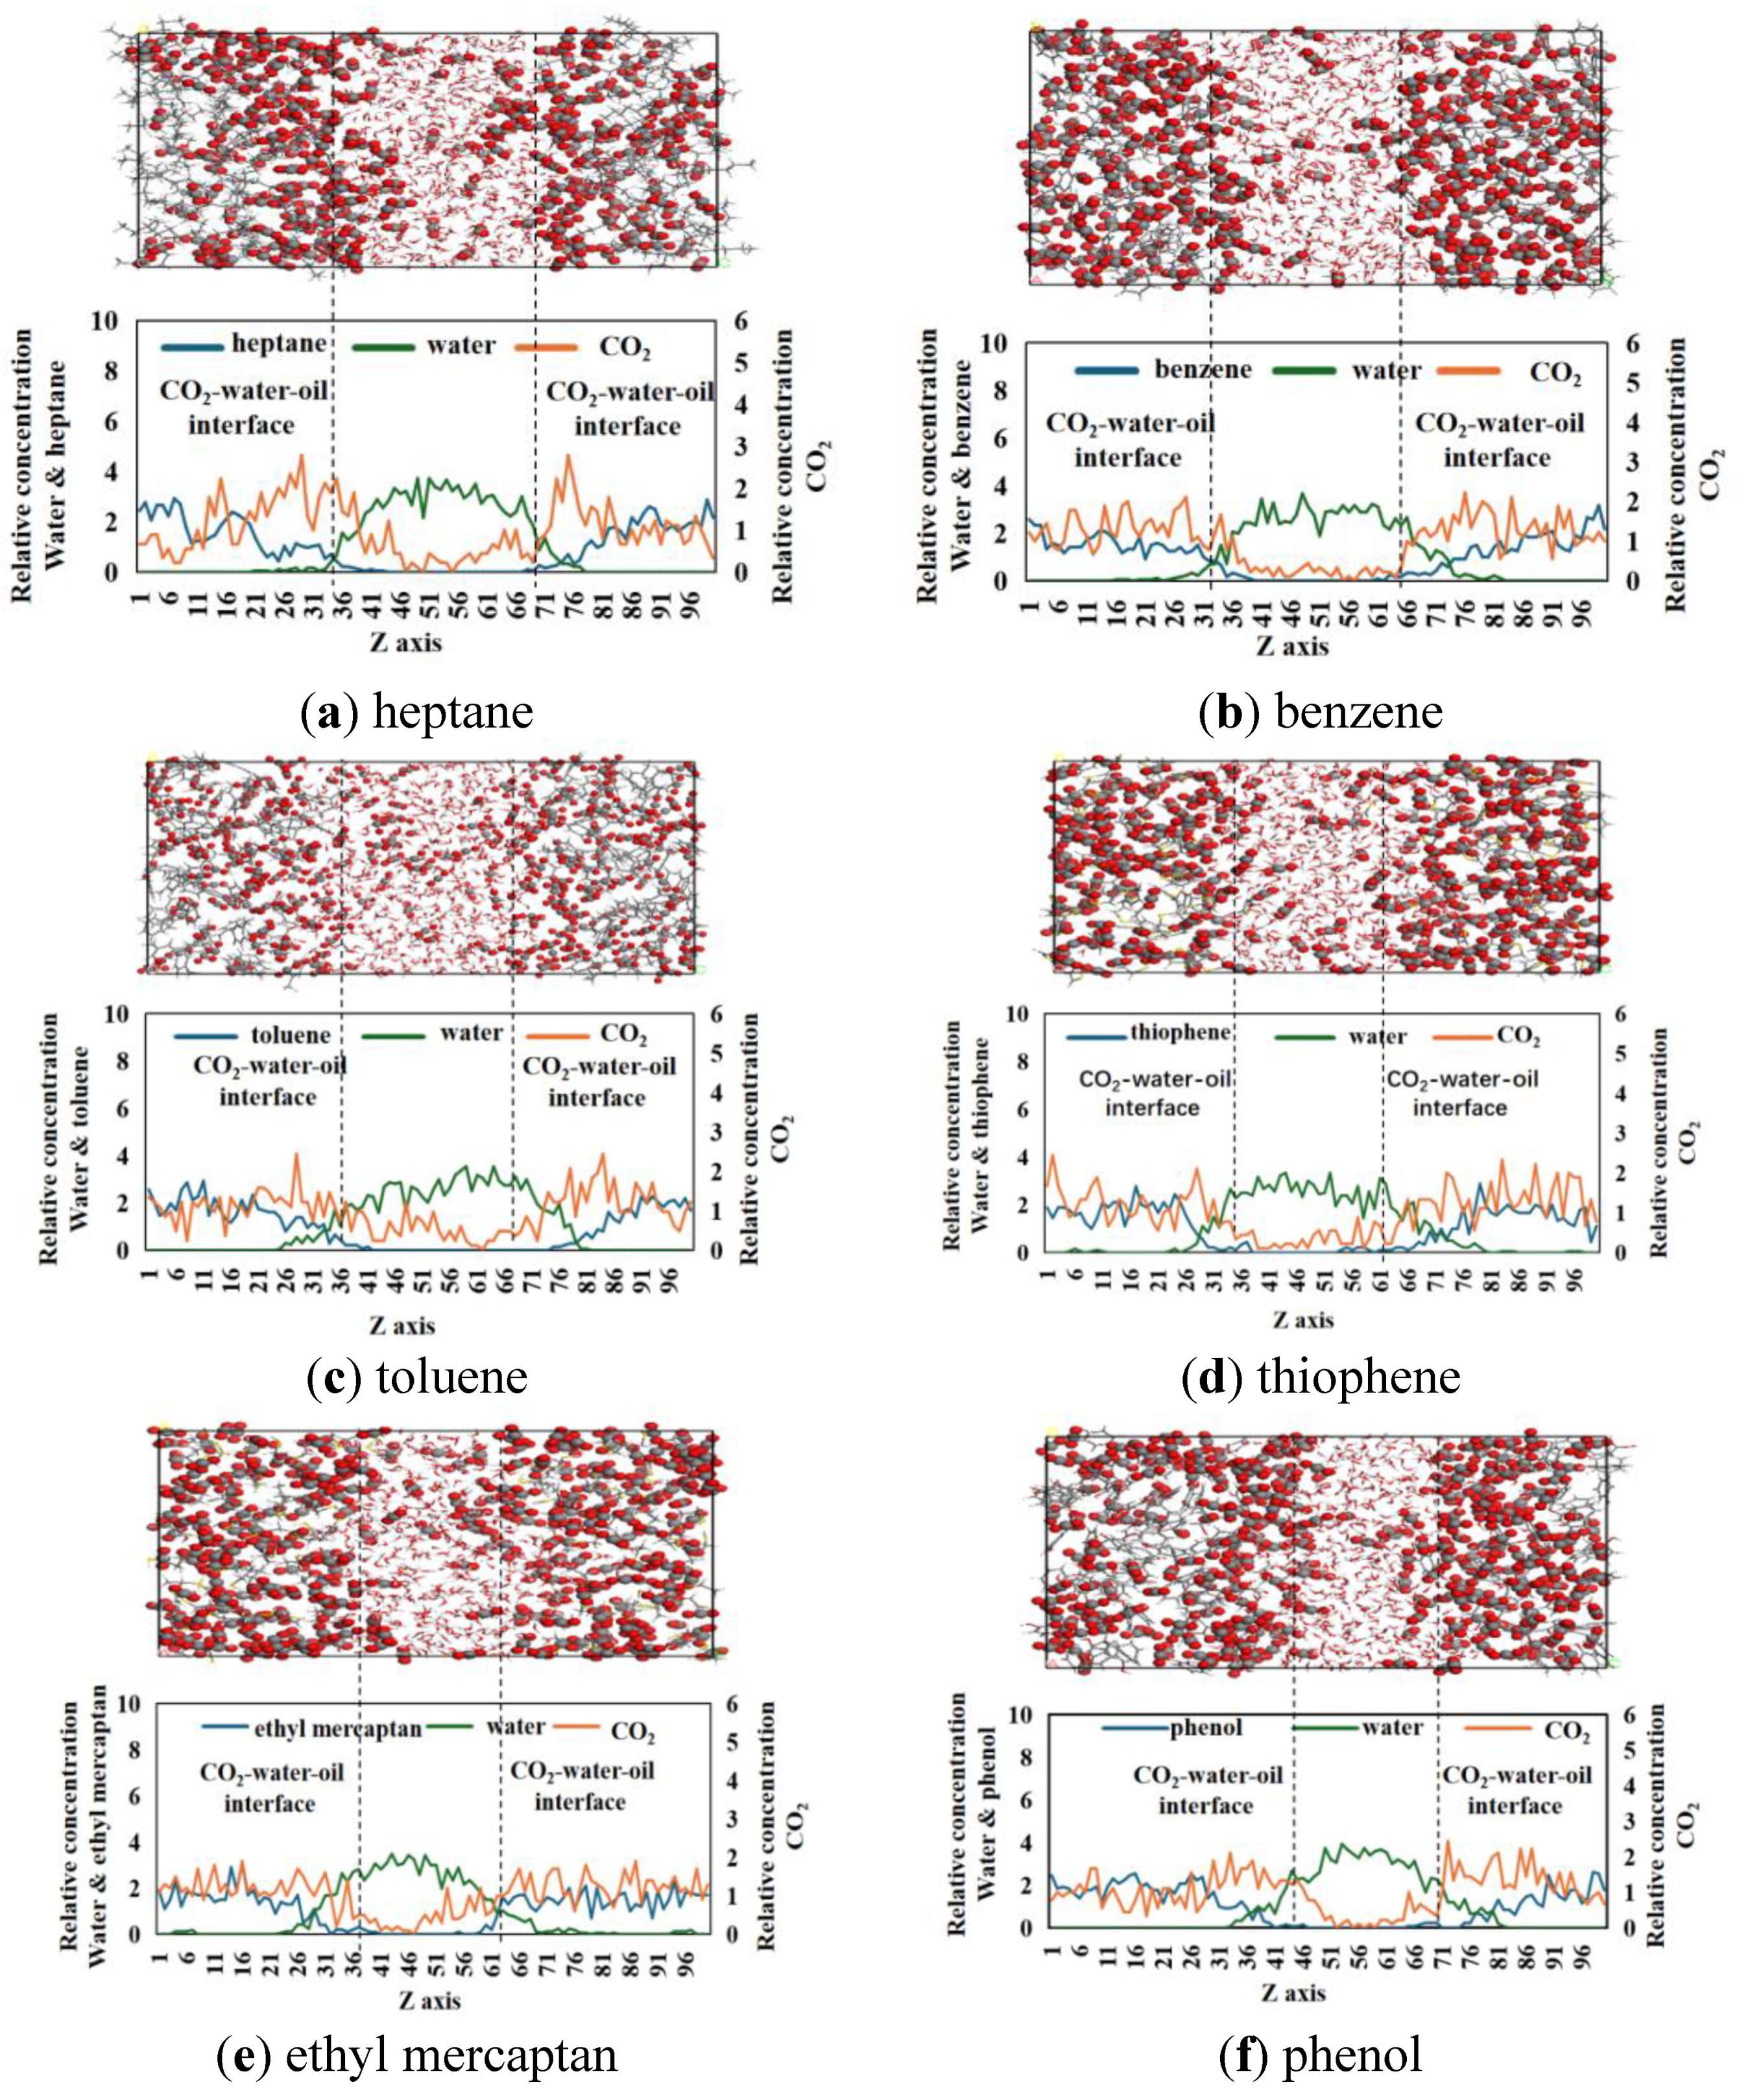
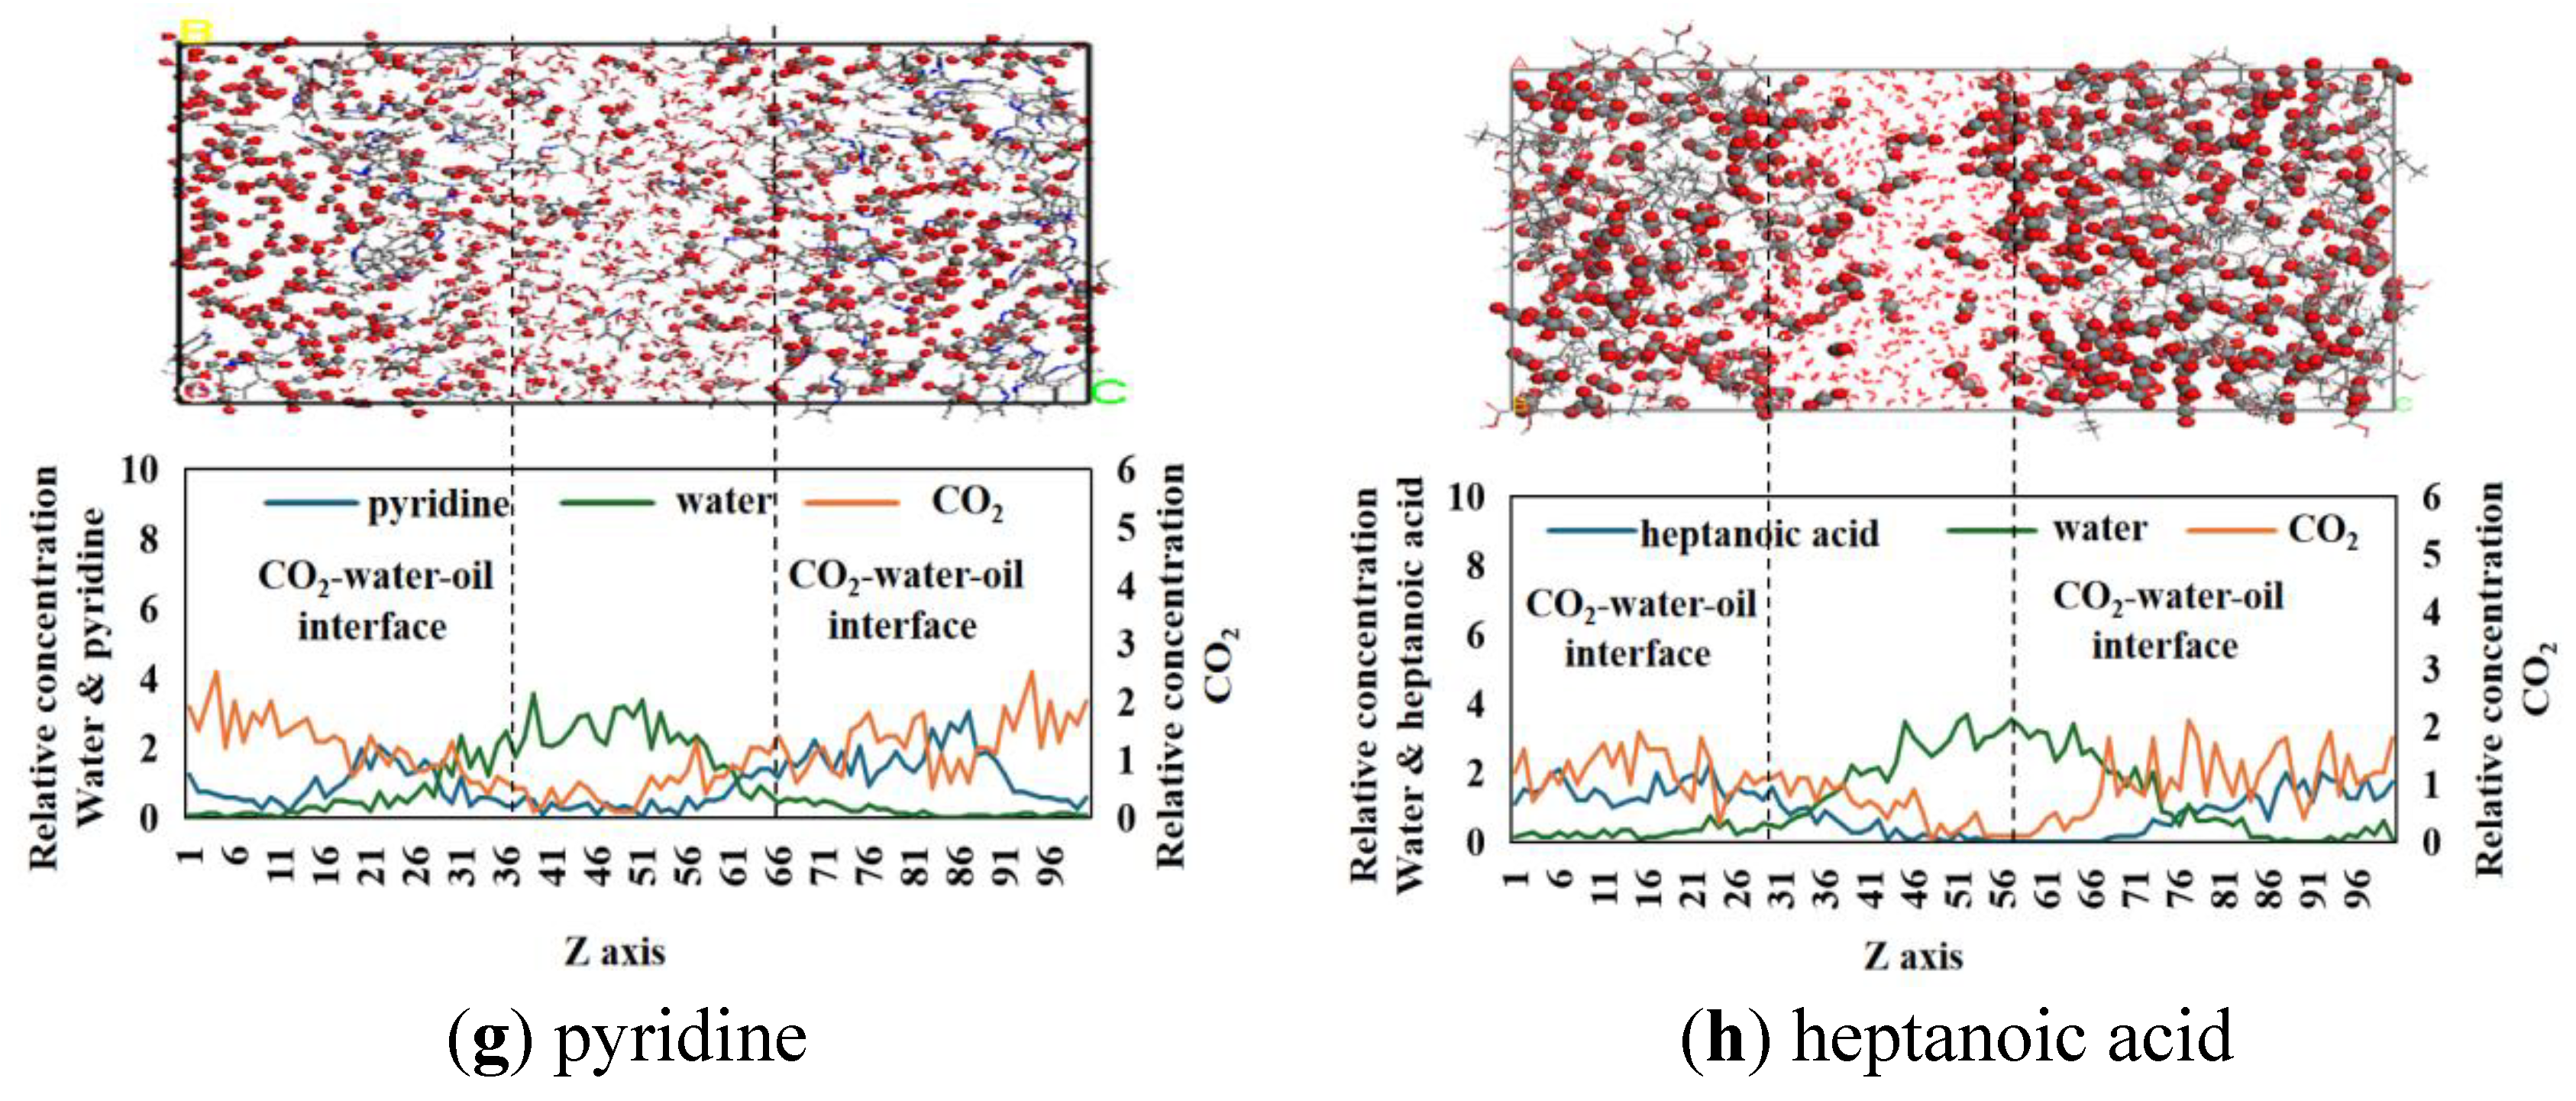
Figure 5.
In a molecular equilibrium state, the interfacial tension of eight different oil-water concepts.
Figure 5.
In a molecular equilibrium state, the interfacial tension of eight different oil-water concepts.
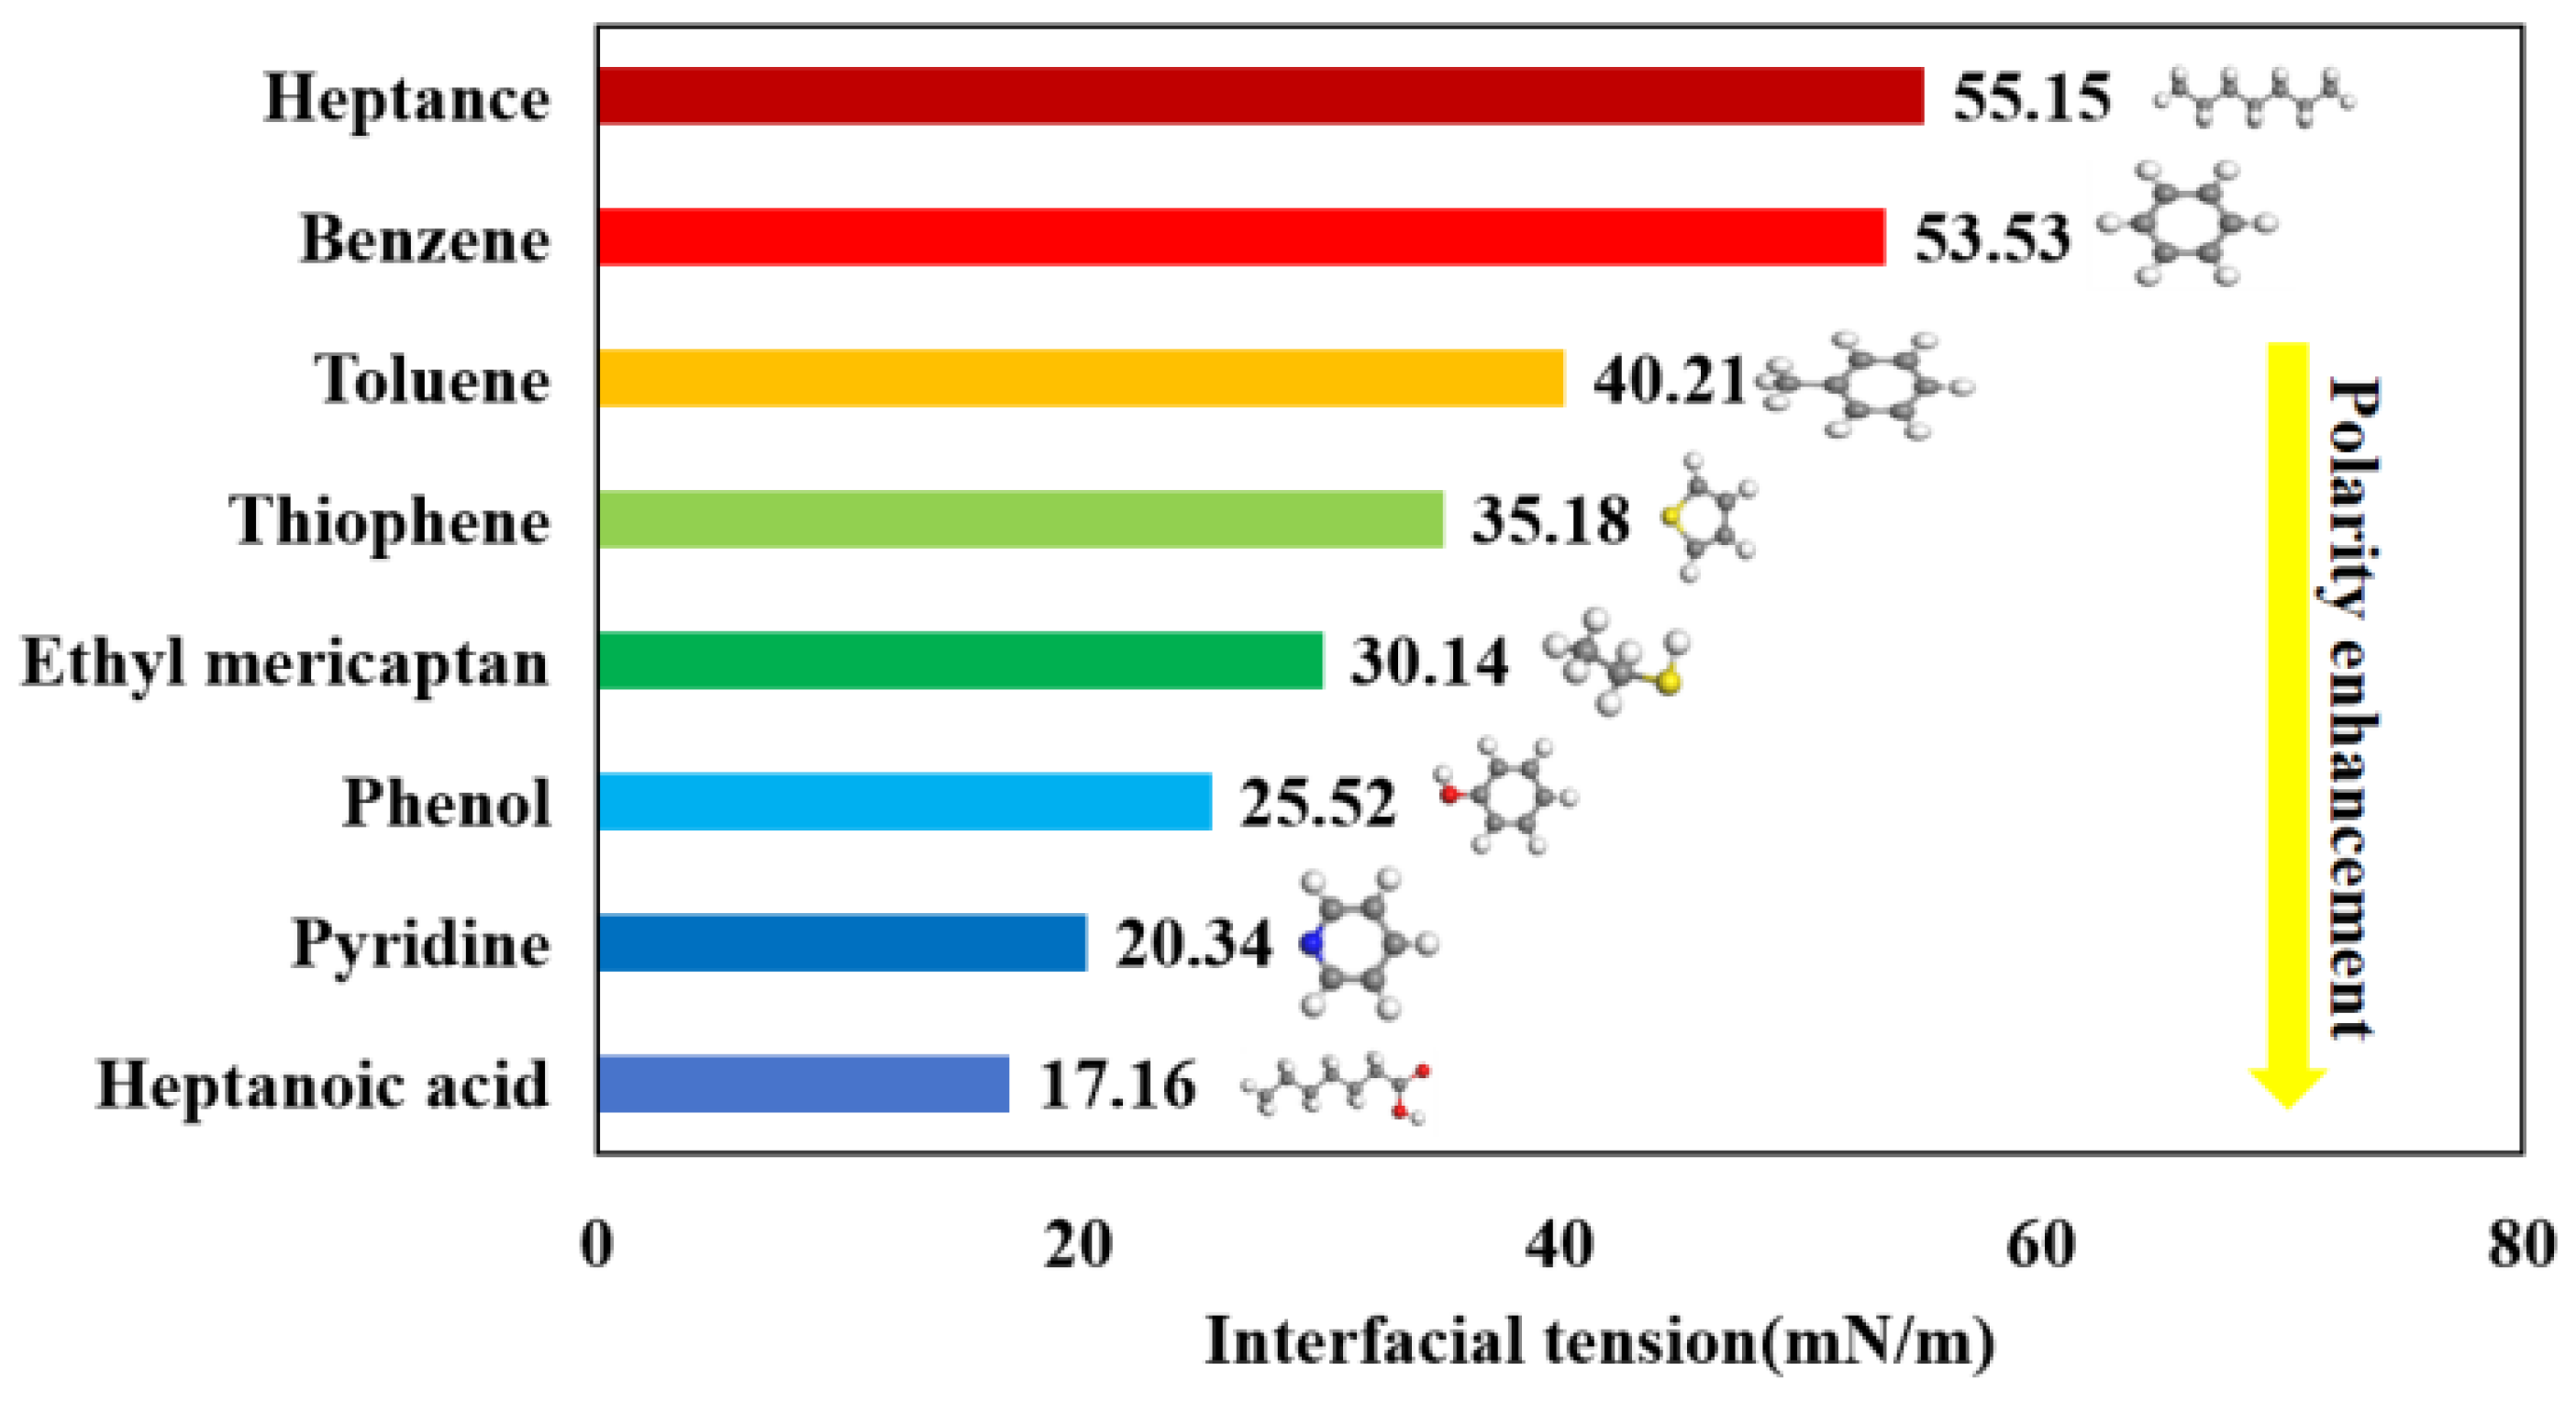
Figure 6.
At molecular equilibrium, the interfacial tension of eight different models involving 150CO2-oil-water interacts.
Figure 6.
At molecular equilibrium, the interfacial tension of eight different models involving 150CO2-oil-water interacts.
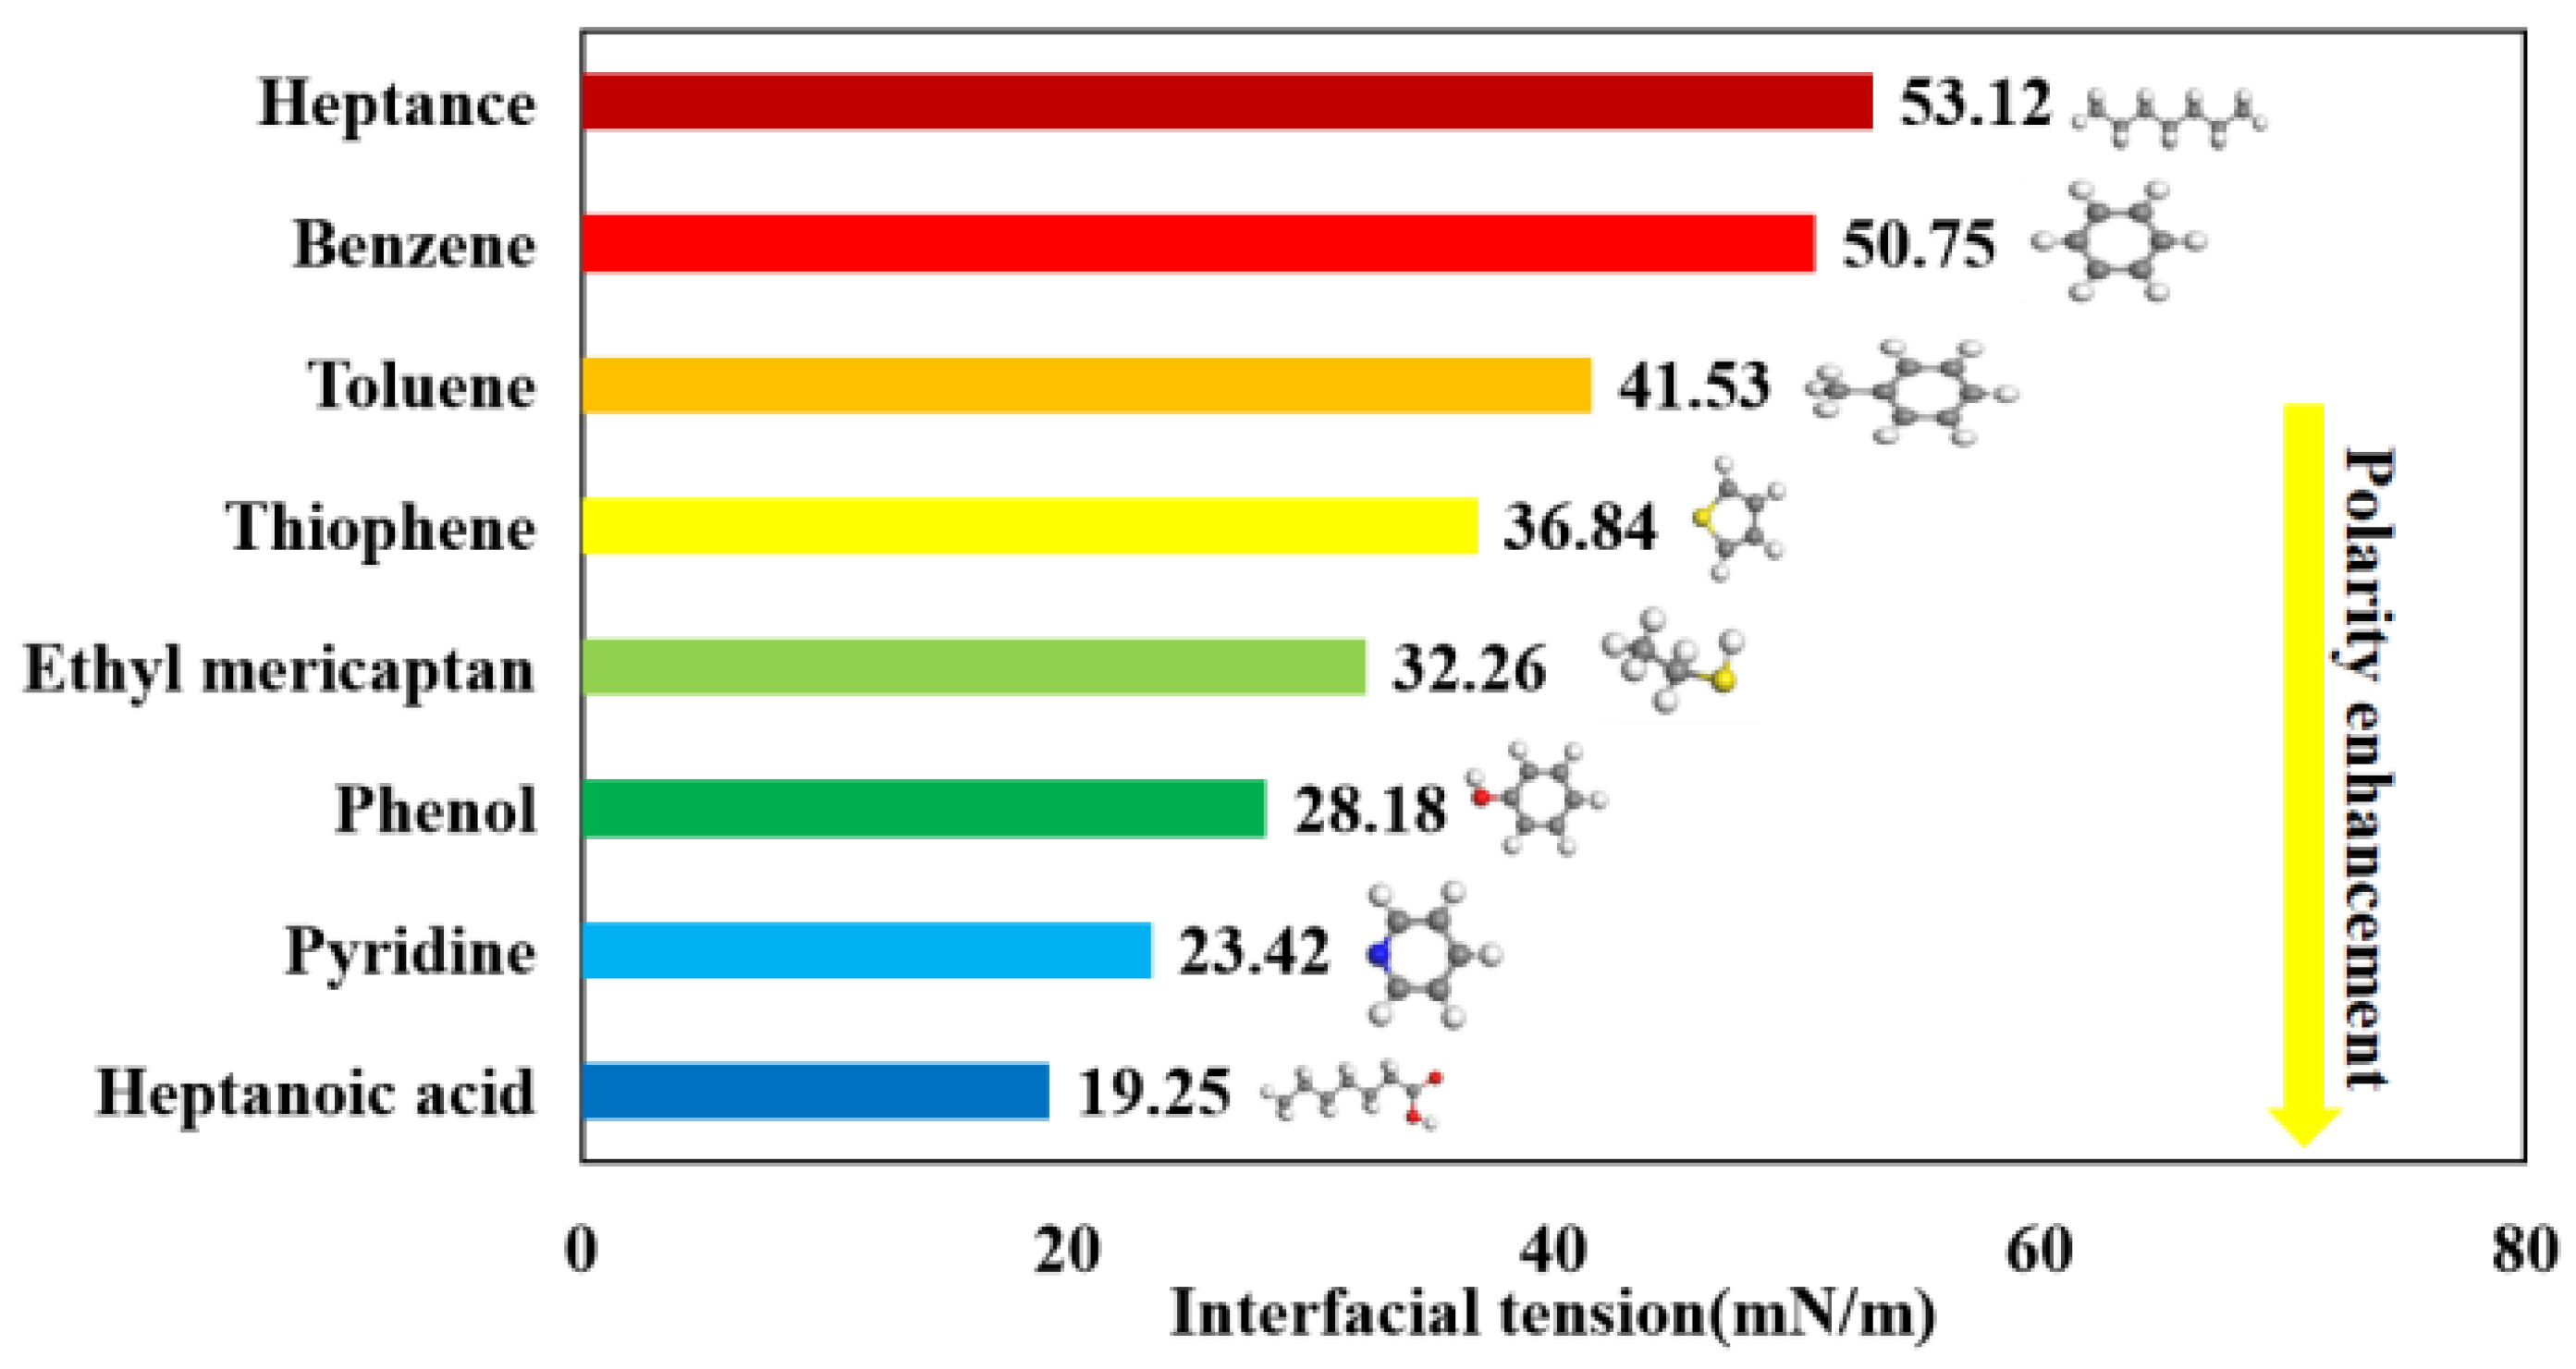
Figure 7.
At molecular equilibrium, the interfacial tension of eight different models involving 200CO2-oil-water interacts.
Figure 7.
At molecular equilibrium, the interfacial tension of eight different models involving 200CO2-oil-water interacts.
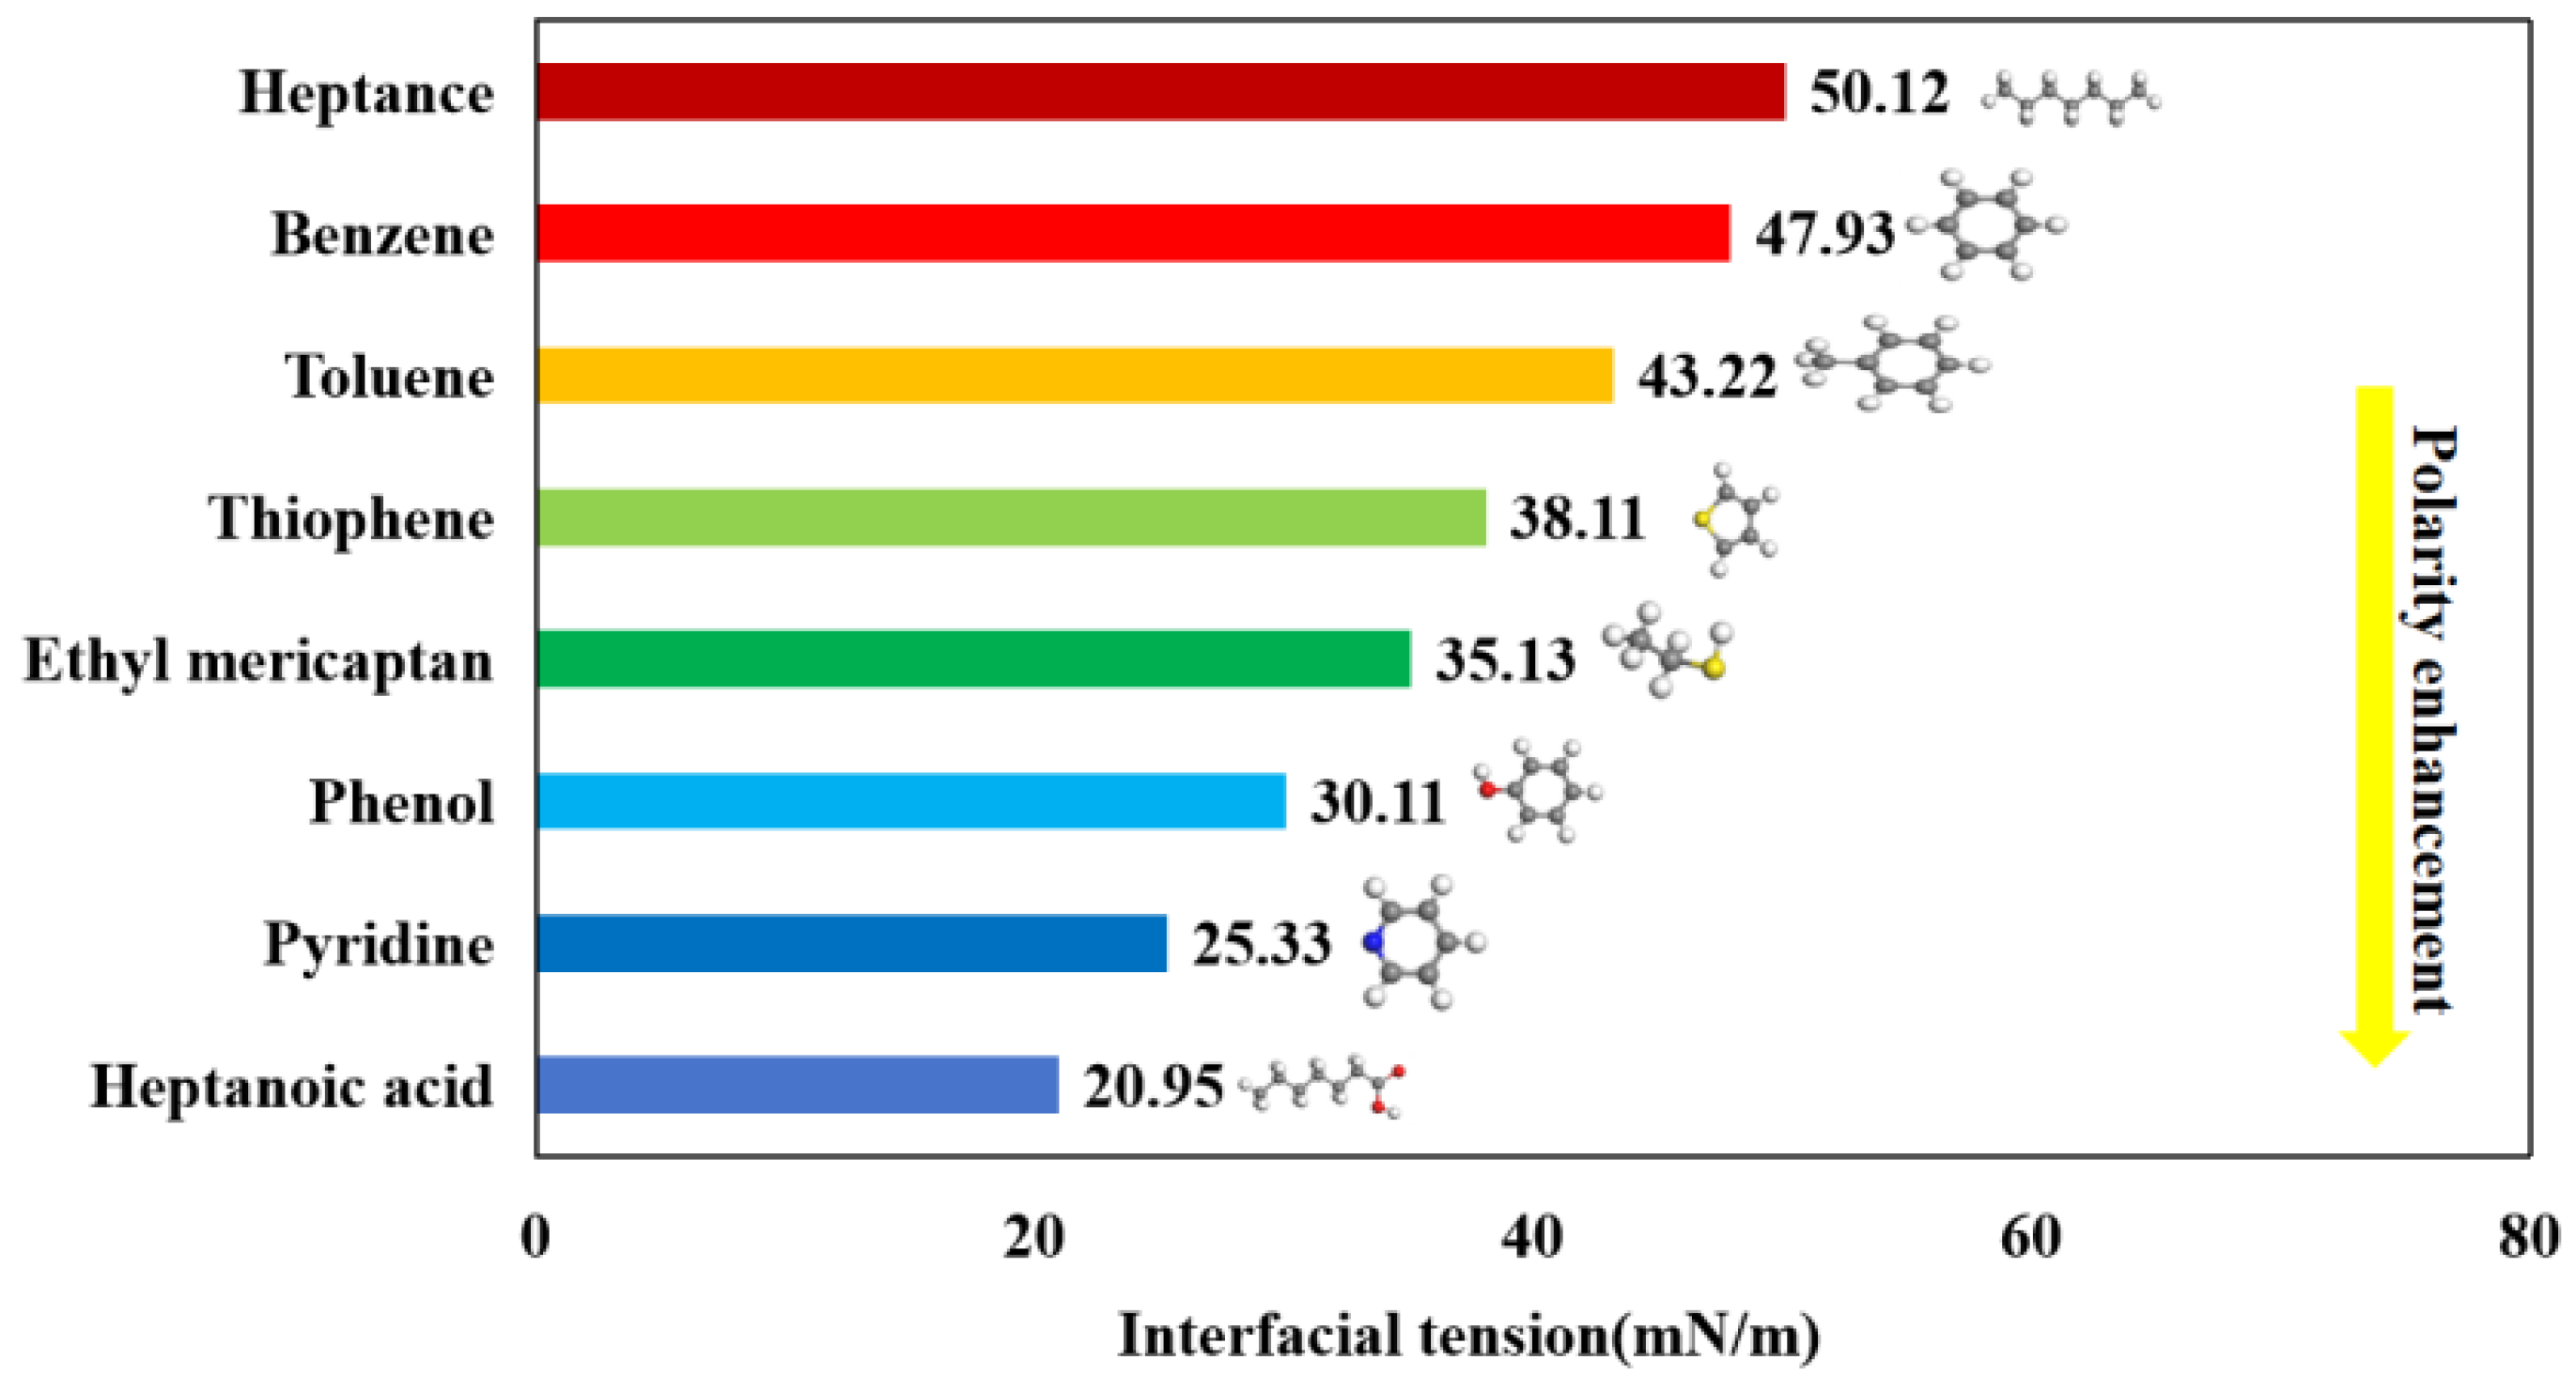
Figure 8.
At molecular equilibrium, the interfacial tension of eight different models involving 300CO2-oil-water interacts.
Figure 8.
At molecular equilibrium, the interfacial tension of eight different models involving 300CO2-oil-water interacts.
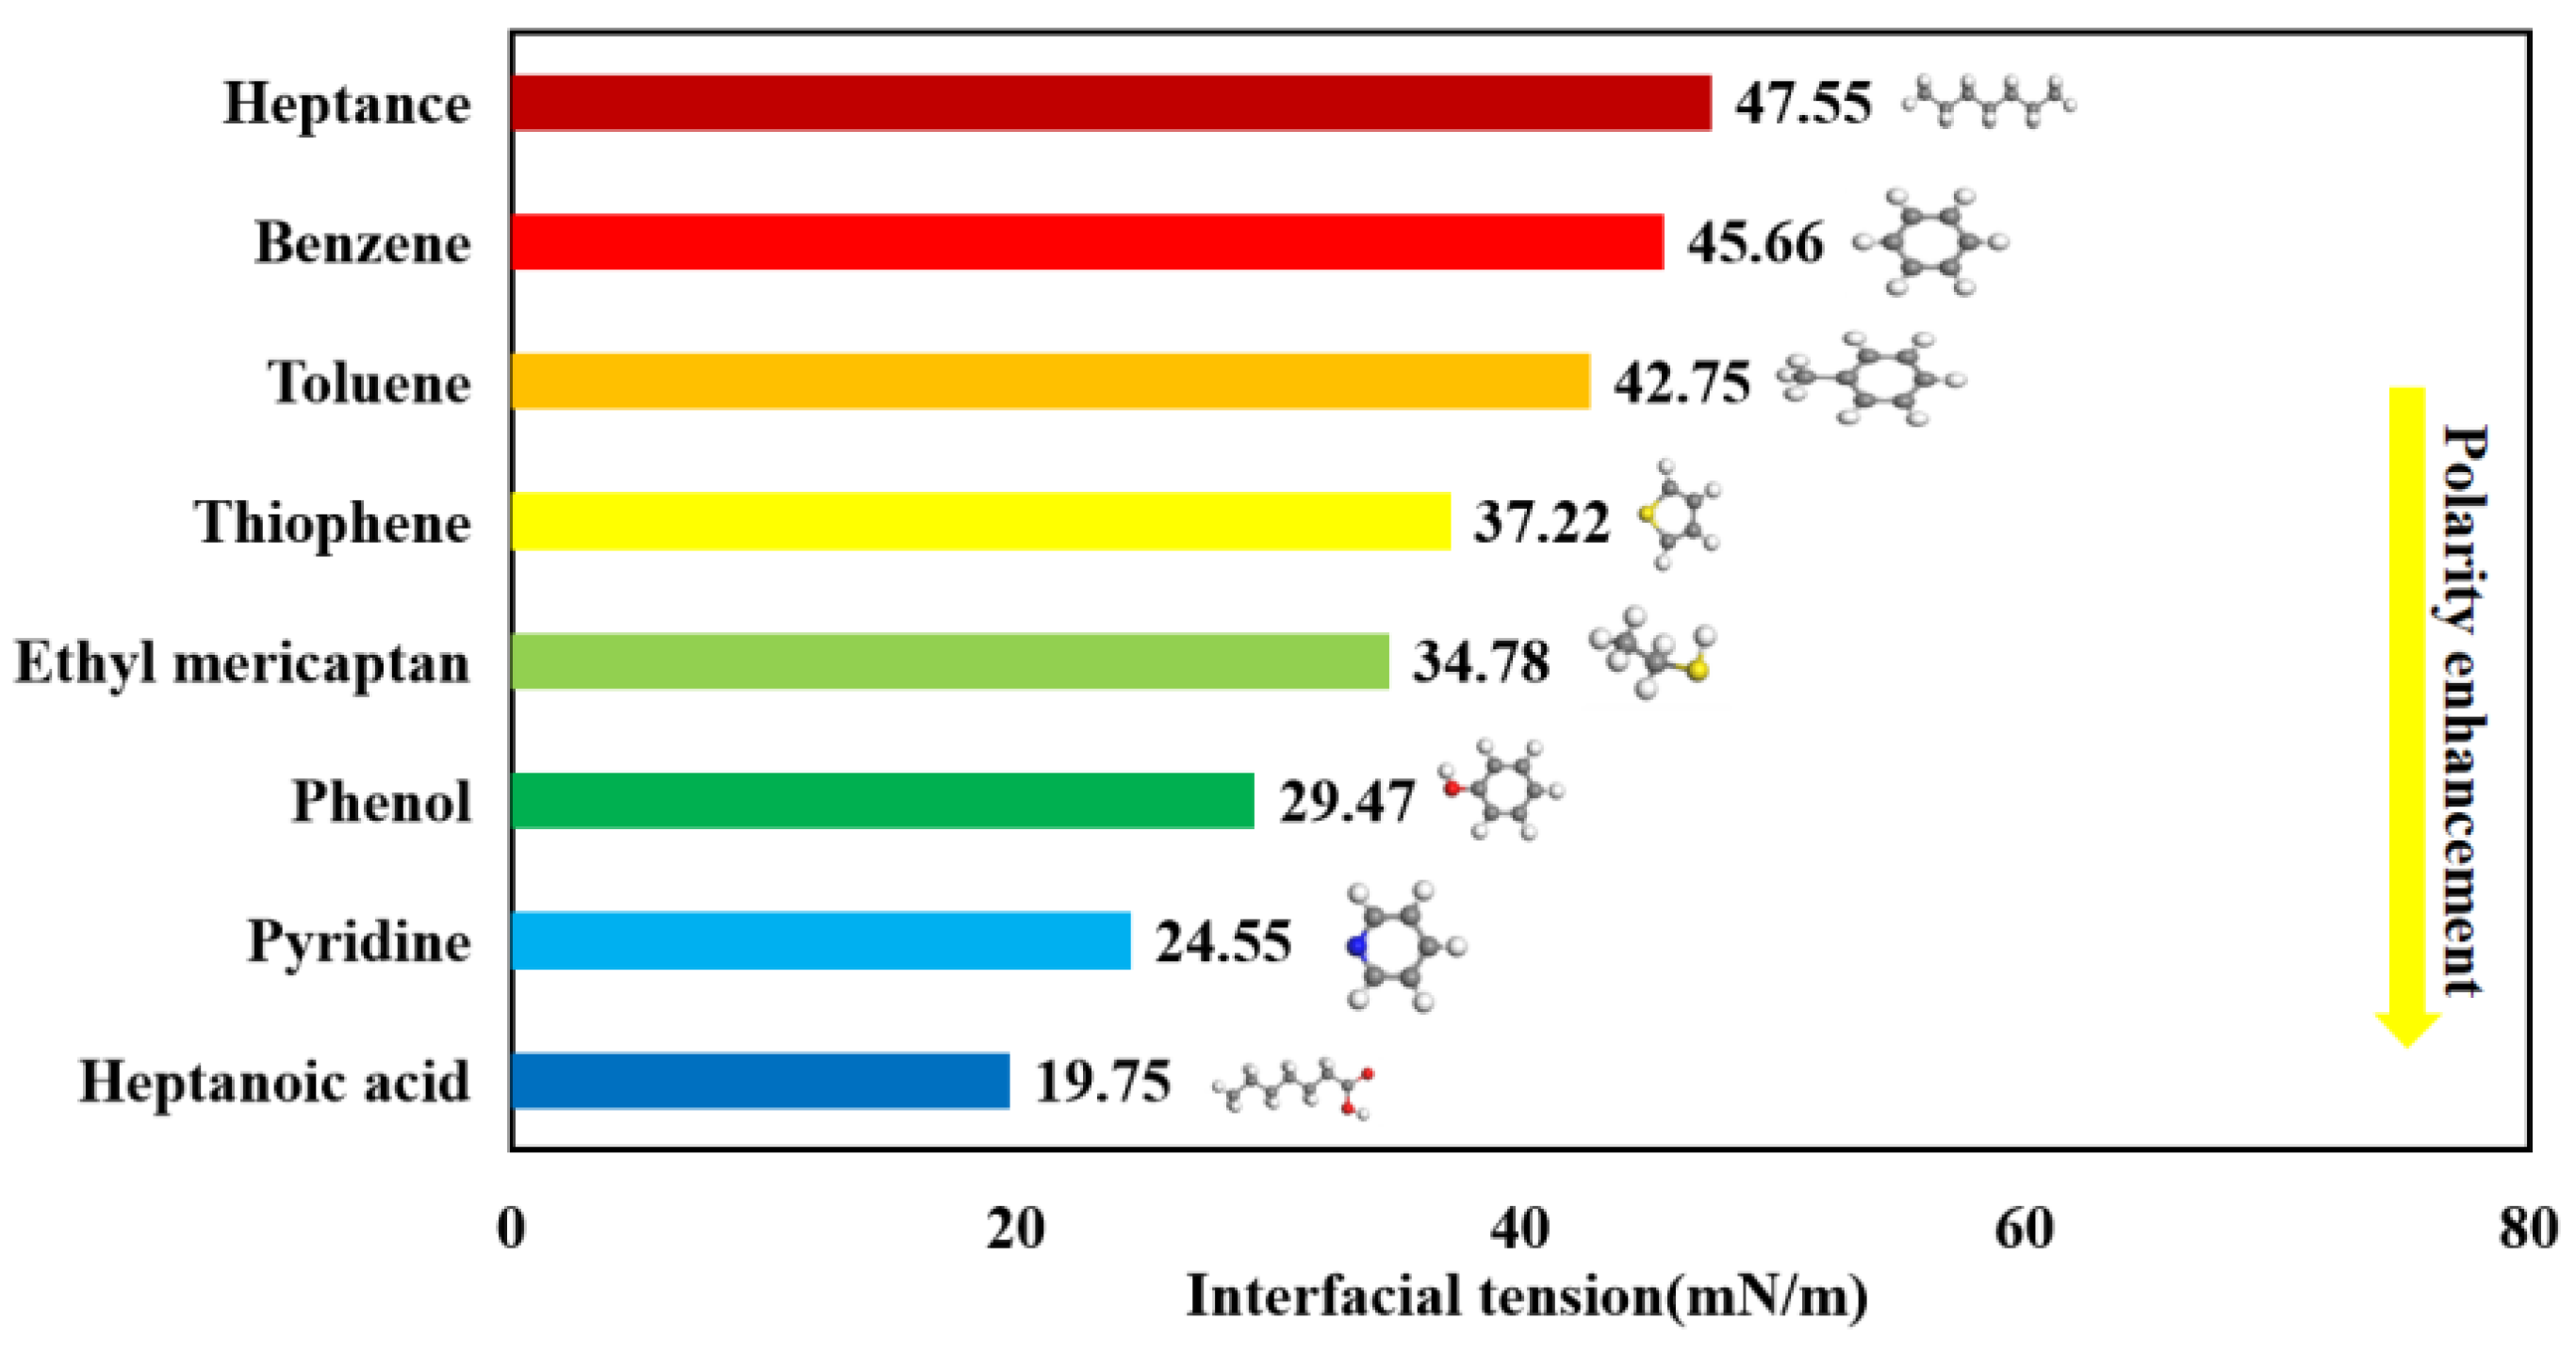
Figure 9.
The correlation between interfacial tension and dipole moment in CO2-oil-water interfacial models at molecular equilibrium is examined.
Figure 9.
The correlation between interfacial tension and dipole moment in CO2-oil-water interfacial models at molecular equilibrium is examined.
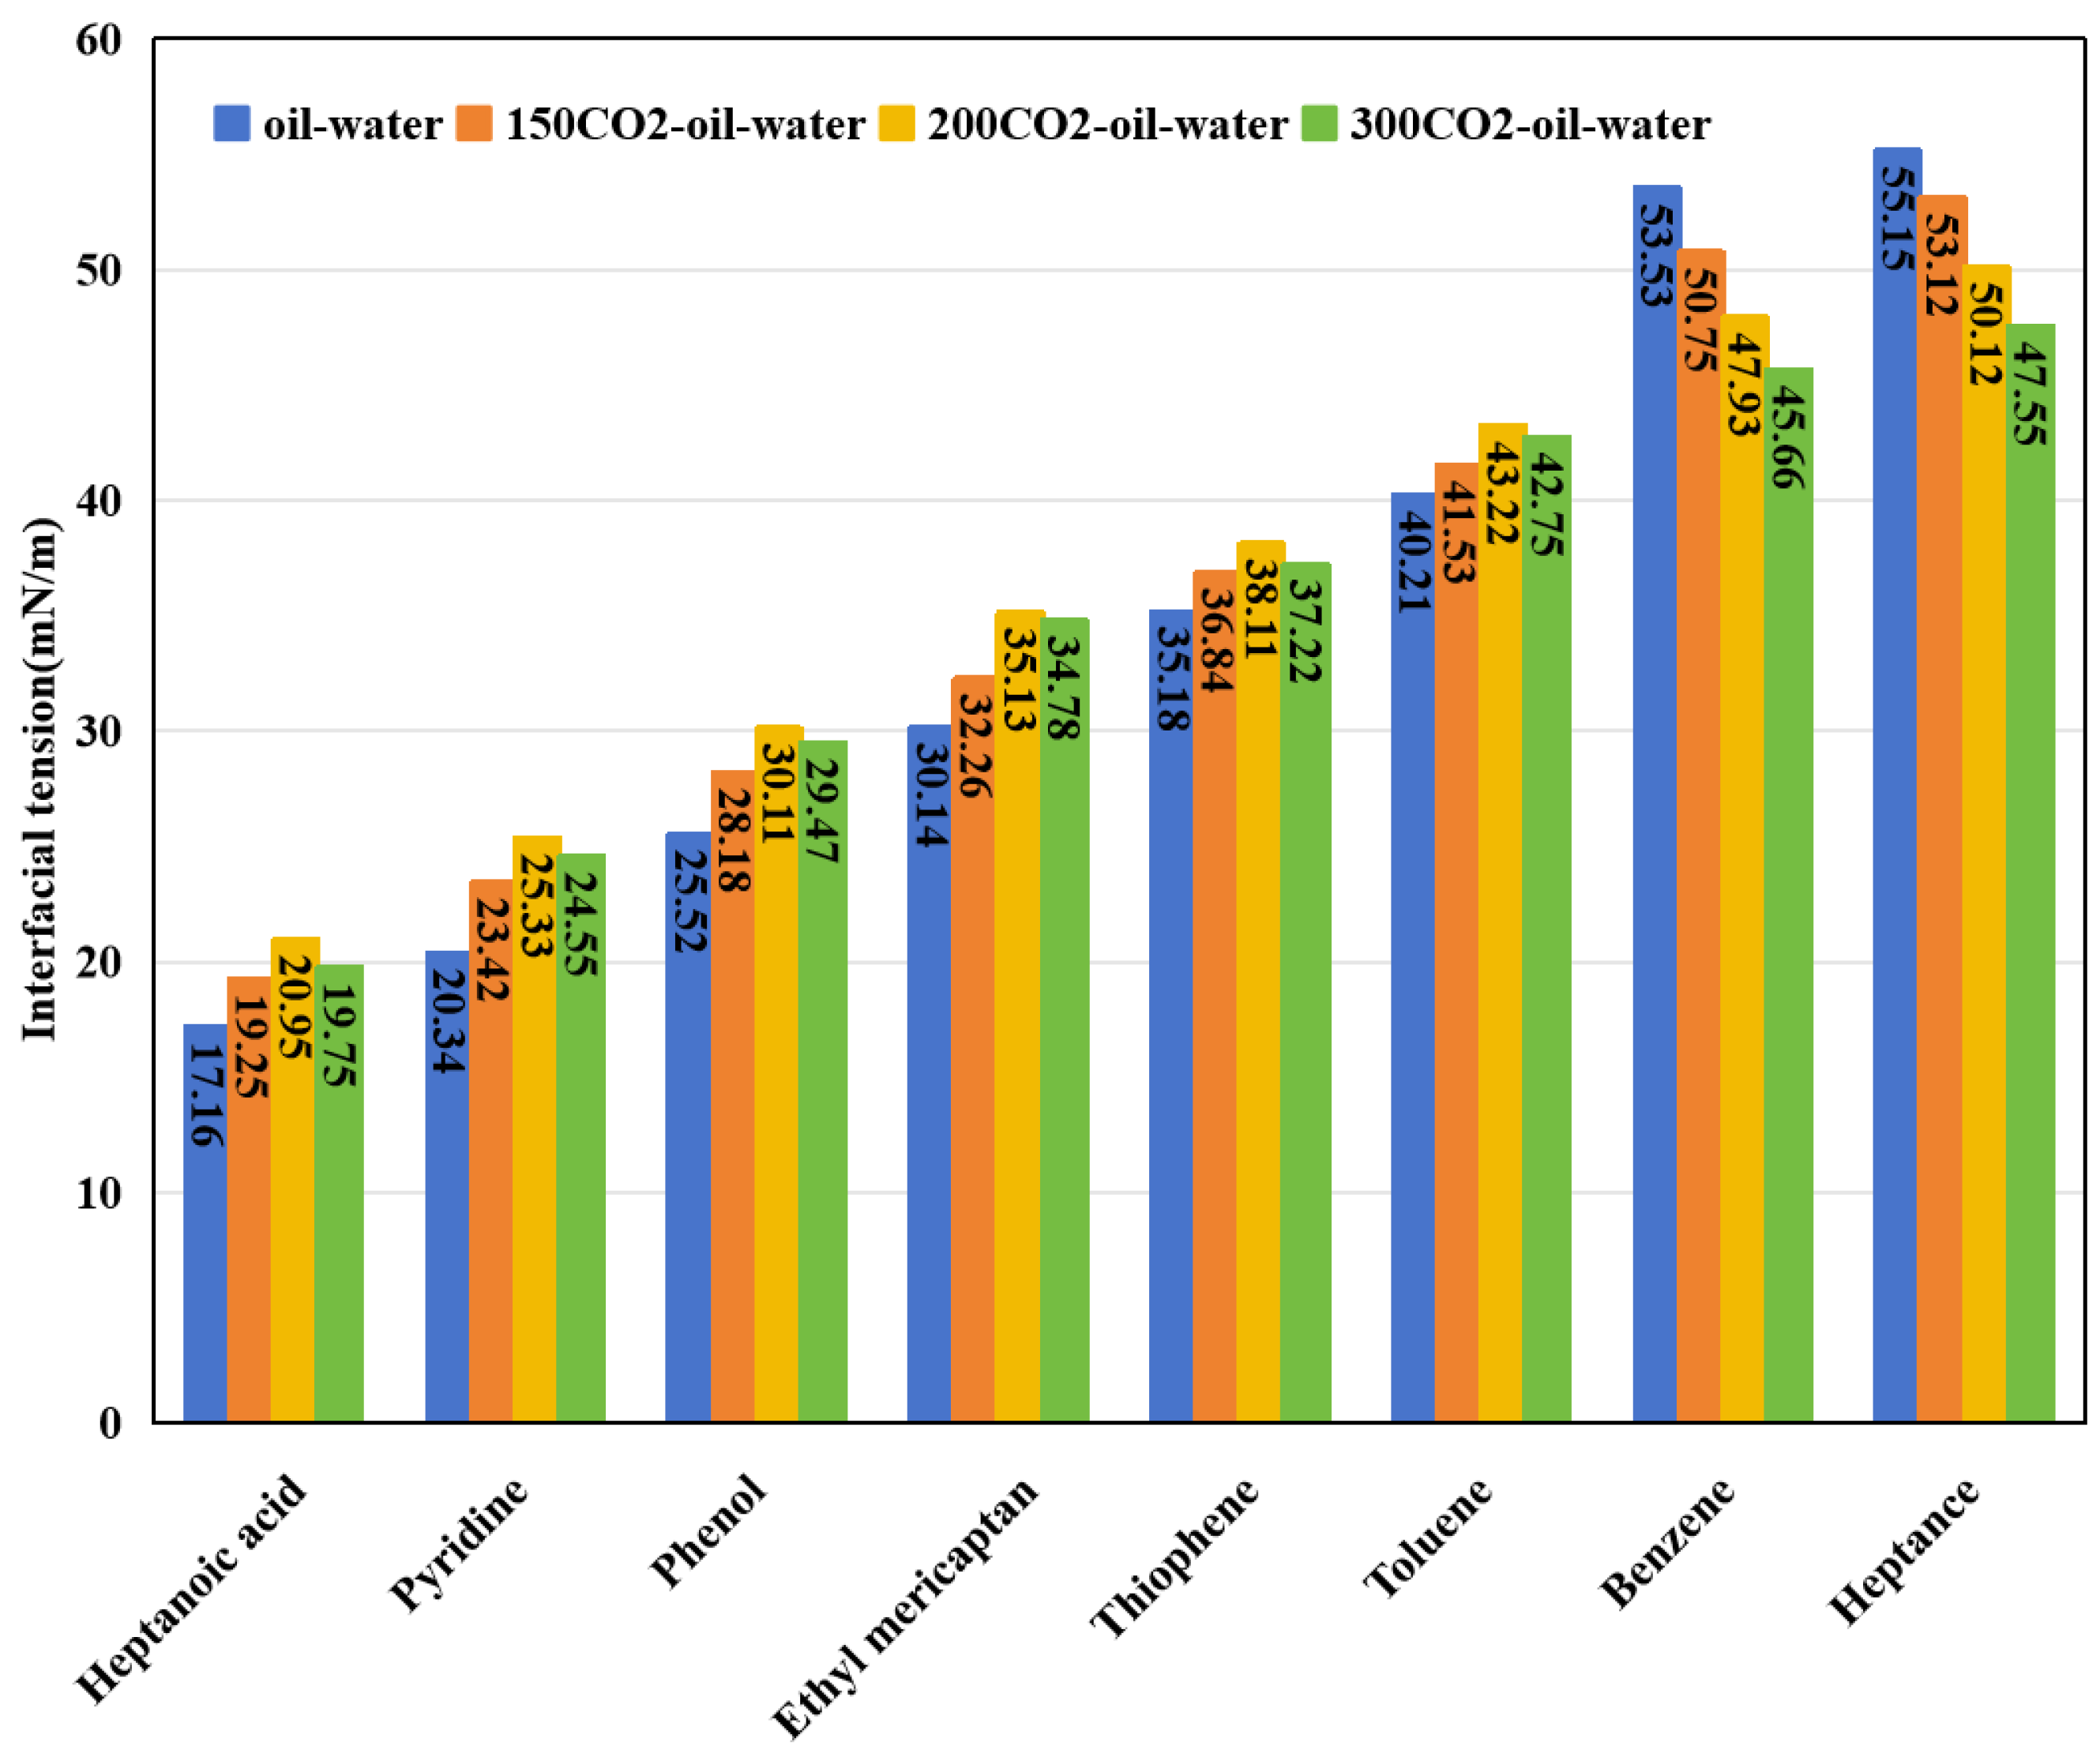
Figure 10.
An assessment of the correlation between IFT and dipole moment conducted using eight distinct oil-water interfacial systems at molecular equilibrium.
Figure 10.
An assessment of the correlation between IFT and dipole moment conducted using eight distinct oil-water interfacial systems at molecular equilibrium.
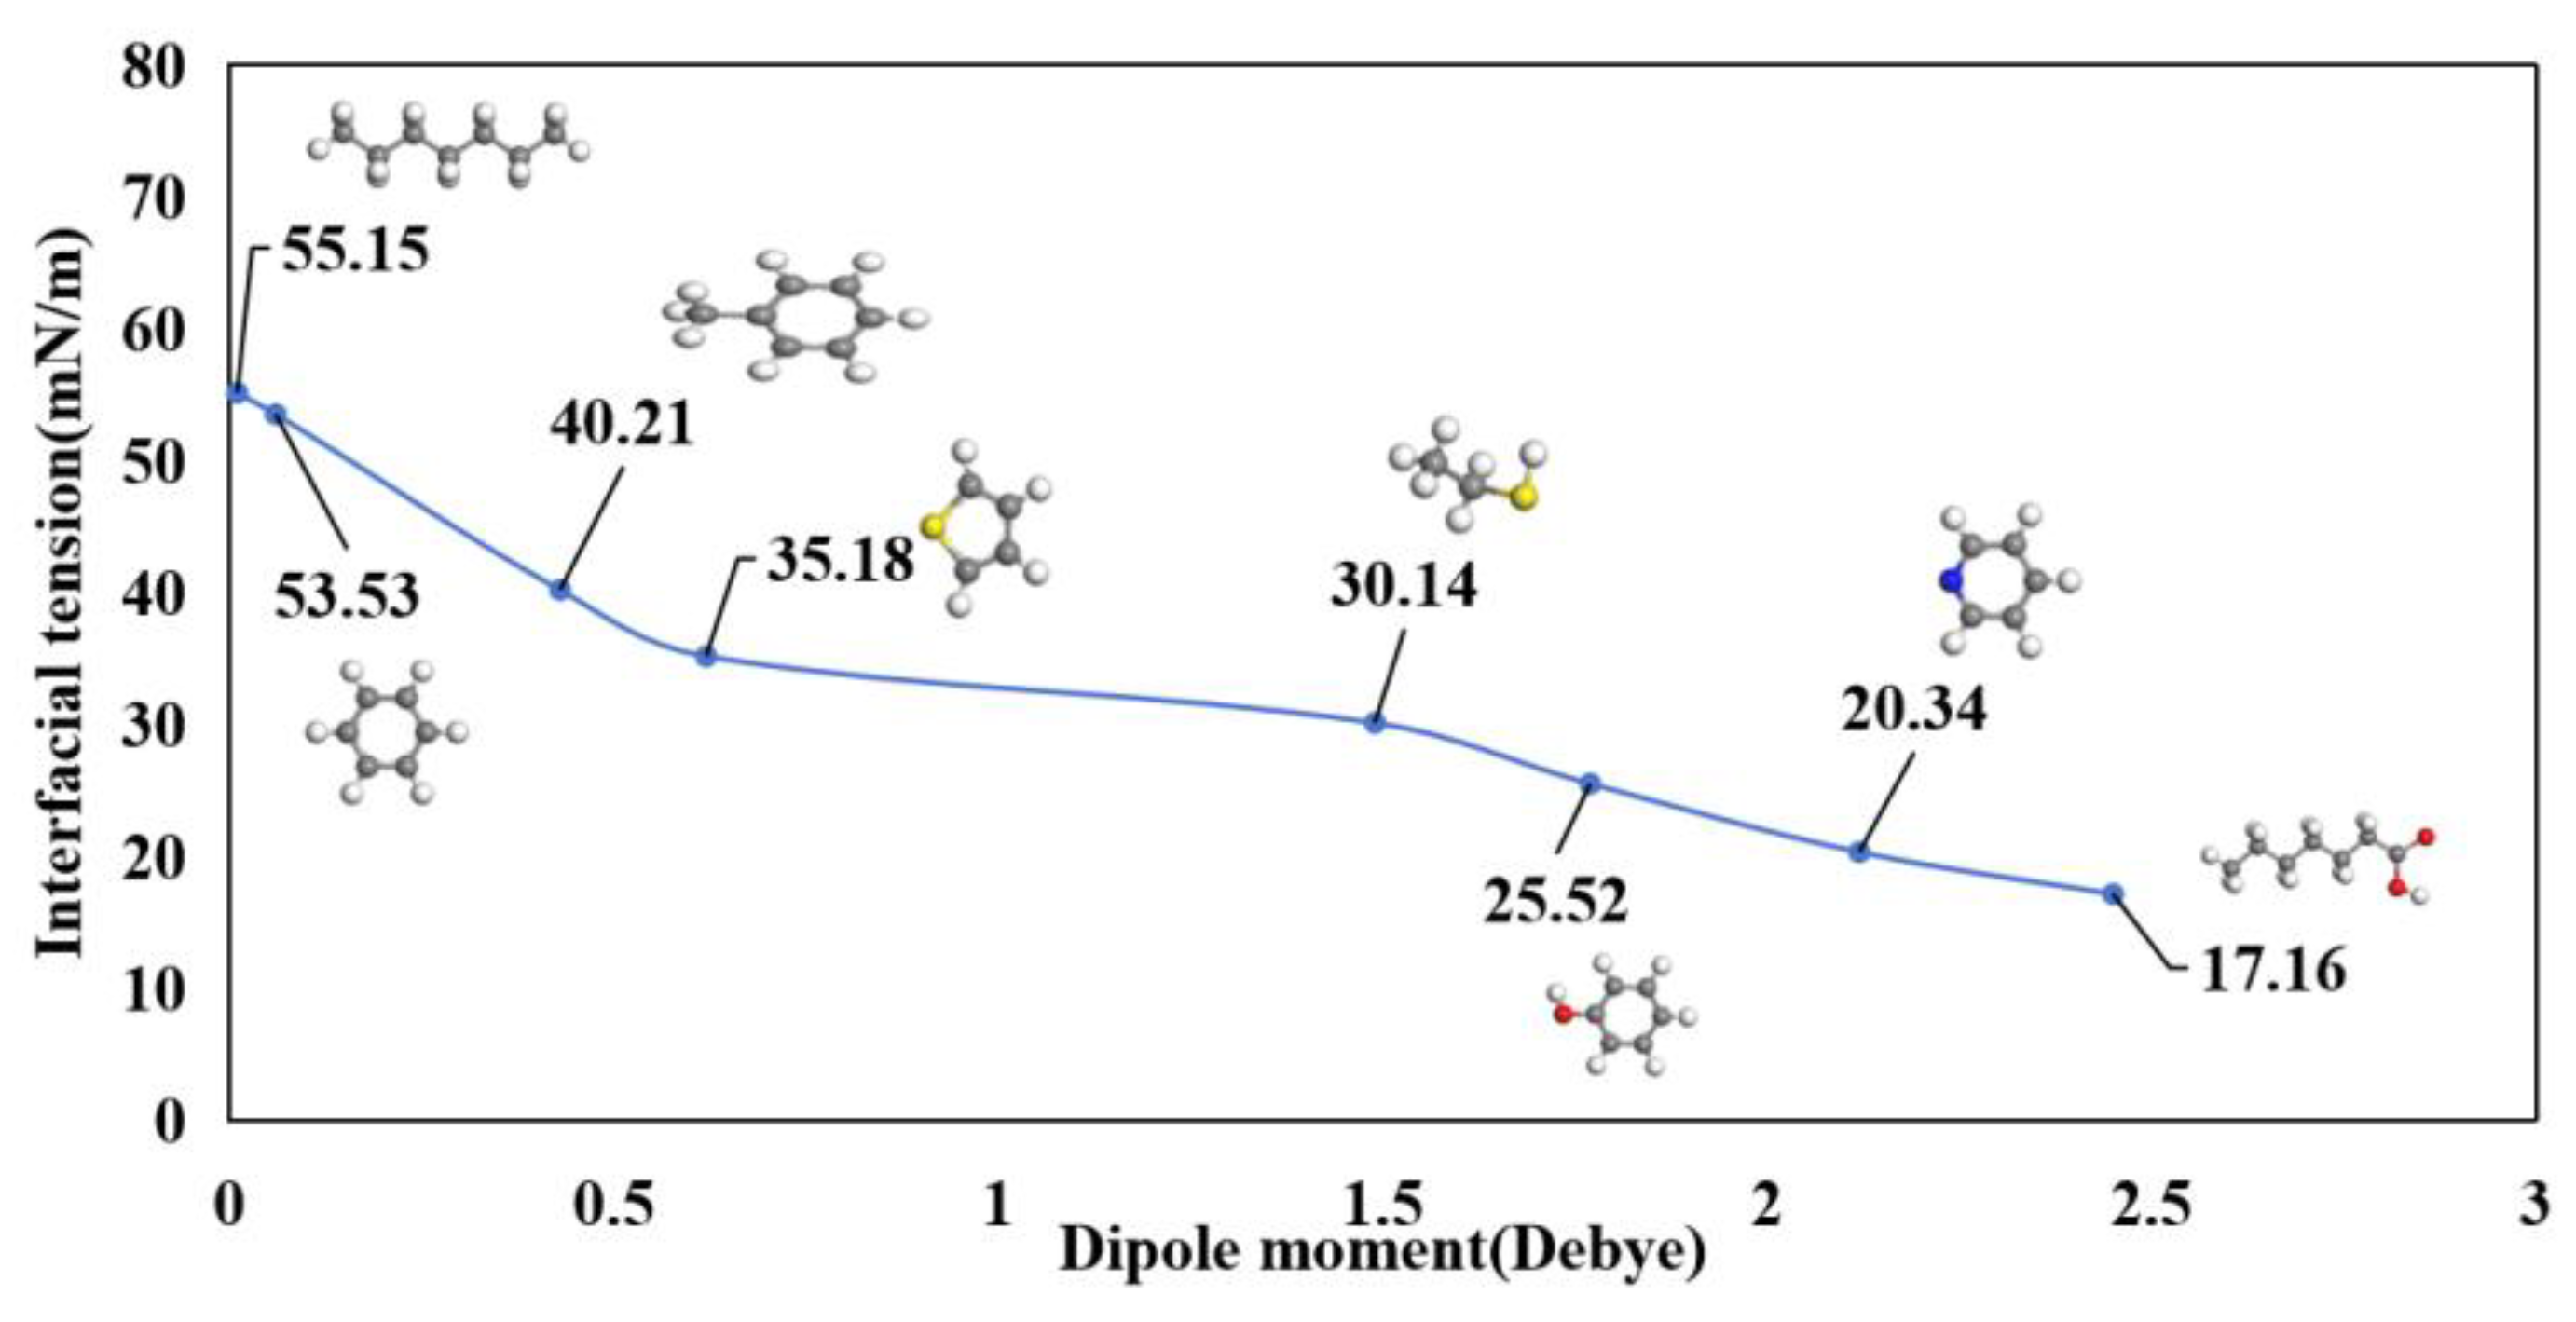
Figure 11.
An assessment of the correlation between IFT and dipole moment conducted using eight distinct 150CO2-oil-water interfacial systems at molecular equilibrium.
Figure 11.
An assessment of the correlation between IFT and dipole moment conducted using eight distinct 150CO2-oil-water interfacial systems at molecular equilibrium.
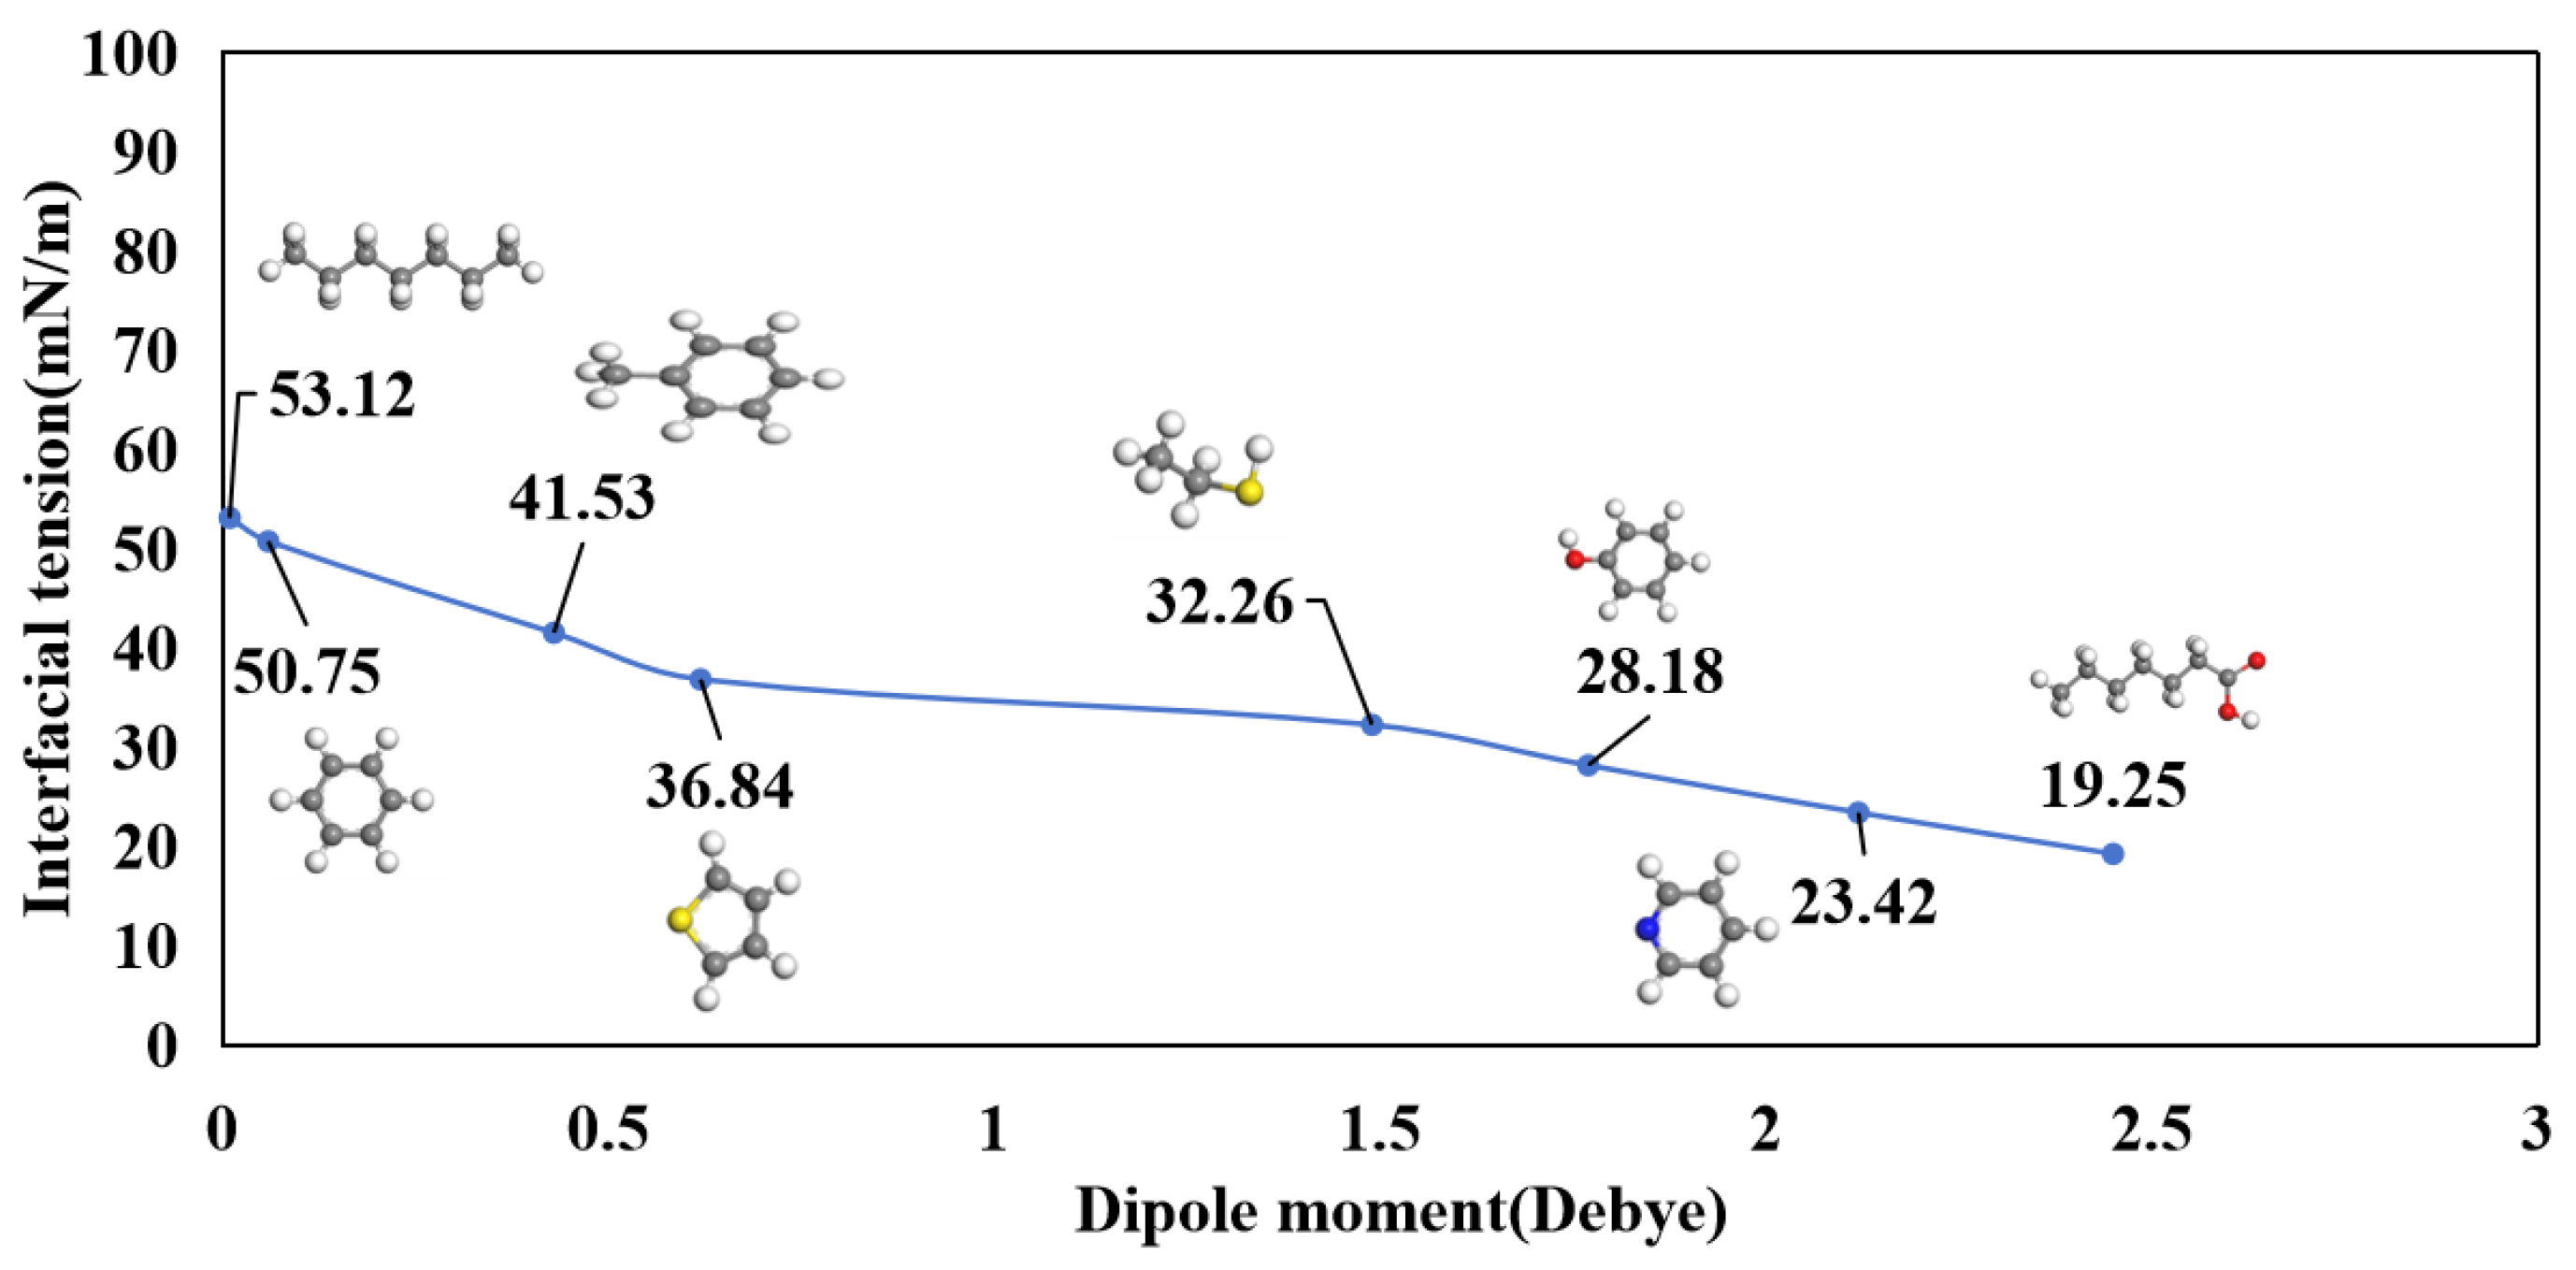
Figure 12.
An assessment of the correlation between IFT and dipole moment conducted using eight distinct 200CO2-oil-water interfacial systems at molecular equilibrium.
Figure 12.
An assessment of the correlation between IFT and dipole moment conducted using eight distinct 200CO2-oil-water interfacial systems at molecular equilibrium.
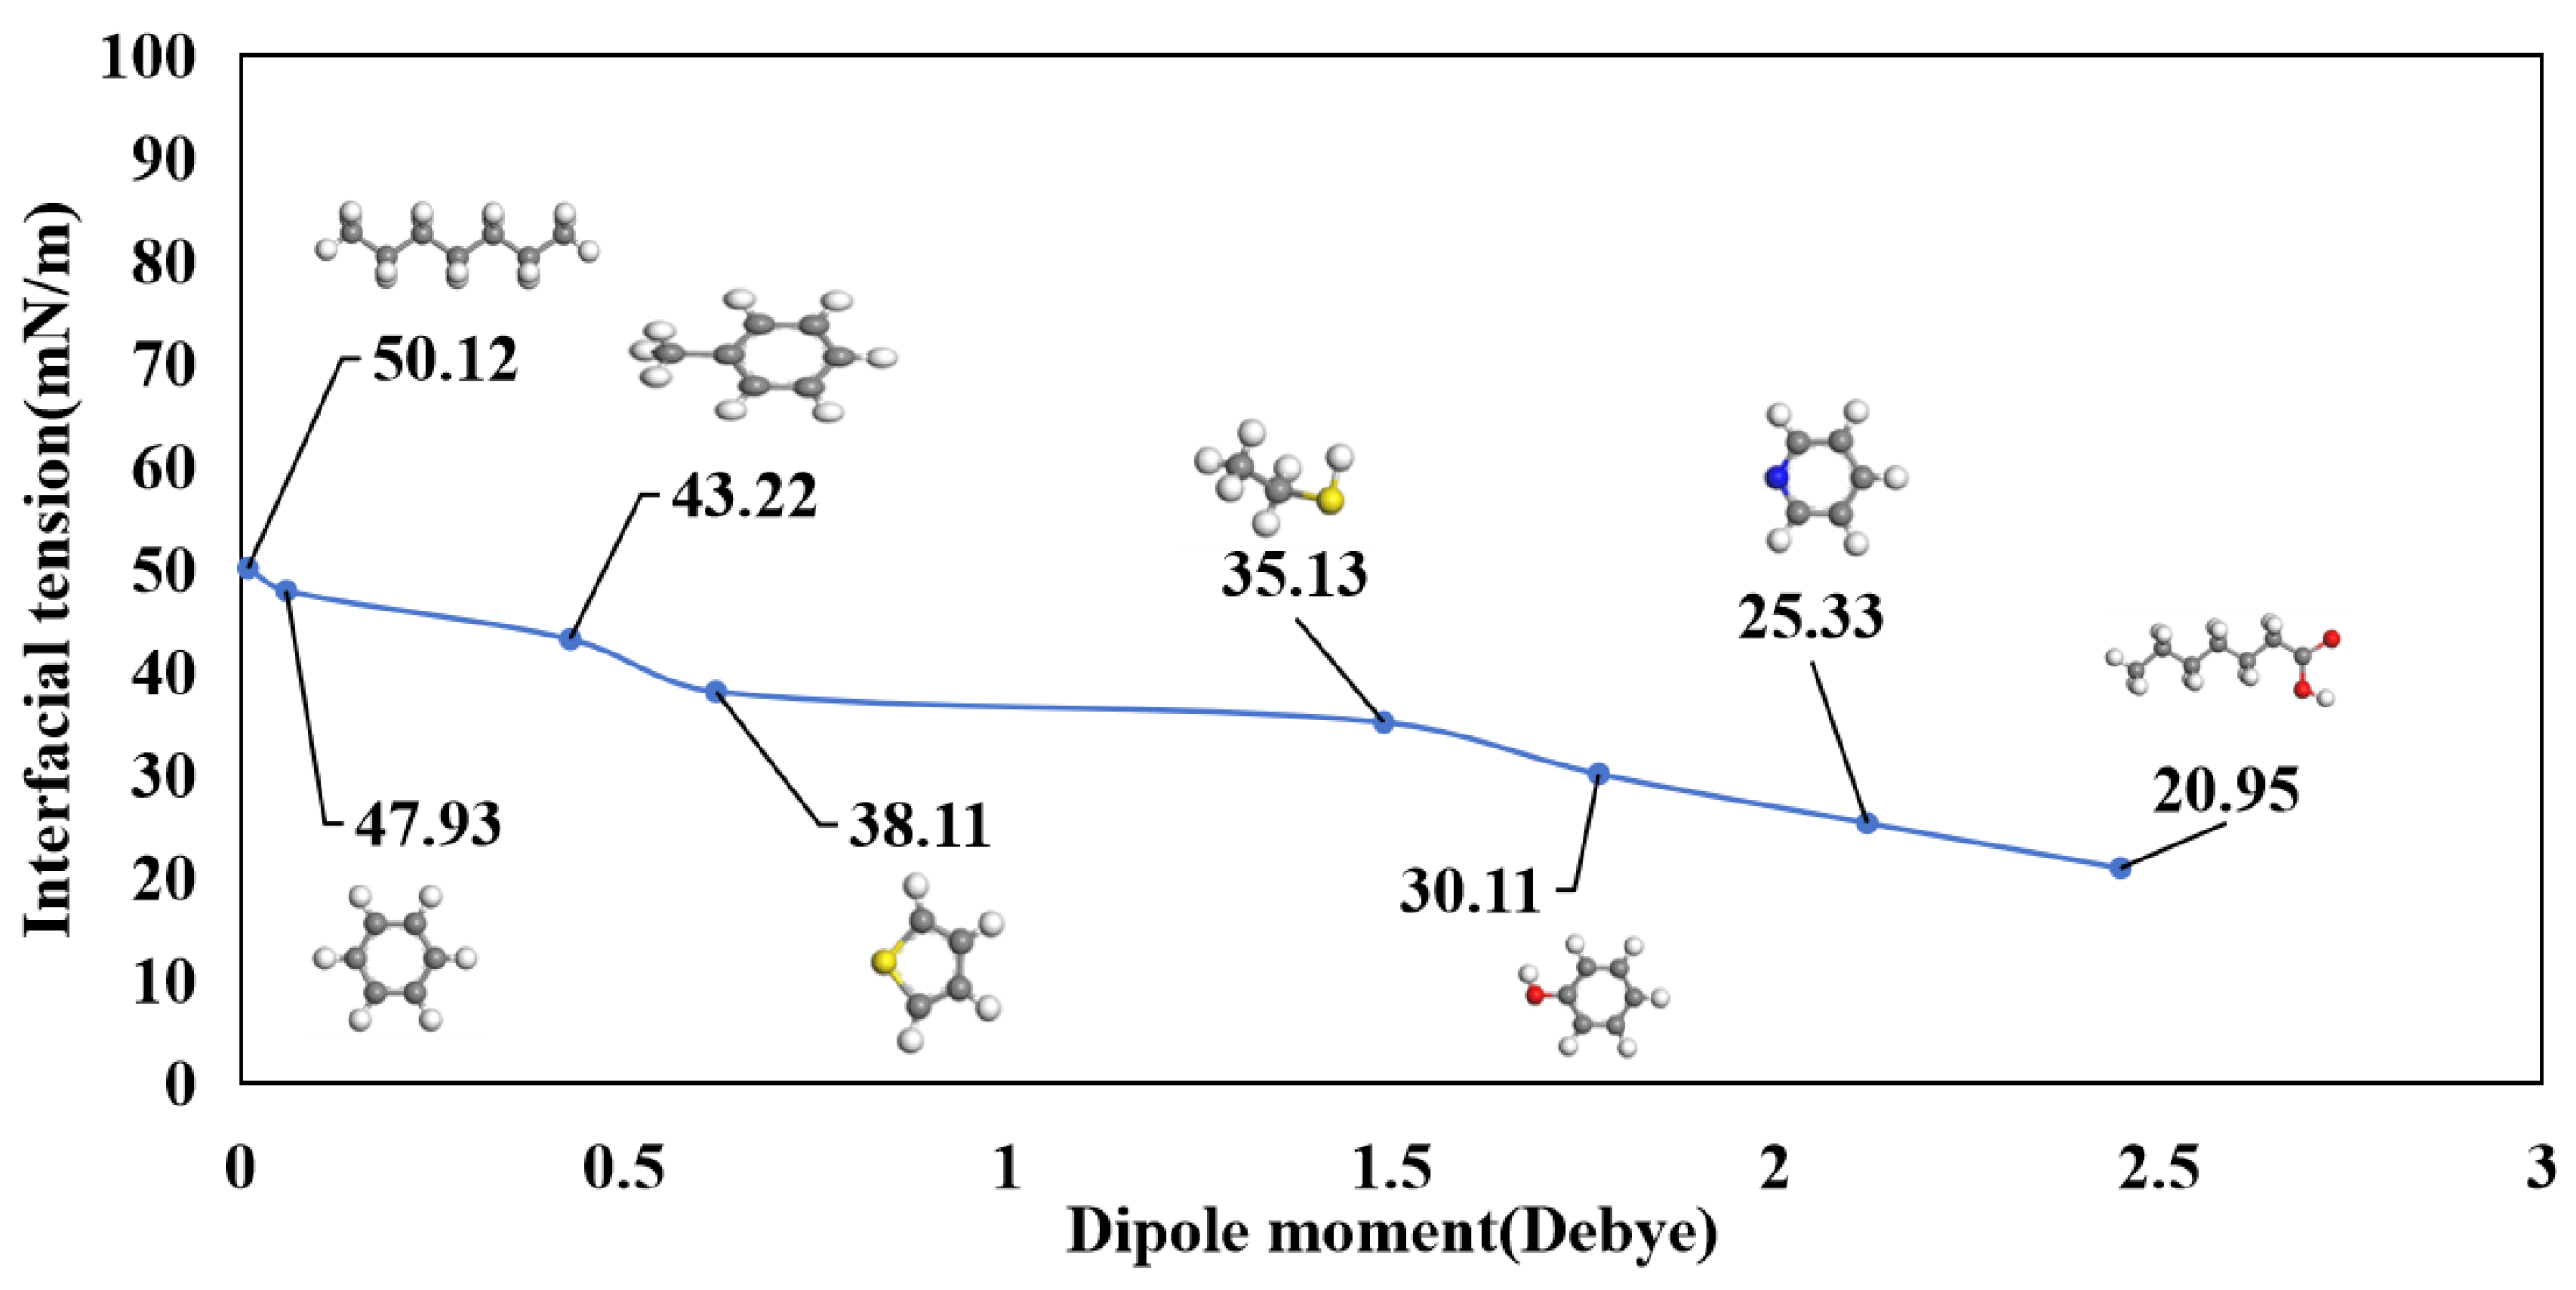
Figure 13.
An assessment of the correlation between IFT and dipole moment conducted using eight distinct 300CO2-oil-water interfacial systems at molecular equilibrium.
Figure 13.
An assessment of the correlation between IFT and dipole moment conducted using eight distinct 300CO2-oil-water interfacial systems at molecular equilibrium.
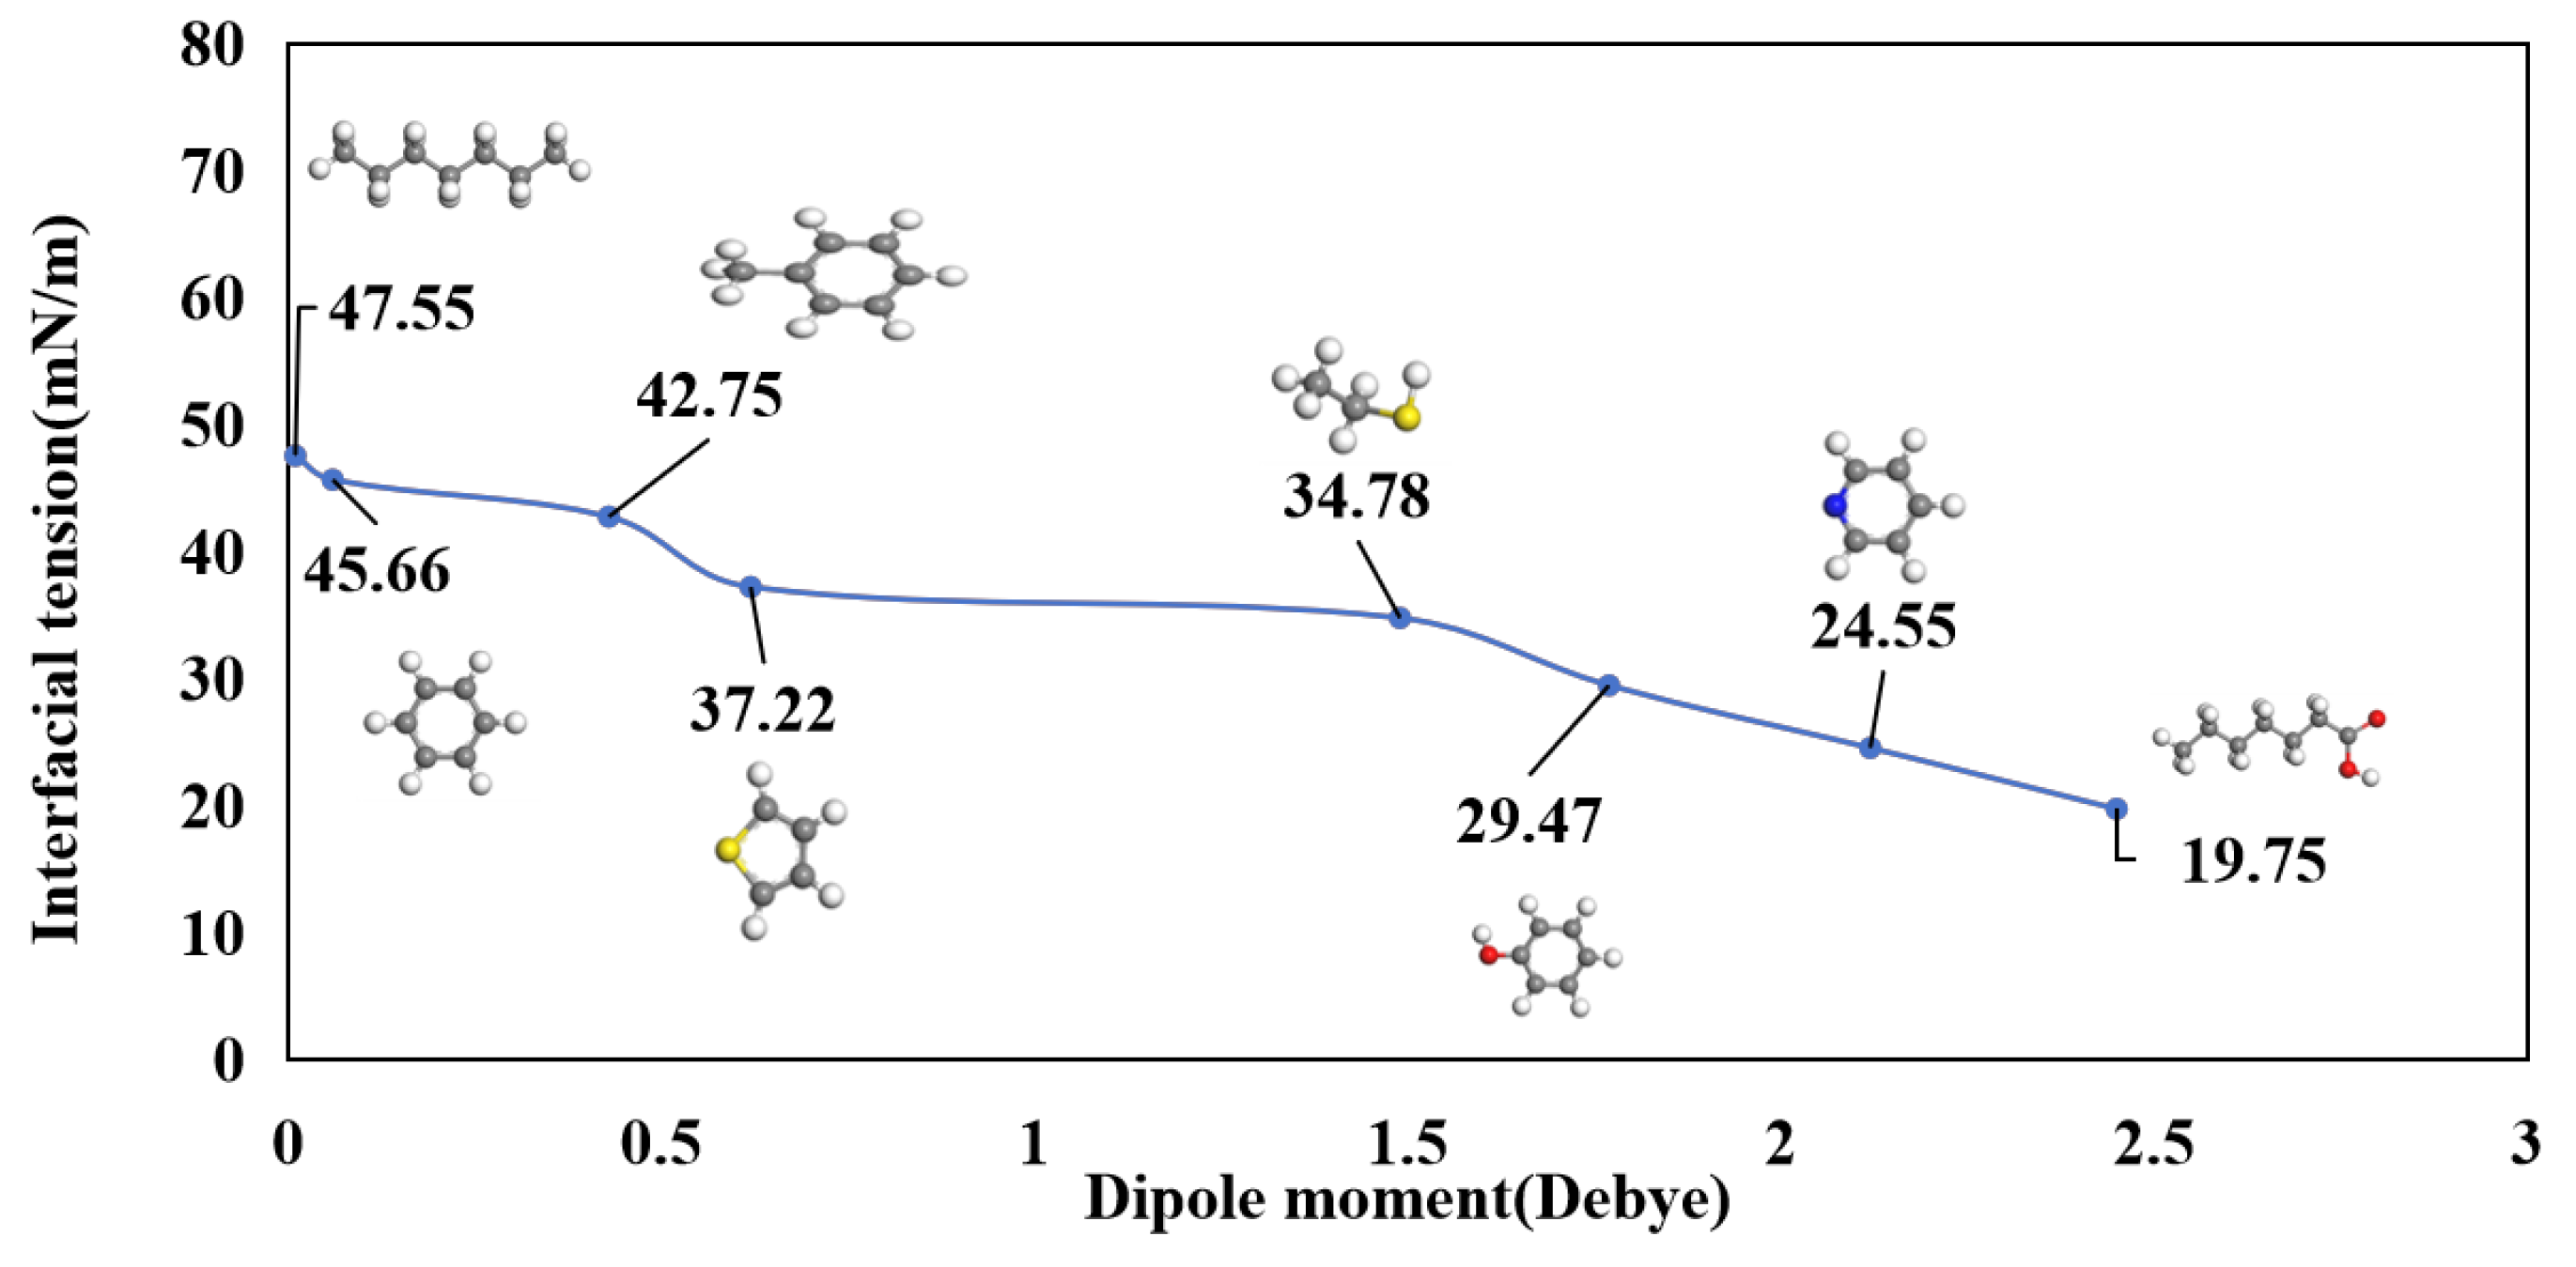
Figure 14.
At equilibrium, polar oil molecules adopt specific orientations at eight different CO2-oil-water interfaces. (These interfaces are comprised of CO2 and water in combination with the following: heptane (a), benzene (b), toluene (c), thiophene (d), ethyl mercaptan (e), phenol (f), pyridine (g), and heptanoic acid (h).).
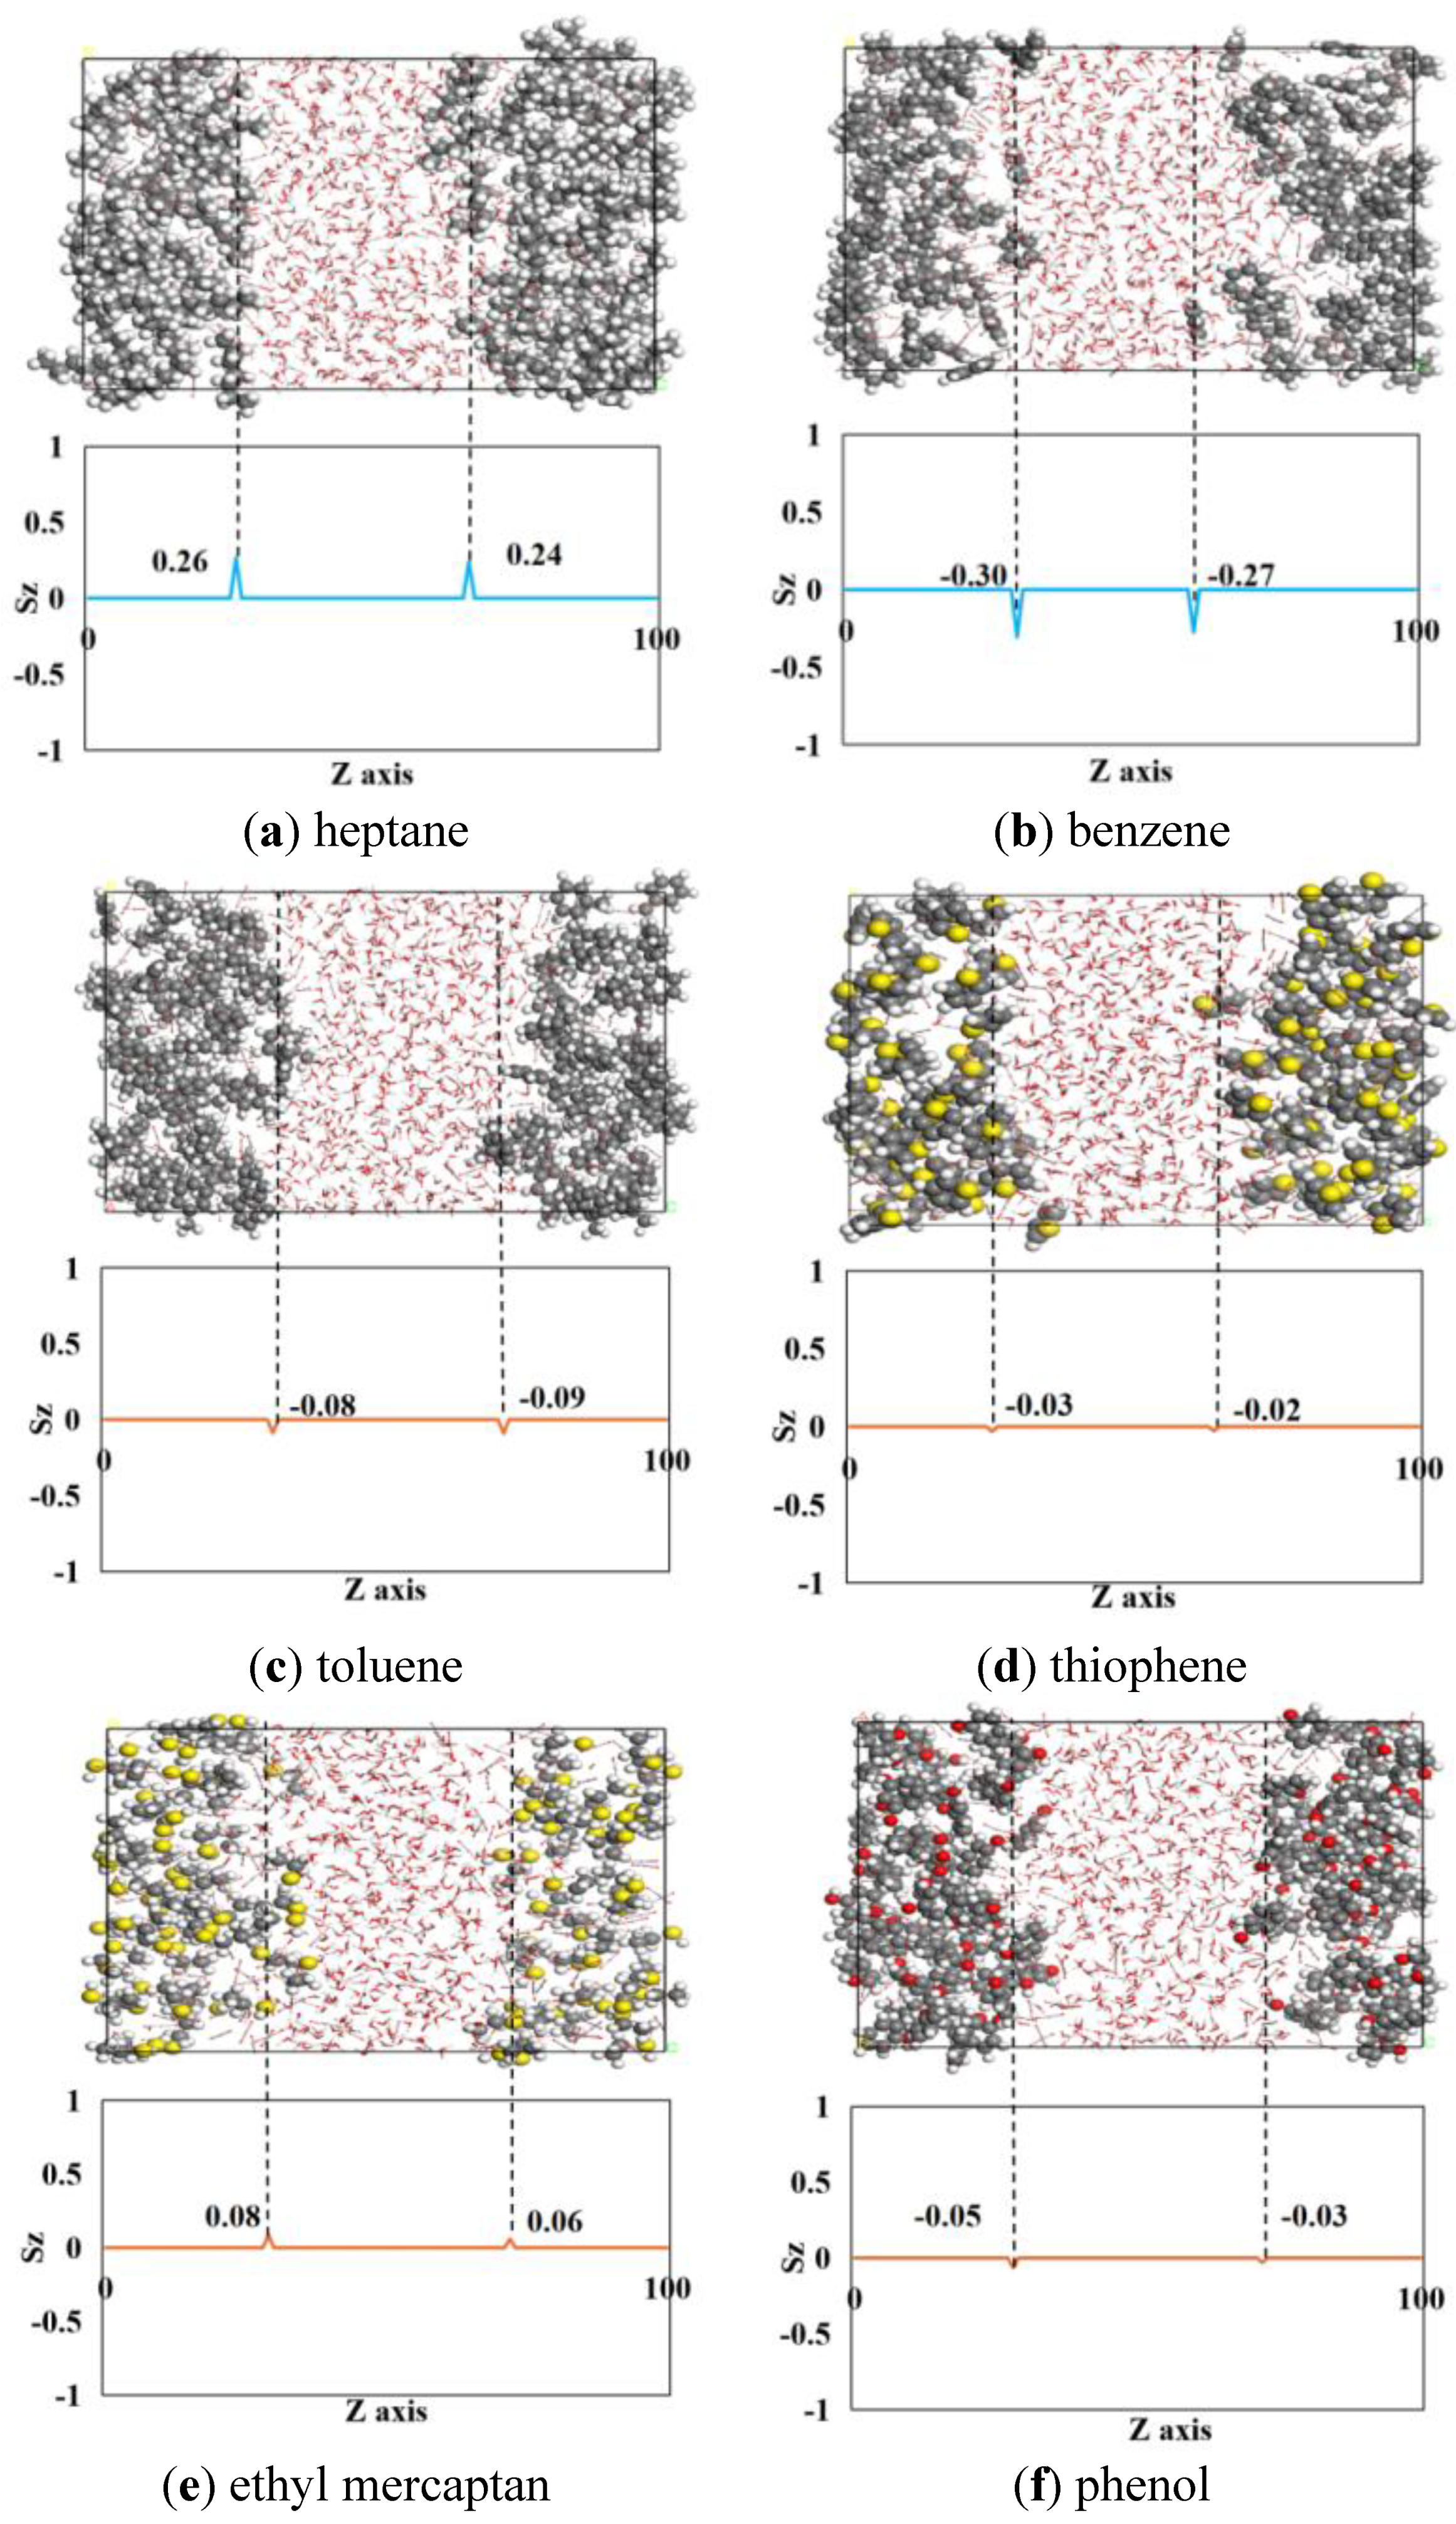
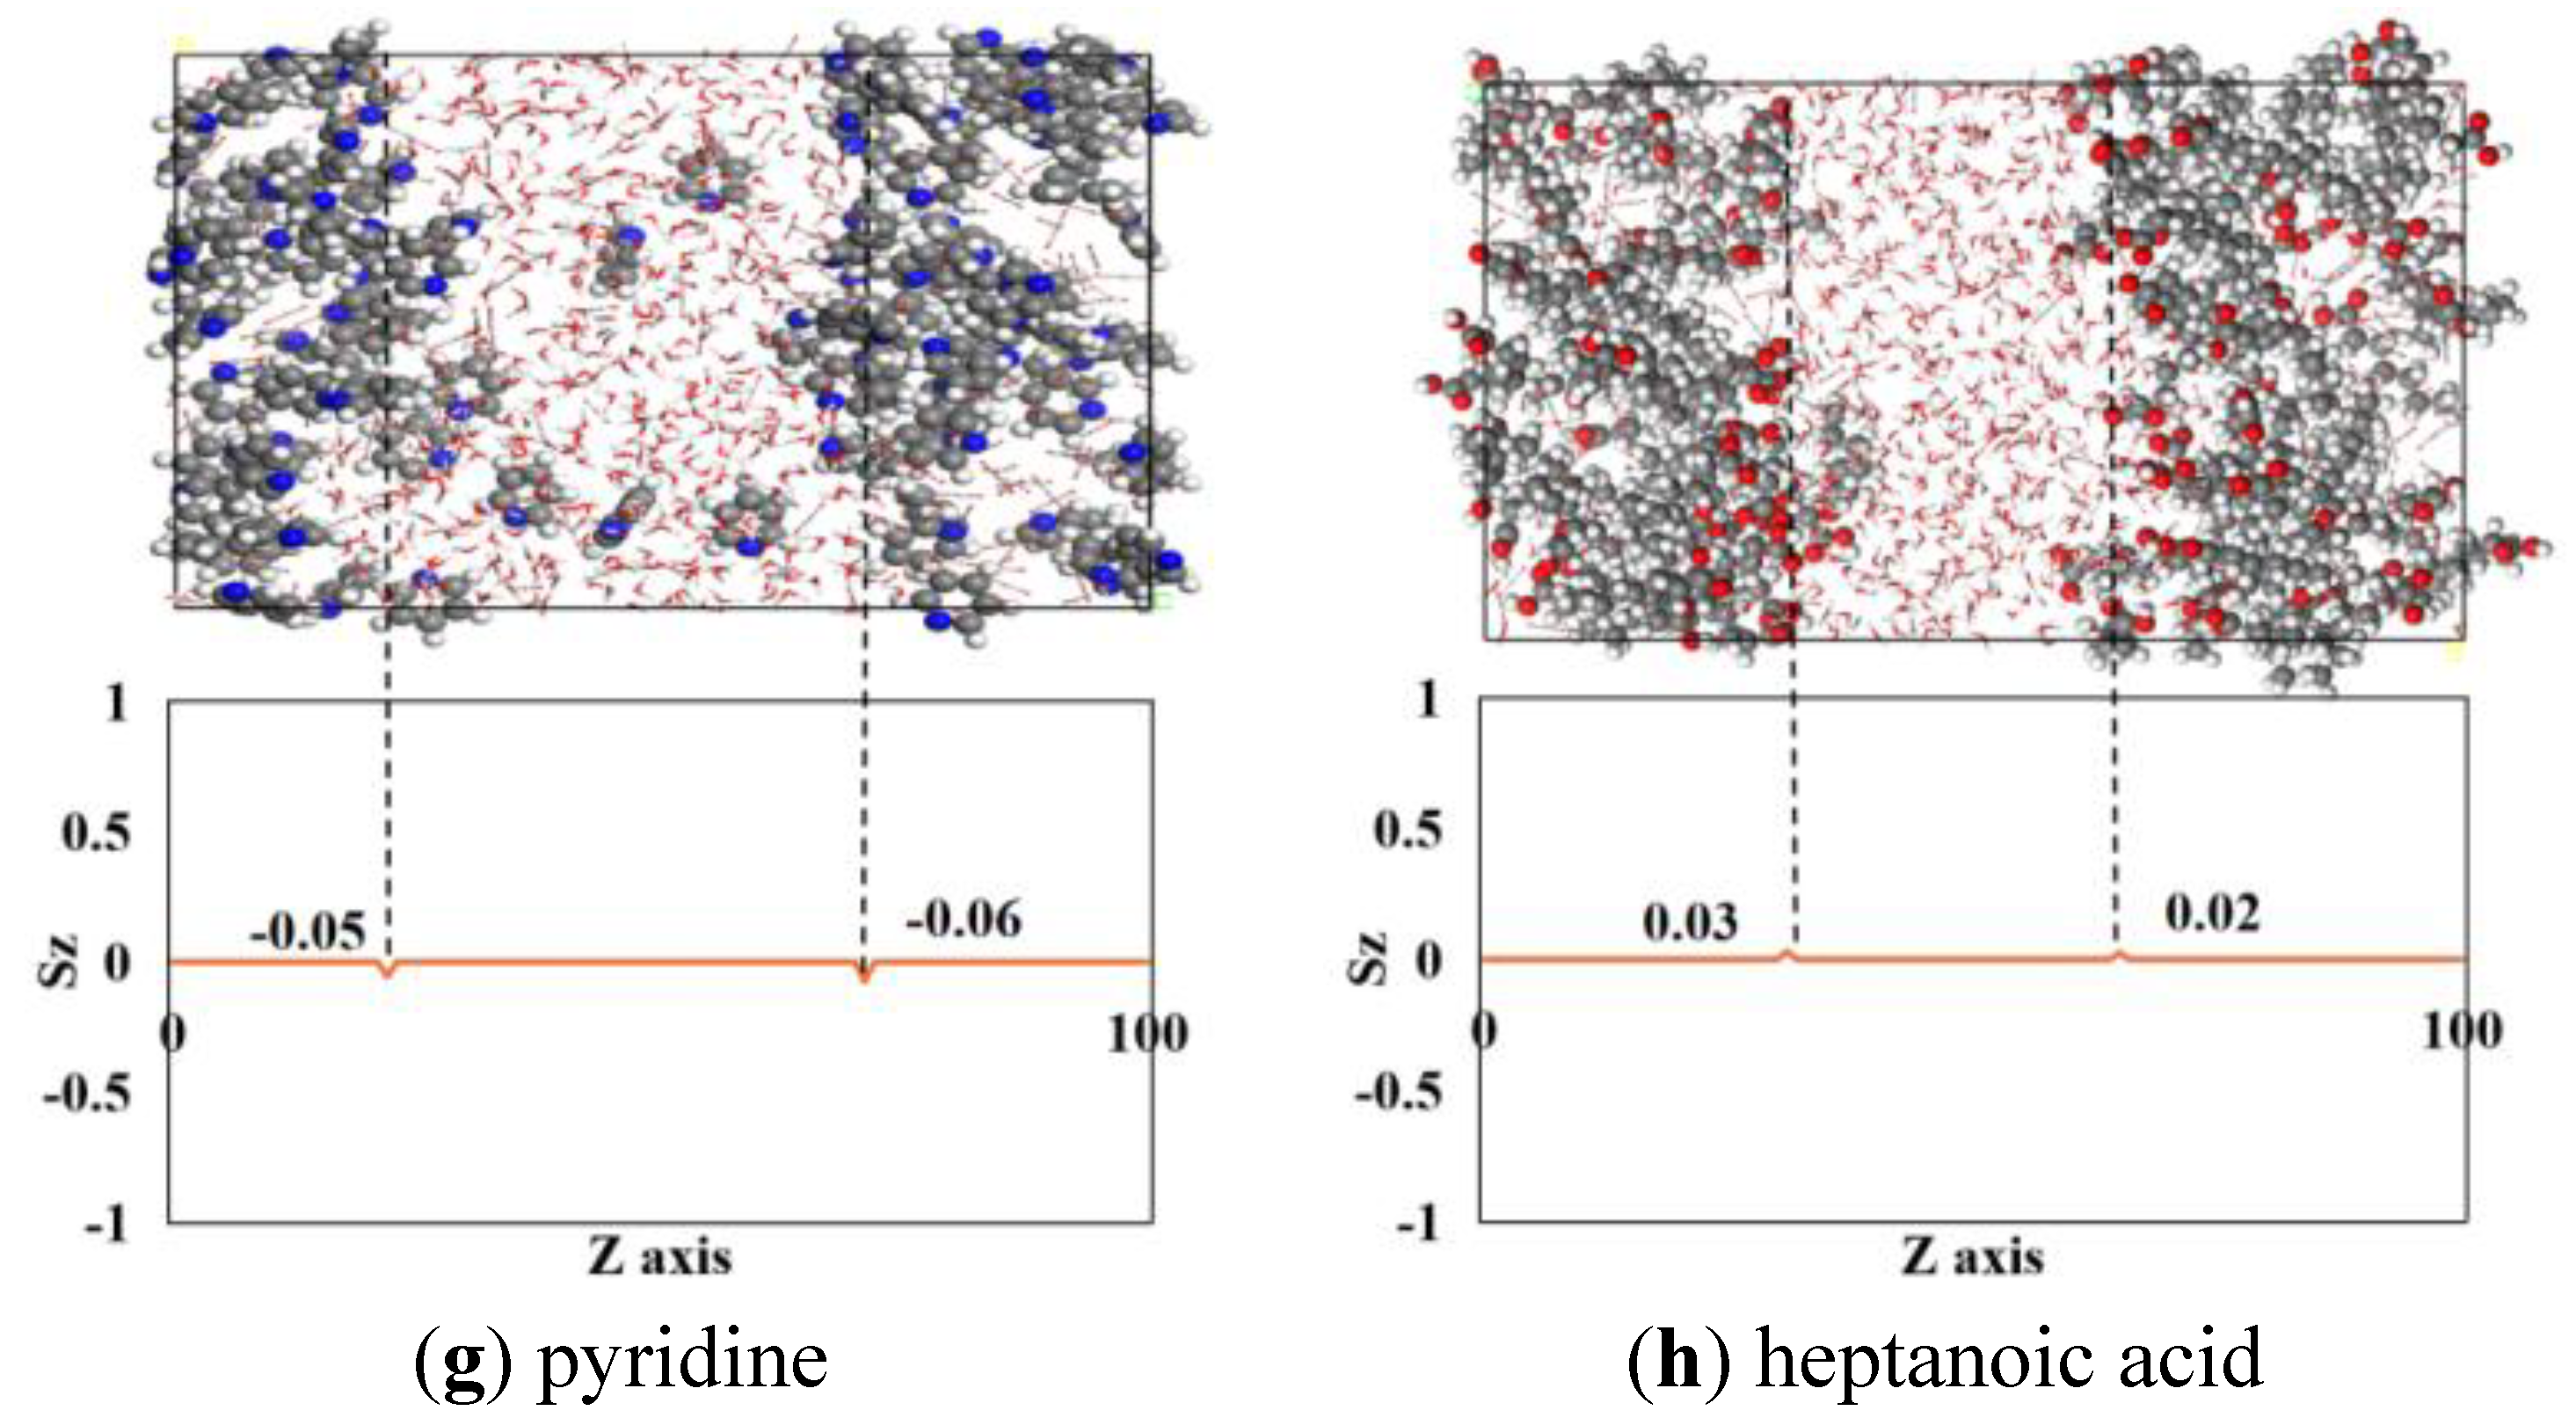
Figure 15.
Interfacial interaction energies for eight oil-water models.
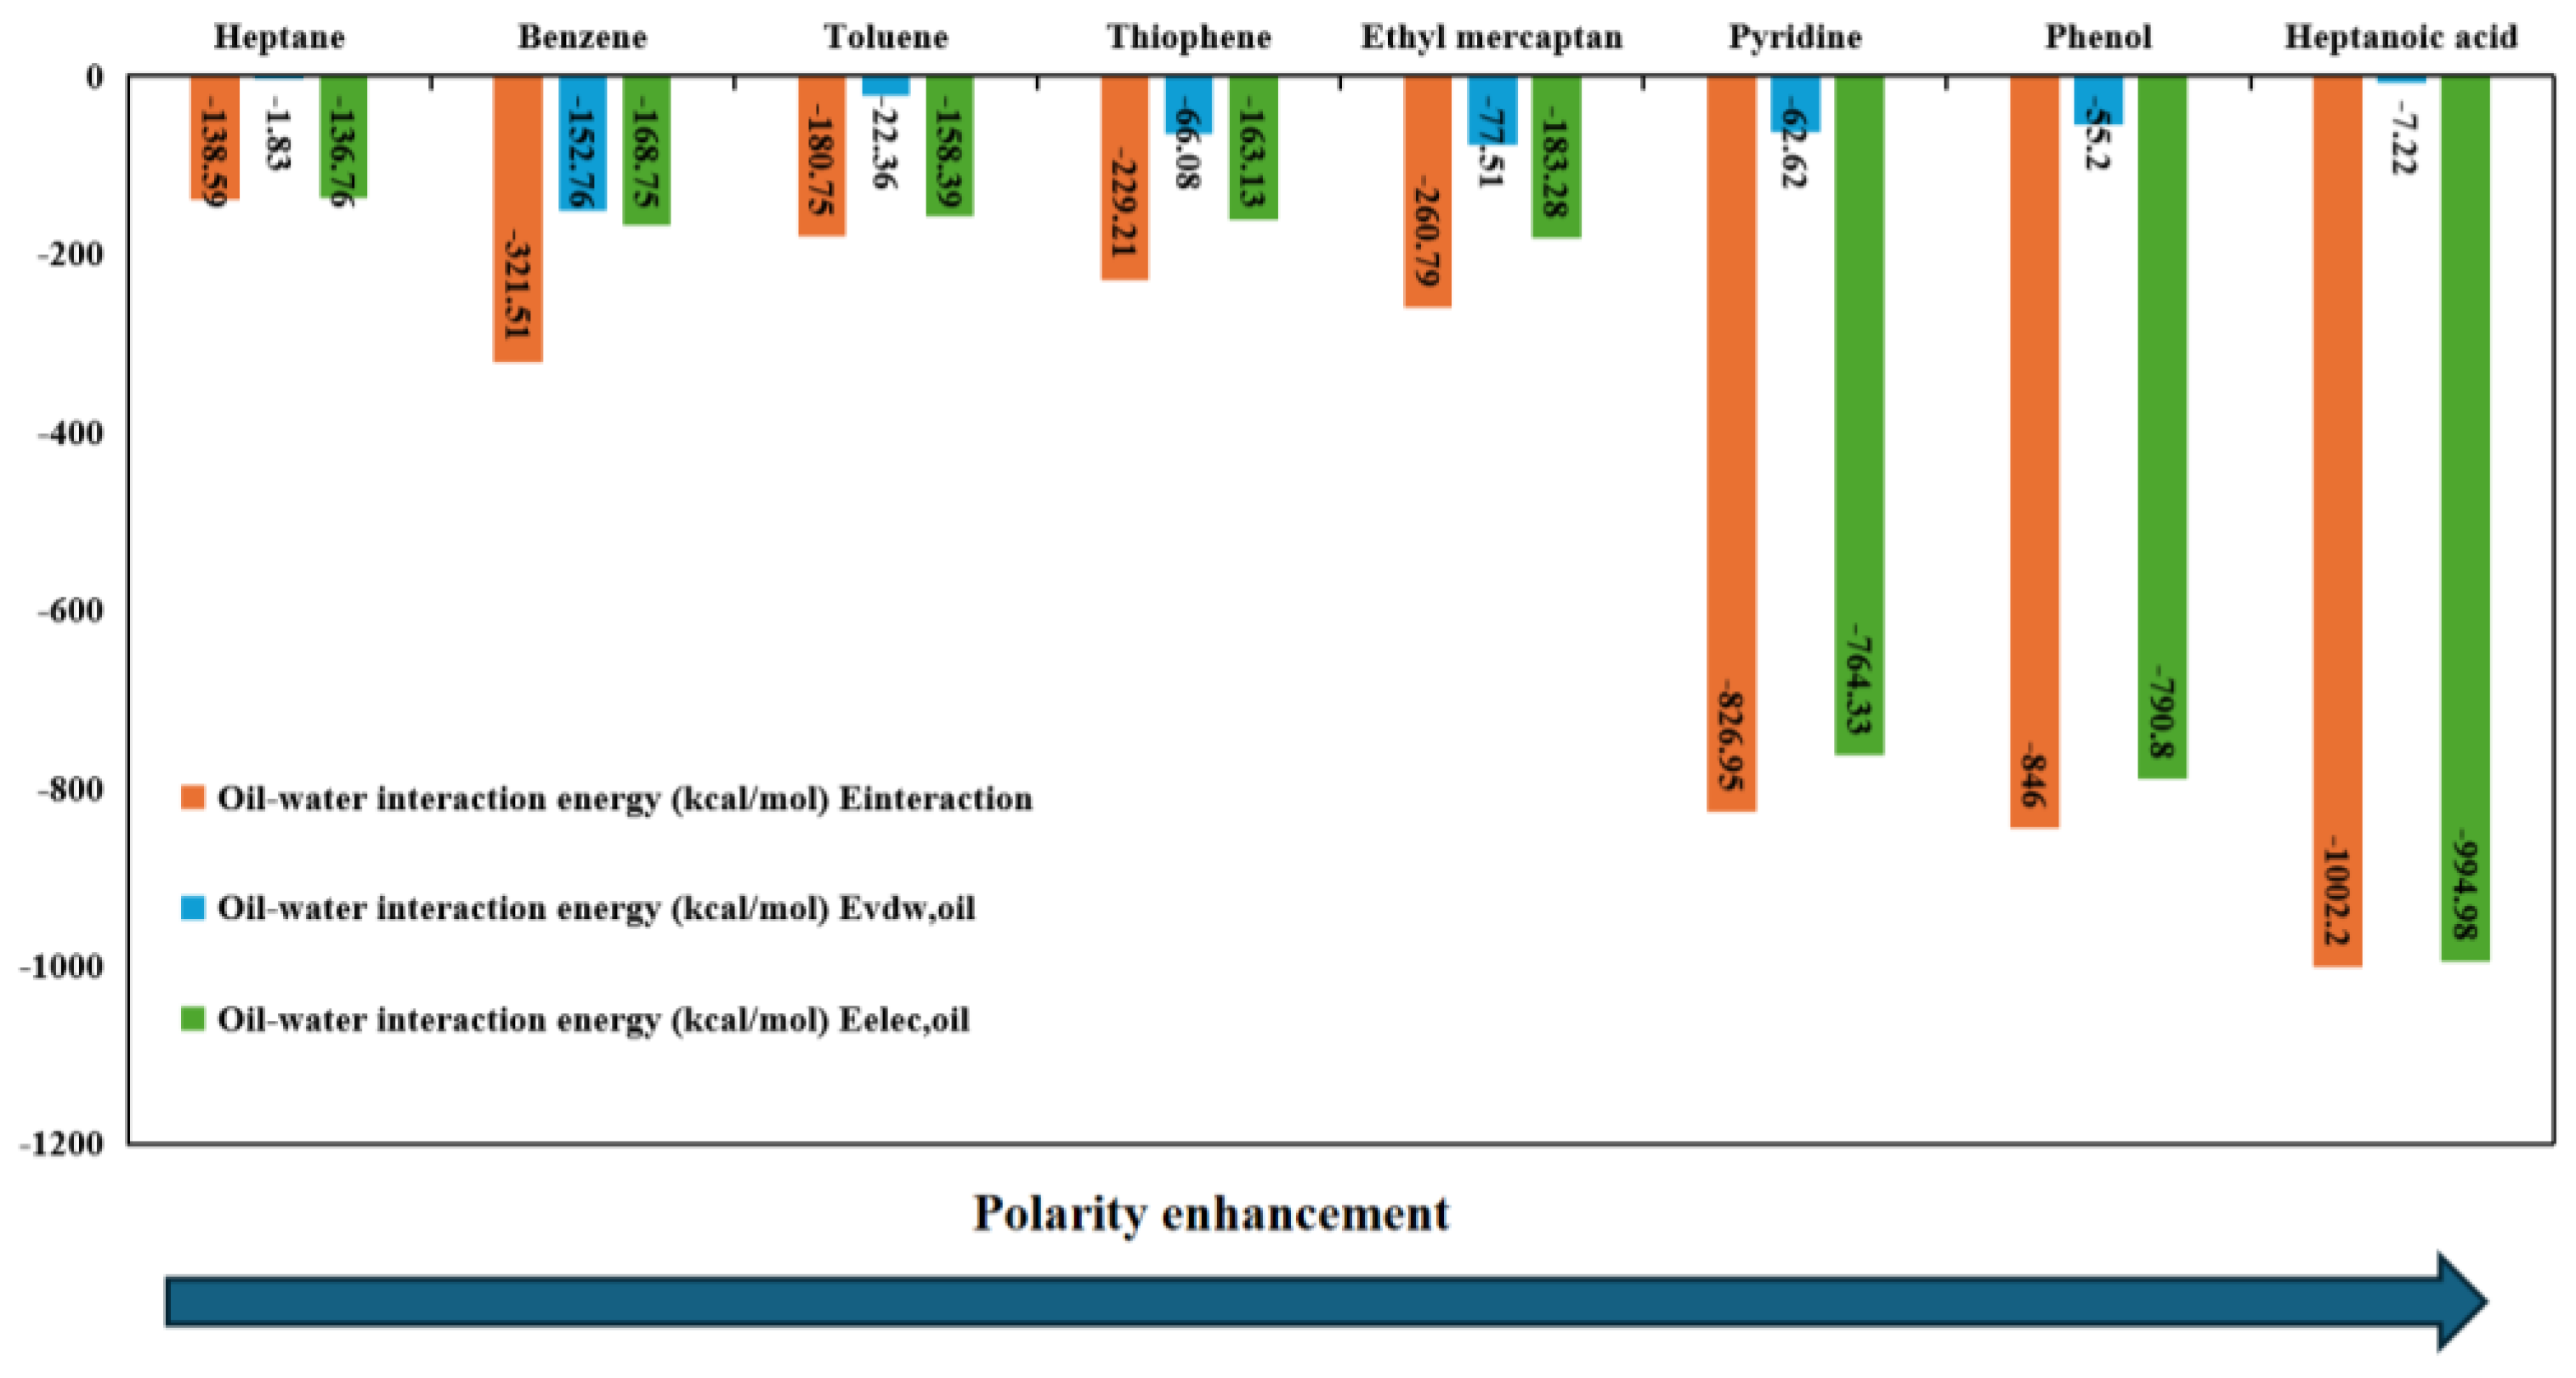
Figure 16.
Calculations of interaction energies at the oil-water interface were performed for eight models containing 150 CO2 molecules.
Figure 16.
Calculations of interaction energies at the oil-water interface were performed for eight models containing 150 CO2 molecules.
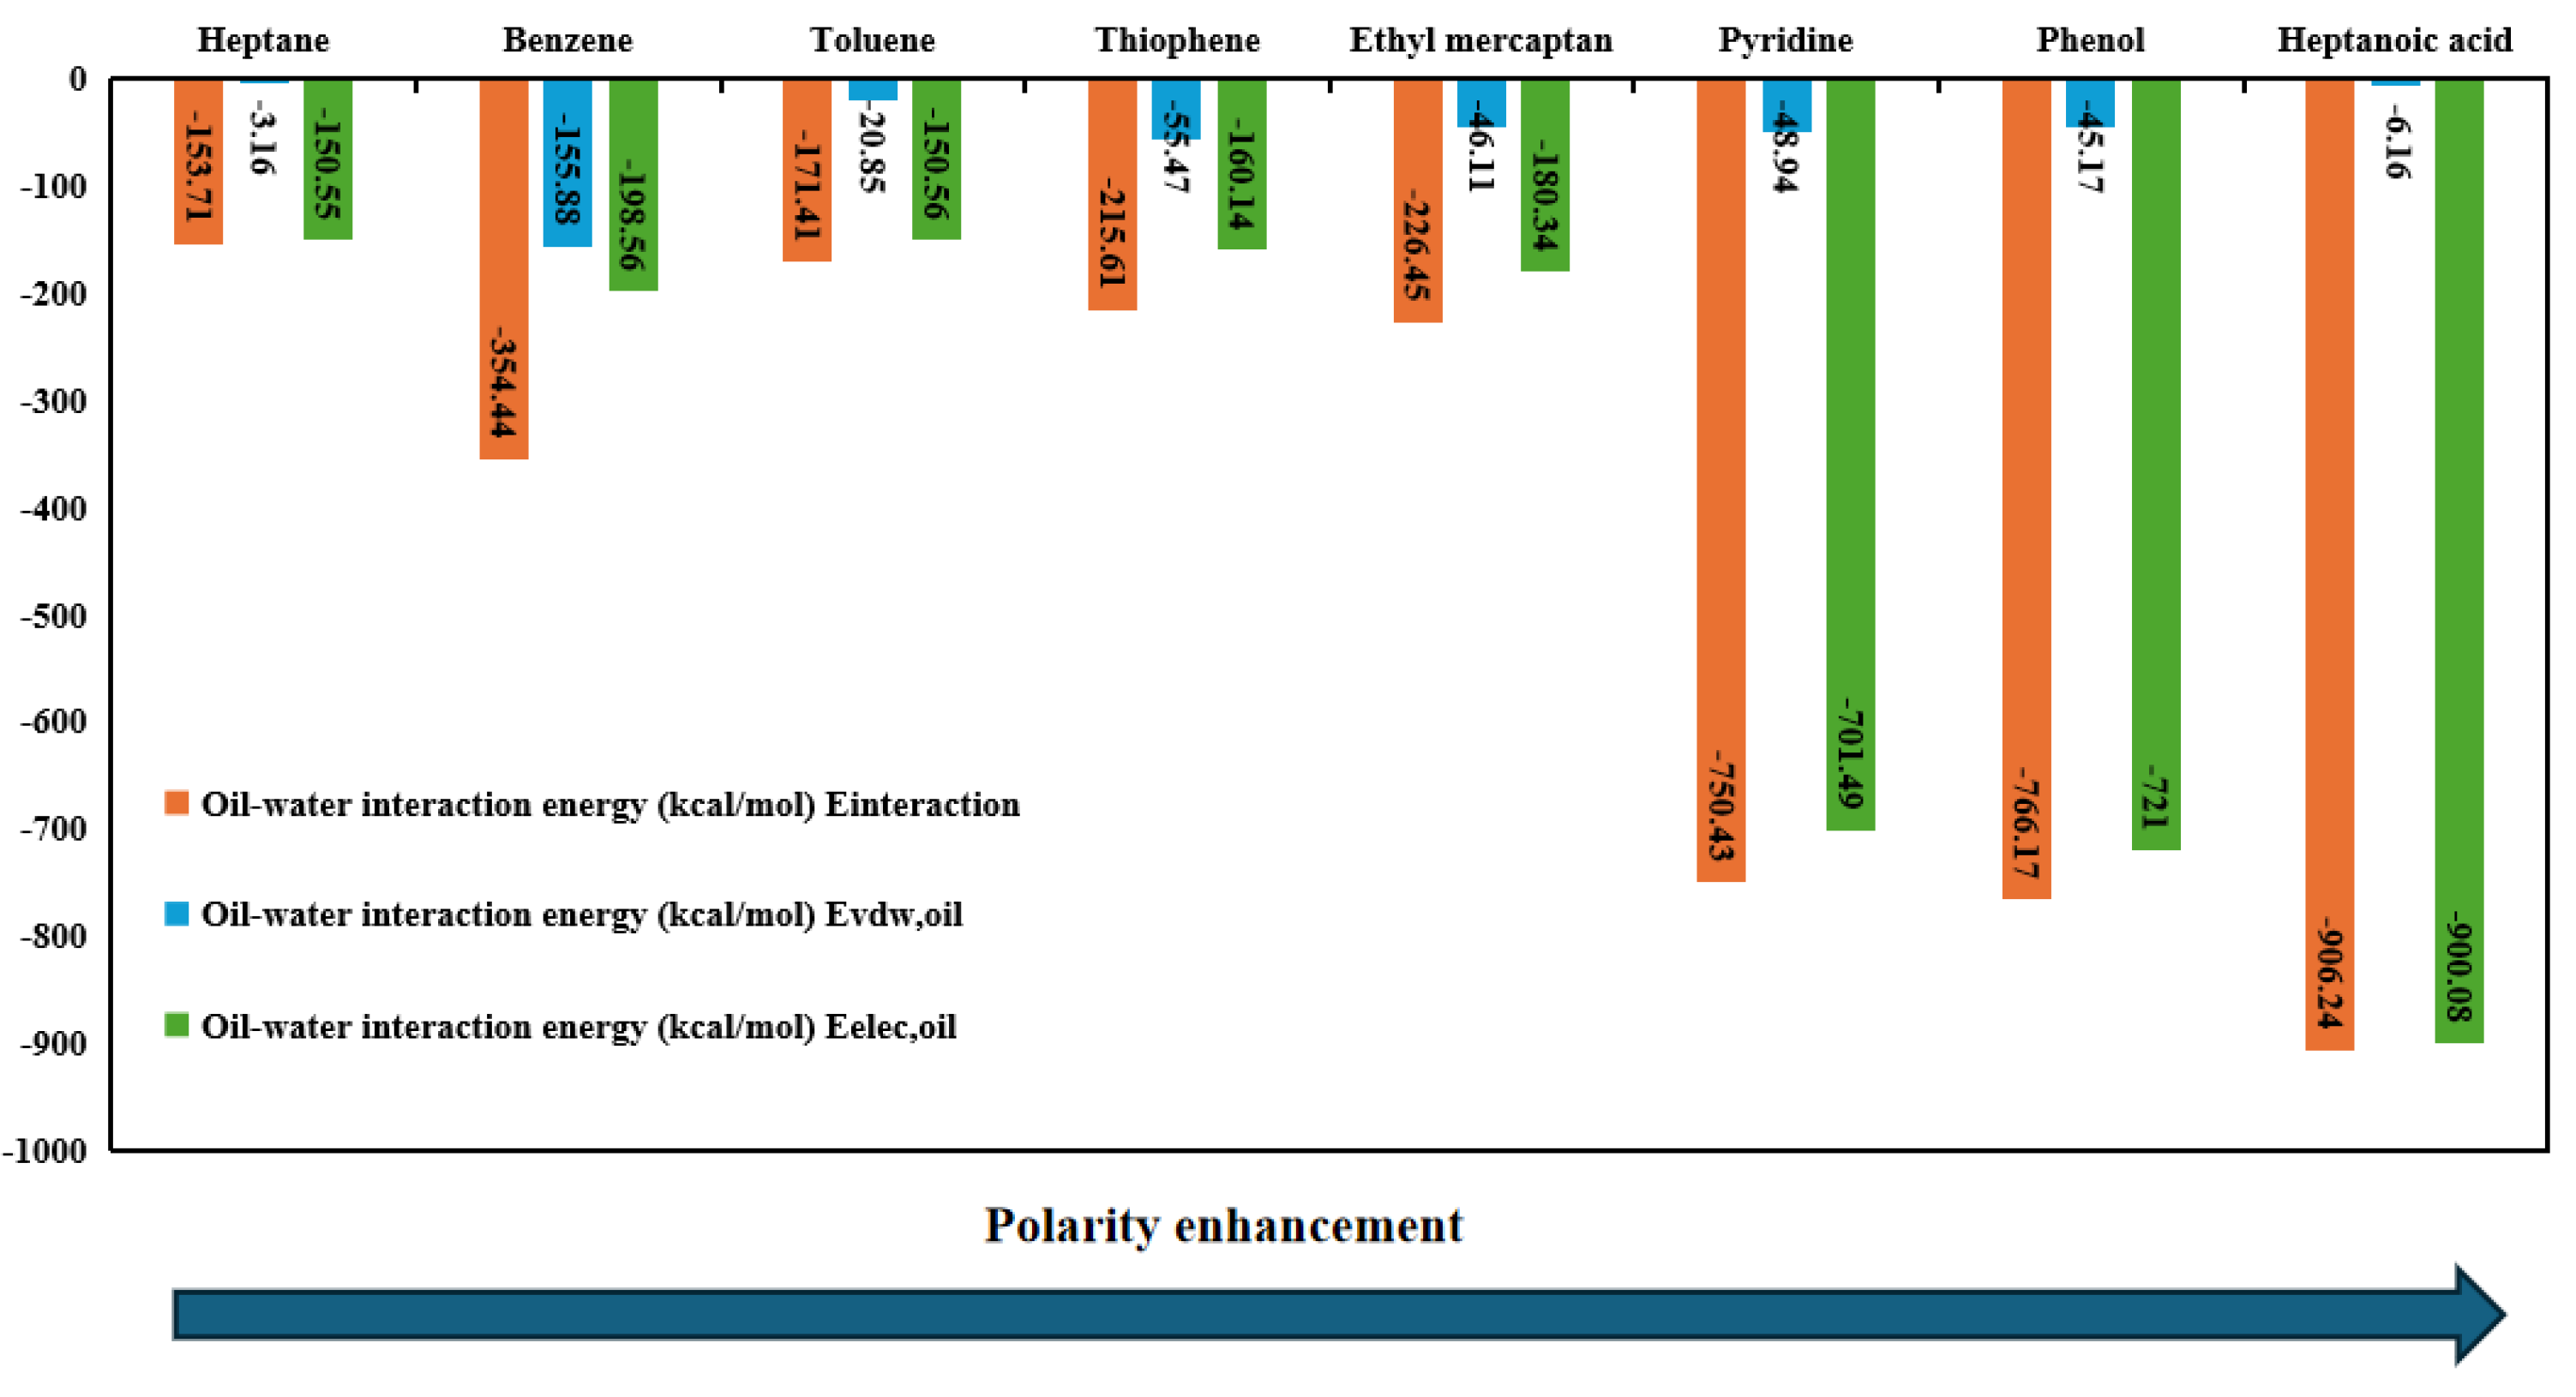
Figure 17.
Calculations of interaction energies at the oil-water interface were performed for eight models containing 200 CO2 molecules.
Figure 17.
Calculations of interaction energies at the oil-water interface were performed for eight models containing 200 CO2 molecules.
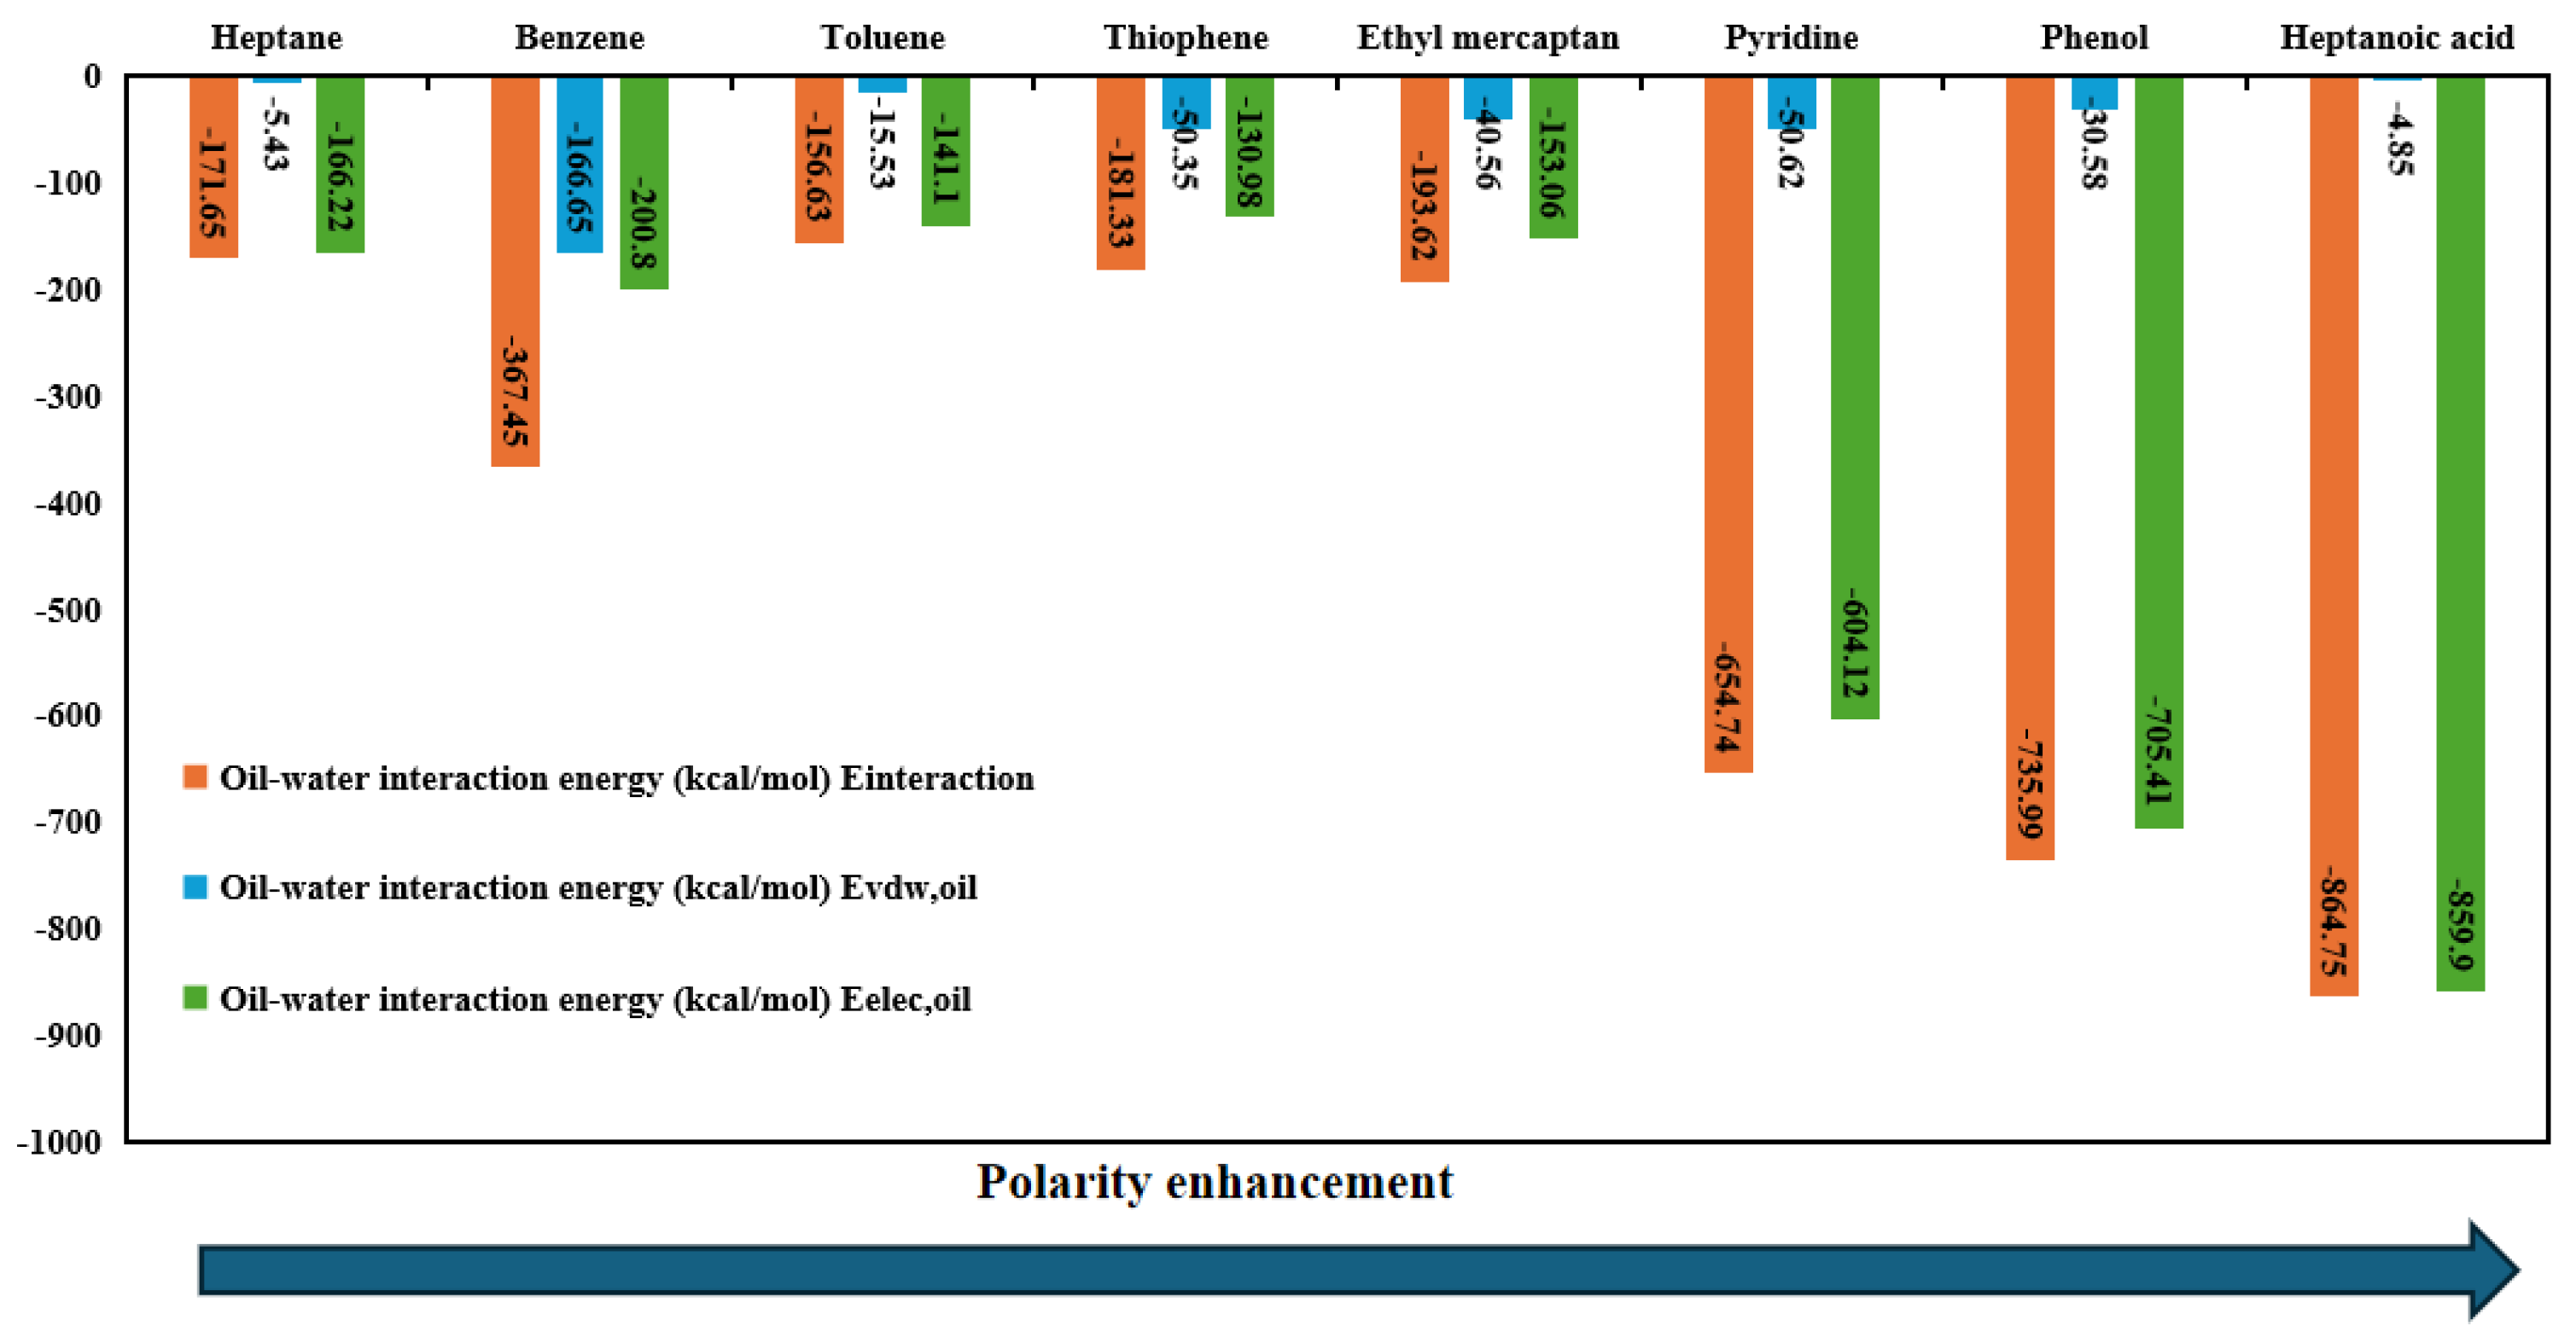
Figure 18.
Calculations of interaction energies at the oil-water interface were performed for eight models containing 300 CO2 molecules.
Figure 18.
Calculations of interaction energies at the oil-water interface were performed for eight models containing 300 CO2 molecules.
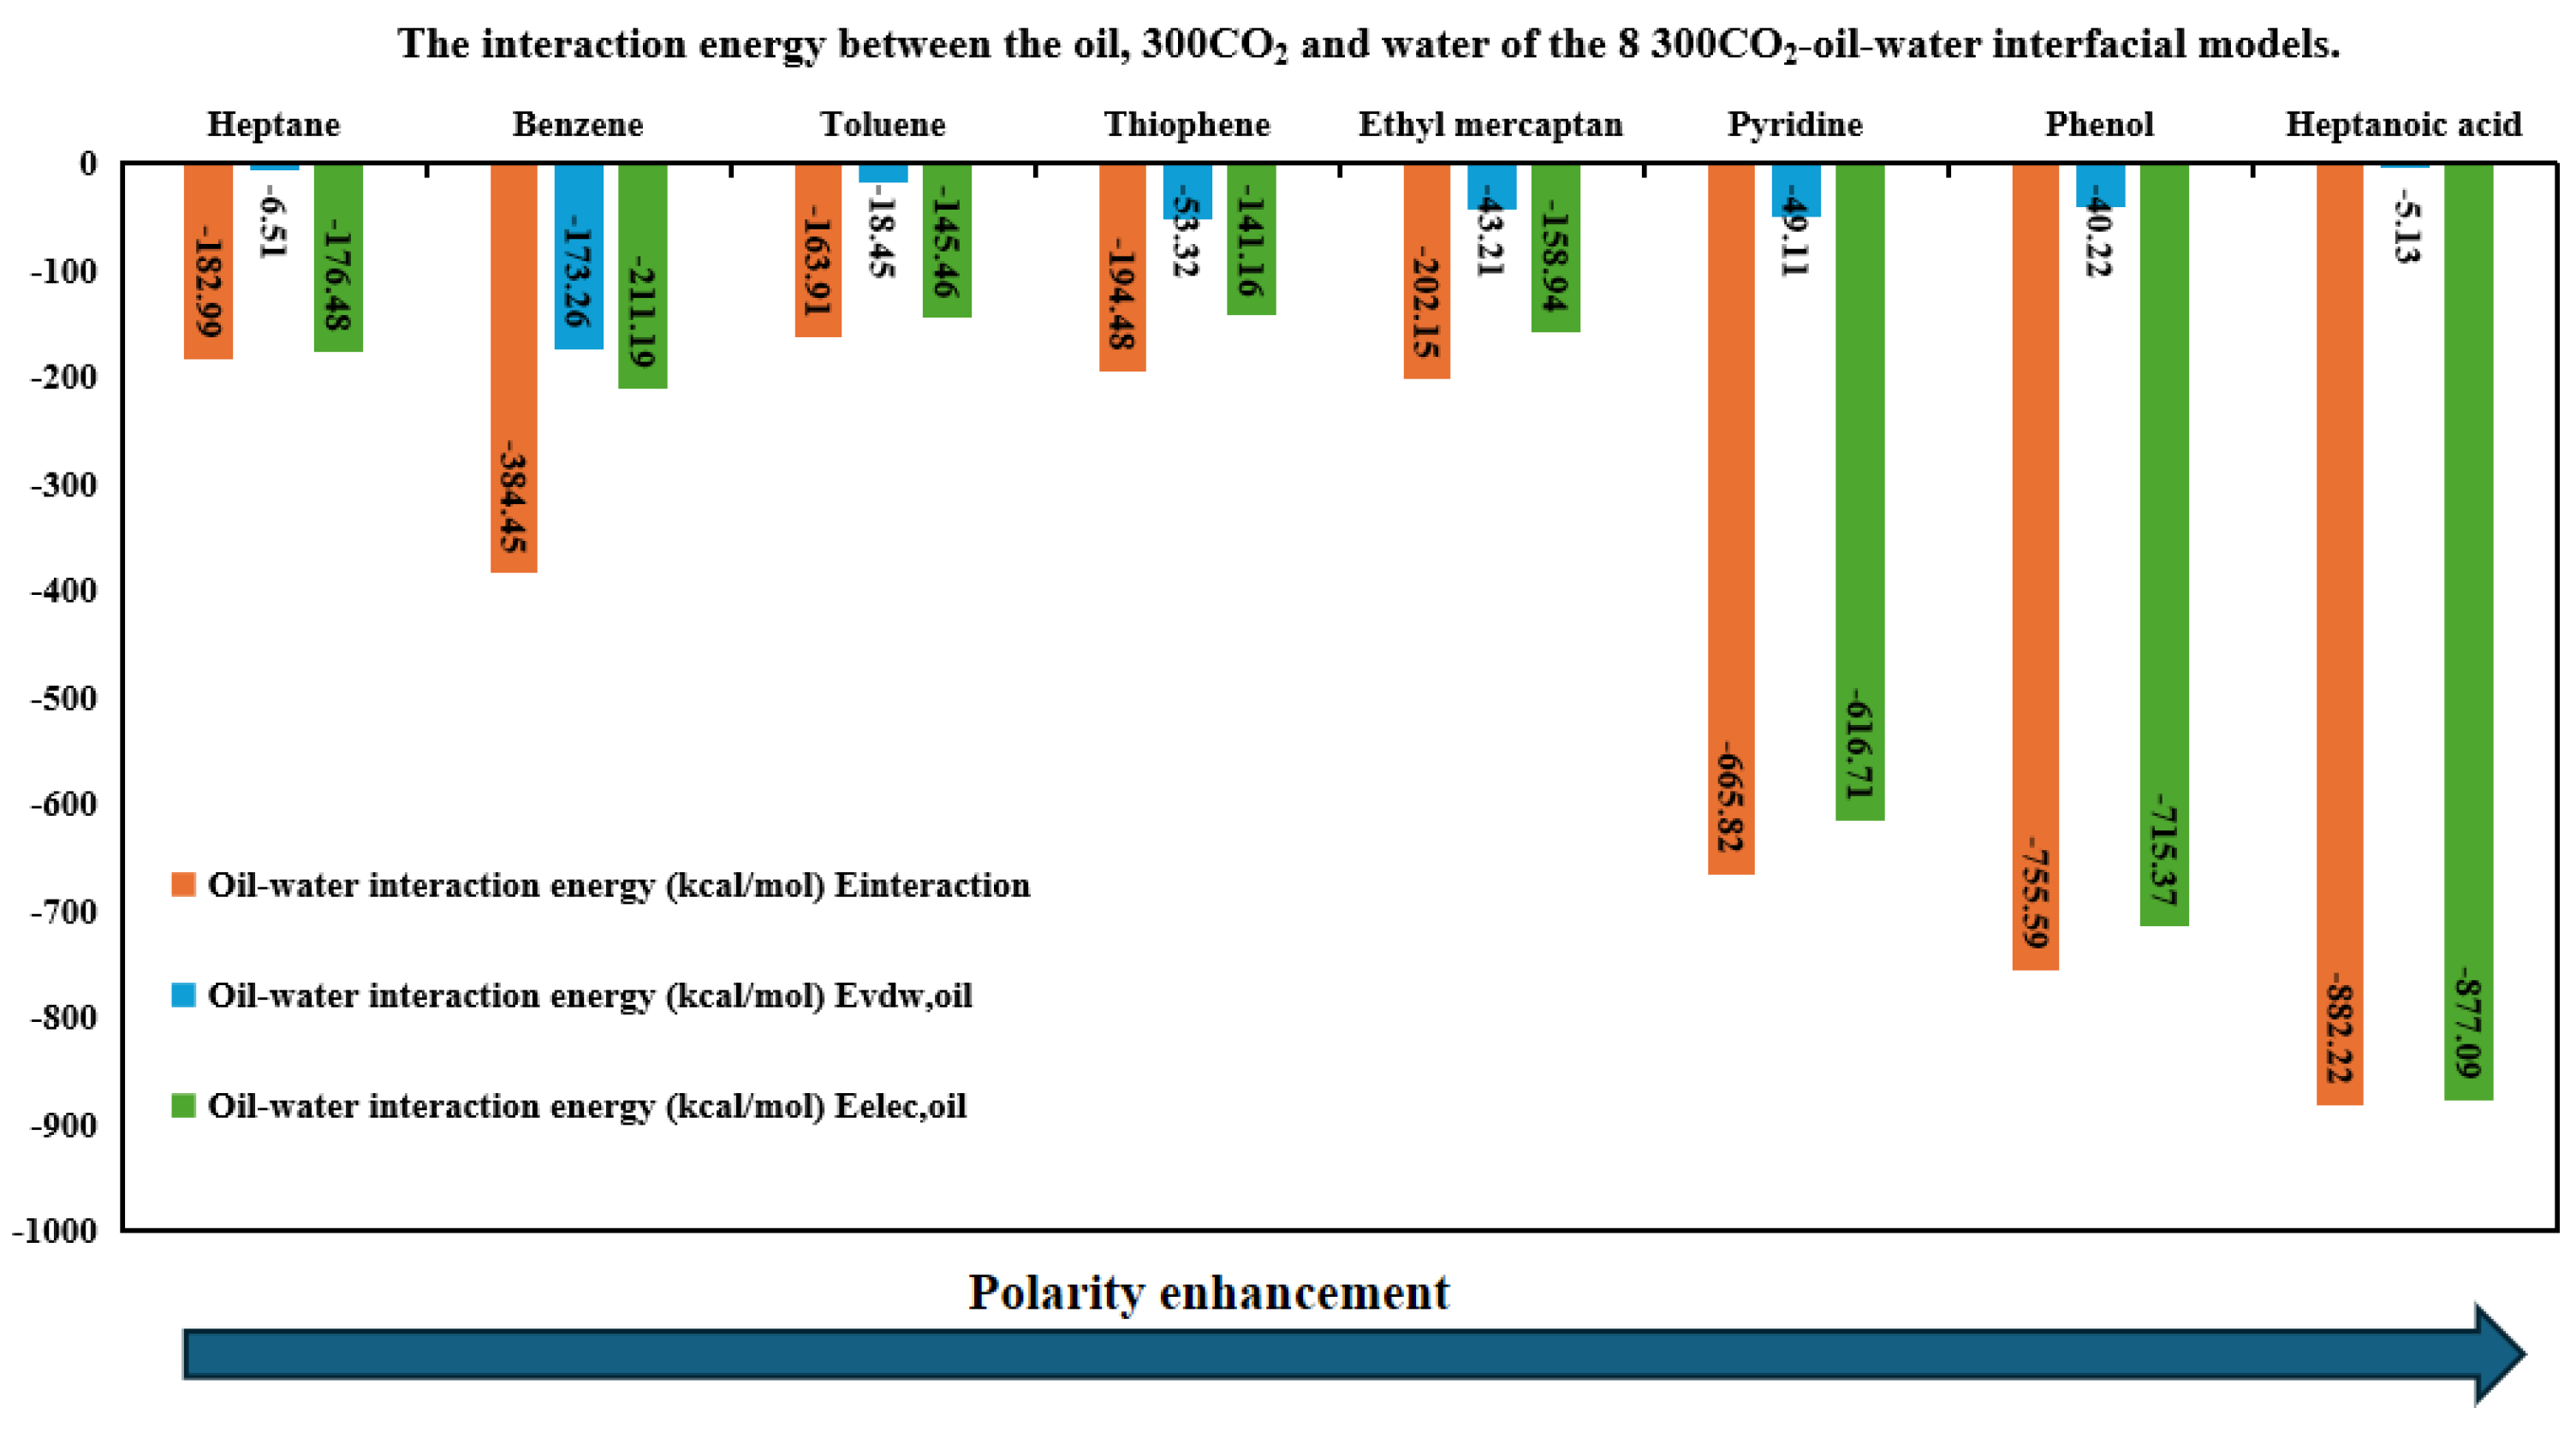
Table 1.
Types and quantities of the basic molecules in the models.
| Case | Quantity and types of oil molecules | Water | CO2 | Total | |||
|---|---|---|---|---|---|---|---|
| Nonpolar molecules | Polar molecules | ||||||
| 1 | heptane | 80 | - | 0 | 600 | 0 | 680 |
| 2 | heptane | 80 | - | 0 | 600 | 150 | 830 |
| 3 | benzene | 100 | - | 0 | 600 | 0 | 700 |
| 4 | benzene | 100 | - | 0 | 600 | 150 | 850 |
| 5 | - | 0 | Toluene | 100 | 600 | 0 | 700 |
| 6 | - | 0 | Toluene | 100 | 600 | 150 | 850 |
| 7 | - | 0 | Thiophene | 100 | 600 | 0 | 700 |
| 8 | - | 0 | Thiophene | 100 | 600 | 150 | 850 |
| 9 | - | 0 | heptanoic acid | 100 | 600 | 0 | 700 |
| 10 | - | 0 | heptanoic acid | 100 | 600 | 150 | 850 |
| 11 | - | 0 | Pyridine | 100 | 600 | 0 | 700 |
| 12 | - | 0 | Pyridine | 100 | 600 | 150 | 850 |
| 13 | - | 0 | Phenol | 100 | 600 | 0 | 700 |
| 14 | - | 0 | Phenol | 100 | 600 | 150 | 850 |
| 15 | - | 0 | ethyl mercaptan | 100 | 600 | 0 | 700 |
| 16 | - | 0 | ethyl mercaptan | 100 | 600 | 150 | 850 |
Table 2.
Discrepancies between simulated outcomes and experimental data.
| Model | Interfacial tension(mN/m) | ||
|---|---|---|---|
| Simulation | Experiment | Error | |
| hexane-water | 60.01 | 50.38 | 1% |
| heptane-water | 44.98 | 50.17 | -1% |
| decane-water | 60.05 | 51.10 | 2% |
Disclaimer/Publisher’s Note: The statements, opinions and data contained in all publications are solely those of the individual author(s) and contributor(s) and not of MDPI and/or the editor(s). MDPI and/or the editor(s) disclaim responsibility for any injury to people or property resulting from any ideas, methods, instructions or products referred to in the content. |
© 2025 by the authors. Licensee MDPI, Basel, Switzerland. This article is an open access article distributed under the terms and conditions of the Creative Commons Attribution (CC BY) license (http://creativecommons.org/licenses/by/4.0/).
Copyright: This open access article is published under a Creative Commons CC BY 4.0 license, which permit the free download, distribution, and reuse, provided that the author and preprint are cited in any reuse.


