Submitted:
28 March 2025
Posted:
01 April 2025
You are already at the latest version
Abstract
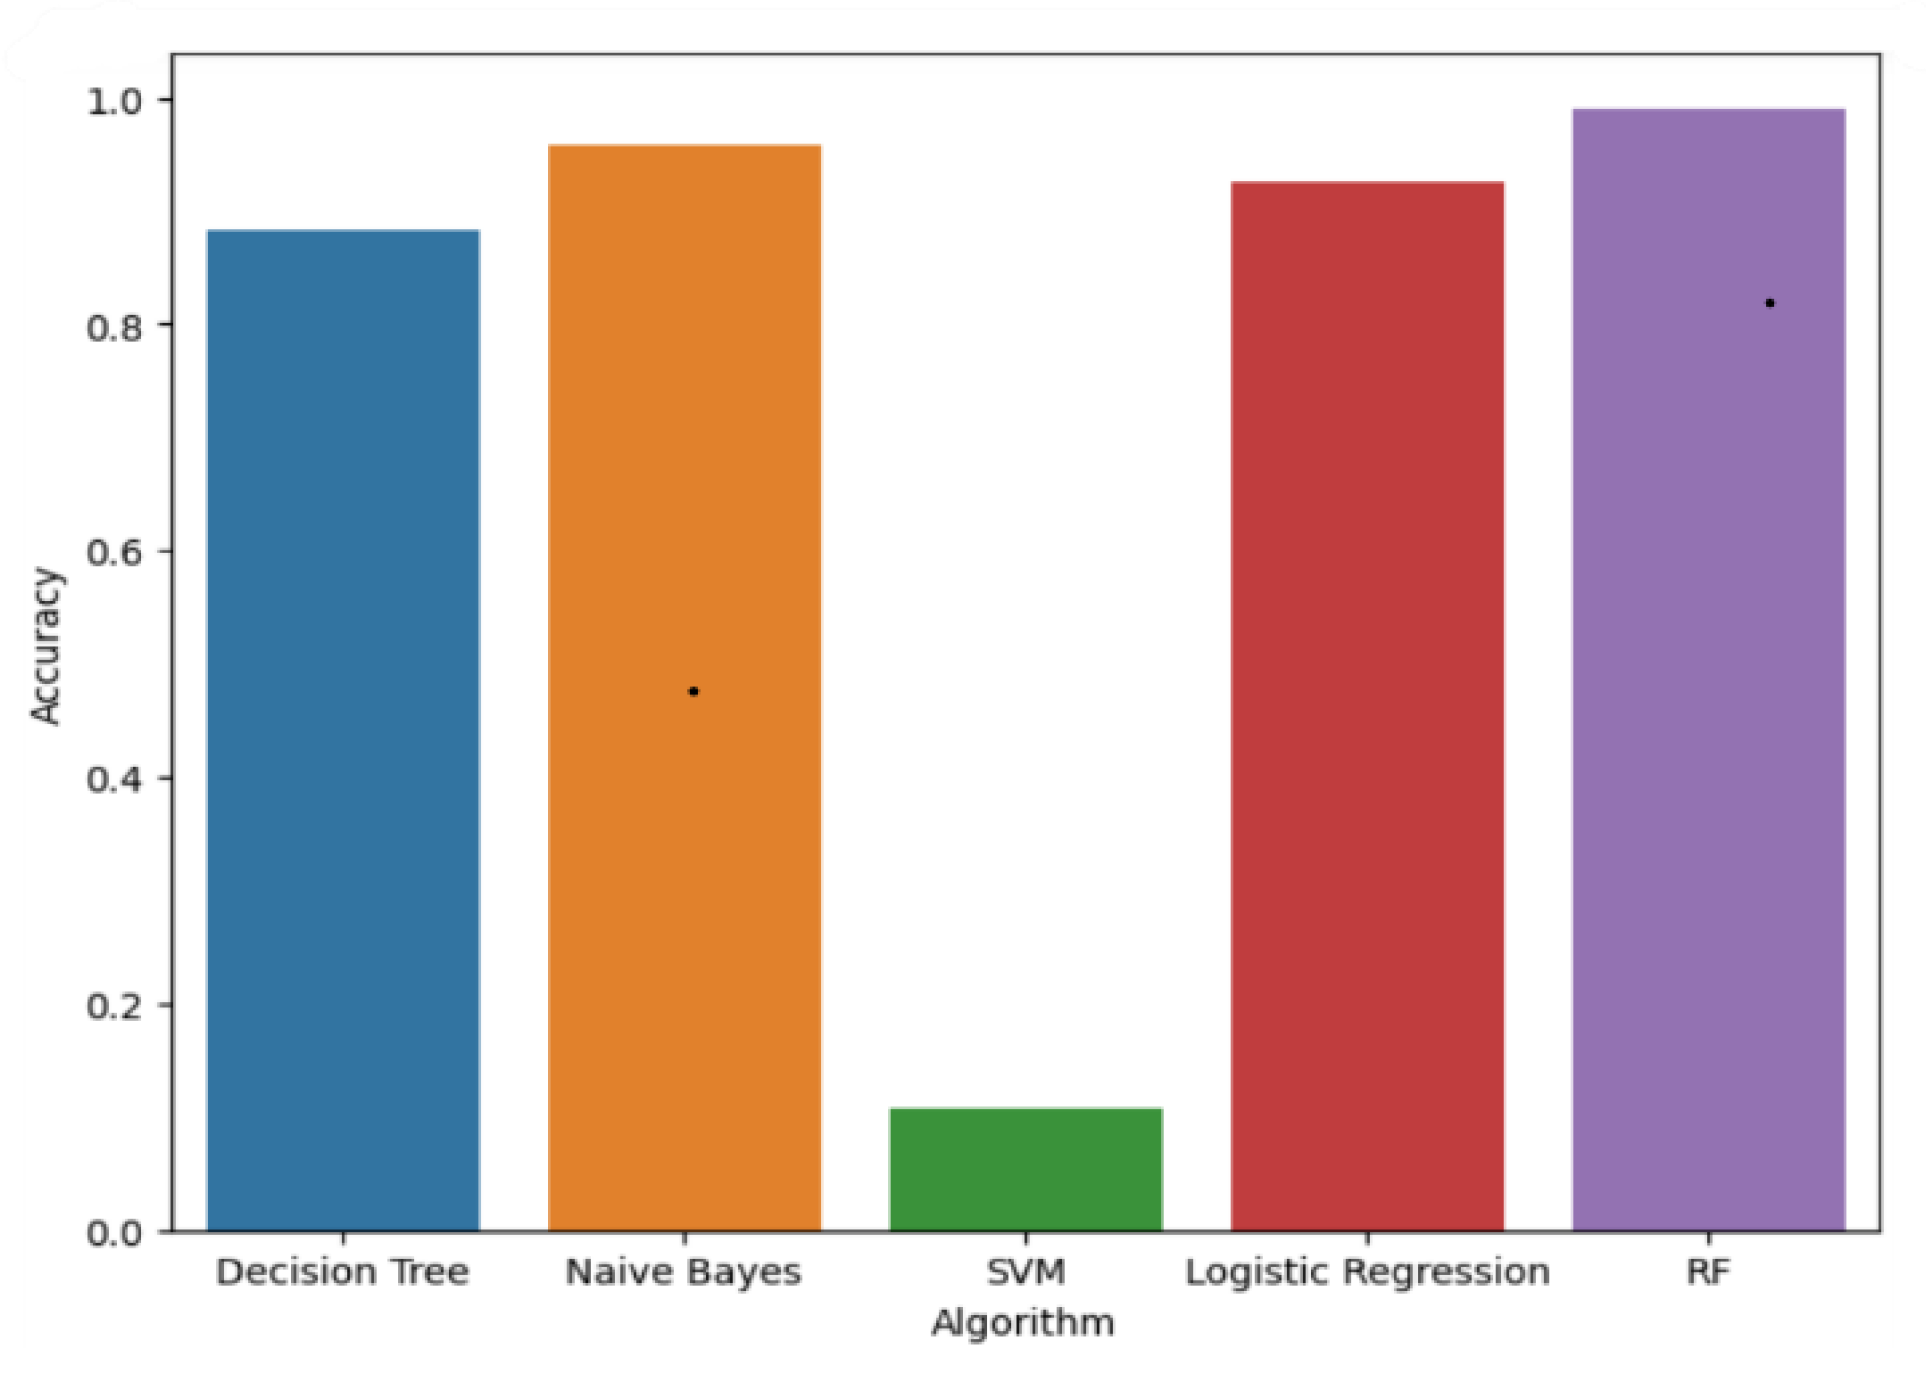
One of important part that is source of the nutrients to grow crops and for successful agricultural production is soil. Capability of soil to sustain crop growth by providing significant nutrients and favorable chemical, physical, and biological characteristics as a habitat is called soil fertility. There are different properties on which several type of crops to grow. Characterizing soil property fertility level, which crops to sow in certain soil types is important for successful crop productivity. SNNPR is reach with fertile containing substantial minerals soil and major producer/supplier of fruits, vegetables, and cereals root crops but crop production less than demand. This research study id basically aimed to design productivity and soil fertility prediction model using machine learning techniques. Researchers conducted different experiments using dataset containing 2200 soil fertility records of 22 well producing crops from SNNPR. There are five machine learning algorithms used for comparative analysis to select best performance one using K-fold cross validation. Such as Decision Trees(90%), Logistic Regression (95%), SVM(13%), Random Forest(99.5%), and Naive Bayes(99%) accuracy achievement in each of them. As a result Random Forest algorithm was built with best performance with 99.5% accuracy and decided to design the model for successful prediction of soil fertility and productivity for particular crop in SNNPR.
Keywords:
Soil Fertility
; Crop Prediction
; Soil
; Machine learning
; SNNPR
; Agriculture
1. Introduction
Agriculture is pillars] of the Ethiopian economy and success on this sector is main indication overall country progress in economic development. From country GDP and total foreign trade 42% and 90% represented by this sector respectively. And also, about 85 % of the population gains their livelihood directly or indirectly from agricultural production [1]. Agricultural productivity is completely dependent on the soil fertility quality or properties like mineral content. However, due to lack of soil fertility, presence of nutrients content in the soil agricultural production in quantity and quality results low [2]. Particularly, the national agricultural productivity is decreasing by quantity and quality from year to year due to some factors like farmers and agricultural extension workers cannot simply identify the soil fertility labels for particular crop types [3]. Those farmers and the extension workers have a lack of knowledge to identify the soil types, fertilities and it is suitability for certain crop type. Besides, there are limited number of soil characterization laboratory national level. Due to this reason, the agricultural research center experts waste their time, financial budget, labor resources for soil classification or characterization in their laboratory for their individual research data demand. Most of the time they use the traditional way of agricultural soil fertility classification techniques based on soil color like black, red soil, etc. This indicates that few farmers decided by themselves a specific type of soil used for a specific type of crop without considering the soil mineral suitability using traditional experience [3].
Soil characterization or classification using such a traditional techniques, observation soil properties for fertility identification incorporate rapidly increasing of complexity and decrease accuracy [4]. Due to this complexity, even experienced agricultural experts like extension workers may often fail to successfully identify specific soil class and are consequently led to mistaken conclusions and unwanted result this result hinder overall agricultural production and lead to food insecurity problem national level [5]. Therefore, looking for an automatic, accurate, fast, and less expensive technology for soil fertility prediction for particular crop type is great importance.
At the end of this planned research study, the following questions will be answered:-
- Which machine learning techniques is suitable for accurate classification of soil fertility for crops to develop of new architectures or models?
- What are parameters to be customized on machine learning approaches and frameworks to achieve accurate soil fertility classification?
- What crops should be sowed in particular area with certain soil fertility level or properties in SNNPR?
Machine learning is one of recent solution to improve crop production in quality and quantity in the agriculture sector. Its algorithms have been practicing to classify the soil whether the soil is fertile or not by using micronutrient content in the given soil [3,6]. The crop yield, crop sowing and some other related aspects can also be analysed using this machine leaning technique. Some of recently known machine learning algorithms are CNN, Support Vector Machine (SVM), Artificial Neural Network (ANN), Decision Tree, Naive Bayes, and Linear Regression [3,7,8].
The core objective of this research study is to create a suitable machine learning model to classify various kinds of soil series data along with suitable crops suggestion for certain areas of SNNPR [2]. For this research study data were collected for dataset by which new model going to train is from SNNPR Agricultural research centers, private and governmental farm and Ethiopian Agricultural Transformation Agency (EATA).
2. Literature Review
At the end of this task, the researcher identifies the critical analysis from previous research studies which includes salient approaches, novel ideas, knowledge gaps, performance analysis and tools which are relevant to provide significant importance to understand the existing problems for this research study. There are several related studies described blow by different authors and are categorized into local and abroad related work.
Research paper [3] presented design machine learning model to identify whether the soil is fertile or not, and predicting the crop yield production. Different Machine Learning algorithms were used such as Support Vector Machine (SVM), Random Forest, Naive Bayes, Linear Regression, Multilayer perceptron (MLP), and ANN to achieve above objective. An experiment results show that the proposed a deep learning architecture has several layers for input and output are connected to achieve better accuracy than traditionally known techniques.
The research study [6] presented soil prediction model with land type and it can suggest suitable crops. Some of machine learning algorithms used in this study were weighted k-Nearest Neighbor (k-NN), Bagged Trees, and Gaussian kernel based SVM for soil classification. Experimental results in this study show that the SVM algorithm performed better than many existing algorithms.
The research paper [9] introduced classification and grading of soil samples using SVM algorithm. The conducted research is pertinent to practical soil classification, utilizing both image processing and pattern recognition methods. SVM's computational complexity remains independent of the input space's dimensionality, making it less susceptible to overfitting. This study seeks to integrate both techniques, incorporating crop classification for suitable soil as a component of soil classification.
The research study [8] used temperature, rainfall, and soil type analyse soil feature using Artificial Neural Networks (ANN) algorithm for models development. After deep observation based on the analysis of machine learning-based different papers recommend application of deep learning algorithms. And also, Convolutional Neural Networks (CNN) identified as the most widely used deep learning algorithm.
The research study [7] performed a series of comprehensive assessment models for soil nutrient by using SVM, multiple linear regression (MLR), and ANN, respectively. Researchers selected total nitrogen, alkali-hydrolysable nitrogen, rapidly available phosphorus, and rapidly available potassium as independent variables. Experiments result show that the average prediction accuracies of SVM models are 77.87% and 83.00%, respectively, while the general regression neural network (GRNN) model’s average prediction accuracy is 92.86%. Finally, researchers recommend that SVM and GRNN models to be used for soil nutrient level evaluation with suitable dependent variables.
3. Materials and Methods
A design science is an approach used to build and evaluates overall research process of this research study. It helped to creates innovations, defining ideas and practicing, technical capabilities, and products using qualitative or quantitative data. One of Design Science Research Methodology (DSRM) outputs is a model, it is a conceptual representation or abstraction of a set of propositions or statements expressing relationships among constructs [10].
As depicted in Figure 1 represents the DSRM processing model 'problem-centered initiation' is selected among different entry points. According to Hevner [11] it is best fit for this design science research. The problem-centered initiation entry point is applicable because of the problem being observed by researchers and businesses within the cotton disease identification domain [12,13]. Figure 1 depicts the DSRM proposed by the research study and together with the activities adapted to this research.
4. Dataset Preparation
In this study, data were collected from main agriculture based research centers and dedicated governmental office such as Agricultural Transformation Agency (ATA) in Ethiopia, Arba Minch and Areka agricultural research centers. During data collection, 3,122 soil fertility data for all 30 class labels are collected from former SNNPR central part. From this region, about 50.7% of the total regional cropland is in central part such as Sidama (currently autonomous region), Gurage, Waliata, Hadiya, Gamo Gofa, and Halaba accounts for 6.91%, 9.87%, 6.49%, 10.84%, 12.94% and 3.65% of the regional total respectively. However, only 2,200 soil fertility records for 22 class labels, 100 records for each class of 7 attributes are used. Those 7 attributes common in this region are soil-PH, humidity, temperature, rainfall, available phosphorus, available potassium and total nitrogen included in dataset to train model in data balancing technique [14,15]. Quality and reliability of the dataset main criteria for data accuracy it also requires expert knowledge and experience in soil characterization. In this research study, data cleaning, validation, reclassification, and verification processes and data labeling were performed by national pedologists (soil experts) from each research center.
5. Design of Soil Fertility and Productivity Prediction Model
As mentioned earlier, the main goal of this research is developing model to classify soil fertility to particular crop label by using machine learning classifier. The first task in this model soil data set preparation this phase contain collection and pre-processing and validating dataset with soil experts. Then dataset partitioning or splitting is next important task in order to segment dataset in to training and testing dataset by using K-fold validation technique. After this, training dataset are inserted into the machine learning algorithm to be trained since this plays a great role in the classification task. Then, the performance of the trained model is validated with testing dataset that is done for all classifier to compare each other to select best suited model are best suited for this research study.
Figure 2.
Soil Fertility and Productivity Prediction Model Process.
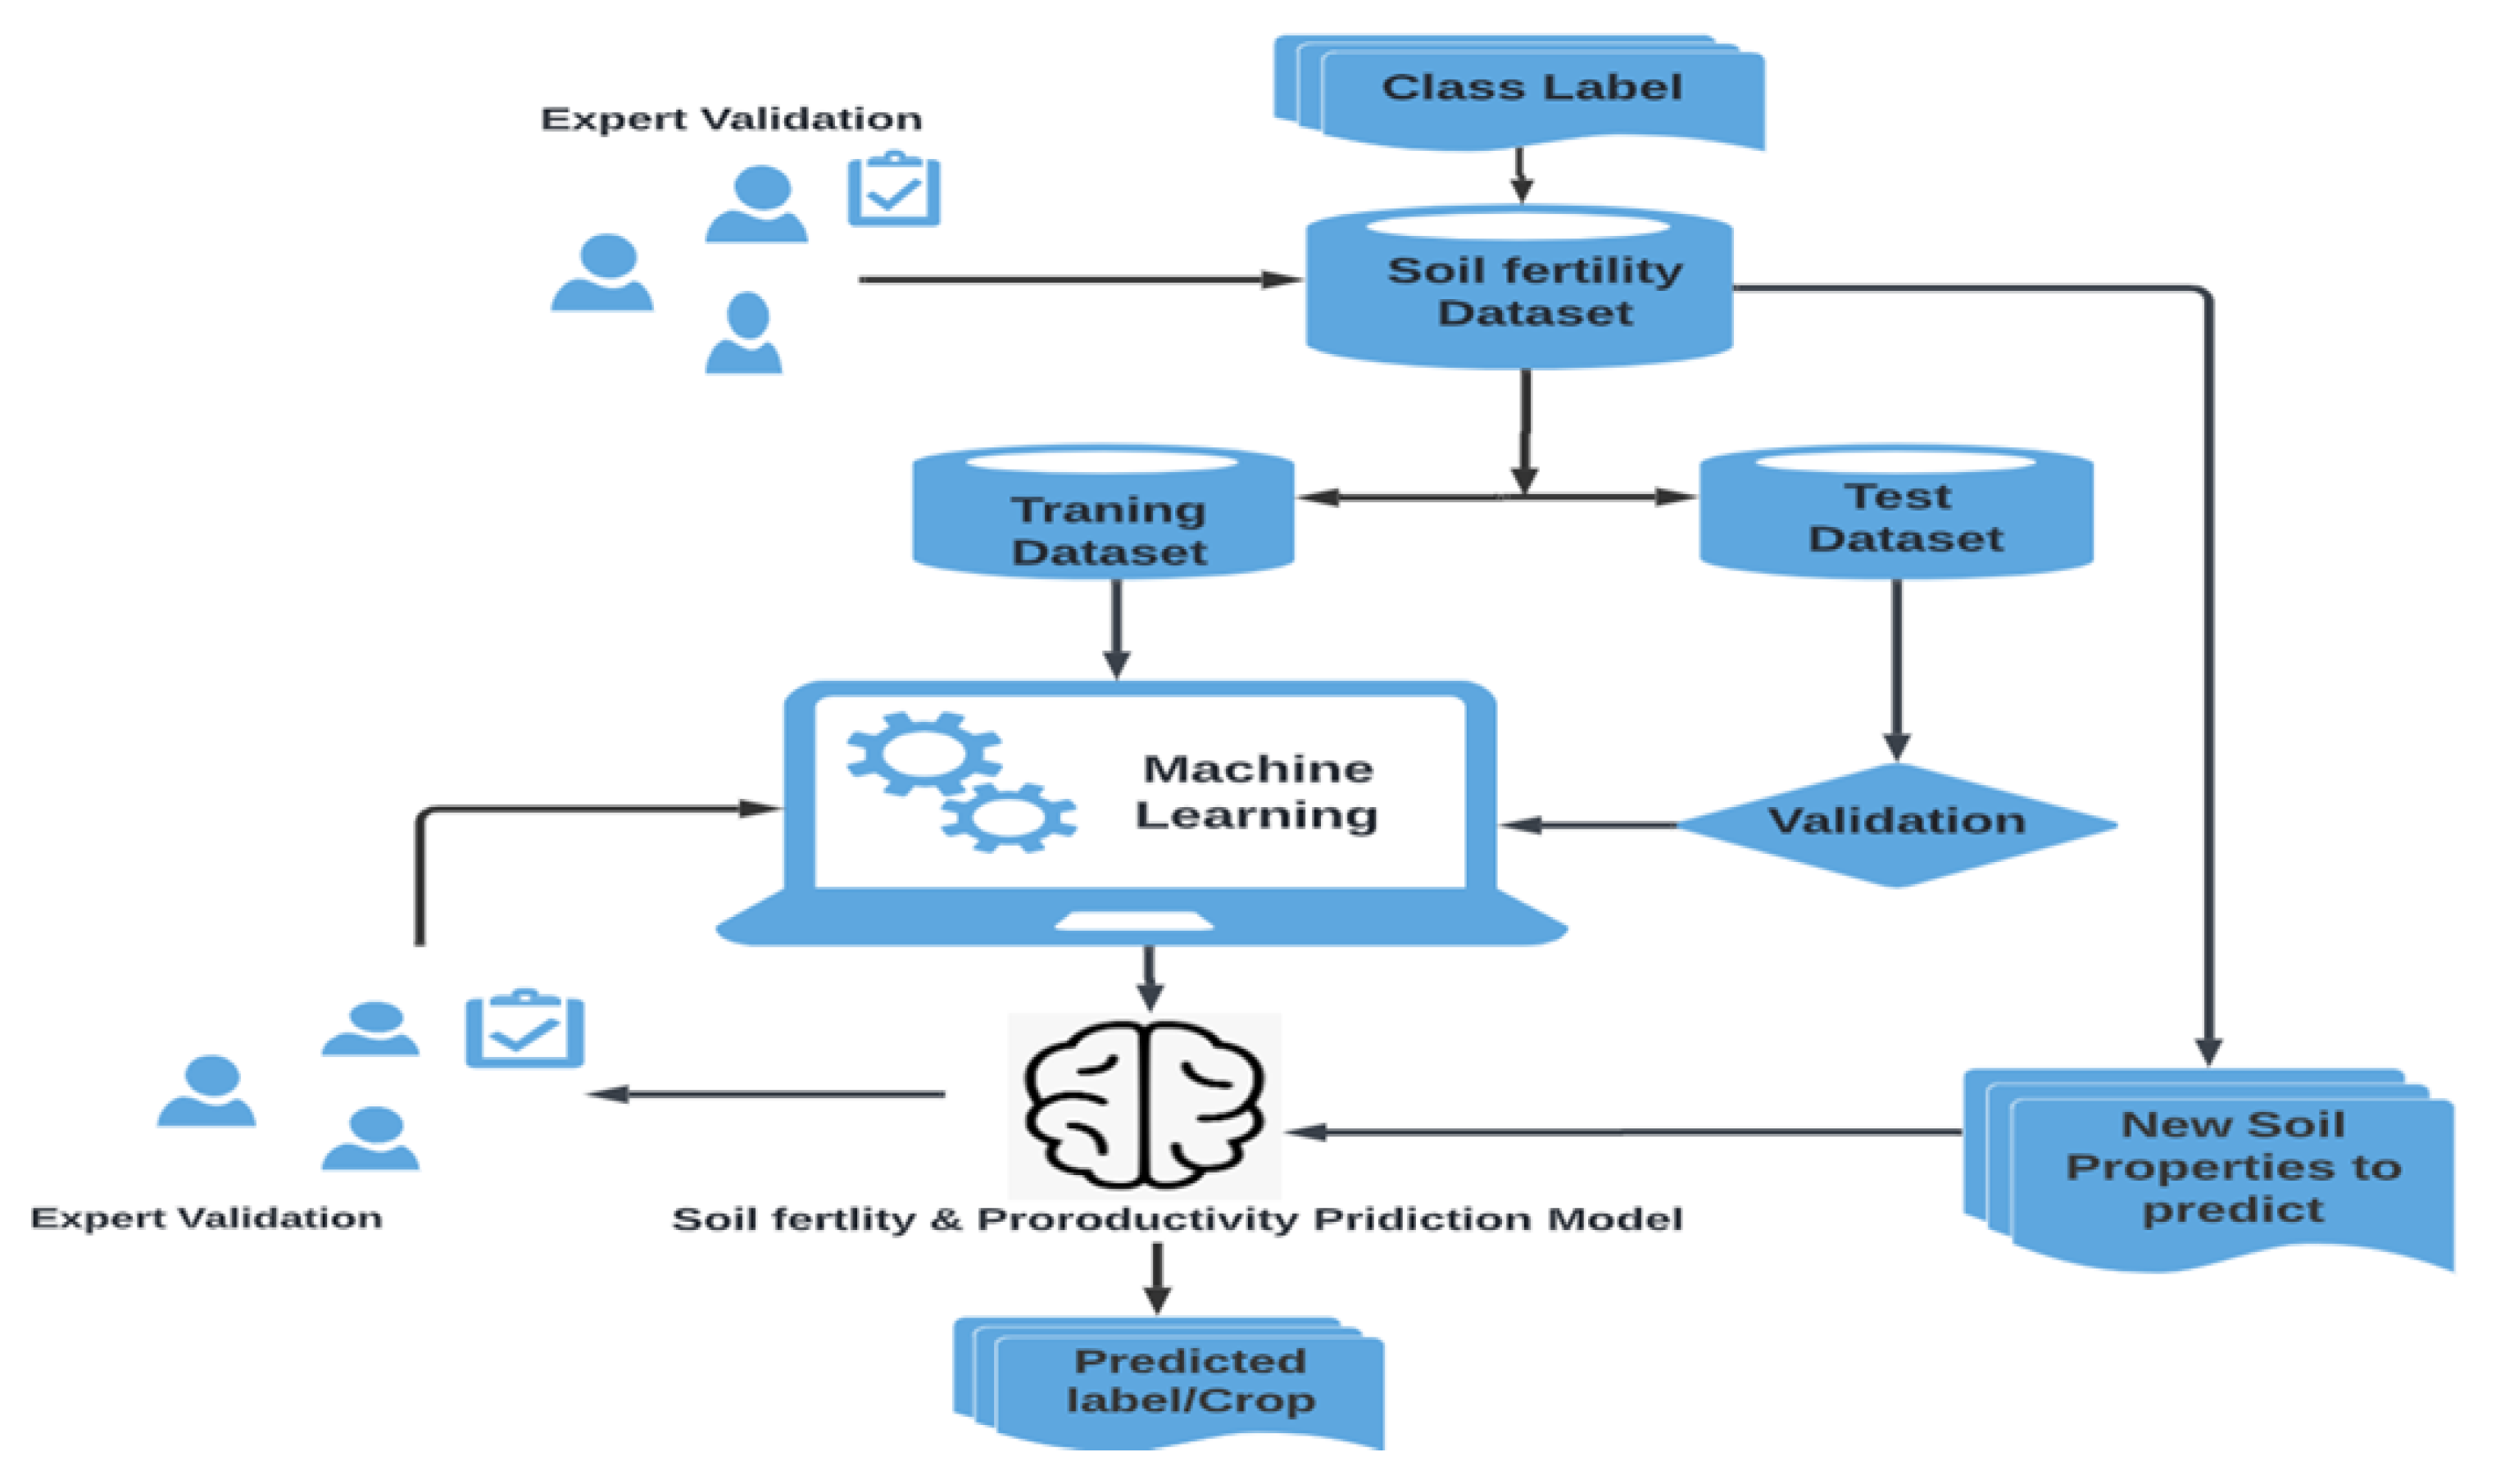
As we discussed above compaction of all classifiers performance is done using confusion matrix report that generate statistical metrics such as precision, recall, F1-score, and accuracy. Finally, a trained knowledge base classifies new inserted soil fertility data and provide predicted result. Figure 3.3, depicts all steps of the developed model of soil fertility prediction or classification for particular crop.
6. Experiments
To achieve proposed soil fertility and crops productivity model, different experiments were conducted using machine learning predictive algorithms such as logistic regression, SVM, decision trees, random forest, and Naive Bayes algorithms, using Python version 3.19.13 on Jupyter Notebook environment. The main reason to train these algorithms is for the purpose of comparison in order to select a better performant model which is most suitable for the prediction of soil fertility and productivity class labels. The experiments have been conducted can be categorized into five parts.
- In part one, five experiments were conducted for each algorithm without altering machine learning algorithms parameters. The aim of these experiments was conducted to observe the effect of using all attributes and then, selecting a better model based on their performance evaluator metrics values and confusion matrix results.
- And in part two, five experiments were also conducted for each algorithm with some attribute modifications and selection of attributes. All experiments under three parts the performance of each have been evaluated and the experiment having better performance have been selected for each part.
- And in part three, two experiments were also conducted for each algorithm with K value modification dataset partitioning in K fold cross validation. The aim of these experiments was conducted to observe the effect of tuning of K values then, selecting a better model based on their performance evaluator metrics values and confusion matrix results.
- Finally in fourth part, five experiments were conducted for each algorithm with 80/20 dataset partitioning (80% for training and 20% for testing). The main reason to select only this data set partitioning type is collected dataset size for this research study is classified as small dataset. The aim of these experiments was conducted to observe the effect of using 80/20 dataset partitioning techniques then, selecting a better model based on their performance evaluator metrics values and confusion matrix results.
7. Result
The overall goal of this study was to develop an interpretable and understandable predictive model that is used to classify the soil fertility and productivity labels to the corresponding crop types.
Five experiments were conducted under this category for each of the selected machine learning algorithms namely Logistic Regression, SVM, Decision Trees, Random Forest, and Naive Bayes algorithms without altering default machine learning algorithms parameters. Using 2200 records with all 7 attributes such as soil-PH, humidity, temperature, rainfall, available phosphorus, available potassium and total nitrogen. Regarding to the remaining attributes were irrelevant to discriminate the records into the predefined class labels such as productive, poor and optimum soil fertility. All the experiments were used 5-fold cross-validation techniques for evaluating the model's performances by applying performance metrics.
In this experiment, model was built using dataset consists of 2200 records of 22 classes or crops and 7 attributes. The model building took 0.11 seconds with an accuracy of 90.0%. Figure 4.2 shows the sample output for the decision tree model with 7 attributes.
This indicate from this total records 1980 records out of 2200 total dataset were classified correctly as one of 22 class or crops. From those all classes none both Sorghum and Horse Beans, 84% of Papaya, 92.8% of Red Haricot Bean and 62.5% of Wheat are correctly classified, mean that remaining 0%, 0%, 16%, 7.2%, 37.5% of records are incorrectly classified respectively.
The remaining 683 records which represent 12.5% are classified incorrectly. As result, this machine learning algorithm, Decision Tree achieves 90% overall accuracy in this experiment.
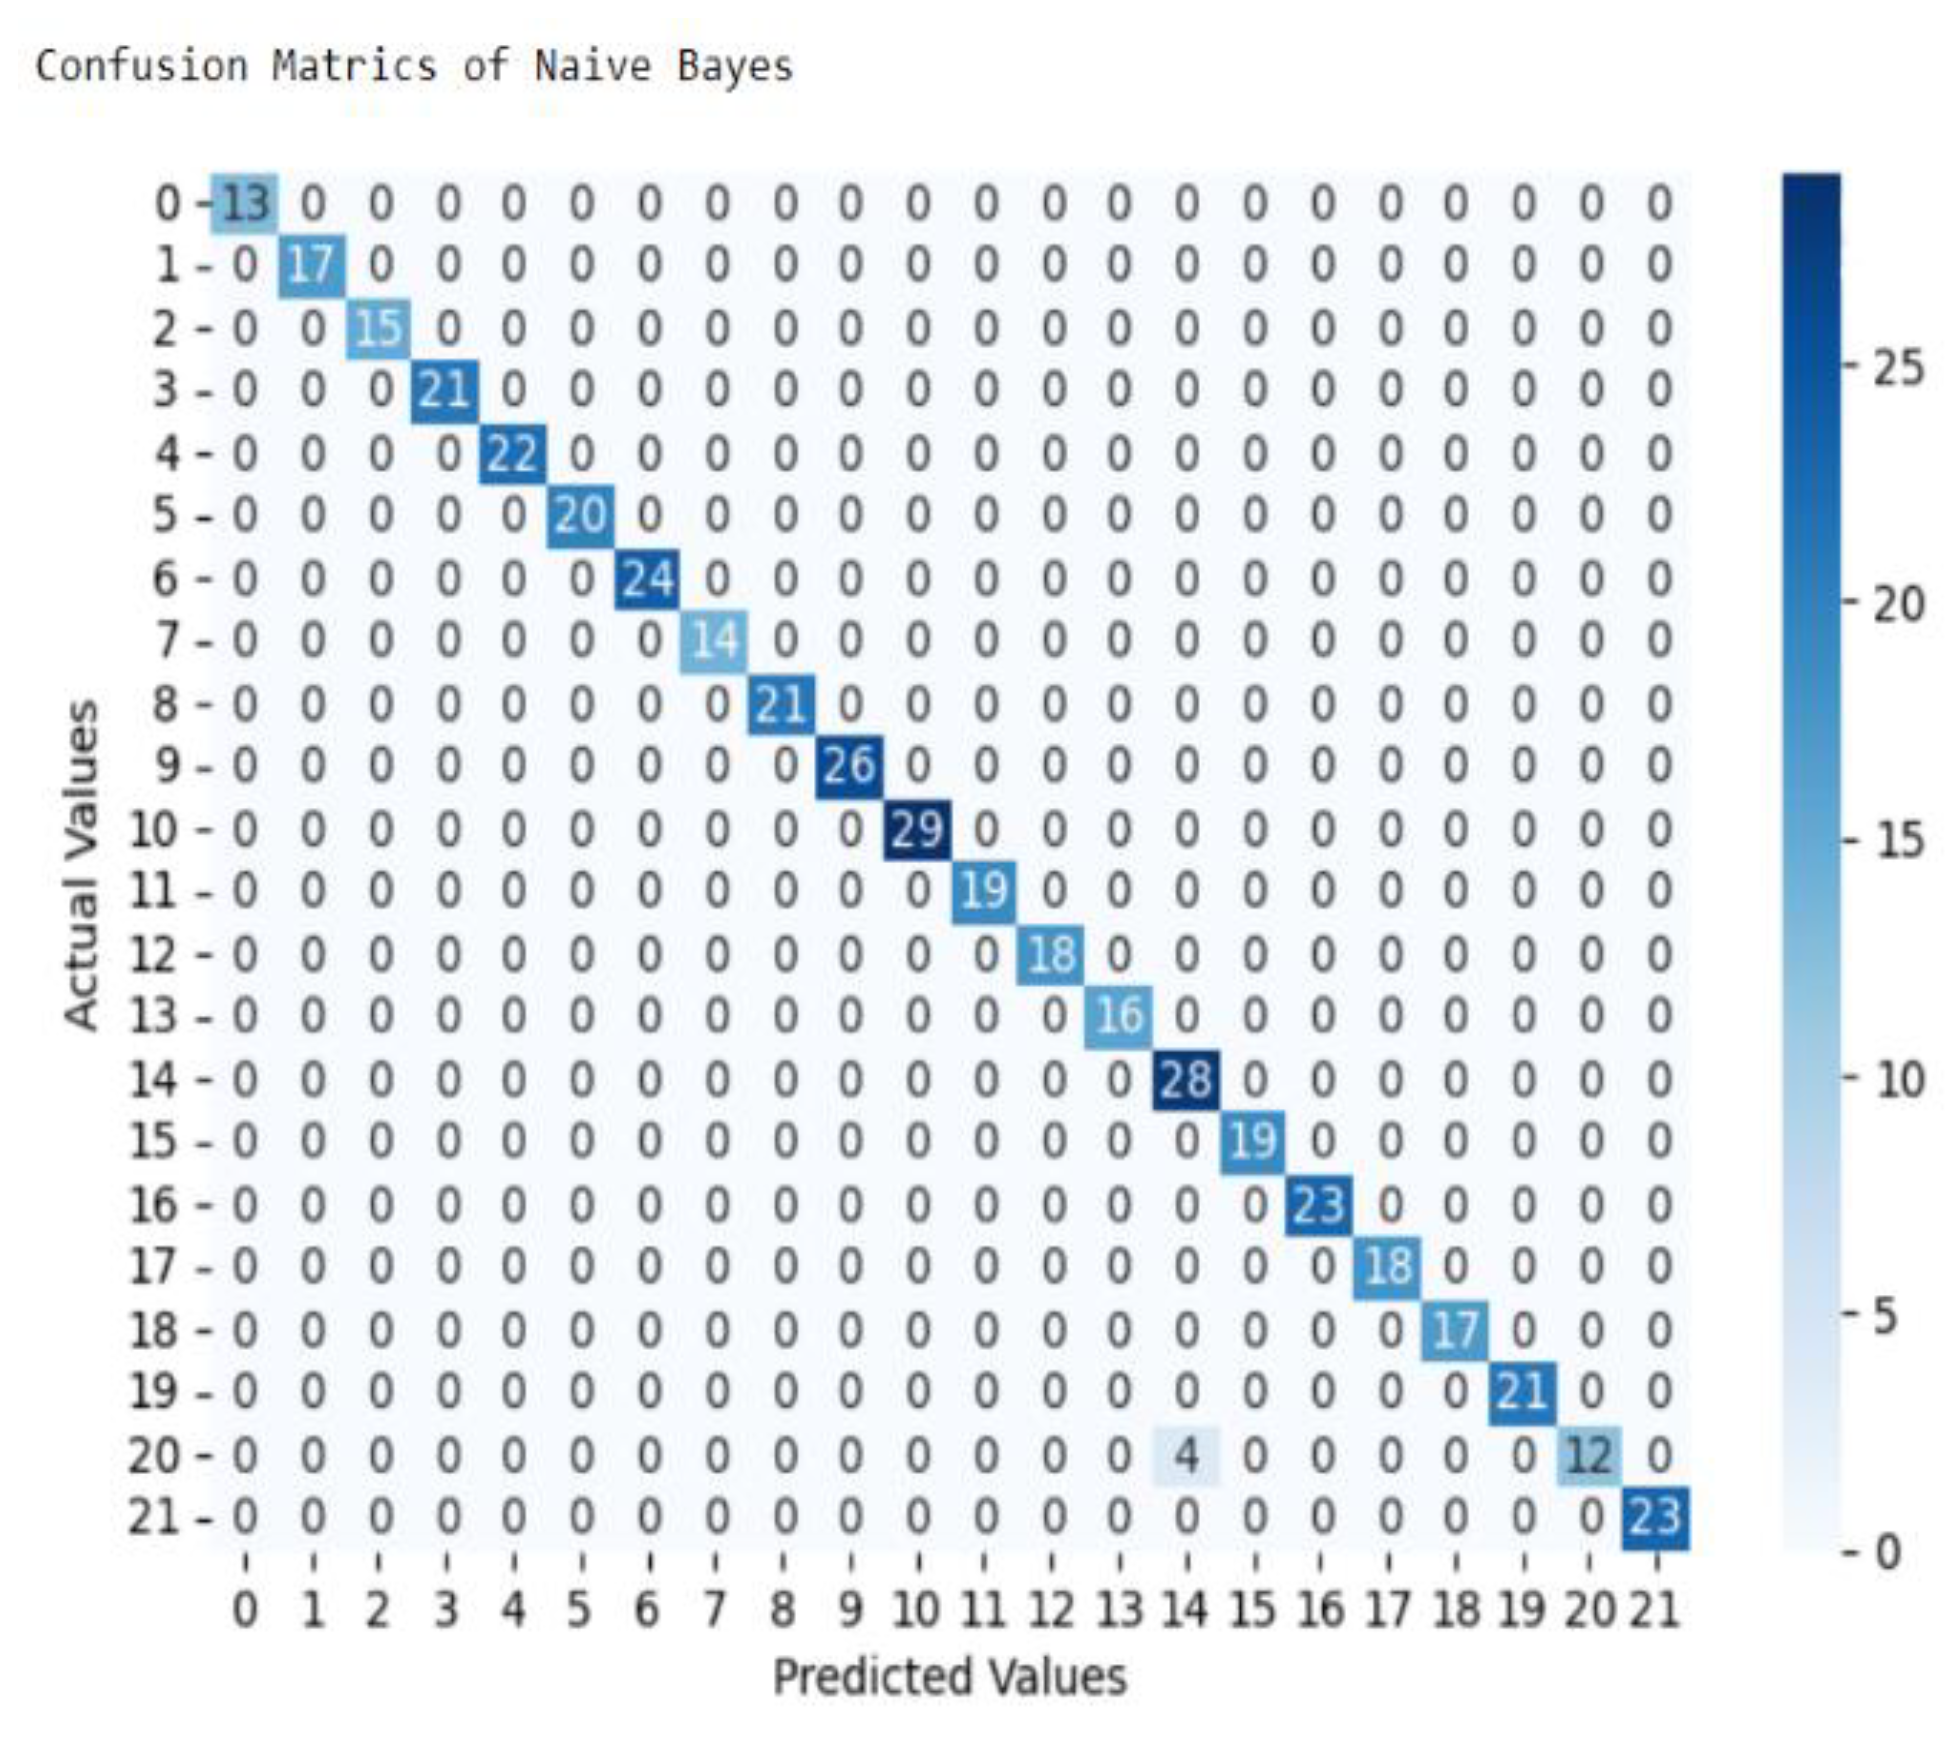
The above classification report and confusion matrix show that out of the total records supplied to the classification algorithm from 440 test set records 20% of dataset, 436 records, 99% are classified correctly and 4 records, only 1% are incorrectly classified. This indicate from total dataset 2196 records out of 2200 records were classified correctly as one of 22 class or crops. From those all classes only 25% of Wheat are incorrectly classified, mean that remaining amount of records were correctly classified respectively. As result, this machine learning algorithm, Naive Bayes model achieves 99% overall accuracy in this experiment.
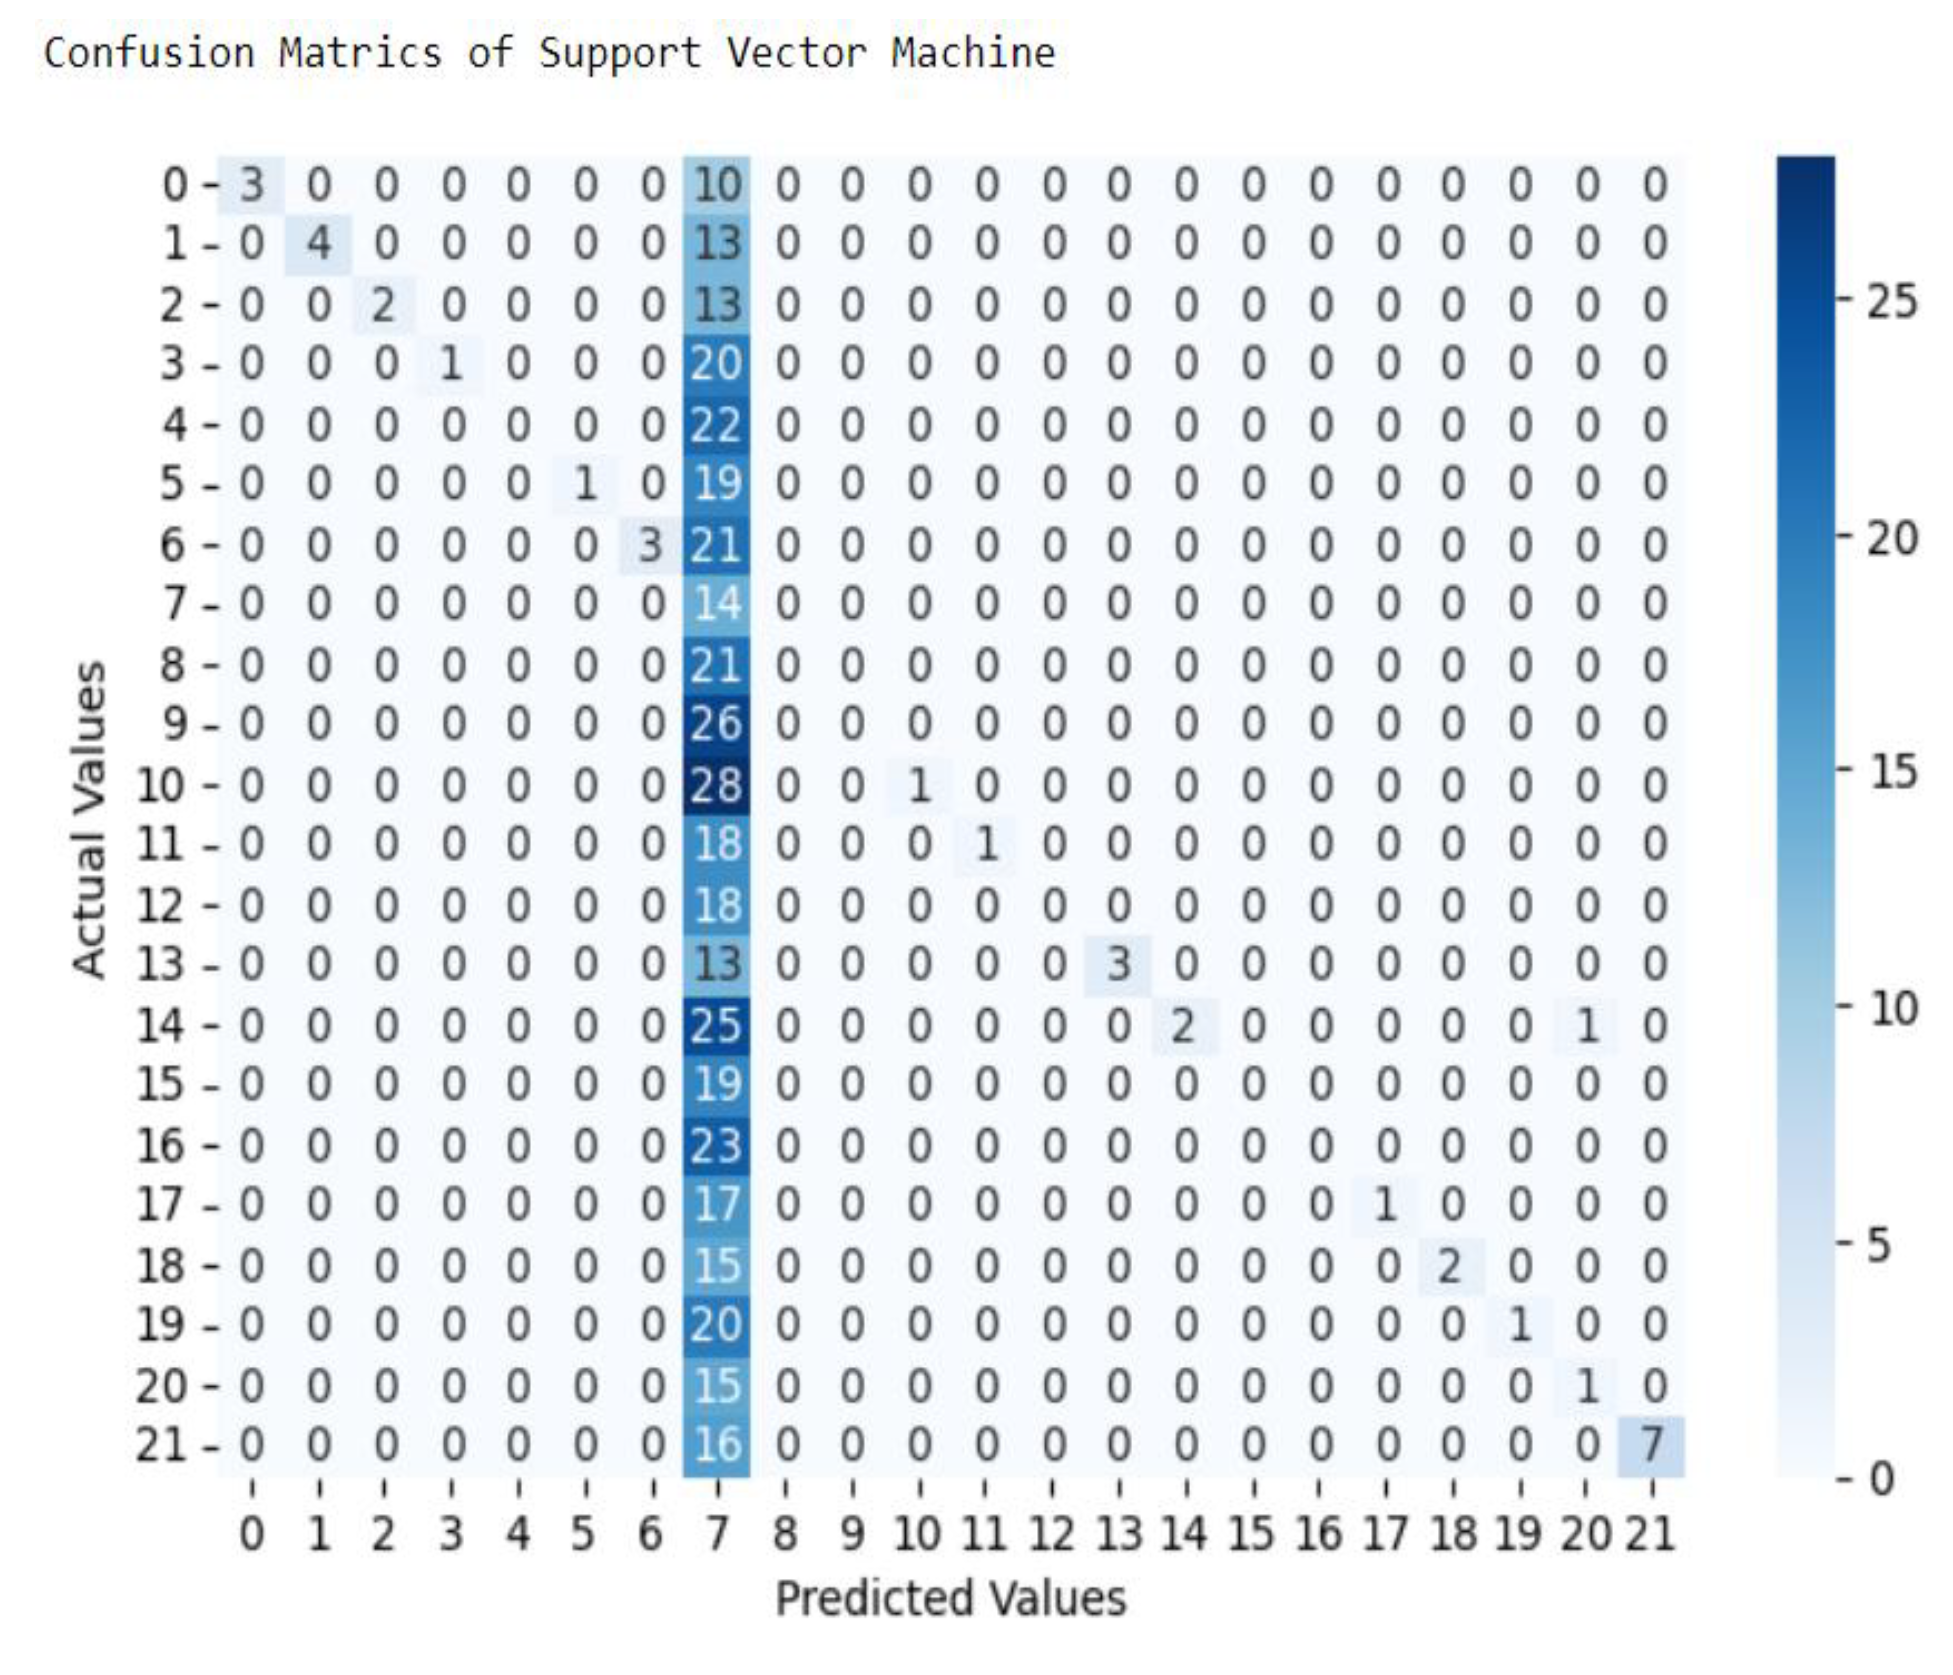
The above classification report and confusion matrix show that out of the total records supplied to the classification algorithm from 440 test set records 20% of dataset, 57 records, 13% are classified correctly and 383 records, about 87% are incorrectly classified. This indicate from total dataset only 286 records out of 2200 records were classified correctly as one of 22 class or crops. From those all classes only Horse Bean records 100% correctly classified from other classes like 30% of Yem, 24% of Banana, 23% of Apple records were correctly classified remaining classes or crops classified insignificant amount. As result, this machine learning algorithm, SVM model achieves 13% overall accuracy in this experiment.
Figure 5.
Confusion Matrices of SVM model.
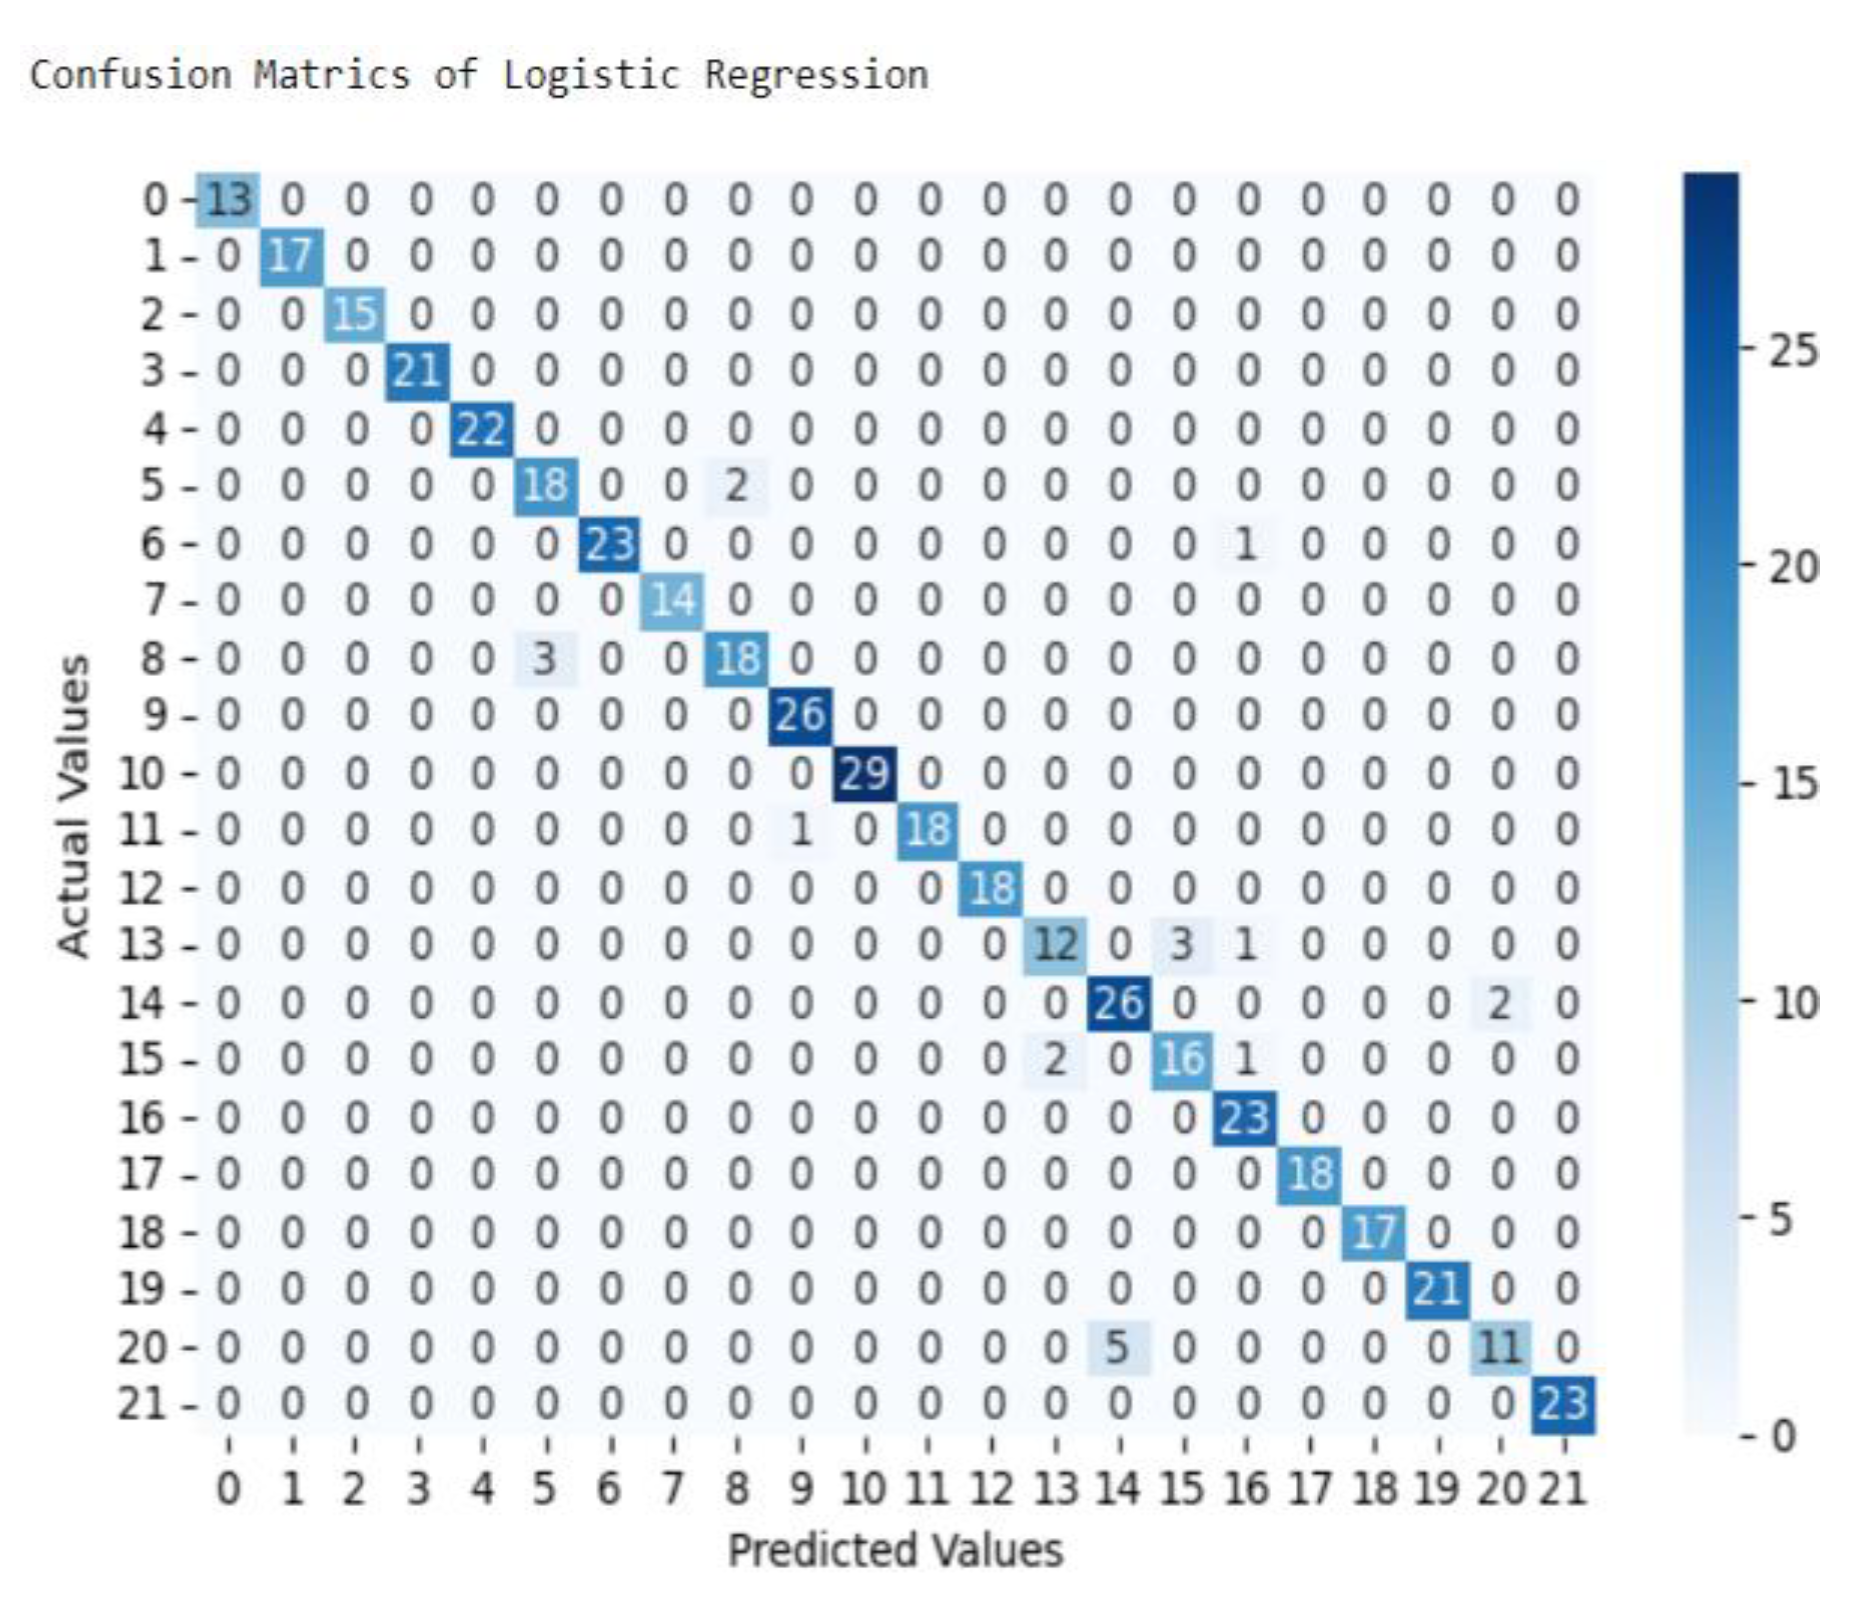
The above classification report and confusion matrix show that out of the total records supplied to the classification algorithm from 440 test set records 20% of dataset, 419 records, 95% were classified correctly and 21 records, about 5% are incorrectly classified. This indicate from total dataset 2090 records out of 2200 records were classified correctly as one of 22 class or crops. From those all classes 31% of Wheat, 25% of Peppers, 16% of sorghum records were incorrectly classified. As result, this machine learning algorithm, Logistic Regression model achieves 95% overall accuracy in this experiment.
Figure 6.
Confusion Matrix of Logistic Regression model.
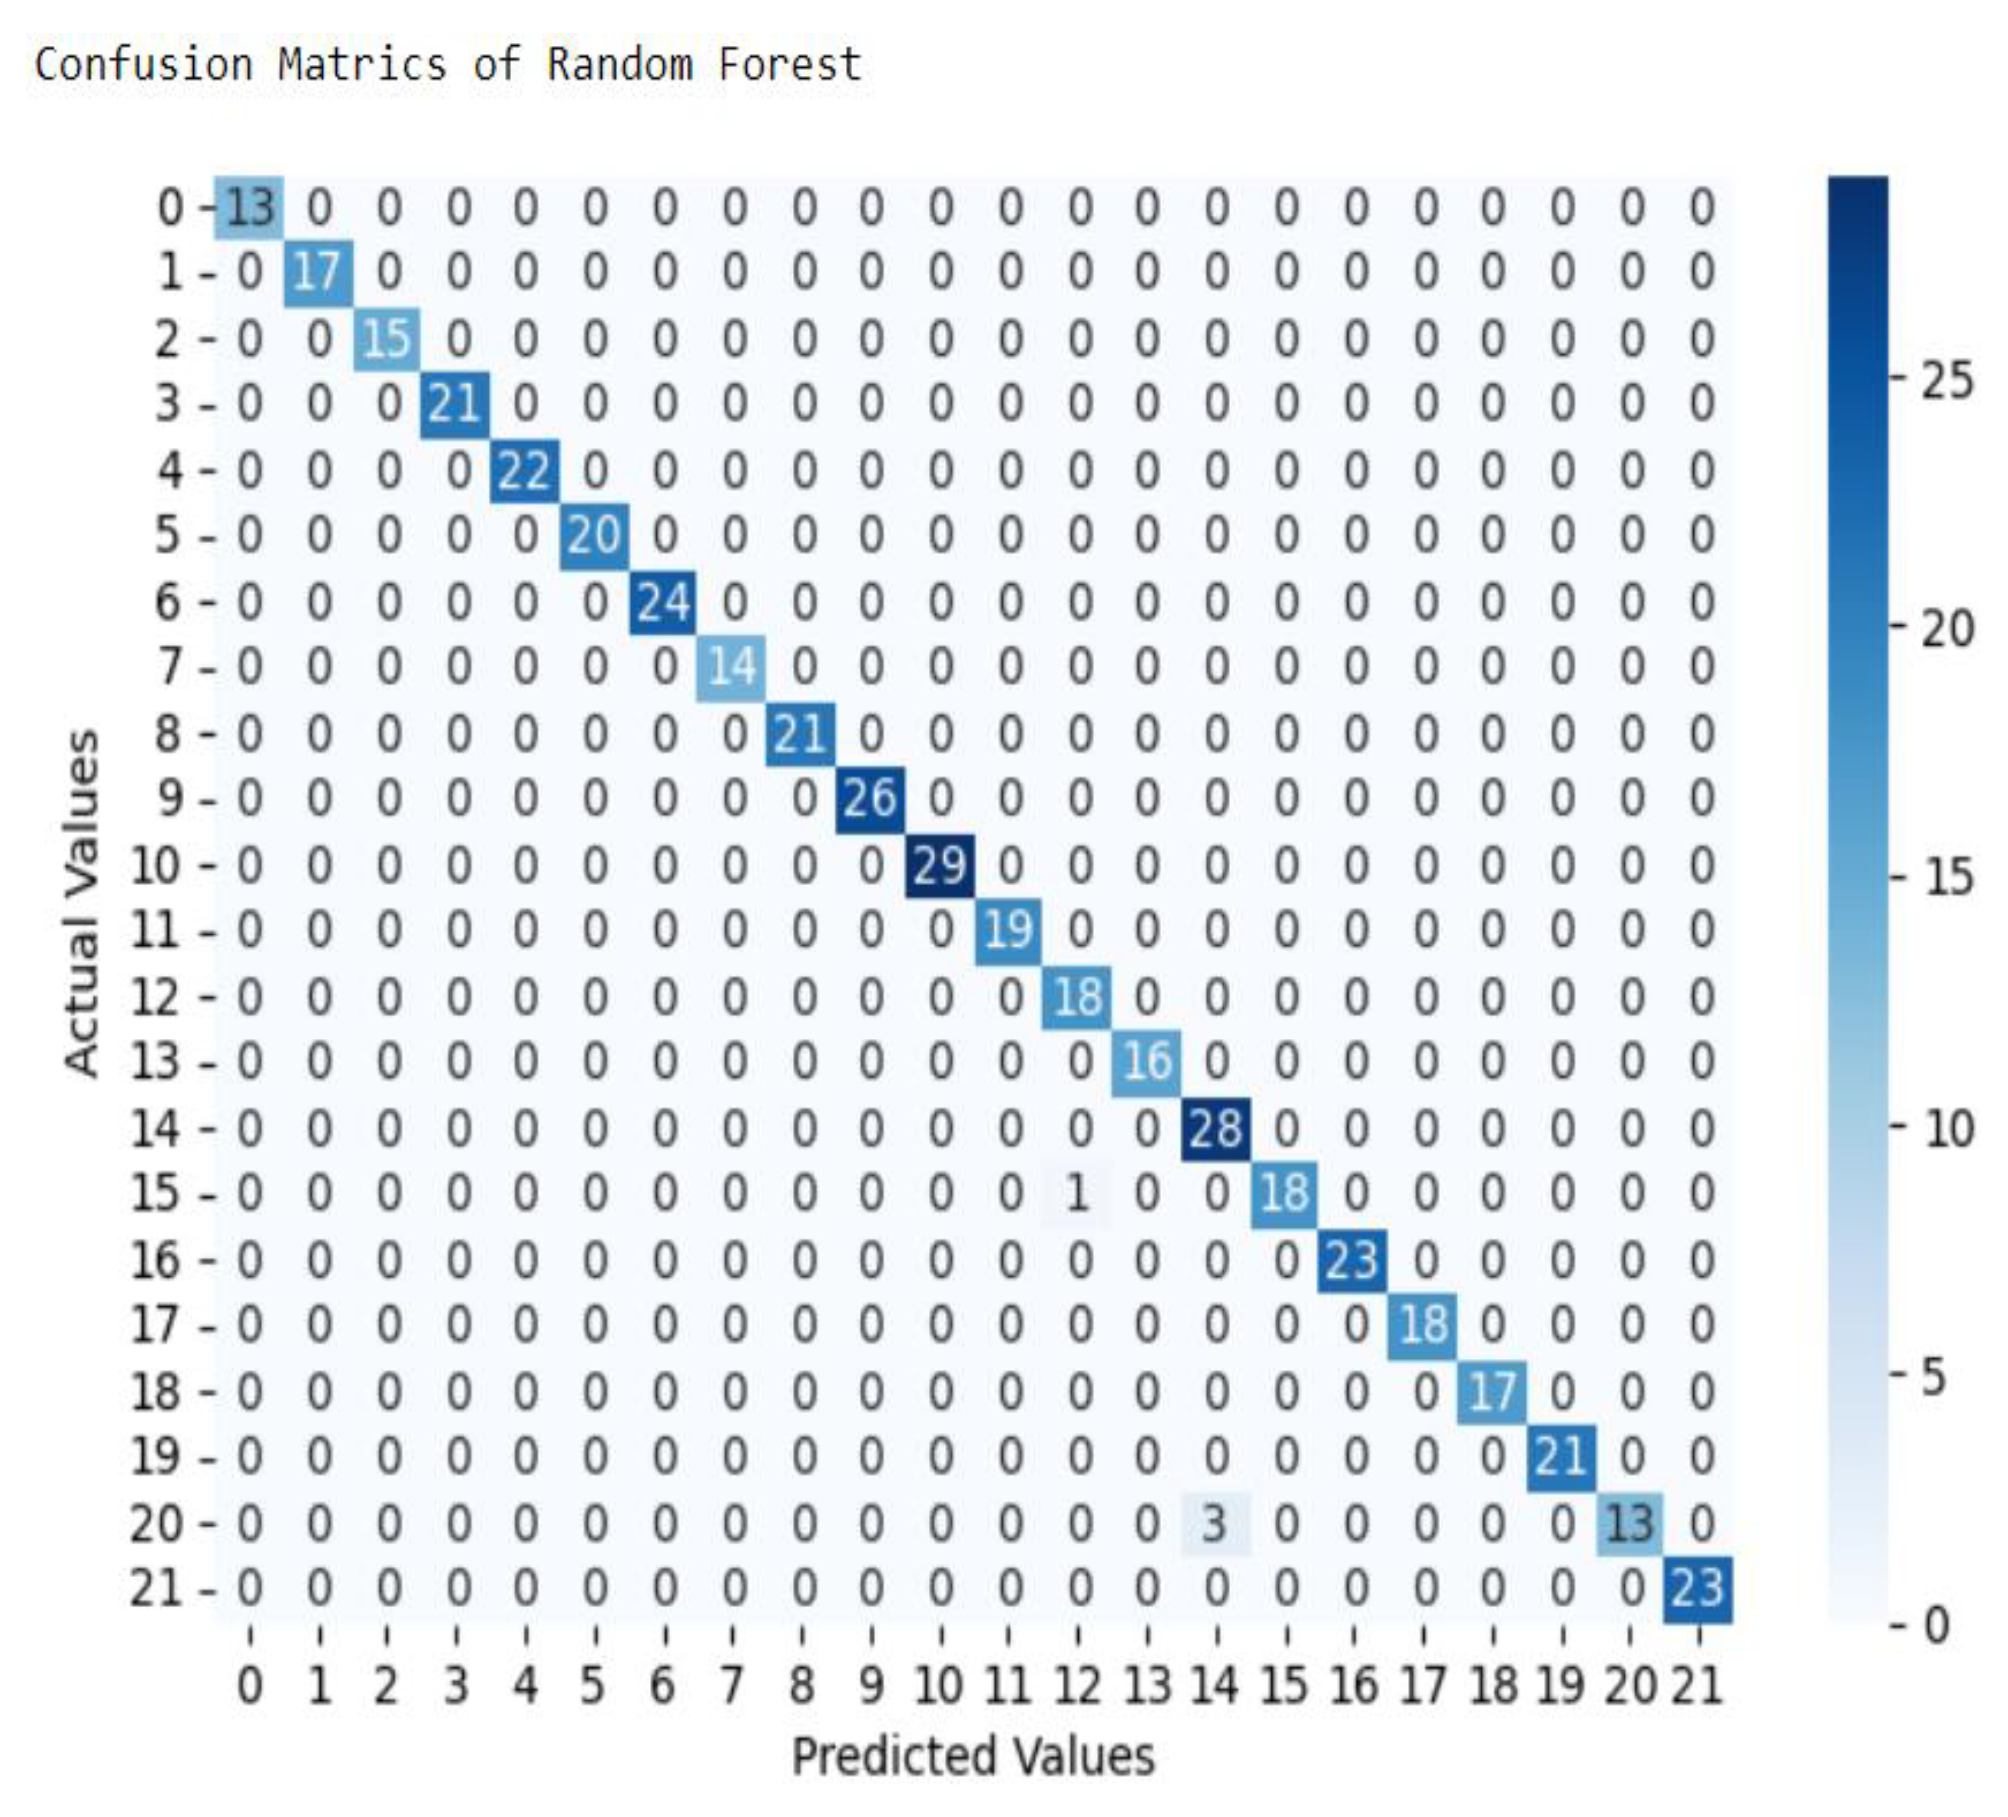
The above classification report and confusion matrix show that out of the total records supplied to the classification algorithm from 440 test set records 20% of dataset, 436 records, 99% are classified correctly and 4 records, only 1% are incorrectly classified. This indicate from total dataset 2196 records out of 2200 records were classified correctly as one of 22 class or crops. From those all classes only 19% of Wheat and only 5% of Sorghum are incorrectly classified, mean that remaining amount 81% and 95% of records were correctly classified respectively. As result, this machine learning algorithm, Random Forest model achieves 99% overall accuracy in this experiment.
Figure 7.
Confusion Matrix of Random Forest model.
8. Discussion
Findings in this study were interpreted and discussed based on all experiments’ results that were produced using selected attributes of the dataset. Researchers divided experiments in to two parts. In part one were to verified using a 5 fold cross-validation testing verses training set techniques. They automatically classified the whole datasets into training and validation dataset which gave the researcher different results when evaluating the models. Finally, the one with better model performance and sound rule sets was taken as a predictive model with the intention of classifying and predicting the agricultural soil fertility into predefined class labels or crops with maximum overall accuracy for this study.
From those all classes none in both Sorghum and Horse Beans, 84% of Papaya, 92.8% of Red Haricot Bean and 62.5% of Wheat are correctly classified, mean that remaining 0%, 0%, 16%, 7.2%, 37.5% of records are incorrectly classified respectively. The remaining 683 records which represent 12.5% are classified incorrectly. As result, this machine learning algorithm, Decision Tree achieves 90% overall accuracy in this experiment.
In the next experiment of building Naive Bayes model, from total dataset (2200 records), 2196 records were classified correctly in to 22 class or crops. From those all classes only 25% of Wheat are incorrectly classified, mean that remaining amount of records were correctly classified respectively. As result, this machine learning algorithm, Naive Bayes model achieves 99% overall accuracy in this experiment.
In the third experiment of building SVM model, from total dataset containing 2200 records only 286 records were classified correctly as one of 22 class or crops. From those all classes only Horse Bean records 100% correctly classified from other classes like 30% of Yem, 24% of Banana, 23% of Apple records were correctly classified remaining classes or crops classified insignificant amount. As result, this machine learning algorithm, Support Vector Machine model achieves 13% overall accuracy in this experiment.
In the fourth experiment of building Logistic Regression model, from total dataset containing 2200 records 2090 records were classified correctly as one of 22 class or crops. From those all classes 31% of Wheat, 25% of Peppers, 16% of sorghum records were incorrectly classified. As result, this machine learning algorithm, Logistic Regression model achieves 95% overall accuracy in this experiment.
In the fourth experiment of building Random Forest model, from total dataset containing 2200 records 2196 records were classified correctly in to 22 class or crops. From those all classes only 19% of Wheat and only 5% of Sorghum are incorrectly classified, mean that remaining amount 81% and 95% of records were correctly classified respectively. As result, this machine learning algorithm, Random Forest model achieves 99.5% overall accuracy in this experiment.
As a result shown in Figure 7, the confusion matrix, it is also possible to calculate statistical metrics such as confusion matrix reports such as F1-score, precision, recall, accuracy on the test data set, the Random Forest model was built with better performance. Besides, it reduced the number of misclassified records of different labels or crops’ suitable soil fertility. All those five experiments conducted in part one are done using with 5-fold cross validation.
Figure 8.
Evaluation results for experiments in part one of five models with all attributes.
The other task was evaluation of Logistic Regression, Naive Bayes and Random Forest algorithm was tested by changing learning rate, hidden layer and momentum values with the intention to achieve the model’s performance. Random Forest model achieves 99% overall accuracy in this experiment by using 2200 classified correctly in to 22 class or crops and using finally selected 7 attributes.
In experiment part two researcher is aimed to evaluate models by conducting experimenters using K-fold cross-validation data set portioning technique by tuning the value of K in to 5 and 10 as shown in Table 2 and 2. The last and best practice of datasets partitioning technique is using K-fold cross-validation. As shown in Table 2 for this research, the study researchers achieve maximum result by assigning K value 5 and also using K value as 5 is recommended for machine learning containing minimum dataset size.

Table 1.
Experiments result of K-Fold (K-F) Cross Validation where K=10.
| Models | F-1 | F-2 | F-3 | F-4 | F-5 | F-6 | F-7 | F-8 | F-9 | F-10 | Aver |
|---|---|---|---|---|---|---|---|---|---|---|---|
| Decision Tree | 0.92 | 0.94 | 0.92 | 0.92 | 0.91 | 0.92 | 0.86 | 0.92 | 0.94 | 0.93 | 0.92 |
| Naive Bayes's | 1 | 0.99 | 1 | 0.99 | 0.99 | 1 | 0.99 | 1 | 0.98 | 0.99 | 0.95 |
| SVM's | 0.28 | 0.25 | 0.27 | 0.31 | 0.27 | 0.32 | 0.25 | 0.29 | 0.31 | 0.30 | 0.29 |
| Logistic Regression | 0.95 | 0.95 | 0.95 | 0.97 | 0.95 | 0.97 | 0.97 | 0.95 | 0.95 | 0.95 | 0.96 |
| Random Forest's | 0.99 | 0.99 | 1 | 0.98 | 0.99 | 0.99 | 0.99 | 0.99 | 0.98 | 0.99 | 0.94 |
Table 2.
Experiments result of K-Fold Cross Validation where K=5.
| Models | Fold 1 | Fold 2 | Fold 3 | Fold 4 | Fold 5 | Aver |
|---|---|---|---|---|---|---|
| Decision Tree | 0.926 | 0.909 | 0.918 | 0.870 | 0.926 | 0.907 |
| Naive Bayes's | 0.994 | 0.992 | 0.995 | 0.990 | 0.991 | 0.99 |
| SVM | 0.127 | 0.119 | 0.129 | 0.117 | 0.118 | 0.13 |
| Logistic Regression | 0.95 | 0.966 | 0.948 | 0.966 | 0.943 | 0.954 |
| Random Forest | 0.998 | 0.995 | 0.998 | 0.993 | 0.989 | 0.995 |
Besides, researchers evaluated all 5 models by applying traditional dataset splitting techniques such partitioning dataset into training and testing for range 60/40 f/or large, 70/30 for medium and 80/20 for small data sets. As shown in Table 3 relative to those techniques 80/20 dataset splitting to provide good performance on Random Forest algorithm. However, result of those experiments show that low when we compared to that of K-fold cross validation data partitioning technique.
Table 3.
Experiments result of Traditional Dataset Splitting.
| Models | 80/20 | 70/30 | 60/40 |
|---|---|---|---|
| Decision Tree | 0.90 | 0.87 | 0.86 |
| Naive Bayes's | 0.9977 | 0.99 | 0.98 |
| SVM's | 0.11 | 0.7 | 0.5 |
| Logistic Regression | 0.95 | 0.96 | 0.95 |
| Random Forest's | 0.99 | 0.987 | 0.972 |
| Random Forest's | 0.99 | 0.987 | 0.972 |
9. Conclusions
Agriculture is pillar for nation economy for developing country like Ethiopia. In order to insure high quantity and quality agricultural crop production, soil fertility play great role. Soil fertility is capability of a soil to sustain crop growth by providing essential crop nutrients and favorable chemical, physical, and biological characteristics as a habitat for crop growth in particular area. Classifying soil fertility level for particular crops to sow in certain soil types is important. SNNPR is third major producer and supplier of fruits, vegetables, and cereals root crops but crop production is lower than expected. Development of machine learning model to automize classification of soil fertility for particular crop. Researchers done different experiments using dataset containing 2200 soil fertility records of 22 well producing crops from SNNPR. There are five machine learning algorithms used for comparative analysis to select best performance one using K-fold cross validation. Such as Logistic Regression (95%), SVM(13%), Decision Trees(90%), Random Forest(99.5%), and Naive Bayes(99%) accuracy achievement in each of them. As a result Random Forest algorithm was built with best performance with 99.5% accuracy and researcher decided to design the model for successful prediction of soil fertility and productivity for particular crop in SNNPR.
Author Contributions
Conceptualization, M. Z. S.; methodology, M. Z. S., H. S. A. and A. D.; software, H. S. A.; validation, M. Z. S., H. S. A. and A. D.; formal analysis, M. Z. S., H. S. A. and A. D.; investigation, M. Z. S., H. S. A. and A. D.; resources, H. S. A. and A. D.; data curation, M. Z. S., H. S. A. and A. D.; writing—original draft preparation, M. Z. S., and H. S. A.; writing—review and editing, H. S. A. and A. D.; visualization, M. Z. S.; supervision, H. S. A.; project administration, H. S. A. All authors have read and agreed to the published version of the manuscript.
Funding
This research was funded by Wachemo University, Ethiopia.
Institutional Review Board Statement
Not applicable.
Informed Consent Statement
Not applicable.
Data Availability Statement
Data supporting the reported results can be found at [16].
Conflicts of Interest
The authors declare no conflicts of interest.
Abbreviations
The following abbreviations are used in this manuscript:
| ATA | Agricultural Transformation Agency |
| CNN | Convolutional Neural Networks |
| DNN | Deep Neural Networks |
| DSRM | Design Science Research Methodology |
| ECEC | Effective Cation Exchange Capacity |
| GDP | Growth Domestic Product |
| GRNN | General Regression Neural Network |
| GTP | Government Transformation Programme/Plan |
| ha | Hectare area |
| MLP | Multilayer Perceptron |
| MLR | Multiple Linear Regression |
| RNN | Recurrent Neural Network |
| SVM | Support Vector Machine |
| SNNPR | South Nation Nationality and People Region |
References
- Central Statistical Agency, "Agricultural Sample Surveys(Crop Yield for Major Grain Crops , Private Small holder Farms )," pp. 1-15, September 2015.
- Francis Abuye, Mitiku Haile, Wassie Haile and Befekadu G/Hanna, "Soil fertility status, fertilizer application and nutrient balance in SNNPR, southern Ethiopia in contrasting agro-ecological zones of Ethiopia," African Journal of Agricultural Research, vol. 17, no. 11, pp. 1433-1452, November 2021. [CrossRef]
- Jagdeep Yadav, Shalu Chopra, Vijayalakshmi M, "Soil Analysis and Crop Fertility Prediction Using Machine Learning," International Journal of Innovative Research in Advanced Engineering (IJIRAE), vol. 8, no. 03, pp. 41-50, March 2021. [CrossRef]
- D. A. Zebire, T. Ayele and M. Ayana,, "Characterizing soils and the enduring nature of land uses around the Lake Chamo Basin in South-West Ethiopia," Journal of Ecology and Environment, pp. 2-32, April 2019. [CrossRef]
- G. T. Mekonnen and L. Garuma, "Climate Change and Variability Impacts on Crop Productivity and its Risk in Southern Ethiopia," Global Journal of Science Frontier Research, vol. 21, no. 5, 2021.
- Sk Al Zaminur Rahman, Kaushik Chandra Mitra, S.M. Mohidul Islam, "Soil Classification using Machine Learning Methods and Crop Suggestion Based on Soil Series," ICCIT, pp. 2-10, 21-23 December, 2018. [CrossRef]
- Hao Li, Weijia Leng, Yibing Zhou, Fudi Chen, Zhilong Xiu, and Dazuo Yang, "Evaluation Models for Soil Nutrient Based on Support Vector Machine and Artificial Neural Networks," The Scientific World Journal, vol. 2014, pp. 1-7, 2014. [CrossRef]
- Thomas van Klompenburg, Ayalew Kassahun, Cagatay Catal, "Crop yield prediction using machine learning: A systematic literature review," Computers and Electronics in Agriculture, vol. 177, 8 August 2020. [CrossRef]
- Gilson Augusto Helfera, Jorge Luis Victória Barbosa, Ronaldo dos Santos, "A computational model for soil fertility prediction in ubiquitous agriculture," Computer and Electronics in Agriculture, vol. 175, 2020. [CrossRef]
- B. B. Desmond , "Design Science Research Methodology in Computer Science and Information System," ResearchGate, pp. 1-7, 01 November 2016.
- A. R. Hevner, S. T. March, P. Jinsoo and R. Sudha , "Design Science in IS Research," vol. 28, pp. 75-105, March 2004.
- K. Peffers, T. Tuunanen, B. A. Marcus and C. Samir, "A Design Science Research Methodology for Information Systems Research," Journal of Management Information Systems, p. 45–77, August 2007. [CrossRef]
- V. M. Isabella, R. d. l. Harpe and S. R. Po, "Deploying Design Science Research in Deploying Design Science Research in South Africa," in Twentieth Americas Conference on Information Systems, Savannah, 2015.
- A. I. Isong, K. John and N. Michael , "Using Machine Learning Algorithms to Estimate Soil Organic Carbon Variability with Environmental Variables and Soil Nutrient Indicators in an Alluvial Soil," LAND, vol. 9, no. 12, pp. 1-12, 2 December 2020. [CrossRef]
- D. S. Wankhede, "Analysis and Prediction of Soil Nutrients pHNPK for Crop using Machine Learning Classifier, PhD Research Scholar Alliance University,," PhD Research Scholar Alliance University, 2020.
- G. C. Repository., 27 March 2025. Available online: https://github.com/melesez/Soil-fertility (accessed on 27 March 2025).
Figure 1.
DSRM Processes Model.
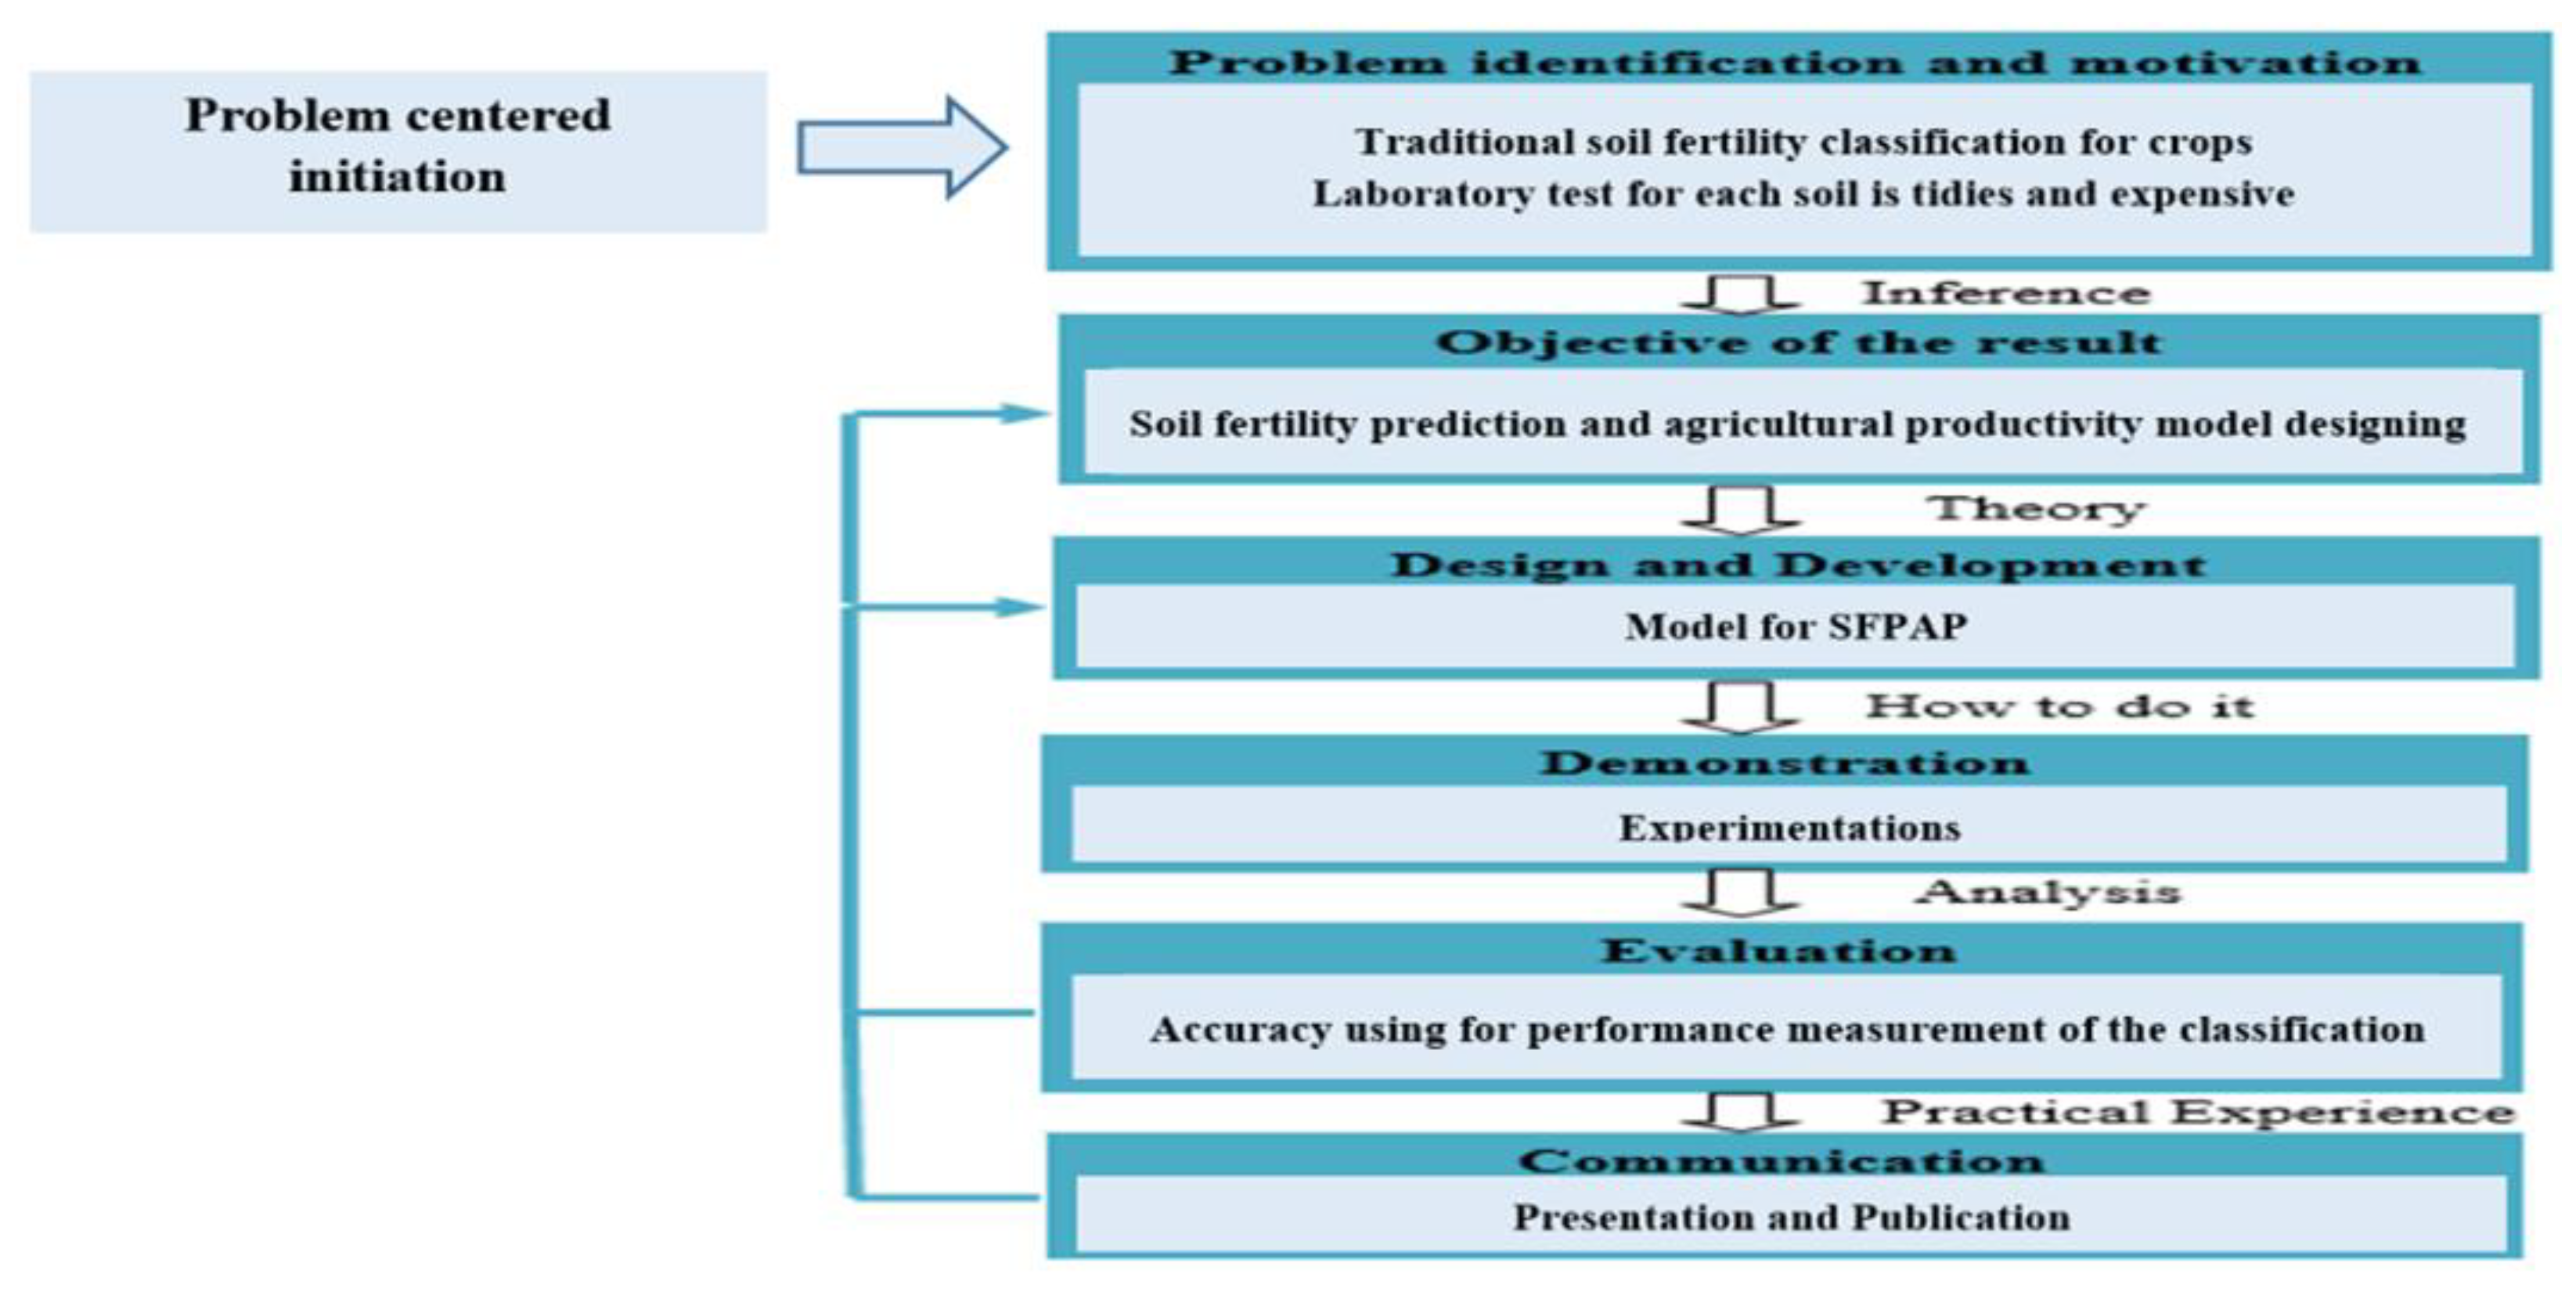
Figure 3.
Confusion Matrices of Decision Tree.
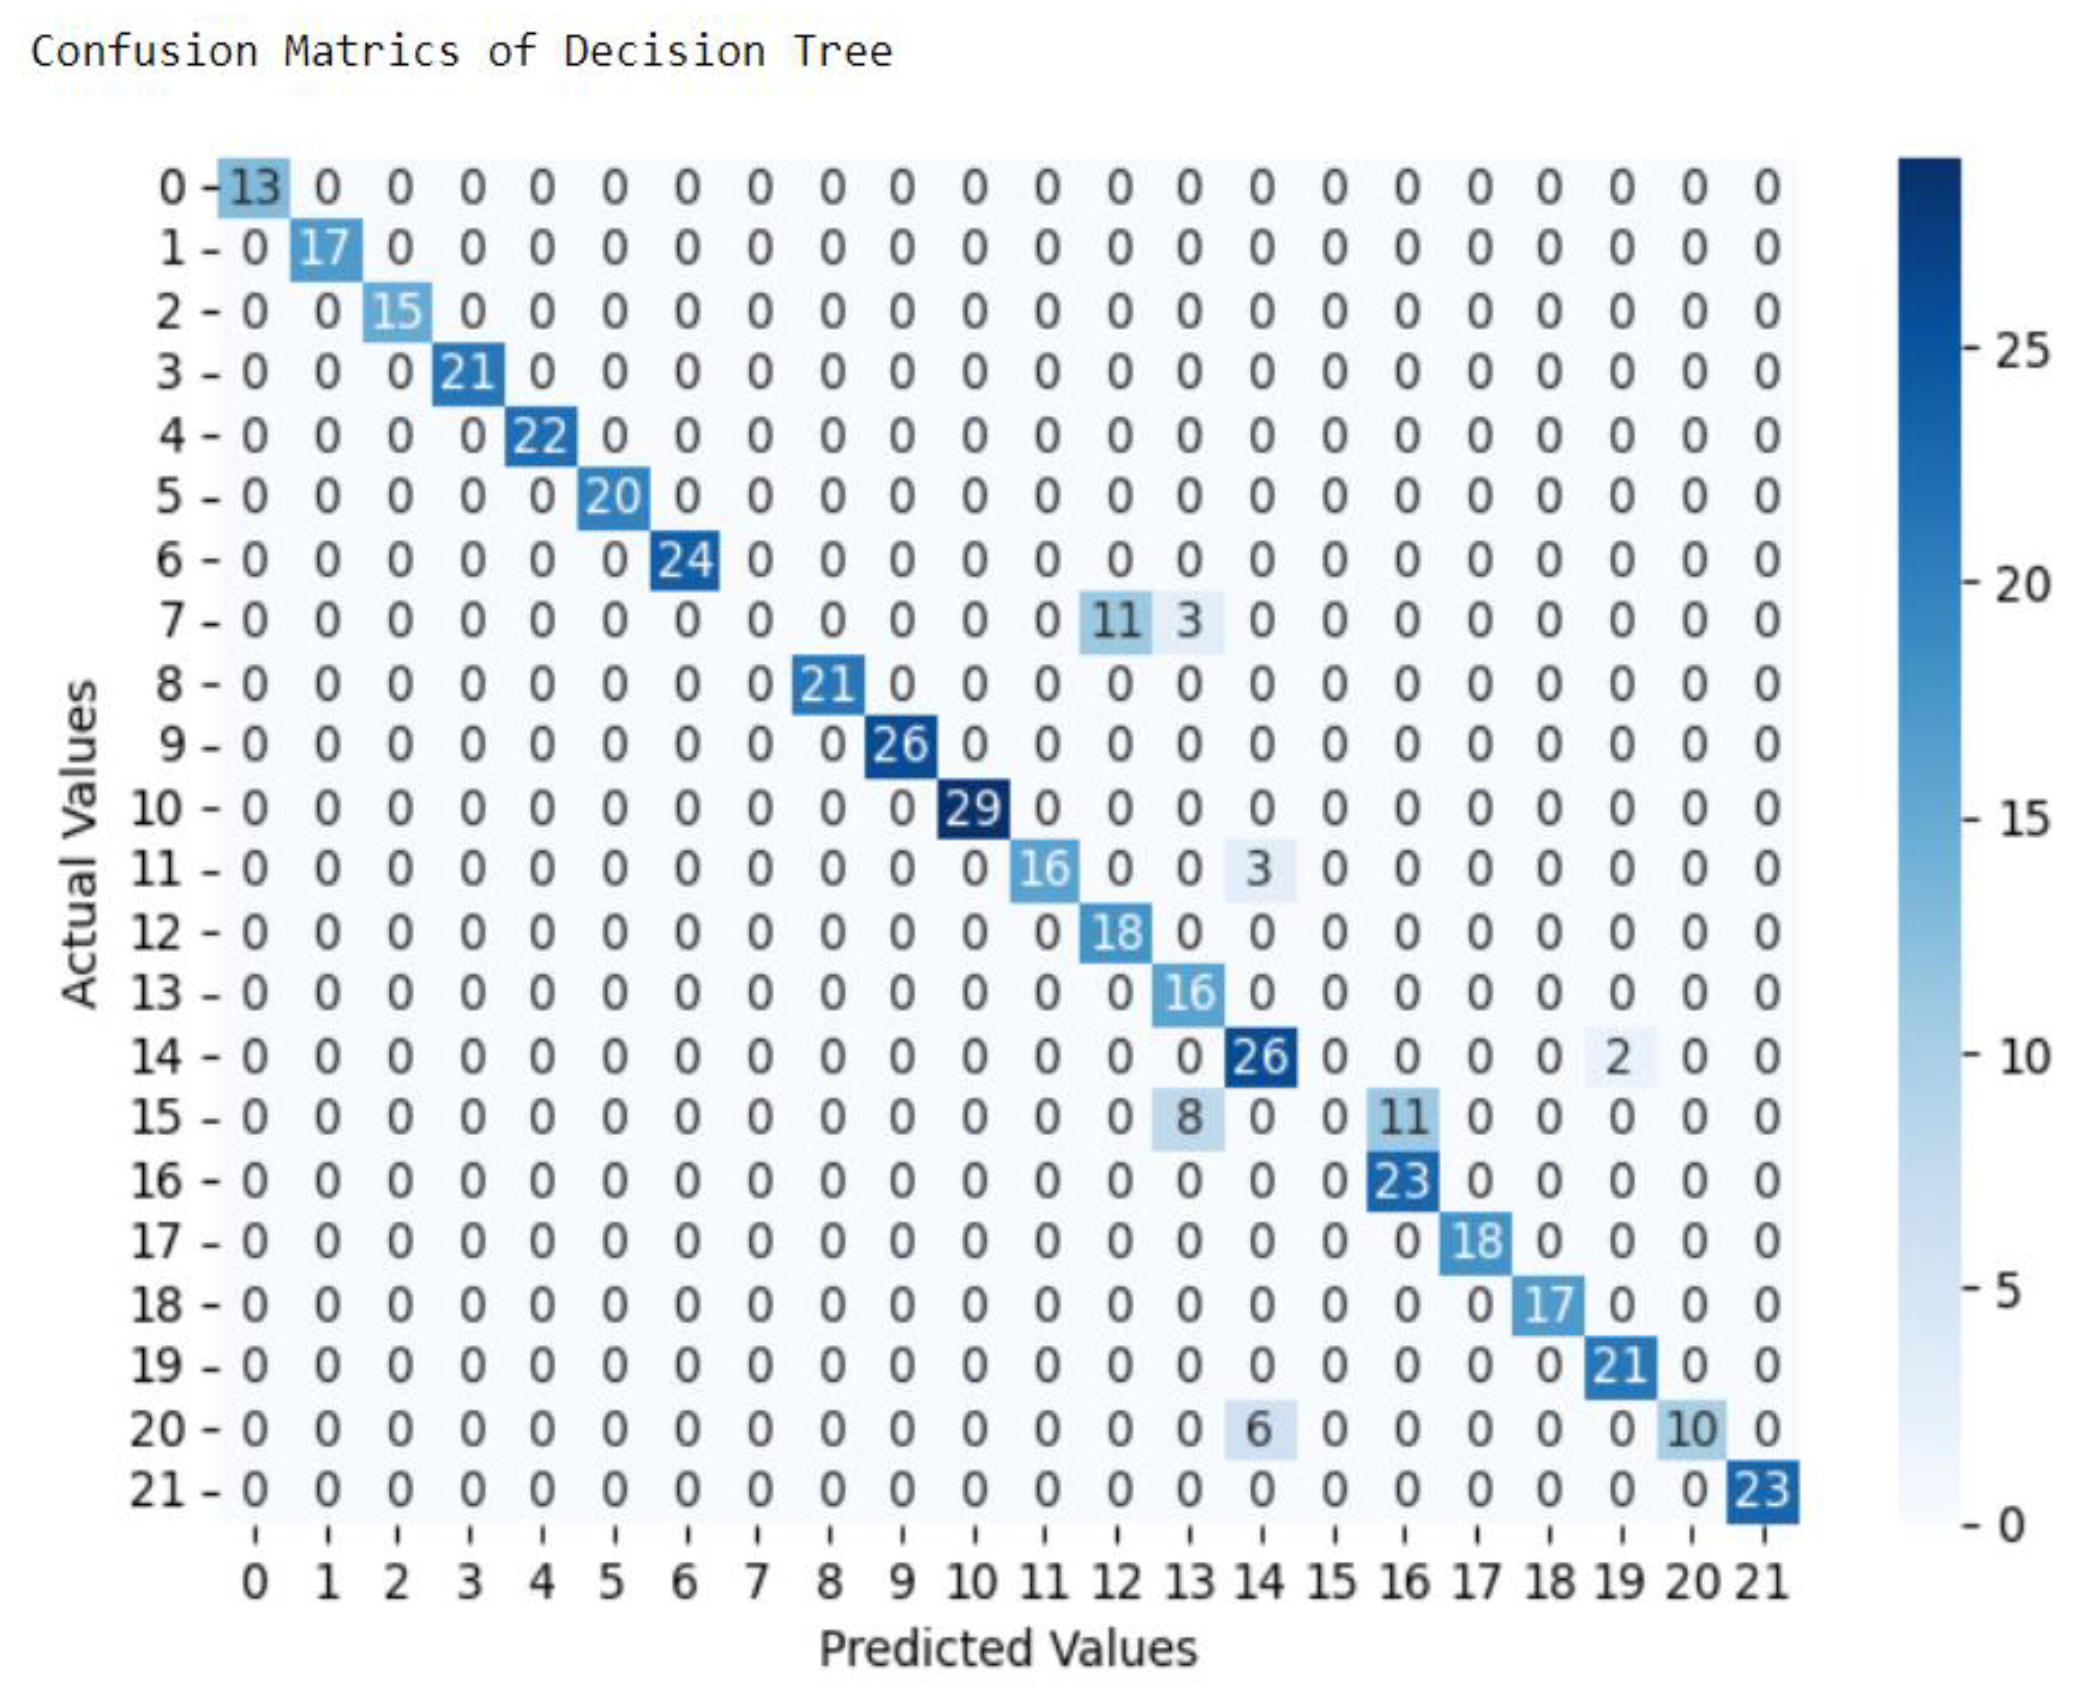
Figure 4.
Confusion Matrices of Naive Bayes model.
Disclaimer/Publisher’s Note: The statements, opinions and data contained in all publications are solely those of the individual author(s) and contributor(s) and not of MDPI and/or the editor(s). MDPI and/or the editor(s) disclaim responsibility for any injury to people or property resulting from any ideas, methods, instructions or products referred to in the content. |
© 2025 by the authors. Licensee MDPI, Basel, Switzerland. This article is an open access article distributed under the terms and conditions of the Creative Commons Attribution (CC BY) license (http://creativecommons.org/licenses/by/4.0/).
Copyright: This open access article is published under a Creative Commons CC BY 4.0 license, which permit the free download, distribution, and reuse, provided that the author and preprint are cited in any reuse.


