
Submitted:
28 March 2025
Posted:
31 March 2025
You are already at the latest version
Abstract
As a sensitive indicator of climate change, vegetation ecological quality on the Tibetan Plateau (TP) plays a crucial role in indicating environmental change. Based on the meteorological and ecological data on the TP from 2001 to 2020, we analyze the variations of different vegetation types and their relationship with atmospheric circulations. The results suggest that the overall ecological quality of vegetation on the TP shows an improvement trend. The ecological quality index (EQI) of sparse shrubs increases dramatically, while it of evergreen coniferous forests shows a decreasing trend. Warming is an important factor contributing to the EQI increase in the northeastern TP. Precipitation increase is not favorable to the EQI increase in the southwest of grasslands. Furthermore, the strengthening of the East Asian and South Asian summer monsoons is beneficial for the EQI increase of coniferous forests and evergreen broad-leaved forests. The remarkable warming and humidifying in deciduous broad-leaved forests, mixed forests, partial shrubs and evergreen broad-leaved forests, and the meridional water vapor transport in the central-southern TP, is conducive to EQI increase. Although the strengthening of the TP summer monsoon and westerly remarkably favors the EQI increase in grasslands and shrubs, the variations in meridional water vapor flux transport in the northeast area and the zonal water vapor flux transport in the west, results in the marked EQI decrease. Thus, the northeastern and western parts are the main areas of ecological quality degradation. The results can provide a basis for ecological restoration and protection, the development and utilization of climate resources on the TP.
Keywords:
Tibetan Plateau
; vegetation ecological quality
; climate change
; atmospheric circulation
1. Introduction
Since the 1980s, the Tibetan Plateau (TP) has experienced a more pronounced warming trend, and the warming rate is about twice the global average [1,2]. It poses unprecedented challenges to the ecological security of the TP. The TP is a climate-sensitive and ecology-fragile region [3], whose warming trend not only affects the lives of local residents but also has important implications for global climate change [4].
Previous studies on the vegetation ecological quality on the TP have mainly focused on the spatial distribution characteristics of net primary productivity (NPP) in terms of different regions, vegetation types and models, or the correlations between the spatial distribution characteristics of vegetation cover and climate factors. For example, the Global Inventory Modelling and Mapping Studies normalized difference vegetation index (NDVI) and multiple models were used to analyze the variation characteristics of vegetation and surface temperature on the TP and their relationship [4,6,7,8]. Some studies investigated the spatiotemporal variation characteristics of the NPPs of different vegetation types on the TP and their associations with climatic factors [8,9,10]. The influence of meteorological driving factors on vegetation coverage were examined. It is highlighted that the vegetation on the TP is currently in a stable recovery state, which is closely associated with temperature and precipitation during the same period [11,12,13]. In addition, several studies analyzed the spatial distribution characteristics of fractional vegetation cover (FVC) variations in alpine grasslands of the TP and their relationships with climate [14,15] using ecological models [16], time-lag cross-correlation methods and based on various types of data such as field measurement data, remote sensing data, frozen soil distribution data, soil water and heat data and meteorological data.
Vegetation ecological quality involves not only the NPP and vegetation cover, but also their joint effect. The comprehensive ecological quality index (EQI) based on the NPP and vegetation cover has been applied to assess the vegetation ecological quality in the Shiyang River Basin, Yellow River Basin[17,18], Tarim Basin and even the entire region of China [19,20,21]. Therefore, in this study, we quantitatively analyze the spatio-temporal evolution pattern of vegetation ecological quality on the TP using the comprehensive EQI. Additionally, we investigate the effect of the westerly-monsoon synergy that reflects atmospheric circulation characteristics on the ecological quality variations of vegetation, aiming to enrich the knowledge on ecological environment variations on the TP, and provide scientific support for government decision-making.
The remainder of this paper is organized as follows. Section 2 introduces the study area, data and methods. Section 3 shows the results and the analyses, including the spatio-temporal evolution of vegetation ecological quality, the response of the EQI on the TP to climate change and the impact of atmospheric circulations. The discussion and the main conclusions are presented in sections 4 and 5, respectively.
2. Materials and Methods
2.1. Study Area
The TP is located in the region of 25°59′37″N–39°49′33″N, 73°29′56″E–104°40′20″E, with an area of about 2,500,000 km2 and an average altitude of more than 4,000 m [22]. The annual average temperature is between −4℃ and 13.4℃, and the spatial distribution of precipitation is uneven. In summer, the precipitation in most areas of the TP is abundant due to the influences of the southwesterly monsoon and warm-wet airflow from the Indian Ocean. However, more gales and less precipitation can be observed in winter due to the remarkable impact of the westerly belt. From the northwest to the southeast, the TP can be divided into arid, semi-arid, semi-humid and humid areas according to Climate characteristics. Thus, the vegetation types are complex on the TP, and they display distinct distinctive geographical differences (Figure 1).
2.2. Data
In this research, the NDVI remote sensing data are adopted, which are the Moderate Resolution Imaging Spectroradiometer (MODIS) vegetation index product (MOD13A3) provided by the National Aeronautics and Space Administration, with a spatial resolution of 500 m. The NDVI data are preprocessed by the Aeronautical Reconnaissance Coverage Geographic Information System (ArcGIS) and the Environment for Visualizing Images software, and the annual maximum NDVI is extracted through a maximum value composite method. The NPP data (g C m−2 a−1) is from the MOD17A3 dataset of the MODIS product, with a spatial resolution of 500 m. In addition, the basic data, including vegetation types, land-use types, elevation and boundaries, are obtained from the National Tibetan Plateau Data Center (http://data.Tpdc.Ac.cn) and Resource and Environmental Science and Data Center (https://www.resdc.cn). The meteorological data are from the Daily Meteorological Dataset of Basic Meteorological Elements of China National Surface Weather Station (version 3.0) released by the National Meteorological Information Center. The daily temperature and precipitation observation data from 108 meteorological stations on the TP are selected to calculate the annual average temperature and annual rainfall amount. Moreover, the data are interpolated to the grid of 0.25°× 0.25° by the ordinary Kriging method. Additionally, the method for extracting multiple values to points in the ArcGIS is used for extracting the raster data to grid data. The resampling method of the ArcGIS is also adopted to unify the resolutions of the vegetation indices and meteorological data.
2.3. Methods and Evaluation Indicator
3.1.1. Ecological and Circulation Indexes
- Fractional vegetation cover
The NDVI is the best factor to characterize vegetation growth [23], which has an extremely significant linear correlation with the FVC. In this research, we use the NDVI to extract the FVC information on the TP, and Equation 1 shows the calculation [24].
where NDVIsoil denotes the NDVI value in naked land, and its value is the NDVI value at the accumulated probability of 5%. NDVIveg represents the NDVI value of the region covered by vegetation completely, and its value is the NDVI value at the accumulated probability of 95%.
- 2.
- Ecological quality index of vegetation
The NPP and FVC of vegetation are two critical indicators reflecting the ecological quality of regional ecosystems. The vegetation EQI based on the NPP and FVC is selected as the evaluation indicator to assess the variation characteristics of regional vegetation ecological quality [25,26], is calculated using the following formulas:
where the values of the EQI and FVC vary in the ranges of 0–100 and 0–1, respectively. NPPmax indicates the maximum of the NPP during the assessment period, and f1 and f2 denote the weight coefficients, with values of 0.5. According to the Technical Specification for Investigation and Assessment of National Ecological Status: Ecosystem Patterns Assessment (HJ 1171-2021) released by the Ministry of Ecology and Environment, the vegetation ecological quality on the TP is classified into five levels, as shown in Table 1.
- 3.
- Monsoon and westerly indexes
The East Asian summer monsoon index (EMI) [27] is calculated by Equation (3).
where “Nor” indicates the normalization of data, and u represents the 200 hPa zonal wind field.
The South Asian summer monsoon index (SMI) is the regional average of seasonal dynamic normalized index at 850 hPa in the South Asian region (5°–22.5°N, 35°–97.5°E) from June to August [28].
where denotes the standardized variability of dynamic circulation during summer in a certain year (n), the climatic mean of wind vector in January, the average of the January and July climatic mean of wind vector, and the the average wind vector during summer in a certain year (n).
The 600 hPa vorticity distribution over the TP is calculated based on the wind field. In summer, the TP is controlled by a positive vorticity center. Considering the stable establishment of positive vorticity, we take the contour of positive vorticity of five units (1 unit =1 × 10⁻⁶ s-1) as the characteristic isoline. The grid area with vorticity values equal to or above five units within the region (30°–40°N, 70°–105°E) is defined as the vorticity range of the cyclonic circulation, i.e., the vorticity area of the TP vortex (IVarea) [29].
The westerly index (WI) is the average difference of the 500 hPa geopotential height between 35°N and 50°N in 70°E–110°E during June–August [30].
where N represents the number of equi-interval longitudes selected along the latitudinal circle, and the interval is 2.5 longitudinal distances. H denotes the 500 hPa geopotential height.
2) Statistical analysis method
3.1.1. Trend Analysis
Based on univariate linear regression method, the variation trend of the vegetation EQI on the TP from 2001 to 2020 is analyzed, which is represented by the trend ratio [31]. The calculation is expressed by Equation (6).
where n (n = 21) is the length of temporal sequence, i is a certain year of the temporal sequence, EQIi the EQI value in the ith year, and “SLOPE” the trend ratio which refers to the variation rate of an index with time. A positive SLOPE value indicates an increasing trend of the EQI, and a negative SLOPE value represents a decreasing trend of the EQI.
3.1.2. Regional Area Ratio
The statistical test is carried out by using a combination of the Theil-Sen Median trend analysis [32] and Mann-Kendall statistical test method. Based on this, we perform pixel analyses of ecological quality variation trends of vegetation on the TP from 2001 to 2020. The Hurst index of vegetation ecological quality variation is calculated through the R/S analysis method, reflecting the sustainability of variation trends. The Hurst index (Hu) value varies from 0 to 1. When 0 ≤ Hu ≤ 0.5, it indicates that the variation trend is unsustainable to some extent, i.e., the future trend is opposite to that in the past. When 0.5 ≤ Hu ≤ 1, the variation trend is sustainable, i.e., the future trend is consistent with that in the past. When Hu = 0.5, the future trend is not affected by that in the past. Combined with the result of the Theil-Sen Median trend analysis, four types of trends, namely future degradation trend, persistent degradation trend, future improvement trend and persistent improvement trend, are obtained. The significance test is performed at the significance level of 0.01 ().
3.1.3. Correlation Analysis Method
In this study, based on the Pearson correlation coefficient (R), the correlations of vegetation ecological quality with meteorological elements and circulation systems, as well as the significance of these correlations, are investigated. When the absolute value of R () is 0.575 or above, and R passes the significance test at the significance level of 0.01 (), it indicates that the correlation is extremely significant. When and R is significant at , it suggests that the correlation is significant. When , the correlation is not significant.
Partial correlation analysis is conducted by a second-order partial correlation analysis method. If the first and second variables are associated with the third and fourth variables simultaneously, the impacts of the third and fourth variables are excluded, and only the correlation between the first and second variables is analyzed. This correlation is assessed by partial correlation r [33], and its calculation is shown in Equatin (7).
where , and represent the first-order partial correlation coefficients between x and y, between x and w, and between y and w [34], and the T-test method is applied to analyze the significance. The significance of these partial correlations is classified into four grades: significant positive correlation (r > 0 and T > T0.05), non-significant positive correlation (r > 0 and T < T0.05), significant negative correlation (r < 0 and T > T0.05), and non-significant negative correlation (r < 0 and T < T0.05).
3.1.4. Regional Area Ratio
For the area ratios of the annual EQI and meteorological elements for different vegetation types, as well as the influenced area ratios of the annual EQI by meteorological elements, they are represented as the percentages of regional area of element variations for each vegetation type to the total area of this vegetation type.
3. Results
This section may be divided by subheadings. It should provide a concise and precise description of the experimental results, their interpretation, as well as the experimental conclusions that can be drawn.
3.1. Variations Characters of Different Vegetation Indexes
3.1.1. Spatio-Temporal Variations of Vegetation Net Primary Productivity and Fractional Vegetation Cover
From 2001 to 2020, the overall NPP and FVC of vegetation on the TP display fluctuating and increasing trends. The rising rate of the annual average NPP is 5.4 /g c m−2 (decade)−1. The maximum of the annual average NPP appears in 2006 (232.1 g c m−2), and the minimum appears in 2004 (203.6 g c m−2). The rising rate of the annual average FVC is 0.008 (decade)−1. The maximum (0.4) of the annual average FVC can be found in 2020, and the minimum (0.37) appears in 2001. Regarding spatial distributions, the NPP and the FVC on the TP are higher in the southeast than those in the northwest. The areas with large differences in the NPP and FVC are mainly found in shrubs, grasslands in the east, deciduous-coniferous forests, deciduous broad-leaved forests, mixed forests and evergreen broad-leaved forests (figure omitted).
3.1.2. Spatio-Temporal Variations of Vegetation Ecological Quality
The annual EQI of vegetation on the TP shows an overall fluctuating and increasing trend, with an increasing rate of 0.8 (decade)−1, reaching its maximum value (34.4) in 2020 (Figure 2a). Specifically, the EQI reaches the good level in 2.1% of the areas, which are located in the southern part of evergreen coniferous forests. 15.3% of the areas show a relatively good level of the EQI, mainly in evergreen broad-leaved forests and evergreen coniferous forests. 29.2% of the areas have a medium level of the EQI, which are mainly distributed in broad-leaved forests and coniferous forests. 16.6% of the areas display a relatively poor level of the EQI, mainly distributed in shrubs, the western part of grasslands, deciduous-coniferous forests and the western part of sparse shrubs. The EQI is at a poor level in most areas of sparse shrubs and grasslands, which account for about 36.8% of the TP area.
The areas where vegetation ecological quality has improved account for 65.6% of the TP, which are mainly located in sparse grasslands, the northern part of grasslands, and mixed forests. Particularly, the areas with significant improvement and extremely significant improvement account for 8.1% and 6.7%, respectively. The areas with a degradation trend of vegetation ecological quality account for 34.4%, mainly distributed in the central and southern parts of grasslands and evergreen coniferous forests. Among them, the areas with significant degradation and extremely significant degradation trends account for approximately 3% in total (Figure 2c). In the future, the areas with an improvement trend of vegetation ecological quality on the TP are larger than those with a degradation trend. The areas with an improvement trend and a persistent improvement trend account for 35.5% and 13.9%, respectively. Additionally, the areas with a degradation trend and a persistent degradation trend account for 15.8% and 5.9%, respectively (Figure 2d and Table 2).
The EQIs for different vegetation types on the TP all show increasing trends, and areas with increasing trends (all the area proportions greater than 50%) are larger than those with decreasing trends (Figure 3). The rising trends of the EQIs for sparse shrubs, deserts and deciduous broad-leaved forests are relatively remarkable, all above 1.1 (decade)−1, with area proportions of 96%, 92.6% and 87.8%, respectively. Specifically, the area with an extremely significant increase in the EQI is the largest for sparse shrubs, accounting for 25.2%. In terms of mixed forests, deserts, sparse shrubs and deciduous broad-leaved forests, the area proportions for decreasing EQI trends are all below 20%, and there is no area with an extremely significant decrease or a significant decrease. The increasing trend rates of the EQIs for evergreen coniferous forests and shrubs are about 0.5 (decade)−1, smaller than those of the other vegetation types. Among them, the area with a decreasing EQI trend is the maximum (47.4%) in evergreen coniferous forests, followed by grasslands (41.4%).
3.2. Response of Vegetation Ecological Quality on the Tibetan Plateau to Climate Change
3.2.1. Characteristics of Climate Change
The annual average temperature on the TP shows an increasing trend with a rate of 0.18℃ (decade)−1. The warming rate in most areas is between 0.1℃ (decade)−1 and 0.6℃ (decade)−1, and in the southwest and most areas of the east, the warming rate varies from 0.6℃ (decade)−1 to 0.8℃ (decade)−1. Only the northwestern edge and parts of the east show a weak cooling trend (Figure 4a). On the TP, about 91.9% of the area displays an increasing trend in annual average temperature, and about 20.9% of the area shows a significant increasing trend. Specifically, more than 95% of mixed forests and grasslands show a warming trend, and 61.3% of mixed forests and 21.0% of grasslands have a significant warming trend. The warming areas of deciduous-coniferous forests and shrubs are relatively smaller than those of mixed forests and grasslands (Figure 4c). Moreover, 8.1% of the TP area shows a decreasing trend in annual average temperature, and only 0.4% of the area displays a significant cooling trend. Among them, 43% of evergreen broad-leaved forests exhibit a cooling trend, and 9.2% of these areas show a significant cooling trend. In addition, 16.0% of deserts and sparse shrubs show a non-significant cooling trend.
The annual rainfall amount on the TP exhibits an increasing trend with a rate of 27.5 mm (decade)−1, and the increasing trend rate in the northeast is between 40 mm (decade)−1 and 160 mm (decade) −1 (Figure 4b). The areas with an increasing trend of annual precipitation cover about 92.1% of the TP, and the areas with a significant increasing trend account for 14.1% of the TP. Particularly, the areas with a significant increasing trend of annual rainfall are the most in mixed forests (93.5%), followed by evergreen broad-leaved forests (47.7%) and shrubs (44.2%). However, the annual rainfall in the southeast of the TP shows a decreasing trend with a rate of 10–80 mm (decade)−1, as shown in Figure 4b. In terms of evergreen coniferous forests, evergreen broad-leaved forests and deciduous-coniferous forests, the areas with a significant decreasing trend of annual rainfall account for 25%–70% of their respective total areas (Figure 4d).
3.2.2. Response of Vegetation Ecological Quality to Climate Change
Climate is an essential factor influencing vegetation growth. The high-value areas of positive and negative correlations between annual average temperature and vegetation ecological quality are located in the east and southwest of the TP, respectively (Figs. 5a and 5b). 2.0% of desert areas show a significant negative correlation or a non-correlation between vegetation ecological quality and annual average temperature. For the other vegetation types, the areas with a significant positive correlation between vegetation ecological quality and annual average temperature are all within 30.0% and larger than those with a significant negative correlation. The areas with a significant positive correlation are relatively larger in mixed forests and deciduous broad-leaved forests, 29.0% and 16.0%, respectively, and there are no areas showing a significant negative correlation for both vegetation types. In grasslands, the areas with a significant positive correlation are the smallest (2.7%), and the proportion of areas showing a significant negative correlation is the largest (3.0%).
In the south and northeast of the TP, only 3.8% of the areas show a positive correlation between the annual rainfall and the EQI (Figs. 7a and 7c). The areas with a significant positive correlation between the EQI and the annual rainfall are the most in deciduous broad-leaved forests, reaching 28.0%. The area proportions for significant positive correlation are 5.0%–14.0% for the other vegetation types. Neither deciduous broad-leaved forests nor mixed forests have areas displaying a significant negative correlation between the EQI and annual rainfall. For grasslands, the area proportion for a significant negative correlation between the EQI and annual rainfall is the largest (11.7%), but that for a significant positive correlation is the smallest (4.9%).
3.2.3. Impacts of Atmospheric Circulations
The EQIs in the areas of deciduous broad-leaved forests, mixed forests, some shrubs and evergreen broad-leaved forests (Q1, 32.5°N–35.0°N, 100.0°E–105.0°E) have a relatively significant positive correlation with annual average temperature and annual rainfall. However, the negative correlation is predominant in most areas of the southern part of grasslands (Q2, 30.0°N–32.5°N, 85.0°E–90.0°E). Moreover, regions Q1 and Q2 are the concentration areas of significant positive and significant negative correlations between vegetation ecological quality and meteorological elements on the TP, respectively (Figure 5). Therefore, the possible impacts of atmospheric circulations on the remarkable difference mentioned above are analyzed below in the aspects of water vapor flux and atmospheric circulation indices.
(1) Water vapor transport
In the past 20 years, the vertical integral of zonal water vapor flux on the TP mainly shows eastward transport, and the transport flux in the north is larger than that in the south. Westward transport only appears in parts of the south. The vertical integral of meridional water vapor flux is relatively smaller, mostly showing northward transport. Additionally, the transport flux in the southeast is larger than that in the northwest (figure omitted). As presented in Figure 6, the variations of water vapor transport in regions Q1 and Q2 can be divided into three periods: 2001–2007, 2007–2015 and 2015–2020. From 2001 to 2007, the zonal water vapor fluxes in regions Q1 and Q2 are both around 0.4 × 10⁶ kg m−1 s−2, the meridional water vapor flux in Q1 fluctuates around −0.8 × 10⁶ kg m−1 s−2, and the annual variation of meridional water vapor flux in Q2 is relatively large. From 2007 to 2015, the zonal and meridional water vapor fluxes in Q1 and Q2 exhibit increasing trends, the zonal water vapor flux ranges from0.4 × 106 kg m−1 s−2 to 0.6 × 10⁶ kg m−1 s−2, and the meridional water vapor transport shifts from southward to northward in both areas. From 2015 to 2020, the zonal water vapor fluxes in Q1 and Q2 are both characterized by an increasing trend of eastward transport, and the meridional transport in Q1 and Q2 displays increasing trends of southward and northward transport, respectively. Note that the increasing trend of zonal water vapor flux in Q1 passes the significance test at the significance level of 0.01 (Table 3).
(2) Westerly and monsoons
Atmospheric water vapor transport relies on the adjustment of circulation systems. Through the four indexes of the EMI, SMI, IVarea and mid-latitude westerly index (WI), we analyze the impacts of westerly and monsoons on the EQIs in regions Q1 and Q2.
Figure 7 shows the correlations of the annual EQI with the IVarea, EMI, SMI and WI. The results indicate that the IVarea is significantly and positively correlated with the EQIs in most grasslands and shrub areas, and it is significantly and negatively correlated with the EQIs in the southwest part of grasslands and evergreen broad-leaved forests. The correlations with the WI are similar to those with the IVarea. The EQI shows a significant positive correlation with the EMI in some coniferous and evergreen broad-leaved forests, and it has a significant negative correlation with the SMI in the east part of grasslands, shrubs, and sparse shrubs. The area proportions of the significant impact of different circulation factors on the EQIs are similar in Q1, which are all between 10% and 25%. Specifically, the area proportions of the significant impact of the IVarea on the EQI in Q1 and Q2 are the largest, accounting for 16.8% and 21.4%, respectively. The EQI in 12.8% of region Q1 is significantly affected by the SMI, but the significantly influenced area in Q2 only accounts for 8.4%. The WI has a significant impact on the EQI in 20.2% of region Q2, but the significantly influenced area of the WI on the EQI is relatively small in Q1. The areas of the EMI that significantly influences the EQI account for about 12.0% in both Q1 and Q2 (Table 3).
4. Discussion
a. Effects of climate change on vegetation ecological quality
The partial correlation analysis between the EQI of different vegetation types and the standardized meteorological elements suggests that the impact of precipitation variations on vegetation growth is markedly greater than that of temperature. The impact of precipitation variations shows differences between the south and the north, and it is more complex than the impact of annual average temperature. Except for mixed forests, annual rainfall is a significantly influential factor for the EQI of all the vegetation types, and the significantly influenced range of rainfall is 2%–16% larger than that of annual average temperature. In the northeast of the TP, high temperature and more rainfall are greatly conducive to the increase of vegetation ecological quality. The vegetation types with a relatively significant response of EQI variations to rainfall variation are deciduous broad-leaved forests and evergreen coniferous forests, and the significantly influenced areas are 20%–30%. Rainfall variation can interpret about 30% of EQI variations in deciduous broad-leaved forests and evergreen coniferous forests. In mixed forests and deciduous broad-leaved forests, EQI variations have a relatively significant response (positive correlation) to temperature, the significantly impacted areas are 15%–30%. In addition, temperature variations can explain 20%–40% of the EQI variations in these areas. Note that in the southwest, high temperature is not favorable for the improvement of vegetation ecological quality.
b. Effects of circulation systems on vegetation ecological quality
Water vapor transport variations on the TP have a certain effect on the ecological quality of regional vegetation, which may be caused by the adjustment of circulation systems under the background of global climate warming. The five-year moving averages of different circulation indexes (Figure 8) illustrate that the four indexes change from stable state to fluctuations around 2007. Around 2015, relatively obvious variations can also be found. Specifically, the meridional water vapor transport in the central and southern TP shows a relatively significant influence on the vegetation ecological quality in Q1, but the influence of zonal water vapor transport is not obvious. However, the vegetation ecological quality in Q2 is mainly affected by the meridional water vapor transport variation in the northeast and the zonal water vapor flux transport in the west (Figure 9).
5. Conclusions
From 2001 to 2020, vegetation ecological quality on the TP shows an increasing trend, and in terms of spatial distribution, it decreases from the southeast to the northwest. The areas with an increasing EQI trend are almost twice those with a decreasing EQI trend. The vegetation ecological quality in the south part of evergreen coniferous forests reaches a good level, but nearly half of these areas show a decreasing trend of the EQI. Regarding sparse shrubs, the vegetation ecological quality in most areas is at a poor level, but the increasing trend of EQI is intense. The areas with an increasing trend account for 92.6%, and the areas with a significant increasing trend reach 42.1%. On the whole TP, the areas with an improvement trend of vegetation ecological quality are larger than those with a degradation trend, and these areas with an improvement trend are mainly located in the western and eastern parts of sparse shrubs, the northeastern part of grasslands, deciduous broad-leaved forests, mixed forests, central shrubs, and evergreen broad-leaved forests. The areas with a degradation trend are mainly in the central and southern parts of grasslands, central evergreen coniferous forests, and the western part of shrubs.
The increasing trend rate of annual average temperature in the south of the TP is larger than that in the north. The warming is more remarkable in grasslands, with 21% of the region significantly warming, which is a key area with a significant warming trend that deserves attention in the future. Warming contributes to the annual EQI increase in the east, but it is not conducive to the EQI increase in the west, especially in grasslands of the west and the central part of evergreen coniferous forests. About 92% of the areas in the eastern and northern TP show a rising trend of annual rainfall amount. About 93.5% of mixed forests display a significant rainfall increase, which is favorable for the EQI increase in mixed forests. However, the increasing trend of rainfall in the southwestern part of grasslands is relatively small, while warming is relatively significant. Such environmental conditions are not conducive to the regional EQI increase.
The EQI on the TP is affected by atmospheric circulations through water vapor transport and their impacts on temperature and rainfall. The increases in the IVarea and WI increases significantly affect the EQI increase in most grasslands and shrub areas. The annual EMI increase is beneficial for the EQI increase in some coniferous and evergreen broad-leaved forests. The SMI increase has a significant impact on the EQI increase, mainly in the southern part of grasslands and some areas of coniferous forests. In Q1, the EQI shows a significant increasing trend, and it will continue to increase in the future. Thus, Q1 is the area with the relatively strong increasing trend of EQI, and it is also the concentration area of ecological quality improvement of different vegetation types. The increasing trend of eastward zonal water vapor transport is more evident than that of meridional water vapor flux transport. It is mainly caused by the South Asian summer monsoon and East Asian summer monsoon, which led to significant increases in temperature and rainfall in Q1. In Q2, the EQI shows a significant decreasing trend, but it will significantly decrease in the future. Therefore, Q2 is the concentration area of ecological quality degradation of different vegetation types.
Funding
This work was funded by the Second Tibetan Plateau Comprehensive Research Project (2019QZKK0106), Longyuan Youth Talent of Gansu Province (GSLQ-QX202201), The China Meteorological Administration youth meteorological talent program in 2024.
Data Availability Statement
NCEP-NCAR Reanalysis 1 data was retrieved from the data portal at https://psl.noaa.gov/data/gridded/data.ncep.reanalysis.html. The other data that support the findings of this study are available from the corresponding author upon reasonable request.
Acknowledgments
We thank Nanjing Hurricane Translation for reviewing the English language quality of this paper.
Conflicts of Interest
The authors declare no conflicts of interest.
References
- Chen, D. L., B. Q. Xu, T. D. Yao, Z. T> Guo, P. Cui, F. H. Chen, R. H. Zhang, X. Z. Zhang, Y. L. Zhang, J. Fan, Z. Q. Hou, and T. H. Zhang. 2015: Assessment of past, present and future environmental changes on the Tibet Plateau. Chin. Sci. Bull, 60, 3025–3035. [CrossRef]
- Yao, T. D. 2019: Tackling on environmental changes in Tibetan Plateau with focus on water, ecosystem and adaptation. Sci. Bull., 64, 417. [CrossRef]
- Yue, X., L. X. Zhang, D. C. Zhou, J. Yue, and L. L. Liu, 2024: Ecological vulnerability and its driving forces of the Qinghai-Xizang Plateau based on the net primary productivity of vegetation. Scientia Geographica Sin., 44, 140–148, https://link.oversea.cnki.net/doi/10.13249/j.cnki.sgs.20220954.
- Piao, S. L., Q. iu, A. P. Cen, I. A Janssens, Y. S. Fu, J. H. Dai, L. L. Liu, X. Lian, M. G. Shen, and X. L. Zhu. 2019: Plant phenology and global climate change: Current progresses and challenges. Global Change Biol., 25, 1922–1940. [CrossRef]
- Wo, X., L. C. Wu, J. P. Zhang, L. B. Zhang, and W. L. Liu, 2014: Estimation of net primary production in the Three -River headwater region using CASA model. J. Arid Land Resour. and Environ., 28, 45–50, https://link.oversea.cnki.net/doi/10.13448/j.cnki.jalre.2014.09.001.
- Zhou, T., Y. S. Zhang, H. F. Gao, T. Zhang, and Y. Z. Ma, 2015. Relationship betw een vegetation index and ground surface temperature on the Tibetan Plateau alpinegrassland, J. Glaciol. and Geocryology, 37, 58–69. [CrossRef]
- Chen, S. T., B. Guo, F. Yang, B. M. Han, Y. W. Fan, X. Yang, T. L. He, Y. Liu, and W. N. Yang. 2020: Spatial and temporal patterns of NPP and its response to climate change in the Qinghai-Tibet Plateau from 2000 to 2015. J. Nat. Resour., 35, 2511–2527. [CrossRef]
- Liu, M. X., J. Jiao, J. H. Pan, J. Y. Song, Y. D. Che, and L. R. Li, 2020: Spatial and temporal patterns of planting NPP and its driving factors in Qinghai Province. Acta Ecol. Sin., 40, 5306–5317, https://www.sciengine.com/AES/doi/10.5846/stxb201903040403.
- Zhang, Y. l., W. Qi, C. P. Zhou, M. J. Ding, L. S. Liu, J. G. Gao, W. Q. Bai, Z. F. Wang, and D. Zhen. 2014: Spatial and temporal variability in the net primary production of alpine grassland on the Tibetan Plateau since 1982. J. Geogr. Sci., 24, 269–287. [CrossRef]
- Liu, J., Y. H. Ji, G. S. Zhou, L. Zhou, X. M. Lv, and M. Z. Zhou, 2022: Temporal and spatial variations of net primary productivity (NPP) and its climate driving effect in the Qinghai-Tibet Plateau, China from 2000 to 2020. J. Appl. Ecol., 33, 1533–1538, https://link.oversea.cnki.net/doi/10.13287/j.1001-9332.202206.025.
- Han, B. H., B. R. Zhou, Y. Q. Yan, M. M. Shi, S. L. Su, H. H. Zhao, D. C. Niu, and H. Fu, 2019: Analysis of vegetation coverage change and its driving factors over Tibetan Plateau from 2000 to 2008. Acta Agrestia Sin., 27, 1651–1658, https://manu40.magtech.com.cn/Jweb_cdxb/EN/10.11733/j.issn.1007-0435.2019.06.023.
- Xu, J., H. L. Chen, S. S. Shang, H. Yang, G. F. Zhu, and X. W. Liu, 2020: Response of net primary productivity of Tibetan Plateau vegetation to climate change based on CEVSA model. Arid Land Geogr., 43, 592–601, http://alg.xjegi.com/EN/10.12118/j.issn.1000-6060.2020.03.05.
- Qin, Q. T., J. J. Chen, Y. P. Yang, X. Y. Zhao, G. Q. Zhou, H. T. You, and X. W. Han, 2021: Spatiotemporal variations of vegetation and its response to topography and climate in the source region of the Yellow River. China Environ. Sci., 41, 3832–3841, https://link.oversea.cnki.net/doi/10.19674/j.cnki.issn1000-6923.20210324.005.
- Zhuo, G., S. R. Chen, and B. Zhou, 2018: Spatio-temporal variation of vegetation coverage over the Tibetan Plateau and its responses to climatic factors. Acta Ecol. Sin., 38, 3208–3218. [CrossRef]
- Chen J. J., 2020: Research on change of fractional vegetation cover of alpine grassland and its environmental impact factors on the Qinghai-Tibetan Plateau. Acta Geod. et Cartographica Sin., 49, 533–533, http://xb.chinasmp.com/EN/10.11947/j.AGCS.2020.20190402.
- Liu, J. H., J. X. Gao, and W. J. Wang, 2013: Variations of Vegetation Coverage and Its Relations to Global Climate Changes on the Tibetan Plateau during 1981-2005. J. Mountain Sci., 31, 234–242, https://link.oversea.cnki.net/doi/10.16089/j.cnki.1008-2786.2013.02.007.
- Zhao, Q. Q., J. H. Li, G. Q. Zhang, and Y. Shi, 2022: Vegetation Changes and Their Causes in the Yellow River Basin under the Background of Climate Change. Clim. and Environ. Res., 27, 157–169. [CrossRef]
- Chen, C., Y. M. Wang, Y. Y. Li, and S. Zhou, 2022: Vegetation Changes and Influencing Factors in Different Climatic Regions of Yellow River Basin from 1982 to 2015. J. Changjiang River Sci. Res. Inst., 39, 56–62,81. [CrossRef]
- Qian, S., H. Yan, M. X. Wu, Y. Cao, L. L. Xu, and L. Cheng, 2020: Dynamic monitoring and evaluation model for spatio-temporal change of comprehensive ecological quality of vegetation. Acta Ecol. Sin., 40, 6573–6583, https://www.sciengine.com/AES/doi/10.5846/stxb201906041188.
- Cao, Y., Y, L. Sun, Z. X. Chen, H. Yan, and S. Qian, 2022: Dynamic changes of vegetation ecological quality in the Yellow River Basin and its response to extreme climate during 2000-2020. Acta Ecolo. Sin., 42, 4524–4535. [CrossRef]
- Zhang, Y. M., Y. Lu, G. L. Sun, L. Li, Z. H. Zhang, and X. G. Zhou. 2024: DynamicChanges in Vegetation EcologicalQuality in the Tarim Basin and ItsResponse to Extreme Climate during 2000–2022. Forests, 15, 505. [CrossRef]
- Bohner, J., 2006: General climatic controls and topoclimatic variations in Central and High Asia. Boreas, 35, 279–295. [CrossRef]
- Pei, H. W., M. Z. Liu, Y. G. Jia, H. J. Zhang, Y. L. Li, and Y. X. Xiao, 2021: The trend of vegetation greening and its drivers in the agropastoral ecotone of northern China, 2000–2020. Ecol. Indic., 129, 108004. [CrossRef]
- Li, M. M., B. F. Wu, C. Z. Yan, and W. F. Zhou, 2004: Estimation of Vegetation Fraction in the Upper Basin of Miyun Reservoir by Remote Sensing, Recour. Sci., 26, 153–159. [CrossRef]
- Qian, S., H. Yan, M. X. Wu, Y. Cao, L. L. Xu, and L. Cheng. 2019: Dynamic monitoring and evaluation model for spatio-temoral change of comprehensive ecological quality of vagetation. Acta Ecol. Sinica, 40, 6573–6583. [CrossRef]
- Xu, L. L., S. Qian, X. L. Zhao, and Y. Hao. 2022: Spatio-temporal Variation of Vegetation Ecological Quality and Its Response to Climate Change in Rocky Desertification Areas in Southwest China during 2000–2020. J. Resour. Ecol., 13, 27–33.
- Zhao, G. J., G. Huang, R.G. Wu, W. C. Tao, H. N. Gong, X. Qu, and K. M. Hu, 2015: A New Upper-level circulation index for the East Asian summer monsoon variability. J. Clim., 28, 9977–9996. [CrossRef]
- Li, J. P., Q. C. Zeng, 2005: A new monsoon index, its interannual variability and relation with monsoon precipitation. Clim. and Environ. Res., 10, 351–365. [CrossRef]
- Wang, Y., and D. L. Li, 2015: Variation of the Tibetan Plateau summer monsoon under the background of global warming and its impact on the climate in southwestern China. Acta Meteorol. Sin., 73, 910–924. [CrossRef]
- Li, W. L., K. L. Wang, S. M. Fu, and H. Jiang, 2008: The interrelationship between regional westerly index and the water vapor budget in Northwest China. J. Glaciol. and Geocryology. 30, 28–34. [CrossRef]
- Tan, Q. T., J. J. Chen, Y. P. Yang, X. Y. Zhao, G. Q. Zhou, H. T. You, and X. W. Han. 2021: Spatiotemporal variations of vegetation and its response to topography and climate in the source region of the Yellow River. China environmental Science, 41, 3823–3841, https://www.zghjkx.com.cn/CN/Y2021/V41/I8/3832.
- Jiang, W. G., L. H. Yuan, W. J. Wang, R. Cao, Y. F. Zhang, and W. M. Shen, 2015: Spatio-temporal analysis of vegetation variation in the Yellow River Basin. Ecol. Indic., 51, 117–126. [CrossRef]
- Chen, C., Y. M. Wang, Y. Y. Li, and S. Zhou. 2022: Vegetation Changes and Influencing Factors in Different Climatic Regions of Yellow River Basin from 1982 to 2015. J. Changjiang river scientific research institute., 39, 56–62. [CrossRef]
- Zhao, Q. Q., J. H. Li, G. Q. Zhang, and Y. Shi, 2022: Vegetation Changes and Their Causes in the Yellow River Basin under the Background of Climate Change. Clim. and Environ. Res., 27, 157–169. [CrossRef]
Figure 1.
Geographic location and elevation of the Tibetan Plateau (TP), and the distributions of ground-based meteorological stations and vegetation types on the TP.
Figure 1.
Geographic location and elevation of the Tibetan Plateau (TP), and the distributions of ground-based meteorological stations and vegetation types on the TP.
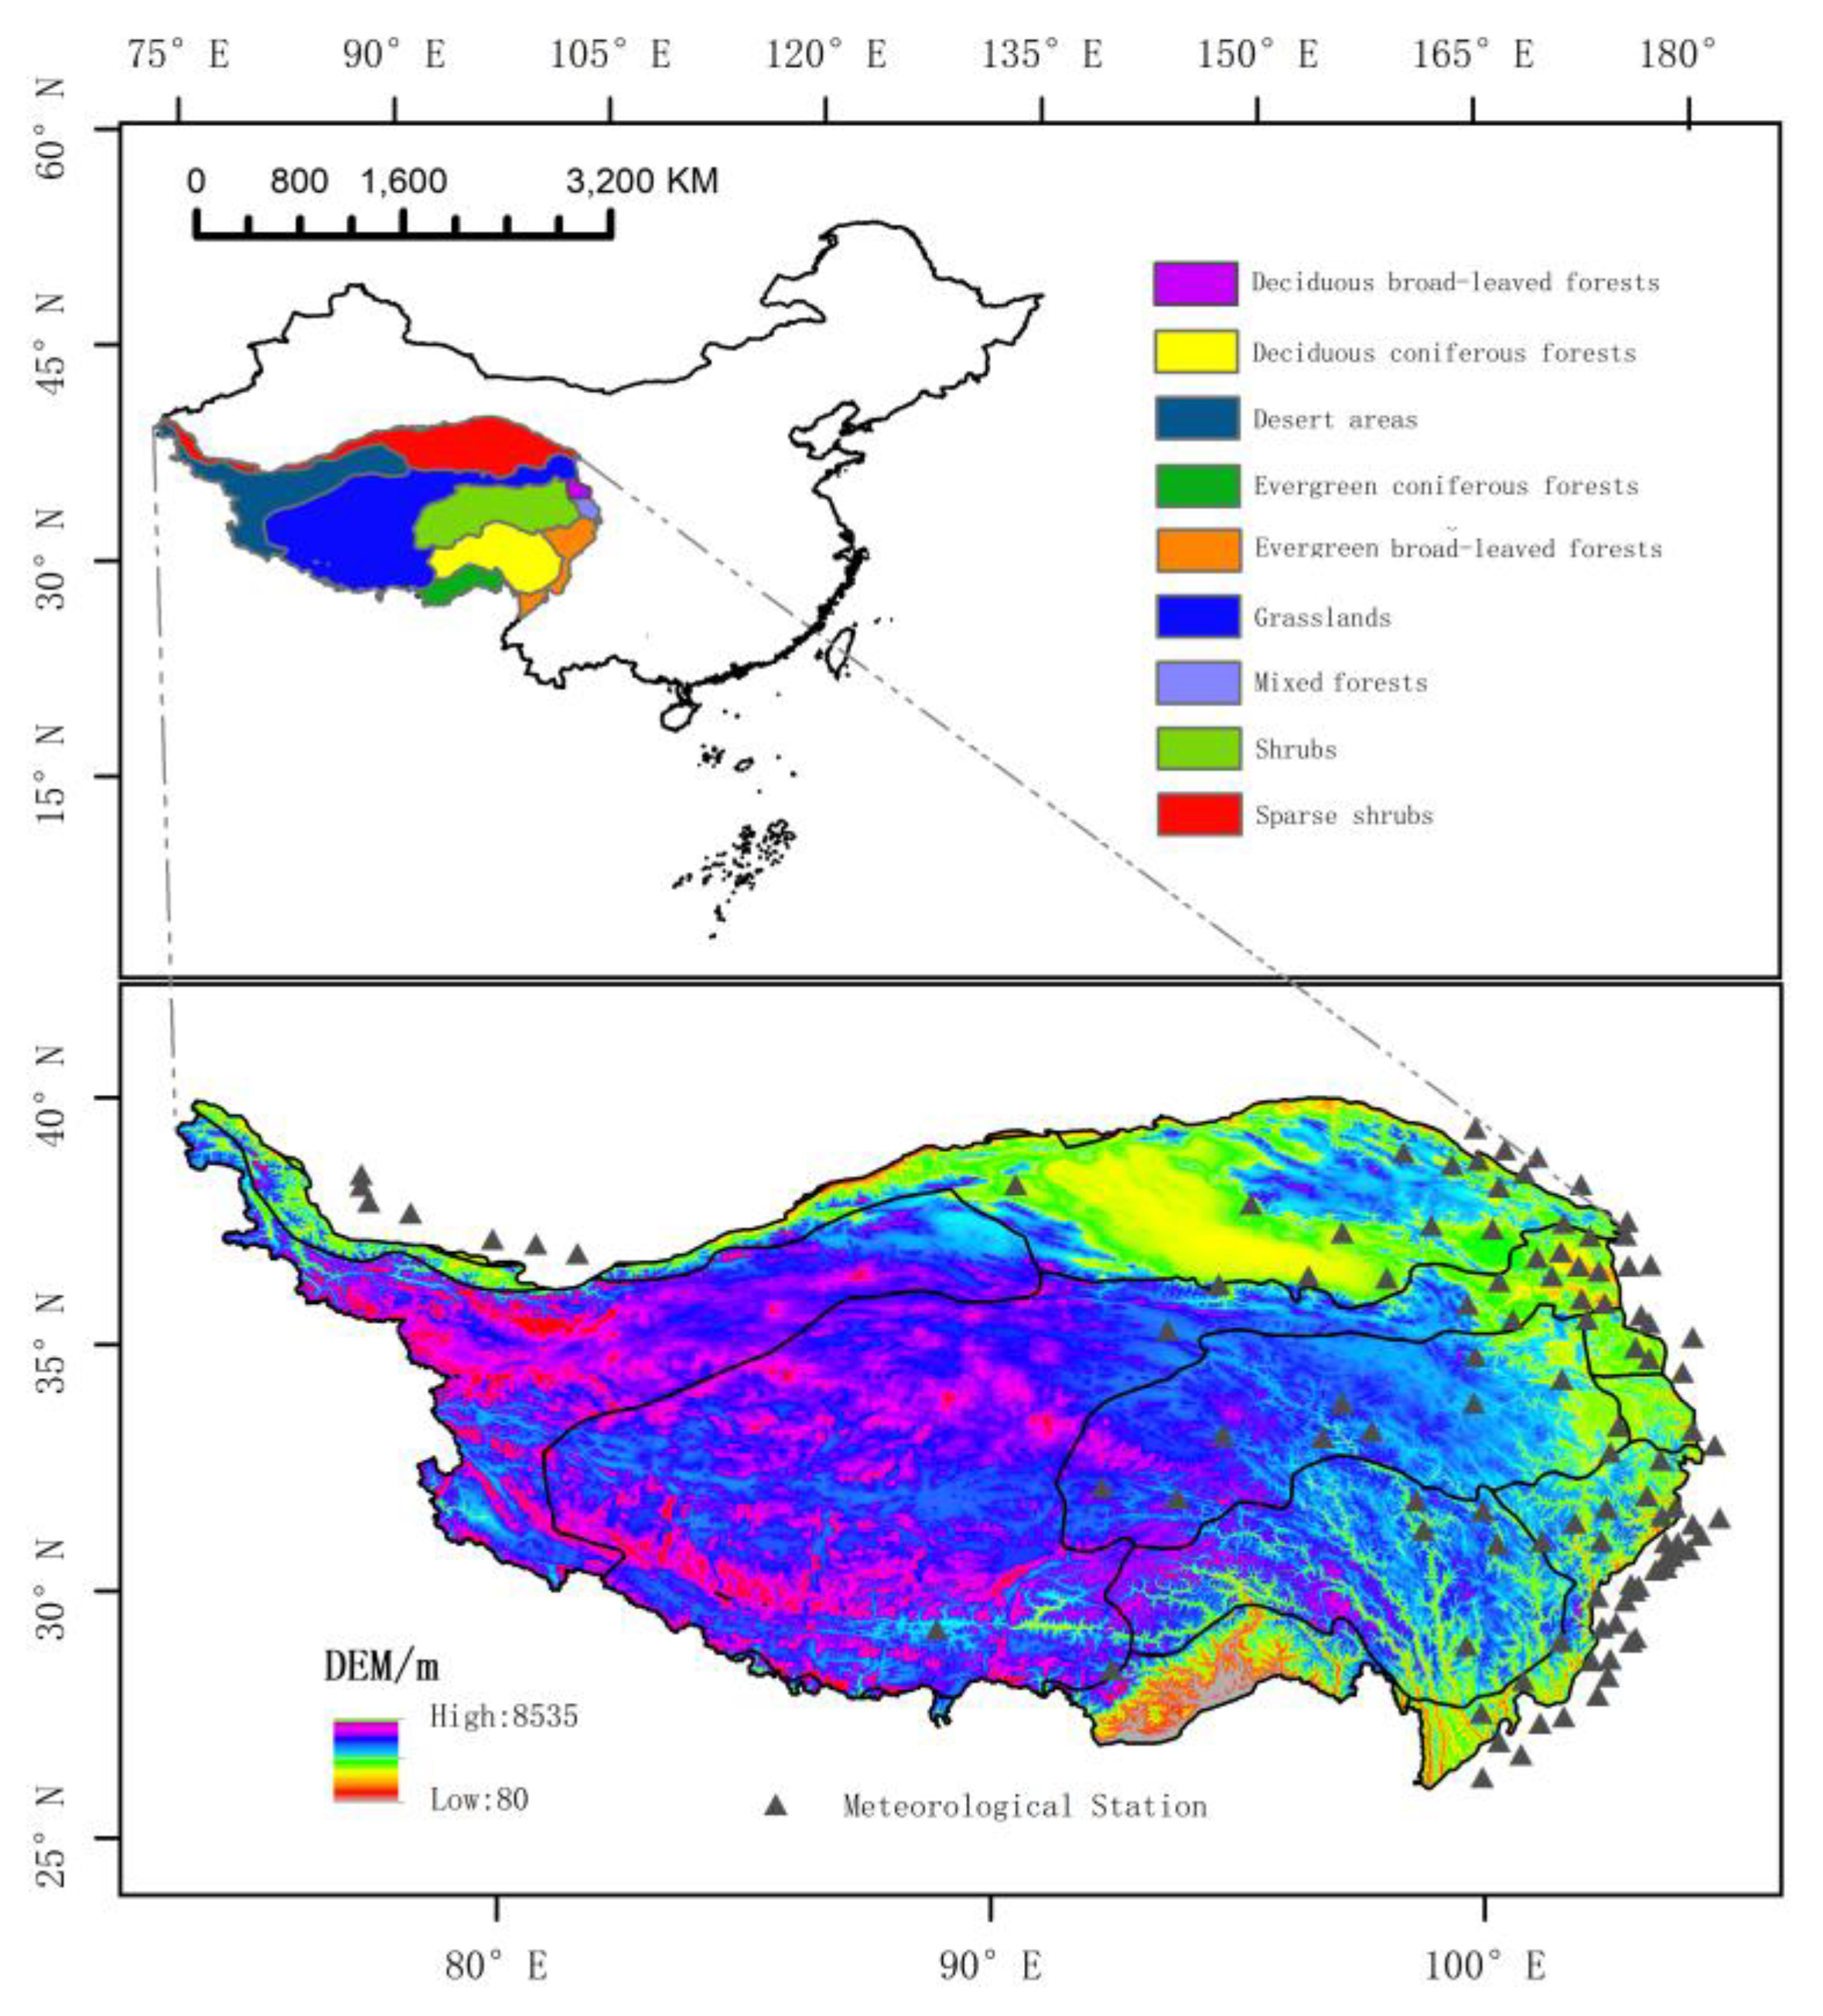
Figure 2.
(a) Annual variation, (b) multi-year average, (c) variation trend and (d) future variation of the vegetation ecological quality index (EQI) on the TP from 2001 to 2020.
Figure 2.
(a) Annual variation, (b) multi-year average, (c) variation trend and (d) future variation of the vegetation ecological quality index (EQI) on the TP from 2001 to 2020.
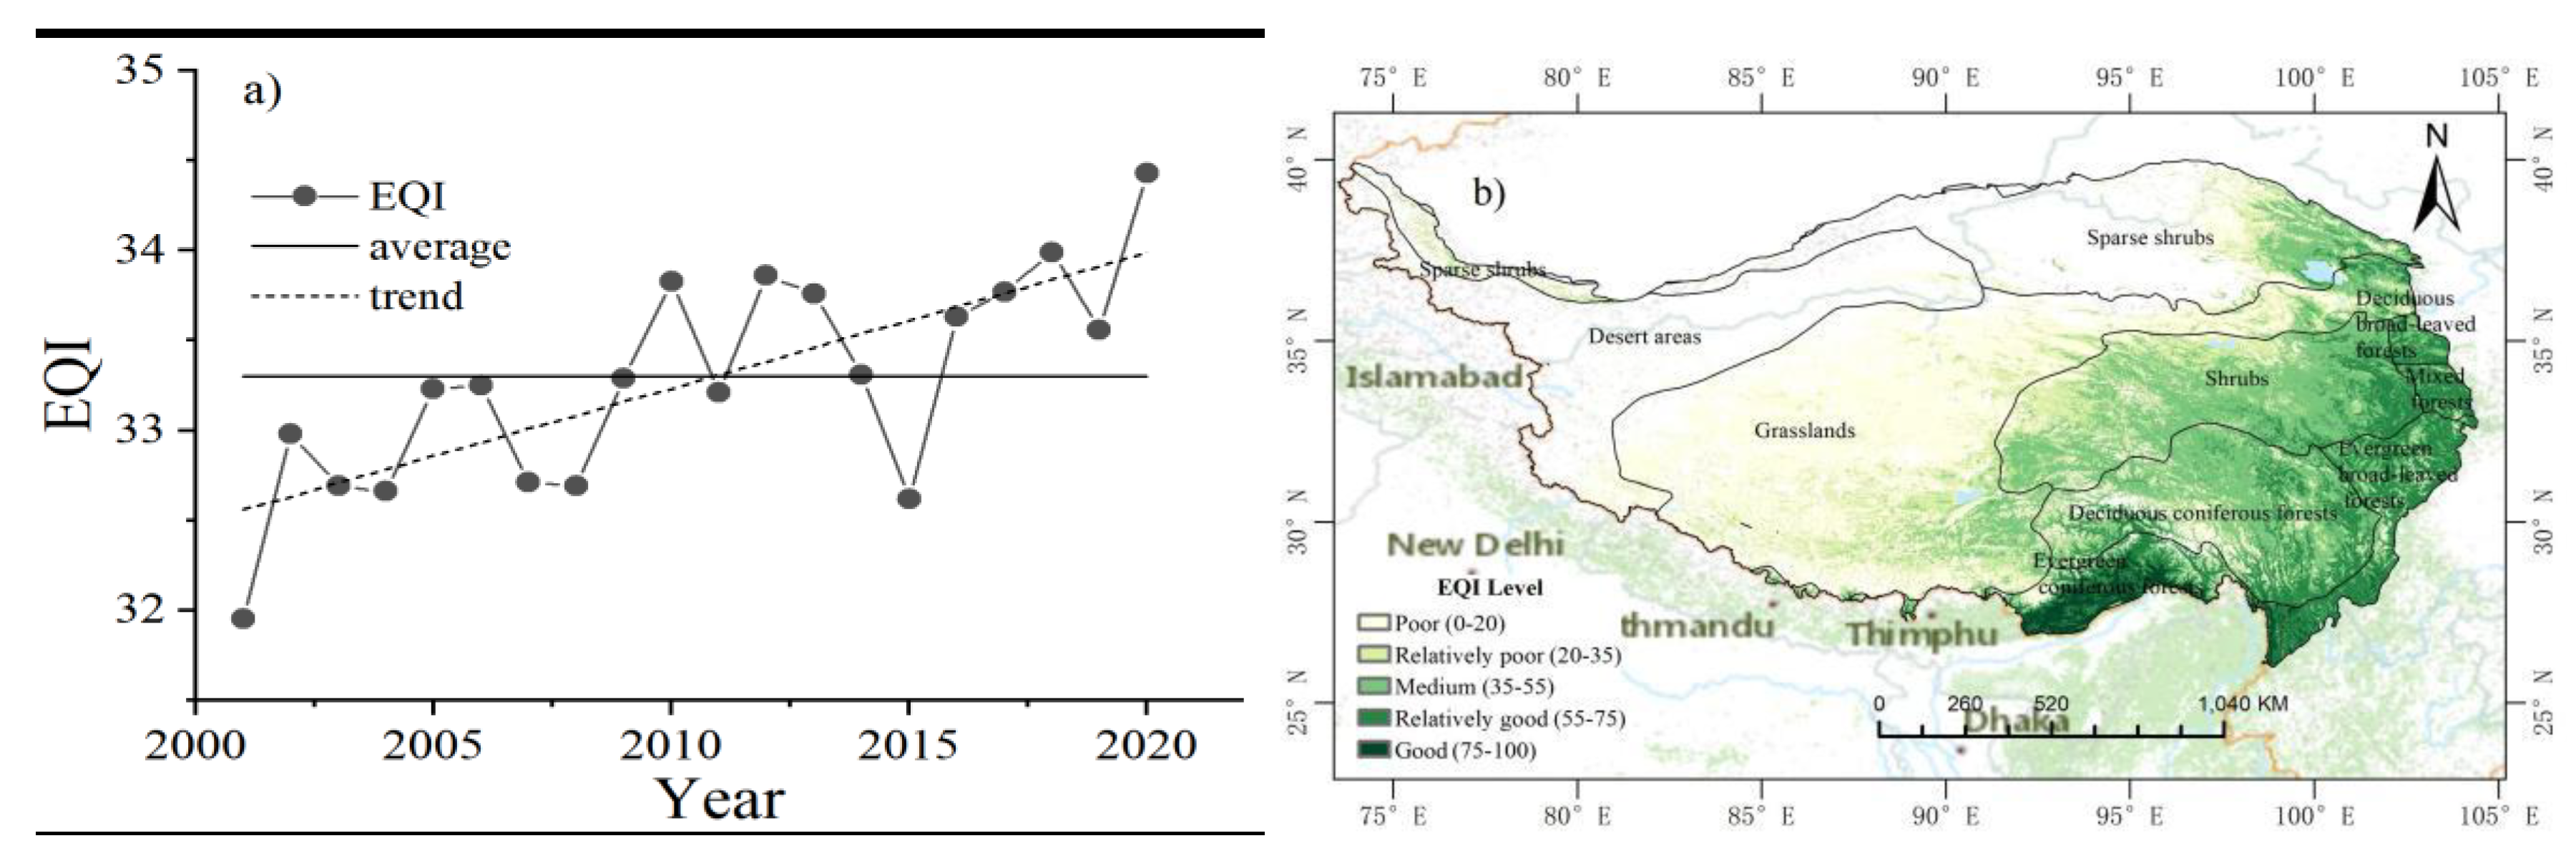
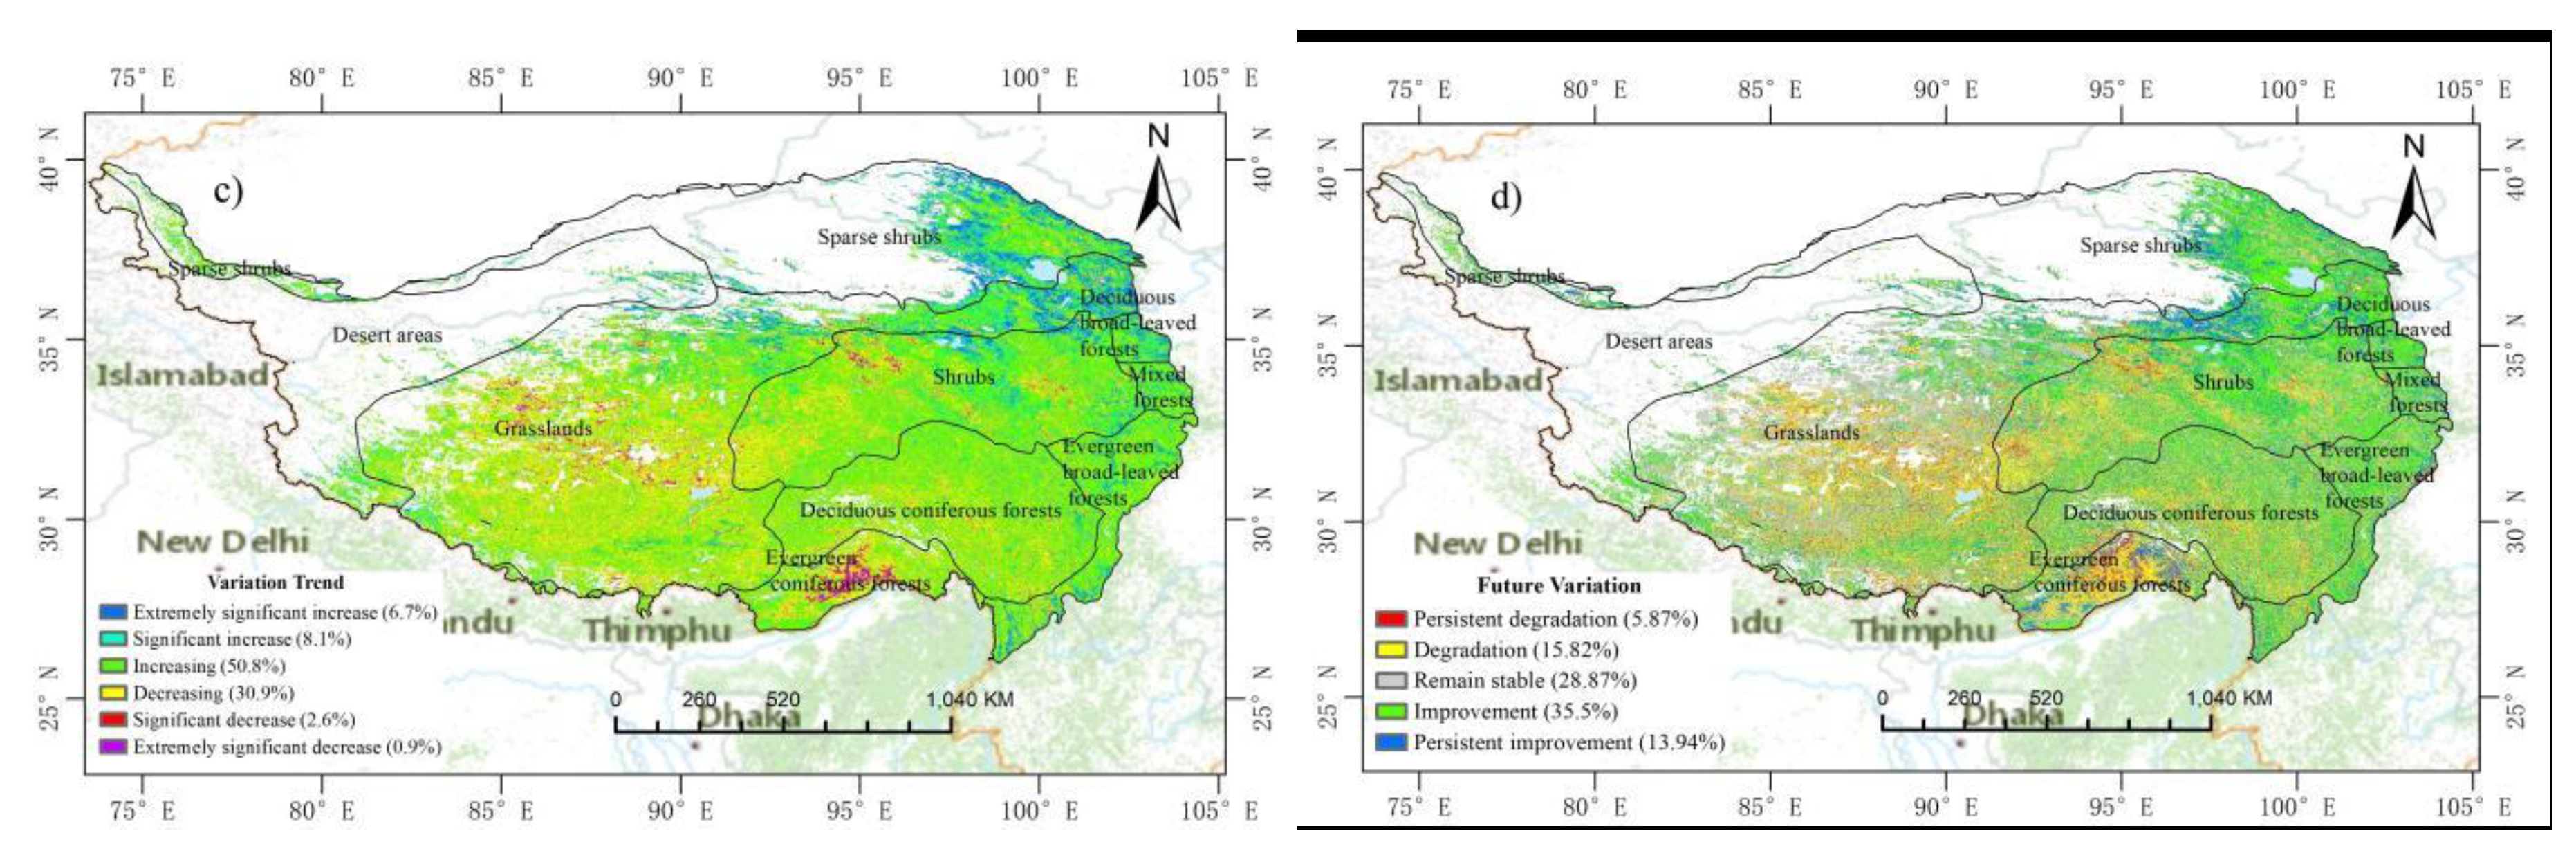
Figure 3.
Climate tendency rates of the standardized EQIs for different vegetation types and their varied area percentages on the TP from 2001 to 2020.
Figure 3.
Climate tendency rates of the standardized EQIs for different vegetation types and their varied area percentages on the TP from 2001 to 2020.
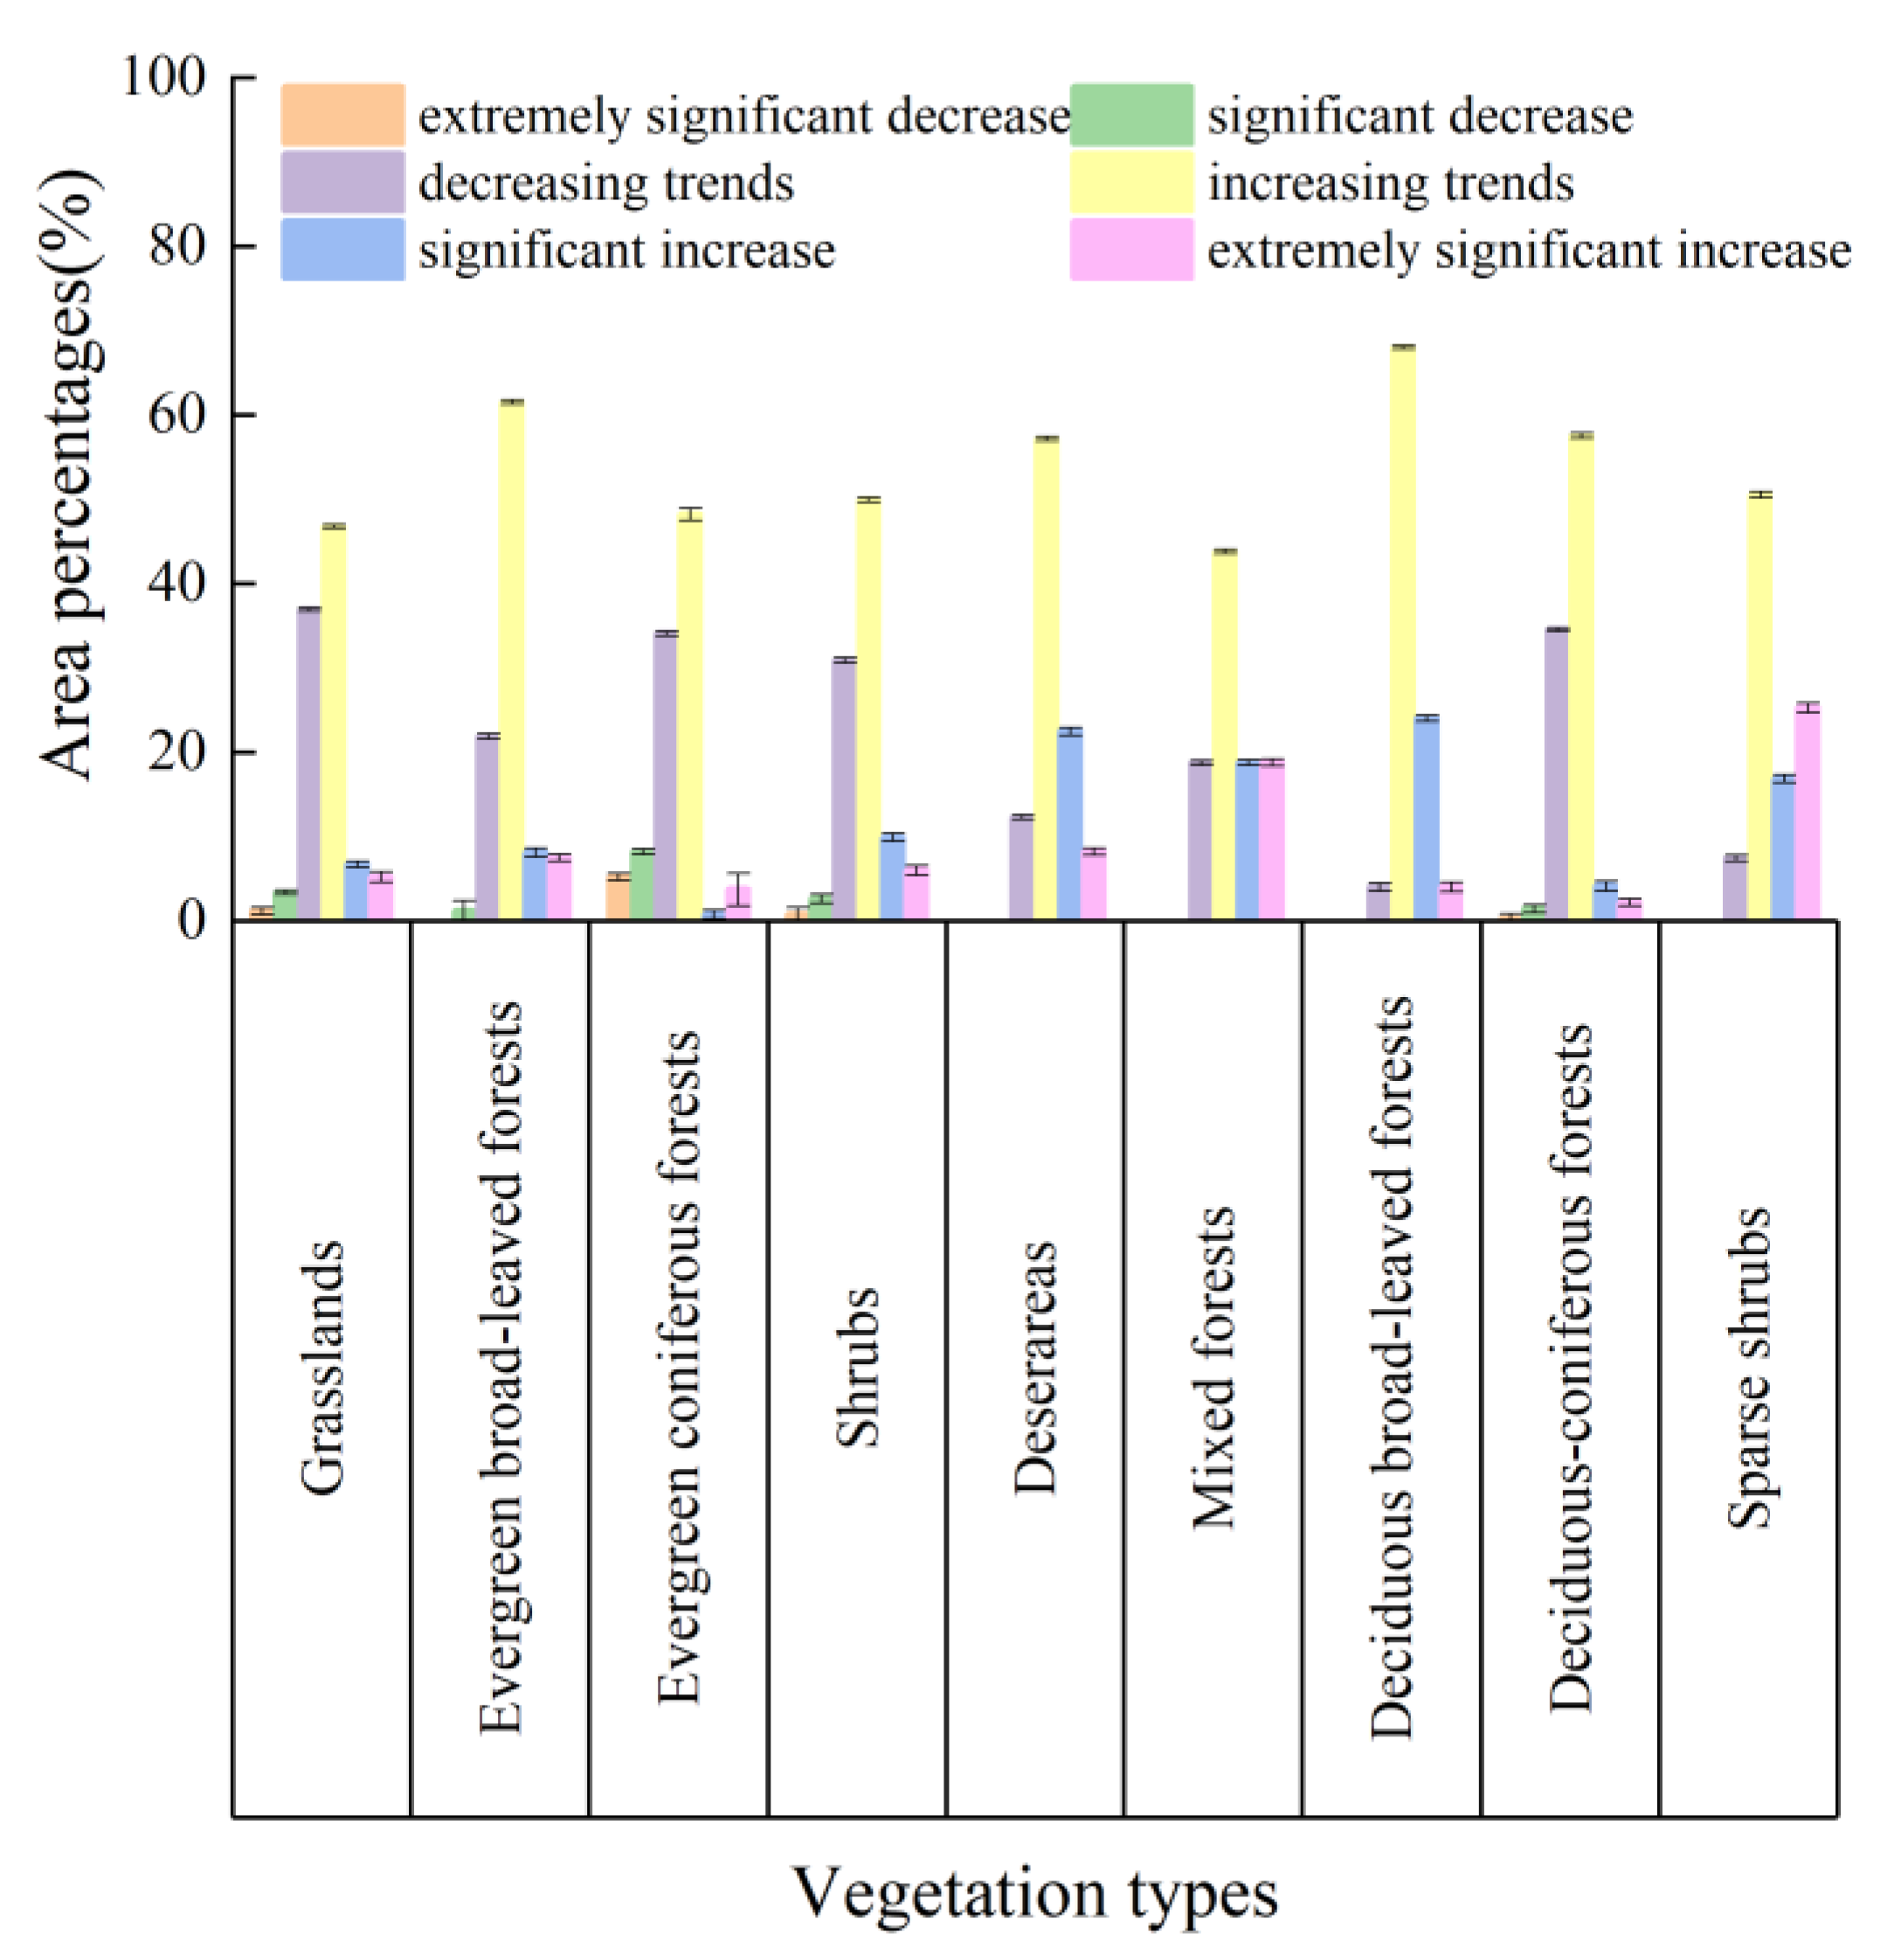
Figure 4.
Variation trends of (a, c) annual average temperature (℃ (decade)−1) and (b, d) precipitation (mm (decade)−1), and the significance test results.
Figure 4.
Variation trends of (a, c) annual average temperature (℃ (decade)−1) and (b, d) precipitation (mm (decade)−1), and the significance test results.
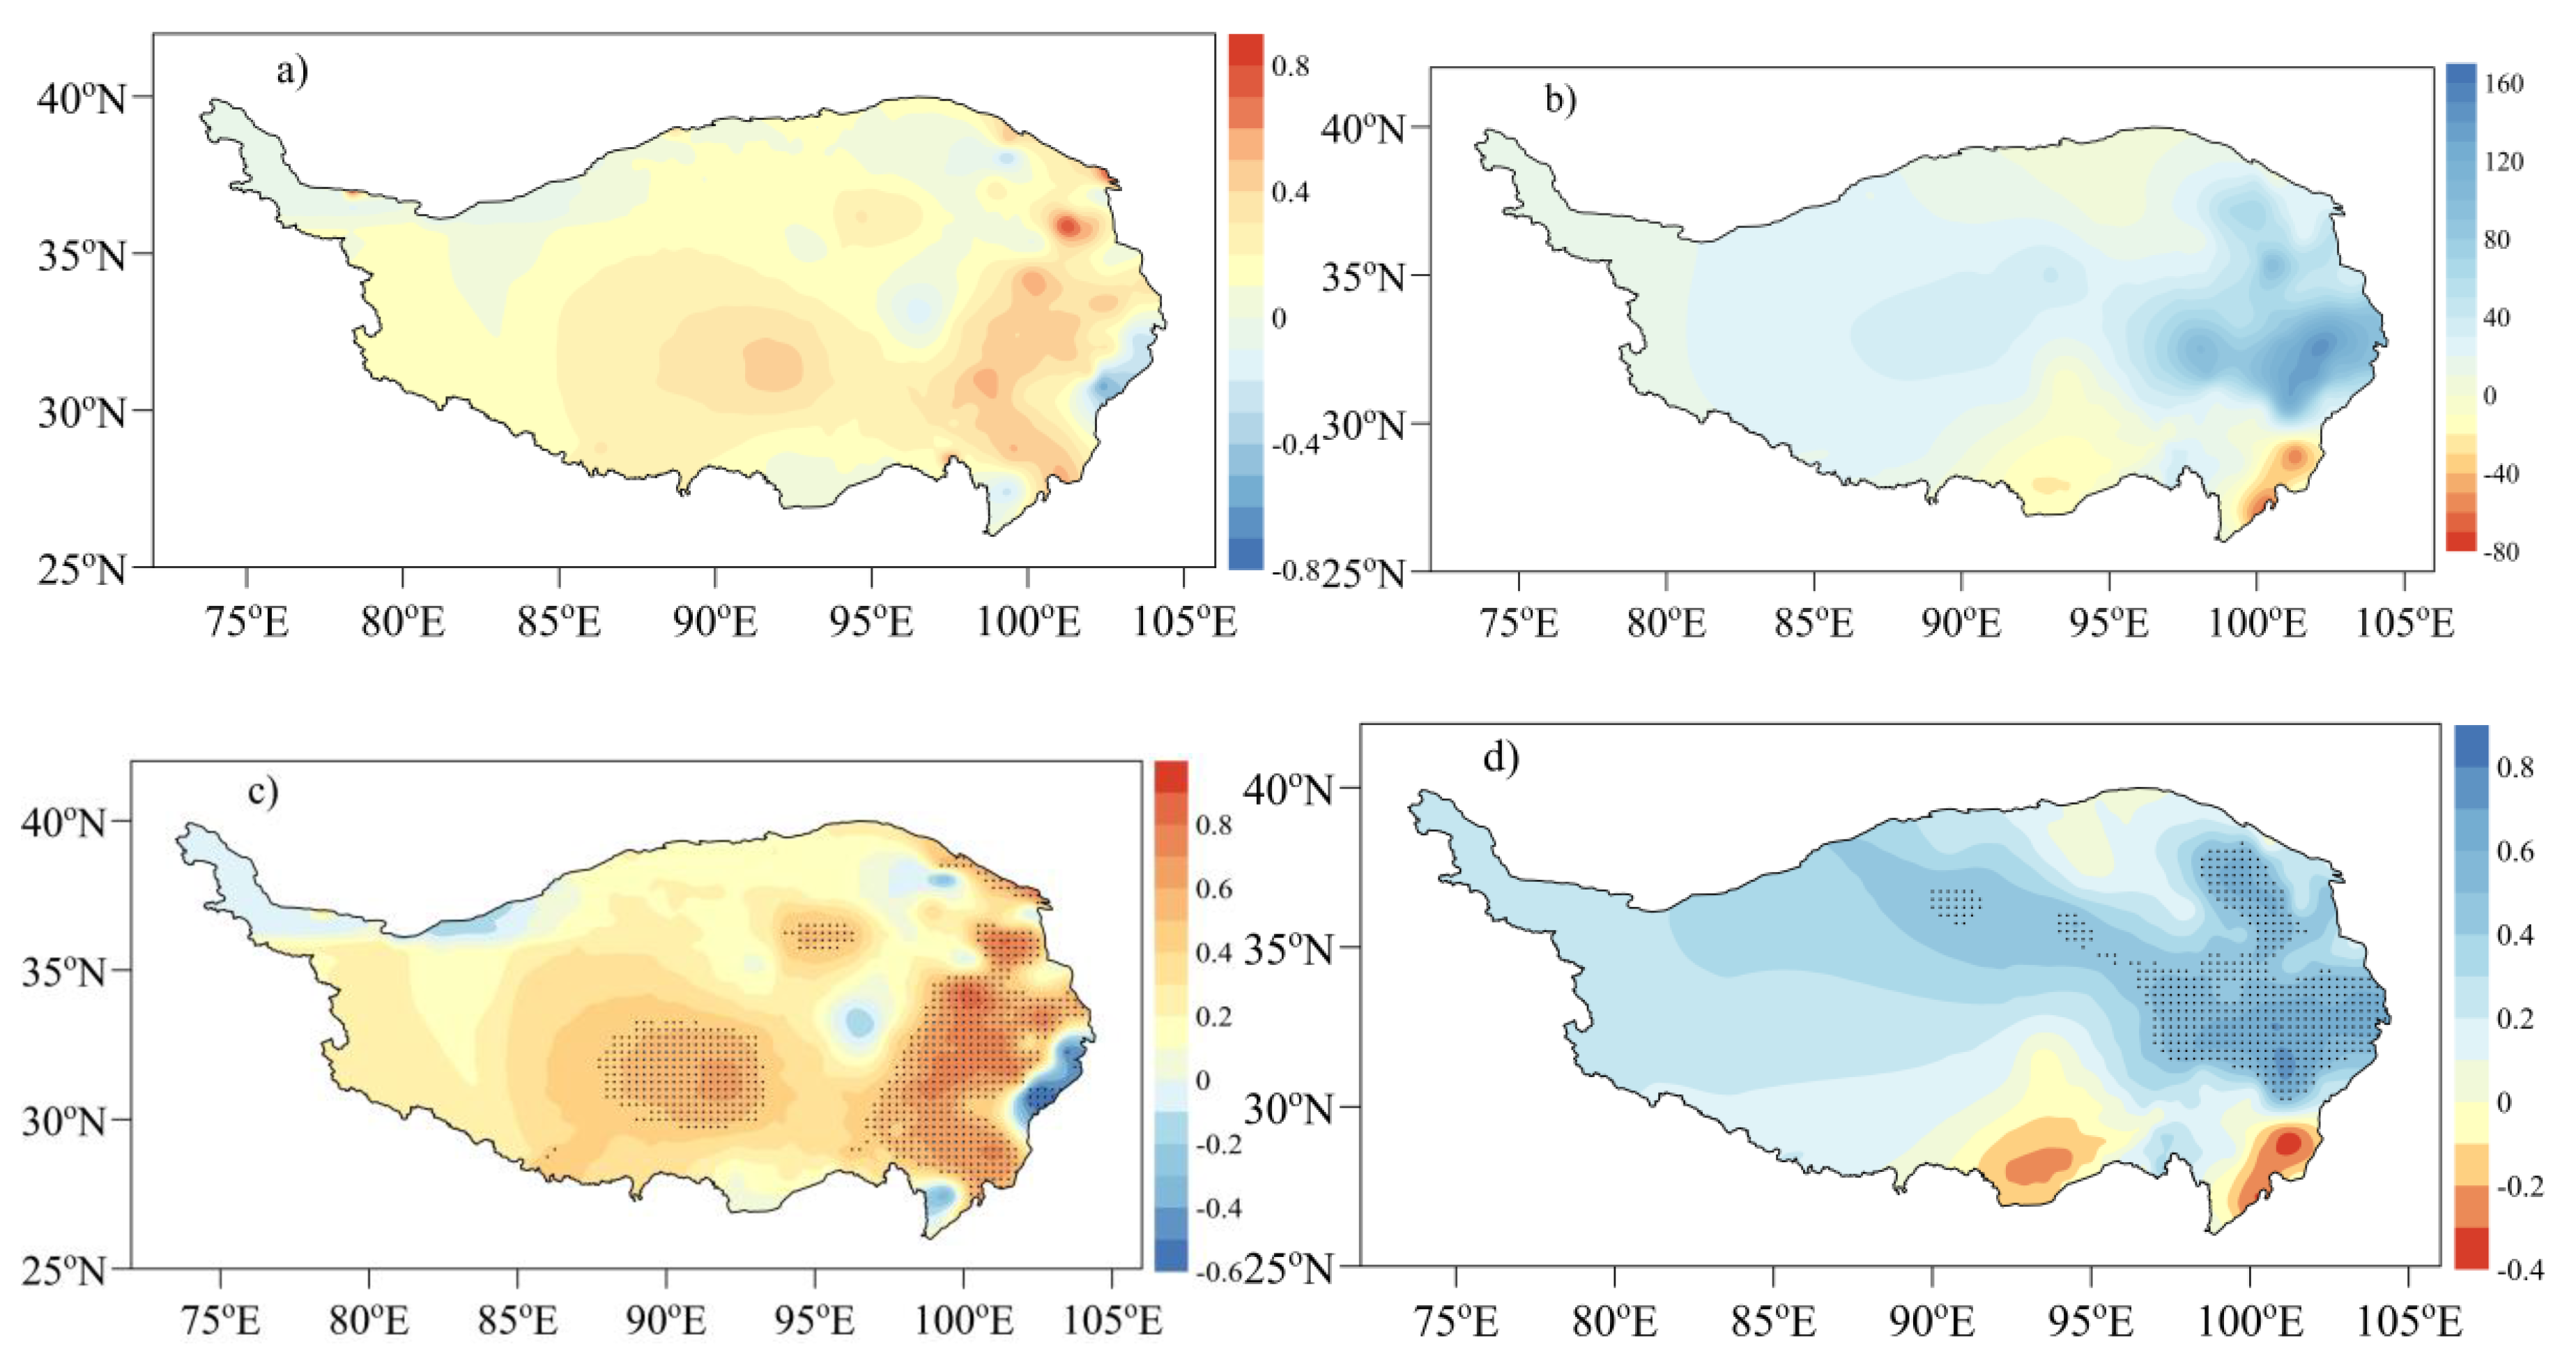
Figure 5.
Proportions (%) of the significant impacted area of the standardized annual average temperature (a) and annual rainfall (b) variations on the EQIs of different vegetation types, and the partial correlations of the EQIs of different vegetation types with (c) the annual average temperature and (d) the annual rainfall.
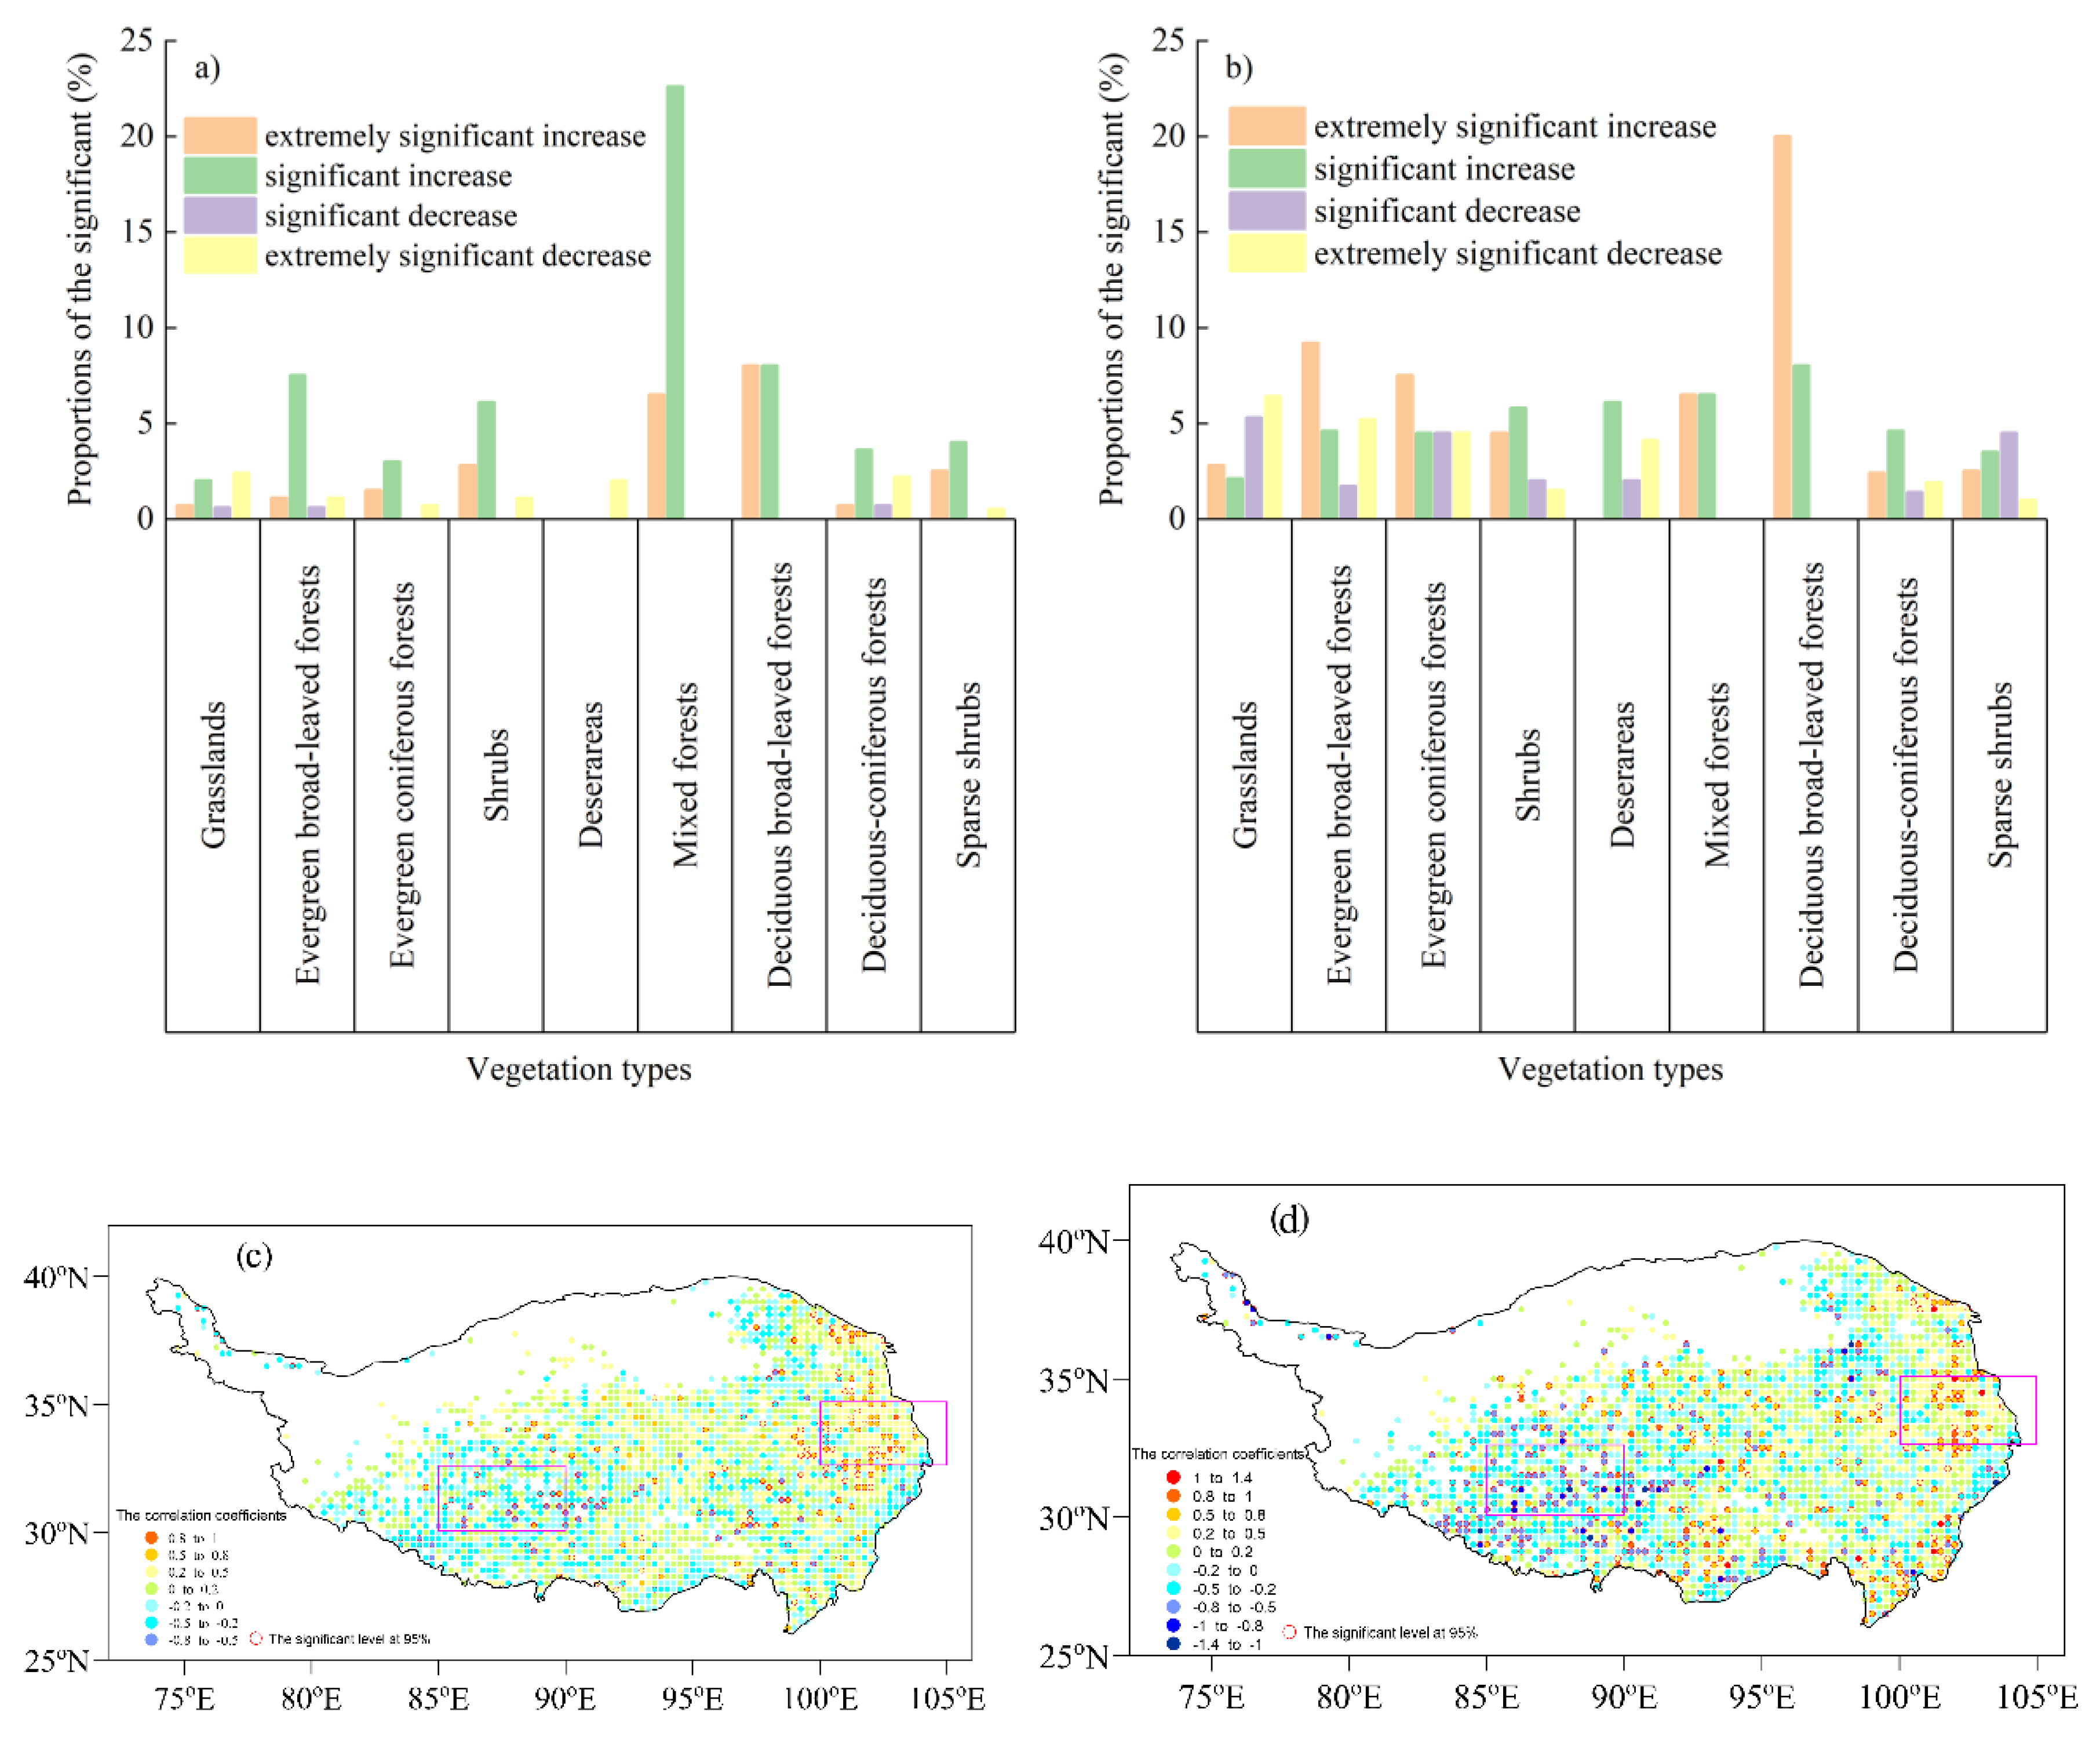
Figure 6.
Vertical integrals of zonal and meridional water vapor fluxes in regions (a, c, e) Q1 and (b, d, f) Q2. The positive and negative zonal water vapor fluxes indicate the eastward and westward transport, respectively, and the positive and negative meridional water vapor fluxes indicate the northward and southward transport, respectively. The shaded areas are from 2007 to 2015.
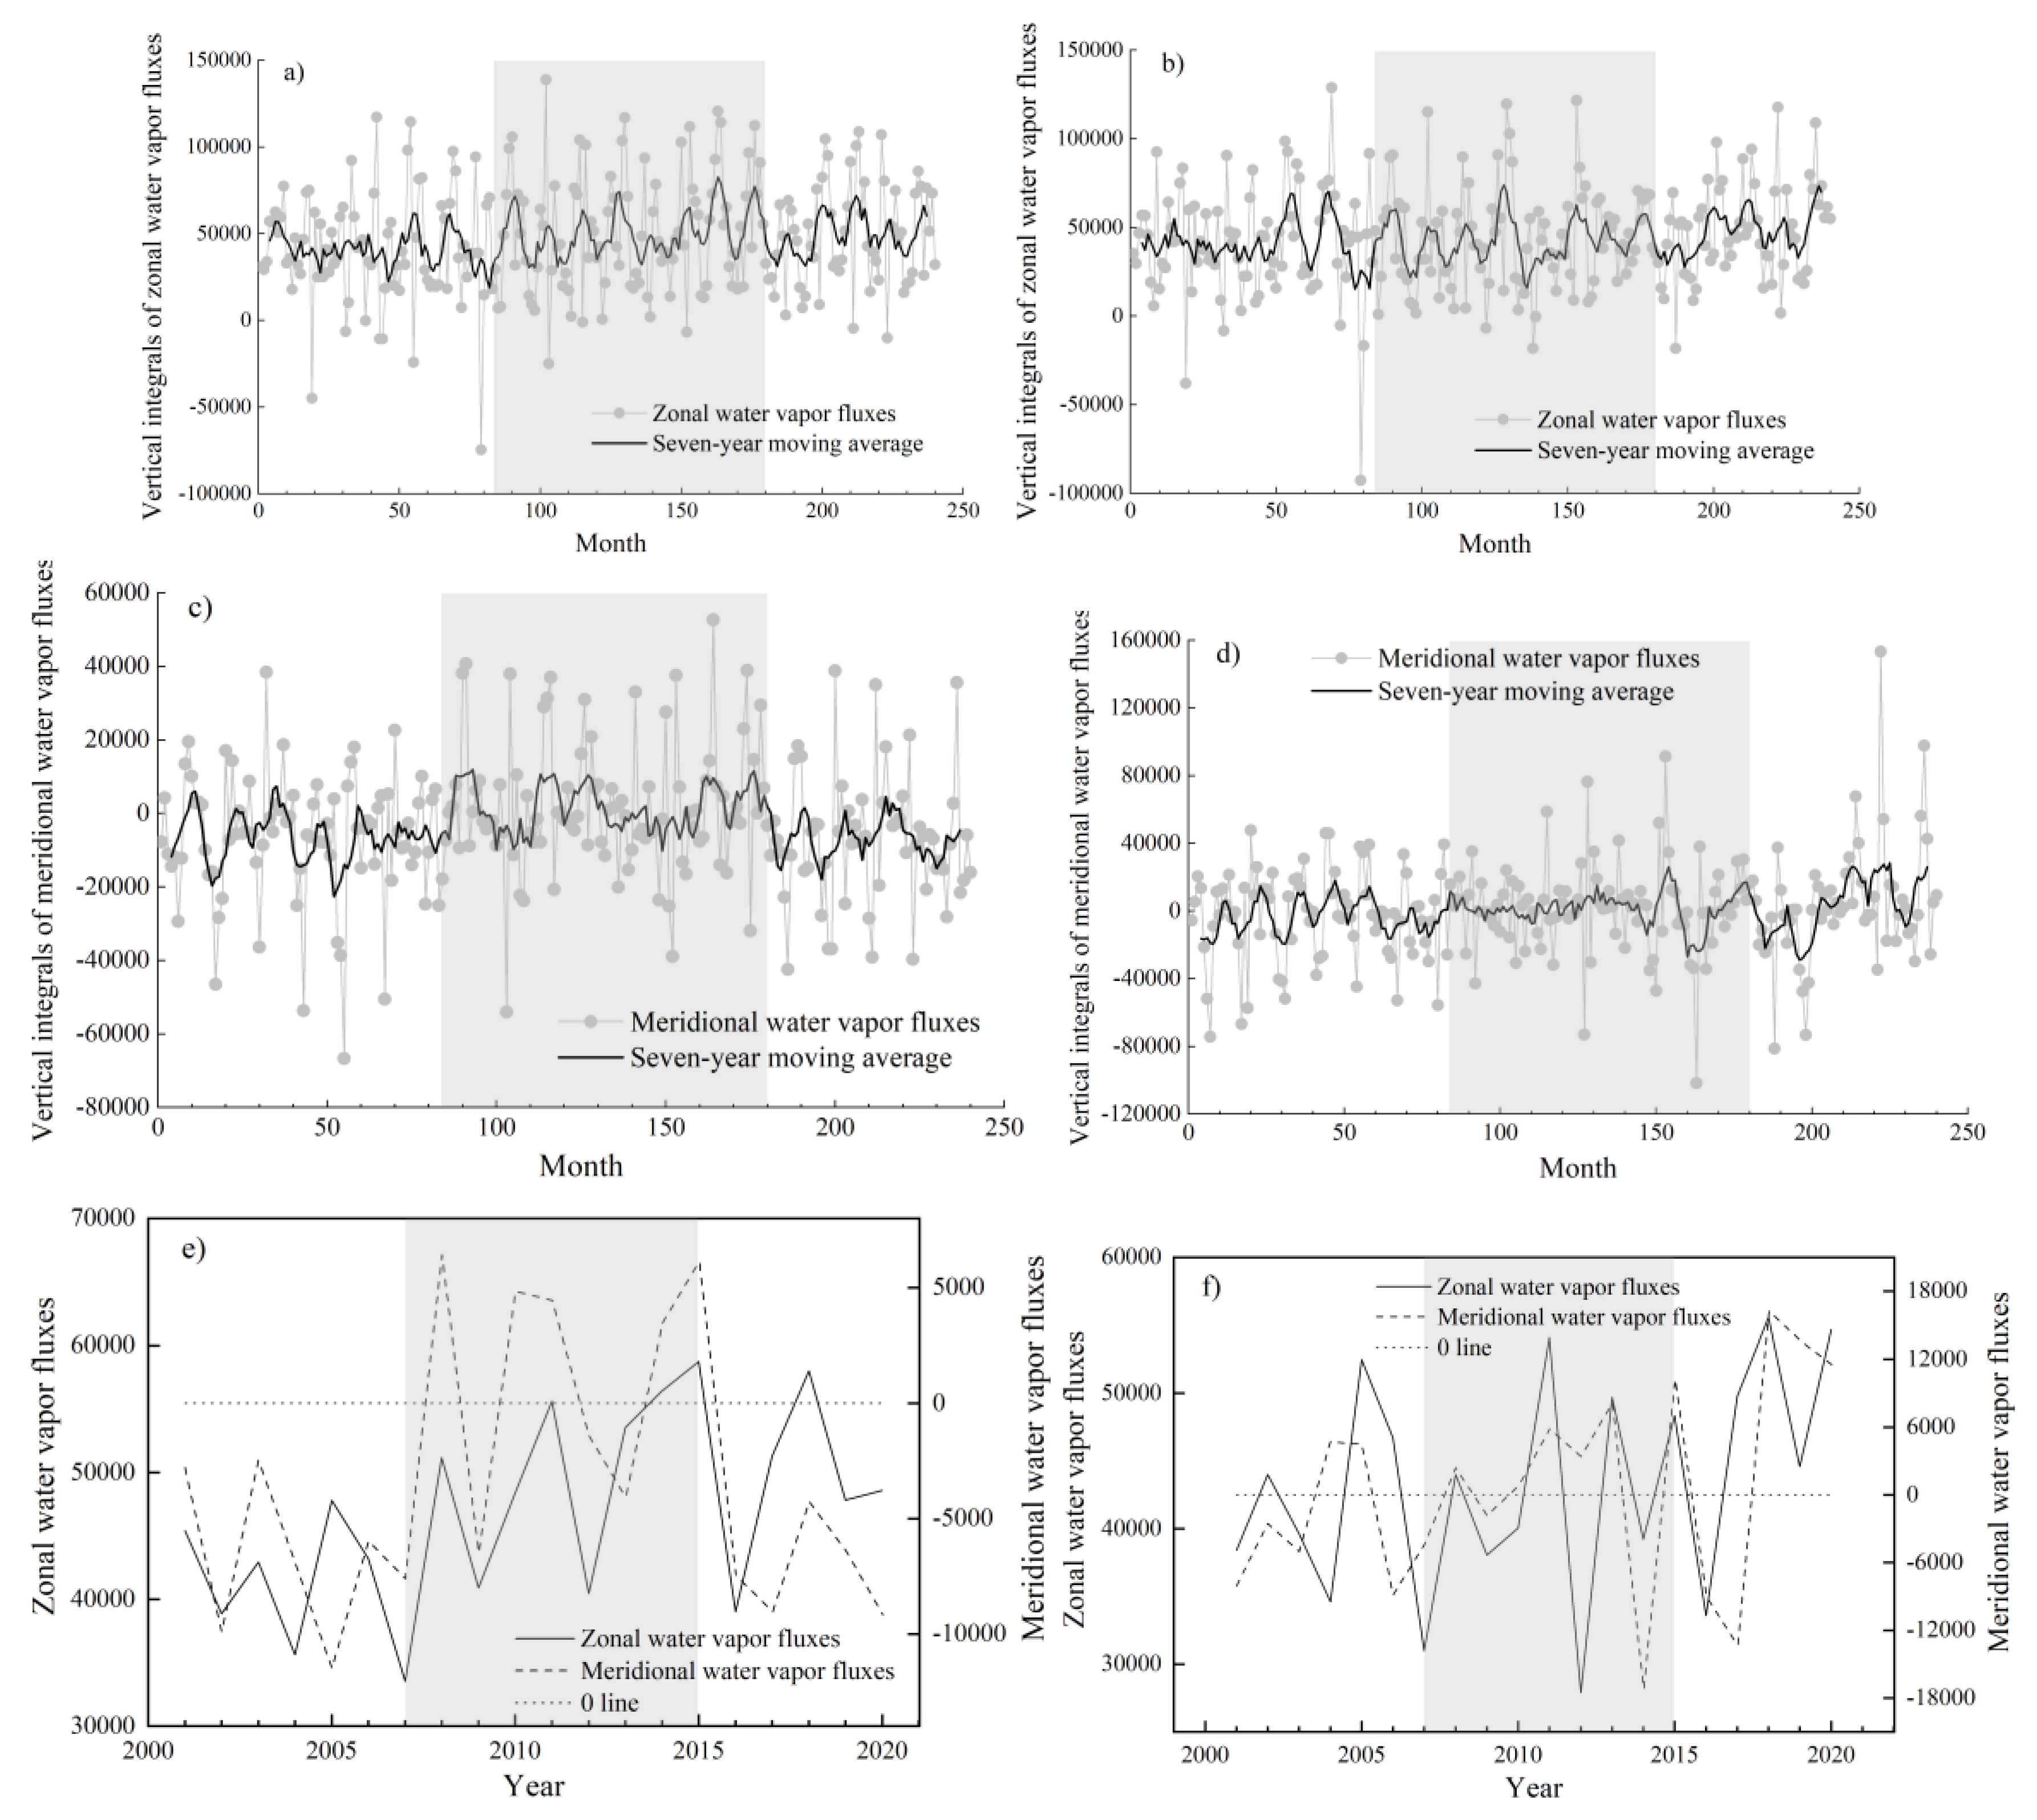
Figure 7.
Partial correlation analysis of the annual EQI on the TP with (a) the vorticity area (IVarea), (b) East Asian summer monsoon index (EMI), (c) South Asian summer monsoon index (SMI) and (d) westerly index (WI) on the TP.
Figure 7.
Partial correlation analysis of the annual EQI on the TP with (a) the vorticity area (IVarea), (b) East Asian summer monsoon index (EMI), (c) South Asian summer monsoon index (SMI) and (d) westerly index (WI) on the TP.
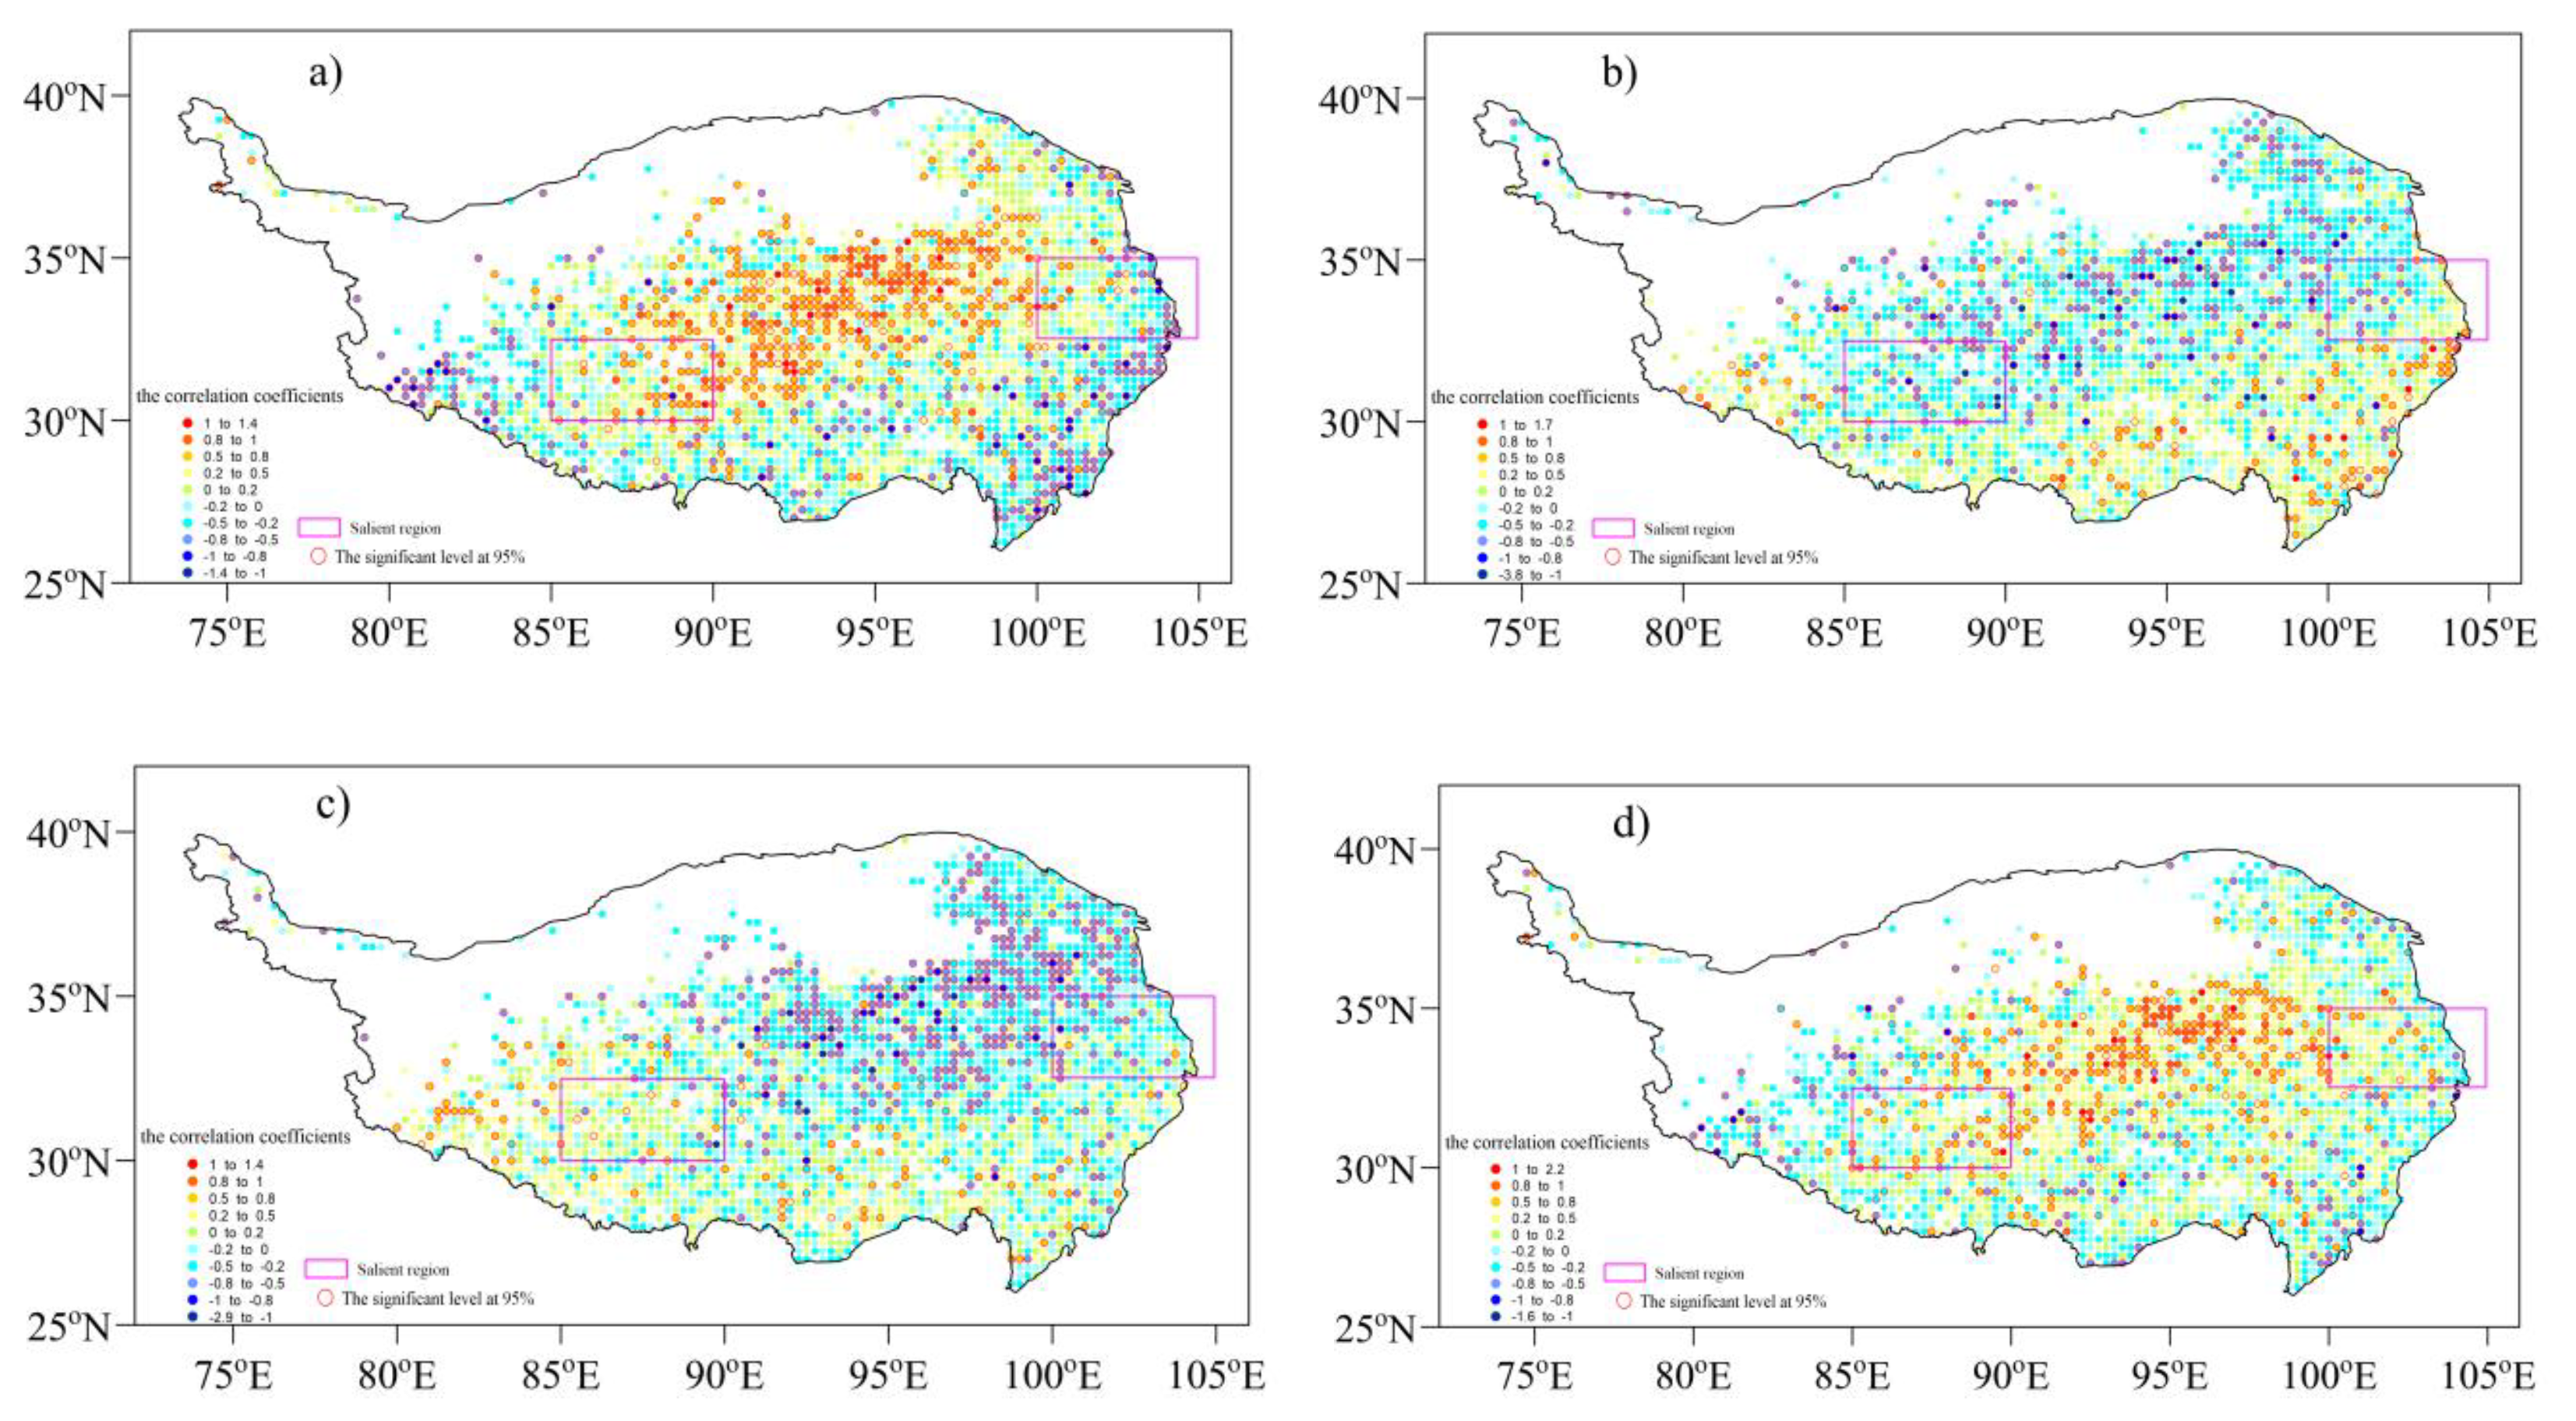
Figure 8.
Five-year moving average of the IVarea, EMI, SMI and WI from 2001 to 2020.
Figure 9.
Areas of the vertical integrals of the (a) meridional and (b) zonal water vapor transport that significantly influence the EQI in regions Q1 and Q2 from 2001 to 2020.
Figure 9.
Areas of the vertical integrals of the (a) meridional and (b) zonal water vapor transport that significantly influence the EQI in regions Q1 and Q2 from 2001 to 2020.

Table 1.
Grades of vegetation ecological quality index (EQI) on the Tibetan Plateau (TP).
| Grades | Good | Relatively good | Medium | Relatively poor | Poor |
|---|---|---|---|---|---|
| EQI range | EQI ≥ 75 | 55 ≤ EQI < 75 | 35 ≤ EQI < 55 | 20 ≤ EQI < 35 | EQI < 20 |
Table 2.
Persistent variation trend of future vegetation ecological quality on the TP.
| β(trend) | Hurst | Variation | Area percentage (%) |
|---|---|---|---|
| β<0 | 0<Hu<0.5 | improvement trend | 35.5 |
| β<0 | 0.5<Hu<1 | persistent degradation trend | 5.9 |
| Hu=0.5 | remain stable | 28.9 | |
| β>0 | 0<Hu<0.5 | degradation trend | 15.8 |
| β>0 | 0.5<Hu<1 | persistent improvement trend | 13.9 |
Table 3.
Variation characteristics of water vapor fluxes in different regions and the areas with significant impact of circulation factors and meteorological factors on EQIs.
Table 3.
Variation characteristics of water vapor fluxes in different regions and the areas with significant impact of circulation factors and meteorological factors on EQIs.
| Circulation analysis | Q1 | Q2 |
|---|---|---|
| Rectangular range | 32.5°–35°N,100°–105°E | 30°–32.5°N,85°–90°E |
| Vegetation type | mixed forests,deciduous broad-leaved forests, shrubs and evergreen broad-leaved forests, | Grasslands |
| Trend of zonal water vapor flux (kg m−1 s−2) | 6491.3 | 4749.2 |
| Trend of meridional water vapor flux (kg m−1 s−2) | 576.1 | 5375.6 |
| Significant impact range of IVarea on EQI (%) | 16.8% | 24.1% |
| Significant impact range of EMI on EQI (%) | 11.2% | 13.3% |
| Significant impact range of SMI on EQI (%) | 12.8% | 8.4% |
| Significant impact range of WI on EQI (%) | 11.7% | 20.2% |
Disclaimer/Publisher’s Note: The statements, opinions and data contained in all publications are solely those of the individual author(s) and contributor(s) and not of MDPI and/or the editor(s). MDPI and/or the editor(s) disclaim responsibility for any injury to people or property resulting from any ideas, methods, instructions or products referred to in the content. |
© 2025 by the authors. Licensee MDPI, Basel, Switzerland. This article is an open access article distributed under the terms and conditions of the Creative Commons Attribution (CC BY) license (http://creativecommons.org/licenses/by/4.0/).
Copyright: This open access article is published under a Creative Commons CC BY 4.0 license, which permit the free download, distribution, and reuse, provided that the author and preprint are cited in any reuse.


