Submitted:
30 March 2025
Posted:
31 March 2025
You are already at the latest version
Abstract
The magnitude of an earthquake is related to many variables. Among those variables are the geological rocks. It is hypothesized that a sedimentary rock is one of the geological types that can magnify an earthquake wave. Recently an earthquake with a strong magnitude has occurred in Myanmar. In this regard, this study aimed to elaborate how the recent Myanmar earthquake is related to the geological rocks. Besides that, this study also used the geological rock as predictor variables to model the potential earthquake risk zones. The model was generated using a machine learning method. The earthquake data used were data with periods of 28–30 March 2025. This study confirmed that most of the earthquake data occurrences were within the sedimentary rock regions. Based on the model, it confirms that the western parts of Myanmar have earthquake risk ranging from high to very high. This model then encourages the related stakeholders to consider the geological rocks and particularly the presence of sedimentary rocks. This variable should be considered in the development of a region that limits the earthquake risk.
Keywords:
AUC
; earthquake
; fault
; machine learning
; sedimentary
1. Introduction
Myanmar is situated in a major seismic belt and is, therefore, prone to earthquakes. The country is vulnerable to hazards from moderate to large magnitude earthquakes, including tsunami risks along its extensive coastal areas. The seismotectonic features of the region indicate that most earthquakes in Myanmar originate from an active subduction zone known as the Andaman Megathrust Zone in the west, as well as from a significant transform fault zone called the Sagaing Fault Zone in the central part of the country. Historically, at least two large magnitude earthquakes along these subduction zones have generated tsunamis. Additionally, the tsunami triggered by the massive 2004 Sumatra Earthquake caused moderate damage to certain areas along the Myanmar coast. Therefore, it is clear that Myanmar is at risk from both moderate and large magnitude earthquakes, along with the associated tsunami hazards (Thein et al. 2009).
Recently, numerous machine learning-based models have been utilized to estimate the distribution of disaster potential. As computer technology advances, an increasing number of disaster research studies are adopting machine learning techniques, including Random Forest (Wang et al. 2024), Artificial Neural Networks, Support Vector Machines, and Decision Trees, to assess and predict disasters (Gao et al. 2022). Zhang et al. (2021) combined a pipe flow model with a surface diffuse flow model to create a hydrodynamic model for flood hazard simulation. Similarly, Zhang et al. (2023) developed a flood prediction model that integrated a Back Propagation (BP) neural network with the Storm Water Management Model (SWMM) to evaluate regional flood risk in various cities. Their model revealed that the performance of the piped drainage system was inadequate to handle heavy rainfall with high return periods. Meanwhile, Li et al. (2023) devised a Bayesian network-based bowtie model for disaster risk analysis, focusing on flood risk evaluation and proposing prevention and control strategies for accidents. Chen et al. (2023) developed a neural network architecture that combined Convolutional Neural Network (CNN) and Long Short-Term Memory (LSTM) components. This model was trained to provide rapid and accurate predictions of internal flood depth. The aforementioned studies highlight the promising applications of machine learning in modeling the potential risks associated with disasters, including earthquake disasters.
On March 28, 2025, a powerful and devastating earthquake struck Myanmar, impacting a major city. This was not the first earthquake to hit the region, as Myanmar has a history of experiencing significant seismic activity. In light of this situation, it is essential to develop a method for estimating areas prone to earthquakes. To ensure accuracy, a machine learning model to identify Potential Earthquake Risk Zones is urgently needed. This model can help encourage stakeholders to consider earthquake risk when planning regional development, ultimately aiming to minimize the impact of future earthquakes.
2. Materials and Methods
The research was conducted on Myanmar where earthquake with strong magnitude has been reported recently. The modeling methodology followed recent study (Huang et al. 2024), including earthquake occurrence, geological rock variables, and model evaluation.
2.1. Study Site
The study was conducted in a country of Myanmar, with the study areas located between longitudes 90°–100° E and latitudes 15°–27° N. These specific areas were chosen based on their history of earthquake occurrences. The shapefiles of these regions then were reared for further analysis.
2.2. Earthquake Occurrences
Earthquakes were reported from 28 to 30 March 2025, following a series of recent strong and destructive seismic events. The data was retrieved from https://www.emsc-csem.org/Earthquake_map/ on 30 March 2025. This recorded information includes the geocoordinates, depth, and distances of the epicenters. The geocoordinates were then organized and formatted into a CSV file as required for modeling. The earthquake data were visualized as points.
2.3. Earthquake Predictor Variables
This study utilized earthquake predictor variables such as faults and geological rock formations. The positions of the faults were obtained from recent literature, and the faults were then digitized for overlay with earthquake data, following the methodology of Saputra et al. (2018). The fault lines were visualized as polylines and geo-referenced. The geological rock layer data were sourced from the GSJ CCOP Combined Bedrock and Superficial Geology and Age, which is a geological map produced and compiled by the Coordinating Committee for Geoscience Programmes in East and Southeast Asia (CCOP). Each polygon's attributes include information about bedrock, superficial geology, and age. The bedrock was visualized as polygons and geo-referenced as well. This bedrock data was subsequently used for modeling as predictor variables.
2.4. Potential Earthquake Risk Zone Modeling
To estimate potential earthquake risk zones in the studied regions of Myanmar, this study utilized machine learning techniques (Dolci and Peruzzi 2022) with R software version 3.6.3 (Mao et al. 2021). The R packages employed to support the machine learning analyses and to create models of potential earthquake risk zones include the "dismo" and "sp" packages (Khan et al. 2022), the "rgdal" package (Bivand, 2022), and the "raster" library (Lemenkova 2020). Geological rock layers were included as predictor variables in the model inputs.
Subsequently, the results from the machine learning models predicting potential earthquake risk zones were imported into GIS for visualization and further spatial analysis (Hijmans et al. 2012). The QGIS platform, version 2.16, was used in this study. The earthquake risk zones were classified into five categories: very low, low, moderate, high, and very high risk.
2.5. Earthquake Risk Zone Model Evaluation
Model evaluation and validation are crucial for ensuring the reliability of modeling results. This is typically expressed through the area under the receiver operating characteristic (ROC) curve (AUC), which is calculated using the accuracy test of the ROC curve analysis method. The AUC values range from 0 to 1 and are categorized into several classifications:
- -
- an AUC value below 0.5 indicates that the model performs worse than random guessing.
- -
- an AUC value between 0.5 and 0.6 is considered poor.
- -
- an AUC value from 0.6 to 0.7 is regarded as fair.
- -
- an AUC value from 0.7 to 0.8 is classified as good.
- -
- an AUC value from 0.8 to 0.9 is considered very good.
- -
- an AUC value between 0.9 and 1 is classified as excellent.
The closer the AUC is to 1, the better the model's ability to discriminate and accurately describe the potential earthquake risk zone.
3. Results and Discussion
3.1. Earthquake Occurrences
This study has identified 15 earthquake occurrences between 28 and 30 March 2025 in the areas of Myanmar under investigation. By overlaying the earthquake data with predictor variables such as fault lines and geological formations, two important findings emerged, as illustrated in Figure 1.
First, more than half of the earthquakes occurred very close to the Sagaing Fault, which runs from the north to the south of Myanmar. There were at least two clusters of earthquake occurrences, both located in proximity to this fault. This observation aligns with previous research indicating that earthquakes frequently occur near fault lines. The clusters are situated between latitudes 19.240 and 22.770, in an area known as the Thazi–Pyinmana Segment. According to historical earthquake data (Tun 2010), this segment experiences relatively few earthquakes compared to the surrounding segments. As a result, the strong earthquakes happened recently in 2025 may be linked to the release of accumulated energy in this segment.
The Sagaing Fault is a significant right-lateral strike-slip fault that extends over 1,200 km throughout Myanmar and is responsible for several major earthquakes. The presence of strong magnitude earthquakes near this fault is related to its slip rates. According to Vigny et al. (2003), the slip rate is approximately 18 mm/year; Maurin et al. (2010) reported it to be around 22 mm/year, while Mallick et al. (2019) noted it could be as high as 24 mm/year. These conditions help explain the frequent occurrences of strong earthquakes near the Sagaing Fault.
This study confirms that earthquake occurrences are closely associated with specific types of geological formations, particularly sedimentary rocks. Notably, 12 out of 15 earthquakes that occurred between March 28 and March 30, 2025, were located in areas with sedimentary rock formations. This finding aligns with prior research indicating that geological formations can influence earthquake risk. Deep sedimentary basins tend to amplify long-period shaking from seismic waves, thereby increasing the seismic hazard for urban areas situated on such basins (Wirth et al. 2019b). Unfortunately, many urban regions are built on sedimentary basins due to the appealing flat terrain for housing and infrastructure, as well as their favorable locations near water bodies like rivers and harbors.
3.2. Earthquake Risk Zone Model
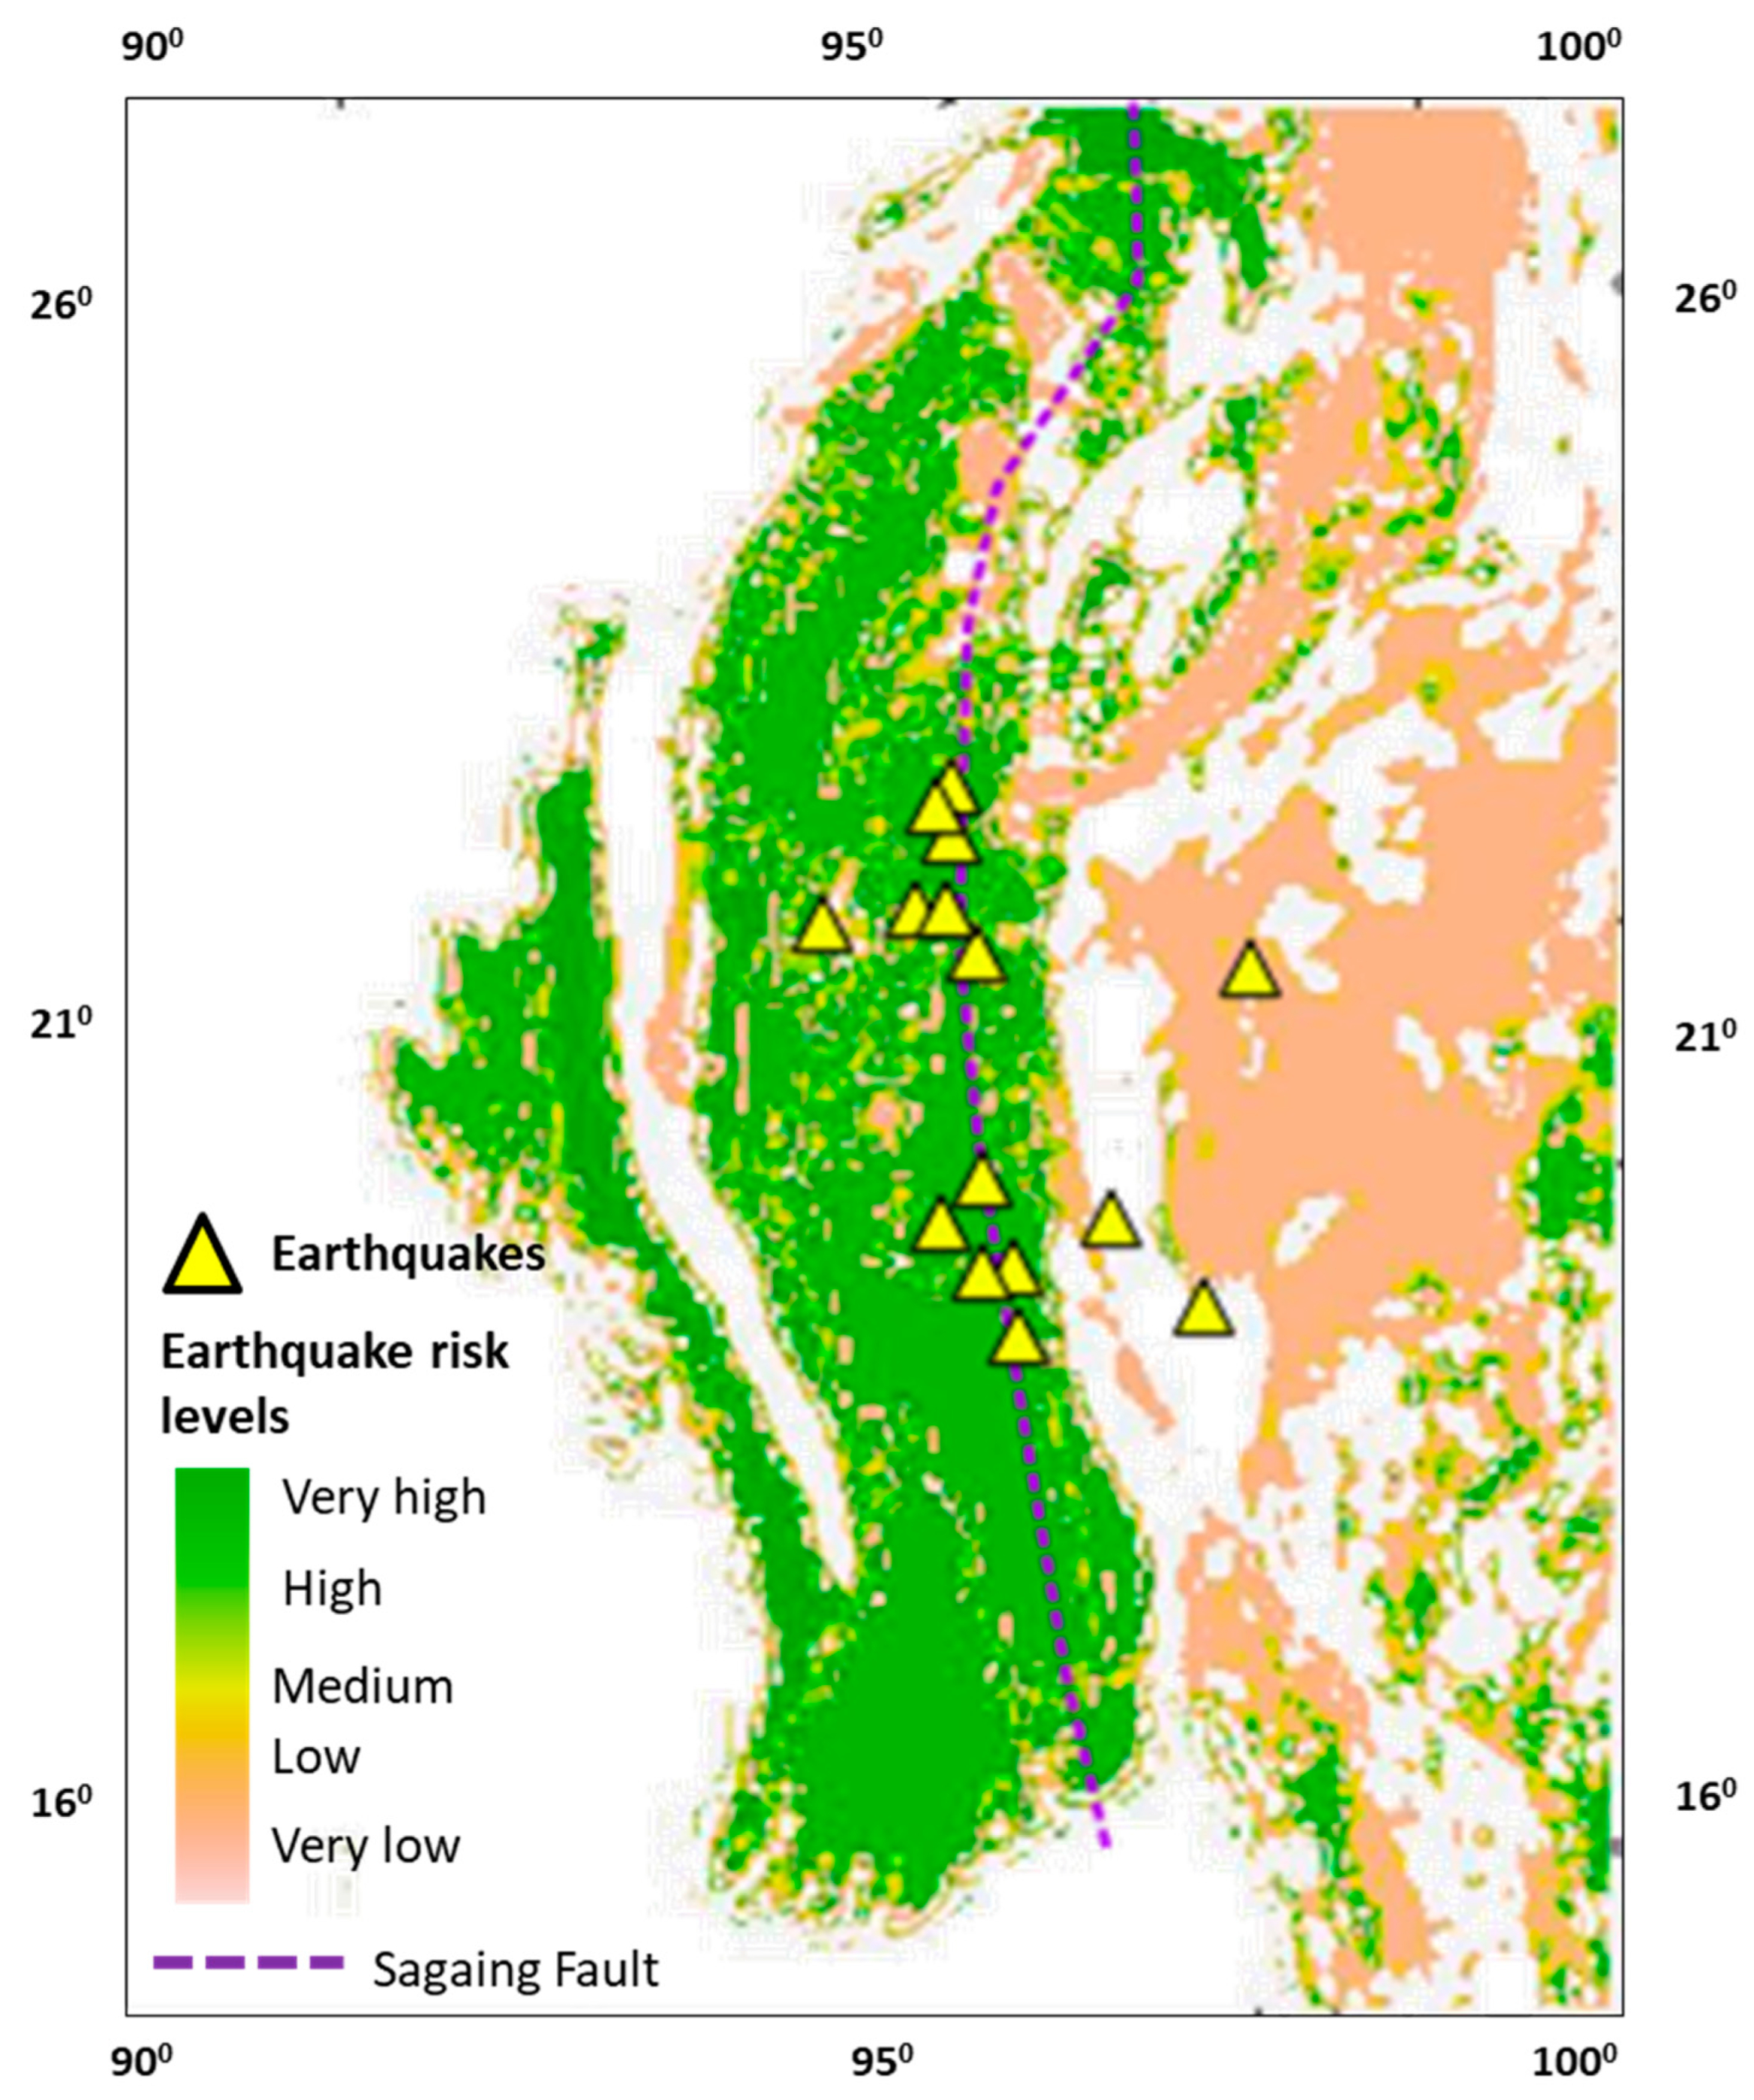
The evaluation results of the model indicate that its AUC value is 0.718 (Figure 2), which classifies the model as good. According to the model, most of the western part of Myanmar is considered to have high to very high risks (Figure 3). This assessment is related to the presence of sedimentary rock in the western regions. This model aligns with a previous model developed by GEM in 2019. Utilizing types of settlements as predictors, that model also confirmed that the high-risk areas are located in the western part of Myanmar.
4. Limitations of the Study
This study focuses exclusively on geological rock variables to develop the earthquake risk model. However, there are many other factors that could also be considered when modeling earthquake risk zones. One important factor is the structural integrity of buildings. Earthquakes can cause significant damage if buildings are weak and fail to meet safety standards. This vulnerability can be influenced by the materials used in construction (Rupakhety and Gautam, 2024) and other contributing factors. Additionally, the design of buildings can create resonance (Chen et al. 2022, Gangone et al. 2023), which may serve as a predictor variable for modeling the magnitude of earthquake impacts. The proposed variables should be available in a spatial format, specifically as polygons, to enable effective modeling. By utilizing maps that categorize buildings based on their height, it becomes possible to model the risk zones according to the predicted impacts of earthquakes.
5. Conclusions
This study, to the best of our knowledge, has made two important findings. First, it confirms the relationship between earthquakes and geological rock formations. Second, it provides the latest evidence to identify risk areas that require attention moving forward. The model generated from this study encourages stakeholders to take into account geological rocks, particularly the presence of sedimentary rocks. This variable should be considered in regional development plans to help minimize earthquake risk.
Declaration of Competing Interest
The authors declare that they have no known competing financial interests or personal relationships that could have appeared to influence the work reported in this paper.
Data availability
Data will be made available on request.
Funding
This research was funded through internal funding mechanisms of Center for Health and Earth Modeling (CHEM).
References
- Bivand, R.R. packages for analyzing spatial data: a comparative case study with areal data. Geographical Analysis 2022, 54. [Google Scholar] [CrossRef]
- Chen, S.; Liu, Q.; Zhai, C.; Wen, W. Influence of building-site resonance and building properties on site-city interaction: A numerical investigation. Soil Dynamics and Earthquake Engineering 2022, 158, 107307. [Google Scholar] [CrossRef]
- Chen, J.; Li, Y.; Zhang, S. Fast Prediction of Urban Flooding Water Depth Based on CNN−LSTM. Water 2023, 15, 1397. [Google Scholar] [CrossRef]
- Dolci, D.; Peruzzi, L. Assessing the effectiveness of correlative ecological niche model temporal projection through floristic data. Biology 2022, 11, 1219. [Google Scholar] [CrossRef]
- Gangone, G.; Gallipoli, M. R. , Tragni, N., Vignola, L., Caputo, R. Soil-building resonance effect in the urban area of Villa d’Agri (Southern Italy). Bulletin of Earthquake Engineering 2023, 21, 3273–3296. [Google Scholar] [CrossRef]
- Gao, J.; Murao, O.; Pei, X.; Dong, Y. Identifying Evacuation Needs and Resources Based on Volunteered Geographic Information: A Case of the Rainstorm in July 2021, Zhengzhou, China. Int. J. Environ. Res. Public Health 2022, 19, 16051. [Google Scholar] [CrossRef]
- GEM 2019. Development of the Earthquake Risk Model for Myanmar.
- Hijmans, R.J.; Guarino, L.; Mathur, P. (2012). Diva-GIS Version 7.5 Manual.
- Khan, A.M.; Li, Q.; Saqib, Z.; Khan, N.; Habib, T.; Khalid, N.; Majeed, M.; Tariq, A. Maxent modelling and impact of climate change on habitat suitability variations of economically important Chilgoza pine (Pinus gerardiana Wall. ) in South Asia. Forests 2022, 13, 715. [Google Scholar] [CrossRef]
- Huang, F.; Zhu, D.; Zhang, Y.; Zhang, J.; Wang, N.; Dong, Z. Urban Flooding Disaster Risk Assessment Utilizing the MaxEnt Model and Game Theory: A Case Study of Changchun, China. Sustainability 2024, 16, 8696. [Google Scholar] [CrossRef]
- Lemenkova, P. Using R Packages 'tmap', 'raster' and 'ggmap' for cartographic visualization: an example of DEM-based terrain modelling of Italy, Apennine Peninsula. ZbornikRadova – Geografski FakultetUniverziteta U Beogradu. 2020, 68, 99–116. [Google Scholar] [CrossRef]
- Li, J.; Liu, J.; Wu, T.; Peng, Q.; Cai, C. Risk analysis of waterlogging in a big city based on a bow-tie Bayesian network model, using the megacity of Wuhan as an example. Front. Environ. Sci. 2023, 11, 1258544. [Google Scholar] [CrossRef]
- Mao, M.; Chen, S.; Qian, Z.; Xu, Y. Using Maxent to predict the potential distribution of the little fire ant (Wasmannia auropunctata) in China. Insects 2021, 13, 008. [Google Scholar] [CrossRef]
- Maurin, T.; F Masson, C. Rangin, U Than Min, P. Collard. First globalpositioning system results in northern Myanmar: Constant and localized slip ratealong the Sagaing fault. Geology 2010, 7, 591–594. [Google Scholar] [CrossRef]
- Mallick, R.; Lindsey, E. O. , Feng, L., Hubbard, J., Banerjee, P., Hill, E. M. Active convergence of the India-Burma-Sunda plates revealed by a new continuous GPS network. Journal of Geophysical Research Solid Earth 2019, 124, 3155–3171. [Google Scholar] [CrossRef]
- Rupakhety, R.; Gautam, D. Seismic Impact on Building Structures: Assessment, Design, and Strengthening. Buildings 2024, 14, 1545. [Google Scholar] [CrossRef]
- Saputra, A.; Gomez, C.; Delikostidis, I.; Zawar-Reza, P.; Hadmoko, D.S.; Sartohadi, J.; Setiawan, M.A. Determining Earthquake Susceptible Areas Southeast of Yogyakarta, Indonesia—Outcrop Analysis from Structure from Motion (SfM) and Geographic Information System (GIS). Geosciences 2018, 8, 132. [Google Scholar] [CrossRef]
- Thein, M.; Myint, T.; Tun, S.T.; Swe, T.L. Earthquake and tsunami hazard in Myanmar. Journal of Earthquake and Tsunami 2009, 3, 43–57. [Google Scholar] [CrossRef]
- Tun, S.T. (2005). Sagaing Fault: A desk study report on seismotectonic implications in Myanmar. 113 pages. Myanmar Earthquake Committee.
- Vigny, C.; A Socquet, C. Rangin, N. Chamot-Rooke, M. Pubellier, M.-N. Bouin, G.Bertrand, and M. Becker, . Present-day crustal deformation around SagaingFault, Myanmar. J. Geophys. Res. 2003, 108, ETG 6-1-10. [Google Scholar]
- Wang, C.; Wang, K.; Liu, D.; Zhang, L.; Li, M.; Khan, M.I.; Li, T.; Cui, S. Development and application of a comprehensive assessment method of regional flood disaster risk based on a refined random forest model using beluga whale optimization. J. Hydrol. 2024, 633, 130963. [Google Scholar] [CrossRef]
- Wirth, E. A. , Vidale, J. E., Frankel, A. D., Pratt, T. L., Marafi, N. A., Thompson, M., Stephenson, W. J. Source-Dependent amplification of earthquake ground motions in deep sedimentary basins. Geophysical Research Letters 2019, 46, 6443–6450. [Google Scholar] [CrossRef]
- Zhang, F.; Tan, L.; Zhao, Q.; Wu, Y.; Xu, Y.; Gao, C. Research on urban waterlogging disaster based on hydrodynamic model: A case study of Baihe Community in Ningbo City. J. Nat. Disasters 2021, 30, 209–218. [Google Scholar]
- Zhang, J.; Li, X.; Zhang, H. Research on urban waterlogging risk prediction based on the coupling of the BP neural network and SWMM model. J. Water Clim. Chang. 2023, 14, 3417–3434. [Google Scholar] [CrossRef]
Figure 1.
Earthquake occurrences and magnitude for periods of 28–30 March 2025 related to geological rocks with dashed yellow lines representing the Sagaing Fault.
Figure 1.
Earthquake occurrences and magnitude for periods of 28–30 March 2025 related to geological rocks with dashed yellow lines representing the Sagaing Fault.
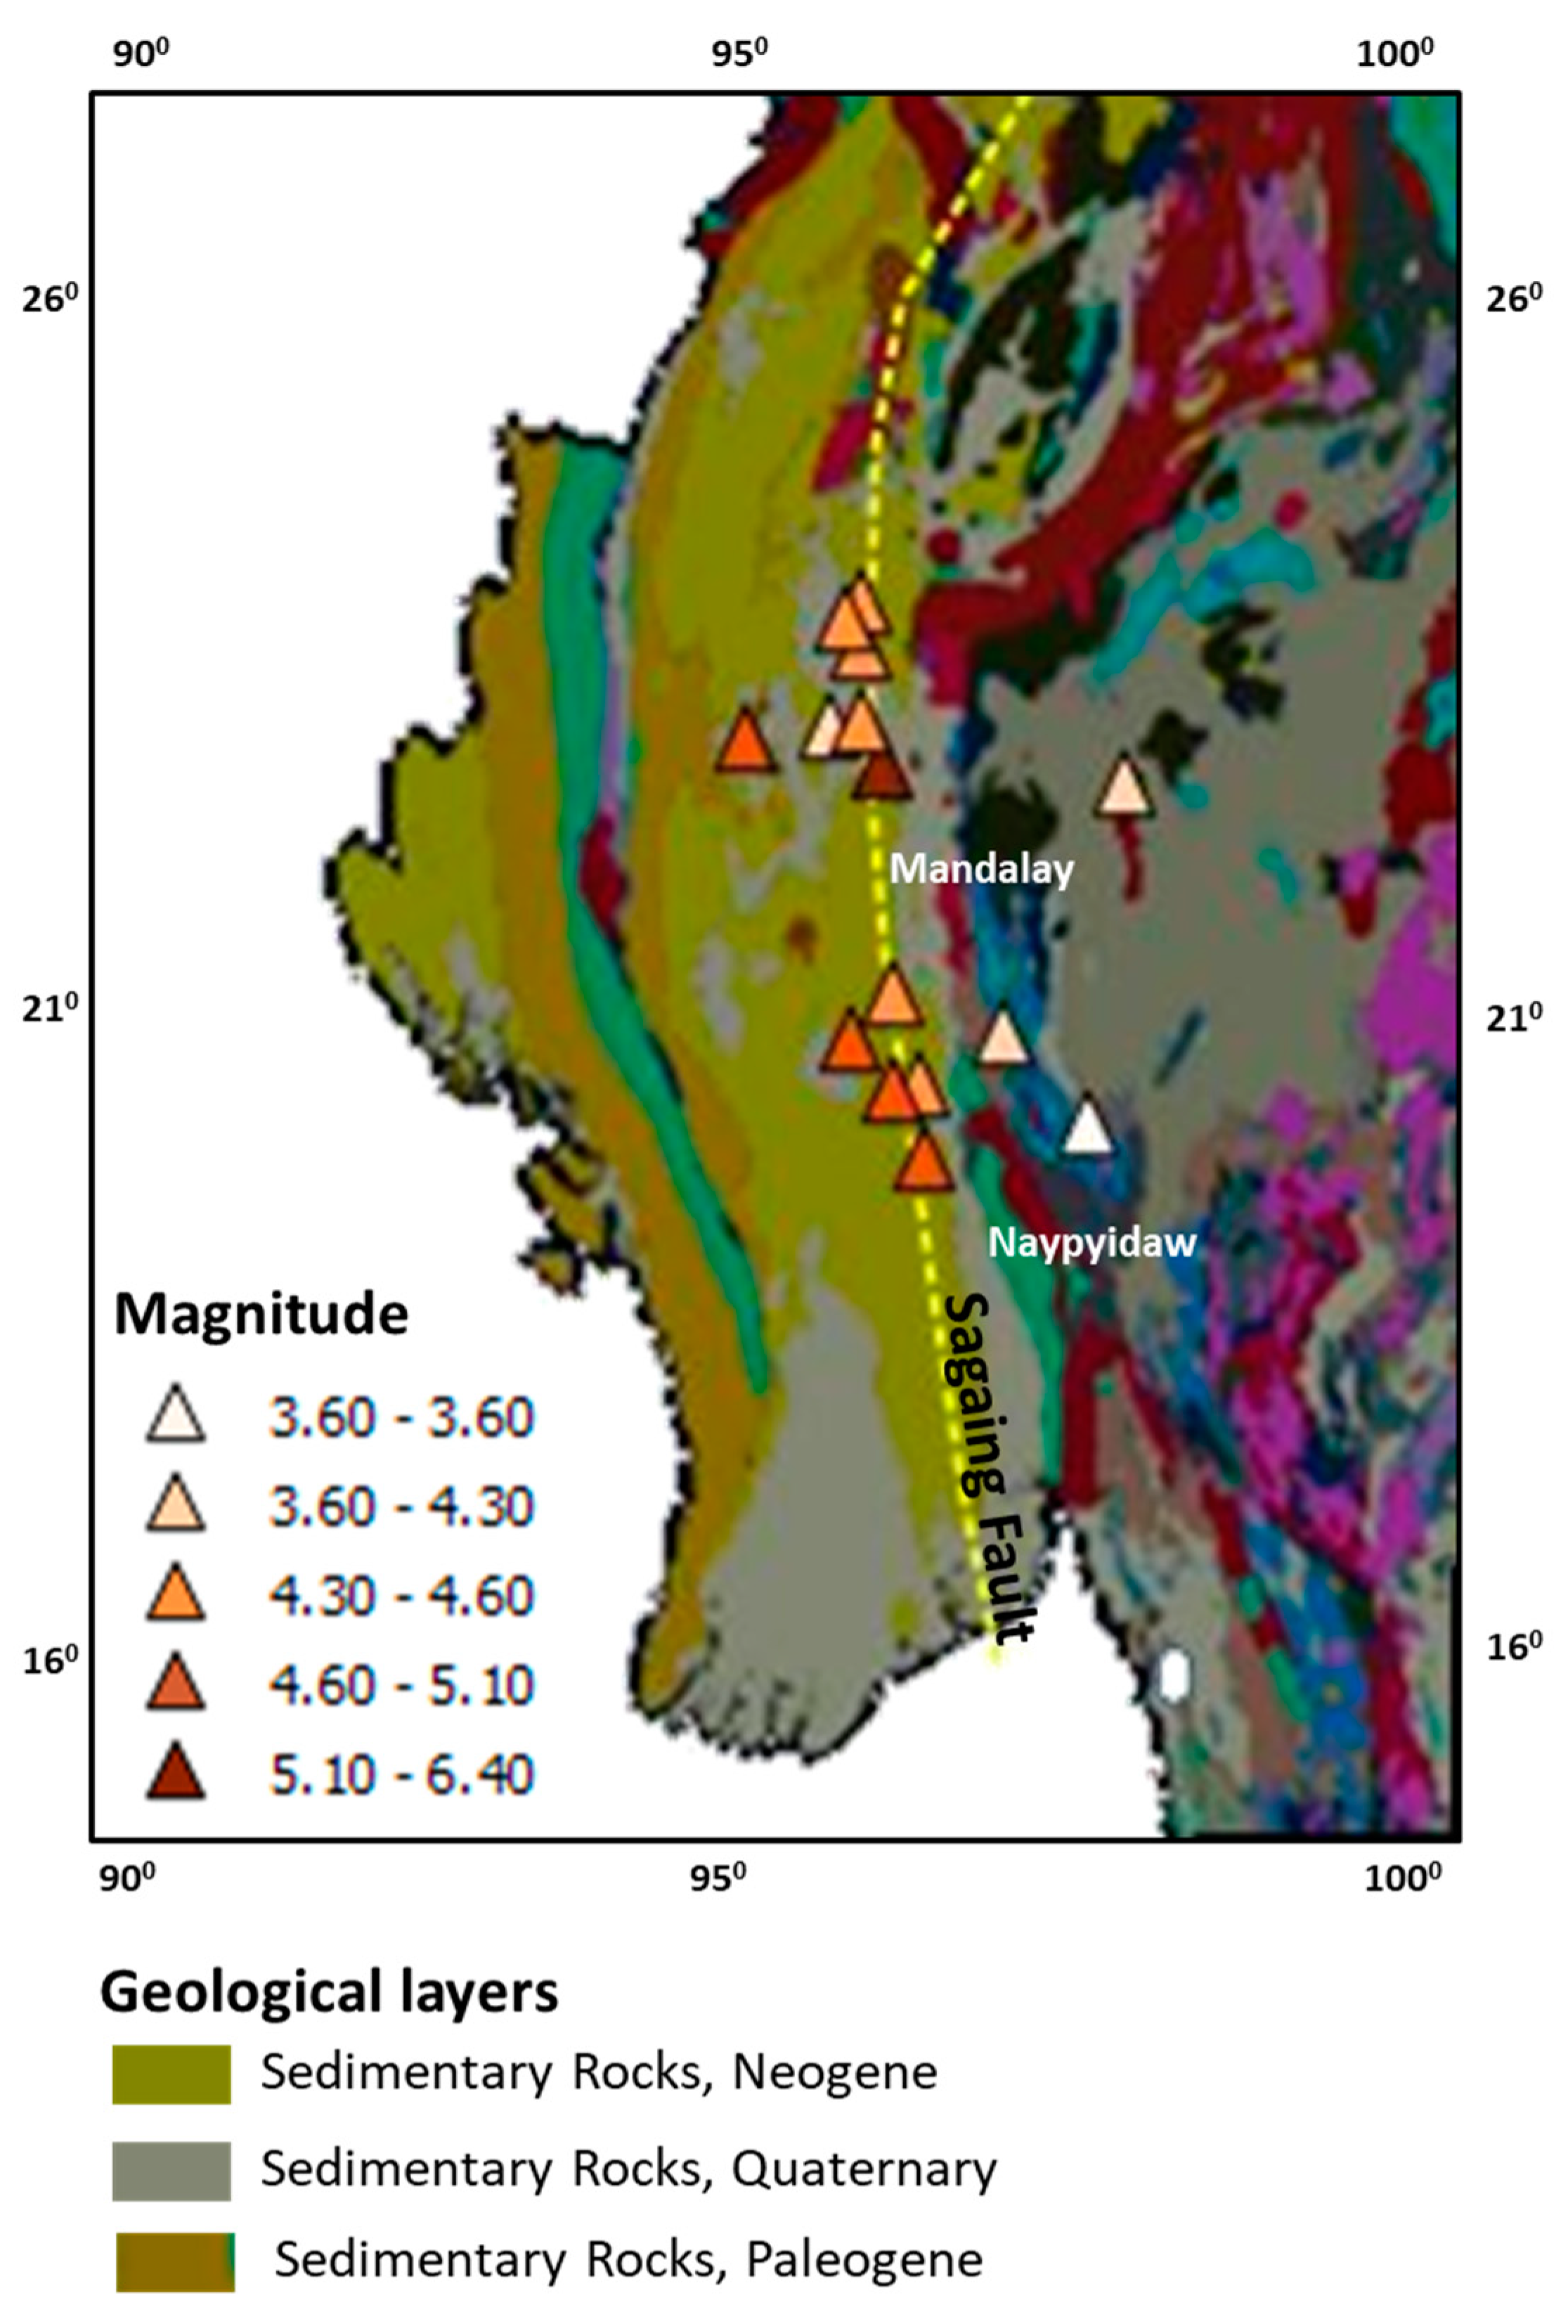
Figure 2.
Response curve and AUC value of earthquakes to the geological rocks as predictor variables.
Figure 2.
Response curve and AUC value of earthquakes to the geological rocks as predictor variables.
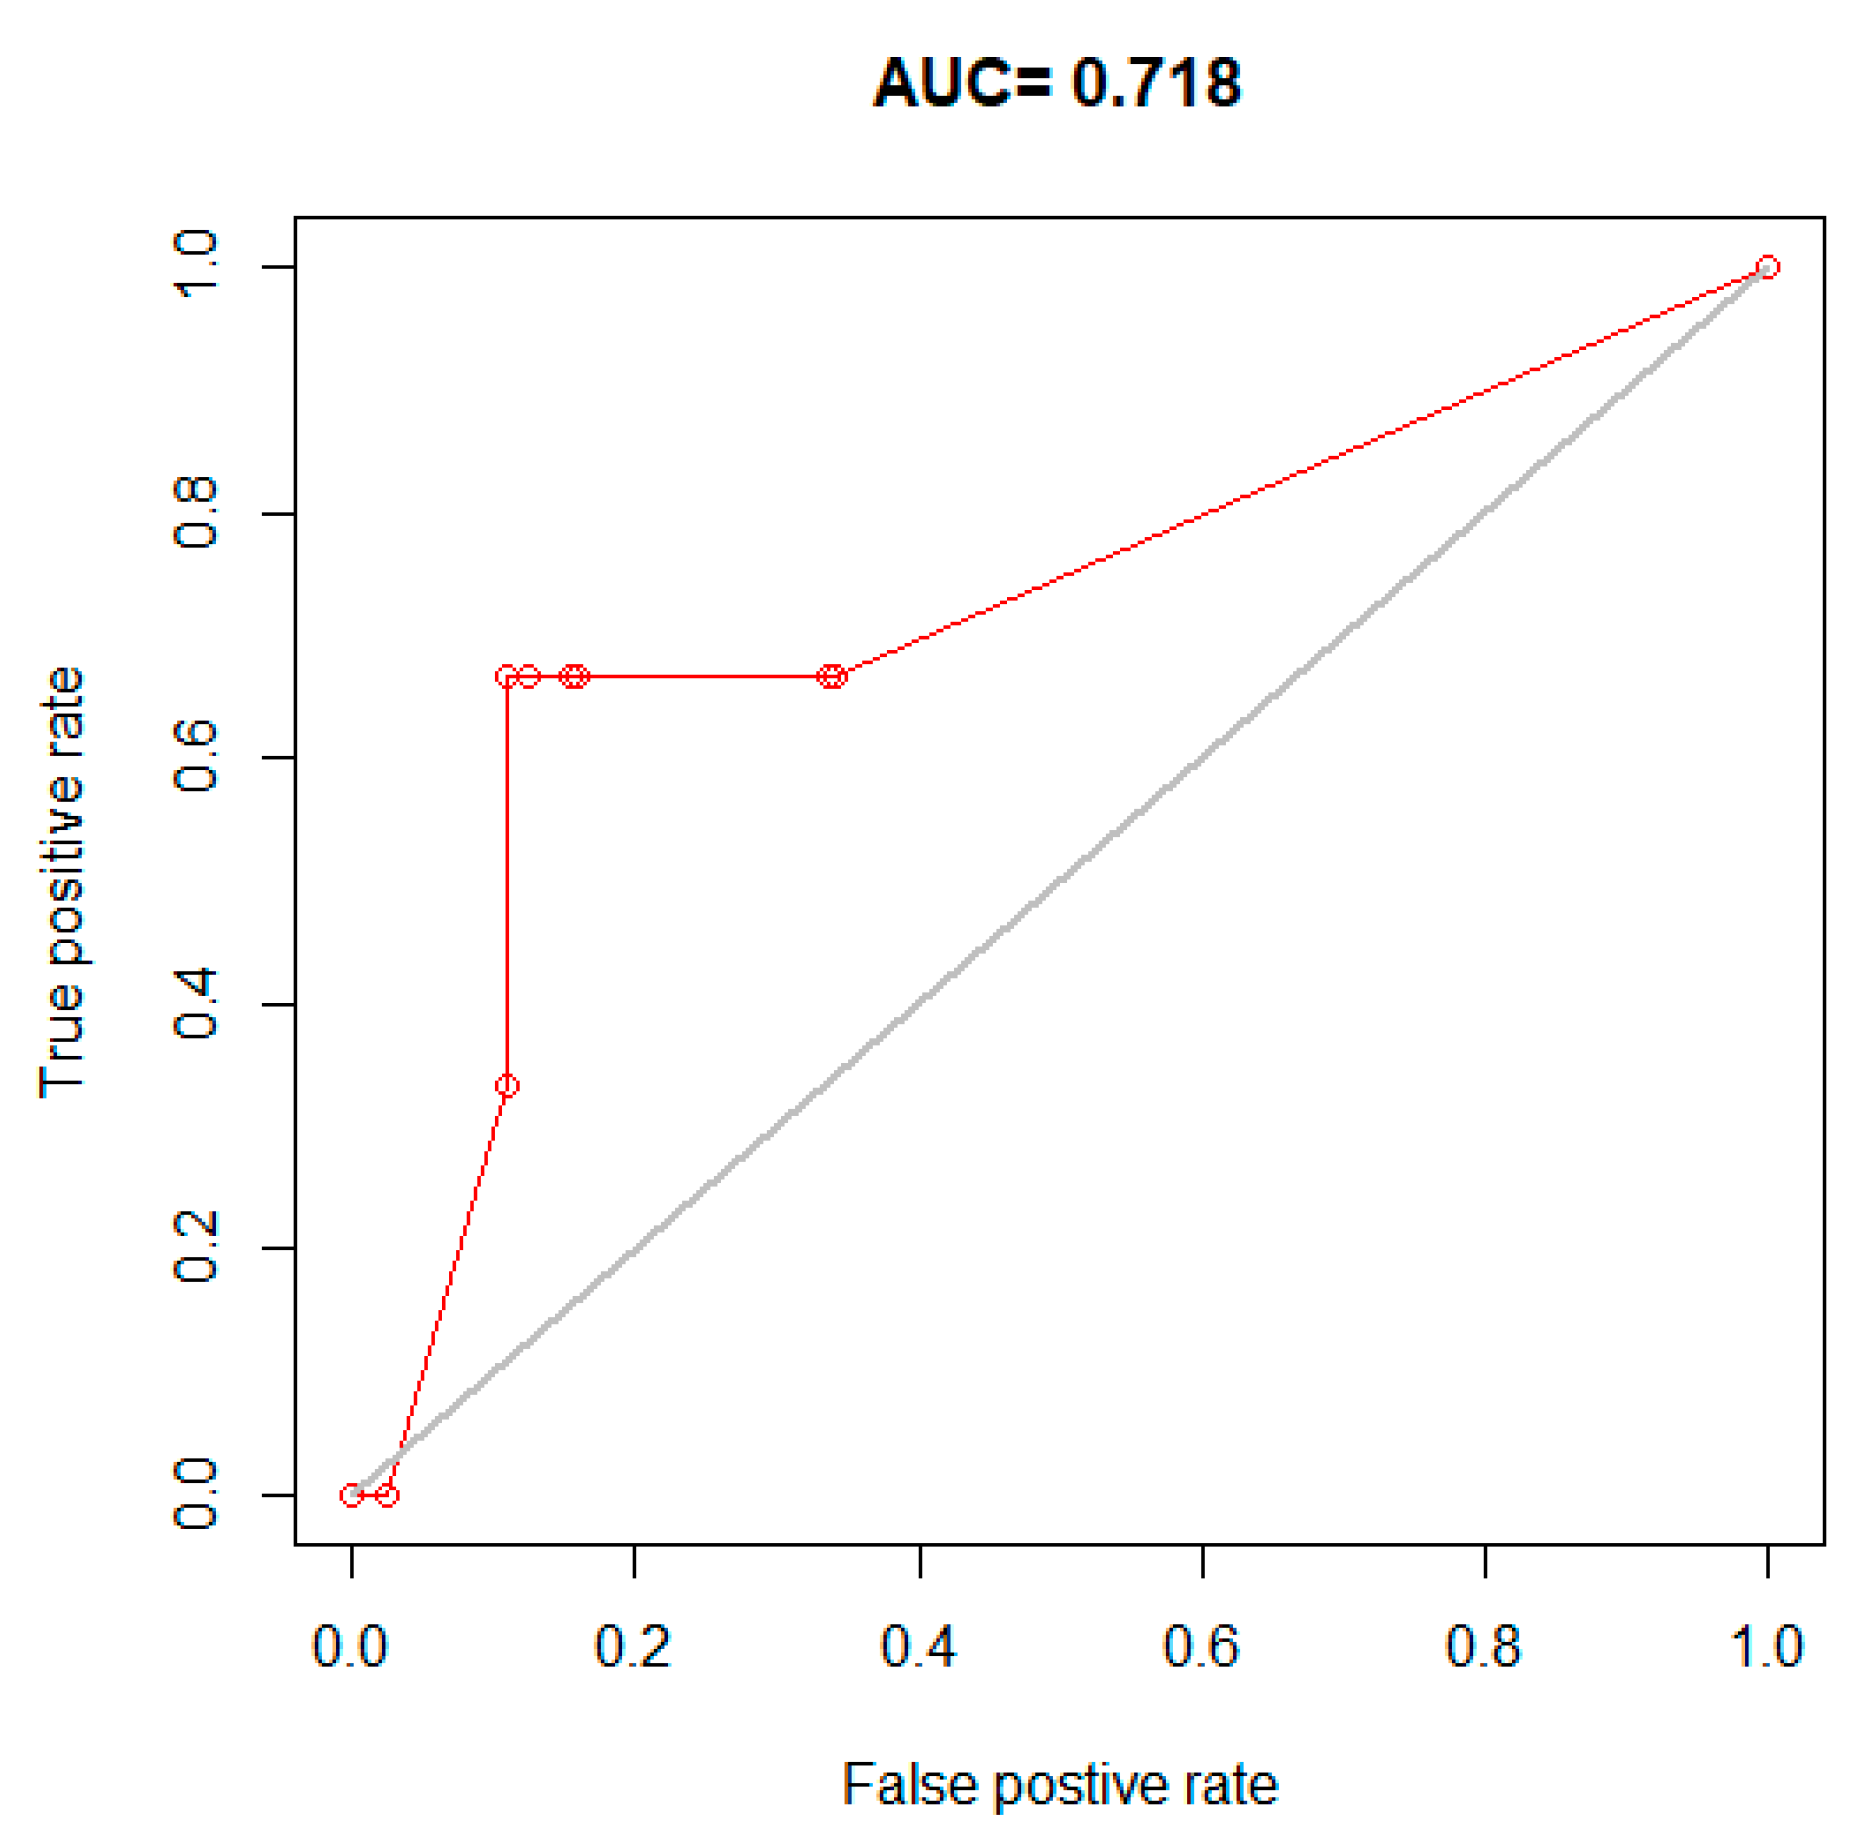
Figure 3.
Machine learning based model to estimate earthquake risk levels using geological rocks as predictor variables.
Figure 3.
Machine learning based model to estimate earthquake risk levels using geological rocks as predictor variables.
Disclaimer/Publisher’s Note: The statements, opinions and data contained in all publications are solely those of the individual author(s) and contributor(s) and not of MDPI and/or the editor(s). MDPI and/or the editor(s) disclaim responsibility for any injury to people or property resulting from any ideas, methods, instructions or products referred to in the content. |
© 2025 by the authors. Licensee MDPI, Basel, Switzerland. This article is an open access article distributed under the terms and conditions of the Creative Commons Attribution (CC BY) license (http://creativecommons.org/licenses/by/4.0/).
Copyright: This open access article is published under a Creative Commons CC BY 4.0 license, which permit the free download, distribution, and reuse, provided that the author and preprint are cited in any reuse.


