
Submitted:
28 March 2025
Posted:
31 March 2025
You are already at the latest version
Abstract
Quantifying ecosystem carbon stocks and various carbon pools across different zones of biosphere reserves is essential for informing policy decisions and advancing scientific research on forest ecosystems' role in climate change mitigation and ecological conservation. Previous carbon stock assessments in the Yayu Coffee Forest Biosphere Reserve (YCFBR) and other moist Afromontane forests primarily focused on disturbance and elevation gradients. However, there is limited data for carbon stock assessments across zonation and zonation effects. Therefore, this study aims to quantifying carbon stock across the three zones of YCFBR in Southwest Ethiopia, i.e., the core zone, buffer and transitional zones. Vegetation data were collected using various plot sizes across the three zones for the core, buffer, and transition zones. Above-ground carbon (AGC) was determined from above-ground biomass (AGB), while below-ground carbon (BGC) was estimated as 27% of the AGC, and then extrapolated to megagrams of carbon per hectare (Mg C ha⁻¹). Litter and soil samples were also collected and analyzed. To evaluate the contributions of species diversity and structural attributes to carbon storage, a correlation analysis was performed. Results indicate significant differences in AGC, BGC, soil organic carbon (SOC), litter carbon (LC), and total carbon (TC) among the core, buffer, and transitional zones. The core zone exhibited the highest AGC and SOC, suggesting superior carbon sequestration, while the buffer zone had the highest LC stock. Overall, TC was highest in the core zone compared to buffer and transitional zones. Additionally, species diversity and stand structure were positively associated with carbon storage, highlighting the importance of preserving diverse and structurally complex forests for enhancing carbon storage and climate change mitigation. Future research should focus on litter decomposition rates across these zones to better understand the relationship between litter carbon stocks and SOC contributions.
Keywords:
carbon pool
; climte change mitigation
; core zone
; forest zones
; southwest Ethiopia
Introductions
According to the 1997 Kyoto Protocol, which is the first major international agreement on climate change, natural vegetation plays an important role in mitigating climate change by naturally collecting carbon from the atmosphere and therefore reducing the impact of CO2 emissions [1,2]. A gradual increase in the global emissions of carbon dioxide (CO2) and consequent temperature increase has become a major concern to work on emissions mitigation [3,4]. Tropical forests play an important role in removing atmospheric CO2 as they store one fourth of the global terrestrial carbon [5]. In addition, tropical forests support at least two-thirds of the world’s biodiversity[6], while their coverage from the total land area of the Earth is about 12%. The current carbon stocks in the world’s forests are estimated to be approximately 359 billion tones [7]. Tropical forests are only cover 7-10% of the Earth’s land surface, but they store 25% of the terrestrial above- and below-ground carbon, which are responsible for 34% of terrestrial primary productivity and harbour 96 % of the world’s estimated 45,000 tree species[8].
Southwestern moist Afromontane forests are providing an important source for the surrounding environment and international communities by reducing the GHGs concentration[9]. Including Yayu Coffee Forest Biosphere Reserve (YCFBR) nominated in 2010, these Moist Afromontane forest of Ethiopia is mainly found in the Southwest escarpment of Ethiopia, where most of the country’s Biosphere reserves are located and known as “Ethiopia’s green lungs” [10]. Biosphere reserve (BR) is ‘living laboratories’ for testing out and demonstrating integrated management of land, water and biodiversity and established to benefit both people and environment by focusing on balancing nature conservation with sustainable development (SD) for and with communities[11]. The three main functions of BR are conserving biodiversity, enhancing ecosystem services, and sustainable development [12]. If BR cannot ensure balanced fulfilment of the three functions of the BR, it leads to withdrawn from UNESCO, for instance, withdrawal of the Untere Lobau Biosphere Reserve, Austria established in 1977 [12]. From this stand points, monitoring biosphere reserves for their sustainability is necessary for mitigation and adaptation to climate change and other global environmental changes[9].
The commonly recognized carbon pools are AGC, BGC, dead wood carbon, litter carbon, and SOC [4]. AGC includes all living biomass above the soil including stem, stump, branches, bark, seeds, and foliage. BGC contains all living biomass of live roots of less than 2mm diameter are excluded because they cannot be distinguished empirically from soil organic matter or litter. Dead wood includes wood lying on the surface, dead roots, and stumps greater or equal to 10cm in diameter, whereas, litter is all non-living biomass with a diameter less than 10cm, lying dead or in various states of decomposition above organic soil. These carbon stocks have been found to be dependent on the stand structure, disturbance [13] and species diversity[14]. For instance, tree size, stand density, and species richness positively affected soil carbon in tropical forests[15].
The UNFCCC introduced mitigation instruments, including the clean development mechanism (CDM) and reducing emissions from deforestation and forest degradation and conservation and enhancement of forest carbon stock with sustainable management (REDD+) of tropical forests while conserving biodiversity [4,16]. However, there is insufficient data on carbon stock across zonation in local forests, hindering the effective implementation of REDD+[17].
The previous carbon stock assessments in the Yayu Coffee Forest Biosphere Reserve (YCFBR) and at other different moist Afromontane forests of Africa, including Ethiopia’s focused on disturbance and elevational variation. However, there is limited data for carbon stock assessments across zonation. Thus, monitoring forest ecosystem carbon stocks within biosphere reserves across zonation based become pressing matter in this study. Therefore, this study aims to assess carbon stock variation across different zones to give evidence-based policy decisions for conservation of ecological resources. Furthermore, research on carbon stock assessments in moist Afromontane forests like the YCFBR has not fully explored variations across different zonation levels. Although some studies have looked at carbon stock in various regions of Ethiopia[18], there is still a gap in understanding the specific potential within the core, buffer, and transitional zones. Therefore, this study aims to assess carbon stock potentials across the three zones of YCFBR, i.e., the core zone, buffer and transitional zones.
Methods and Materials
Sampling Design
The study was carried out at YCFBR in Southwest Ethiopia. Cluster sampling technique was employed for stratification of the biosphere reserve (BR) in to the core, buffer, and transitional zones to include samples from each zones (Figure 1). Different, but proportionally transects lines were systematically distributed in the core, buffer and transitional zones. Typical plot sizes used in forest inventory for both diversity and carbon stock assessment are 200 m2, 400 m2, and 500 m2 , but any size can possibly be used [4]. Using this standard range, a plot size of 400 m2 was designed to collect vegetation data from the core and buffer zones, while a 900 m2 plot size was designed for the transitional zone. For both core and buffer a nested plot design of 400m2 with 25m2 and 1m2 size was used to collect vegetation data for trees, shrubs, litters and soil, respectively and the same sub-plots was established within the main plot size of transitional zone. A total of 90 plots were distributed for the core (40 plots), buffer (25 plots), & transitional zones (25 plots).
Vegetation Data Collection and Environmental Factors
Vegetation data for trees and shrubs were collected for diameter at breast height (DBH) and height (H) of all woody species for > 5cm DBH[4,19]. Therefore, DBH (cm) and H (m) of individuals of the species were measured using a diameter tape, caliper, and hypsometer, respectively. The disturbance intensity levels were derived from the relative measurement of major disturbance indicators for each plot and then categorized into four disturbance intensity levels [20,21].
Taxonomic Diversity and Tree Stand Structure
Three taxonomic diversity indices, species richness (S) and Shannon-Wiener index (H`), were calculated as follows (Pielou, 1975).
where Pi is the proportion of individual species (Pi = ni/N), ‘ni’ is the number of individuals of the ith species and N is a total number of species recorded for the study forest.
Estimation of Above-Ground Carbon
For diverse and mixed types of tropical rainforest species, the generic Allometric equation developed by [17] was used for this study, since the general criteria described by the author are similar to this study area. Also, the carbon stocks of the forest was calculated using the DBH, H and wood density (ρ), since this model is more accurate to quantify the carbon stocks for the tropical forests. For the Diospyros abyssinica tree species, the species-specific Allometric equation developed by [24] for the YCFBR was used for AGB estimation. The AGC was then determined by calculating the AGB for each individual tree measured and by applying a carbon fraction of 47% of dry total biomass [16]. AGB for coffee plants was calculated by using Allometric equation developed by [25]. Tree carbon data was then scaled up from tree to plot level and then extrapolated to Mg C ha-1.
Estimation of Below-Ground Carbon
Using AGC, the BGC was estimated at 27% of AGC [16].
Estimation of Litter Carbon
Litter samples were collected, and transported to Wondo Genet College of Forestry and Natural Resources (WGCFNRs) Soil laboratory. For this, litter samples were collected from the four replicates of 1m x 1m within the main plot[26]. Then sub-samples (100g) were taken and oven-dried at 70 °C for 48 hours for dry weight determination (Table 2). The oven dried samples were grinded and analyzed using dry ashing methods burning the samples for organic carbon content determination in the muffle furnace at 500 0C for organic carbon concentration at WGCFNRs Soil Laboratory. Carbon concentration in the litter was estimated by multiplying litter organic matter by 37 % per plot and expressed in MgCha-1 [16].
Estimation of Soil Organic Carbon
Soil organic carbon was estimated by collecting two sets of samples for soil organic carbon concentration (%OC) and soil bulk density determination. Undisturbed soil samples were collected for bulk density determination, then packed, labeled, and transported to the soil laboratory[27]. Soil samples for bulk density were oven-dried at 105 °C for 48 hours and estimated using the core method [28,29]. Stones or woods in the soil (> 2mm) were removed by washing through a 2mm sieve and collecting the materials. The bulk density of the mineral soil core was calculated from the core volume, dry soil mass, and a correction factor for stones[19].
where: The bulk density is for the < 2mm fraction, coarse fragments are > 2mm. The density of rock fragments is often given as 2.65 g/cm3.
A depth of 0-60cm soil samples with two depth intervals (0-30cm and 30.1-60cm) were collected using a soil auger from 1m x 1m sub-plots for %OC analysis. Samples were taken diagonally two from the corner and one from the center[26]. Then, composite samples of about 700g were taken to the lab for analysis. Soils were sieved, air dried, and analyzed for carbon content using the Walkley-Black method[30]. Carbon stocks in the mineral soil were calculated using bulk density (BD) and expressed in Mg C ha-1 for each zone.
where, SOC = soil organic carbon, % OC= % Carbon in soil determined in laboratory.
Statistical Analysis
ANOVA was used to compare carbon stocks among zones and depths and Tukey’s HSD test was used to separate the means. A regression model was used to determine the influence of the H, DBH, species richness, and Shannon-Wiener diversity index on the carbon stocks. R software was used for statistical analysis.
Results and Discussions
Carbon Pools for the Above- and Below-Ground Carbon Stock Across YCFBR Zonation
Results for AGC varied significantly among the three zones (Table 1). The BGC showed a significant difference between the core and transition zones, and between the buffer and transitional zones, but not between the core and buffer zones (Table 1). This could be due to soil characteristics influencing below-ground biomass development. Concern to transitional zone, transition zones might have younger forests or degraded lands where root biomass is less developed, which is in agreement with[31]. The total biomass carbon stock (AGC + BGC) also differed significantly between the core and transitional zones, and between the buffer and transitional zones (Table 1), emphasizing the importance of conserving core and buffer zones to ensure carbon storage for climate change mitigation.
The mean AGC from these finding is higher than the mean from different Afromontane forests of Ethiopia[32]. We found that this moist Afromontane forest of YCFBR have a mean AGC stock of 368.06 Mg C ha-1, which is higher than findings of [33] who found that 149.3 Mg C ha-1 for montane African forests. Also, our results in the YCFBR for AGC is substantially higher than the IPCC default values for montane forests in Africa (89.3 Mg C ha-1)[34]. Biomass carbon stocks are highest in the core zone due to low anthropogenic disturbance, with high tree species richness and stand density leading to increased carbon storage. Enhancing species diversity can help increase forest carbon storages. Because, biomass carbon stock was calculated using species diversity and in the subsequent BGC depends on the AGC. Similar studies have found that core forest areas have higher carbon stocks compared to buffer and transitional zones[31], emphasizing the need for prioritizing conservation efforts in the core zone of YCFBR. The core zone forests play a crucial role in carbon sequestration and should be prioritized for conservation efforts, while reforestation of the transitional zone is needed for effective carbon management in the YCFBR.
Litter Carbon, Soil and Total Carbon Stock Across YCFBR Zonation
The study found significant differences in soil organic carbon (SOC) levels between topsoil (0-30cm) and subsoil (30-60cm), as well as across different forest zones (Table 1). SOC levels were highest in the core zone forests, followed by the buffer zone and the transitional zone. SOC decreased with increasing soil depth. These emphasize that the significance of protecting the core zone for carbon sequestration. There was no significant difference in subsoil SOC between depths across zonation. However, there was significant differences in total depth (0-60cm) for SOC levels found between the core and transitional zones and between the core and buffer zones, but not between the buffer and transitional zones (Table 1). This inverse relationship between SOC and soil depth may be due to excessive accumulation of litter on the ground, which improves topsoil fertility. Also, the grand mean for the 0-60 cm depth of SOC value of this study was obtained as 187.4 Mg C ha-1 which is greater than moist Afromontane forest of the study report with 128 Mg C ha-1[35]. Overall, higher SOC levels were recorded in the topsoil compared to the subsoil. This higher carbon stocks was obtained due to different conservation interventions implemented in the YCFBR following the establishment of biosphere reserve in 2010.
The buffer zone had the highest carbon stocks for litter due to the presence of coffee plantations and shade trees allowed for farmers, which led to an accumulation of organic material on the surface. This, in turn, contributed to higher LC levels and increased SOC content. The estimated carbon stock for litter was 0.88 Mg C ha-1, exceeding previous reports [26]. This unexpected highest LC finding for the buffer zone indicates unexpected unique ecological responses to disturbances, which is consistent with previous finding[36]. The high LC levels in the buffer zone demonstrate the carbon storage dynamics within biosphere reserves resulting from conservation interventions efforts implemented following YCFBR designated in the site in 2010. Because, the relationship between SOC stocks and LC stocks in forests is complex and dynamic, influenced by various factors such as climate, functional traits, vegetation type, soil type, disturbance history, and management practices. However, there are some general trends, which shows litter is used as input of organic matter and LC represent the above-ground biomass that falls onto the forest floor and begins to decompose [37]. This litter provides a significant source of organic matter to the soil, and ultimately gives higher SOC in the buffer zones for the topsoil. Similarly, the previous finding revealed, there are certain species in buffer zones, which exhibit specific traits favoring rapid litter decomposition and enhancing SOC, ultimately higher LC and topsoil SOC found for the buffer zone[38]. Another reason was, the buffer zone have experienced disturbances in the past and the site was exposed to logging before the forest was designated as biosphere reserve. Ultimately, the felled down logs and stumps resulted higher carbon storage for litter and SOC for the buffer zones. In sum, these findings provide insights into the distribution and dynamics of carbon pools and storage in different zones of the YCFBR.
Relationships of Above-Ground Carbon with Species Diversity and Structural Attributes
The study found that forest AGC is positively correlated with species diversity and stand structure (Figure 2 a, & b). Increases in tree species richness, the Shannon Weiner diversity index, tree height, and DBH were found to significantly increase AGC storage. For example, an increase in tree DBH, species richness, Shannon Weiner diversity index, and tree height by one unit was found to increase the tree AGC by 48%, 38%, 33%, and 33%, respectively (Figure 2 a - d). Therefore, forest management practices that promote taller and larger trees, species richness, and structural complexity can enhance carbon capture and storage, leading to more effective climate change mitigation actions. It is important to consider these factors when assessing forest biomass carbon and implementing strategies to reduce greenhouse gas emissions.
In addition, results revealed that, among tree species diversity indices considered; species richness, and Shannon Weiner diversity index, tree height (m), have positive influence on the estimated AGC, which is in agreement with [38,39]. Similarly, tree stand structural attributes for the DBH and H were regressed over biomass carbon and found to explain variability of the estimated biomass carbon stocks, which is in agreement with the previous study[40]. The relationships between both the stand structure and tree species diversity with the total carbon stock have important implications for emission reduction [4,16]. This highlights the importance of promoting species diversity in forest management practices to enhance carbon sequestration potential.
Patterns of Biomass Carbon Pools and SOC Along Disturbance Gradient
Results for the relationships between AGC and anthropogenic disturbances shows that, anthropogenic disturbance was influencing negatively AGC, with 25% variation explained (R2 = -0.25, p < 0.001) (Figure 3 a-c). According to the findings, the greater the disturbance intensity was, the less AGC obtained. This was because anthropogenic disturbance had a negative relationship with AGC, i.e., AGC showed decreased pattern with disturbance intensity increase. Therefore, forest management plans should aim to minimize disturbance intensity, as higher disturbance levels lead to reduced AGC. Thus, the need for policies that support the conservation of undisturbed forest areas, as they typically have higher levels of AGC. Also, the results revealed that, there is a decreasing pattern of the SOC along a disturbance gradient in the YCFBR (Figure 3 b). The greater the disturbance intensity was, the less SOC was obtained. This indicates forest management practices that reduce disturbance intensity can help maintain higher levels of SOC in the YCFBR.
The total ecosystem carbon stock also shows decreasing pattern, i.e., total carbon stock decreased significantly across zonation as it goes from the core zone to the buffer zone, buffer zone to transitional zone and from the core zone to transitional zone (Table 3; Figure 3d). According to these findings maximum of total ecosystem carbon stock of the YCFBR was obtained for the core zone and the minimum was estimated for the transitional zone forests. This findings is in agreement with[41] who found that anthropogenic disturbances are the main factors causing the reduced diversity of tree species simultaneously compromised the forest's ability to store carbon. Generally, forest zonation and anthropogenic disturbance have negative effects on carbon stock. Therefore, it is crucial for forest managers and policy makers to prioritize practices that minimize anthropogenic disturbances and promote sustainable forest management. By doing so, they can help preserve and enhance soil organic carbon stocks, which are essential for mitigating climate change impacts.
Conclusions and Recommendation
The findings of this study demonstrate the importance of biosphere reserve conservation for carbon storage for climate mitigation. Specifically, the core zones of these reserves are highly effective at sequestering and storing carbon, making them crucial to combat climate change. Comparison of different zonation systems for the carbon stock revealed the superiority of the core zone followed by buffer and transitional zones. This can be achieved through measures such as limiting deforestation, implementing sustainable land management practices, and promoting reforestation in degraded areas of buffer and transitional zones. Additionally, the interaction between zonation and soil depth highlights the importance of considering soil characteristics and depths when designing climate policies and mitigation strategies. This can provide firsthand knowledge for understanding the relationship between zonation, soil depth, and carbon stocks in order to maximize carbon sequestration potential in the study area and other similar ecological types. The study also verify the role of species diversity and forest structural attributes in promoting carbon storage.
These findings have two major implications for policymakers and climate scientists in terms of understanding the role of forests in climate mitigation and informing forest management practices. Firstly, conservation efforts should prioritize the protection and restoration of diverse forest ecosystems, as they have the potential to store more carbon. Secondly, the inverse and negative relationships between carbon stocks, anthropogenic disturbance gradients and forest zonation indicate that human activities and changes in zoning can have detrimental effects on carbon storage in forests. Overall, policymakers, climate scientists, and forest managers should collaborate to integrate these findings into decision-making processes and create effective strategies for climate change mitigation. Further investigation into litter decomposition rates across zones is crucial for understanding the relationship between litter carbon stocks and SOC contributions.
Funding Statement
No funding was received for this research.
Declaration of Generative Artificial intelligence (AI)
The authors declare that they have not used any type of generative artificial intelligence (AI) technologies such as Large Language Models (ChatGPT, COPILOT, etc.) for the writing of this manuscript, nor for the creation of images, graphics, tables, or their corresponding captions.
Author Contributions
Ferede Abuye Jeldu, Motuma Tolera, and Teshale Woldeamanuel conceived the presented idea and developed the theory and analytical methodologies. Ferede Abuye Jeldu also planned and carried out the data collection and analysis. All authors substantially contributed to a discussion of methodologies and results. Ferede Abuye Jeldu wrote the first draft and received substantial contributions from other authors. All authors read and approved the final manuscript.
Data availability statement
All Data are available within the article.
Acknowledgments
The authors gratefully acknowledge Yayu and Hurumu District administrations for their assistance during field data collection for this research.
Conflicts of interest
The authors declare no conflict of interest.
References
- A: (Intergovernmental Panel on Climate Change) Guidelines for National Greenhouse Gas Inventories, 2006.
- IPCC Climate Change 2023: Synthesis Report. Contribution of Working Groups I, II and III to the Sixth Assessment Report of the Intergovernmental Panel on Climate Change [Core Writing Team, H. Lee and J. Romero (Eds.)]. 2023.
- IPCC IPCC Fifth Assessment Synthesis Report-Climate Change 2014 Synthesis Report. IPCC 2014.
- UNFCCC Measurements for Estimation of Carbon Stocks in Afforestation and Reforestation Project Activities under the Clean Development Mechanism: A Field Manual. A field manual 2015, 1–72.
- Mitchard, E. The Tropical Forest Carbon Cycle and Climate Change. Nature 2018, 559, 527–34. [Google Scholar] [CrossRef]
- Wilson EO, Peter FM, R.P. Our Diminishing Tropical Forests. In:Wilson EO, Peter FM, Editors. Biodiversity. Washington, DC: National academic press 1988, Biodiversity. Washington, DC: National Academy Pre.
- Kothandaraman Subashree, Javid Ahmad Dar, S. S.; Khan, S.D.& M.L. Ecosystem-level Carbon Storage and Its Links to Diversity, Structural and Environmental Drivers in Tropical Forests of Western Ghats, India. Scientific Reports 2020, 10, 1–15. [Google Scholar] [CrossRef]
- Poorter, L. M. T. van der Sande, J. Thompson, E.J.M.M.A.; Alarcón, A.; Álvarez-Sánchez, J.; Ascarrunz, N.; Balvanera, et al. Diversity Enhances Carbon Storage in Tropical Forests. Global Ecology and Biogeography, 15. [CrossRef]
- Devries, B.; Pratihast, A.K.; Verbesselt, J.; Kooistra, L.; Herold, M. Characterizing Forest Change Using Community-Based Monitoring Data and Landsat Time Series. PLoS ONE 2016. [Google Scholar] [CrossRef]
- Semegnew Tadese, Teshome Soromessa, Tesefaye Bekele, and G.G. Biosphere Reserves in the Southwest of Ethiopia: Review Article. Hindawi: Advances in Agriculture. [CrossRef]
- Špulerová, J.; Piscová, V. .; Matušicová, N. The Contribution of Scientists to the Research in Biosphere Reserves in Slovakia. Land 2023, 12, 1–19. [Google Scholar] [CrossRef]
- UNESCO In Depth: UNESCO World Heritage Sites: Key to Biodiversity Conservation. The UNESCO Courier 2023, 3, 54–57. [CrossRef]
- Khan MNI, Islam MR, Rahman A, Azad MS, Mollick AS, K. M.; Al, E. Allometric Relationships of Stand Level Carbon Stocks to Basal Area, Tree Height and Wood Density of Nine Tree Species in Bangladesh. Global Ecology and Conservation 2020, 22. [Google Scholar]
- Mandal RA, Jha PK, Dutta IC, Thapa U, K. S. Carbon Sequestration in Tropical and Subtropical Plant Species in Collaborative and Community Forests of Nepal. Advanced ecology 2016. [Google Scholar] [CrossRef]
- Islam M, Dey A, R. M. Effect of Tree Diversity on Soil Organic Carbon Content in the Homegarden Agroforestry System of North-Eastern Bangladesh. Small-Scale For. 2015, 14, 91–101.
- IPCC GENERIC METHODOLOGIES APPLICABLE TO MULTIPLE LANDUSE:Volume 4: Agriculture, Forestry and Other Land Use CATEGORIES. 2006, 4. 4.
- Chave, J. , Réjou-Méchain, M., Búrquez, A., Chidumayo, E., Colgan, M.S., Delitti, W.B., Duque, A., Eid, T., Fearnside, P.M., Goodman, R.C. and Henry, M. Improved Allometric Models to Estimate the Aboveground Biomass of Tropical Trees. Global change biology 2014, 20, 3177–3190. [Google Scholar] [CrossRef]
- Admassu Addi, Sebesebe Demissew, T. S. and Z.A. Carbon Stock of the Moist Afromontane Forest in Gesha and Sayilem Districts in Kaffa Zone: An Implication for Climate Change Mitigation. Journal of Ecosystem & Ecography 2019, 9, 1–8. [Google Scholar] [CrossRef]
- Pearson TRH, Brown SL, B.R. Measurement Guidelines for the Sequestration of Forest Carbon. General Technical Report NRS-18. USDA FOREST SERVICE, United States Department of Agriculture. General Technical Report NRS-18.
- Yuan, Z. , Wang, S., Ali, A. et al Aboveground Carbon Storage Is Driven by Functional Trait Composition and Stand Structural Attributes Rather than Biodiversity in Temperate Mixed Forests Recovering from Disturbances. Annals of Forest Science 2018, 75. [Google Scholar] [CrossRef]
- Beyene, A.D.; Mekonnen, A.; Hirons, M.; Robinson, E.J.Z.; Gonfa, T.; Gole, T.W.; Demissie, S. Contribution of Non-Timber Forest Products to the Livelihood of Farmers in Coffee Growing Areas: Evidence from Yayu Coffee Forest Biosphere Reserve. Journal of Environmental Planning and Management 2020, 63, 1633–1654. [Google Scholar] [CrossRef]
- Pielou, E.C. Ecological Diversity, London: Wiley. 1975.
- Zhang, J.T. Quantitative Eecology, 2nd Ed., Beijing: China. science press.
- Daba, D.E.; Soromessa, T. The Accuracy of Species-Specific Allometric Equations for Estimating Aboveground Biomass in Tropical Moist Montane Forests: Case Study of Albizia Grandibracteata and Trichilia Dregeana. Carbon Balance and Management 2019. [Google Scholar] [CrossRef]
- Mesele, N. , Mike Starr, M.K.& L.B. Erratum to: Allometric Equations for Estimating Aboveground Biomass of Coffea Arabica L. Grown in the Rift Valley Escarpment of Ethiopia. Agroforestry Systems 2013, 87, 953–966. [Google Scholar] [CrossRef]
- Baul Kumar Tarit, Avinanda Chakraborty, Rajasree Nandi, Mohammed Mohiuddin, A. K. and; Sultana, T. Effects of Tree Species Diversity and Stand Structure on Carbon Stocks of Homestead Forests in Maheshkhali Island, Southern Bangladesh. Carbon balance and management 2021, 16, 1–15. [Google Scholar] [CrossRef]
- Black CA, Evans DD, White JL, E.; IE, C.F. Bulk Density in Black Methods of Soil Analysis. Part 1. American Society of Agronomy.
- Blake, GR and Hartge, K. Particle Density. In Methods of Soil Analysis: Part 1-Physical and Mineralogical Methods. Soil Science Society of America, American Society of Agronomy.
- Davidson, D. Soil Physical Measurement and Interpretation for Land Evaluation. Aclep, Land Evaluation Program 2020, 2, 1–16. [Google Scholar] [CrossRef]
- Walkley, A. & Black, I.A. An Examination of the Degtjareff Method for Determining Soil Organic Matter, and a Proposed Modification of the Chromic Acid Titration Methods. soil science 1934, 37, 29–38. [Google Scholar]
- Jusys, T. Quantifying Avoided Deforestation in Pará: Protected Areas, Buffer Zones and Edge Effects. Journal for Nature Conservation 2016, 33, 10–17. [Google Scholar] [CrossRef]
- Damena Edae Daba, B.W.D. and T.S. Effect of Forest Management on Carbon Stock of Tropical Moist Afromontane Forest. International Journal of Forestry Research 2022, 1–14. [Google Scholar] [CrossRef]
- Cuni-Sanchez, A, Sullivan, M, et al. High Aboveground Carbon Stock of African Tropical Montane Forests. 2021.
- Domke, G. , et al.Aida Cuni-Sanchez, Martin J. P. Sullivan, Philip J. Platts, S.L.L.; Rob Marchant, Gérard Imani, Wannes Hubau, Iveren Abiem, H.A.; Tomas Albrecht, J.A. Refinement to the 2006 IPCC Guidelines for National Greenhouse Gas Inventories Vol. 4.
- Rahman MM, Kabir ME, JahirUddinAkon ASM, A. K. High Carbon Stocks in Roadside Plantations under Participatory Management in Bangladesh. Global Ecology and Conservation(elsevier) 2015, 3, 412–23. [Google Scholar] [CrossRef]
- Dada, A. D. , Matthew, O. J., & Odiwe, A.I. Nexus between Carbon Stock, Biomass, and CO2 Emission of Woody Species Composition: Evidence from Ise-Ekiti Forest Reserve, Southwestern Nigeria. Carbon Research 2024, 3, 1–16. [Google Scholar] [CrossRef]
- Li, Y. , Liu, X., Xu, W., Bongers, F. J., Bao, W., Chen, B., Chen, G., Guo, K., Lai, J., Lin, D., Mi, X., Tian, X., Wang, X., Yan, J., Yang, B., Zheng, Y., & Ma, K. Effects of Diversity, Climate and Litter on Soil Organic Carbon Storage in Subtropical Forests. Forest Ecology and Management 2020, 476. [Google Scholar] [CrossRef]
- Ferede Abuye Jeldu, Motuma Tolera, T. W. Predictive Role of Species Diversity on Aboveground Carbon via Functional Diversity and Dominance in the Moist Afromontane Forest: Implications for Conservation Policies. Internal journal of forestry reserach 2024, 2024, 1–14. [Google Scholar] [CrossRef]
- Chai, S.L. , Huang, C.L., Tan, A.K.J. et al. Influence of Tree Diameter, Species Richness, and Diversity Indices on Aboveground Carbon Stock in a Tropical Rainforest in Malaysia. Forests, Trees and Livelihoods 2017, 26, 86–97. [Google Scholar]
- Zhang, X. , Li, B., Peñuelas, J., Sardans, J., Cheng, D., Yu, H., & Zhong, Q. Resource-Acquisitive Species Have Greater Plasticity in Leaf Functional Traits than Resource-Conservative Species in Response to Nitrogen Addition in Subtropical China. Science of the Total Environment 2023, 903, 166177. [Google Scholar] [CrossRef]
- Akotoye, Komla, F. -E.G.N.M. Impact of Anthropogenic Disturbance on Tree Species Diversity, Vegetation Structure and Carbon Storage Potential in an Upland Evergreen Forest of Ghana, West Africa. Trees, Forests and People 2022, 8. [Google Scholar]
Figure 1.
Map of the study area (Yayu Coffee Forest Biosphere Reserve), sample design and plot distributions within the zones and transect line.
Figure 1.
Map of the study area (Yayu Coffee Forest Biosphere Reserve), sample design and plot distributions within the zones and transect line.
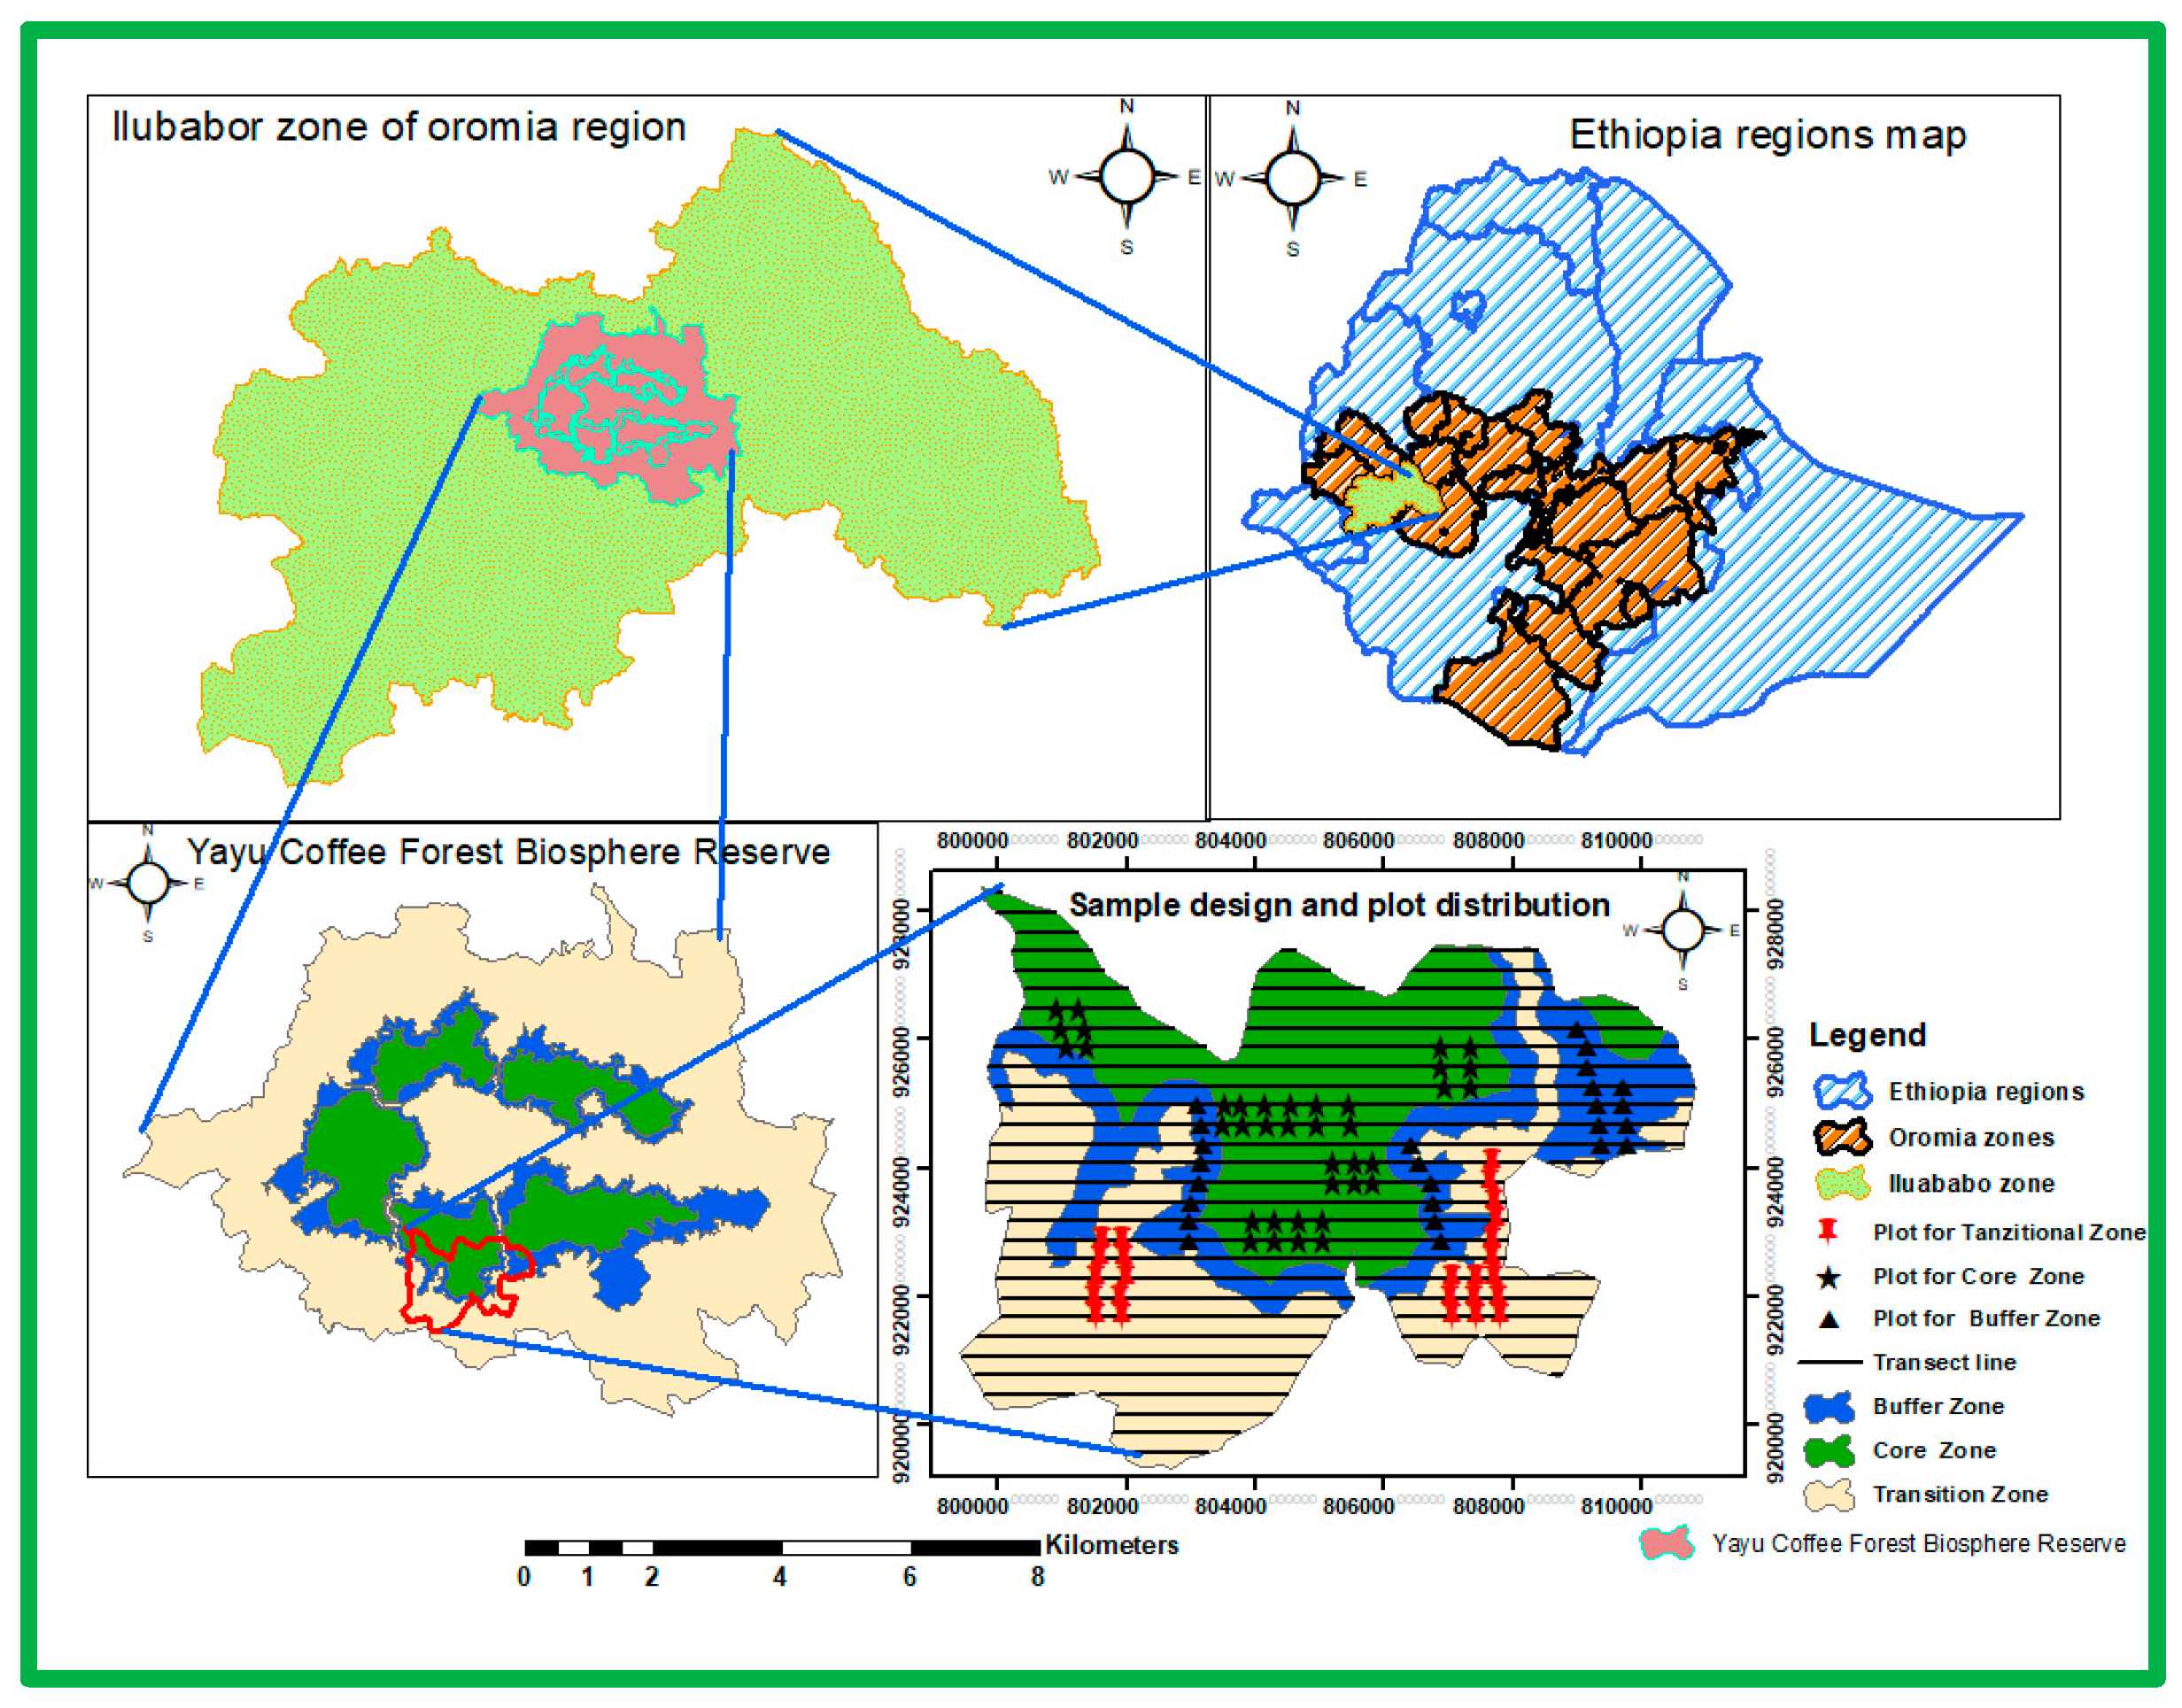
Figure 2.
Bivariate relationships between above-ground carbon and tree stand structural attributes. Note: Mg C/ha -megagrams of carbon per hectare.
Figure 2.
Bivariate relationships between above-ground carbon and tree stand structural attributes. Note: Mg C/ha -megagrams of carbon per hectare.
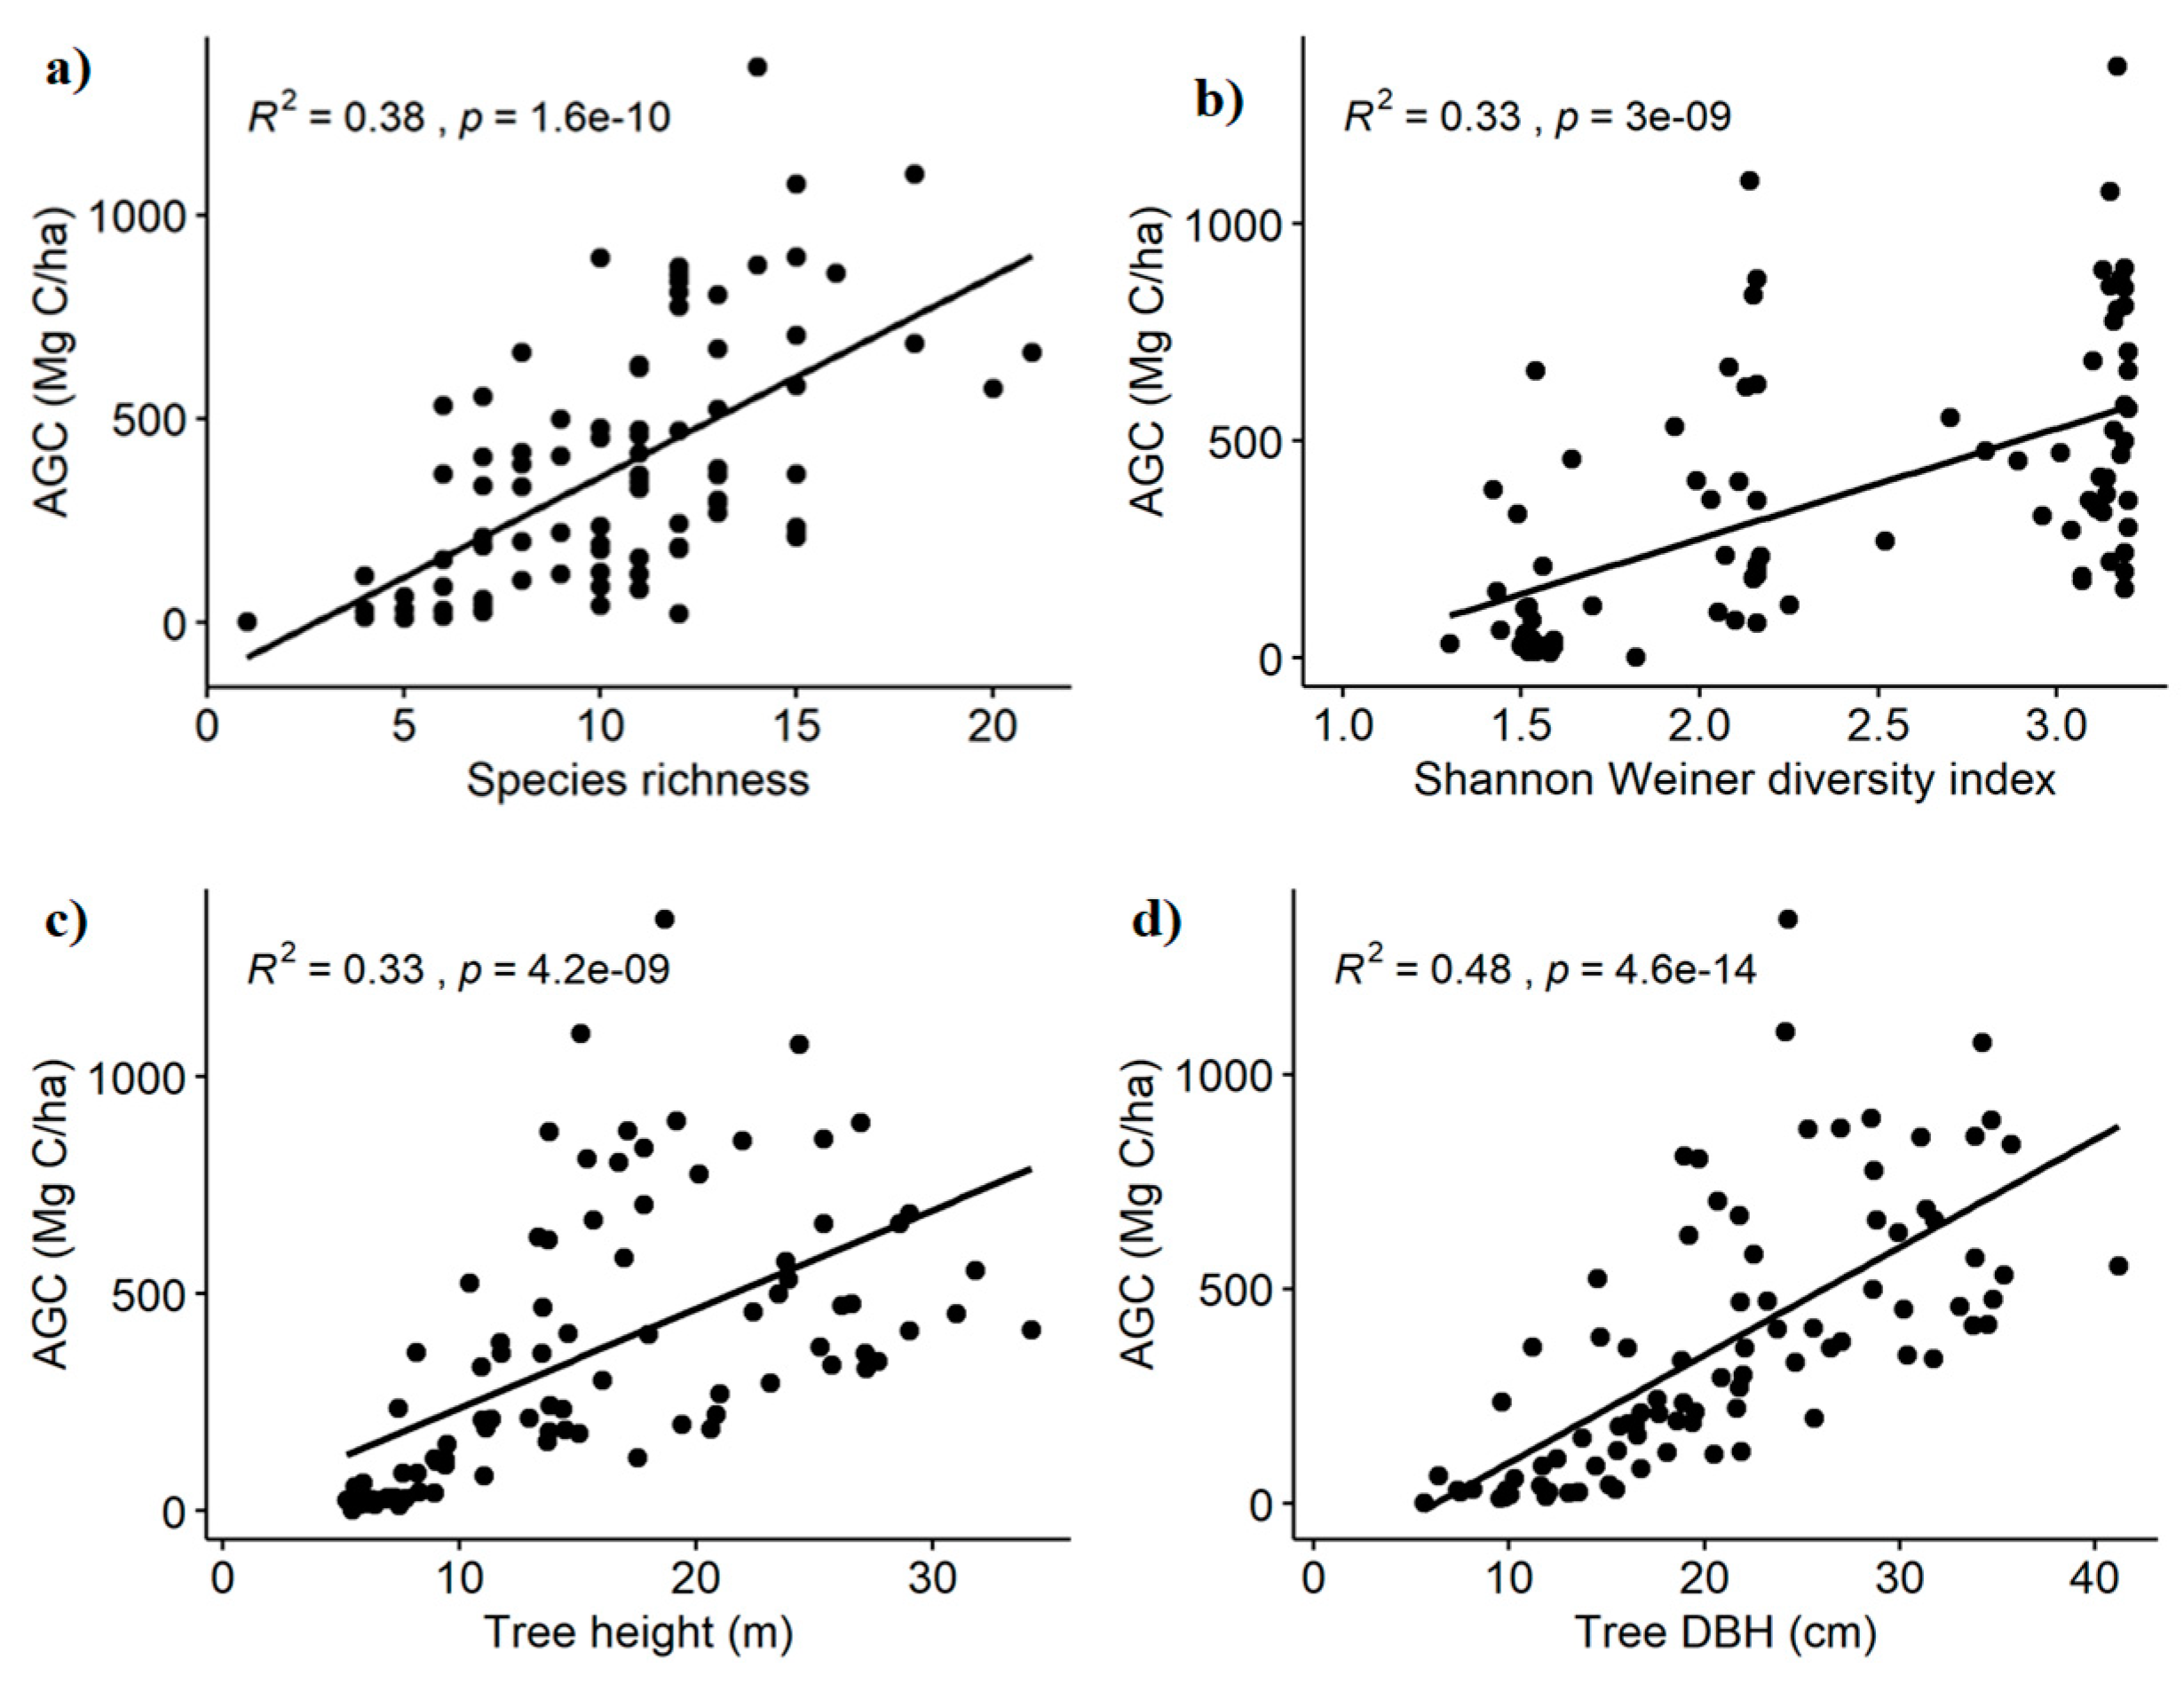
Figure 3.
Bivariate relationships between soil organic carbon stocks (0-60cm), above-ground carbon and total carbon stock with the forest zonation and disturbance levels in the case of Yayu Coffee Forest Biosphere Reserve, Southwest Ethiopia. Note: Mg C/ha -megagrams of carbon per hectare, for figure 3 d; 1, 2 and 3 represents core zone, buffer and transitional zone, respectively, whereas on figure3 a-c; 1, 2, 3 and 4 represents undisturbed, slightly disturbed, moderately disturbed and disturbed sites, respectively. .
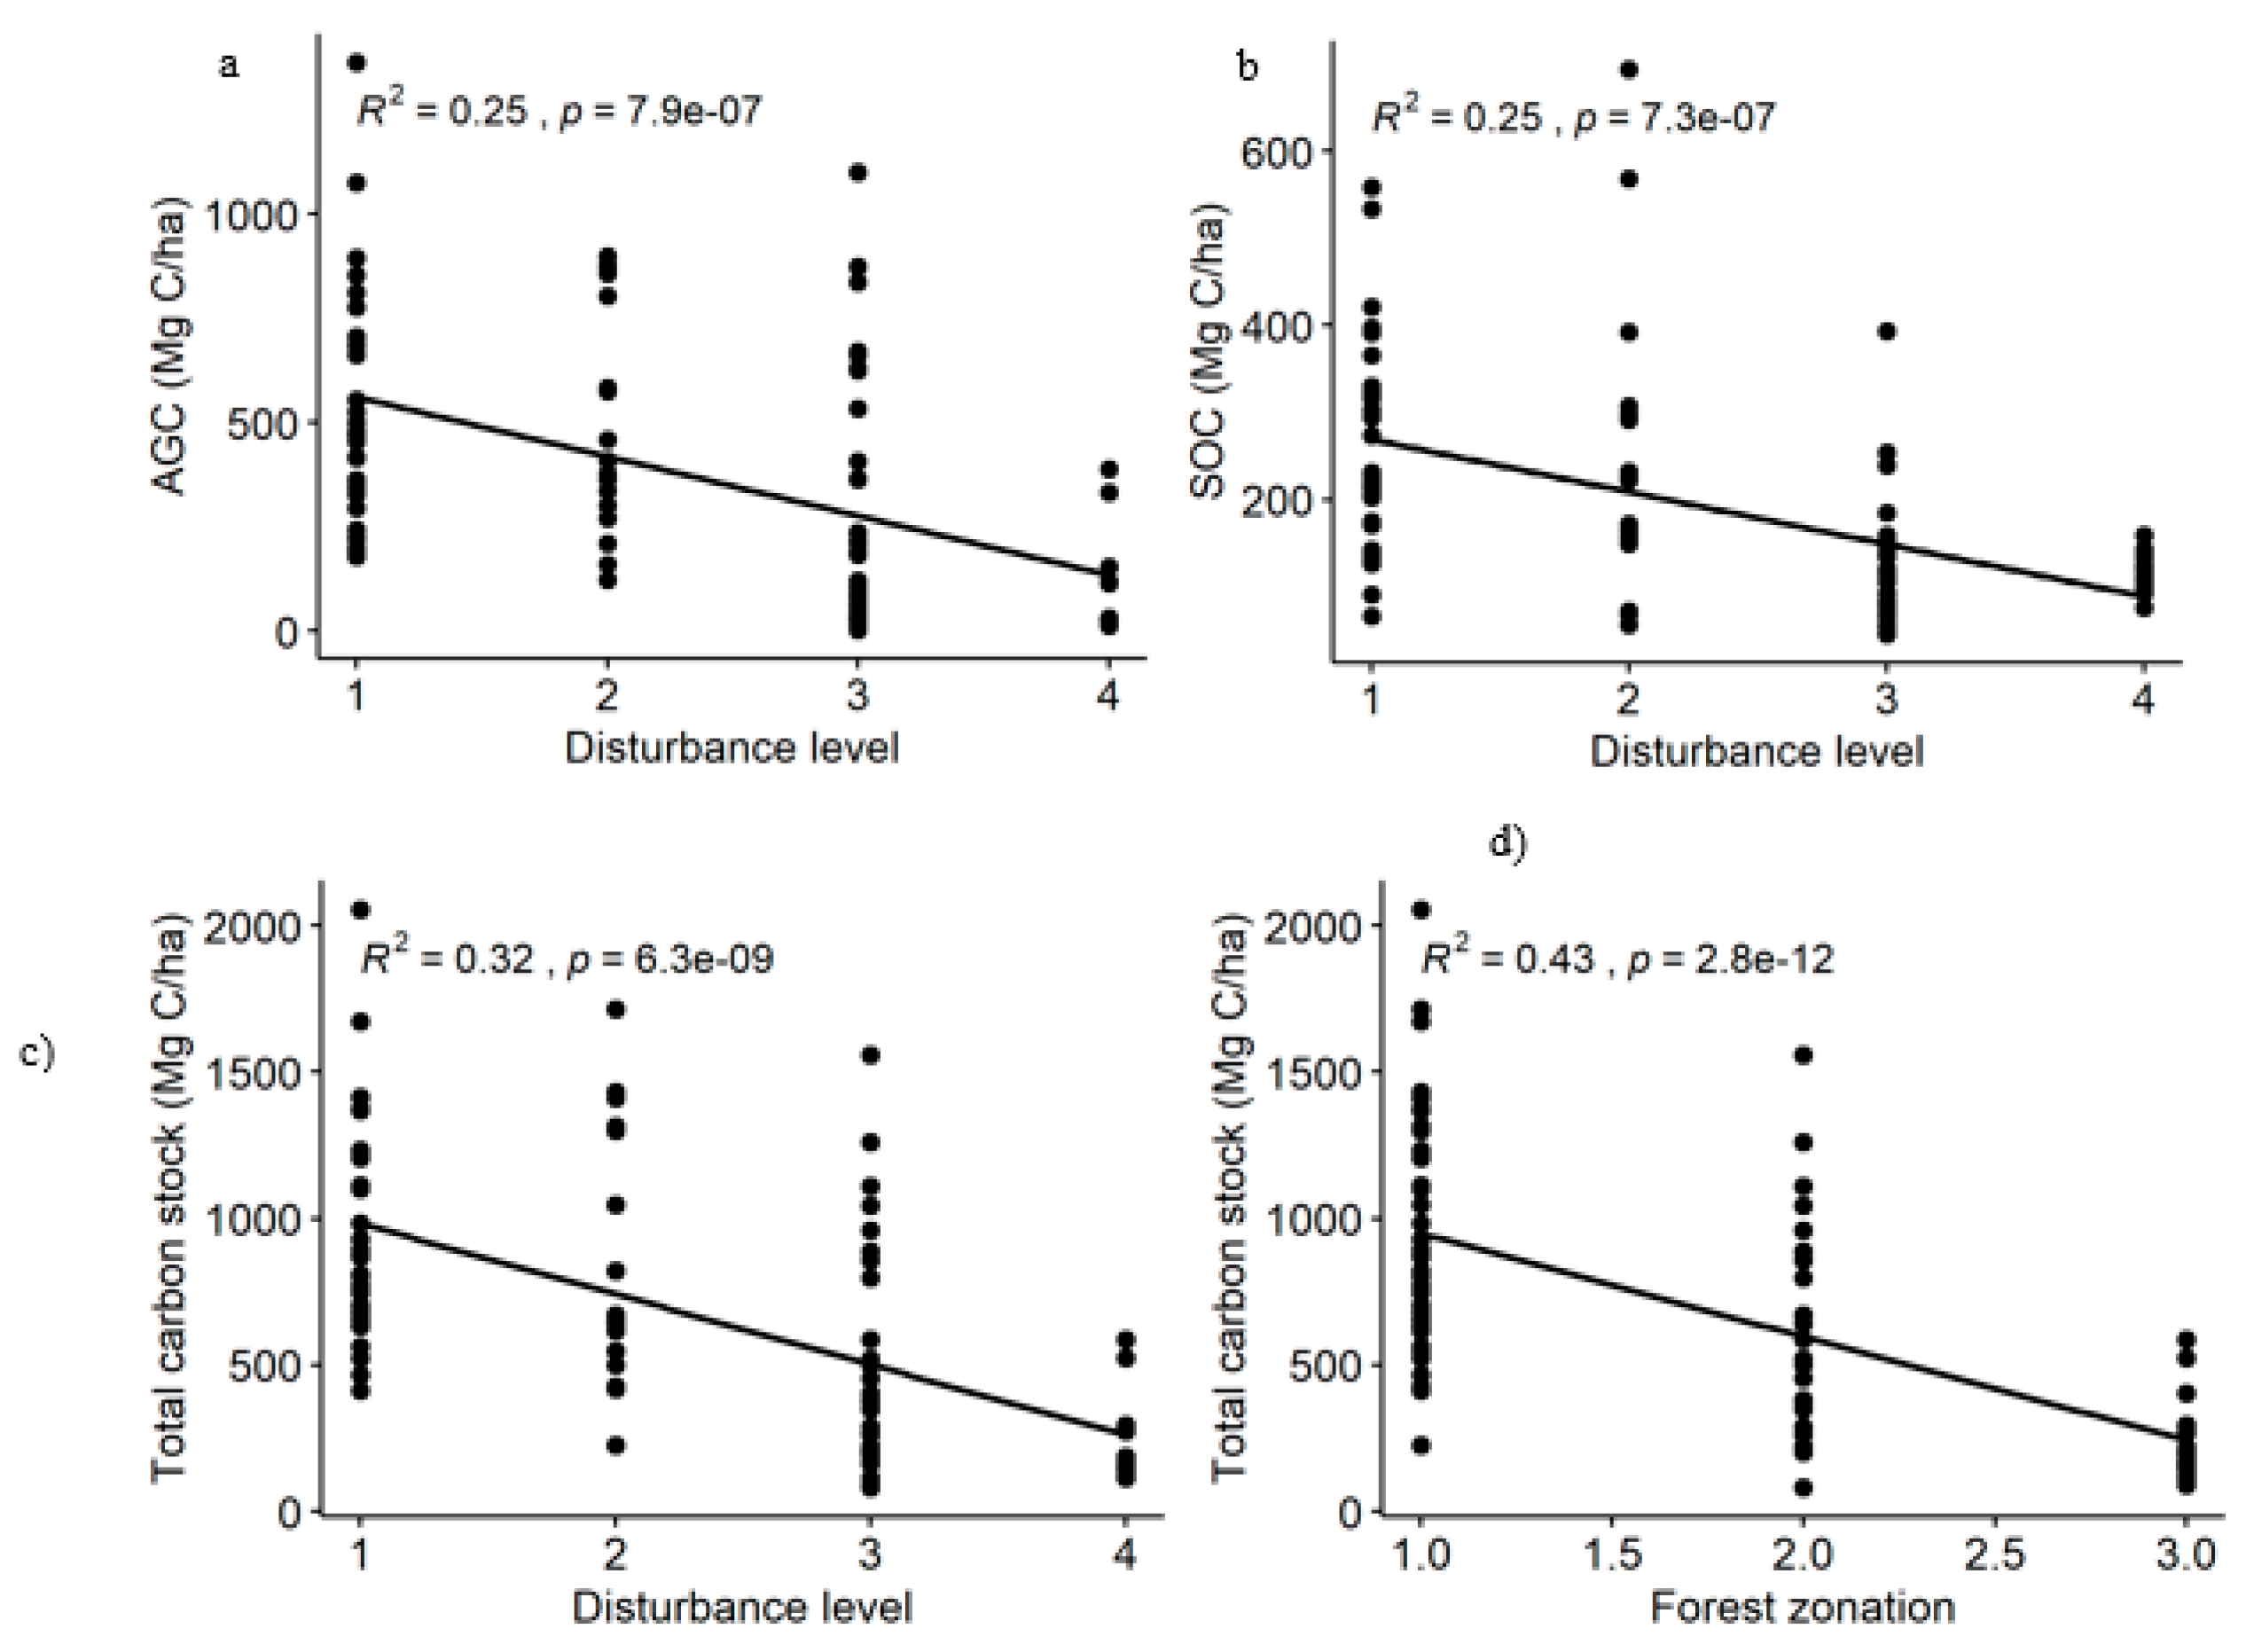

Table 1.
Carbon pools and total carbon stocks across the Yayu Coffee Forest Biosphere Reserve.
| Carbon pools (MgCha-1) | Forest zonation | Grand mean | ||
|---|---|---|---|---|
| Buffer | Core | Transition | ||
| AGC | 403.21±285.8a | 525.42±28.7b | 82.56±98c | 368.06 |
| BGC | 108.87±77.2a | 141.86±76.3a | 22.29±26.5b | 99.38 |
| AGC+BGC | 512.1±362.8a | 667.28±358.9a | 104.85±124.5b | 467.44 |
| LC | 0.97±0.5a | 0.89±0.4a | 0.75±0.3a | 0.88 |
| SOC (0-30 cm) | 191.02±91.6a | 96.96±76.6b | 76.73±25.8bc | 133.6 |
| SOC (30-60 cm) | 39.19±19.02c | 76.48±74.7bc | 31.41±18.8c | 53.85 |
| SOC (0-60 cm) | 128.38±82.9a | 267.50±144.8b | 115.92±32.5a | 187.4 |
| Total carbon stock | 641.42±370.8a | 935.68±413.4b | 221.52±122.9c | 655.72 |
Note: Mg C/ha-1 megagrams of carbon per hectare, AGC-above-ground carbon, BGC-below-ground carbon, AGC+BGC-biomass carbon, LC-litter carbon, SOC-soil organic carbon, values with similar letters are not significant, values with different letters are significant.
Disclaimer/Publisher’s Note: The statements, opinions and data contained in all publications are solely those of the individual author(s) and contributor(s) and not of MDPI and/or the editor(s). MDPI and/or the editor(s) disclaim responsibility for any injury to people or property resulting from any ideas, methods, instructions or products referred to in the content. |
© 2025 by the authors. Licensee MDPI, Basel, Switzerland. This article is an open access article distributed under the terms and conditions of the Creative Commons Attribution (CC BY) license (http://creativecommons.org/licenses/by/4.0/).
Copyright: This open access article is published under a Creative Commons CC BY 4.0 license, which permit the free download, distribution, and reuse, provided that the author and preprint are cited in any reuse.


