
Submitted:
28 March 2025
Posted:
31 March 2025
You are already at the latest version
Abstract
Boating tourism in coastal-maritime areas often overlaps spatially and temporally with other economic activities, such as fishing, leading to complex interactions. These interactions can create opportunities for positive cooperation or generate conflicts that pressure natural resources and stakeholders. This study focuses on the interplay between maritime-tourism activities and fishing in the south of Portugal, using a social network analysis (SNA) approach based on automatic identification system (AIS) data to evaluate spatial and temporal patterns. The findings reveal that tourism activities dominate zones closer to the coast, with intermediate areas serving as shared spaces where interactions are most likely to occur.
Keywords:
automatic identification system (AIS)
; common pool resources (CPRs)
; maritime tourism
; social network analysis (SNA)
1. Introduction
Marine and coastal tourism is one of the sectors with well-established activities in the blue economy scope. Furthermore, in recent decades there has been a growth in tourism in general, and maritime and coastal tourism activities have accompanied this development [1,2]. Fisheries is also one of the sectors with well-established activities in the blue economy [3].
On a local scale, these two sectors of the blue economy interact in a certain way [4,5]. On the one hand, marine and coastal tourism focuses on leisure activities and provides entertainment experiences to its clientele in essentially non-extractive activities, but some also extractive as e.g., angling [6,7]. On the other hand, professional fishing, focused on catching wild fish (extractive activity), supplies local or larger-scale markets, which in turn also sustain part of the tourist activity (i.e., in gastronomy and hospitality)
The interaction between economic activities that take advantage of the resources (i.e., goods and services) in coastal zones can be modelled and their relationships of involvement can be analysed through network approaches. Under this lens, some studies related to social network analysis can be found [8,9,10,11].
This study aims to contribute to the analysis of the complex network of interaction between maritime tourism and fishing activities through AIS data via a social network analysis. Additional tools such as the Sankey diagram and the dendrogram are also used to strengthen the SNA, and to facilitate the understanding of trends in the analysed data.
2. Literature Review
2.1. Common Pool Resources (CPRs)
Marine spaces provide us with diverse resources, and people benefit by consuming many of them without taking them away from the environment [12]. There are other resources that are subtracted, such as fishing resources [13].
Marine spaces, however, are used by several stakeholders, and they may eventually be conserved or over-exploited, which can generate some conflicts. This rationale leads us to the theory of common pool resources pioneered by Elinor Ostrom and continued by other authors [14,15]. This theory explores the governance systems, norms and rules that regulate the exploitation of resources and allows them to be managed in a sustainable way [16].
Sharing information about the abundance and availability of natural resources is, however, a tacit way of managing them in a more sustainable way [17]. The CPRs theory allows to frame the pressure exerted on the exploitation of resources, their overlap, and to engender management solutions through collective governance or management recommendations [18].
2.2. Automatic Identification System (AIS)
Vessel tracking done by AIS has several advantages [19,20]. AIS records contain spatial-temporal information on passenger boats (regardless of their size), fishing boats (e.g., in the EU if they are at least 15 meters long or 300 GT), and other types of boats [21]. These records are provided on a voluntary basis from a transponder, which is equipment mounted on the vessels themselves [22].
AIS pings are a way to collect a large volume of data in a trusted and non-intrusive way [23]. In addition, AIS records allow the visualization of the simultaneous occurrence of vessels in a given area, which in turn facilitates the recognition of the interactions that may exist between coastal area users [24].
The spatial and temporal interception of activities such as maritime tourism and fishing have aroused some research interest due to their relevance in the busiest coastal zones [25]. An analysis of AIS data allows to verify where there are the highest densities of spatial use by the stakeholders and where there are overlapping areas [26]. A proper understanding of these phenomena allows for improvement in management processes and can be effectively used for maritime spatial planning [27].
2.3. Social Network Analysis (SNA)
In the maritime-coastal space, understanding the interactions between groups of actors and exploited resources is important [28]. However, these interactions make the system complex, and there is no shared consensus for its approach [29]. Systems are complex because they usually include a large number of components that interact with other complementary forms [30]. To facilitate this understanding, the use of networks (e.g., SNA or social-ecological) are very useful tools to facilitate the visualization and analysis of complex systems [31,32].
The tourist destination is a key factor within tourism management research. Economic activities carried out in coastal areas aimed at exploiting existing resources, whether in a non-extractive or extractive way, are key to establishing contact and arousing the interest of customers [33,34,35]. Boat trips to observe the natural beauty of the coastal areas, as well as to enjoy marine resources through underwater or fishing/angling activities are important generators of economic benefits, where tourists are willing to pay for memorable moments of entertainment and leisure time [36].
The resources obtained by professional fishing are also generators of economic wealth by entering the food market – through intermediaries and distribution networks – which is consumed not only by locals, but also by visitors and tourists [37]. There is a more recent phenomenon that consists of the incorporation of fishing into tourism activities, where it sometimes becomes more profitable to take tourists fishing, than to practice fishing as the main economic activity [38]. This activity is called fishing-tourism and has been generalized by several countries [39,40,41,42,43].
3. Methodology
3.1. Research Question
In systems of exploitation of living resources where there are several groups of actors/stakeholders – in light of the CPRs theory –, it is of crucial importance to know how these resources are exploited by different groups, and what interaction exists between them [44]. Having this focus as a premise in the present study were used AIS pings as primary data and from these, a research question (RQ) was built:
RQ: What are the identifiable patterns of the tourism and fishing vessels that use the resources identified in the study area under analysis and their interaction?
3.2. Conceptual Approach
It is ascertained whether there is any type of communication or cooperation between the social entities (i.e., the different vessels and the firms that operate them), with regard to the sharing of common resources (Figure 1). To this end, the terrestrial and satellite AIS records of the different vessels operating in the area under analysis are used, in order to be able to categorize the type of vessels, according to the distance from the coast and the type of resources sought after.
Social network analysis (SNA) – From the categorization of these data, in order to better understand the complex interdependencies, a social network is built [45], where the social network is composed of the categories/types of vessels, i.e., recreational and fishing, and the different activities that can be related. Social interaction (between these vessels) will have to do with the total number of AIS records and the pattern of proximity of other vessels.
Sankey Diagram – To have another perspective of visualizing the analysed SNA data including the features, following the suggestions given by Chong et al. (2021) [46], a Sankey diagram is plotted. The Sankey diagram is constructed from the different proportions of the variables under analysis, i.e., anchoring port/marina, number of AIS pings relating to vessels according to their type (fishing or recreational) and the type of resource exploited. In this comparative analysis it is important to distinguish between the 3 months with a propensity for worse sea conditions and the other 3 months with more pleasant sea conditions, so the Sankey diagram is divided into two parts (the coldest period defined here for simplicity as January to March, corresponding approximately to winter, and the warmest period from July to September, adjusting to summer).
Dendrogram – In addition to the above, in order to better understand the interaction of maritime vessel activities, a dendrogram – from the suggested approaches by Galili (2015) [47] – that uses a top-down hierarchical categorization that incorporates the characteristics of all the vessels involved and groups them by clusters is defined. The similarities between the different activities are analysed. This type of analysis also gives clues about cooperative aspects or friction between different activities.
The data to analyse should report a well-defined temporal scale and time for signal reception for AIS records (i.e., number of pings/time interval). The input for the construction of the networks should be aided by other methods of data collection, such as visits to marinas and fishing ports and cross-checking information with the European fleet register (https://webgate.ec.europa.eu/fleet-europa/ ). Table 1 shows the information required for data collection.
4. Findings
4.1. Study Area
The case study area chosen was the central area of the Algarve (Portugal) because it is a place where many interactions between maritime-coastal activities occur (Figure 2).
4.2. Data Analysis
The data under analysis reports the full years of 2022 and 2023 with AIS data collection on an hourly basis (Table 2). To show some interaction, it was defined – after empirical analysis – that the number of users (social nodes of the network) that demonstrated some regularity in the use of resources should be equal to or greater than 22 records/pings per boat and must have at least one vessel nearby (i.e., up to 1 nautical mile) in at least 5 of these records.
A total of 108 vessels were found. Of these, 65 were recreational (4,758 pings) and 43 were fishing (30,896 pings). Of the recreational boats, only 3 met the previous premises (all passenger boats), while of the fishing boats, only 1 was left out of the social network analysis due to not known interaction with other fishing/recreational activities (the longliner).
4.3. SNA Relationships with Vessels
From the data collected (Table 2), fishing vessels with high interaction, whether intra their typology or with other typology of vessels (inter), a SNA can be constructed to infer the interaction that occur between vessels and consequently between economic activities (i.e., fisheries and tourism/recreation).
Recreational nodes – From the data analysis, it can be seen that 3 passenger vessels are responsible for over 56% of the AIS pings related to recreational vessels. On average, it is also this typology of vessels that have overall the highest average number of pings per vessel (889 pings/vessel).
Fisheries nodes – About 87% of all set of AIS pings come from the fishing fleet. Within this fleet, seiners and trawlers are the ones with the most records. It is the seiners that have the highest average of the AIS pings, closely followed by trawlers (782 pings/vessel and 723 pings/vessel, respectively).
It is also the vessels (nodes) with the most pings that have the most edges. In fishing boats, the domain is divided between 3 types of boats, while in the recreational there is a clear dominance for passenger boats.
From (Figure 3) it can be seen that there are three distinct communities: 1st composed by 22 vessels in outer waters as recurrent trawlers (pinkish and bluish), 2nd has 16 seiners in (greenish) and 3 passenger boats (orangish) closer to the coast, and a 3rd composed by only 4 fishing vessels (multi-gear for multipurpose fisheries). Most of the interaction takes place with vessels of the same category, with sporadic cases of vessels of other categories occurring in nearby locations in the same time frame. Table 3 shows the main metrics calculated.
4.4. Sankey Diagram
The Sankey diagram shows that the importance of places is linked with the time of year (Figure 4). In winter it is the fishing ports that prevail in terms of contribution to maritime traffic, while in summer it is usually the marinas that generate the most pings. Although fishing boats are active all year round, they are usually subject to harsher weather conditions during the winter, and consequently sometimes there are days when fishing is not practiced.
In the summer there is a prevalence of places with recreational boats, where a large part of the activities is not resource extractive. In winter, ports with fishing vessels in more important locations have more activity than marinas. Non-extractive resources also have a decrease in demand in the low season. Generally speaking, the number of recreational boats decreases considerably in winter. Fishing vessels, while not decreasing, have limited activity to fewer days at sea.
4.5. Dendrogram
There is a clear distinction between recreational maritime activities and fisheries at the first level (Figure 5). In recreational boats, most of them have multiple functions, some of them with non-specific activities, and others with emphasis on biological or geological resources. The remaining vessels focused on biological resources, some have prevalence only by non-extractive activities such as observation (of the resources), and the rest with a focus on extracting activities (e.g., angling). In the professional fishing part, there is a clear distinction between passive gear vessels in relation to active gear vessels.
5. Discussion
5.1. Resource Dependency
Both tourist activities and those related to fishing depend on the good availability of resources. Many of these resources are shared by various activities. Maritime tourism is very dependent on the existence of biodiversity, namely marine wildlife [50]. Because professional fishing is aware, the sustainability of resources is very important, and an abundance of commercial-size stocks should exist for the activity to be viable [51].
At the time this study was carried out, the area under analysis defined by the red rectangle in Figure 2 was determined. Within this area there are many resources used by different vessels (primary stakeholders) as described by [52]. There are several boating activities identified for this area (Table 2). For example, passenger vessels that take tourists on boat trips use areas very close to the rocky coast to show the cliffs that have caves through which the sea enters [53]. For instance, the Benagil cave is now subject to daily limitations due to pressure on carrying capacity, since August 2024. In this same area there are several sites with natural and artificial reefs that are in some way exploited, either by fishing [54] or also by some recreational activities [55], as demonstrated by some of the literature consulted.
5.2. Interaction Areas
The analysis of the data allows us to verify that several areas of interaction occur. Cooperation is easier in situations where vessels target different types of resources [56]. Tourist activities in search of wildlife may sometimes take place near areas where passive fishing gear is anchored. In these situations, the entanglement of wildlife in nets can occur, causing inadvertent damage that is wildlife observation, or damaging fishing gear [57].
There will be no other situations to report, since the trawlers operate at a distance quite off the coast, where there are no major tourist activities. As far as seiners are concerned, they are gears that essentially operate during dusk till dawn, and at those times there are usually no boating tourist activities. From Figure 3 (SNA) we can see that it is only in the intermediate water areas where there is some interaction between passenger boats and some (few) of the purse seine boats. All other activities do not interact with each other at the area level.
Authors such as Natale et al. (2015) [58] have determined fishing effort through AIS and cross-referencing data. Although AIS records do not give us direct information about the type of activity that each vessel carries out, by cross-referencing this data with other type of information sources, we can deduce what the main types of activity of the vessels are and from where they come from (Figure 4). This type of information is very important for prioritizing the type of activity and understanding what type of resources are used depending on the areas used/visited. We were thus able to infer the typology of vessels more focused on the extraction of marine resources (fishing) or non-extraction (passenger vessels) (Figure 5).
5.3. Temporal Patterns
The AIS data show that the patterns of recreational-tourist activities occur during the day. There is greater incidence in the warmer seasons or when the holiday periods (e.g., Christmas and Easter), receive the greater abundance of visitors who are predisposed to participate in this type of activities.
In the case of fishing, although there are fewer records in the winter months, the activity, regardless of the type of fishing gear, extends throughout the year. The limitations of the activity are limited to days of storm when the inlets are closed, or when certain fishing quotas have already been reached (essentially purse-seine vessels). There are still limitations if boats go to the shipyard for annual maintenance or repairs [59]. This type of strike usually occurs in the months of December and January. We found several records that corresponded to this type of situation. For this purpose, we considered that the boats were in dry dock.
Apparently, in winter there is no potential conflict due to the lower activity of recreational boats. As we can see from the Sankey diagrams (Figure 4), there is a slight prevalence of more records of recreational boats in the summer, but this is reversed for the winter season where records related to fishing activities prevail. In the summer, the potential conflict increases slightly and may be only in the intermediate coastal areas where there may be some overlap in the areas of interest to exploit resources.
All other activities related to vessels that do not interact with each other if we consider the same time period. It is important to note, however, that AIS data has limitations and that we cannot infer what actually happens, but only with the data we work with [60].
6. Conclusions
This article presents a simple methodology using a social network analysis and its application to the interaction between tourism and fisheries, through the use of non-intrusive data from AIS. These results are a valuable aid to the governance of activities carried out within a framework of CPRs.
The results achieved are, however, restricted due to the very limitation of AIS data, which is not comprehensive of the entire fleet of vessels that use and exploit the resources coming from a given area, and consequently its applicability is less than what happens in reality. However, as competition for space in the marine environment continues to intensify, this methodology allows inferences about the development of the aforementioned activities and their interaction and can be replicable in other geographies. Addressing the limitations of AIS data, thorough improvements or regulation, could enable this type of social network analysis to be further developed as a policy tool to manage stresses and exploitation on the marine environment.
Author Contributions
Writing—original draft preparation, J.R.; methodology, J.R.; artwork, J.R.; data analysis, J.C.; building and running the SNA model, J.R. and J.C.; writing—review and editing, F.L. and B.D. All authors have read and agreed to the published version of the manuscript.
Funding
This work is funded by Portuguese national funds through FCT – Foundation for Science and Technology within the scope of the projects UIDB/04020/2020, UIDB/04326/2020, UIDP/04326/2020, LA/P/0101/2020 and 2022.01783.PTDC and the Individual Calls to Scientific Employment Stimulus 2021.02180.CEECIND (JR) and 2022.04803.CEECIND (FL).
Institutional Review Board Statement
Not applicable.
Informed Consent Statement
Not applicable.
Data Availability Statement
Not applicable.
Conflicts of Interest
The funders had no role in the design of the study; in the collection, analyses, or interpretation of data; in the writing of the manuscript; or in the decision to publish the results.
References
- Hall, C. M. Trends in ocean and coastal tourism: the end of the last frontier? Ocean & coastal management 2001, 44, 601–618. [Google Scholar]
- Papageorgiou, M. Coastal and marine tourism: A challenging factor in Marine Spatial Planning. Ocean & coastal management 2016, 129, 44–48. [Google Scholar]
- Ramos, J. , & Drakeford, B. Blue economy and tourism: is there a potential to create sustainable jobs? In Handbook of research on human capital and people Management in the Tourism Industry; IGI Global 2021; (pp. 243–264).
- Hamaguchi, Y. , & Thakur, B. K. How can fisheries’ environmental policies help achieve a sustainable blue economy and blue tourism? Discover Sustainability 2024, 5, 261. [Google Scholar]
- Reddy, K. , & Sailesh, B. Integrating Marine Tourism into the Blue Economy Framework. Journal of Environmental Management and Tourism 2024, 15, 501–520. [Google Scholar]
- Otrachshenko, V. , & Bosello, F. Fishing for answers? Impacts of marine ecosystem quality on coastal tourism demand. Tourism Economics 2017, 23, 963–980. [Google Scholar]
- Pearson, N. , & Thompson, B. S. Saving two fish with one wreck: Maximizing synergies in marine biodiversity conservation and underwater cultural heritage protection. Marine Policy 2023, 152, 105613. [Google Scholar]
- Aguilar-Becerra, C. D. , Frausto-Martínez, O., Avilés-Pineda, H., Pineda-Pineda, J. J., Caroline Soares, J., & Reyes Umana, M. Path dependence and social network analysis on evolutionary dynamics of tourism in coastal rural communities. Sustainability 2019, 11, 4854. [Google Scholar]
- KC, B. , Morais, D. B., Peterson, M. N., Seekamp, E., & Smith, J. W. Social network analysis of wildlife tourism microentrepreneurial network. Tourism and Hospitality Research 2019, 19, 158–169. [Google Scholar]
- Chuang, M. T. , Chou, W. H., Chang, C. H., & Chou, W. L. Examining the key drivers for regional revitalization based upon social network analysis: A case study of Badouzi in Taiwan. Marine Policy 2021, 133, 104754. [Google Scholar]
- Gómez, S. , Patraca, B., & Molina, J. L. Improving seafood systems with social network analysis: The case of cuttlefish marketing in Catalonia. Marine Policy 2023, 150, 105517. [Google Scholar]
- Heenehan, H. , Basurto, X., Bejder, L., Tyne, J., Higham, J. E., & Johnston, D. W. Using Ostrom's common-pool resource theory to build toward an integrated ecosystem-based sustainable cetacean tourism system in Hawaii. Journal of Sustainable Tourism 2015, 23, 536–556. [Google Scholar]
- Torres-Guevara, L. E. , Lopez, M. C., & Schlüter, A. Understanding artisanal fishers’ behaviors: the case of Ciénaga Grande de Santa Marta, Colombia. Sustainability 2016, 8, 549. [Google Scholar]
- Bergstrom, T. C. The uncommon insight of Elinor Ostrom. Scandinavian Journal of Economics 2010, 112, 245–261. [Google Scholar] [CrossRef]
- Acheson, J. M. Ostrom for anthropologists. International Journal of the Commons 2011, 5, 319–339. [Google Scholar] [CrossRef]
- Ostrom, E. (1990). Governing the commons: The evolution of institutions for collective action. Cambridge university press.
- Bodin, Ö. , & Crona, B. I. The role of social networks in natural resource governance: What relational patterns make a difference? Global environmental change 2009, 19, 366–374. [Google Scholar]
- Robertson, J. Challenges in sustainably managing groundwater in the Australian Great Artesian Basin: Lessons from current and historic legislative regimes. Hydrogeology Journal 2020, 28, 343–360. [Google Scholar] [CrossRef]
- Alessandrini, A. , Mazzarella, F., & Vespe, M. Estimated time of arrival using historical vessel tracking data. IEEE Transactions on Intelligent Transportation Systems 2018, 20, 7–15. [Google Scholar]
- Yang, D. , Wu, L., Wang, S., Jia, H., & Li, K. X. How big data enriches maritime research–a critical review of Automatic Identification System (AIS) data applications. Transport Reviews 2019, 39, 755–773. [Google Scholar]
- Mazzarella, F. , Vespe, M., Damalas, D., & Osio, G. (2014, July). Discovering vessel activities at sea using AIS data: Mapping of fishing footprints. In 17th International conference on information fusion (FUSION) (pp. 1–7). IEEE.
- Serra-Sogas, N. , O’Hara, P. D., Pearce, K., Smallshaw, L., & Canessa, R. Using aerial surveys to fill gaps in AIS vessel traffic data to inform threat assessments, vessel management and planning. Marine Policy 2021, 133, 104765. [Google Scholar]
- Hassan, A. , & Khokhar, S. S. (2024). Internet of Things-Enabled Vessel Monitoring System for Enhanced Maritime Safety and Tracking at Sea. In SoutheastCon 2024 (pp. 250–259). IEEE.
- O'Hara, P. D. , Serra-Sogas, N., McWhinnie, L., Pearce, K., Le Baron, N., O'Hagan, G.,... & Canessa, R. Automated identification system for ships data as a proxy for marine vessel related stressors. Science of The Total Environment 2023, 865, 160987. [Google Scholar]
- Wei, T. , Feng, W., Chen, Y., Wang, C. X., Ge, N., & Lu, J. Hybrid satellite-terrestrial communication networks for the maritime Internet of Things: Key technologies, opportunities, and challenges. IEEE Internet of things journal 2021, 8, 8910–8934. [Google Scholar]
- Goudossis, A. , & Katsikas, S. K. Towards a secure automatic identification system (AIS). Journal of Marine Science and Technology 2019, 24, 410–423. [Google Scholar]
- Le Tixerant, M. , Le Guyader, D., Gourmelon, F., & Queffelec, B. How can Automatic Identification System (AIS) data be used for maritime spatial planning? Ocean & Coastal Management 2018, 166, 18–30. [Google Scholar]
- Smythe, T. C. , & McCann, J. Lessons learned in marine governance: Case studies of marine spatial planning practice in the US. Marine Policy 2018, 94, 227–237. [Google Scholar]
- Germond, B. , & Mazaris, A. D. Climate change and maritime security. Marine Policy 2019, 99, 262–266. [Google Scholar]
- Barnett, A. J. , & Anderies, J. M. Weak feedbacks, governance mismatches, and the robustness of social-ecological systems: an analysis of the Southwest Nova Scotia lobster fishery with comparison to Maine. Ecology and Society.
- Sayles, J. S. , Mancilla Garcia, M., Hamilton, M., Alexander, S. M., Baggio, J. A., Fischer, A. P.,... & Pittman, J. Social-ecological network analysis for sustainability sciences: a systematic review and innovative research agenda for the future. Environmental Research Letters 2019, 14, 093003. [Google Scholar]
- Felipe-Lucia, M. R. , Guerrero, A. M., Alexander, S. M., Ashander, J., Baggio, J. A., Barnes, M. L.,... & Dee, L. E. Conceptualizing ecosystem services using social–ecological networks. Trends in Ecology & Evolution 2022, 37, 211–222. [Google Scholar]
- Schittone, J. Tourism vs. commercial fishers: development and changing use of Key West and Stock Island, Florida. Ocean & coastal management 2001, 44, 15–37. [Google Scholar]
- Ditton, R. B. , Holland, S. M., & Anderson, D. K. Recreational fishing as tourism. Fisheries 2002, 27, 17–24. [Google Scholar]
- Ghermandi, A. , & Nunes, P. A. A global map of coastal recreation values: Results from a spatially explicit meta-analysis. Ecological economics 2013, 86, 1–15. [Google Scholar]
- Hynes, S. , Ghermandi, A., Norton, D., & Williams, H. Marine recreational ecosystem service value estimation: A meta-analysis with cultural considerations. Ecosystem services 2018, 31, 410–419. [Google Scholar]
- Dimitrovski, D. , & Crespi Vallbona, M. Urban food markets in the context of a tourist attraction–La Boqueria market in Barcelona, Spain. Tourism Geographies 2018, 20, 397–417. [Google Scholar]
- Zapata, M. J. , Hall, C. M., Lindo, P., & Vanderschaeghe, M. (2013). Can community-based tourism contribute to development and poverty alleviation? Lessons from Nicaragua. In Tourism and the Millennium Development Goals (pp. 98–122). Routledge.
- Moksness, E. , Gjøsæter, J., Lagaillarde, G., Mikkelsen, E., Olsen, E. M., Sandersen, H. T., & Vølstad, J. H. Effects of fishing tourism in a coastal municipality: a case study from Risør, Norway. Ecology and Society 2011, 16. [Google Scholar]
- Kauppila, P. , & Karjalainen, T. P. A process model to assess the regional economic impacts of fishing tourism: A case study in northern Finland. Fisheries Research 2012, 127, 88–97. [Google Scholar]
- Hoogendoorn, G. Mapping fly-fishing tourism in Southern Africa. African Journal of Hospitality, Tourism and Leisure 2014, 3, 1–13. [Google Scholar]
- Chen, C. L. , & Chang, Y. C. A transition beyond traditional fisheries: Taiwan's experience with developing fishing tourism. Marine Policy 2017, 79, 84–91. [Google Scholar]
- Romanelli, M. , & Meliadò, E. Fishing tourism in Italy. Ocean & Coastal Management 2021, 215, 105886. [Google Scholar]
- Eider, D. , Partelow, S., Albrecht, S., Adrianto, L., & Kluger, L. C. SCUBA tourism and coral reefs: a social-ecological network analysis of governance challenges in Indonesia. Current Issues in Tourism 2023, 26, 1031–1050. [Google Scholar]
- Valeri, M. , & Baggio, R. Italian tourism intermediaries: A social network analysis exploration. Current Issues in Tourism 2021, 24, 1270–1283. [Google Scholar]
- Chong, C. , Zhang, X., Kong, G., Ma, L., Li, Z., Ni, W., & Yu, E. H. C. A visualization method of the economic input–output table: mapping monetary flows in the form of Sankey diagrams. Sustainability 2021, 13, 12239. [Google Scholar]
- Galili, T. dendextend: an R package for visualizing, adjusting and comparing trees of hierarchical clustering. Bioinformatics 2015, 31, 3718–3720. [Google Scholar] [CrossRef] [PubMed]
- Horta e Costa, B. , Guimarães, M. H., Rangel, M., Ressurreicão, A., Monteiro, P., Oliveira, F.,... & Goncalves, J. M. Co-design of a marine protected area zoning and the lessons learned from it. Frontiers in Marine Science 2022, 9, 969234. [Google Scholar]
- R Development Core Team (2024). R: a language and environment for statistical computing, version 4.3.3. R Foundation for Statistical Computing, Vienna, Austria. https://cran.r-project.org/.
- Selvaduray, M. , Bandara, Y. M., Zain, R. M., Ramli, A., & Mohd Zain, M. Z. Bibliometric analysis of maritime tourism research. Australian Journal of Maritime & Ocean Affairs 2023, 15, 330–356. [Google Scholar]
- Andersson, M. From pluri-activity to entrepreneurship: Swedish inshore commercial fisheries navigating in the service-oriented economy. Scandinavian Journal of Hospitality and Tourism 2021, 21, 374–390. [Google Scholar] [CrossRef]
- Monteiro, P. V. , Salvador, R., & Soares, C. G. A microcluster approach applied to the case of the nautical tourism sector of the Algarve region (Portugal). Tourism in Marine Environments 2017, 12, 105–124. [Google Scholar]
- Lukoseviciute, G. , Henriques, C. N., Pereira, L. N., & Panagopoulos, T. Participatory development and management of eco-cultural trails in sustainable tourism destinations. Journal of Outdoor Recreation and Tourism 2024, 47, 100779. [Google Scholar]
- Leitao, F. , Santos, M. N., Erzini, K., & Monteiro, C. C. Diplodus spp. assemblages on artificial reefs: importance for near shore fisheries. Fisheries Management and Ecology 2009, 16, 88–99. [Google Scholar]
- Ramos, J. , Drakeford, B., Madiedo, A., Costa, J., & Leitão, F. A Bayesian Approach to Infer the Sustainable Use of Artificial Reefs in Fisheries and Recreation. Sustainability 2024, 16, 810. [Google Scholar]
- Monteiro, P. V. The purse seine fishing of sardine in Portuguese waters: a difficult compromise between fish stock sustainability and fishing effort. Reviews in Fisheries Science & Aquaculture 2017, 25, 218–229. [Google Scholar]
- Issifu, I. , & Sumaila, U. R. A review of the production, recycling and management of marine plastic pollution. Journal of Marine Science and Engineering 2020, 8, 945. [Google Scholar]
- Natale, F. , Gibin, M., Alessandrini, A., Vespe, M., & Paulrud, A. Mapping fishing effort through AIS data. PloS one 2015, 10, e0130746. [Google Scholar]
- House, D. (2015). Dry docking and shipboard maintenance: A guide for industry. Routledge.
- Mieczyńska, M. , & Czarnowski, I. Impact of Distance Measures on the Performance of AIS Data Clustering. Computer Systems Science & Engineering 2021, 36. [Google Scholar]
Figure 1.
Conceptual approach: Within the circle are the probable interactions between the recreational and fishing vessel activities. AIS data collected by satellite or terrestrial make it possible to gather useful information on vessels activity along time. By using a SNA approach with ancillary methods, it is possible to suggest information that can inform coastal managers and decision makers.
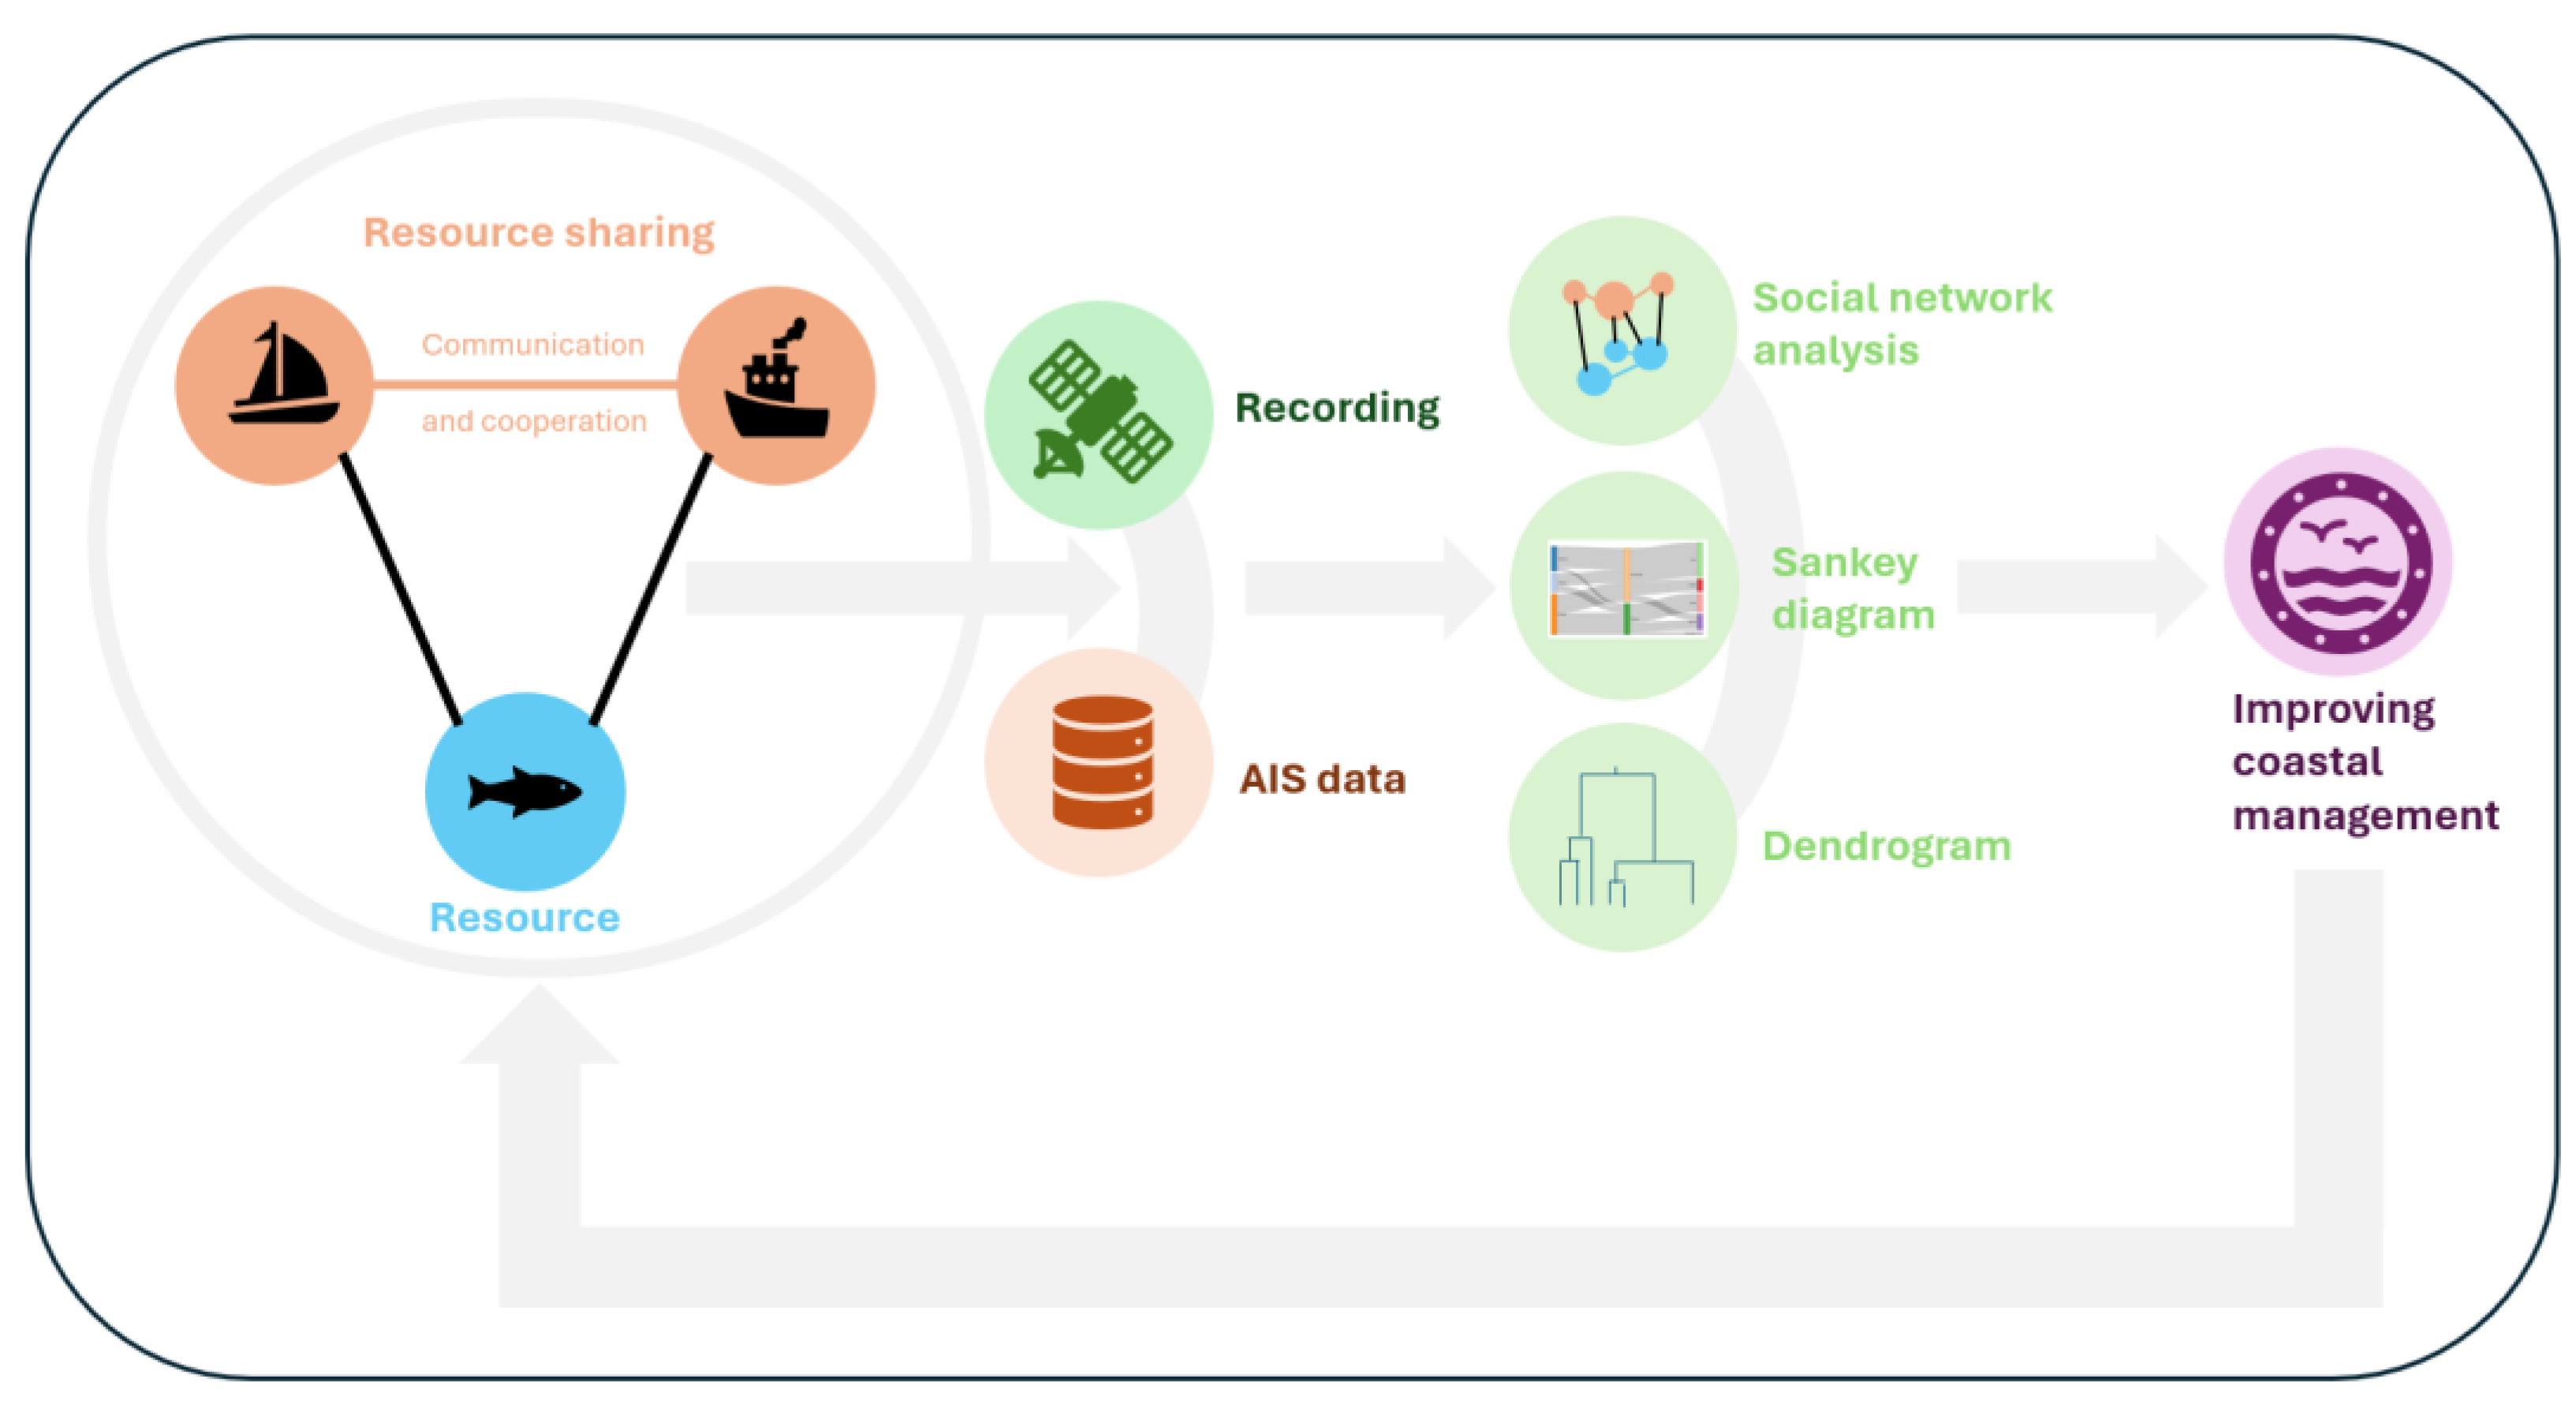
Figure 2.
Map showing the case study location off south Portugal and the main areas where maritime-coastal activities can be found. Orangish circles represent marinas where recreational boats are berthed, and bluish ones represent ports for fishing vessels). The red rectangle is the AIS study area for the years 2022/3, whereas the pinkish area is a recently created MPA (access restrictions in the central polygon, since 2024). Source for MPA area: [48].
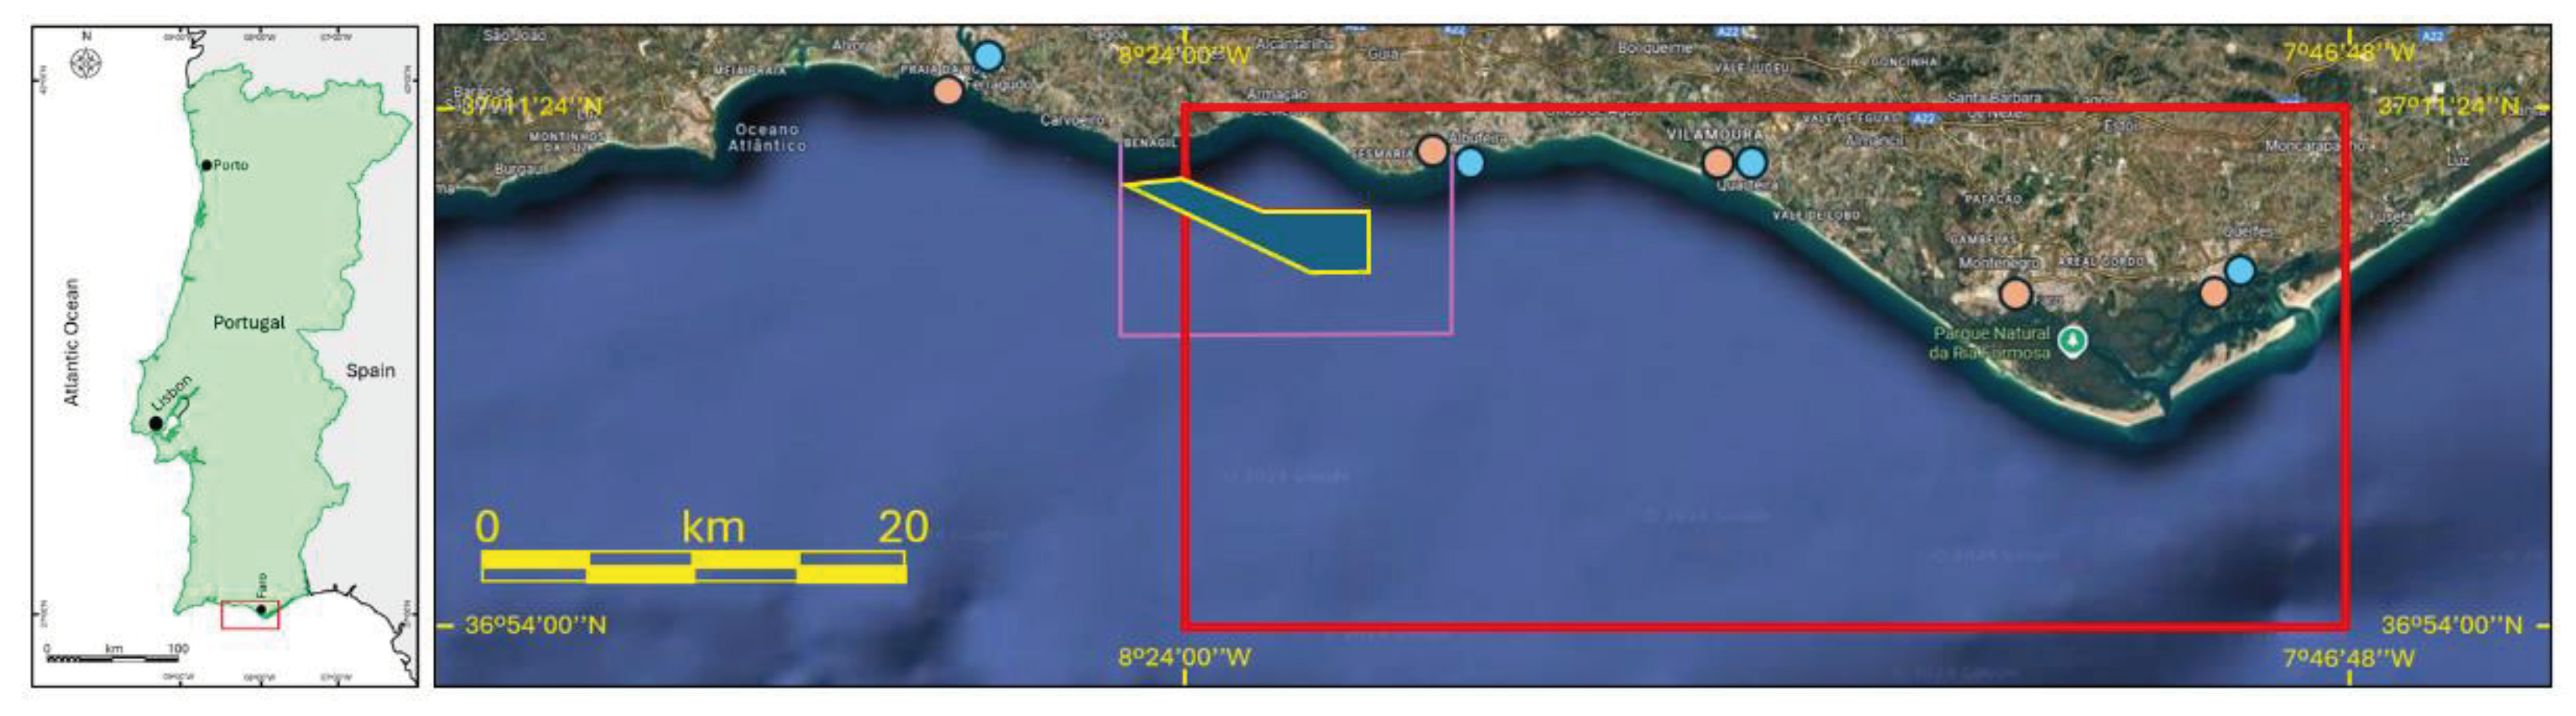
Figure 3.
SNA model showing the interaction between recreational and fishing vessels (Algarve, Portugal). For the analysis it was used the Gephi software (version 0.10.1) available from: https://gephi.org/ .
Figure 3.
SNA model showing the interaction between recreational and fishing vessels (Algarve, Portugal). For the analysis it was used the Gephi software (version 0.10.1) available from: https://gephi.org/ .
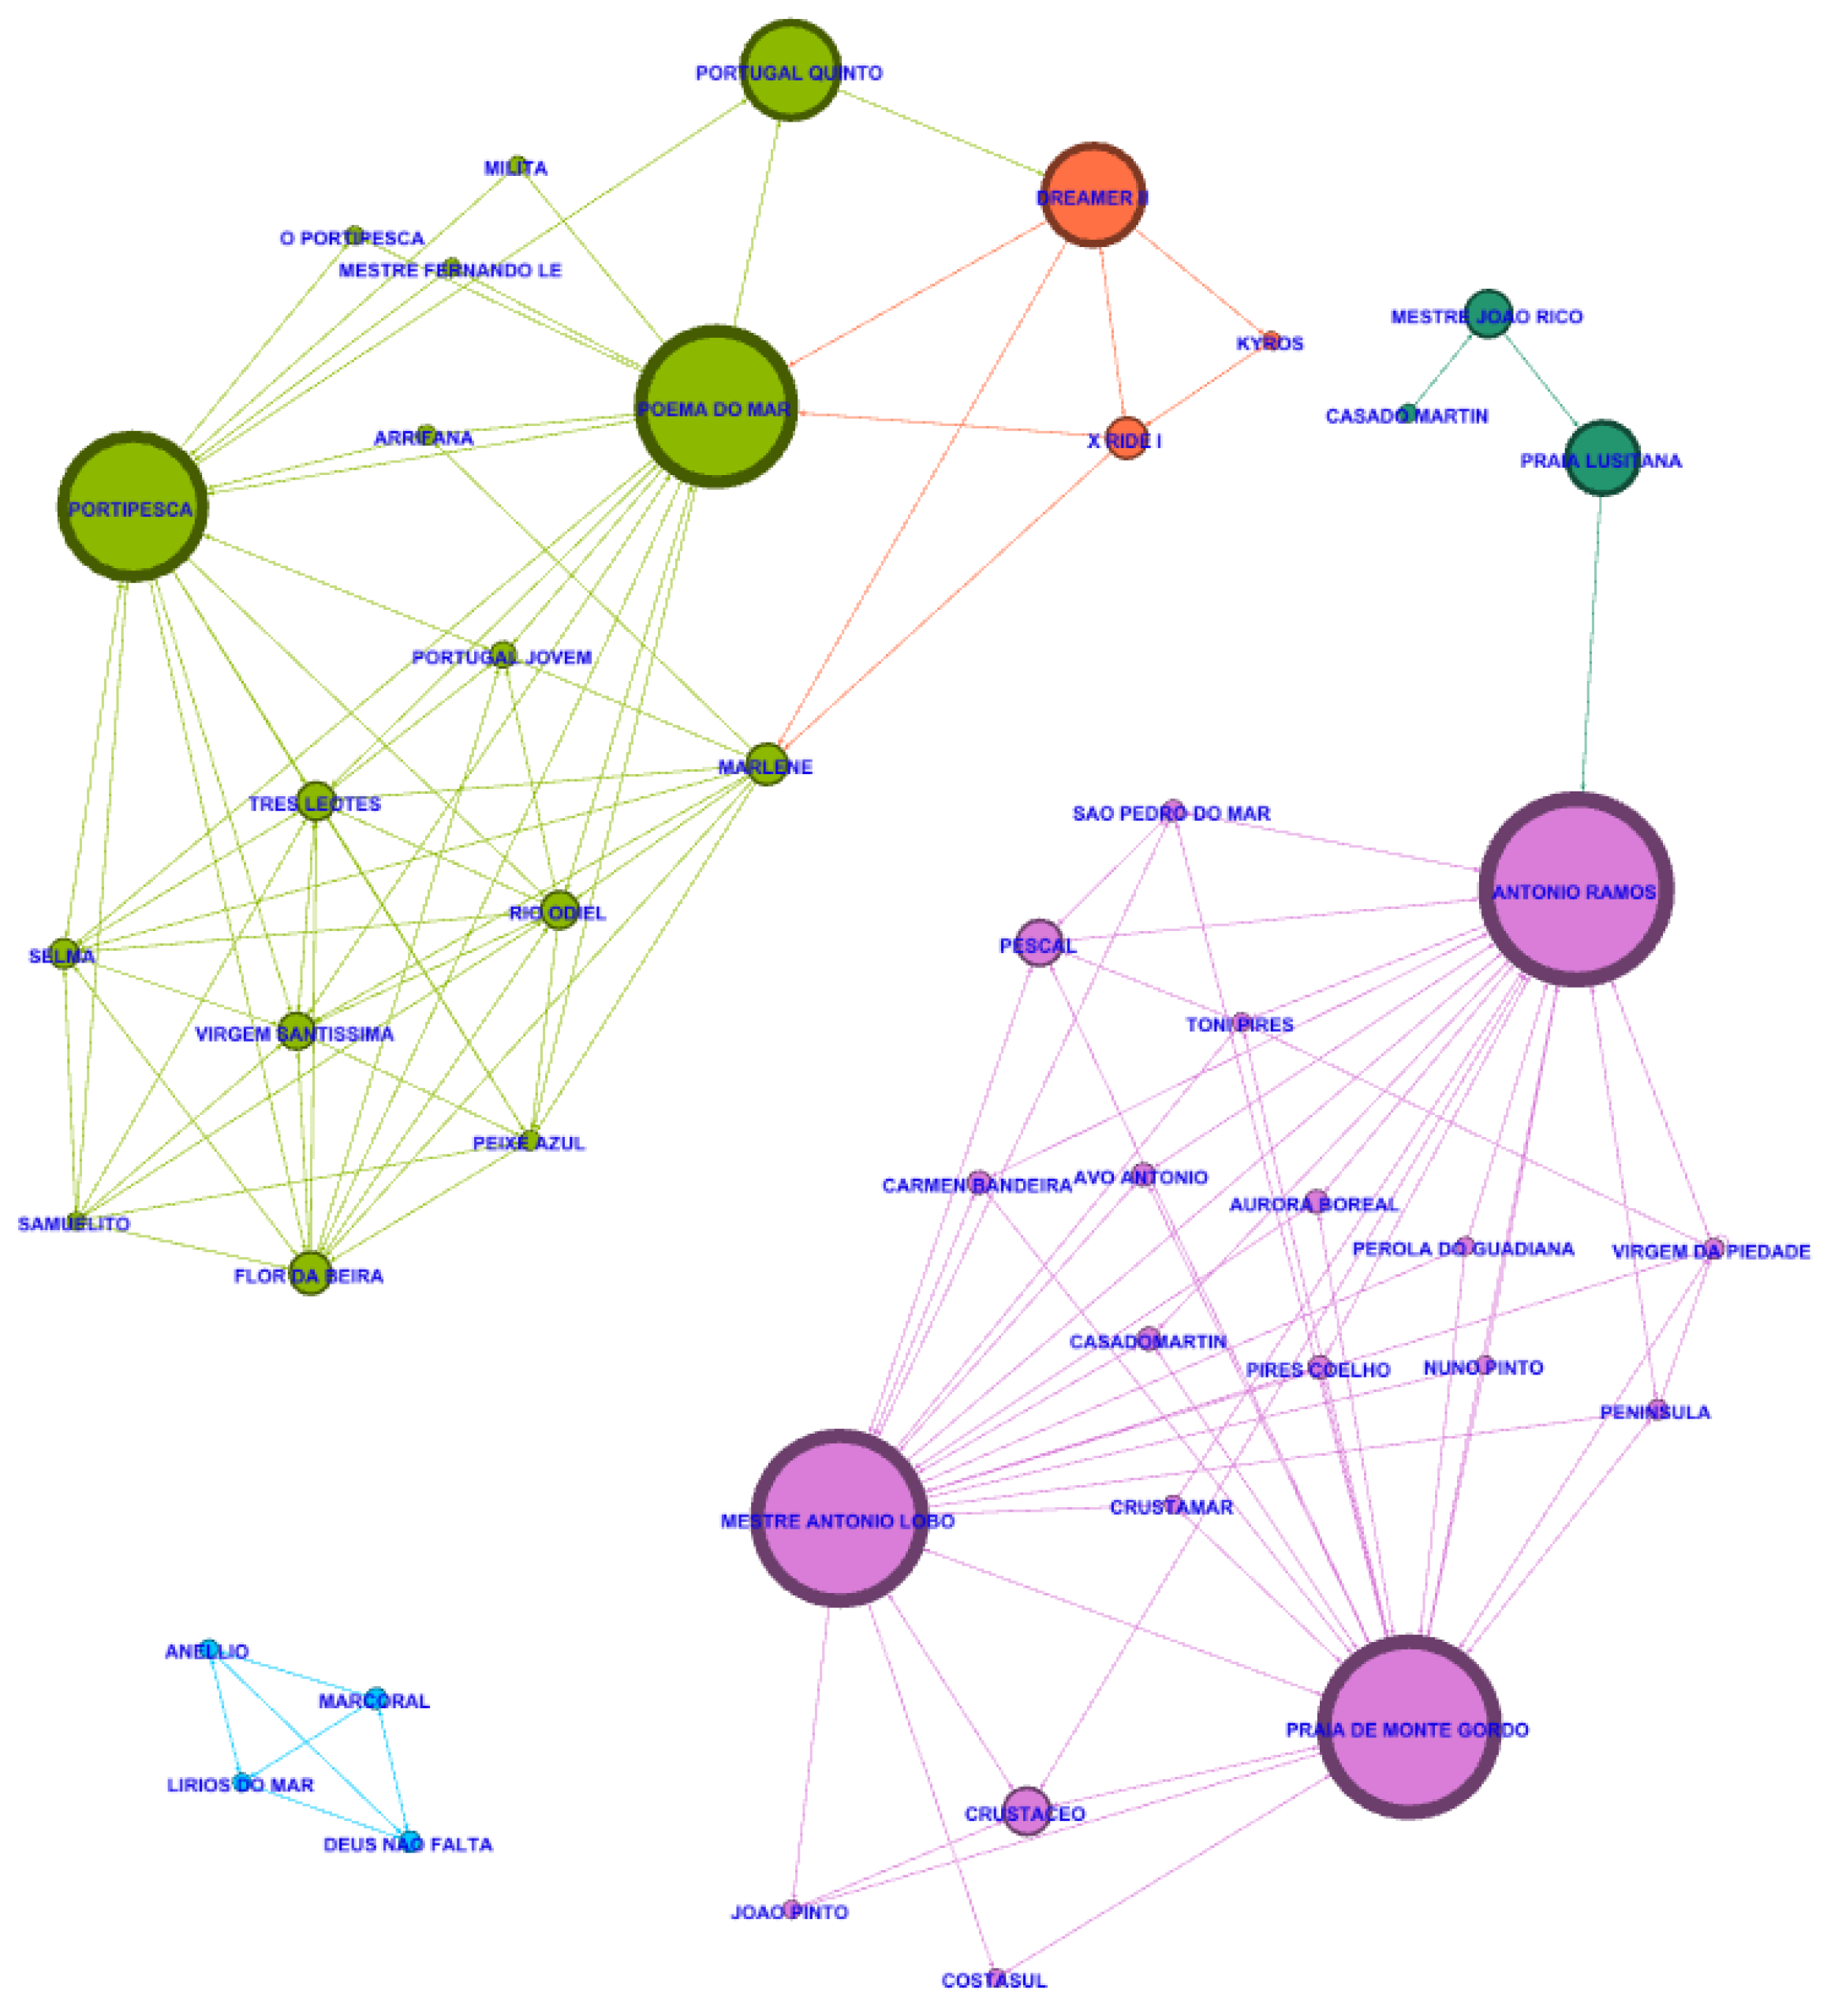
Figure 4.
Sankey diagrams showing contrasting seasons (Summer and Winter). Left side nodes refer to ports and marinas, whereas right side is related to the type of resources sought after. R Development Core Team (2024) [49].
Figure 4.
Sankey diagrams showing contrasting seasons (Summer and Winter). Left side nodes refer to ports and marinas, whereas right side is related to the type of resources sought after. R Development Core Team (2024) [49].
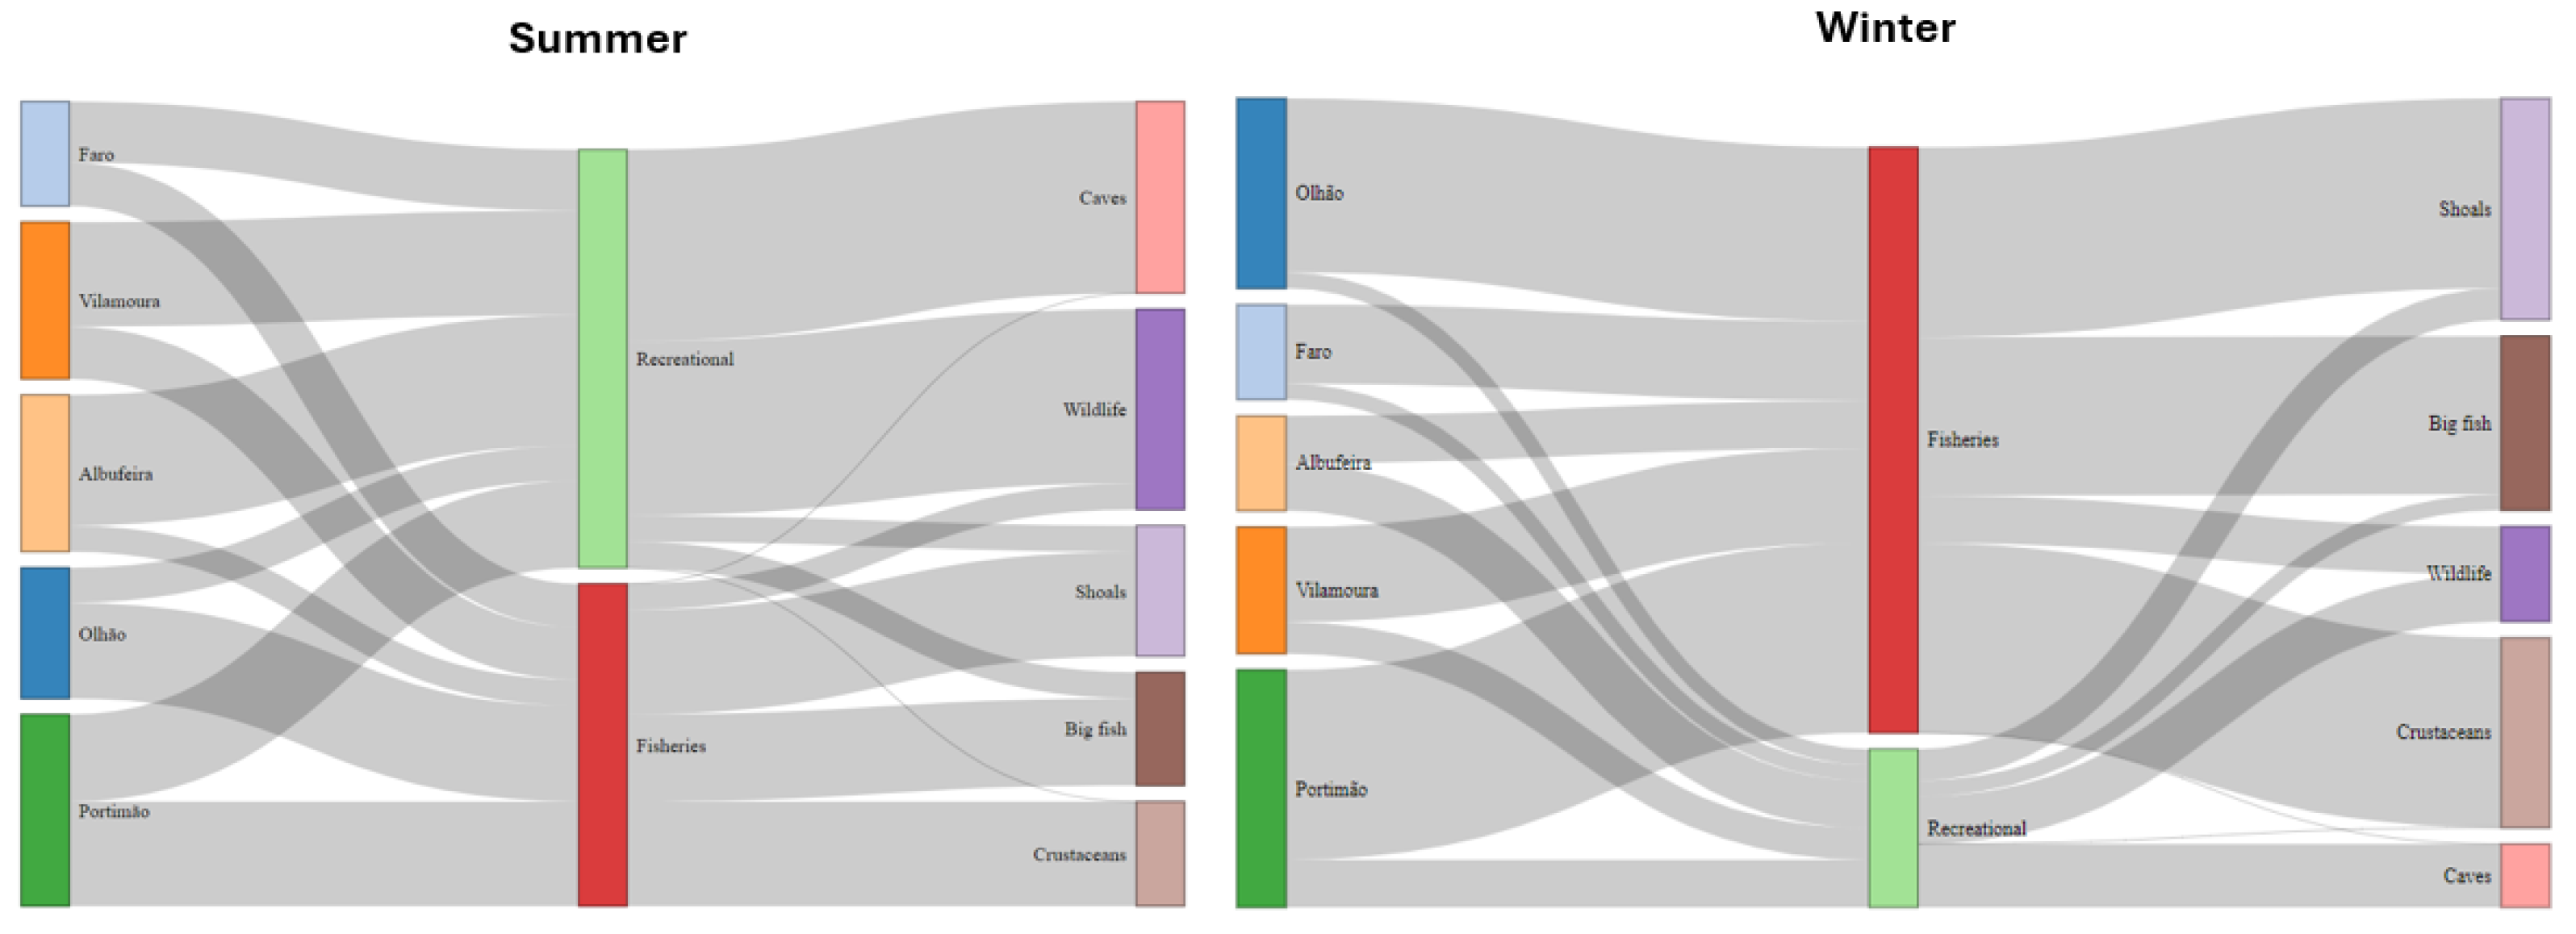
Figure 5.
Cluster dendrogram. To construct the dendrogram, the AIS pings from Table 2 were used, but 23 boats were left out because they had few records (17 sailing and 6 fishing). Lower-level shows vessels codified by a number (bluish recreational and orangish fishing). R Development Core Team (2024) [49].
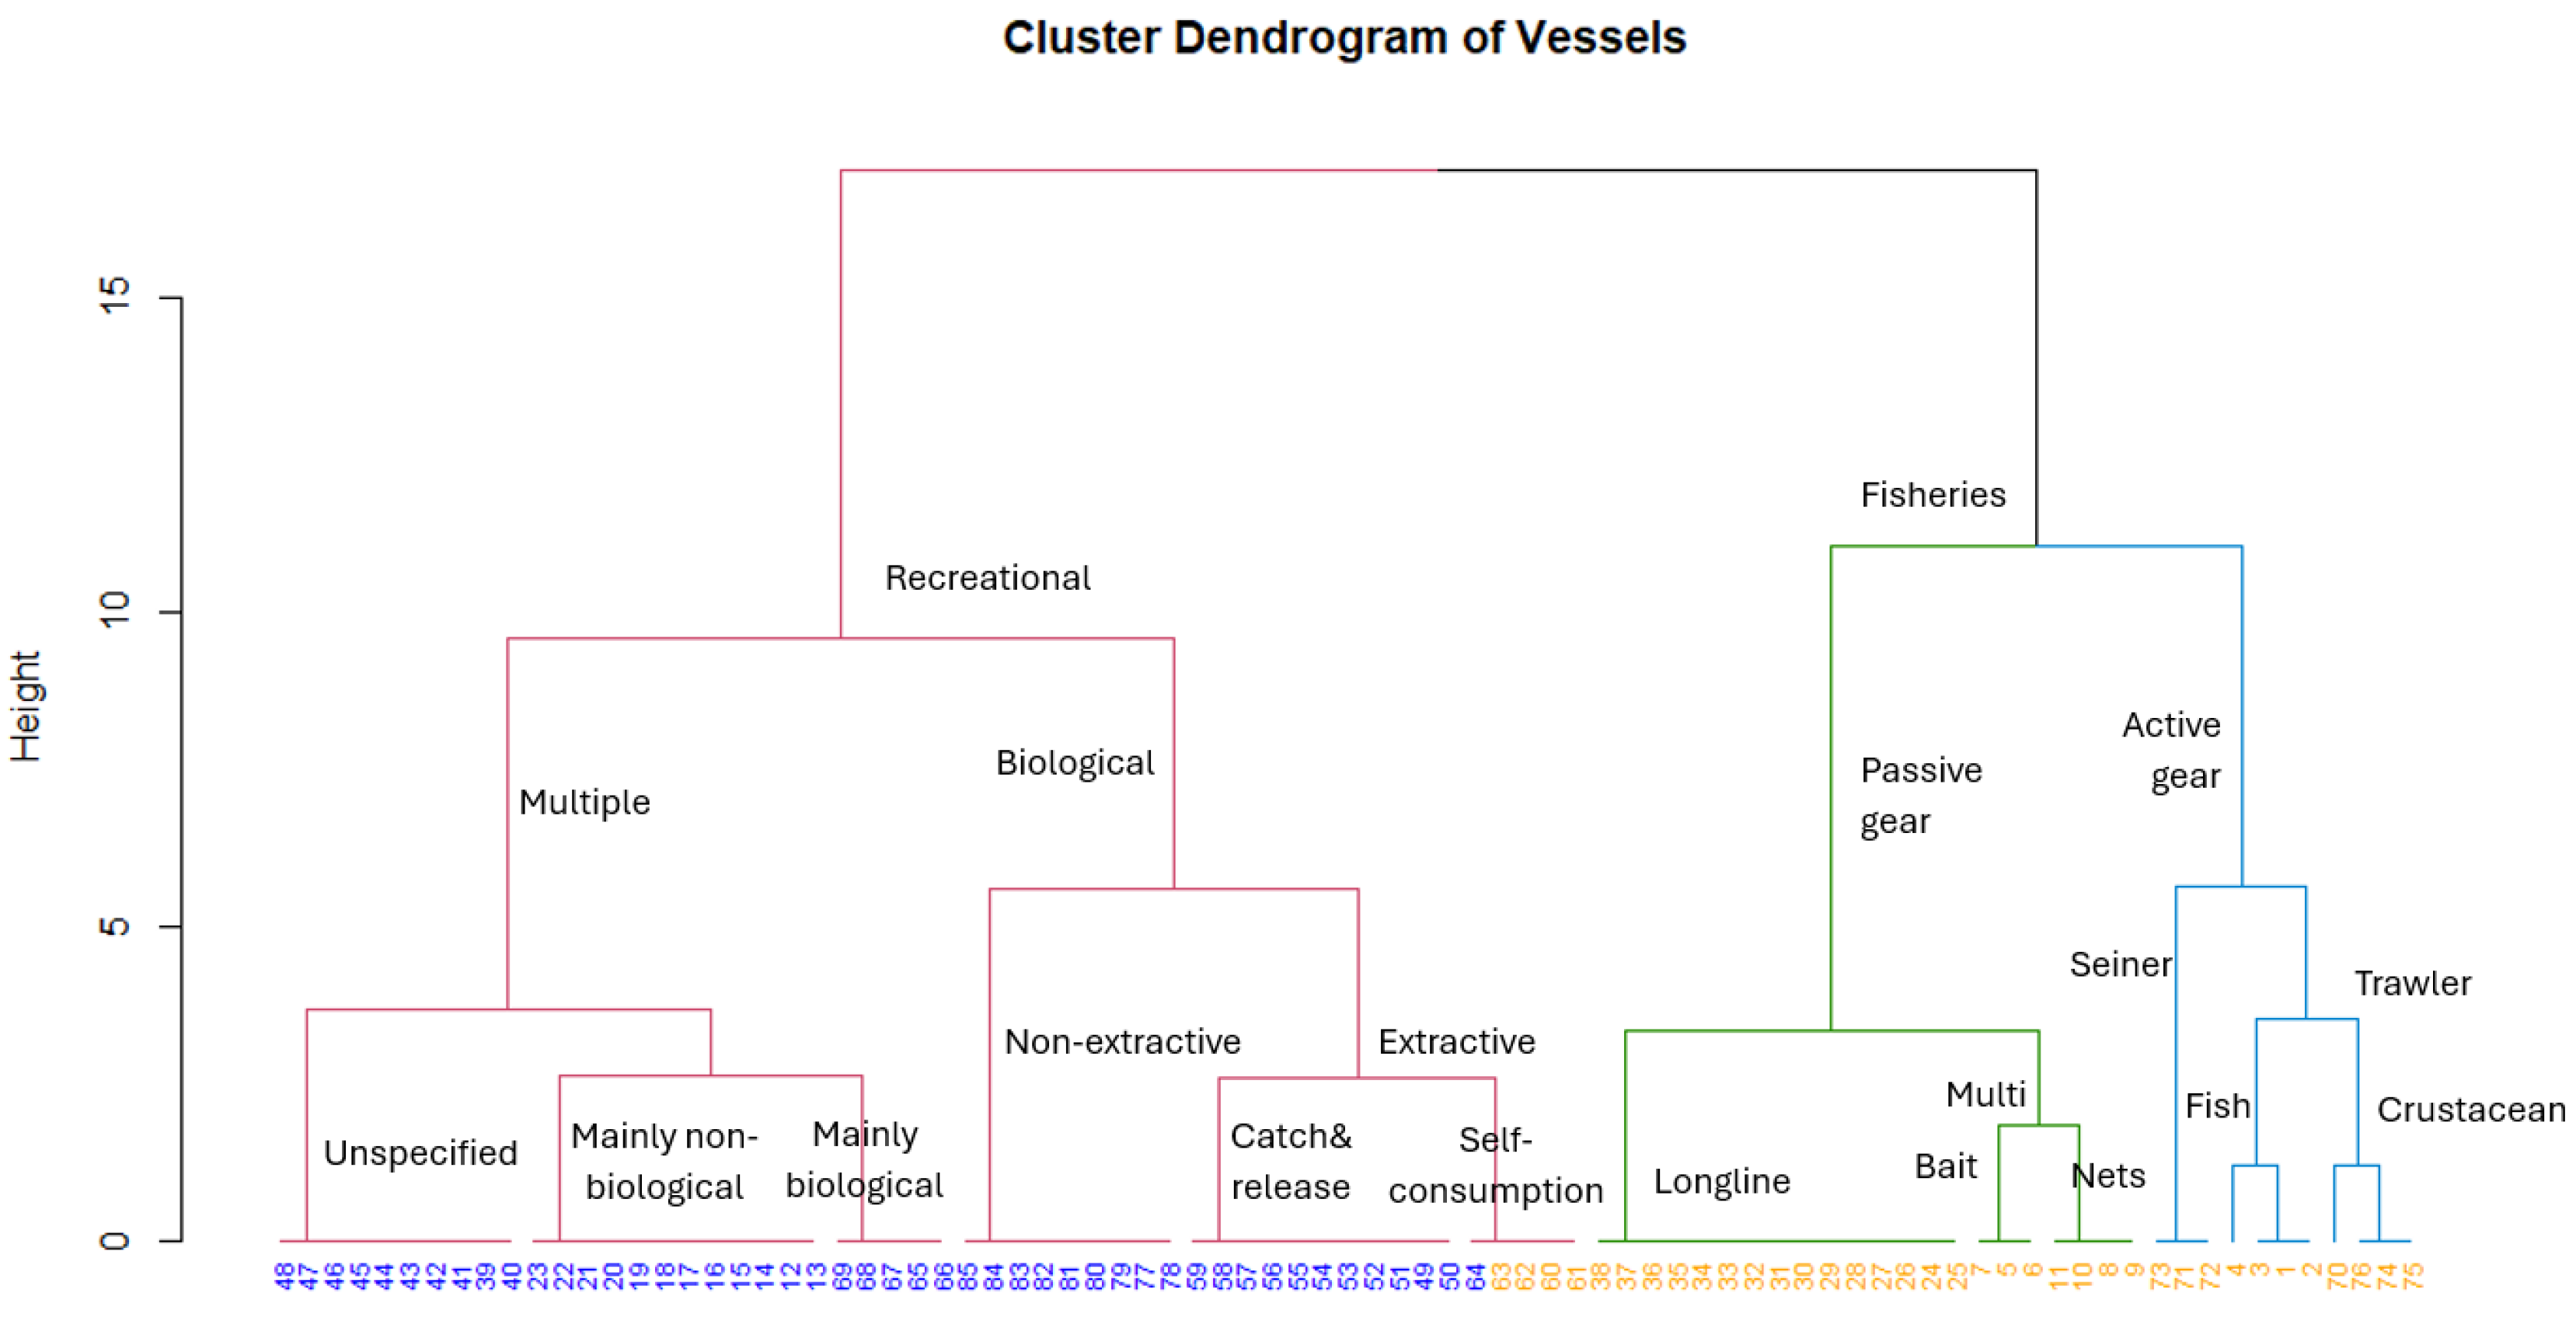

Table 1.
Data collection from AIS pings and crosschecked with other sources to be used in the SNA.
| Variable | Description |
|---|---|
| Vessel ID | The identification of the vessel (e.g., MMSI, name) |
| No. Pings | Identified number of AIS data records, cleansing and selection of the useful ones |
| Activity type | By crosschecking data, an economic/leisure activity for the vessel is attributed either as fishing or recreational |
| Area used | From the number of pings and its characterization it is possible to identify the area used by that vessel |
| Resource(s) | Associated with the different areas are some resources that stimulate economic or leisure activities |
| Interaction | The degree of systematic occurrence of some vessels in a given area in similar time periods |
Table 2.
Data distribution and classification by vessel category.
| Activity | AIS Classification | Vessel typology | No. of vessels | No. of pings | Observed interaction |
|---|---|---|---|---|---|
| Recreational | |||||
| Passenger | Passenger | 3 | 2,666 | High (inter) | |
| Pleasure Craft | Pleasure Craft | 41 | 1,411 | Low | |
| Sailing | Sailing | 21 | 681 | Low | |
| Total | 65 | 4,758 | |||
| Fisheries | |||||
| Fishing | Trawler | 22 | 15,910 | High (intra) | |
| Fishing | Seiner | 16 | 12,519 | High (inter) | |
| Fishing | Multi-gear | 4 | 2,383 | High (intra) | |
| Fishing | Longliner | 1 | 84 | Not known | |
| Total | 43 | 30,896 |
Note: Pings consist of the summation of hourly records for a period of two consecutive years (2022/3).
Table 3.
Main network metrics used in the SNA.
| Nodes: | 45 |
| Edges: | 175 |
| Average degree: | 3.889 |
| Average weighted degree: | 3.889 |
| Network diameter: | 6 |
| Graph density: | 0.088 |
| Connected components: | 3 |
| Modularity: | 0.292 |
| Statistical inference: | 315.321 |
| Average clustering coefficient: | 0.508 |
| Average path length: | 2.182 |
Source: Own elaboration. Note: There were only used the data from those vessels that showed high interaction.
Disclaimer/Publisher’s Note: The statements, opinions and data contained in all publications are solely those of the individual author(s) and contributor(s) and not of MDPI and/or the editor(s). MDPI and/or the editor(s) disclaim responsibility for any injury to people or property resulting from any ideas, methods, instructions or products referred to in the content. |
© 2025 by the authors. Licensee MDPI, Basel, Switzerland. This article is an open access article distributed under the terms and conditions of the Creative Commons Attribution (CC BY) license (http://creativecommons.org/licenses/by/4.0/).
Copyright: This open access article is published under a Creative Commons CC BY 4.0 license, which permit the free download, distribution, and reuse, provided that the author and preprint are cited in any reuse.


