
Submitted:
31 January 2025
Posted:
03 February 2025
You are already at the latest version
Abstract
Besides the zonation of the Marine Protected Area of Karaburun-Sazani, the first marine national park in Albania, this protected area is situated close to a very dynamic urbanistic, touristic and important fishing area, making it a very important one to be managed by the pre-identified stakeholder earlier in the process. With the integration of local ecological knowledge and direct surveys, the study aims to understand the socio-economic factors that shape the local small-scale fisheries market. Given the sensitivity of the fishing sectors, where there are registered 50 small scale fishers and the illegality is a challenge, the analysis aimed to take into account also the impact that this illegality is having in the registered fishers. The findings reveal the structure and dynamics of small-scale fisheries value chains from catch to consumer, including the roles of fishers, wholesalers, retailers, and restaurants. Key challenges identified include illegal sales, lack of infrastructure, and data scarcity. The study suggests that direct sales can potentially increase fishers' income, though they currently rely heavily on middlemen for services like ice and bait. Findings also highlight the competition from recreational fishing and the impact of imported seafood. The research advocates for the creation of fishery management organizations to strengthen the small scale fisheries value chain and suggests diversification and improvement of business strategies for small-scale fishers in MPAs. This study contributes to the broader Mediterranean discourse on small scale fisheries, providing insights that can guide policy and management decisions to support sustainable fisheries and local livelihoods.
Keywords:
small-scale fisheries
; marine protected area
; value chain analyses
; local ecological knowledge
; socio-economic impact
1. Introduction
Small-Scale Fisheries (SSFs) are defined as “fishing carried out by fishing vessels of an overall length of < 12 m and not using towed gear” [1]. In the Mediterranean Sea region, small scale fisheries (SSF) account for 82% of the total fleet for commercial fishing, provide 85% of total employment (166 000 of part-time and full-time employment), generate 17 percent of total annual revenue, and yield 15 percent of the total marine capture fishery production [2]. The signing of the RPOA has demonstrated that the signatory have stepped up their support for this sector [2]. Albania is a signatory to the RPOA-SSF and one of the countries where SSFs play a significant role, accounting for approximately 70% of the total Albanian fishing fleet, which consists of 337 small-scale vessels [2], though industrial fisheries employ the majority of all workers in the capture fisheries sector [2].
Analyzing the local markets driving SSF, it is critical to identify the socioeconomic drivers of SSFs in order to collect perspectives on the consequences and pressures of fishing operations on marine resources, as well as the behavior of the key actors along the value chain [3].
Assessing the true socioeconomic impacts of SSFs is not an easy task because landings are not always declared, the exact number of active vessels is seldom known, fisheries are often spread over large areas with multiple landing points, multiple gears are used, most fisheries are both poorly regulated and monitored, and dedicated infrastructures are missing [2, 4, 5, 6, 7, 8]. All of these challenges lead to a complicated data gathering situation and management framework, highlighting the need to expand SSF understanding [9]. Better understanding of SSF markets and value chains might lay the groundwork for identifying the most relevant solutions to enhance fishers' socioeconomic conditions and encourage the sustainable and competitive growth of Albanian SSFs.
Up until the year this study was conducted (2020), only the region of Karaburun and Sazani had been designated as a Marine Protected Area (MPA) (recognized by the national and international authorities as National Marine Park of Karaburun-Sazani [hereafter, KSMPA]) along the 476 km of Albanian coastline in the south-eastern Adriatic and Ionian seas [7] and in accordance with a proposal made by the Albanian Ministry of Environment, Forest, and Water Administration based on the Council of Ministers’ decision number 289 (April 28, 2010).
Recently, after the decision of the Albanian authorities (29 July, 2022), the Porto-Palermo Bay was proclaimed a "Nature Park". The length of coast that comprises the KSMPA, like many other coastal regions in Albania, is home to a variety of human populations and activities, including towns, ports, aquaculture farms, tourism enterprises, and a number of large-scale fisheries and SSFs [7].
We conducted a survey to collect data from KSMPA stakeholders in Albania, primarily fishers, in recognition of the current state of data scarcity in Mediterranean SSFs, including the Albanian ones. In fact, local ecological knowledge (LEK) can represent a valid instrument to supplement science-based information in the understanding of social and ecological systems, which scientific surveys alone can sometimes fail to achieve [10, 11].
Many authors [12, 13, 14] have emphasized the relevance of LEK for data improvement, management success, enhancing the status of small-scale fishers, and including local people in data gathering and resource management. The potential for ecosystem-based management of Mediterranean SSFs can be strengthened by acknowledging the important role that fishermen's knowledge plays and incorporating local communities into research frameworks [15]. This will help manage SSFs and MPAs not just in Albania but throughout the Mediterranean region [16].
The following objectives were achieved at the Albanian pilot site, which corresponds to the MPA of Karaburun-Sazani, and this study is in line with the RPOA-SSF objectives: (1) Analyze the composition and functioning of SSF value chains in KSMPA, paying special attention to the function and interactions of each chain participant, including fishermen, wholesalers, retailers, eateries, and customers; (2) define the primary imperfections in the value chain structure; and (3) highlight viable solutions to enhance and diversify small-scale fishermen's livelihoods.
2. Materials and Methods
2.1 Study Area
This investigation was conducted at the KSMPA at Vlora, Albania (Adriatic and Ionian seas, Mediterranean Sea, Figure 1). The zoning scheme has four zones: the core zone (CZ), effective management zone (EMZ), sustainable development zone (SDZ), and recreation zone (RZ). The four zones are distinguished by diminishing levels of legislative protection and management controls [7].
The map depicts the fishing communities, sea food/wholesalers, and restaurants that were the focus of interviews done using the LEK based strategy. Bakiu [7] shown a significant difference in catch composition, total catches, and catch per unit of effort (CPUEs) obtained by SSF communities from the two ports Triport and Orikum (Fishing Center Oriku). This study includes an additional SSF community that is landing near Marina Orikum. As it was shown previously by [7] at Orikum (as in other small, coastal villages), small-scale fishers mostly use small boats for fishing in coastal lagoons or in shallow marine waters. In general, Orikum has a limited number of active boats, and they typically utilize trammel nets that are not extremely long and have a pretty big mesh size, particularly while fishing in the MPA. The Orikum small-scale fishers show a clearly collaborative approach, witnessed by their active participation at meetings with scientists and their positive attitude toward the MPA [7]. Almost all of them (20 from 30 registered at the Municipality of Orikum) participated in all meetings organized with scientists and Regional Administrate of Protected Areas Vlore (RAPA Vlore) representatives, while at least 80% of the fishers in Triport never opted to participate in any of the meetings scheduled in that community between 2015-2016 [7]. It is also important to state that there are not present SSF management organisations in Vlore, though in 2016 the Municipality of Orikum showed to have promoted the existence of the Orikum Fishing Management Organization [7], which doesn’t exist anymore.
2.2. Survey Characteristics
The research area's fishery value chains have been analyzed from the sea to the consumers, encompassing fishing, food service, wholesaling, and retailing operations. In this study, documentation of each step undertaken by the seafood product, coupled with an investigation of price fluctuations associated with each of these stages, has been conducted. The examination has been conducted for both fresh seafood products and their respective origins, which is the location of their initial capture. This method offers for a better knowledge of where the largest price mark-ups occur, impacting the gap between the final price and the ex-vessel price [3].
An interview-based process was used to acquire as much information as possible about the structure of SSF value chains. We have implemented a protocol within the context of Albania, tailored to the specific characteristics and stakeholders relevant to the Albanian context. The same people questioned stakeholders in each location (SSF communities, restaurants, and seafood shops). Each demographic class was represented by a sample, and each class also provided replies. Interviews were done with accessible fishermen. Following Di Cintio's methodology [18], questionnaires were produced for MPA managers, the Agency of Food Control (in Albanian: Agjensia e Kontrrollit Ushqimore - AKU), small-scale fishers, seafood/fish shops, and restaurants.
The questionnaires were different for each stakeholder segment. Those who were unable to be reached or refused to be polled were replaced with others from the same sample class. This technique ensured that all fishing gear usage groups in the baseline population were appropriately represented. The presence of key informants facilitated the vast majority of face-to-face surveys with fishermen. With a few exceptions, fishers were approached prior to the start of the interviews by MPA personnel, other researchers, or other fishermen. All information was acquired through direct interviews, with the exception of the Vlora AKU and Fishery Inspectorate representatives, who were interviewed in groups to gain their perspectives.
The survey was performed by the representative of WWF-Adria and the contracted expert in December 2020. Surveying activities lasted two weeks. The direct interviews were conducted by the project team members in the localities indicated in the map of the Karaburun-Sazani MPA (Albania), along the coast of Vlora bay. Small-scale fishers belong to communities close to the Fishing Port of Triport and the small-scale fishers communities of Orikum (Fishing Center Oriku and Marina Orikum, located in the village of Radhime, under the Municipality unit of Vlora, named Orikum), all of them near the MPA (Figure 1).
3. Results
3.1. Small-Scale Fishers Communities
Along the coast of the Bay of Vlora there are present almost three small-scale fishers communities, (Treport, Fishing Center Radhime and Marina Orikum) and the total registered small-scale fishers is about 40, though in the past it was reported that the number of the licensed small-scale fishing vessels was 50 [7]. Twelve fishers were interviewed, belonging to three different small-scale fishers’ communities. Four seafood shops are present in Vlore (from Treport to Orikum), while one of them represents a wholesaler; three representatives of them (including the wholesaler) were interviewed by the WWF-Adria project team. Also six of the 60 restaurants along the coast of the Bay of Vlora were included in the interview process (from Treport to Orikum). The coverage rate of the sampling activities is reported in Table 1.
As it is shown in the table, the coverage of the registered SS fishers resulted to be 35%, while the restaurants coverage was the lowest in the conducted survey and it included just 10% of the restaurants, though these restaurants represent the biggest and most famous one in the Vlora city. The seafood shops coverage was 75% and 1 of them represent also a wholesaler, which is located in the center of Vlora city.
3.2. Structure of the Seafood Supply Chain
In the Bay of Vlora coast there are present several small-scale fishers communities, while not all the small-scale fisheries landings are conducted at adequate landing sites. It is just the case of the Fishing Port of Vlora (named Triport), where the landing areas are seriously risky for the health of the fishers. This is one of the reasons, which implies that in theory all the landed seafood is landed illegally. However, works have recently been completed for the construction of a new, legal and well infrastructure fish market inside the Fishing Port of Triport, despite it is still not known when it will be inaugurated.
After landing their catch, the small scale fishers of Fishing Port of Triport sell it either to the nearby restaurants, fishmongers or seafood shops, or directly to consumers on the quay. Most of the fishers of Triport never showed a preference regarding selling directly or selling it to the seafood shops, though (our observations) most of the catches were immediately sold to the fishmongers, who were waiting at the Fishing Port in order to immediately buy the total catch from the fishers (corresponding to small-scale and large scale fishing - LSF). During the trip to Fishing Port of Triport there were several points along the road where it was sold to the consumers on the quay. However, direct landing on the quay is illegal, because it happens without been part of taxation system and it means that do not respect the minimum sanitary requirements.
Differently happened with the fishers from the Fishing Center Oriku and those corresponding to the landing site of Marina. Half of them were selling exclusively to the seafood shop, while the others were selling it directly on the quay sometimes (most the time they were selling it to the Fishing Center Oriku, which represents the biggest seafood shop in Radhime village, close to the town of Orikum). It was noticed during the survey that some of the fishers of Treport were able to transport their seafood catches for selling it to the Fishing Center Oriku.
Based on the interviews results and observations, it was possible to design a graphic (Figure 2) showing the structure of the small scale (or differently known as artisanal fisheries in the Mediterranean countries) value chain in Vlore (including Orikum, Vlore City and Treport), all the area, which is close to the MPA of Karaburun-Sazani.
Most of the seafood shops representatives were interested to buy from the wholesaler, only in the case of imported seafood products, while the 3 seafood shops and 1 wholesaler (in this case selling to the restaurant with the same price as the seafood shop) were selling to the restaurants the seafood locally fished by the fishers.
No formal contract is signed between fishers and seafood shops. The fishers are free to choose their preferred sale channel according to the conditions they are offered. As a general procedure, the fishers deliver the catch to the seafood shop, and both agents write down the amount and composition of the seafood. The sale price is agreed by the fisher and the shop representative, while the only service provided by the seafood shop to the fishers is represented by offering to them the ice (according to the fishers of Treport and Radhime; Treport is the name of the place while the name of the Fishing Port is Triport). The seafood shops (even the fishmongers in the case of Treport) pay immediately the fishers after getting their total catch from them.
According to the fishers, the seafood (including fish) price was subject to fluctuation during the year and the selling price to the seafood shops was dependent of seafood/fish dimensions; it means that it is used as indicator of seafood quality during their selling to the consumers or restaurants by the seafood shops.
3.3. Analyses of the Seafood Supply Chain
A large number of recreational fishers (including divers) fish both inside and beyond the MPA perimeter (in all MPA zones), sharing fishing grounds with small-scale fishers. This has a considerable impact on the local seafood businesses as some of these recreational fishers sell their catch illegally. All surveyed shops (n = 4) and restaurants (n = 6) sold mostly locally fished seafood, but during the peak tourist season of the summer, they are forced to sell imported and/or farmed seafood due to a lack of local supply to meet seafood demand, which is extremely high due to the high number of tourists who visit the area.
When fishers sell their product directly to consumers, they receive a greater sale price than when they sell it to fish stores (Table 2). Generally, the price increase varies for the different species and ranges from 11% for the greater amberjack (Seriola dumerilii) to 100% for the red porgy (Pagrus pagrus). There are also exceptions, the data show a price increase of more than 100% for the bogue (Boops boops), golden gray mullet (Chelon auratus), groupers and Atlantic mackerel (Scomber scombrus), while the highest price increase corresponds to Flathead grey mullet (Mugil cephalus) of 543%, which is known as a product shops have little or no interest in.
Fish stores pay fishers less than direct buyers and offer essential services such as obtaining the complete catch and supplying ice, boxes, and baits. They then add a markup to that price in order to benefit from their own sale. Such markups range from an additional 8-33% of the price paid to the fisherman.
In addition we analysed even the applied mark-up to the seafood price by the restaurants, which applied it to the price payed to local fishers or sometimes to fish shops, when it is insufficient from the fish shops to satisfy the seafood demands from the restaurants (Table 3). Normally, the mark-up ranges from the minimum of 4% corresponding to the second class of European seabass (Dicentrarchus labrax) (smaller the fish dimensions, less is the relative value) to the maximum of 100% for the second class European hake (Merluccius merluccius) or common sole (Solea solea), though there are exceptional cases regarding the restaurants average profits for species like second class red mullet, first class piper gurnard (Trigla lyra), shrimps (Aristaeomorpha foliacea and/or Farfantepenaeus aztecus) and common cuttlefish (Sepia officinalis).
Figure 3 depicts the differences in price gained by fishers when selling their catch to shops and when selling directly to clients on the quay. By far the biggest average mark-ups occur for those things that shops have little or no interest in (i.e., those for which the fishermen get paid very little), like the flathead gray mullet, Atlantic mackerel, bogue and golden grey mullet, whose corresponding sold price to the shop is below 2.0 €/kg. Regarding the other species, which price is higher than 2.0 €/kg, except the groupers, the applied average mark-ups to the price by the restaurants are equal or lower than 100%.
Figure 4 depicts the disparities between the prices gained by fishers when selling their catch to shops and the prices paid by customers to the comparable businesses. As is shown by the graphic the applied mark-up to the price by the shop of 20% represent the borderline between the species, which paid price to the local fishers by the fish shops is below 2.0 €/kg and the other ones, which were sold by the local fishers to the fish shop at a higher price. Even in this case, similarly to the fishers selling on the quay, the profits by the restaurants are the highest for the low value species, like the Atlantic mackerel and the grey mullet species.
In the Figure 5 are shown the differences between the price obtained by fishers and fish shops when selling their catch to restaurants and the price paid by the customers to the corresponding restaurants. As it is shown by the graphic the restaurants profits are not based on the species. For instance, there are species like European seabass (second class) which is paid to the fisher at a higher price than the one paid regarding shrimps (Aristaeomorpha foliacea and/or Farfantepenaeus aztecus), but the mark-up is much higher (133%) for the latter one, in comparison to the one corresponding to the European seabass (second class) (4%).
Furthermore we compared profits from the selling the locally fished seafood products along the value chain corresponding to SSF in the Vlora Bay, close to the MPA (Figure 6).
For all the considered common commercial species, the fish shops resulted to get the lowest profit from selling them, which ranges from 9% regarding the grouper, up to 20% regarding the European seabass (second quality), gilthead seabream (second quality) and white seabream (second quality). Regarding the small-scale fishers, those resulted to get the highest profit from selling on quay in comparison not only to the fish shops, but also to the restaurants, except some species like European hake (second quality), red mullet (both qualities), white seabream (second quality) and piper gurnard (first quality). Their profit ranges from 46% corresponding to the European hake (first quality), up to 118% regarding the groupers. In the case of the restaurants, the minimal profit corresponds to European seabass (second quality), while the highest profit corresponds to the red mullet (second quality). This also represents the highest observed profit from selling seafood products, in the comparisons between fishers, fish shops and restaurants.
4. Discussion
The analyses results shed light on the complex seafood supply chain in the Bay of Vlora, specifically focusing on small-scale fisheries (SSF) and their interactions with fish shops and restaurants. The study reveals important insights into the structure, practices, and profitability of this seafood supply chain.
As in [18], a multidisciplinary approach was employed throughout the study, with questions addressing the ecological, biological, and economical aspects of fisheries. Furthermore, questionnaires were conducted to include several types of local fisheries stakeholders, including both private (fishers, wholesalers, shops, restaurants) and public sectors (MPA staff, researchers, local health authority). Following the LEK methodology, interviews with key stakeholders allowed for the collection of a substantial amount of crucial data about the structure of SSF's value chains in a reasonably short period of time [18, 19].
The seafood supply chain of the KSMPA structure (Figure 2) and features were found to be similar to the three Italian MPAs in a research conducted by [18]. These MPAs include Porto Cesareo (Lecce, Apulia), Penisola del Sinis - Isola di Mal di Ventre (Oristano, Sardinia), and Capo Milazzo (Messina, Sicily). Similarly to the Italina MPAs, in the Albanian MPA (Karaburun-Sazani MPA), fishermen who sold their catch directly received a greater price than those who sold to fish stores or wholesalers.
However, direct sale by fishermen is not generally practiced for a variety of reasons, as noted by the fishermen themselves, particularly those from the two fisher communities in Orikum. The reasons are related to the time consuming of the selling activity, which requires an extra effort by the fishers, though fishers close to Triport were seen to sell it on the quay. In addition it required adequate infrastructures that often are not available, while in the case of fishers from Orikum, the adequate infrastructure is provided by the Fishing Center Oriku. The main reasons given by the majority of the fishers were that they rely heavily on seafood shops and wholesalers who can absorb and market all of their catch and supply inputs (such as ice, boxes, and bait), as well as to avoid competition and conflicts with other commercial categories or the local health authority. Furthermore, like with the three Italian MPAs [18], the local product competes heavily with seafood products unlawfully traded by non-professional fishers. Unlike the fishers in the Italian MPAs (from the [18] study), the Albanian interviewees stated that the influence of imported seafood products was less substantial in terms of earnings.
The per kilo price that fishermen may obtain has a significant influence on their lives and when fishers fix a higher price for some species than fish shops, which correspond to the low valued species (Table 2, Fig. 3), it seems a very efficient and smart marketing strategy, because from a market point of view, it is justified by the fact that buyers buying seafood from fishermen have the absolute knowledge that the product is fresh and local, and hence are willing to pay a premium price. Furthermore, fishermen receive a better price from the direct sale compared to the sale to the fish shops, particularly those products that shops have little or no interest in, such as the low value fish. (Table 2, Figure 3), like grey mullets and bogue. This demonstrates how a suitable market approach might be advantageous in commercializing these low-end products, which could become popular among customers once seafood is properly processed and marketed, though none of the interviewed small scale fishers declared interest or any experience in processing the locally fished seafood products.
Due to inadequate infrastructure, fishermen depend on fish store owners and wholesalers to supply them with ice. However, as evidenced by the results and emphasized by the RPOA-SSF [9], the provision of adequate infrastructure at landing points may give fishermen more chances to independently conduct their own commercial activity (such as ice machines and bait stores) and engage in direct sale, which can help fishermen increase profits from their catch.
Similarly to the three Italian MPA [18], the Albanian (Table 3, Figure 4) had a weak direct sales route to restaurants. It was implemented when it was insufficient from the fish stores to satisfy the seafood demands from the restaurants, implying that selling to restaurants is another option to perform direct sale and to further boost the fisher's profit.
Anyway, the initial stage in the value chain is the selling of the product from the fishermen to a customer (fish store, wholesaler, or final consumer) [18]. At this point, the seafood price (and hence the fisher's earnings) is quite dynamic and dictated by the fishers' function, negotiating strength within the community, catch volume, and preferred selling channel.
Logistic issues (e.g., difficult supply of boxes, ice, and baits) force fishers to rely on other commercial categories (e.g., fish shop owners and wholesalers), and fishers are frequently individualists who are unable to manage conflicts within their own category as well as with other commercial categories [8]. Each fisher pursues an individual interest, so a governance system should be in place to ensure that all actors act as a cohesive group [18]. These features were validated throughout the data collection process, proving the need for a small-scale fisheries management organization in the entire Vlora Bay.
Figures 3, 4, and 5 of the study illustrate how seafood prices fluctuate along the value chain. Additionally noted and crucial to consider is the expertise and experience of various stakeholders regarding the composition and arrangement of local value chains. Similar to the value chain analysis published for the Italian MPAs by [18], the first producer of goods or captures receives the lowest sale price per kilogram, while wholesalers and shops obtain the greatest pricing. In addition, though the profit margin for the fishers selling on the quay (Figure 6) was the highest for most of the locally fished species, in comparison to the other stakeholders, there was a pervasive sense of unhappiness with the existing situation, as well as resignation and mistrust regarding the many possibilities given to fishermen to revitalize their businesses, which suggest that work should be carried out to invert this trend [20].
It is important to note that small-scale fishers, in particular, should be more aware of their commercial power as critical pillars of the entire supply chain as well as providers of diverse, healthful, protein-rich, and fresh food that contributes significantly to everyone's nutrition in civil society [21-23]. Furthermore, it is indisputable that retailers and wholesalers relieve fishermen of the burden of commercializing their whole harvest after hours at sea, and these partners also supply ice, boxes, and bait. They pay fishers less than direct customers for their catch, and their profit margin is based on that differential, similarly to the study conducted by [18]. However, these stakeholders are significant because they can create a larger economic rent for the fishing supply chain in which they operate, even if these rents primarily benefit themselves, as mentioned by [24].
Small-scale fisheries management organizations must be established first because they can encourage the formation of cooperatives for the processing and marketing of seafood. Local seafood labeling programs can be a creative niche market strategy based on rising consumer preferences [25]. The improvement of seafood value chains and the diversification of business strategies can thus be greatly aided by the fisheries management organization [26].
Other interventions can be exchange experiences and visits, as successful methods to improve fisher skills through sharing lessons learned among peers, similarly to trainings and workshops for fishers, which have been organised by several organisations (including the WWF Adria and Albanian Center for Environmental Protection and Sustainable Development - ACEPSD) in the projects implemented so far along the Vlora Bay.
5. Conclusions
The comprehensive study of the SSF value chain in the Bay of Vlora, proximate to the Karaburun-Sazani MPA, provides a multi-layered understanding of the socio-economic dynamics at play within the region's seafood supply chain. Emphasizing the interconnectedness of fishers, seafood shops, restaurants, and the various other stakeholders, the research highlights the fluidity and intricacy of seafood commodification from catch to consumer.
It is apparent from the findings that small-scale fishers face numerous challenges, primarily related to the lack of infrastructure, which compels reliance on intermediaries for essential services such as ice, storage, and marketing of their catch. The resultant economic disadvantage is evident in the lower prices fishers receive compared to the premiums they could command through direct sales or enhanced infrastructure support.
The study also uncovers a competitive disadvantage for local fishers due to the influx of illegal fishing and imported seafood, which saturates the market and depresses the potential profits for legally operating local fishers. This situation is compounded by the absence of a unified fisheries management organization in the Bay of Vlora, which could advocate for the collective interests of the fishers, negotiate better terms, and foster a more cooperative approach to address common challenges.
Despite these adversities, the research identifies an opportunity for small-scale fishers to capitalize on the growing consumer preference for fresh and local seafood. By leveraging direct sales, fishers can attain higher profit margins, particularly with low-value species that command higher consumer prices when sold directly due to perceived freshness and quality.
The analysis of the supply chain further indicates that fish shops and restaurants apply a considerable mark-up to seafood prices, which is unsurprising in a capitalist market system. However, there is a pronounced disparity between the value captured by these intermediaries and that retained by the fishers themselves, signaling an imbalance in the distribution of economic benefits within the value chain.
In conclusion, the findings of this study call for a concerted effort to address the infrastructural deficits that limit the economic potential of small-scale fishers in the Bay of Vlora. The establishment of a fisheries management organization appears imperative, as it could play a catalytic role in enhancing the value chain for locally sourced seafood, promoting direct sales avenues, and improving the negotiating power of fishers. Furthermore, the adoption of local seafood labelling initiatives and the development of cooperative models for seafood processing and marketing could serve as innovative strategies to increase the economic rent for the entire supply chain, ultimately delivering a more equitable distribution of profits and fostering the long-term sustainability of the SSF in the region.
Author Contributions
RB: Conceptualization; Data curation; Investigation; Methodology; Validation; Writing - original draft, review and editing. PK: Investigation; Data curation; Project administration; Funding acquisition; Investigation; Methodology; Writing - original draft, review and editing. AP: Funding acquisition; Investigation; Data curation; Project administration. All authors read and approved the final manuscript.
Funding
This study was supported by World Wildlife Fund in the frame of the project WWF-Adria Project “Small Scale Fisheries 2 – Plastic project”, which aim was represented by improving the socio-economic condition of small-scale fishers in the Vlora Bay locally and Albania at the national level.
Acknowledgments
Our thanks go to fishers and all the other value chain stakeholders, who kindly contributed to the survey. We thank the anonymous reviewers for their careful reading of our manuscript and their many insightful comments and suggestions.
Conflicts of Interest
The authors declare no conflicts of interest.
References
- EU. Regulation (Eu) No 508/2014 of the European Parliament and of the Council, of 15 May 2014. [online] URL: 〈https://eur-lex.europa.eu/legal-content/EN/TXT/ HTML/?uri=CELEX:32014R0508&from=IT 2014.
- FAO. The State of Mediterranean and Black Sea Fisheries 2022. General Fisheries Commission for the Mediterranean. Rome, 2022. [CrossRef]
- Garcia Rodrigues, J.; Villasante, S. Disentangling seafood value chains: tourism and the local market driving small-scale fisheries. Mar. Pol. 2016, 74, 33–42.
- Jentoft, S. Walking the talk: implementing the international voluntary guidelines for securing sustainable small-scale fisheries. Mar. Stud. 2014, 13(16). [CrossRef]
- Lindkvist, E.; Wijermans, N.; Daw, T.M.; Gonzalez-Mon, B.; Giron-Nava, A.; Johnson, A.F.; van Putten, I.; Basurto, X.; Schlüter, M. Navigating complexities: agentbased modelling to support research, governance, and management in small-scale fisheries. Front. Mar. Scie. 2020, 6, 733. [CrossRef]
- Rosales, R.M., Pomeroy, R., Calabio, I.J., Batong, M., Cedo, K., Escara, N., Facunla, V., Gulayan, A., Narvadez, M., Sarahadi, M., Sobrevega, M.A. Value chain analysis and small- scale fisheries management. Mar. Pol. 2017, 83, 11–21. https://doi. org/10.1016/j.marpol.2017.05.023.
- Bakiu, R.; Cakalli, M.; Korro, K.; Di Franco, A.; Guidetti, P. Small-Scale Fisheries at an Albanian Marine Protected Area: A Collaborative Attitude is Associated with Higher Catches. Mar. Coast. Fish. 2018, 10, 527–535.
- Bakiu, R.; Moutopoulos, D. K.; Gurma, M.; Çakalli, M. Typology ofthe Albanian small-scale fisheries. Croat. J. Fish. 2022, 80, 26-37. [CrossRef]
- RPOA-SSF (Regional Plan of Action on Small Scale fisheries for the Mediterranean and the Black Sea) 2018. Malta. p. 7.
- Mclean, E.L.; García-Quijano, C.G.; Castro, K.M. Seeing the whole elephant–How lobstermen’s local ecological knowledge can inform fisheries management. J. Env. Man. 2020, 73. [CrossRef]
- Boubekri, I.; Mazurek, H.; Borhan, A.; Amara, D.R. Social-ecological dimensions of marine protected areas and coastal fishing: How fishermen’s local ecological knowledge can inform fisheries management at the future “Taza” MPA (Algeria, SW Mediterranean). Ocean Coast. Man., 2022, 221, 106121.
- Bender, M.G.; Machado, G.R.; da Silva, P.J.; Floeter, S. R.; Monteiro-Netto, C.; Luiz, O. J.; Ferreira, C.O.L. Local ecological knowledge and scientific data reveal overexploitation by multi-gear artisanal fisheries in the southwestern Atlantic. PLoS One. 2014, 9, e110332. [CrossRef]
- Lima, M.S.P.; Lins Oliveira, J.E.; de Nobrega, M.F.; Lopes, P.F.M. The use of local ecological knowledge as a complementary approach to understand the temporal and spatial patterns of fishery resources distribution. J. Ethno. Ethno, 2017, 13, 30. [CrossRef]
- Bakiu, R.; Peculaj, A.; Krstinic, P. Using local ecological knowledge of fishers to identify the presence and habitats of angelsharks in Albanian waters. Croat. J. Fish. 2023, 81, 139-146. [CrossRef]
- Zelasney, J.; Ford, A.; Westlund, L.; Ward, A.; Riego Pe˜narubia, O. Securing sustainable small-scale fisheries: Showcasing applied practices in value chains, post-harvest operations and trade. FAO Fish. Aqua. Tech. Pap. 2020, No. 652. Rome, FAO.
- Pita, P.; Fern´andez-Vidal, D.; García-Galdo, J.; Muí˜no, R. The use of the traditional ecological knowledge of fishermen, cost-effective tools and participatory models in artisanal fisheries: Towards the co-management of common octopus in Galicia (NW Spain). Fish. Res. 2016, 178, 4–12. [CrossRef]
- Rajkovic, Z.; Kromidha, G. Management Plan for National Marine Park Karaburun-Sazan. UNDP, 2014, 128 pp. + Annexes.
- Di Cintio, A.; Scianna, C.; Prato, G. Analysis of small-scale fisheries value chain: An interview-based approach in Italian marine protected areas. Fish. Res. 2022, 252, 106358. [CrossRef]
- Bjørndal, T.; Child, A.; Lem, A.; Dey, M.M. Value chain dynamics and the small scale sector: a summary of findings and policy recommendations for fisheries and aquaculture trade. Aqua. Econ. Man. 2015, 19, 148–173. [CrossRef]
- Phelan, A.; Ross, H.; Adhuri, D.S.; Richards, R. Equity in a sea of debt: how better understanding of small-scale fisheries can help reel in sustainable seafood. ICES J. Mar. Scie. 2023, 80 (8), 2222–2232. [CrossRef]
- Leroy, J.L.; Frongillo, E.A. Can interventions to promote animal production ameliorate undernutrition? J. Nut., 2007, 137, 2311–2316.
- Tacon, A.G.J.; Metian, M.; Fish matters: importance of aquatic foods in human nutrition and global food supply. Rev. Fish. Sci. 2013, 21, 22–38.
- ElDine, M.S.; AbdelAziz, S.I. Assessing the Value Chain of Small-Scale Fisheries in Egypt: Challenges and Opportunities. J. Log. Man. 2024, 12 (1), 1-5.
- Thủy, P.; Flaaten, O.; Skonhoft, A. Middlemen: good for resources and fishermen? Env. Dev. Econ. 2019, 24, 437–456.
- Fonner, R.; Sylvia, G.. Willingness to Pay for Multiple Seafood Labels in a Niche Market. Mar. Res. Econ. 2015, 30(1), 51-70. [CrossRef]
- Kalikoski, D.; Franz, N. Strengthening organizations and collective action in fisheries – a way forward in implementing the international guidelines for securing sustainable small-scale fisheries. FAO Workshop, 18–20 March 2013, Rome, Italy. FAO Fishe. Aqua. Proc. 2014, No. 32, Rome, FAO. pp. 168.
Figure 1.
Map of the Adriatic Sea basin indicating the location of area of study (while it is also indicated the Adratic Sea location in the Mediterranean Sea basin) and the National Marine Park of Karaburun-Sazan [17]. Black circles represent the communities of fishers, white circles represent the seafood shops/wholesalers and black squares represent the restaurants, in which were compiled the questionnaires in representatives’ presence during the survey.
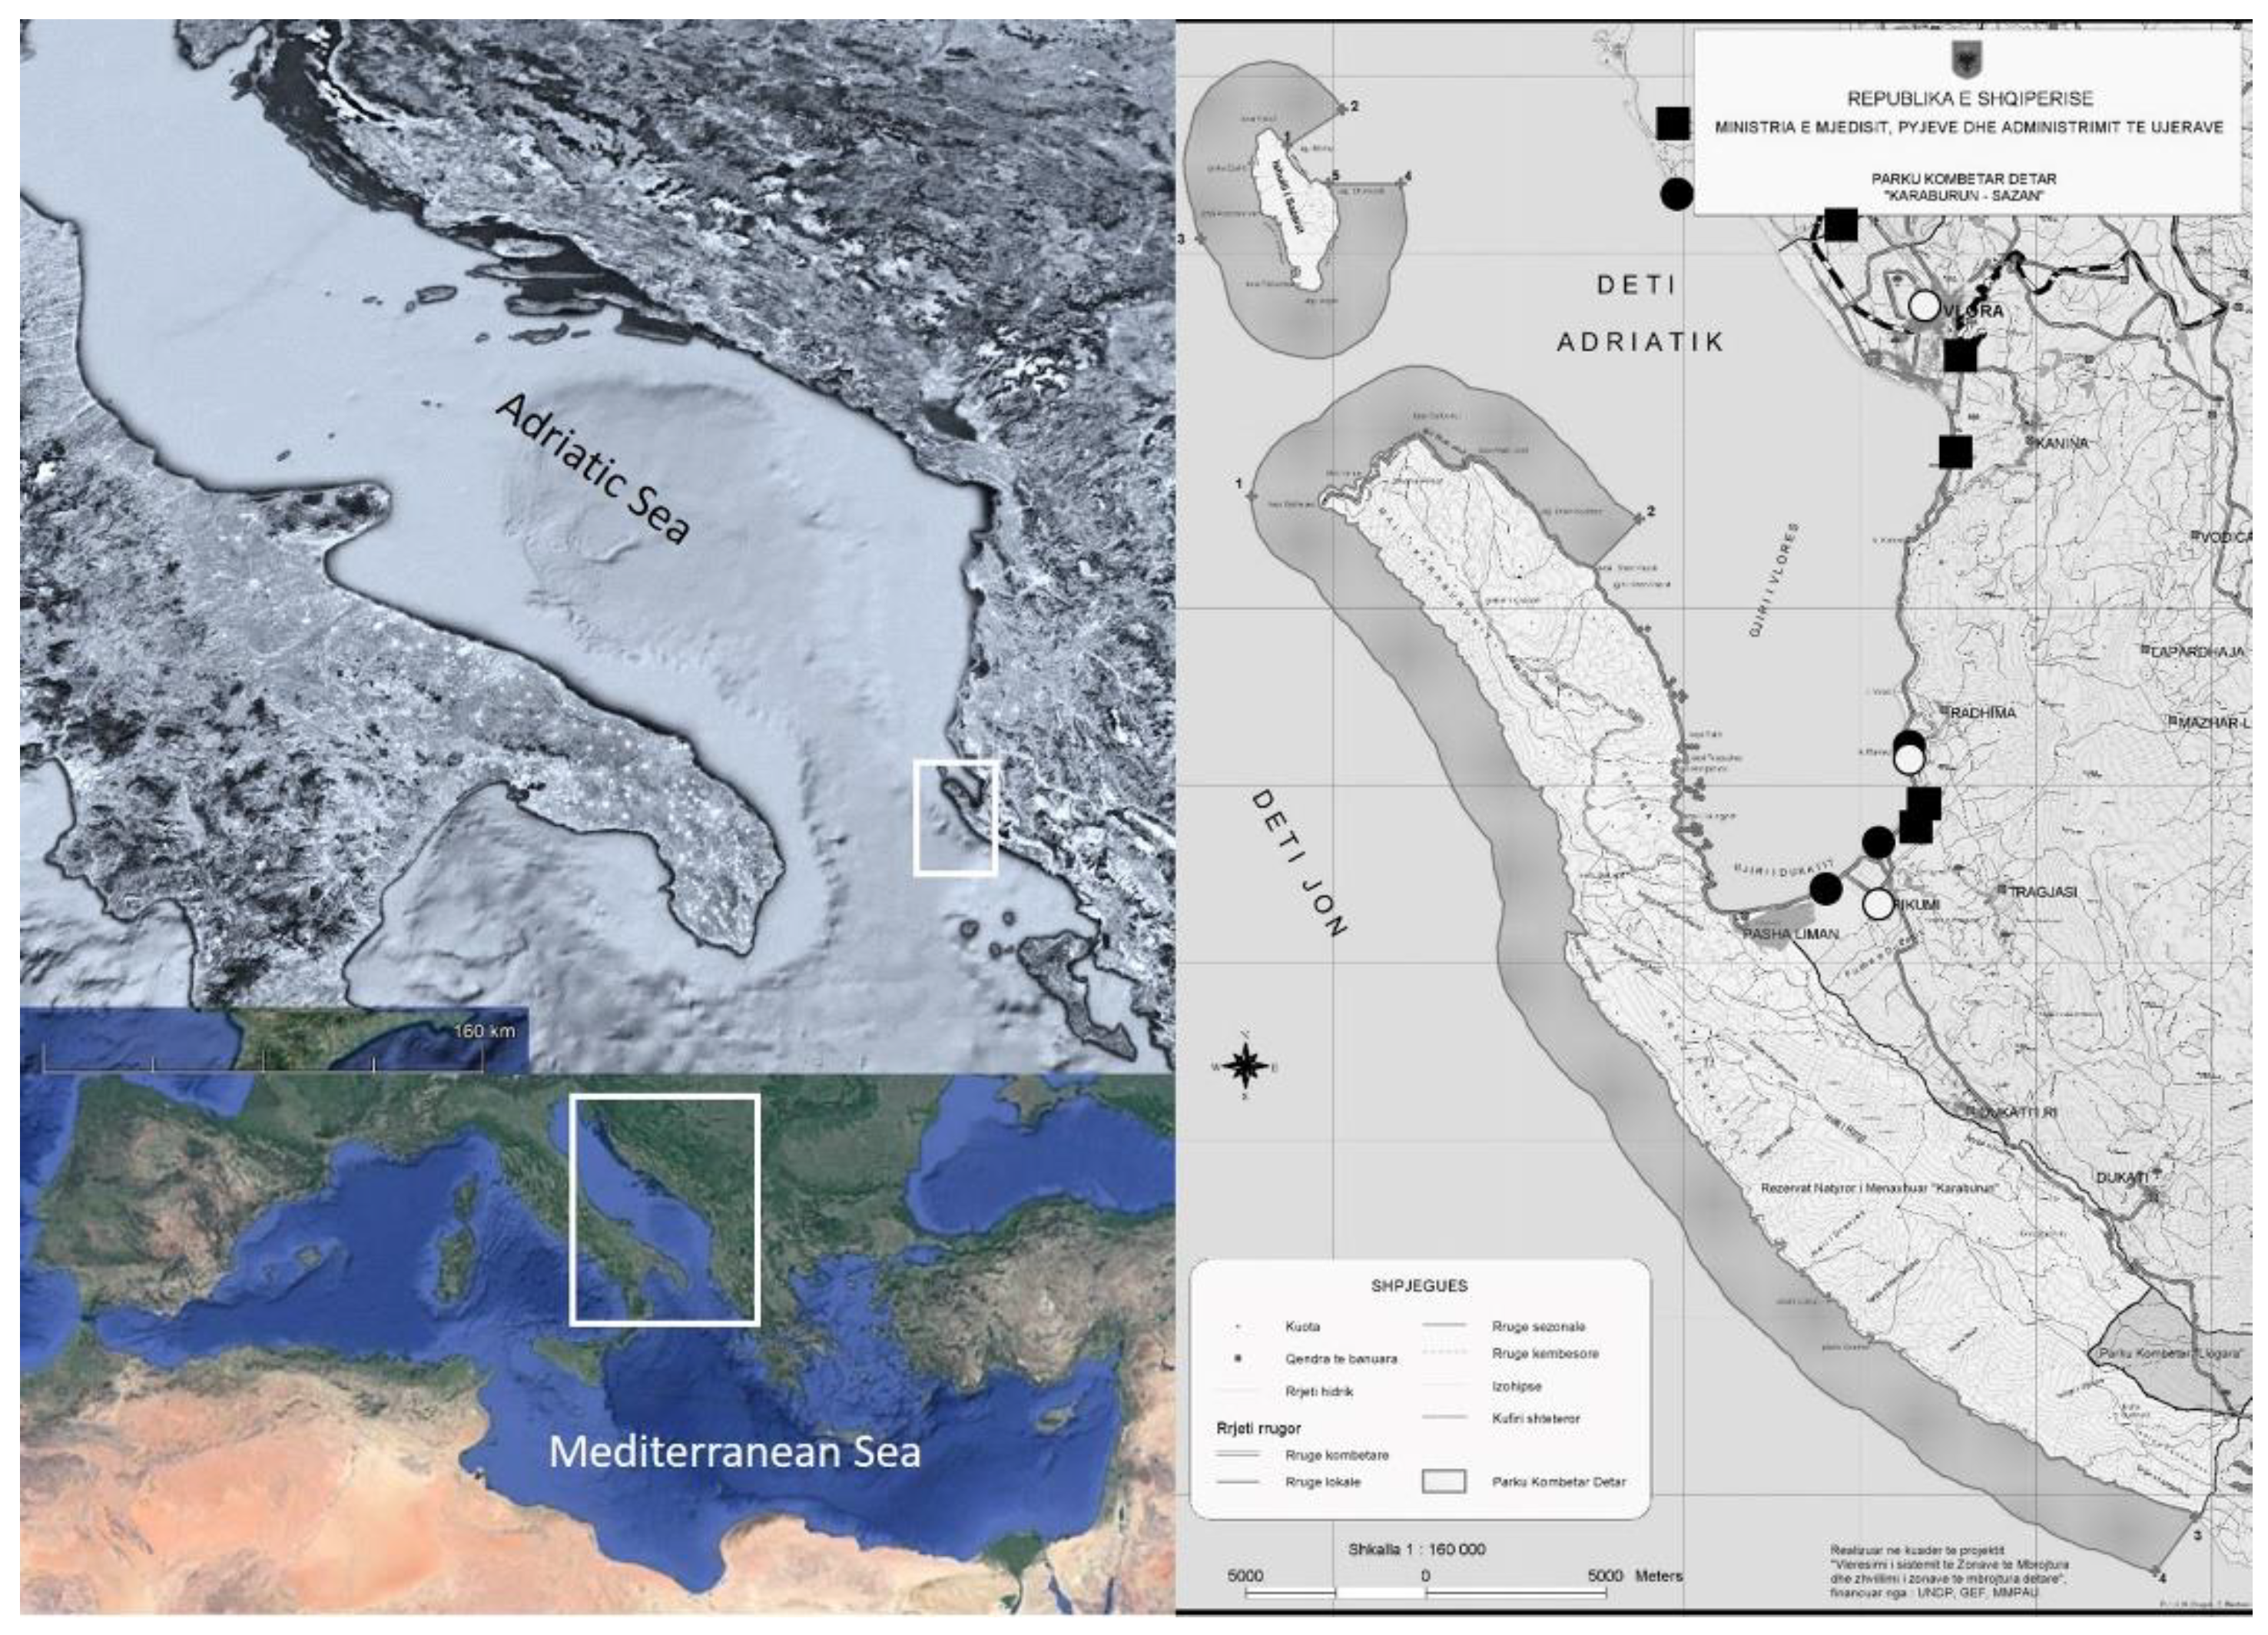
Figure 2.
Structure of the SSF (or differently named artisanal fisheries) value chain in Vlora Bay.
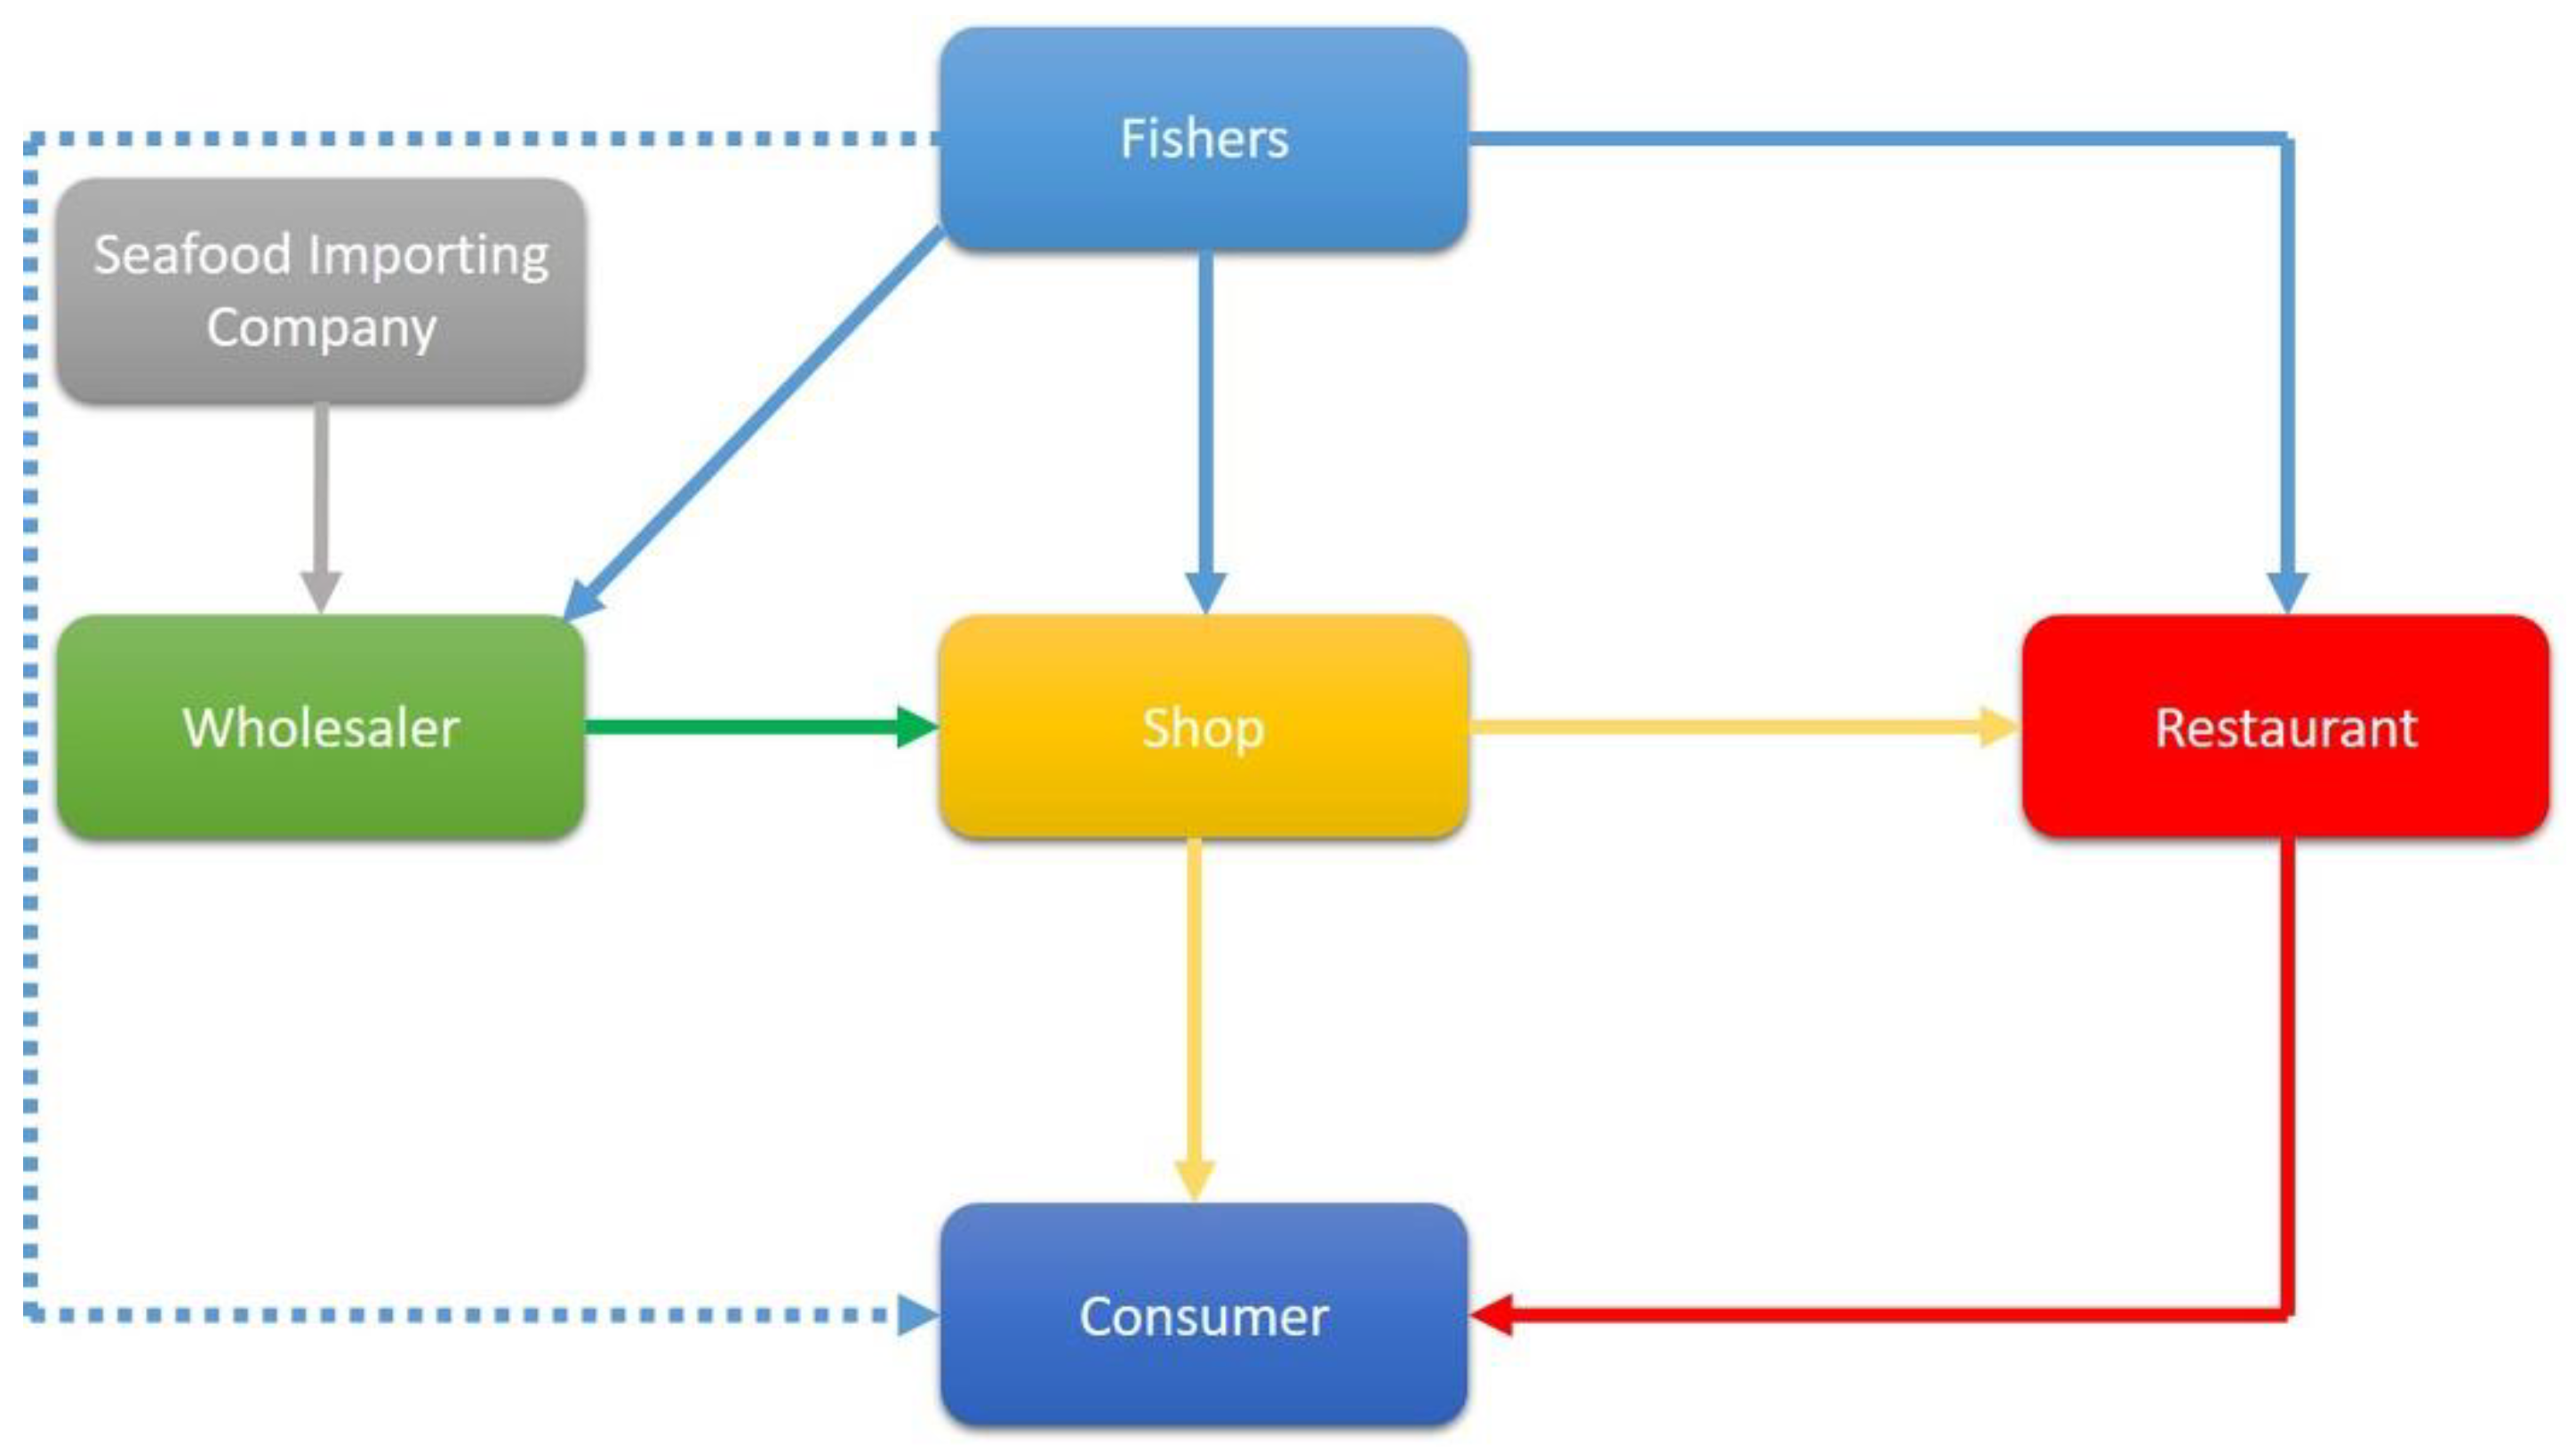
Figure 3.
Price increases in seafood value chains close to the MPA. The y-axis depicts the relationship between the ex-vessel price of seafood sold to retailers. The x-axis depicts the difference between the latter price and the price gained by fishermen when selling their seafood straight to clients. The highest price grows down the value chain and occurs for species for which fishers are compensated very little. The computation includes all species sold in Vlora Bay.
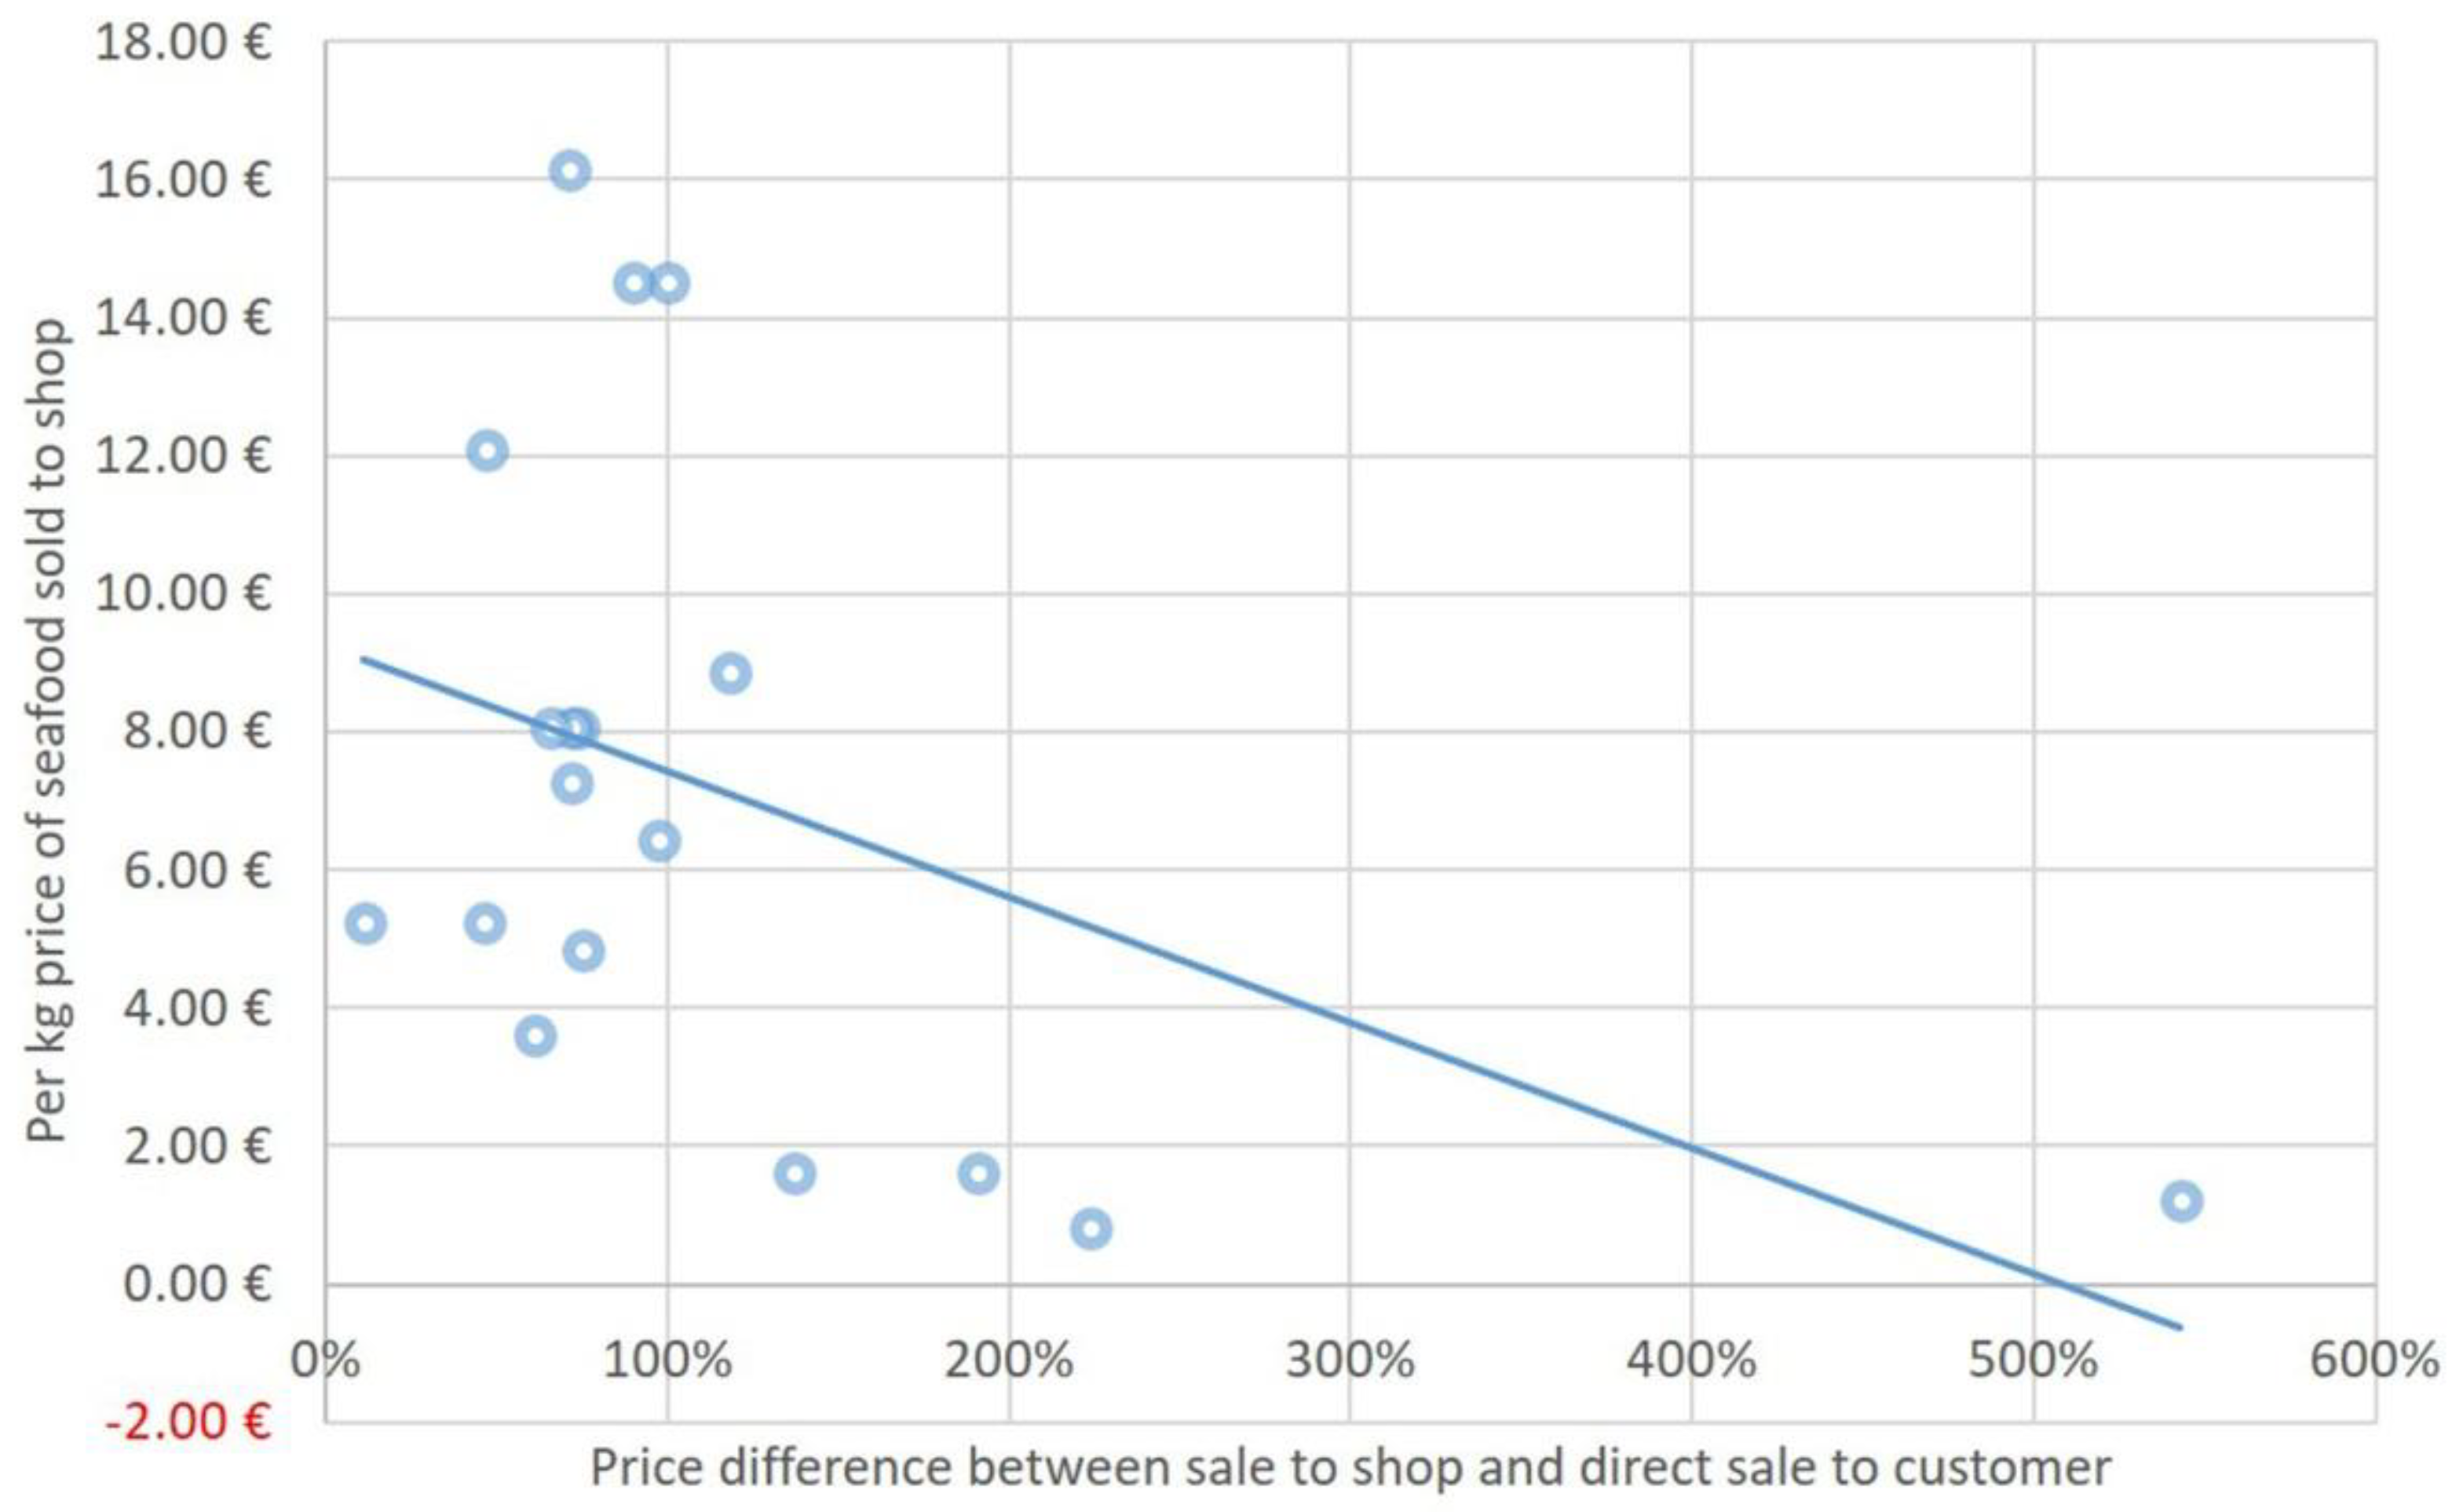
Figure 4.
Price increases in seafood value chains close to the MPA. The y-axis depicts the relationship between the ex-vessel price of seafood sold to retailers. The x-axis represents the difference between the latter price and the price paid by clients at the fish stores. The computation includes all species sold in Vlora Bay.
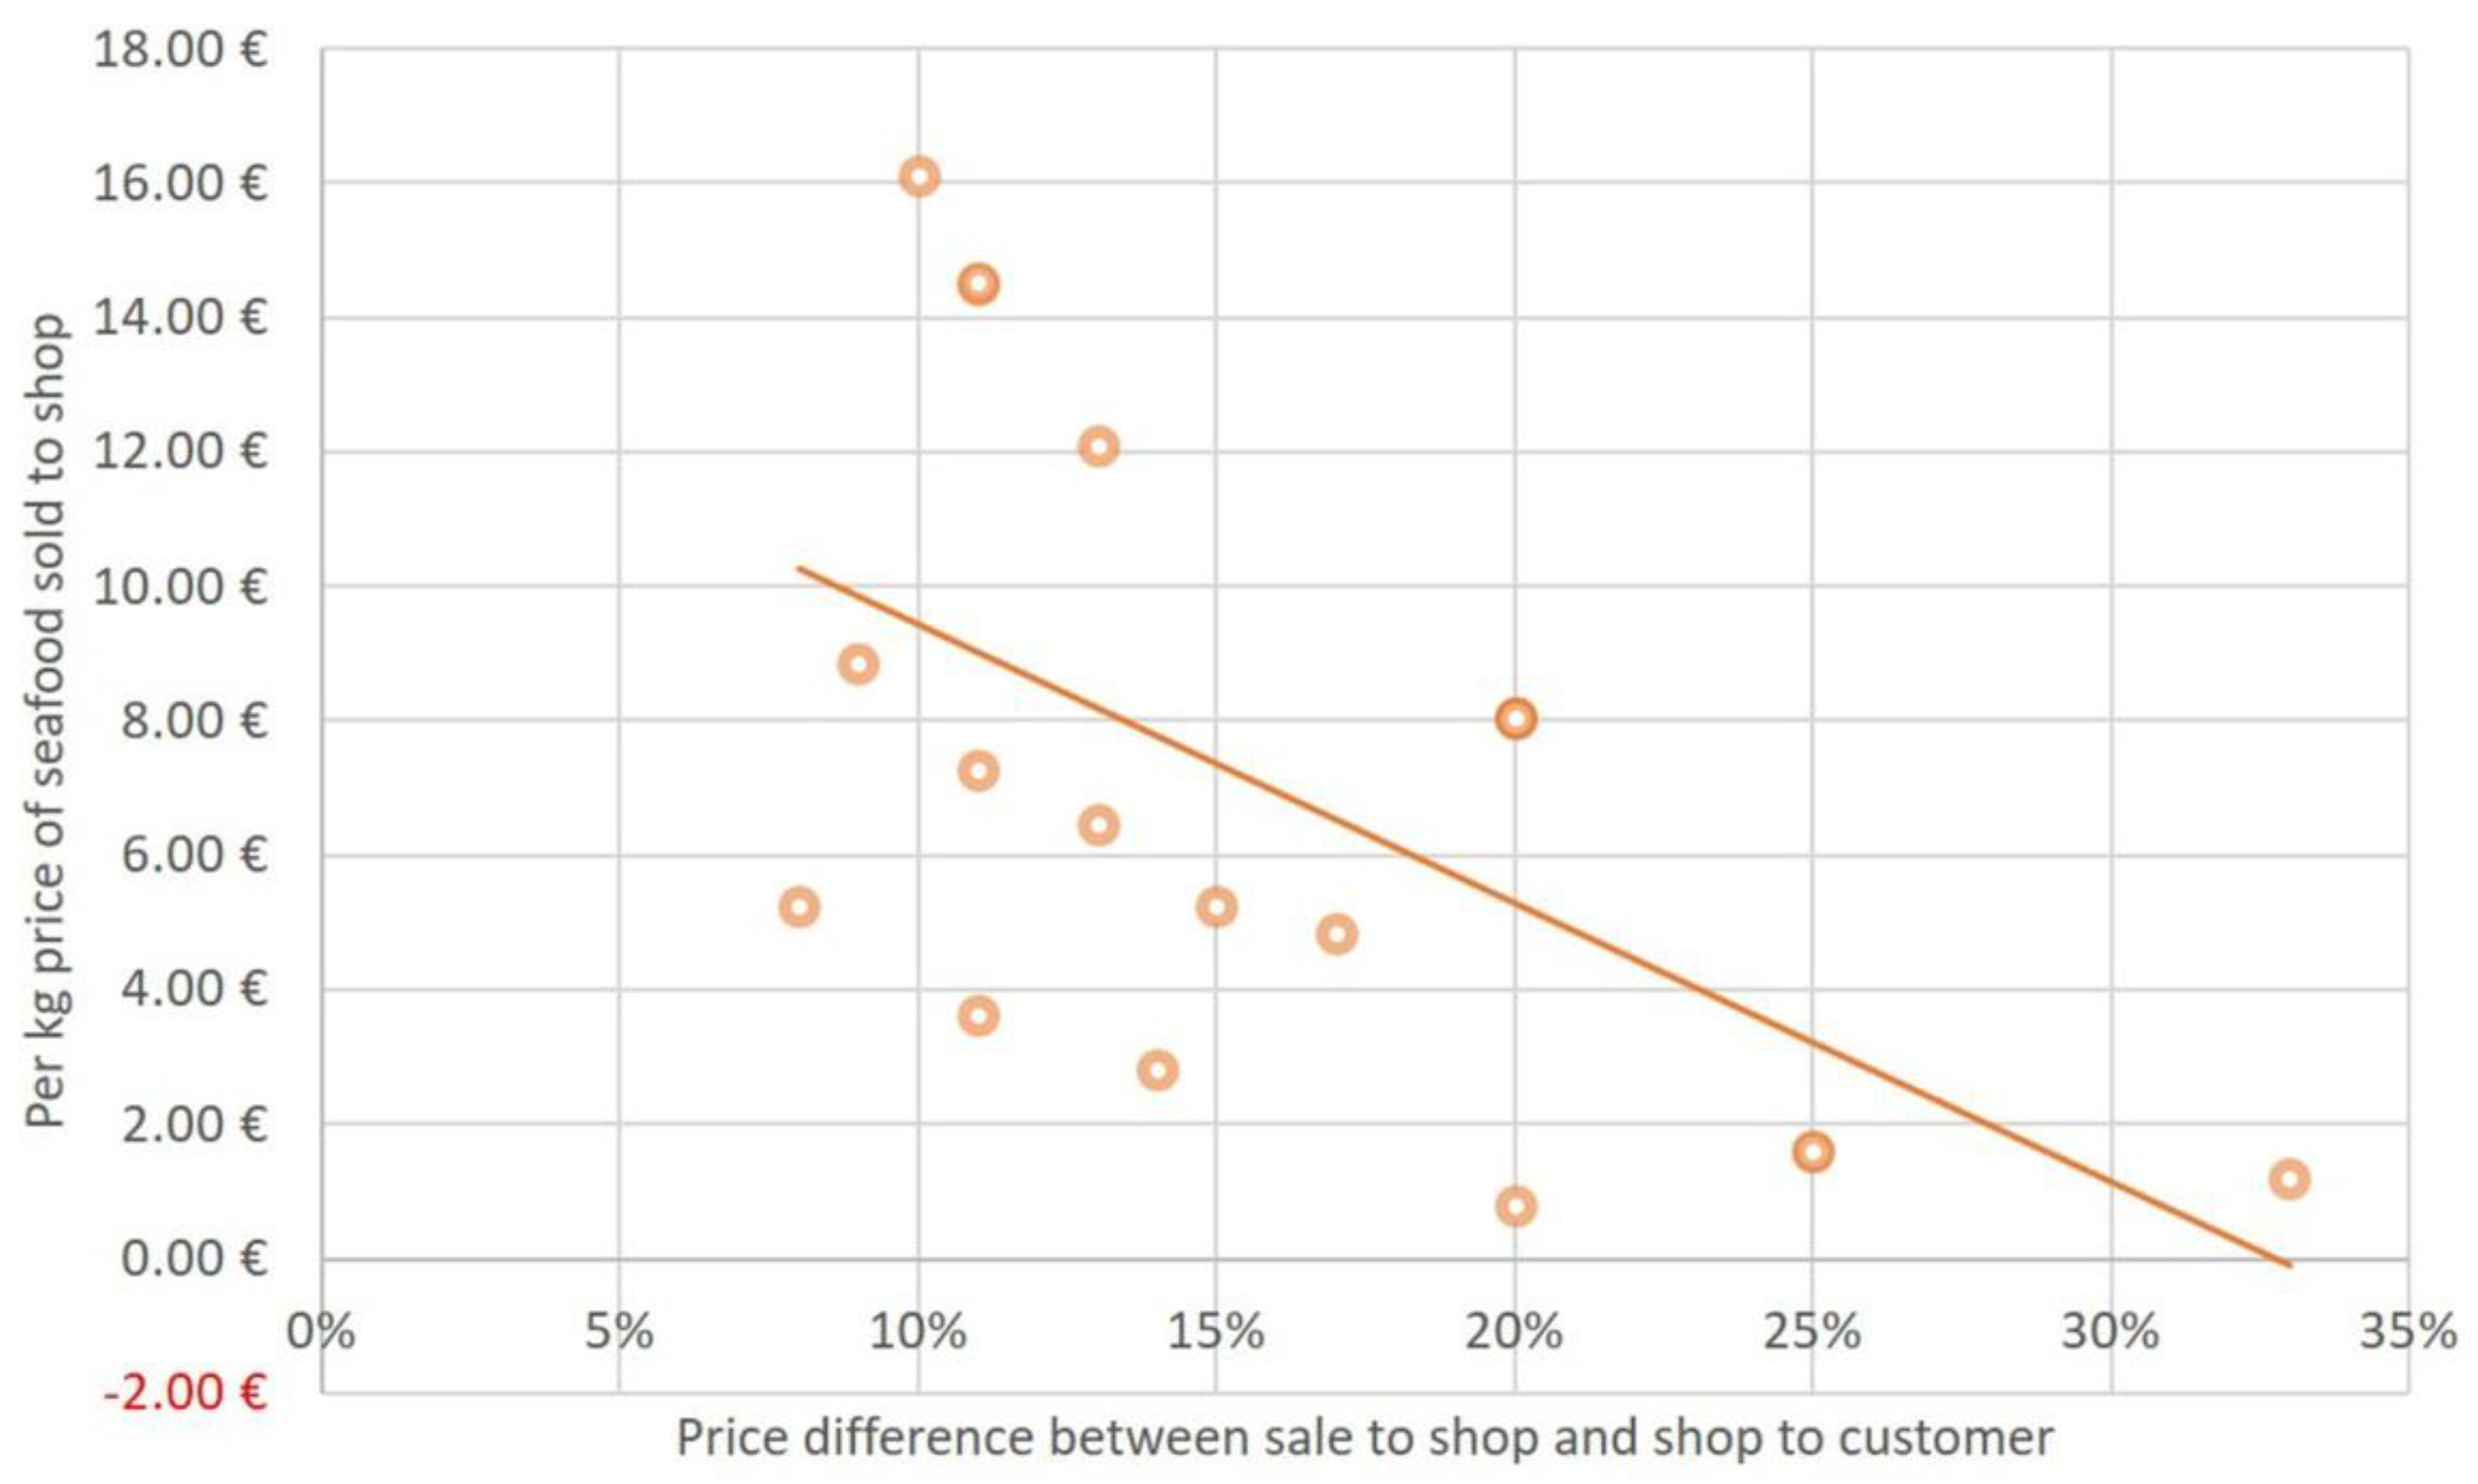
Figure 5.
Price increases in seafood value chains close to the MPA. The y-axis represents the relationship between the price of seafood sold to restaurants. The x-axis represents the difference between the latter price and the price paid by consumers at the eateries. The computation includes all species sold in Vlora Bay.
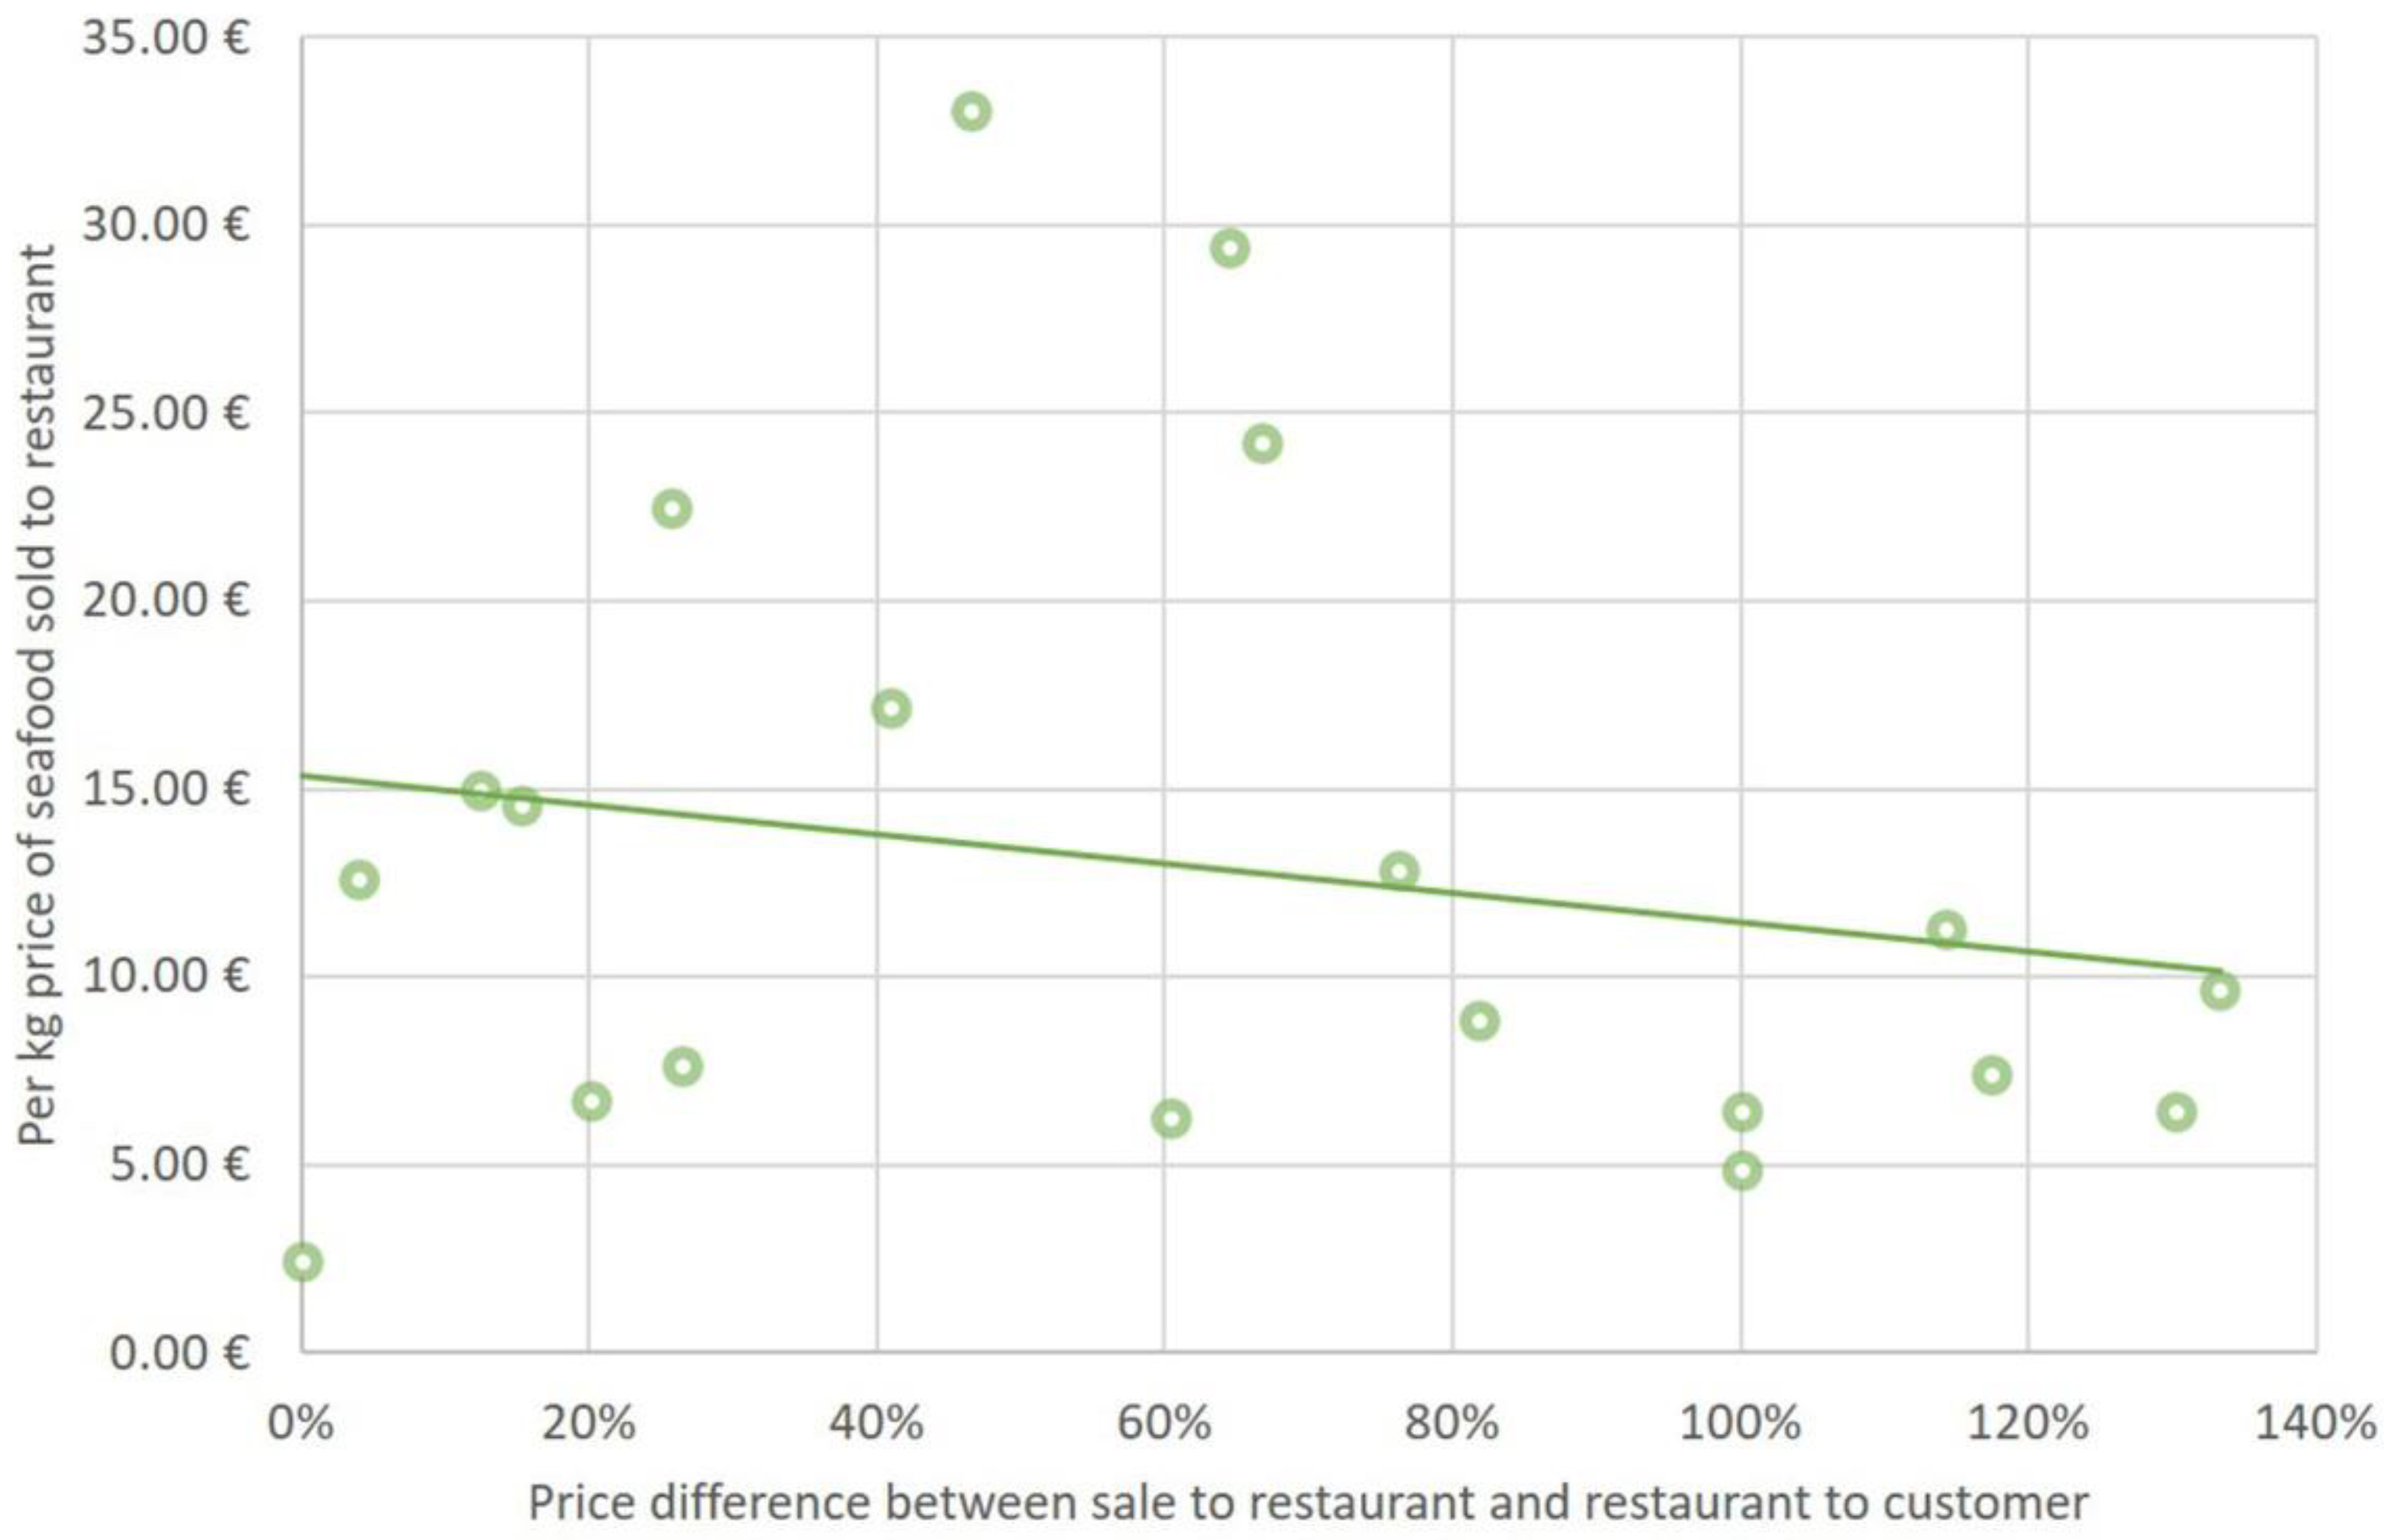
Figure 6.
Comparisons of the profits (in percentage) from the selling the locally fished seafood products along the Vlora Bay (close to the MPA of Karaburun-Sazani). In green, blue and yellow are shown the profits corresponding to fish shops, fishers (from selling their catch on the quay) and restaurants, respectively. Deep-water rose shrimp is not sold on the quay by the fishers and due to this reason it is missing from the graphic.
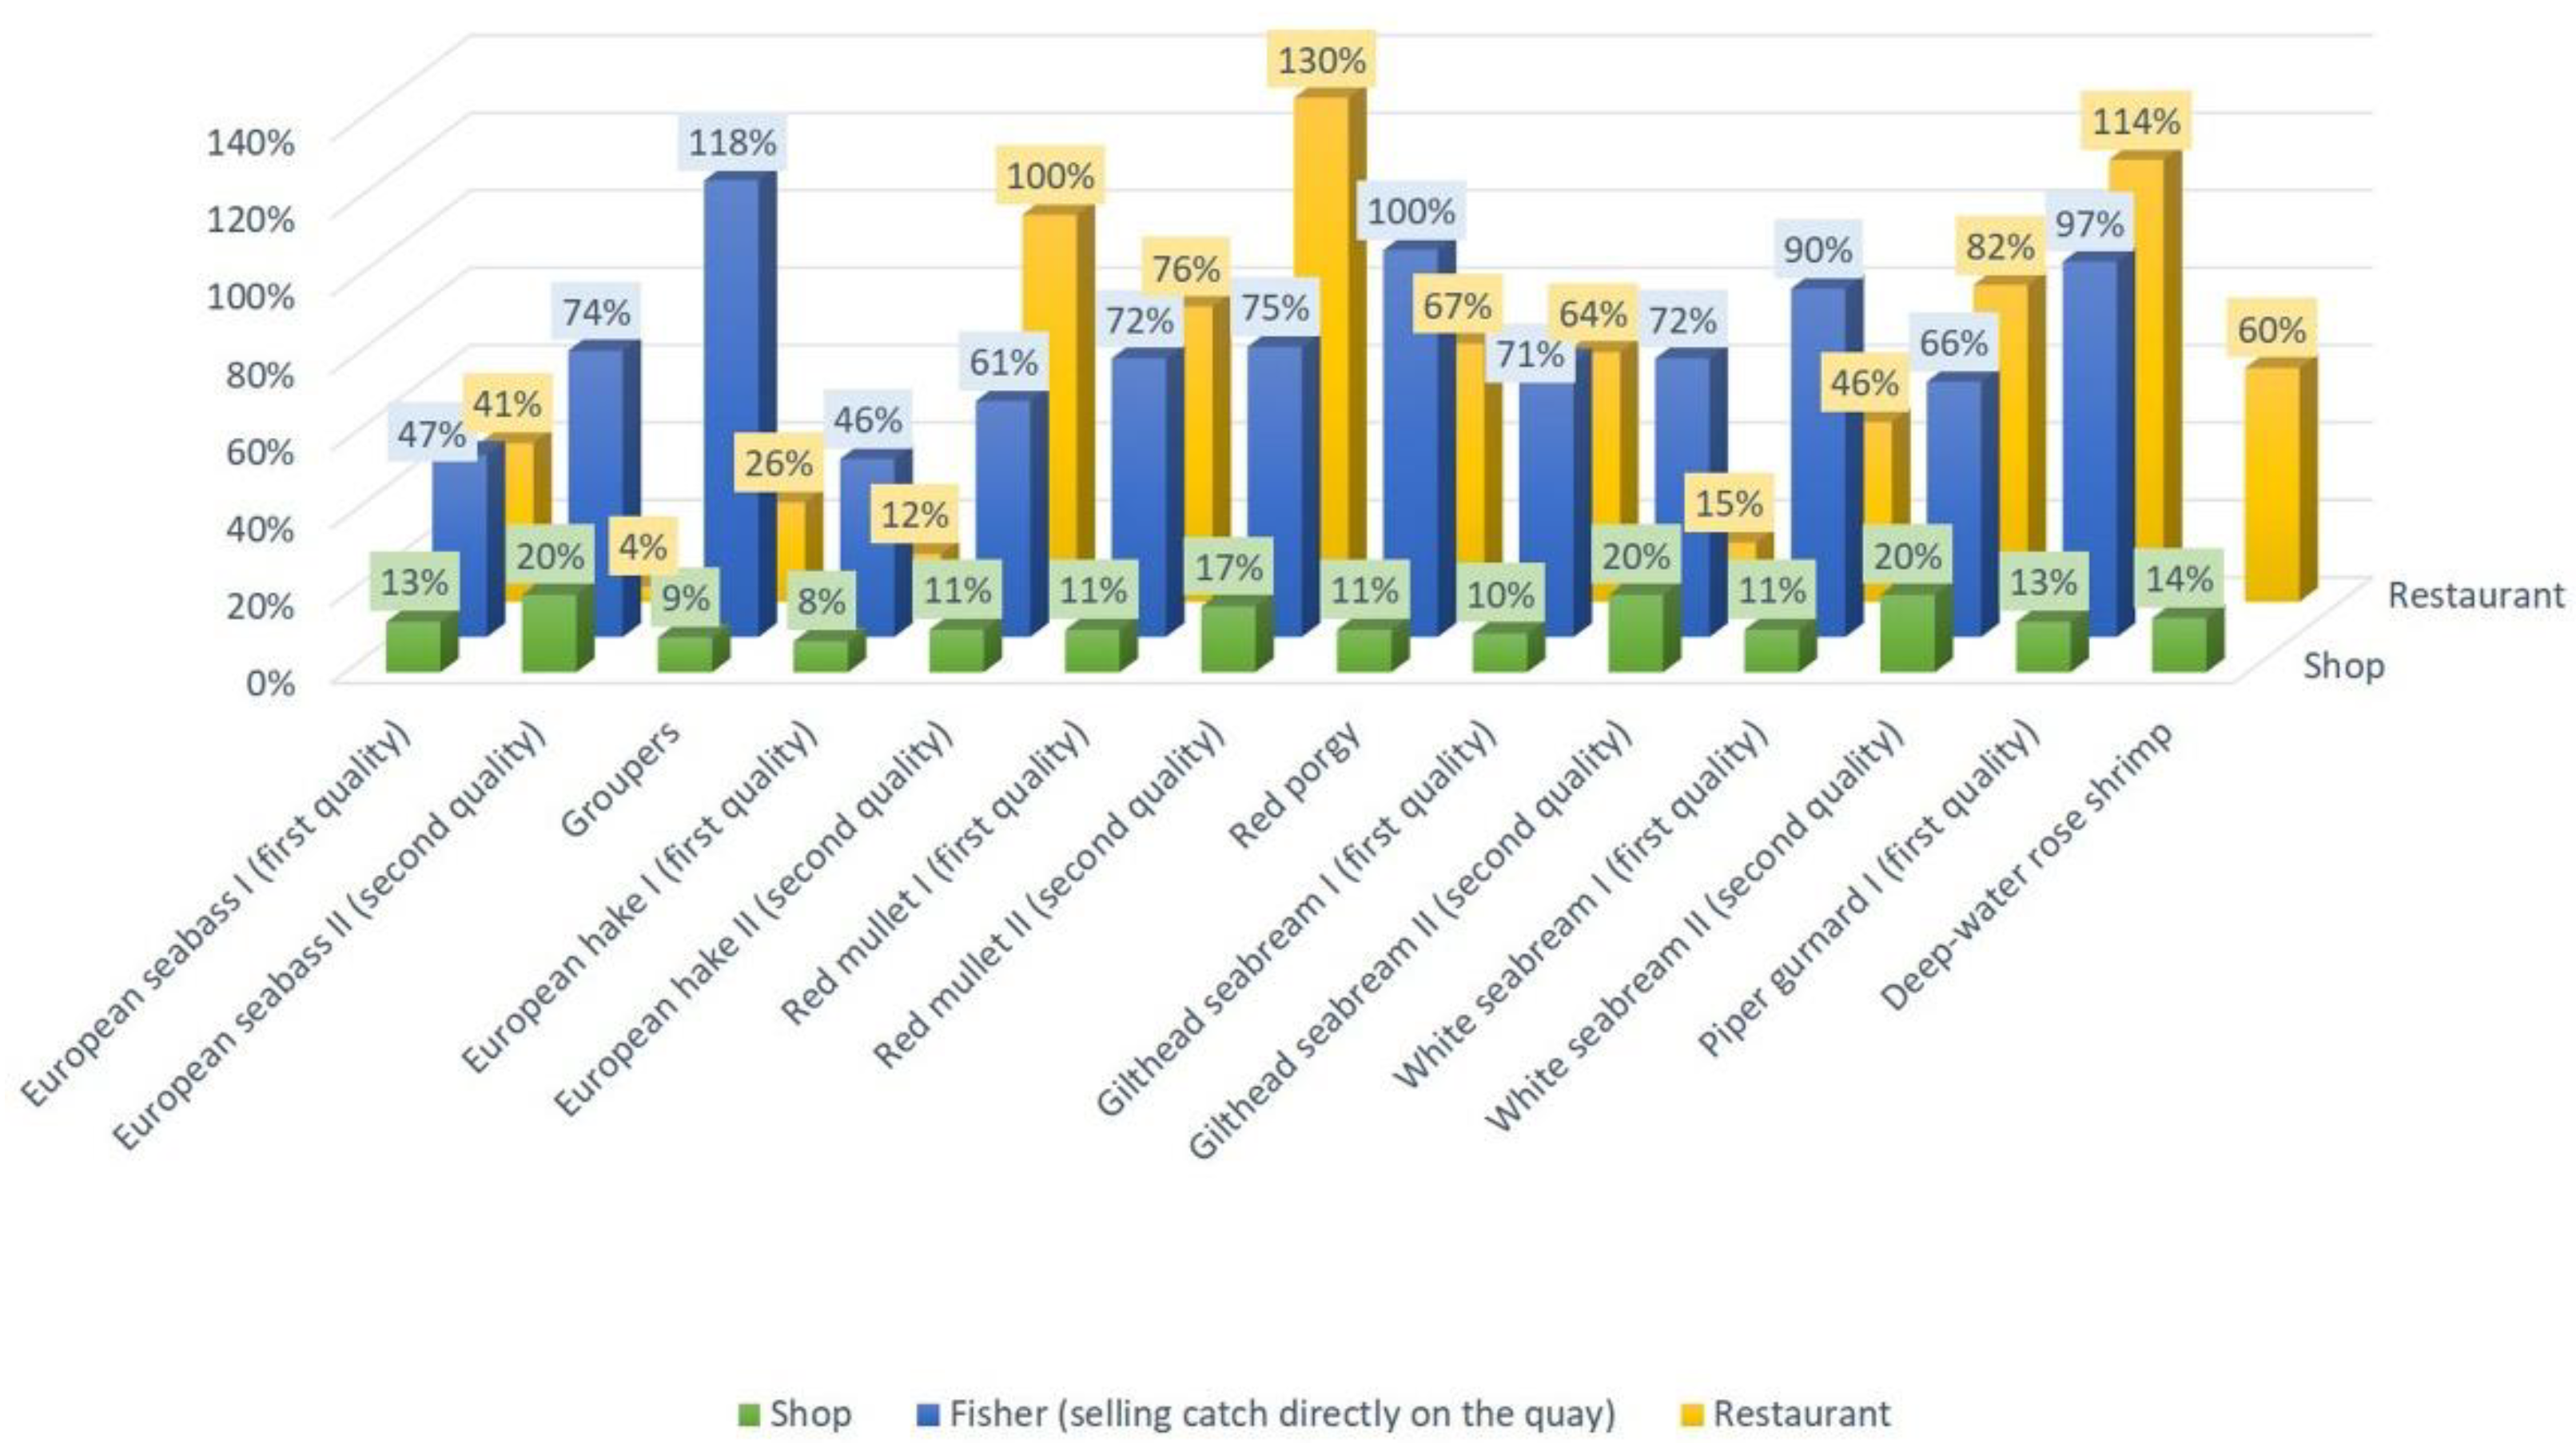

Table 1.
Coverage rate of the sampling activities (fishing and fishing-related activities) in Vlora Bay.
Table 1.
Coverage rate of the sampling activities (fishing and fishing-related activities) in Vlora Bay.
| Type of Fishing and Fishing-related Activities | Total | Sample | Sampled percentage |
|---|---|---|---|
| Registered Small-Scale Fishers (from Triport to Orikum) | 40 | 14 | 35% |
| Seafood shops | 4 | 3 | 75% |
| Restaurants (restaurants from Triport to Orikum) | 60 | 6 | 10% |
Table 2.
The average sale price in Vlore was observed when fishers sold their catch to a shop ("Fisher to shop"), when the businesses sold the catch to customers ("Shop to customer"), and finally when fishermen sold their catch directly on the quay ("Fisher to customer"). Numbers Fish sizes are classified as 1-3◦, with 1◦ being larger than 400 g and 2◦ ranging from 200-400 g. Larger fish are regarded to be of higher grade and so more valuable. However, size classes might vary from one species to another.
| Species | Scientific name | Fisher to shop | Shop to customer | % Price mark-up between fisher to shop and shop to customer | Fisher to customer | % Price difference between fisher toshop and fisher to customer (max) |
|---|---|---|---|---|---|---|
| Bogue | Boops boops | 0.81 € | 0.97 € | 20% | 2.26 ± 0.36 € | 224% |
| Golden grey mullet | Chelon auratus | 1.61 € | 2.02 € | 25% | 3.21 ± 0.60 € | 137% |
| European seabass 1◦ | Dicentrarchus labrax | 12.10 € | 13.71 € | 13% | 16.59 ± 1.22 € | 47% |
| European seabass 2◦ | Dicentrarchus labrax | 8.06 € | 9.68 € | 20% | 11.29 ± 2.70 € | 74% |
| Groupers | Epinephelus sp. | 8.87 € | 9.68 € | 9% | 15.67 ± 3.69 € | 118% |
| European hake 1◦ | Merluccius merluccius | 5.24 € | 5.65 € | 8% | 6.94 ± 0.72 € | 46% |
| European hake 2◦ | Merluccius merluccius | 3.62 € | 4.03 € | 11% | 5.44 ± 0.40 € | 61% |
| Flathead grey mullet | Mugil cephalus | 1.21 € | 1.61 € | 33% | 4.97 ± 2.81 € | 543% |
| Red mullet 1◦ | Mullus barbatus or Mullus surmuletus | 7.26 € | 8.06 € | 11% | 10.75 ± 1.74 € | 72% |
| Red mullet 2◦ | Mullus barbatus or Mullus surmuletus | 4.84 € | 5.65 € | 17% | 7.42 ± 1.05 € | 75% |
| Red porgy | Pagrus pagrus | 14.50 € | 16.13 € | 11% | 24.52 ± 4.48 € | 100% |
| Atlantic mackerel | Scomber scombrus | 1.61 € | 2.02 € | 25% | 4.03 ± 0.66 € | 191% |
| Greater amberjack | Seriola dumerili | 5.24 € | 6.05 € | 15% | 5.38 ± 0.42 € | 11% |
| Gilthead seabream 1◦ | Sparus aurata | 16.13 € | 17.74 € | 10% | 21.31 ± 6.24 € | 71% |
| Gilthead seabream 2◦ | Sparus aurata | 8.06 € | 9.68 € | 20% | 11.42 ± 2.47 € | 72% |
| White seabream 1◦ | Diplodus sargus | 14.52 € | 16.13 € | 11% | 21.43 ± 6.14 € | 90% |
| White seabream 2◦ | Diplodus sargus | 8.06 € | 9.68 € | 20% | 11.02 ± 2.32 € | 66% |
| Piper gurnard 1◦ | Trigla lyra | 6.45 € | 7.26 € | 13% | 11.69 ± 1.04 € | 97% |
| Deep-water rose shrimp | Parapenaeus longirostris | 2.82 € | 3.23 € | 14% | NA | NA |
Table 3.
The average sale price recorded in Vlore when fishers (including those who buy from stores) sell their catch to a restaurant ("Fisher/shop to restaurant") and restaurants sell the catch to customers ("Restaurant to customer"). The numbers 1-3◦ indicate the fish's size class, with 1◦ representing fish larger than 400 g and 2◦ representing fish between 200-400 g. Bigger fish are also thought to be of higher quality, making them more desirable. However, size classes can vary between species.
| Species | Scientific name | Fisher/shop to restaurant | Restaurant to customer | % Price mark-up between fisher/shop to restaurant and restaurant to customer (max) |
|---|---|---|---|---|
| European seabass 1◦ | Dicentrarchus labrax | 16.45 ± 0.72 € | 24.19 € | 41% |
| European seabass 2◦ | Dicentrarchus labrax | 9.78 ± 2.80 € | 12.5 ± 0.57 € | 4% |
| Groupers | Epinephelus sp. | 20.81 ± 1.65 € | 28.23 € | 26% |
| European hake 1◦ | Merluccius merluccius | 10.55 ± 4.4 € | 14.52 ± 2.28 € | 12% |
| European hake 2◦ | Merluccius merluccius | 4.84 € | 9.68 € | 100% |
| Red mullet 1◦ | Mullus barbatus or Mullus surmuletus | 10.65 ± 2.16 € | 22.58 € | 76% |
| Red mullet 2◦ | Mullus barbatus or Mullus surmuletus | 6.45 € | 13.71 ± 1.14 € | 130% |
| Red porgy | Pagrus pagrus | 24.19 € | 40.32 € | 67% |
| Gilthead seabream 1◦ | Sparus aurata | 25.81 ± 3.61 € | 48.39 € | 64% |
| Gilthead seabream 2◦ | Sparus aurata | 11.37 ± 3.2 € | 14.52 ± 2.28 € | 15% |
| White seabream 1◦ | Diplodus sargus | 26.41 ± 6.63 € | 48.39 € | 46% |
| White seabream 2◦ | Diplodus sargus | 8.87 € | 16.13 € | 82% |
| Piper gurnard 1◦ | Trigla lyra | 11.29 € | 24.19 € | 114% |
| Piper gurnard 2◦ | Trigla lyra | 2.42 € | 2.42 € | 0% |
| Common sole | Solea solea | 6.45 € | 12.90 € | 100% |
| European squid | Loligo vulgaris | 5.85 ± 0.86 € | 8.06 € | 20% |
| Common octopus | Octopus vulgaris | 6.85 ± 0.81 € | 9.68 € | 26% |
| Deep water rose shrimp | Parapenaeus longirostris | 4.84 ± 1.4 € | 8.87 ± 1.14 € | 60% |
| other shrimps | Aristaeomorpha foliacea and/or Farfantepenaeus aztecus | 9.68 € | 22.58 € | 133% |
| Common cuttlefish | Sepia officinalis | 6.85 ± 0.57 € | 16.13 € | 117% |
Disclaimer/Publisher’s Note: The statements, opinions and data contained in all publications are solely those of the individual author(s) and contributor(s) and not of MDPI and/or the editor(s). MDPI and/or the editor(s) disclaim responsibility for any injury to people or property resulting from any ideas, methods, instructions or products referred to in the content. |
© 2025 by the authors. Licensee MDPI, Basel, Switzerland. This article is an open access article distributed under the terms and conditions of the Creative Commons Attribution (CC BY) license (http://creativecommons.org/licenses/by/4.0/).
Copyright: This open access article is published under a Creative Commons CC BY 4.0 license, which permit the free download, distribution, and reuse, provided that the author and preprint are cited in any reuse.


