
Submitted:
27 March 2025
Posted:
28 March 2025
You are already at the latest version
Abstract
Bromodomain and Extra-Terminal (BET) proteins are crucial epigenetic regulators involved in transcriptional processes linked to cancer progression. Inhibiting these proteins has emerged as a promising therapeutic strategy, with OTX015, a potent BET inhibitor, showing promising efficacy against various cancer types. However, accurately predicting drug sensitivity across cancer cell lines remains a challenge. In this study, we present a machine learning-based approach to predict the half-maximal inhibitory concentration (IC₅₀) of OTX015 across various cancer cell lines using their gene expression profiles. By employing regression-based machine learning models, including Support Vector Machine (SVM), K-Nearest Neighbor (KNN), Extreme Gradient Boosting (XGB), Elastic Net (EN), and Neural Networks (NNET), we aimed to optimize prediction accuracy. The dataset was divided into subsets containing 10, 25, 50, 75, and 100 genes based on their correlation with IC₅₀ values, enabling a comprehensive evaluation of model performance across different data dimensions. The SVM model consistently demonstrated the best performance, achieving the lowest Mean Absolute Error (MAE) scores across all datasets, thereby proving most effective for predicting IC₅₀ values. This approach highlights the potential of integrating machine learning algorithms with gene expression data to enhance drug discovery and personalized medicine, particularly in the context of cancer research. Future work should focus on expanding datasets, optimizing feature selection, and evaluating additional machine learning approaches to improve prediction reliability and generalizability.
Keywords:
Machine Learning
; IC₅₀ Prediction
; Bromodomain Inhibitors
; OTX015
; Cancer Cell Lines
; Support Vector Machine
; Gene Expression
; R Programming
; Personalized Medicine
1. Introduction
Cancer remains a major global public health concern, ranking as the second leading cause of death worldwide. Projections indicate a dramatic increase in cancer cases by 2050, attributed to population growth, aging, and lifestyle factors [1]. However, advancements in early detection, treatment, and supportive care have significantly improved survival rates, with approximately 70% of cancer patients surviving at least five years after diagnosis, and 11% surviving for 25 years or more [2]. Despite progress in traditional treatments such as radiotherapy, surgery, and chemotherapy, advanced biotechnological approaches, including gene therapy, stem cell therapy, epigenetic-based therapies, and precision medicine, are increasingly recognized for their potential in cancer diagnosis and treatment [3].
The Bromodomain and Extra-Terminal (BET) protein family, particularly BRD2, BRD3, BRD4, and BRDT, plays a central role in transcriptional regulation and chromatin remodeling by recognizing acetylated histones. Overactivation of BET proteins is implicated in various cancers, including hematologic malignancies, neuroblastomas, breast cancer, and prostate cancer [4,5]. BET inhibitors (BETi) like OTX015, JQ1, and I-BET762 have demonstrated significant efficacy in preclinical and clinical studies by downregulating oncogenic transcription factors such as MYC, BCL-2, and E2F [6,7].
Machine learning (ML) has emerged as a powerful tool to accelerate drug discovery and precision medicine. Supervised learning, in particular, offers a promising approach for predicting drug responses by recognizing patterns within complex biological data [8,9]. The use of programming languages such as R, alongside comprehensive repositories like Bioconductor, facilitates the development of robust models to predict drug efficacy based on genomic data [10].
In this study, we aimed to develop predictive models for estimating the half-maximal inhibitory concentration (IC₅₀) of OTX015 across various cancer cell lines, leveraging gene expression profiles and regression-based ML techniques. Among the models tested, the Support Vector Machine (SVM) consistently achieved the lowest Mean Absolute Error (MAE), outperforming other models across multiple datasets. These findings suggest that ML models, particularly SVM, hold great potential for enhancing drug discovery and personalized medicine. Future research should focus on refining these models, expanding datasets, and integrating diverse machine learning approaches to improve prediction accuracy.
2. Results
This study employed five regression-based machine learning models to predict the half-maximal inhibitory concentration (IC₅₀) values of the compound OTX015 across various cancer cell lines. The selected models were Elastic Net (EN), K-Nearest Neighbor (KNN), Neural Networks (NNET), Support Vector Machine (SVM), and Extreme Gradient Boosting (XGB). The prediction performances of these models were assessed based on their Mean Absolute Error (MAE) scores, which serve as a key metric for evaluating prediction accuracy.
2.1. The Impact of Data Dimensions on Model Performance
To investigate the impact of data dimensionality on model performance, the main dataset was divided into five subsets. Each subset contained a different number of genes, specifically 10, 25, 50, 75, and 100, selected based on their correlation with IC₅₀ values. This approach allowed for the evaluation of whether increasing or decreasing the number of genes influences the performance of prediction models. Table 1 presents the MAE scores achieved by each model across different data dimensions.
The performance of the OTX015 compound across different data dimensions is shown in Table 1.
The SVM model consistently demonstrated the best performance across all datasets, achieving the lowest MAE scores. This suggests that the SVM model is particularly suitable for predicting IC₅₀ values, even when the number of genes varies.
2.2. Evaluation of Error Dimensions of Models
Although MAE scores provide a general assessment of model performance, it is important to examine the distribution of errors across different cancer cell lines to ensure robustness. Individual errors for each model across all data groups are depicted in Figure 1.
Additionally, examining the frequency of errors allows for the identification of models that produce low-degree errors more frequently than high-degree errors. As illustrated in Figure 2, the SVM model showed the highest concentration of errors close to zero, indicating consistent predictive accuracy. This analysis confirms that the SVM model is particularly effective in minimizing prediction errors across various cell lines.
2.3. Comparison of Predicted and Actual IC50 Values
To further evaluate model performance, predicted IC₅₀ values were compared with actual values. The comparison graphs in Figure 3 illustrate the ability of each model to generalize predictions from training data. The results show that the SVM model is capable of producing predictions that closely align with actual values, demonstrating its generalization capability.
2.4. Performance of the SVM Model in Single Cell Line Predictions
Given the superior performance of the SVM model, additional evaluations were conducted to assess its predictive accuracy for individual cell lines. Each cell line in the validation set of the Data of 10 was considered as a single sample, and predictions were generated accordingly. The results for 76 cell lines are presented in Table 2.
The SVM model exhibited a low average error rate (MAE = 1.143), highlighting its robust performance even when applied to single cell lines. This finding demonstrates the suitability of the SVM model for predicting drug sensitivity on an individual cell line basis, enhancing its potential application in personalized medicine.
3. Discussion
The findings of this study highlight the efficacy of machine learning models, particularly the Support Vector Machine (SVM), in predicting the half-maximal inhibitory concentration (IC₅₀) of the compound OTX015 in various cancer cell lines. The use of gene expression profiles for prediction aligns well with current trends in precision medicine, where genomic data is utilized to tailor therapeutic approaches for individual patients [11,12].
The performance of the models across different data dimensions demonstrated that increasing the number of genes included in the dataset generally improved prediction accuracy, as reflected by lower Mean Absolute Error (MAE) scores. However, the improvement was not strictly linear, indicating that certain subsets of genes may provide more relevant information for predicting IC₅₀ values than others. This observation is consistent with the idea that the quality of features is more important than their quantity, a key concept in feature selection and model optimization [13,14].
The comparison of individual errors and error distributions across models showed that the SVM model consistently outperformed other models, achieving the lowest average errors and exhibiting a high concentration of errors near zero. This suggests that the SVM model is robust in minimizing prediction errors across various cell lines. Additionally, the strong performance of the Elastic Net model, which incorporates both L1 and L2 regularization, indicates that hybrid methods may also hold promise for enhancing prediction accuracy [15,16].
A critical observation in this study is the performance of the SVM model when applied to single cell line predictions. Despite training on a general dataset, the SVM model demonstrated strong predictive capabilities for individual cell lines, further supporting its suitability for personalized medicine applications. This finding is particularly significant, as personalized predictions can guide experimental studies towards prioritizing high-potential compounds and optimizing therapeutic strategies.
The results of this study are in agreement with previous research efforts aimed at developing predictive models for drug sensitivity using genomic data. For instance, Chiu et al. (2019) successfully applied neural networks and random forests to predict drug efficacy based on mutation and expression profiles of cancer cells [17]. Similarly, Su et al. (2019) demonstrated the potential of deep forest models to predict drug sensitivity from gene expression data [18]. Furthermore, Ding et al. (2019) highlighted the value of integrating machine learning algorithms with omics data to improve prediction accuracy and therapeutic efficacy [19].
Despite the promising results, certain limitations must be acknowledged. First, this study focused exclusively on predicting IC₅₀ values for a single compound, OTX015. While this approach allowed for a detailed evaluation of prediction models, it limits the generalizability of the findings to other BET inhibitors or unrelated drug classes. Expanding the analysis to include additional compounds would provide a more comprehensive evaluation of model performance. Second, the training datasets used in this study were derived from existing literature, which may lack diversity in terms of cancer cell lines, experimental conditions, and data quality. The reliance on publicly available datasets could introduce biases that may not accurately reflect real-world scenarios. Addressing this limitation would require integrating more diverse datasets, including those generated from patient-derived samples and primary tumor cells. Third, while the models demonstrated strong predictive capabilities on existing data, their performance on real-world patient-derived samples remains unexplored. Testing the models against clinical datasets or organoid models derived from patient tissues would be essential to validate their practical applicability in precision medicine. Finally, the current study utilized gene expression data as the sole feature set for prediction. Integrating other omics data types, such as proteomics, metabolomics, and epigenomics, could enhance prediction robustness by providing a more comprehensive representation of the molecular mechanisms influencing drug sensitivity.
Overall, the results of this study emphasize that the SVM model is the most appropriate choice among the models evaluated, due to its superior generalization capability and ability to provide consistent predictions across diverse datasets. Future research should focus on expanding the dataset to include additional cell lines and drugs, optimizing feature selection processes, and integrating various machine learning approaches to enhance prediction robustness.Moreover, the integration of biological pathway information and transcriptomic profiles could provide additional insights into the molecular mechanisms underlying drug sensitivity, further enhancing the applicability of machine learning models in precision oncology.
The findings of this study contribute to the growing body of research advocating the use of machine learning for predicting potential drug candidates and optimizing cancer treatment strategies. Continued efforts to refine predictive models and incorporate additional datasets will be essential to advance personalized medicine and improve therapeutic outcomes for cancer patients.
4. Materials and Methods
In this study, five different regression-based machine learning models were developed using the R programming language and R Studio to predict the IC₅₀ values of the bromodomain inhibitor OTX015 in cancer cell lines:
- IC₅₀ Values: The IC₅₀ values of OTX015 in cancer cell lines were obtained from the CancerRxGene (https://www.cancerrxgene.org/) data source. This data provides a crucial measure of the impact of OTX015 on cancer cell lines.
- Gene Expression Data: The gene expression levels of cancer cells were obtained from the Sanger Institute's Cancer Cell Lines Project (https://cancer.sanger.ac.uk/cell_lines) data source. These data allow for a detailed examination of the gene expression profile in cancer cells.
4.1. Comparison of Predicted and Actual IC50 Values
The collected IC₅₀ values and gene expression data underwent a series of preprocessing steps before being used for model training, testing, and validation. The preprocessing was conducted using the R programming language, employing various statistical and machine learning packages. The following steps were performed:
- Data Integration: IC₅₀ values and gene expression data were merged based on cancer cell lines. This step helped determine in which cancer cells IC₅₀ values were determined for the OTX015 compound and in which cells gene expression levels were measured.
- Feature Engineering: To determine the features used for model development, feature engineering was performed on the gene expression data. Only significant gene expression levels were selected. Each gene in the dataset was subjected to Pearson correlation with the IC₅₀ value. The relationships were ranked from highest to lowest based on the absolute value of the correlation, irrespective of whether the correlation was positive or negative. Genes with significant correlations to IC₅₀ values were selected in sets of 10, 25, 50, 75, and 100 to evaluate the impact of data dimensions on the models, resulting in five different new datasets.
- Data Scaling: Rescaling the data often improves model performance by reducing error rates, depending on the nature of the problem, data, and models. Therefore, rescaling was applied to all five models used in this study. This contributed to better model performance and lower error rates.
- Creation of Training, Testing, and Validation Data: To evaluate the model's performance on a dataset it had not seen before, the dataset was randomly split before model training. 80% of the data (314 samples) was used for training and testing, and 20% (76 samples) was used for validation. The validation data set was reserved for assessing the model’s performance and was not used during the training or optimization stages. Cross-validation was performed using the training data. In cross-validation, the value of k was set to 5, creating five different training and testing sets during model training.
4.2. Model Training, Utilization, and Evaluation
In this study, five different regression-based machine learning models were implemented using the R programming language and relevant libraries to predict the IC₅₀ values of the bromodomain inhibitor OTX015 in cancer cell lines based on gene expression profiles. Each model was developed using its respective R package, leveraging their built-in functions for model training and evaluation. The selected models, along with their corresponding R libraries, are as follows:
- K-Nearest Neighbor (KNN) – implemented using the kknn package
- Extreme Gradient Boosting (XGB) – implemented using the xgboost package
- Elastic Net (EN) – implemented using the glmnet package
- Neural Networks (NNET) – implemented using the nnet package
- Support Vector Machine (SVM) – implemented using the e1071 package
These five regression models were trained separately using the same dataset and their performances were compared using the same validation set. Model training and evaluation were conducted in R Studio, utilizing the caret package for workflow standardization, hyperparameter tuning, and cross-validation.
During model training, hyperparameter optimization was performed for key parameters influencing model performance, ensuring that each model was fine-tuned for optimal accuracy. The optimal hyperparameters were determined based on the Mean Absolute Error (MAE) calculated using Equation (1)
MAE was used to compute the mean of the absolute differences between the predicted and actual values. The parameters with the lowest MAE scores were selected as the optimal hyperparameters to maximize model performance. The models were then retrained with these optimal parameters and the same training set, and these retrained models were considered the best-performing models.
After optimization, the performance of the best models was evaluated using the validation set, which comprised 20% of the initial data that was not used during training. The MAE score was used for this evaluation. The MAE scores facilitated the comparison of model performances across different data sizes as well as among the five different machine learning models. The MAE scores obtained by the models on the validation sets are presented in Table 2. The entire workflow is illustrated in Figure 4.
5. Conclusions
This study demonstrated that the Support Vector Machine (SVM) model provides the most accurate predictions of IC₅₀ values for the BET inhibitor OTX015 in cancer cell lines compared to other models. Its strong performance across varying gene expression datasets highlights its potential for drug discovery and personalized oncology.However, the study's limitations include its focus on a single drug, reliance on literature-derived datasets, and lack of validation with real-world patient-derived samples. Future research should include diverse datasets, integrate additional omics data, and validate predictions using clinical and organoid-based systems. The SVM model's reliable performance makes it a promising tool for drug response prediction, contributing to the advancement of precision oncology and improving therapeutic strategies.
Author Contributions
Con-ceptualization, Uğur Bilge, M. Okan Çakır, Mustafa Özdoğan and Gizem Tutkun; methodology, Uğur Bilge and Gizem Tutkun; software, Gizem Tutkun.; validation, Uğur Bilge; formal analysis, M. Okan Çakır; investigation, Uğur Bilge and M.Okan Çakır.; resources, Gizem Tutkun; data curation, Uğur Bilge; writing—original draft preparation, Gizem Tutkun.; writing—review and editing, M.Okan Çakır and Mustafa Özdoğan; visualization, Gizem Tutkun; supervision and project administration, Uğur Bilge. All authors have read and agreed to the published version of the manuscript.
Funding
This research received no external funding.
Conflicts of Interest
The authors declare no conflicts of interest.
Abbreviations
The following abbreviations are used in this manuscript:
| BET | Bromodomain and Extra-Terminal |
| BETi | BET inhibitors |
| ML | Machine Learning |
| SVM | Support Vector Machine |
| KNN | K-Nearest Neighbor |
| XGB | Extreme Gradient Boosting |
| EN | Elastic Net |
| NNET | Neural Networks |
| MAE | Mean Absolute Error |
| IC₅₀ | Half-maximal Inhibitory Concentration |
References
- Siegel, R.L.; Miller, K.D.; Fuchs, H.E.; Jemal, A. Cancer Statistics, 2021. CA Cancer J Clin 2021, 71, 7–33. [Google Scholar] [CrossRef] [PubMed]
- Tonorezos, E.; Devasia, T.; Mariotto, A.B.; Mollica, M.A.; Gallicchio, L.; Green, P.; Doose, M.; Brick, R.; Streck, B.; Reed, C.; et al. Prevalence of Cancer Survivors in the United States. JNCI: Journal of the National Cancer Institute 2024. [Google Scholar] [CrossRef] [PubMed]
- Kaur, R.; Bhardwaj, A.; Gupta, S. Cancer Treatment Therapies: Traditional to Modern Approaches to Combat Cancers. Mol Biol Rep 2023, 50, 9663–9676. [Google Scholar] [CrossRef] [PubMed]
- Pérez-Salvia, M.; Esteller, M. Bromodomain Inhibitors and Cancer Therapy: From Structures to Applications. Epigenetics 2017, 12, 323–339. [Google Scholar] [CrossRef] [PubMed]
- Filippakopoulos, P.; Knapp, S. Targeting Bromodomains: Epigenetic Readers of Lysine Acetylation. Nat Rev Drug Discov 2014, 13, 337–356. [Google Scholar] [CrossRef] [PubMed]
- Shu, S.; Polyak, K. BET Bromodomain Proteins as Cancer Therapeutic Targets. In Proceedings of the Cold Spring Harbor symposia on quantitative biology; Cold Spring Harbor Laboratory Press, 2016; Vol. 81; pp. 123–129. [Google Scholar]
- Boyson, S.P.; Gao, C.; Quinn, K.; Boyd, J.; Paculova, H.; Frietze, S.; Glass, K.C. Functional Roles of Bromodomain Proteins in Cancer. Cancers (Basel) 2021, 13, 3606. [Google Scholar] [CrossRef] [PubMed]
- Greener, J.G.; Kandathil, S.M.; Moffat, L.; Jones, D.T. A Guide to Machine Learning for Biologists. Nat Rev Mol Cell Biol 2022, 23, 40–55. [Google Scholar] [CrossRef] [PubMed]
- Yang, J.; Li, A.; Li, Y.; Guo, X.; Wang, M. A Novel Approach for Drug Response Prediction in Cancer Cell Lines via Network Representation Learning. Bioinformatics 2019, 35, 1527–1535. [Google Scholar] [CrossRef]
- Giorgi, F.M.; Ceraolo, C.; Mercatelli, D. The R Language: An Engine for Bioinformatics and Data Science. Life 2022, 12, 648. [Google Scholar] [CrossRef] [PubMed]
- Adam, G.; Rampášek, L.; Safikhani, Z.; Smirnov, P.; Haibe-Kains, B.; Goldenberg, A. Machine Learning Approaches to Drug Response Prediction: Challenges and Recent Progress. NPJ Precis Oncol 2020, 4, 19. [Google Scholar] [CrossRef] [PubMed]
- Firoozbakht, F.; Yousefi, B.; Schwikowski, B. An Overview of Machine Learning Methods for Monotherapy Drug Response Prediction. Brief Bioinform 2022, 23, bbab408. [Google Scholar] [CrossRef] [PubMed]
- L’heureux, A.; Grolinger, K.; Elyamany, H.F.; Capretz, M.A.M. Machine Learning with Big Data: Challenges and Approaches. Ieee Access 2017, 5, 7776–7797. [Google Scholar] [CrossRef]
- Osisanwo, F.Y.; Akinsola, J.E.T.; Awodele, O.; Hinmikaiye, J.O.; Olakanmi, O.; Akinjobi, J. Supervised Machine Learning Algorithms: Classification and Comparison. International Journal of Computer Trends and Technology (IJCTT) 2017, 48, 128–138. [Google Scholar]
- Roy, A.; Chakraborty, S. Support Vector Machine in Structural Reliability Analysis: A Review. Reliab Eng Syst Saf 2023, 233, 109126. [Google Scholar] [CrossRef]
- Hans, C. Elastic Net Regression Modeling With the Orthant Normal Prior. J Am Stat Assoc 2011, 106, 1383–1393. [Google Scholar] [CrossRef]
- Chiu, Y.-C.; Chen, H.-I.H.; Zhang, T.; Zhang, S.; Gorthi, A.; Wang, L.-J.; Huang, Y.; Chen, Y. Predicting Drug Response of Tumors from Integrated Genomic Profiles by Deep Neural Networks. BMC Med Genomics 2019, 12, 143–155. [Google Scholar]
- Su, R.; Liu, X.; Wei, L.; Zou, Q. Deep-Resp-Forest: A Deep Forest Model to Predict Anti-Cancer Drug Response. Methods 2019, 166, 91–102. [Google Scholar] [CrossRef] [PubMed]
- Ding, M.Q.; Chen, L.; Cooper, G.F.; Young, J.D.; Lu, X. Precision Oncology beyond Targeted Therapy: Combining Omics Data with Machine Learning Matches the Majority of Cancer Cells to Effective Therapeutics. Molecular Cancer Research 2018, 16, 269–278. [Google Scholar] [CrossRef] [PubMed]
- Indrayanto, G.; Putra, G.S.; Suhud, F. Validation of In-Vitro Bioassay Methods: Application in Herbal Drug Research. In; 2021; pp. 273–307.
Figure 1.
Errors made by the models in predicting IC50 values for each cell line in the Data of 10. The light green bars represent the highest and lowest errors. (a) EN, (b) KNN, (c) NNET, (d) SVM, and (e) XGB models show individual errors.
Figure 1.
Errors made by the models in predicting IC50 values for each cell line in the Data of 10. The light green bars represent the highest and lowest errors. (a) EN, (b) KNN, (c) NNET, (d) SVM, and (e) XGB models show individual errors.
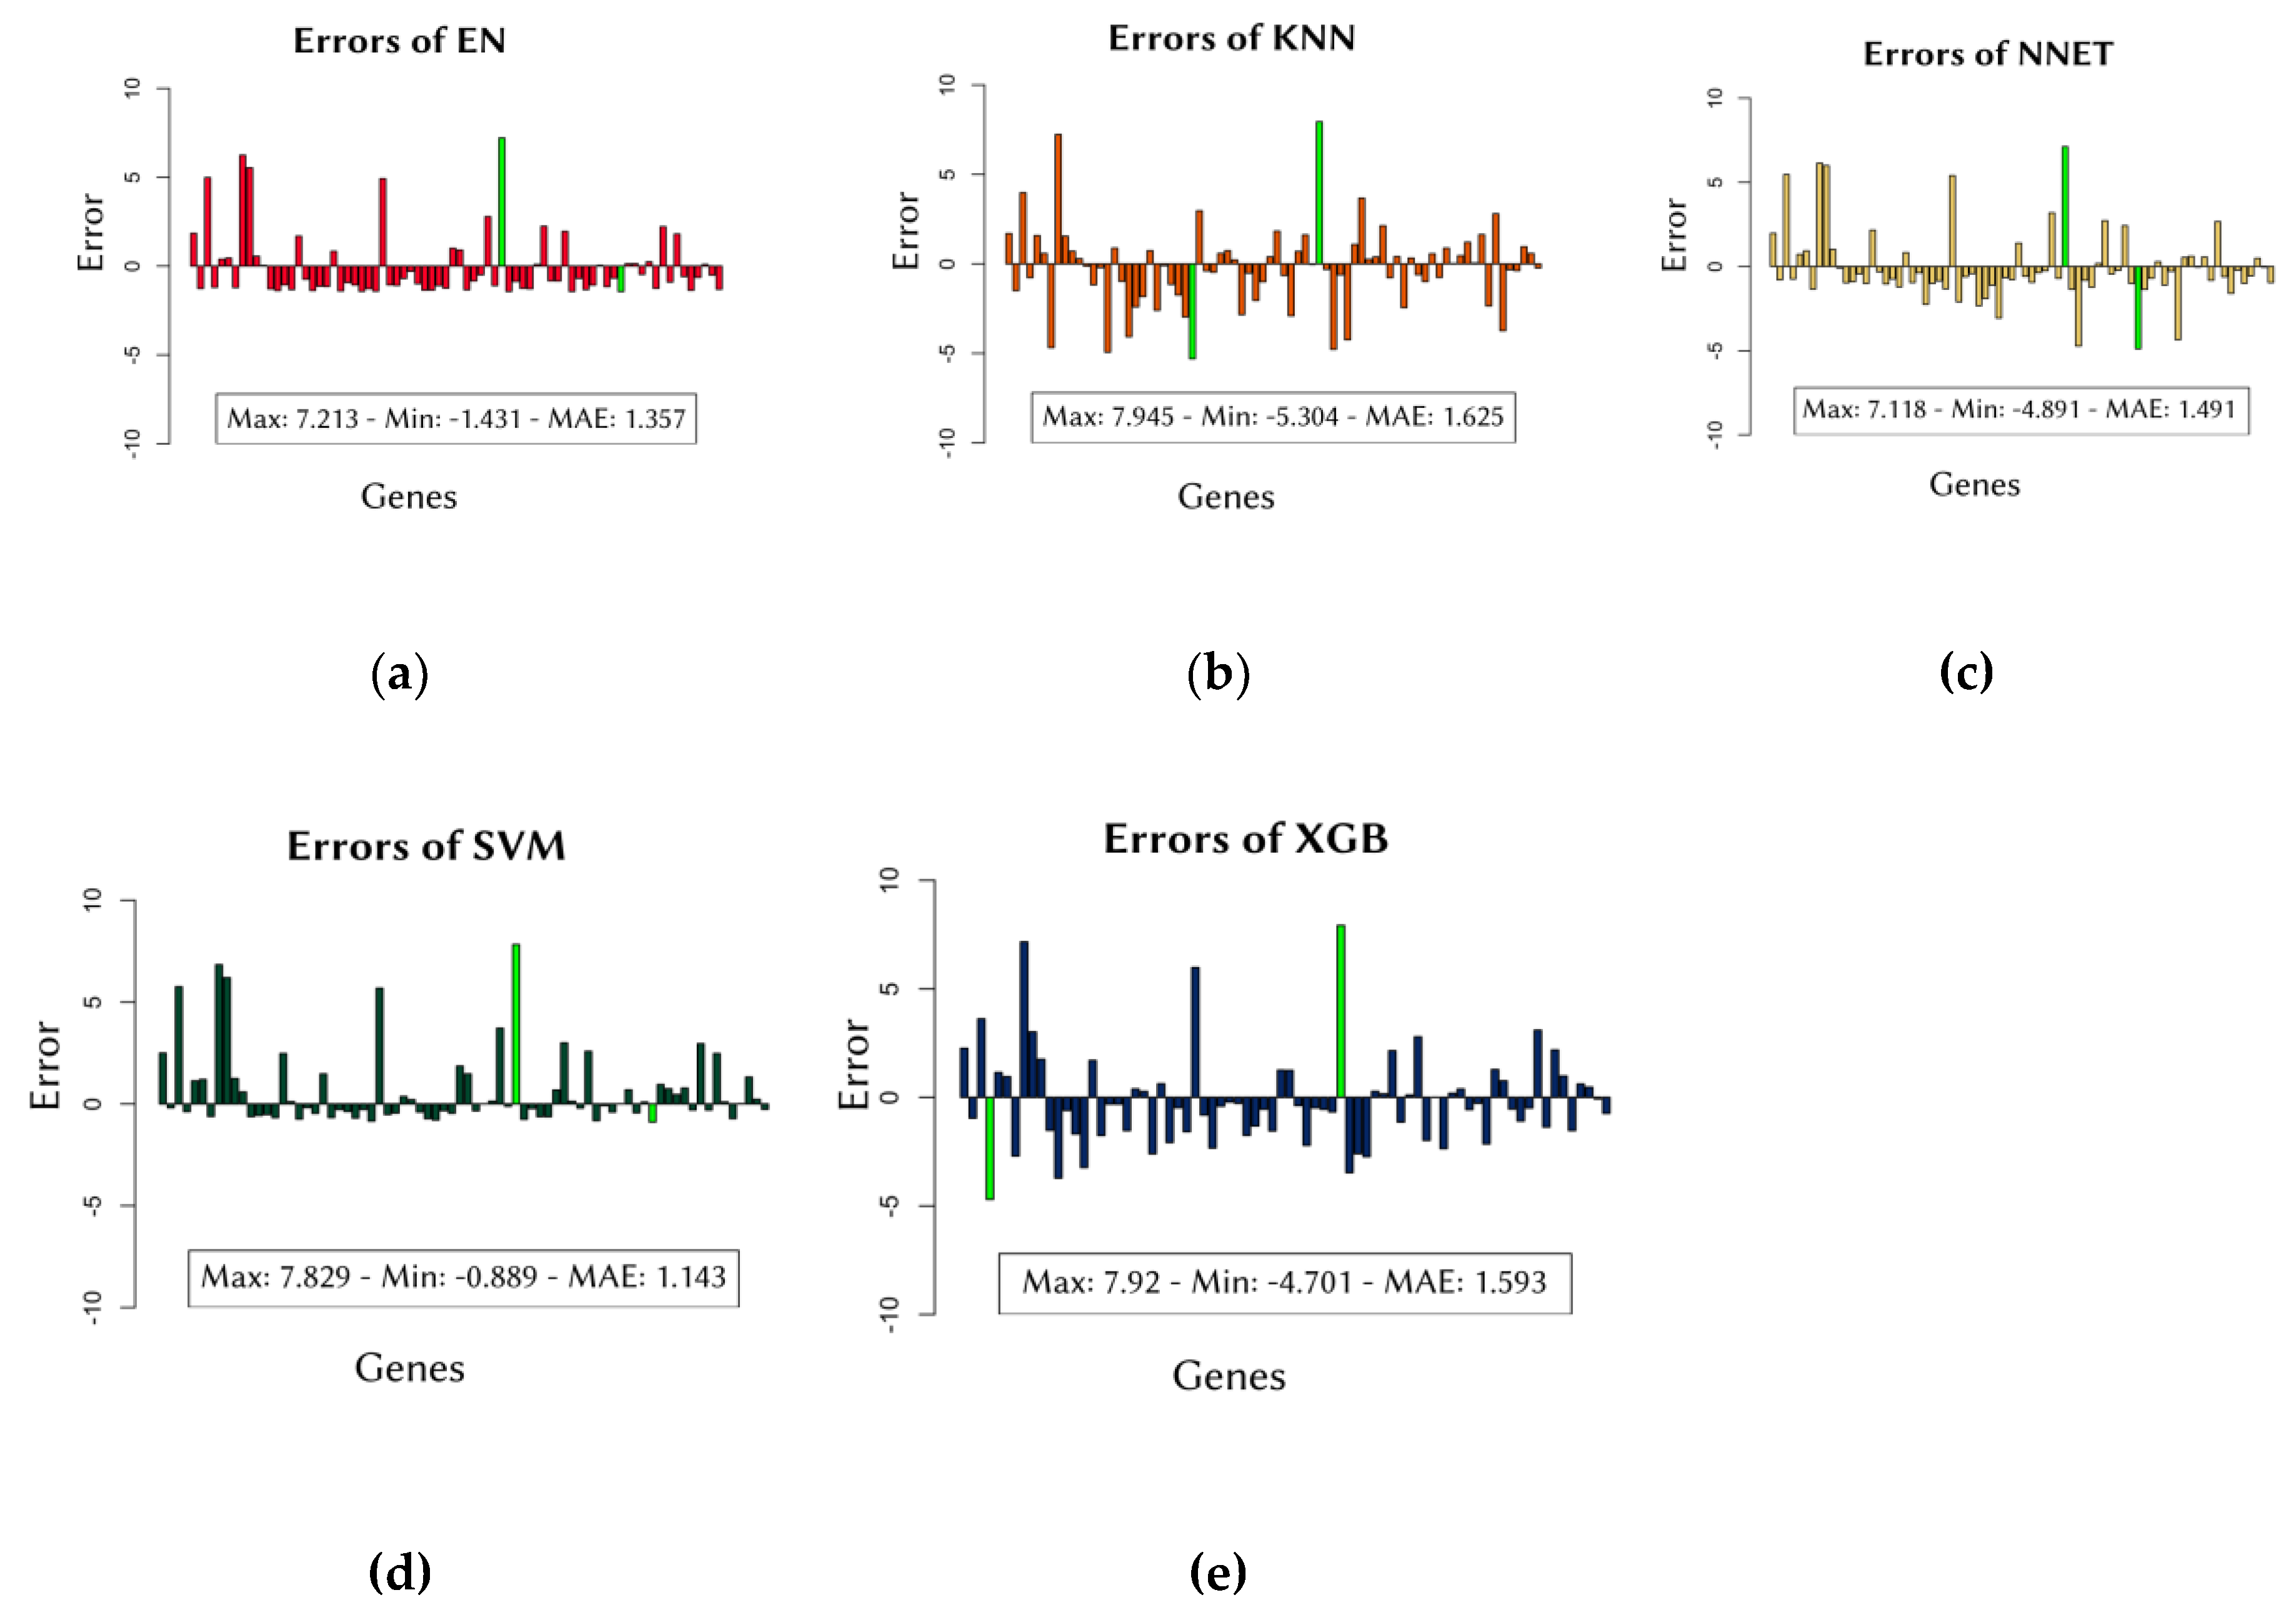
Figure 2.
Frequency of errors made by the models in the Data of 10. The X-axis represents the error magnitude, while the Y-axis indicates the frequency of these errors. (a) EN, (b) KNN, (c) NNET, (d) SVM, and (e) XGB models show the frequency of errors.
Figure 2.
Frequency of errors made by the models in the Data of 10. The X-axis represents the error magnitude, while the Y-axis indicates the frequency of these errors. (a) EN, (b) KNN, (c) NNET, (d) SVM, and (e) XGB models show the frequency of errors.
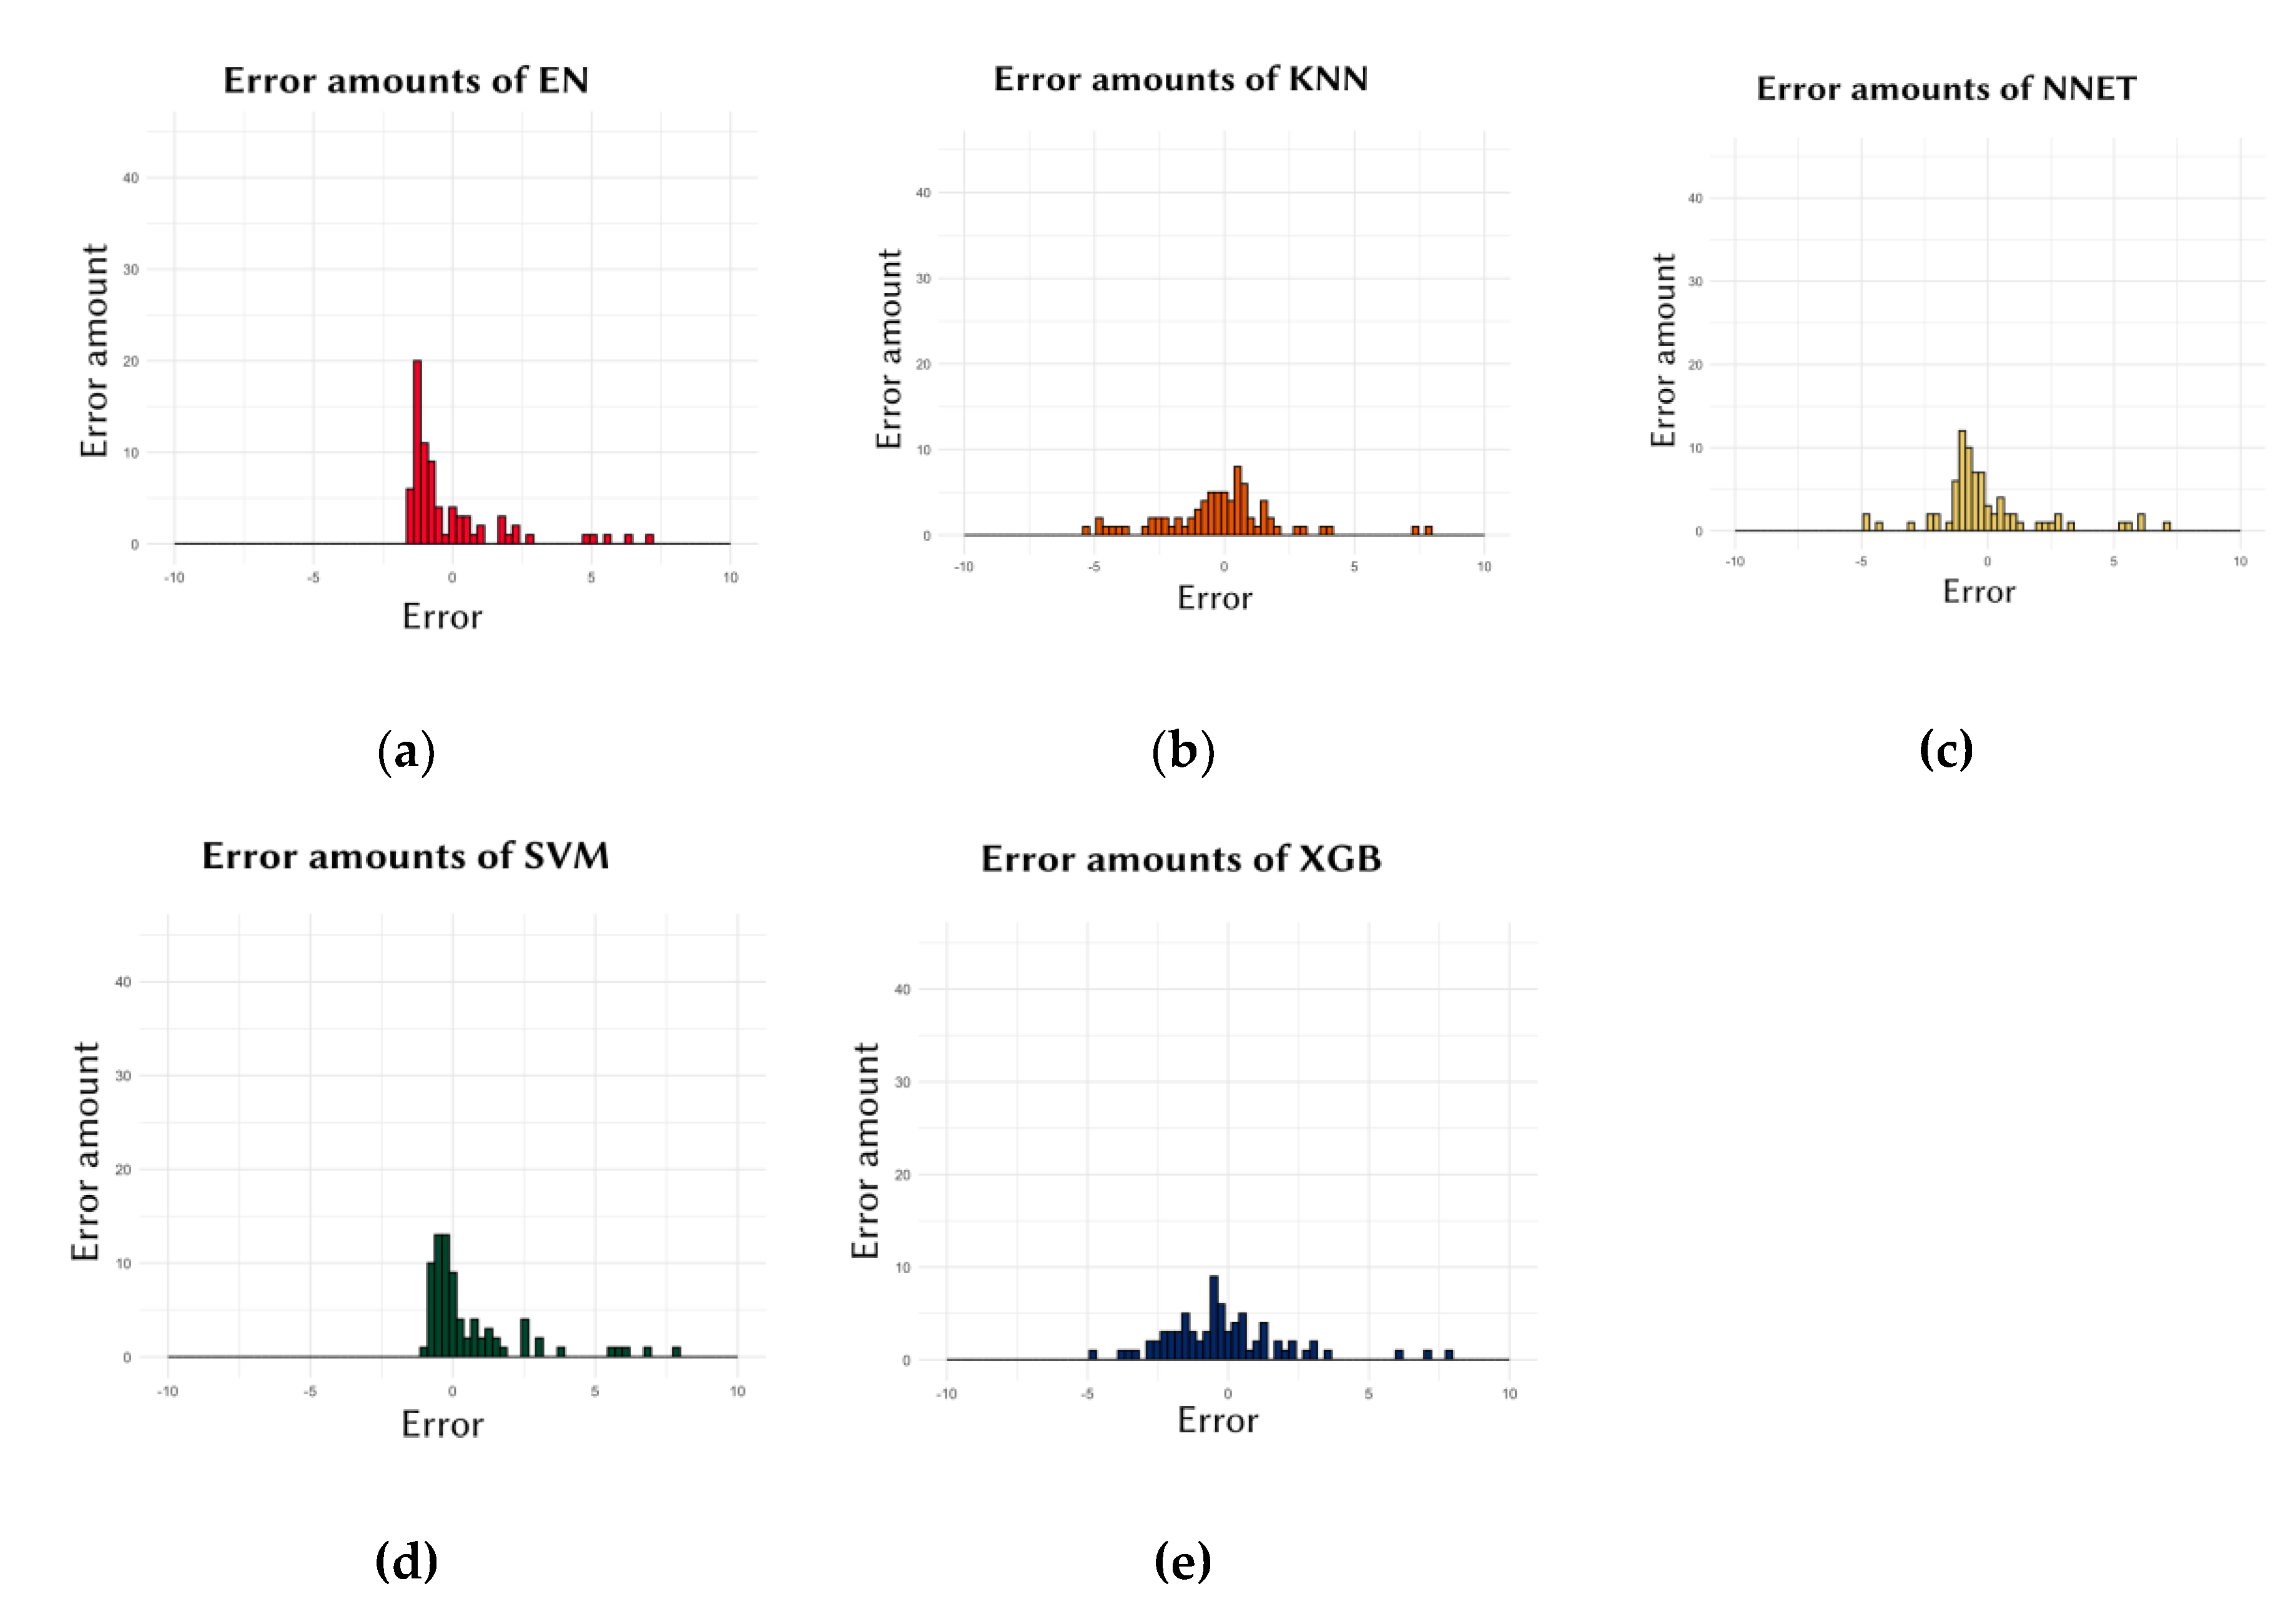
Figure 3.
Comparison of the predicted IC50 values (colored circles) and the actual IC50 values (light green triangles) for the models in the Data of 10. The X-axis represents the index numbers of the cell lines in the dataset, while the Y-axis represents the IC50 values. (a) EN, (b) KNN, (c) NNET, (d) SVM, and (e) XGB models show the performance of the models.
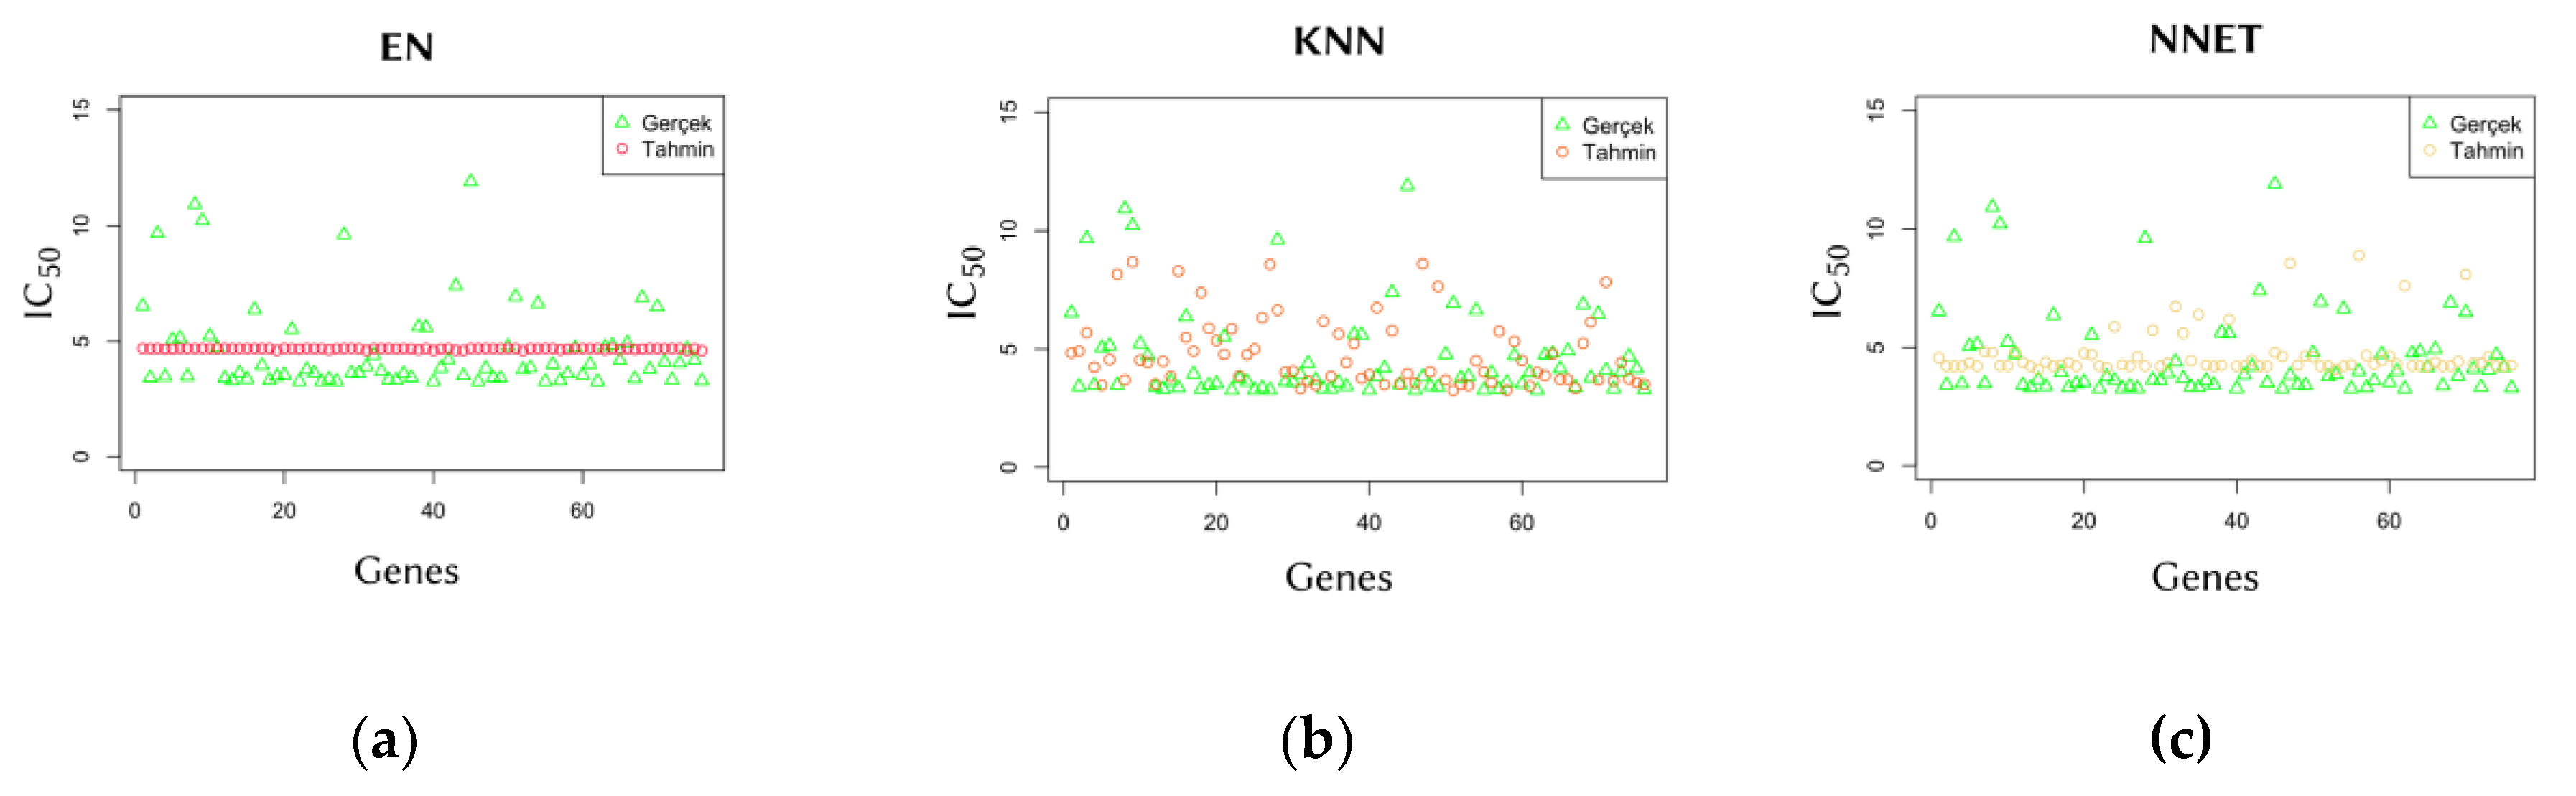
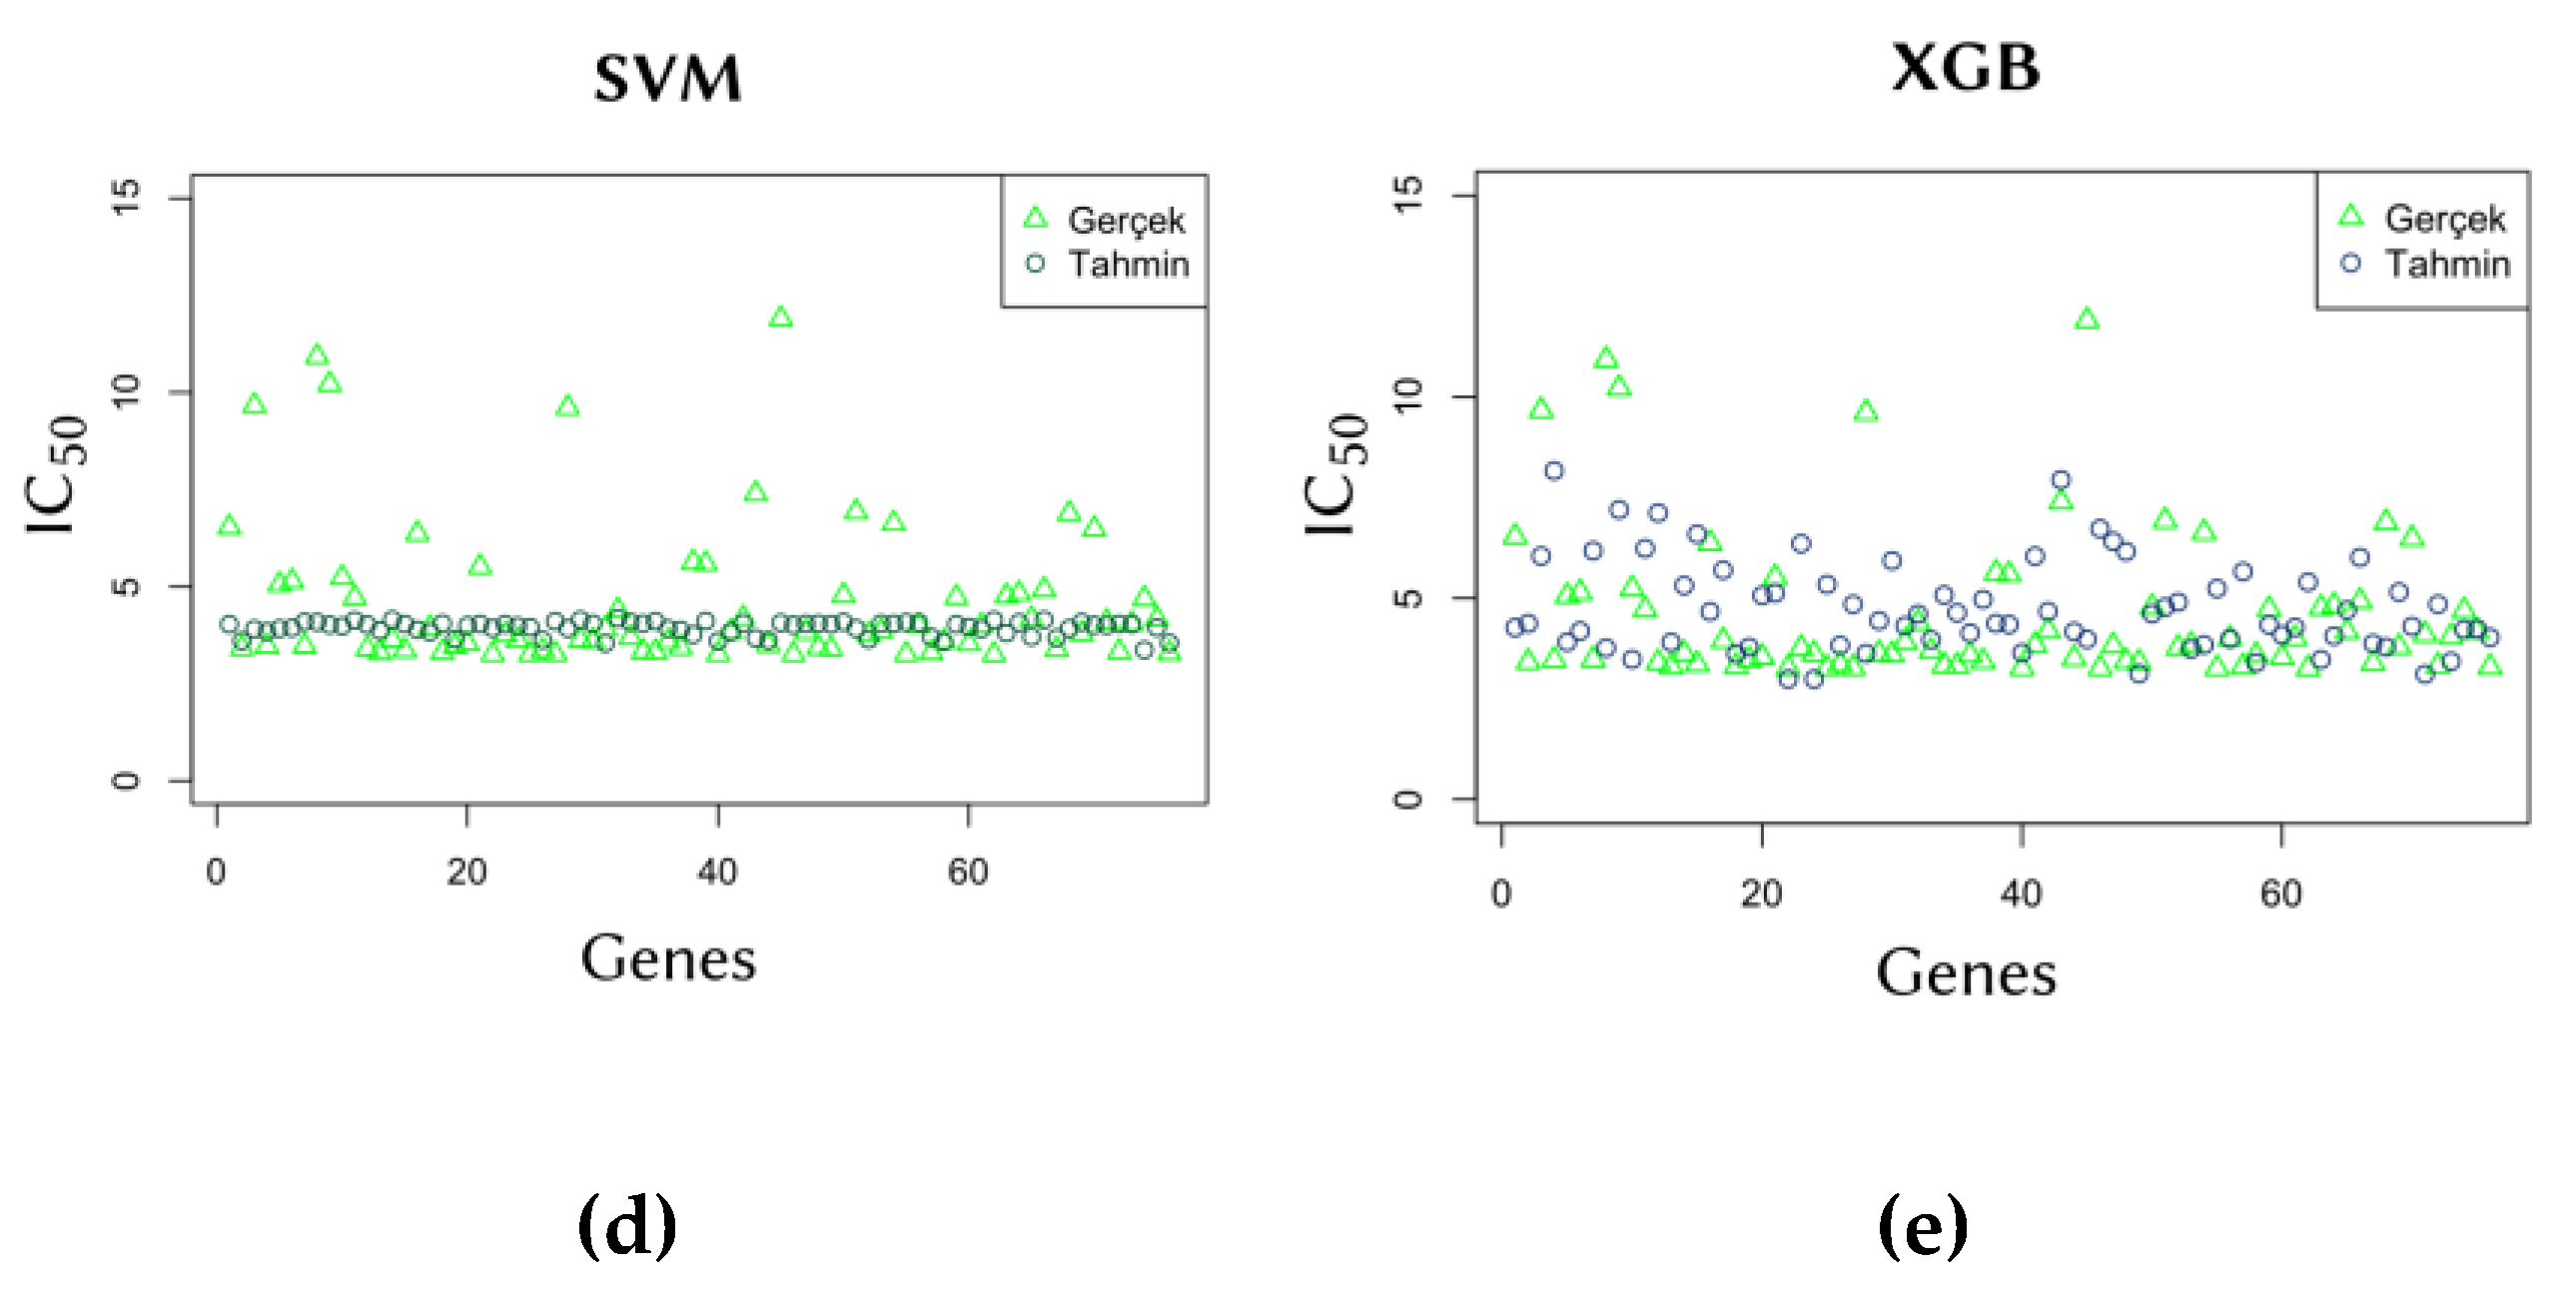
Figure 4.
This is the workflow diagram of the study.
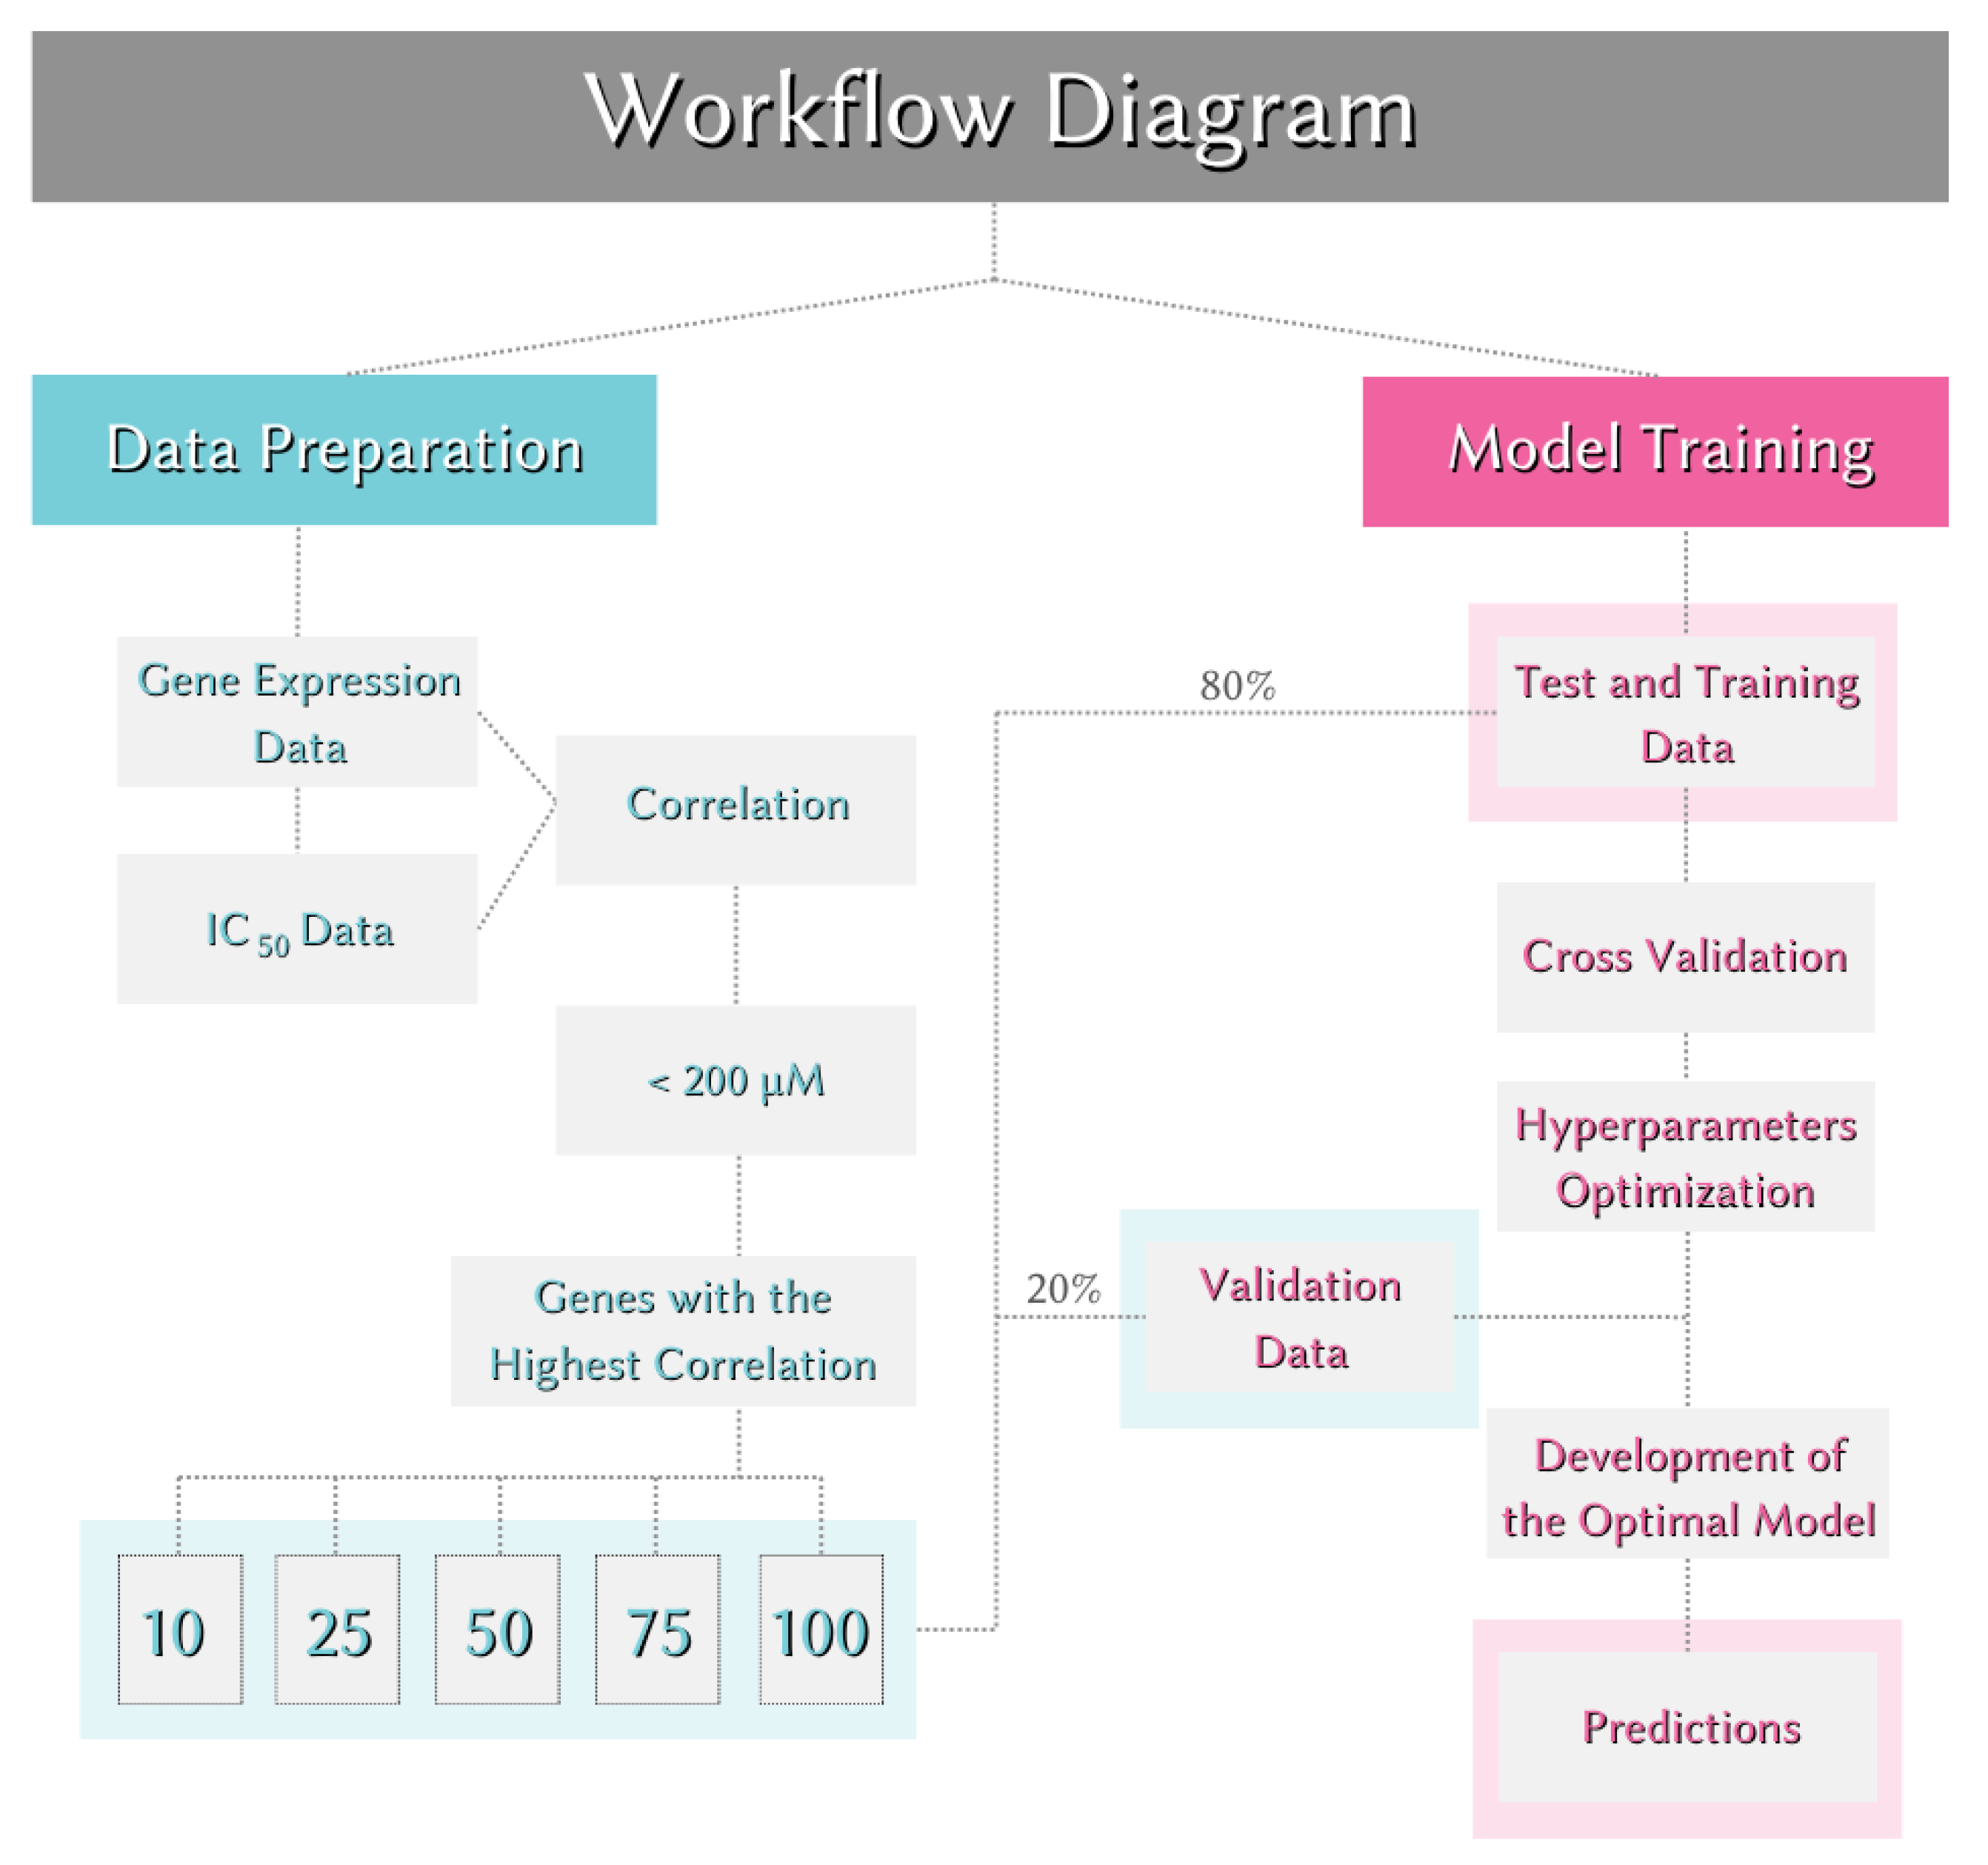

Table 1.
The MAE scores of OTX015 compound across different data dimensions and models based on the number of genes. The lowest MAE score and the dataset yielding this score are highlighted in bold.
Table 1.
The MAE scores of OTX015 compound across different data dimensions and models based on the number of genes. The lowest MAE score and the dataset yielding this score are highlighted in bold.
| Data | EN | KNN | NNET | SVM | XGB |
| Data of 10 | 1,357 | 1,625 | 1,491 | 1,143 | 1,593 |
| Data of 25 | 0,52 | 0,618 | 0,558 | 0,434 | 0,687 |
| Data of 50 | 1,04 | 1,174 | 1,167 | 0,855 | 1,307 |
| Data of 75 | 0,55 | 0,673 | 0,722 | 0,464 | 0,672 |
| Data of 100 | 0,281 | 0,355 | 0,491 | 0,254 | 0,352 |
Table 2.
Single cell line performance of the SVM model.
| Patient | Predicted IC50 | Real IC50 | Error | |
| Patient 1 | 4,03 | 6,528 | -2,498 | |
| Patient 2 | 3,604 | 3,413 | 0,191 | |
| Patient 3 | 3,909 | 9,664 | -5,755 | |
| Patient 4 | 3,843 | 3,464 | 0,379 | |
| Patient 5 | 3,918 | 5,052 | -1,134 | |
| Patient 6 | 3,935 | 5,136 | -1,201 | |
| Patient 7 | 4,091 | 3,476 | 0,615 | |
| Patient 8 | 4,085 | 10,923 | -6,838 | |
| Patient 9 | 4,014 | 10,214 | -6,2 | |
| Patient 10 | 3,985 | 5,233 | -1,248 | |
| Patient 11 | 4,131 | 4,716 | -0,585 | |
| Patient 12 | 4,022 | 3,397 | 0,625 | |
| Patient 13 | 3,871 | 3,302 | 0,569 | |
| Patient 14 | 4,149 | 3,626 | 0,523 | |
| Patient 15 | 4,036 | 3,359 | 0,677 | |
| Patient 16 | 3,891 | 6,366 | -2,475 | |
| Patient 17 | 3,83 | 3,939 | -0,109 | |
| Patient 18 | 4,052 | 3,307 | 0,745 | |
| Patient 19 | 3,651 | 3,469 | 0,182 | |
| Patient 20 | 3,998 | 3,535 | 0,463 | |
| Patient 21 | 4,038 | 5,51 | -1,472 | |
| Patient 22 | 3,931 | 3,259 | 0,672 | |
| Patient 23 | 4,03 | 3,755 | 0,275 | |
| Patient 24 | 3,986 | 3,614 | 0,372 | |
| Patient 25 | 3,953 | 3,26 | 0,693 | |
| Patient 26 | 3,625 | 3,351 | 0,274 | |
| Patient 27 | 4,108 | 3,264 | 0,844 | |
| Patient 28 | 3,923 | 9,608 | -5,685 | |
| Patient 29 | 4,144 | 3,622 | 0,522 | |
| Patient 30 | 4,046 | 3,597 | 0,449 | |
| Patient 31 | 3,542 | 3,907 | -0,365 | |
| Patient 32 | 4,184 | 4,389 | -0,205 | |
| Patient 33 | 4,085 | 3,69 | 0,395 | |
| Patient 34 | 4,052 | 3,326 | 0,726 | |
| Patient 35 | 4,107 | 3,318 | 0,789 | |
| Patient 36 | 3,915 | 3,586 | 0,329 | |
| Patient 37 | 3,882 | 3,424 | 0,458 | |
| Patient 38 | 3,763 | 5,623 | -1,86 | |
| Patient 39 | 4,115 | 5,589 | -1,474 | |
| Patient 40 | 3,598 | 3,261 | 0,337 | |
| Patient 41 | 3,835 | 3,833 | 0,002 | |
| Patient 42 | 4,058 | 4,19 | -0,132 | |
| Patient 43 | 3,67 | 7,39 | -3,72 | |
| Patient 44 | 3,616 | 3,499 | 0,117 | |
| Patient 45 | 4,068 | 11,897 | -7,829 | |
| Patient 46 | 4,011 | 3,256 | 0,755 | |
| Patient 47 | 4,045 | 3,818 | 0,227 | |
| Patient 48 | 4,051 | 3,425 | 0,626 | |
| Patient 49 | 4,029 | 3,399 | 0,63 | |
| Patient 50 | 4,088 | 4,773 | -0,685 | |
| Patient 51 | 3,923 | 6,924 | -3,001 | |
| Patient 52 | 3,636 | 3,761 | -0,125 | |
| Patient 53 | 4,05 | 3,844 | 0,206 | |
| Patient 54 | 4,044 | 6,627 | -2,583 | |
| Patient 55 | 4,08 | 3,257 | 0,823 | |
| Patient 56 | 4,073 | 3,991 | 0,082 | |
| Patient 57 | 3,699 | 3,298 | 0,401 | |
| Patient 58 | 3,579 | 3,582 | -0,003 | |
| Patient 59 | 4,028 | 4,722 | -0,694 | |
| Patient 60 | 3,961 | 3,524 | 0,437 | |
| Patient 61 | 3,911 | 4,002 | -0,091 | |
| Patient 62 | 4,14 | 3,251 | 0,889 | |
| Patient 63 | 3,803 | 4,755 | -0,952 | |
| Patient 64 | 4,075 | 4,819 | -0,744 | |
| Patient 65 | 3,705 | 4,166 | -0,461 | |
| Patient 66 | 4,142 | 4,921 | -0,779 | |
| Patient 67 | 3,679 | 3,382 | 0,297 | |
| Patient 68 | 3,922 | 6,88 | -2,958 | |
| Patient 69 | 4,084 | 3,784 | 0,3 | |
| Patient 70 | 4,006 | 6,483 | -2,477 | |
| Patient 71 | 4,001 | 4,095 | -0,094 | |
| Patient 72 | 4,04 | 3,319 | 0,721 | |
| Patient 73 | 4,033 | 4,043 | -0,01 | |
| Patient 74 | 3,37 | 4,689 | -1,319 | |
| Patient 75 | 3,943 | 4,166 | -0,223 | |
| Patient 76 | 3,548 | 3,283 | 0,265 | |
| Mean Absolute Error (MAE) | 1,143 | |||
Disclaimer/Publisher’s Note: The statements, opinions and data contained in all publications are solely those of the individual author(s) and contributor(s) and not of MDPI and/or the editor(s). MDPI and/or the editor(s) disclaim responsibility for any injury to people or property resulting from any ideas, methods, instructions or products referred to in the content. |
© 2025 by the authors. Licensee MDPI, Basel, Switzerland. This article is an open access article distributed under the terms and conditions of the Creative Commons Attribution (CC BY) license (http://creativecommons.org/licenses/by/4.0/).
Copyright: This open access article is published under a Creative Commons CC BY 4.0 license, which permit the free download, distribution, and reuse, provided that the author and preprint are cited in any reuse.


