Submitted:
27 March 2025
Posted:
28 March 2025
You are already at the latest version
Abstract
Eulerian observations of chemical species at fixed positions in a flow field are known to violate conservation laws, while the observations tracking moving air parcels are practically unfeasible. Eulerian observations often cause positive correlations between reactants and products in the atmosphere, which are frequently misinterpreted as evidence of the related chemical conversion. This dilemma has motivated innovative trials. The perturbation technique, widely used in mathematical and physical studies, offers a potential solution. Combining Eulerian observations with perturbation techniques may compensate the weakness, making this approach particularly valuable for studying the gas-aerosol partitioning of semi-volatile particulate species in ambient air. As an example, we examined this combination through an adiabatic-expansion-induced perturbation study on the gas-aerosol partitioning of dimethylamine (DMA) and trimethylamine (TMA) in ambient air. Eulerian observations of chemical species in size-segregated atmospheric particles ranging from 10 μm to 0.056 μm, coupled with downstream adiabatic-expansion-induced perturbation observations, were performed in coastal and marine atmospheres using a commercial sampler (Nano MOUDI-II, MSP, US), followed by offline chemical analysis. The results revealed that particulate DMA generally tended to evaporate in ambient air during the observational periods, while enhanced adiabatic-expansion-induced perturbations occasionally led to the co-formation of DMAHNO3 and NH4NO3. However, gaseous TMA apparently underwent gas-particle condensation to reach equilibrium in ambient air, with adiabatic-expansion-induced perturbation resulting in the formation of non-ionized TMA particulates. Thermodynamic analysis further supported that the observed particulate TMA was primarily determined by the equilibrium of gaseous TMA with non-ionized particulate TMA, rather than ionic TMAH+.
Keywords:
perturbation analysis
; Eulerian observations
; gas-aerosol partitioning
; trimethylamine
; dimethylamine
1. Introduction
A significant challenge in atmospheric chemistry is obtaining stoichiometric evidence of a net increase in a target product alongside a net decrease in its reactants from continuous, time-integrated ambient observations at fixed positions in a flow field, known as Eulerian observations. These observations, which are the most common in atmospheric chemistry, aim to observe chemical species and related chemical conversion processes [1]. Unlike controlled laboratory experiments, the effect of confounding factors in ambient observations, such as poor dispersion conditions, frequently leads to a positive correlation between reactants and products [2-5]. The lack of negatively correlated stoichiometric evidence makes previous observational reports on atmospheric chemical conversion processes highly speculative. While ambient observations for chemical species within moving air parcels could theoretically establish the expected negative stoichiometric relationship between reactants and products, such measurements are practically unfeasible. Perturbation techniques, widely used to solve complex problems in mathematics and physics [6], may offer a viable alternative for addressing this issue in atmospheric chemistry and warrant further exploration.
The application of perturbation techniques in atmospheric chemistry observations is not unprecedented. For example, supersaturation perturbation has been widely employed to measure the number concentrations of cloud condensation nuclei (CCN) and aerosol activation to CCN [7-14]. Moreover, Guo et al. [15] reported a perturbation technique to investigate the enhanced formation of new particles by removing the pre-existing particles from ambient air. When applying the perturbation concept to investigate gas-aerosol partitioning and related formation of particulate species, two critical steps are involved: (1) measuring and removing atmospheric particles from air parcels and (2) perturbing the target gaseous species in the remaining air streams using rapid adiabatic expansion or similar techniques. A commercial sampler, Nano Micro-Orifice Uniform-Deposit Impactor, second generation (Nano MOUDI-II), allows for routine observations of size-segregated atmospheric particles from 10 μm to 0.056 μm with a 40 kPa pressure drop during sampling, along with adiabatic-expansion-induced perturbation measurements of chemical species in the downstream air with an additional 50 kPa pressure drop [16, 17]. These combined observations can provide valuable insights into gas-aerosol partitioning and formation pathways of semi-volatile particulate species, such as NH4NO3, amines and organic nitrates in ambient air, although this application has yet to gain widespread recognition in the research community.
This study explores the gas-aerosol partitioning of trimethylamine (TMA) and dimethylamine (DMA) in various coastal and marine atmospheres using Nano MOUDI-II sampling, offering an entirely novel perspective by combining conventional observations with adiabatic-expansion-induced perturbation measurements. These two organic alkalis were selected because of the absence of secondary sources for them and their important roles in atmospheric chemistry, such as promoting new particles formation and initial growth, forming low-volatile compounds through reactions triggered by OH and NO3 free radical, replacing ammonium to release ammonia gas (NH3gas) or vice versa, and participating in reactions with dicarbonyl aldehydes to generate brown carbon in particulate phases, etc. [18-34]. Recent studies further suggest that gaseous dimethylamine (DMAgas) is the key alkaline species for H2SO4 nucleation in polluted urban atmospheres, even at low concentration levels [35, 36]. As semi-volatile organic alkalis, their gas-aerosol equilibrium may occur across gas, organic particle and aqueous (or solid) phases [16, 30, 37-39]. The complexity of their gas-aerosol partitioning in these phases is considerably greater compared to inorganic alkali and remains poorly understood because of the lack of observational techniques. In a companion paper, we attempt to use the combination to explore the repeated formation of NH4NO3 at unexpectedly high concentrations in downstream airflow due to the adiabatic-expansion-induced perturbation, potentially superimposed with micro-droplet chemistry of ammonia synthesis during Nano MOUDI-II samplings in certain instances.
2. Experimental
2.1. Sampling and Chemical Analysis
This study analyzed data collected from coastal and marine atmospheres during seven field campaigns, defined as Campaigns 1-7. Campaigns 1-3 were conducted at a semi-urban coastal site in Qingdao, China, from 20 May to 3 June 2013, 6 November to 5 December 2013, and from 17 November to 31 December 2015, respectively (Figure 1). Detailed information about the sampling site can be found in Li et al. (2015). Campaign 4 was conducted at a different semi-urban coastal site in Qingdao (36.34°N, 120.67°E) from 3 to 10 December 2022, with separate daytime and nighttime sampling on certain days. Three cruise campaigns, i.e., Campaigns 5-7, were performed over the Yellow Sea (YS) and the Bohai Sea (BS) from 2 to 19 November 2012, 6 to 24 November 2013, and 29 June to 20 July 2016, respectively. Campaigns 2 and 6 were designed for a comparative study between marine and coastal atmospheres, referred to as “comparative campaigns” later in this study. Two additional campaigns, discussed in a companion paper, were excluded from this analysis as the perturbation effects were limited to NH4+ and NO3-, rather than aminium ions. The YS and BS are generally eutrophic, except in the central oceanic zones of the YS during summer when seawater stratification occurs. These seas are situated downwind of northern China, a region with significant emissions of air pollutants, especially during the heating season [16, 17, 20, 40, 41].
A 14-stage Nano MOUDI-II (Model 122) was used to collect atmospheric particles in various campaigns. In Campaigns 1 and 3, it was positioned in a campus green space (~1.5 m above ground level), while in Campaign 4, it was placed on the roof of a five-story building. For Campaigns 5–7, the sampler was deployed on the upper deck of the Dong Fang Hong II (~8 m above sea level). The instrument operated at a flow rate of 29-30 L min−1 during 2012-2015, with 50% cutoff points for particle aerodynamic diameters of 18, 10, 5.6, 3.2, 1.8, 1.0, 0.56, 0.32, 0.18, 0.10, 0.056, 0.032, 0.018 and 0.010 μm (Figure 1). Teflon filters (47 mm, PALL Life Sciences) were used to collected particles larger than 0.056 μm during all campaigns. Zefluor™ PTFE filters (90 mm, PALL Life Sciences) were used to collect particles smaller than 0.056 μm, except during Campaign 4 where Fluoropore® PTFE filters (90 mm, Millipore Corp.) were used. To reduce back pressure, the sampler was deliberately designed to enlarge the size of the last three-stage impactors (Figure 1b). The enlarged design physically caused adiabatic expansion of the air stream jetted through the thousands of micro-orifice nozzles on the impactors, causing to a temperature drop of ~0.4℃ on the outer surfaces of the last three stages relative to the top stages (Figure 1). The actual temperature decrease of the jetting air stream is likely larger, but could not be measured in this study. In Campaign 2, a 14-stage Nano-MOUDI-II (Model 125) was placed in the same campus green space, operating at a flow rate of 10 L min-1. In Campaign 4, the MOUDI operated at a reduced flow rate of 15.5 L min−1 because of corrosion on the inside surface of nozzles after 10 years of use. A similar phenomenon was observed with an eleven-stage MOUDI in Hong Kong, where the flow rate stabilized at 18 L min−1 after 7 years of use in the coastal atmosphere (based on the author’s personal experience). The decrease in MOUDI operating flow rate likely continued to some extent from 2016 to 2021, although we did not measure flow rates during those periods, as the two vacuum pressure gauges on the MOUDI functioning properly. Moreover, 2-4 sets of positive field blank samples were collected during each campaign, with each set obtained by conducting a three-minute sampling (Figure S1).
The chemical analysis methods are described in detail in Yu et al. [17], Xie et al. [16] , and Hu et al. [41]. Briefly, an Ion Chromatography system (Dionex 3000) equipped with a CS17 column (Dionex, 250 mm × 4 mm) and an AS11 column (Dionex, 250 mm × 4 mm) was used to determine aminium ions and anions, respectively. A CS12A column (Dionex, 250 mm × 4 mm) was employed for the analysis of NH4+ and metal ions. Moreover, an Ambient Ion Monitor−Ion Chromatograph (AIM−IC, URG-9000D) was housed in an air-conditioned laboratory on the third floor of a campus research building during Campaign 3. The sampling probe extended out of the window, approximately 5 m above ground level, to access ambient air. In Campaign 4, the AIM-IC was placed in an air-conditioned room side by side with the Nano MOUDI-II. Detailed operating procedures for the AIM-IC are available in our previous studies [20, 40, 42]. The AIM-IC, installed with a PM2.5 cyclone and CS17A column, provided semi-continuous concentrations of chemically reactive gases (e.g., NH3, SO2, and HNO3, etc.) and water-soluble ions in PM2.5 with an hourly time resolution [42]. In addition, the E-AIM model was used to calculate the gas-aerosol partitioning of semi-volatile species [20, 37, 38, 43] (http://www.aim.env.uea.ac.uk/aim/aim.php, last access: 17 December 2024). Meteorological data including ambient temperature (T) and relative humidity (RH) were obtained from a nearby meteorological station <5 km away from the sampling site during Campaigns 1-4, and from an onboard automatic weather station during Campaigns 5-7.
2.2. Hypothesis for Perturbation Scenarios
Similar to the process in which updrafts of air masses induce supersaturation and form cloud droplets in the troposphere [44], adiabatic expansion during Nano MOUDI-II sampling reduces the T and increases the RH of the air stream jetted from the micro-orifice nozzles in the last three stages (Figure 1). This temperature drop and humidity increase further lower the theoretical saturation pressures of semi-volatile species and the equilibrium constants for the reactions involving reactive gases, such as HNO3+NH3 and HNO3+DMA, etc., in the jetted air stream. In some cases, this can lead to vapor supersaturation and/or the product of reactive gases (e.g., HNO3 and DMA) exceeding theoretical values. Such conditions may result in artifact formation of corresponding particulates, which are then collected on the Nano MOUDI-II filters.
Four potential scenarios may occur, as outlined below: 1) Scenario 1: The reduced theoretical saturation pressures and equilibrium constants remain higher than the corresponding values in the jetted air stream, preventing artifact formation of particulates. 2) Scenario 2: The theoretical saturation pressures (or the equilibrium constants) drop below the actual values in the jetted air stream, causing artifact formation of related particulates on the filter to some extent. 3) Scenario 3: A combination of Scenario 1 and 2 occurs across stages. For instance, Scenario 1 may occur on Stage 11 (or 12), while Scenario 2 occurs on Stage 12 (or 13) in Nano NOUDI-II sampling because of the increased line speed of the jetted air stream as the diameters of micro-orifice nozzles decrease. 4) Scenario 4: Building on the above scenarios, Scenario 2 may occur on Stage 11 (or 12) in Nano NOUDI-II sampling, while either Scenario 1 or 2 may occur on subsequent stages, depending on the differences between the reduced theoretical saturation pressures (and equilibrium constants) and their actual values in the jetted air stream. These scenarios are collectively referred to as “perturbation” because they only occur during sampling rather than in ambient air.
3. Results and Discussion
3.1. Molar Concentration Size Distributions of Particulate Ions and Inter-Comparison Between Nano-MOUDI and AIM-IC Measurements in the Coastal Atmosphere - Campaign 4
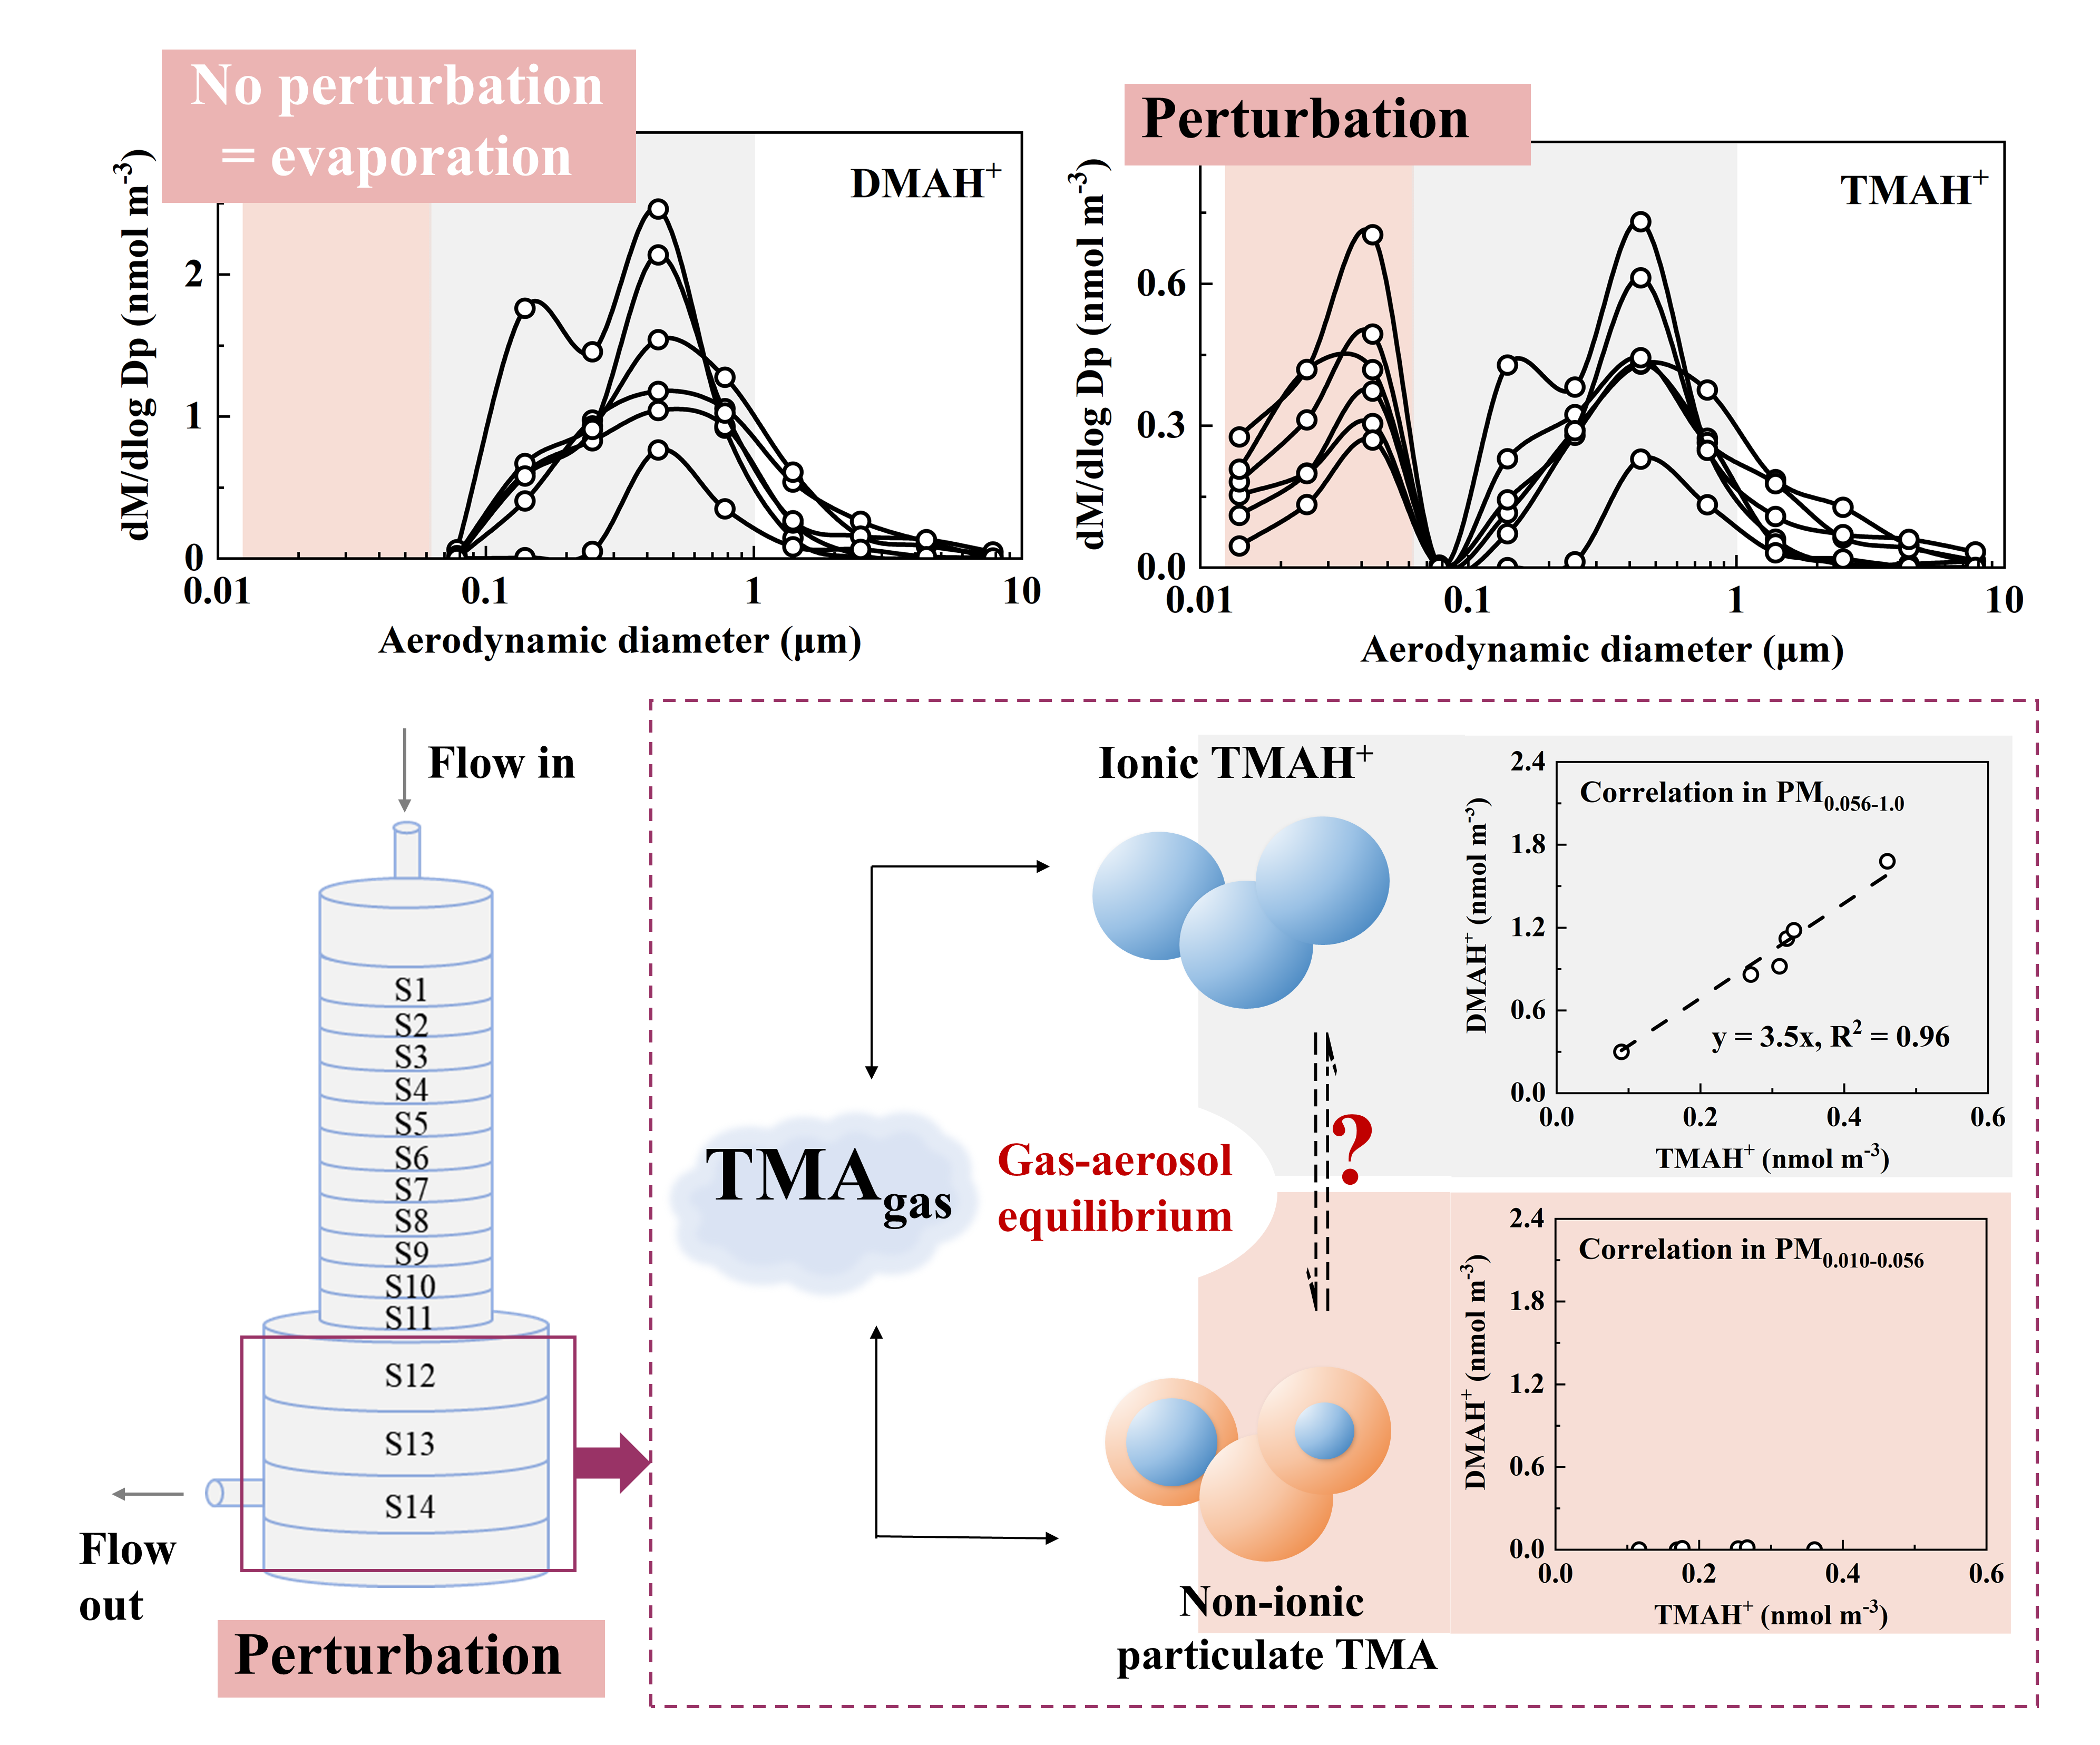
The Nano MOUDI-II and AIM-IC were placed side by side for simultaneously measurements during Campaign 4, allowing for a quantitative evaluation of the Nano-MOUDI-II’s sampling performance and confirmation of the perturbation effect. The results from this campaign are thereby presented first. Figure 2 showed molar concentration size distributions of NH4+, SO42-, NO3-, DMAH+ and TMAH+ in atmospheric particles, correlations between specific particulate ions, and inter-comparison of particulate NH4+, SO42- and NO3- concentrations measured by the two methods during Campaign 4. Here, molar concentration size distributions of particulate NH4+, SO42- and NO3- were analyzed prior to those of particulate DMAH+ and TMAH+ because the knowledge on the modal size distribution patterns of inorganic ions are well-established in the research community [1]. The analysis results are then used to explain the unexpected increase in concentrations of particulate DMAH+ and TMAH+ collected on the last three stages, corresponding to size bins in 0.010-0.018 μm, 0.018-0.032 μm and 0.032-0.056 μm, during Nano MOUDI-II sampling. Specifically, the results address why this increase is considered a perturbation effect in sampling rather a genuine increase in ambient air?
The modal patterns of NH4+, SO42- and NO3- size distributions were reasonably consistent across the 11 samples and can be summarized as follows: (1) Tri-modal size distribution: The size distribution exhibited three distinct modes: a droplet mode with a molar median aerodynamic diameter (MMAD) of ~0.7 μm, a condensation mode with an MMAD of ~0.2 μm, and a substantially smaller coarse mode with an MMAD of ~5 μm (Figure 2a-c). These three modes are frequently reported in various atmospheres [1, 41, 45-47], with their formation mechanisms well documented by [48]. (2) Concentration trends by mode: The droplet mode dominated at higher ionic concentration levels, whereas the condensation mode became more pronounced - and occasionally dominant - at lower ionic concentration levels. (3) Negligible concentrations in the sub-0.056 μm size range: The concentrations of these three particulate inorganic ions below 0.056 μm (highlighted in gray in Figure 2a-c) were negligible in comparison with those in larger size ranges, which is consistent with Nano-MOUDI-II observations from Taiwan [49]. Such negligible concentrations are expected, as surface concentrations of Aitken and nucleation mode particles are consistently reported to be substantially lower than those of accumulation mode particles in various atmospheres [9, 50, 51]. Noted that the averaged molar concentration size distributions for particulate ions in 7 of the 11 samples were presented in Figure 2a-e to reduce overlap. However, the size distributions for specific dates – 3 and 10 December, as well as the nighttime samples on 6 and 8 December 2022 – are shown individually for comparison. Additional details on the size distributions for each sample are provided in Figure S2a-e.
When comparing [NH4+]PM0.056-3.2 (the sum of the particulate NH4+ concentrations ranged from 0.056 μm to 3.2 μm collected by the Nano MOUDI-II) with [NH4+]PM2.5 (the corresponding values in PM2.5 measured by the AIM-IC), a strong correlation was observed with the correlation coefficient (r) of 0.99 (P < 0.01), yielding a regression equation of [NH4+]PM2.5 = [NH4+]PM0.056-3.2 * 0.76, with the determination coefficient (R2) of 0.97, by forcing the intercept to be zero (Figure 2f). The slope suggested an overall 24% positive sampling artifact for particulate NH4+ in the Nano-MOUDI-II measurements. The R2 value, close to unity, further indicated a constant artifact percentage during Campaign 4, regardless of whether samples were collected during the day or night. Similarly, strong correlations were observed for the measured concentrations of SO42- and NO3- between the two methods: [SO42-]PM2.5 = [SO42-]PM0.056-3.2 * 0.62, R2 = 0.97 (r = 0.99, P < 0.01) (Figure 2g) and [NO3-]PM2.5 = [NO3-]PM0.056-3.2 * 1.3, R2 = 0.98 (r = 0.99, P < 0.01) (Figure 2h). The different slopes revealed an overall 38% positive sampling artifact for SO42- concurrently with an overall 30% negative sampling artifact for NO3-, respectively, in the Nano-MOUDI-II measurements. Again, the near-unity R2 values suggested that the positive and negative artifact percentages were almost constant during Campaign 4. These opposite artifacts could be explained by the artifact reactions in forming sulfuric acid, which simultaneously released HNO3 from collected particles into the gas phase during sampling [52]. When the values of ([SO42-]PM0.056-3.2 -[SO42-]PM2.5)*2 were plotted against ([NO3-]PM2.5 - [NO3-]PM0.056-3.2 ), the data aligned along a 1:1 line, providing stoichiometrically evidence for the occurrence of the artifact reactions (Figure 2j). However, a fraction of the formed sulfuric acid may have been neutralized by NH3, leading to cases where ([SO42-]PM0.056-3.2 -[SO42-]PM2.5)*2 exceeding ([NO3-]PM2.5 - [NO3-]PM0.056-3.2 ). Like sulfuric acid, a fraction of organic acids might also have formed, partially replacing particulate NO3-. This hypothesis was supported by the ratio of [NH4+]/([NO3-] + [SO42-]*2), which was approximated 1.37 in PM0.056-3.2, but close to unity (0.98) in PM2.5 (Figure 2i). The unaccounted [NH4+] by ([NO3-] + [SO42-]) in PM0.056-3.2 could have been neutralized by organic acids [53]. The artifact-related formation of SO42- and NH4+, and the release of HNO3 from particulate nitrate on the last three stages of the Nano-MOUDI, were too weak to confirm due to their negligible concentrations therein. However, the artifact-related formation of NH4+ and NO3- on one or more of the last three stages was evident in Campaign 3, 5 and 6, as presented later. Similar results were also observed in other cruise campaigns performed in April-May and August-September 2015, as reported by Yu et al. [17].
The complexity of the size distribution patterns of particulate DMAH+ and TMAH+ increased to some extent compared to those of NH4+, SO42- and NO3- during Campaign 4. Although particulate DMAH+ generally exhibited tri-modal size distributions at the size ranges above 0.056 μm (Figure 2d and Figure S2d), the droplet and condensation modes were often of comparable magnitude (Figure S2d). In some samples, the condensation MMAD of DMAH+ showed a slight shift toward smaller sizes relative to the corresponding inorganic ions. Moreover, no significant correlations were observed between DMAH+ concentrations and those of the three inorganic ions. Notably, the highest particulate DMAH+ concentrations within each size bin (0.056-10 μm) were recorded on 3 December 2022, a day when concentrations of the three inorganic ions ranked among the third lowest in the 11-sample dataset. Particulate DMAH+ concentrations in the three size bins below 0.056 μm were negligible in 9 of the 11 samples in comparison with the values at the larger size bins, consistent with the observations for the three inorganic ions. However, this pattern was not observed in the nighttime sample collected on 6 December 2022 or the sample from 10 December 2022. On 10 December, slightly elevated concentrations of DMAH+ were detected in the 0.010-0.018 μm and 0.018-0.032 μm size ranges compared to the 0.032-0.056 μm and 0.056-0.10 μm ranges. These elevated concentrations, referred to as E-DMAbelow0.056, were also observed in the 0.018-0.032 μm size range relative to those in the 0.032-0.056 μm and 0.056-0.10 μm ranges in the nighttime sample on 6 December, leading to the ratio of [DMAH+]PM0.018-0.032 to [DMAH+]PM0.10-0.32 of condensation mode as high as 0.38, in contrast to ratios of 0.005 for [NH4+] and <0.005 for [SO42-]. Theoretically, the Kelvin effect would produce a larger ratio for low-volatile species than for semi-volatile species in smaller nucleation and Aitken mode atmospheric particles relative to condensation mode atmospheric particles [54]. The absence of a corresponding identical proportional increase in [SO42-] and [NH4+] in size ranges below 0.056 μm suggested that the E-DMAbelow0.056 should be considered as a unique phenomenon. This behavior is likely attributable to an adiabatic-expansion-induced perturbation effect during sampling, rather than an ambient atmospheric process. This conclusion is further supported by the positive artifacts associated with SO42- and NH4+, and the negative artifacts associated with DMAH+ and TMAH+ during Nano-MOUDI-II sampling, as discussed in Section 3.1 and Section 3.2.
The molar concentration size distributions of TMAH+ in the collected atmospheric particles were even more complex than those of DMAH+ (Figure 2d, e). Although TMAH+ also exhibited tri-modal size distributions in size ranges exceeding 0.056 μm, its modal patterns were inconsistent with those of DMAH+ or the three inorganic ions. For example, on 3 December, the condensation MMAD of particulate TMAH+ shifted to 0.15 μm in comparison with 0.25 μm for other ions. This implied a more intricate formation mechanism for TMAH+ relative to DMAH+ and NH4+ [16]. In the size ranges below 0.056 μm, slightly elevated concentrations of TMAH+ were frequently observed in most samples, referred to as E-TMAbelow0.056. Similar to DMAH+, the presence of E-TMAbelow0.056 is unlikely to have occurred in ambient air. Unfortunately, during the first week of Campaign 4, the aging analytical column installed on the AIM-IC failed to detect DMAH+ and TMAH+ due to incompatibility with the applied eluent concentrations. After reducing the concentrations of the eluents, DMAH+ and TMAH+ became detectable by the AIM-IC. However, no further Nano-MOUDI samplings were conducted thereafter.
3.2. Molar Concentration Size Distributions of Particulate Ions and Comparison Between Nano-MOUDI-II and AIM-IC Measurements in the Coastal Atmosphere - Campaign 3
The molar concentration size distributions of DMAH+, TMAH+, NH4+, SO42- and NO3- in atmospheric particles during Campaign 3, as shown in Figure 3 and Figure S3, highly varied compared to the reasonably consistent tri-modal patterns observed across samples in Campaign 4. Among the particulate ions, SO42- exhibited the simplest modal patterns, summarized as follows: (1) Bi-modal size distribution: particulate SO42- typically exhibited a droplet mode with MMAD value of approximately 0.7 μm or 1.5 μm and a condensation mode with an MMAD of ~0.2 μm. The two distinct droplet MMAD values were conventionally attributed to aerosols cloud and fog processing, respectively [48]. (2) On 4 December 2015, an Aitken mode of SO42- was observed concurrently with the condensation mode at lower concentration levels; however, the Aitken mode of SO42- was absent in other samples. (3) Negligible concentrations in the sub-0.056 μm size ranges: Consistent with observations from Campaign 4, particulate SO42- concentrations in size ranges below 0.056 μm were negligible in comparison with those in larger size ranges.
The modal patterns of particulate NH4+ and NO3- above 0.056 μm were generally consistent with that of SO42- within the same samples, except on 4 December 2015. Strong correlations were observed between [NH4+]PM0.056-3.2 and [SO42-]PM0.056-3.2, and between [NH4+]PM0.056-3.2 and [NO3-]PM0.056-3.2 (r = 0.96, P < 0.01), which implied that: 1) the concentrations of these inorganic ions were likely co-determined by the meteorological factors; and/or 2) they originated from the same primary and/or secondary sources, despite their gaseous precursors (e.g. SO2, NOx and NH3) typically having different major contributors [5, 55]. However, elevated concentrations of particulate NH4+ and NO3- were generally obtained in size ranges below 0.056 μm, referred to as E-NH4+below0.056 and E-NO3-below0.056, respectively, in most samples, except on 14 and 15 December 2015 (Figure 3 and Figure S3). A similar phenomenon, E-NO3-below0.056 but not for other particulate ions, was reported by Chang et al. [56] during a case study of aerosol episodes in southern Taiwan using an identical Nano-MOUDI-II, although they did not explain its occurrence (see their Figure 4). Assuming particles in the 0.010-0.018 μm size range are spherical with a density of 1.7 g cm-3, the observed maximum increase in molar concentrations of particulate NH4+ and NO3- at 0.010-0.018 μm on 4 December 2015 would require particle number concentrations exceeding 108 particles cm-3 in ambient air. However, the atmospheric particle number concentrations larger than 5.6 nm were reported to be at the magnitude of 104 particles cm-3 at the site [57, 58]. Such particle number concentration > 108 particles cm-3 is unattainable in typical ambient conditions, even in highly concentrated on-road vehicle plumes inside a long tunnel [9, 51]. This increase will be further investigated in a companion paper.
The modal patterns of particulate DMAH+ above 0.056 μm showed consistency with NH4+ and NO3- in some samples but differed in others, potentially because of the competition between NH3 and DMA in neutralizing particulate acids to different extents [20]. However, the E-DMAbelow0.056 consistently co-occurred with E-NH4+below0.056 and E-NO3-below0.056, e.g., the regression equation with the intercept forced to zero was [DMAH+] = 0.001 * [NH4+], R2 = 0.92 (r = 0.96, P < 0.01) (Figure 4a). However, the R2 value was 0.89 (r = 0.95, P < 0.01) with a slope of 0.0008 for them in the size range of 0.056-3.2 μm (Figure 4c). The results allowed us to infer that in the air upstream of the last three stages, the amount of acids might be sufficient to favor the formation of DMAHNO3 under more favorable conditions such as reduced T and increased RH, leading to approximately a 25% increase in [DMAH+]/[NH4+] ratios relative to larger particles. Note that particulate DMAH+ had been largely removed from the air stream prior to the arrival at the last stages. The modal patterns of particulate TMAH+ above 0.056 μm were irregular because of its substantially lower concentrations. The E-TMAbelow0.056 was generally observed, peaking mostly in the 0.032-0.056 μm size range. Unlike E-DMAbelow0.056, E-TMAbelow0.056 did not show a significant correlation with corresponding E-NH4+below0.056 with P > 0.05 (Figure 4b). The same was true for them in atmospheric particles sized 0.056-3.2 μm (Figure 4d).
When comparing ion concentrations in PM0.056-3.2 collected by the Nano-MOUDI-II at ground level with AIM-IC-based values in PM2.5 collected at the level of 7-meter above the ground during Campaign 3, complex results were obtained. Specifically: 1) the concentrations of SO42- and NH4+ measured by the Nano MOUDI-II in the first four samples (collected on 27-30 November 2015) showed a high correlation with those measured by the AIM-IC, with [NH4+]PM2.5 = 0.46 * [NH4+]PM0.056-3.2, R2 = 0.94 (r = 1.00, P < 0.01), [SO42-]PM2.5 = 0.51 * [SO42-]PM0.056-3.2, R2 = 0.97 (r = 1.00, P < 0.01). The Nano-MOUDI values were approximately double the corresponding AIM-IC values (Figure 3h, j); 2) the remaining values generally aligned along a 1:1 line. Based on the results, we supposed that positive artifacts of 100% for SO42- and NH4+ occurred in the 0.056-3.2 μm size range in the Nano-MOUDI-II samples from 27-30 November. Thus, the observed values were thereby halved to represent the “real” concentrations. When these adjusted values were combined with other unmodified data, the re-plotted results (Figure S3c, d) yielded [NH4+]PM2.5 = 1.03 * [NH4+]PM0.056-3.2, R2 = 0.75 (r = 0.94, P < 0.01), [SO42-]PM2.5 = 1.06 * [SO42-]PM0.056-3.2, R2 = 0.72 (r = 0.92, P < 0.01). The two slopes were surprisingly close to unity, allowing us to confirm the presence of positive artifacts for both SO42- and NH4+ in the first four Nano-MOUDI-II samples. The results of NO3- were more complex and will be discussed in the companion paper.
In contrast to SO42- and NH4+, negative artifacts were confirmed for DMAH+ and TMAH+ during Nano MOUDI-II sampling (Figure 3b, c, e, f). For example, the regression equations were [DMAH+]PM2.5 = 2.1 * [DMAH+]PM0.056-3.2, R2 = 0.87 (r = 0.93, P > 0.05) for the first four samples, and [DMAH+]PM2.5 = 5.0 * [DMAH+]PM0.056-3.2, R2 = 0.30 (r = 0.93, P < 0.05) for the remaining samples. When ([DMAH+]PM2.5 + [DMAgas]) was plotted against [DMAH+]PM0.010-3.2, the regression equations were almost the same, except for a large increase in R2 to 0.90 (r = 0.98, P < 0.01) for samples excluding the first four days. In addition, Figure 3e, f showed over 100% negative artifacts for particulate TMAH+ in the Nano-MOUDI-II sampling. Considering the pressure drop from larger to smaller size bins in Nano-MOUDI-II sampling alone (Figure 1), even greater negative artifacts for particulate DMAH+ and TMAH+ collected would be expected on the last three stages. Again, the Kelvin effect always results in smaller ratios of DMAH+ or TMAH+ to SO42- in nucleation mode and Aitken mode particles than those in accumulation mode particles in ambient air. The presence of E-DMAbelow0.056 and E-TMAbelow0.056 and absence of the correlation between them challenged the conventional theory on sampling artifacts, an adiabatic-expansion-induced perturbation formation of ionized DMA and non-ionized TMA is proposed to explain the unique phenomenon in Section 3.5.
3.3. Molar Concentration Size Distributions of DMAH+ and TMAH+ During Comparative Campaigns
The comparative campaigns were performed in November 2013, including a cruise campaign over the Yellow Sea and the Bohai Sea, and a coastal campaign at a site in Qingdao, China. Frequent occurrences of E-DMAbelow0.056, along with elevated levels of E-NH4+below0.056 and E-NO3-below0.056, were observed in the marine atmosphere, whereas this phenomenon was absent in the coastal atmosphere (Figure 5, Figure 7, Figure S4). E-TMAbelow0.056 was observed on some days in both the marine and coastal atmospheres, although not always on the same day (Figure 5 and Figure 7). This study primarily focuses on the comparative analysis of E-DMAbelow0.056 and E-TMAbelow0.056, while the extreme cases of E-NH4+below0.056 and E-NO3-below0.056 are discussed in a companion paper. Note that missing data for DMAH+ and TMAH+ in certain size bins below 0.056 μm in Figure 5a-d resulted from their ion chromatography signals being overshadowed by those of NH4+.
In the first and third samples collected in the marine atmosphere on 6 and 8 November 2013, when the vessel cruised over the Yellow Sea, the values of E-DMAbelow0.056 accounted for only ~1/4 of the corresponding droplet mode concentrations. In the second sample collected on 7 November 2013, E-DMAbelow0.056 exceeded the droplet mode concentrations because of a significant decrease in droplet mode values. For other instances of E-DMAbelow0.056, the concentrations were substantially larger than those of the corresponding droplet mode concentrations, regardless of whether they were from the marine atmosphere over the Yellow Sea or the Bohai Sea. Based solely on the campaign data, E-DMAbelow0.056 appeared to coincide with a reduction in droplet mode concentrations. However, in theory, E-DMAbelow0.056 should be determined by the concentrations of DMA and acidic vapors in the air upstream of the corresponding stage, as well as T and RH therein, rather than by aerosols collected in upstream stages. Notably, there was no detectable E-DMAbelow0.056 in the coastal atmosphere, except for a slight increase in the 0.032-0.056 μm size range on 6 November 2013. The increase should not be classified as the E-DMAbelow0.056 discussed earlier, as it was accompanied by a proportional increase in [SO42-].
E-TMAbelow0.056 was primarily observed in the presence of detectable droplet mode concentrations of TMAH+ in the marine atmosphere (Figure 5c, d). However, there was no correlation between E-TMAbelow0.056 values and those in the droplet mode. For example, the largest concentration of TMAH+ occurred in the 0.032-0.056 μm size range on 12 November 2013, which was nearly twice as high as that of the corresponding size bin on 6 November, while the opposite trend was observed for droplet mode concentrations of TMAH+. In cases where the detectable droplet mode of TMAH+ was absent because of low concentrations, E-TMAbelow0.056 was also generally absent, thus preventing further analysis. Again, a significant negative correlation was found between E-TMAbelow0.056 and E-NH4+below0.056 (P < 0.05, Figure 6b). In contrast, a significant positive correlation was observed between E-DMAbelow0.056 and E-NH4+below0.056 (r = 0.81, P < 0.01, Figure 6a).
When analyzing the molar concentration size distributions of particulate TMAH+ in the coastal atmosphere during the comparative campaigns, E-TMAbelow0.056 was detected in only 5 of the 21 coastal atmospheric samples - on 6, 17 and 19 November, and 1 and 2 December 2013. Notably, the largest values of E-TMAbelow0.056 were observed in different size bins, i.e., 0.032-0.056 μm on 6 November, 0.018-0.032 μm on 17 and 19 November, 0.010-0.018 μm on 1 and 2 December. A significant negative correlation was found between E-TMAbelow0.056 values and the corresponding accumulation mode concentrations (P < 0.05). For example, the highest accumulation mode concentration of TMAH+ occurred on 6 November and was approximately an order of magnitude higher than that on 1 December. Yet, E-TMAbelow0.056 on 1 December was three times greater than on 6 November. Again, the absence of a proportional increase in SO42-, NH4+ and NO3- indicated that E-TMAbelow0.056 was unlikely to result from the generation of ionized TMA salts.
3.4. Repeatable Occurrence of E-DMAbelow0.056 and E-TMAbelow0.056 in Marine and Coastal Atmospheres
The occurrence of E-DMAbelow0.056 and E-TMAbelow0.056 was highly repeatable; however, the occurrence frequency and size distribution pattern below 0.056 μm were highly variable. In general, the occurrence frequencies for E-TMAbelow0.056 were much higher than those for E-DMAbelow0.056. The presence of E-DMAbelow0.056 was mostly associated with that of E-NH4+below0.056 and E-NO3-below0.056. For example, E-TMAbelow0.056 was consistently observed with the largest values at 0.032-0.056 μm in the absence of the corresponding E-DMAbelow0.056 and E-NH4+below0.056 in the marine atmosphere during Campaign 7 (Figure 8). However, a strong correlation was found between [DMAH+]PM0.056-3.2 and [TMAH+]PM0.056-3.2 (r = 0.98, P < 0.01), with an overall ratio of [TMAH+]PM0.056-3.2/[DMAH+]PM0.056-3.2 around 0.29. In addition, there was no significant correlation between [TMAH+]PM0.056-3.2 and [TMAH+]PM0.010-0.056 (P > 0.05). Based on the aforementioned results and their consistent size distribution patterns, particulate DMAH+ and TMAH+ in the size ranges above 0.056 μm were likely derived from similar processes or sources, while E-TMAbelow0.056 may arise from different mechanisms. In addition, the concentrations of particulate DMAH+ and TMAH+ in the size ranges above 0.056 μm showed no significant correlation with corresponding particulate NH4+ values, implying that they might compete with NH3 to neutralize the acids or be derived from different sources of ammonium salts.
During the first half of Campaign 5, a slight E-TMAbelow0.056 was observed (Figure S5b). However, the fluctuations in particulate DMAH+ below 0.056 μm could not be definitively distinguished from noise. On 6 November 2012, an extreme E-NH4+below0.056 was detected without corresponding increases in DMAH+ or SO42- below 0.056 μm (Figure S5a, d), which contradicted the findings from Campaigns 3 and 6. In the second half of Campaign 5, extreme E-NH4+below0.056 occurred on 12, 15 and 18 November 2012, but E-DMAbelow0.056 was only detected on 18 November 2012 (Figure S6a, c). In other samples from this period, the concentrations of DMAH+ were too low to be distinguished from noise. Nevertheless, E-TMAbelow0.056 was observed in 5 of 7 samples, with no significant correlation between E-TMAbelow0.056 and E-NH4+below0.056.
In Campaign 1, no E-DMAbelow0.056 was observed (Figure S7). The observed E-TMAbelow0.056 were too low to be considered distinct from the noise. In this campaign, the values of [DMAH+]PM0.056-3.2 and [TMAH+]PM0.056-3.2 were substantively lower than those observed in other campaigns (Table S1). The lack of significant increases in E-DMAbelow0.056 and E-TMAbelow0.056 may be attributed to low concentrations of DMA and TMA gases, although they were not measured.
3.5. Cause Analysis for the More Frequent Observation of E-TMAbelow0.056 than E-DMAbelow0.056
To investigate why the E-TMAbelow0.056 was observed more frequently than E-DMAbelow0.056 in various campaigns, the mechanisms behind the occurrence of E-TMAbelow0.056 and E-DMAbelow0.056 were examined. In Campaigns 3, it was evident that the E-TMAbelow0.056 showed no significant correlation with the corresponding E-NH4+below0.056. However, a strong correlation was observed between E-DMAbelow0.056 and both E-NH4+below0.056 and E-NO3-below0.056 (Figure 4). This suggested that the E-TMAbelow0.056 did not result from a neutralization reaction to form TMAHNO3. In Campaigns 6, E-TMAbelow0.056 even showed a significant negative correlation with the corresponding E-NH4+below0.056 (Figure 6). These findings, supported by observations in Campaign 2, 4, 6 and 7, further corroborate the analysis.
To further justify the analysis, additional thermodynamic equilibrium simulations were conducted using the data from Campaign 3, as presented in Table S2. For the Base-test, the ionic concentrations measured by the AIM-IC during Campaign 3, including the gaseous components DMAgas, TMAgas, HNO3gas and NH3gas as well as their partners and SO42- in PM2.5, were used as inputs for E-AIM modeling. The average values of T (Tbase) and RH (RHbase) during each sampling period were used as inputs for E-AIM modeling. For Tests 1-3, the concentrations of DMAgas and TMAgas measured by the AIM-IC in Campaign 3, as well as NH4+below0.056 and NO3-below0.056 obtained from the Nano-MOUDI-II sampling, were used as input for E-AIM modeling. For Test 1, we assumed that the adiabatic-expansion-induced perturbation yielded reasonable result in gas-particle partitioning, i.e., fixed Ttest1 as Tbase, and RHtest1 increased in different extent (Table S2) to produce a liquid phase in E-AIM modeling. Note that the concentrations of NH4+ and NO3- in PM0.010-0.056 were too low (< 2 nmol m-3) in samples collected on 14 and 15 December to support the gas-particle partitioning, which were excluded from Tests 1-6. Base on Test 1, we assumed that the adiabatic-expansion-induced perturbation caused a 2, 4 K decrease in the temperature of the jetted air streams as their line speeds increased. Consequently, the inputs for ambient T and RH were adjusted as (Ttest1- 2) and (RHtest1 + 0.05) for Test 2, (Ttest1 - 4) and (RHtest1 + 0.10) for Test 3. The corresponding increase in RH was estimated from the opposite diurnal variations of ambient T and RH observed in Campaign 3. For Tests 4-6, we assumed that not all gaseous NH3 and HNO3 in the jetted air streams were converted to NH4NO3 in the last stages of Nano-MOUDI-II. Assuming that 50% gaseous NH3 and HNO3 remained in the jetted air streams, the inputs for NH4+ and NO3-+ were adjusted to 1.5*NH4+below0.056 and 1.5*NO3-below0.056. Other inputs were kept the same as in Tests 1-3, respectively.
The modeled concentrations of DMAgas and TMAgas were higher than the corresponding observational values, closely approximating the sum of ([DMAH+]PM2.5+[DMA]gas) and ([TMAH+]PM2.5+[TMA]gas), respectively, in the Case-base (Figure 9a, b), where the modeled NH3gas and NH4+PM2.5 deviated by +13% and -15%, respectively. The Case-base results for NH3gas and NH4+PM2.5 indicated that the gas-aerosol equilibrium was achieved to some extent. Thus, the observed DMAH+ and TMAH+ in PM2.5 were unlikely to co-exist with ammonium salts internally, as the model predicted they were predominantly in the gas phase. The result for TMA was consistent with the lack of correlations of TMAH+0.056-3.2 with NH4+0.056-3.2 as mentioned earlier, but the result for DMA was yet to be explained. However, the results from Test 1-6 indicated that the modeled DMA and TMA overwhelmingly existed in the particle phase. Moreover, the modeled ratios of [TMAgas]/[TMAH+] were proportional to the ratios of [DMAgas]/[DMAH+] in Test 1-6, which was inconsistent with the absence of correlation between E-TMAbelow0.056 and E-DMAbelow0.056 in Campaign 3. This suggested that E-TMAbelow0.056 should exist as non-ionic TMA rather than TMAH+ during sampling. Non-ionic TMA should be thermodynamically more stable than TMAHNO3; however, the exact chemical form remains unclear.
Overall, TMAgas likely required a low energy barrier to convert into chemicals that were thermodynamically more stable than TMAHNO3, allowing them to be collected in the last three stages of the Nano-MOUDI-II sampling due to rapid adiabatic expansion. However, DMAgas required the product of [DMAgas] * [HNO3gas] in the jetted air stream to exceed the theoretical threshold necessary for the formation of DMAHNO3. The latter condition was difficult to satisfy in many cases, at least in our campaigns.
3.6. Statistic Comparison of E-TMAbelow0.056 and E-DMAbelow0.056 Among Different Campaigns
To better understand the large variations in E-DMAbelow0.056 and E-TMAbelow0.056 across different campaigns, two parameters were introduced, i.e., the ratios of E-DMAbelow0.056 to DMAH+PM0.056-3.2 and E-TMAbelow0.056 to TMAH+PM0.056-3.2. The two parameters, which reflect perturbation results, was artificially classified into five levels (Table 1): Level-0 represents a negligible perturbation, where E-DMAbelow0.056 and E-TMAbelow0.056 are less than 15% of the corresponding DMAH+PM0.056-3.2 and E-TMAH+PM0.056-3.2; Level-1 represents a detectable but unconfirmed perturbation, with the ratio between 15% and 30%; Level-2 corresponds to a confirmed moderate perturbation, with the ratio between 30% and 100%; Level-3 represents a confirmed strong perturbation, with the ratio between 100% and 200%; Level-4 represents a confirmed extremely strong perturbation, where the ratio exceeds 200%.
Based on perturbation levels for E-DMAbelow0.056 listed in Table 1, perturbation formation was negligible in two-thirds of the cases across all seven campaigns. This suggests that the gas-particle partitioning of DMA deviated from the thermodynamic equilibrium, favoring evaporation into ambient air in most cases. The perturbation was not strong enough to change the equilibrium status. A similar conclusion applies to particulate NH4+ and NO3- in the absence of E-NH4+below0.056 and E-NO3-below0.056. The high consistency in the size distribution of DMAH+, NH4+ and NO3-, along with a strong correlation between DMAH+ and NH4+ in size bins < 0.056 μm, indicates the perturbation co-formation of DMAHNO3 and NH4NO3. In some cases, strong perturbation effects (Level-3 or Level-4) were observed for NH4+. However, the lack of confirmable perturbation formation for DMAH+ implies that gaseous DMA failed to compete with NH3 to react with HNO3 in these cases. For these cases, the gas-particle partitioning of DMA was similar to those where E-DMAbelow0.056 was absent. In cases where Level-3 or Level-4 perturbations were observed for both E-NH4+below0.056 and E-DMAbelow0.056, no conclusion can be drawn about the gas-particle partitioning of DMA in the ambient air, due to the potential artifact formation of HNO3 and NH3 gases during sampling, as discussed in the companion paper.
Based on perturbation observations for E-TMAbelow0.056 listed in Table 1, the perturbation levels varied from Level-1 to Level-4 in three-fourths of the cases across different campaigns. Despite the lack of simultaneous perturbation effects for DMAH+ in some sampling periods, the good correlation and similar mode distribution patterns of TMAH+ and DMAH+ in PM0.056-1.0 indicate that the perturbation resulted in non-ionized TMA rather than TMAH+. In addition, the strongest perturbation of TMA typically occurred in the 0.032-0.056 μm size bin, although it was occasionally observed in smaller size bins, suggesting that effective perturbation begins at the 0.032-0.056 μm size bin and intensifies with deceasing size.
When combining data from all seven campaigns, it can be argued that E-DMAbelow0.056 and E-TMAbelow0.056 had a higher probability to be obtained 1) in marine atmospheres compared to coastal atmosphere, 2) in colder ambient temperature coastal atmospheres, and with larger line speeds of air streams in the last three stages in Nano-MOUDI-II sampling. However, the mechanisms behind these observations are not yet fully explained in this study.
4. Conclusion and Future Studies
This study presents a unique phenomenon observed during Nano-MOUDI-II sampling in coastal and marine atmospheres, specifically the adiabatic-expansion-induced perturbation formation of particulate DMA and TMA on the last three stages. A comprehensive analysis was conducted to rule out the possibility of physically generating more DMA and TMA particulates in the size range below 0.056 μm than the larger size range (0.056-3.2 μm) in the ambient air. However, the unique phenomenon was highly valuable for studying gas-aerosol partitioning. The absence of the E-DMAbelow0.056 and E-NH4+below0.056 indicated that they tended to evaporate from the particle phase to the gas phase in ambient air, with the reverse generally being true, except in cases where additional formation of HNO3 and NH3 occurred during sampling.
The analysis further found that the observed particulate TMA in coastal and marine atmospheres existed predominantly in their non-ionized form, which had been mistakenly treated as ionic TMA particulates in current 3-D modeling in the literature. In the coastal atmosphere, the observed particulate DMA were generally non-ionized as well, though they could form in the presence of sufficient HNO3 vapor. However, this study alone cannot conclusively determine the chemical form of observed DMA particulates in the marine atmosphere.
This study also raises concerns about data on the chemical composition of atmospheric nanometer particles reported in the literature, especially when adiabatic expansion occurs in the analytic system. The signals reported might be perturbation artifact rather than actual signals, as presented in this study.
Future studies need to focus on quantifying the theoretical perturbation coefficients, such as temperature and air pressure drop, increased relative humidity, and degree of supersaturation, etc., at different size bins under various ambient conditions and MOUDI sampling flow rates (which affect line speeds of air stream through the nozzles). This will require significant time and resources, but collaboration across research groups could expedite this process. This is precisely why the authors are reporting these findings to the research community. Moreover, the design of temperature control on the last three stages should also be considered for further perturbation applications.
Supplementary Materials
The following supporting information can be downloaded at: Preprints.org, Figure S1: Molar concentration size distributions of field blank samples for NO3- (a), NH4+ (b), DMAH+ (c), and TMAH+ (d) over the Yellow Sea and Bohai Sea in 2013; similar to (a-d) but in Qingdao in 2015 (e-h), over the northwest Pacific Ocean (NWPO) in 2015 (i-l), over the South China Sea in 2017 and in Qingdao in 2020 and 2022 (m-p); Figure S2. Molar concentration size distributions of NH4+ (a), SO42- (b), NO3- (c), DMAH+ (d) and TMAH+ (e); Figure S3: Molar concentration size distributions of NO3- (a), [NO3-]PM2.5 measured by AIM-IC vs. [NO3-]PM0.056-3.2 collected by MOUDI (b); [NH4+]PM2.5 measured by AIM-IC vs. [NH4+*]PM0.056-3.2 collected by MOUDI (c); similar to (c) but for SO42- (d); similar to (c) but for NO3- (e) during Campaign 2. NH4+*, SO42-*, and NO3-* in (c-e) represent the concentrations measured on 27-30 November 2015 were divided by 2; Figure S4: Molar concentration size distributions of NO3- in marine atmospheres over the Yellow Sea (a) and the Bohai Sea (b), in coastal atmosphere (c) in November, 2013; Figure S5: Molar concentration size distributions of DMAH+ (a), TMAH+ (b), NH4+ (c), and SO42- (d) in atmospheric particles collected over the south Yellow sea in 2012; Figure S6: Molar concentration size distributions of DMAH+ (a), TMAH+ (b), NH4+ (c), and SO42- (d) in atmospheric particles collected over the north Yellow sea and the Bohai sea in 2012; Figure S7: Molar concentration size distributions of DMAH+ (a), TMAH+ (b) and NH4+ (c); and correlations of DMAH+ vs. NH4+ (d), TMAH+ vs. NH4+ (e), TMAH+ vs. DMAH+ (f), and NH4+ vs. N+2*S (g) in PM0.056-1.0 during Campaign 1; Table S1: The concentration of DMAH+ and TMAH+ in PM0.010-3.2 and PM0.010-0.056 collected by MOUDI and in PM2.5 measured by AIM-IC in different campaigns; Table S2: Adjusted RH according to RHbase in Test 1.
Author Contributions
Conceptualization, X.Y.; methodology, Y.G. and X.Y.; formal analysis, Y.G.; data curation, X.Y.; writing—original draft preparation, Y.G.; writing—review and editing, X.Y.; supervision, X.Y.; funding acquisition, X.Y. All authors have read and agreed to the published version of the manuscript.
Funding
This research was funded by Natural Science Foundation of China, grant number 42276036; and Hainan Provincial Natural Science Foundation of China, grant number 422MS098
Institutional Review Board Statement
Not applicable.
Informed Consent Statement
Not applicable.
Data Availability Statement
The original data presented in the study are openly available at https://data.mendeley.com and should be cited as follows: Gao, Yating; Yao, Xiaohong (2025), “Nano MOUDI-II sampling data from Qingdao and China's marginal seas in 2012-2022 (1)”, Mendeley Data, V1, doi: 10.17632/4h83mftgp2.1.
Acknowledgments
This work was supported by the Natural Science Foundation of China (grant no. 42276036) and the Hainan Provincial Natural Science Foundation of China (grant no. 422MS098).
Conflicts of Interest
The authors declare no conflicts of interest.
Abbreviations
The following abbreviations are used in this manuscript:
| AIM-IC | Ambient Ion Monitor – Ion Chromatograph |
| BS | the Bohai Sea |
| CCN | Cloud Condensation Nuclei |
| DMAgas/DMAH+ | gaseous/particulate dimethylamine |
| E-DMAbelow0.056/ E-TMAbelow0.056/ E-NH4+below0.056/ E-NO3-below0.056 | Elevated DMAH+/TMAH+/NH4+/NO3- concentrations in the size ranges below 0.056 μm compared to the size range of 0.056-0.10 μm |
| MMAD | Molar Median Aerodynamic Diameter |
| Nano MOUDI-II | Nano Micro-Orifice Uniform-Deposit Impactor, second generation |
| PM2.5 | Particulate matter with the aerodynamic diameter below 2.5 μm collected by AIM-IC |
| PM0.056-3.2/PM0.018-3.2/PM0.010-3.2/PM0.010-0.056/PM0.056-1.0 | Particulate matter with the aerodynamic diameter of 0.056-3.2/0.018-3.2/0.010-3.2/0.010-0.056/0.056-1.0 μm collected by Nano MOUDI-II |
| PTFE | Polytetrafluoroethylene |
| RH | Relative Humidity |
| T | Temperature |
| TMAgas/TMAH+ | gaseous/particulate trimethylamine |
| YS | the Yellow Sea |
References
- Seinfeld, J.H.; Pandis, S.N. Atmospheric chemistry and physics: from air pollution to climate change, 3rd ed.; John Wiley & Sons, Inc.: New Jersey, 2016; pp. 154–196. [Google Scholar]
- Chaturvedi, S.; Kumar, A.; Singh, V.; Chakraborty, B.; Kumar, R.; Min, L. Recent advancement in organic aerosol understanding: a review of their sources, formation, and health impacts. Water, Air, & Soil Pollution 2023, 234, 750. [Google Scholar] [CrossRef]
- Mahilang, M.; Deb, M.K.; Pervez, S. Biogenic secondary organic aerosols: a review on formation mechanism, analytical challenges and environmental impacts. Chemosphere 2021, 262, 127771. [Google Scholar] [CrossRef] [PubMed]
- Peng, J.; Hu, M.; Shang, D.; Wu, Z.; Du, Z.; Tan, T.; Wang, Y.; Zhang, F.; Zhang, R. Explosive secondary aerosol formation during severe haze in the North China Plain. Environ. Sci. Technol. 2021, 55, 2189–2207. [Google Scholar] [CrossRef] [PubMed]
- Shen, Y.; Meng, H.; Yao, X.; Peng, Z.; Sun, Y.; Zhang, J.; Gao, Y.; Feng, L.; Liu, X.; Gao, H. Does ambient secondary conversion or the prolonged fast conversion in combustion plumes cause severe PM₂.₅ air pollution in China? Atmosphere 2022, 13, 673. [Google Scholar] [CrossRef]
- Holmes, M.H. Introduction to perturbation methods, 2nd ed.; Springer: New York, 2013; pp. 1–420. [Google Scholar]
- Dusek, U.; Frank, G.P.; Hildebrandt, L.; Curtius, J.; Schneider, J.; Walter, S.; Chand, D.; Drewnick, F.; Hings, S.; Jung, D.; Borrmann, S.; Andreae, M.O. Size matters more than chemistry for cloud-nucleating ability of aerosol particles. Science 2006, 312, 1375–1378. [Google Scholar] [CrossRef]
- Kerminen, V.M.; Paramonov, M.; Anttila, T.; Riipinen, I.; Fountoukis, C.; Korhonen, H.; Asmi, E.; Laakso, L.; Lihavainen, H.; Swietlicki, E.; Svenningsson, B.; Asmi, A.; Pandis, S.N.; Kulmala, M.; Petäjä, T. Cloud condensation nuclei production associated with atmospheric nucleation: a synthesis based on existing literature and new results. Atmos. Chem. Phys. 2012, 12, 12037–12059. [Google Scholar] [CrossRef]
- Kerminen, V.; Chen, X.; Vakkari, V.; Petäjä, T.; Kulmala, M.; Bianchi, F. Atmospheric new particle formation and growth: review of field observations. Environ. Res. Lett. 2018, 13, 103003. [Google Scholar] [CrossRef]
- Small, J.D.; Chuang, P.Y.; Feingold, G.; Jiang, H. Can aerosol decrease cloud lifetime? Geophys. Res. Lett. 2009, 36. [Google Scholar] [CrossRef]
- Sullivan, R.C.; Crippa, P.; Matsui, H.; Leung, L.R.; Zhao, C.; Thota, A.; Pryor, S.C. New particle formation leads to cloud dimming. npj Clim. Atmos. Sci. 2018, 1, 9. [Google Scholar] [CrossRef]
- Twohy, C.H.; Petters, M.D.; Snider, J.R.; Stevens, B.; Tahnk, W.; Wetzel, M.; Russell, L.; Burnet, F. Evaluation of the aerosol indirect effect in marine stratocumulus clouds: droplet number, size, liquid water path, and radiative impact. J. Geophys. Res. Atmos. 2005, 110. [Google Scholar] [CrossRef]
- Wei, X.; Shen, Y.; Yu, X.Y.; Gao, Y.; Gao, H.; Chu, M.; Zhu, Y.; Yao, X. Investigating the contribution of grown new particles to cloud condensation nuclei with largely varying preexisting particles – Part 1: observational data analysis. Atmos. Chem. Phys. 2023, 23, 15325–15350. [Google Scholar] [CrossRef]
- Yu, F.; Luo, G.; Nair, A.A.; Schwab, J.J.; Sherman, J.P.; Zhang, Y. Wintertime new particle formation and its contribution to cloud condensation nuclei in the Northeastern United States. Atmos. Chem. Phys. 2020, 20, 2591–2601. [Google Scholar] [CrossRef]
- Guo, S.; Hu, M.; Peng, J.; Wu, Z.; Zamora, M.L.; Shang, D.; Du, Z.; Zheng, J.; Fang, X.; Tang, R.; Wu, Y.; Zeng, L.; Shuai, S.; Zhang, W.; Wang, Y.; Ji, Y.; Li, Y.; Zhang, A.L.; Wang, W.; Zhang, F.; Zhao, J.; Gong, X.; Wang, C.; Molina, M.J.; Zhang, R. Remarkable nucleation and growth of ultrafine particles from vehicular exhaust. Proc. Natl. Acad. Sci. U.S.A. 2020, 117, 3427–3432. [Google Scholar] [CrossRef]
- Xie, H.; Feng, L.; Hu, Q.; Zhu, Y.; Gao, H.; Gao, Y.; Yao, X. Concentration and size distribution of water-extracted dimethylaminium and trimethylaminium in atmospheric particles during nine campaigns – implications for sources, phase states and formation pathways. Sci. Total Environ. 2018, 631–632, 130–141. [Google Scholar] [CrossRef]
- Yu, P.; Hu, Q.; Li, K.; Zhu, Y.; Liu, X.; Gao, H.; Yao, X. Characteristics of dimethylaminium and trimethylaminium in atmospheric particles ranging from supermicron to nanometer sizes over eutrophic marginal seas of China and oligotrophic open oceans. Sci. Total Environ. 2016, 572, 813–824. [Google Scholar] [CrossRef] [PubMed]
- Berndt, T.; Møller, K.H.; Herrmann, H.; Kjaergaard, H.G. Trimethylamine outruns terpenes and aromatics in atmospheric autoxidation. J. Phys. Chem. A 2021, 125, 4454–4466. [Google Scholar] [CrossRef] [PubMed]
- Chan, L.P.; Chan, C.K. Role of the aerosol phase state in ammonia/amines exchange reactions. Environ. Sci. Technol. 2013, 47, 5755–5762. [Google Scholar] [CrossRef]
- Chen, D.; Yao, X.; Chan, C.K.; Tian, X.; Chu, Y.; Clegg, S.L.; Shen, Y.; Gao, Y.; Gao, H. Competitive uptake of dimethylamine and trimethylamine against ammonia on acidic particles in marine atmospheres. Environ. Sci. Technol. 2022, 56, 5430–5439. [Google Scholar] [CrossRef] [PubMed]
- De Haan, D.O.; Hawkins, L.N.; Welsh, H.G.; Pednekar, R.; Casar, J.R.; Pennington, E.A.; de Loera, A.; Jimenez, N.G.; Symons, M.A.; Zauscher, M.; Pajunoja, A.; Caponi, L.; Cazaunau, M.; Formenti, P.; Gratien, A.; Pangui, E.; Doussin, J. Brown carbon production in ammonium- or amine-containing aerosol particles by reactive uptake of methylglyoxal and photolytic cloud cycling. Environ Sci Technol 2017, 51, 7458–7466. [Google Scholar] [CrossRef]
- De Haan, D.O.; Tapavicza, E.; Riva, M.; Cui, T.; Surratt, J.D.; Smith, A.C.; Jordan, M.; Nilakantan, S.; Almodovar, M.; Stewart, T.N.; de Loera, A.; De Haan, A.C.; Cazaunau, M.; Gratien, A.; Pangui, E.; Doussin, J. Nitrogen-containing, light-absorbing oligomers produced in aerosol particles exposed to methylglyoxal, photolysis, and cloud cycling. Environ Sci Technol 2018, 52, 4061–4071. [Google Scholar] [CrossRef]
- Liu, F.; Bi, X.; Zhang, G.; Lian, X.; Fu, Y.; Yang, Y.; Lin, Q.; Jiang, F.; Wang, X.; Peng, P.; Sheng, G. Gas-to-particle partitioning of atmospheric amines observed at a mountain site in southern China. Atmos Environ 2018, 195, 1–11. [Google Scholar] [CrossRef]
- Marrero-Ortiz, W.; Hu, M.; Du, Z.; Ji, Y.; Wang, Y.; Guo, S.; Lin, Y.; Gomez-Hermandez, M.; Peng, J.; Li, Y.; Secrest, J.; Zamora, M.L.; Wang, Y.; An, T.; Zhang, R. Formation and optical properties of brown carbon from small α-dicarbonyls and amines. Environ Sci Technol 2019, 53, 117–126. [Google Scholar] [CrossRef]
- Møller, K.H.; Berndt, T.; Kjaergaard, H.G. Atmospheric autoxidation of amines. Environ Sci Technol 2020, 54, 11087–11099. [Google Scholar] [CrossRef]
- Ning, A.; Liu, L.; Zhang, S.; Yu, F.; Du, L.; Ge, M.; Zhang, X. The critical role of dimethylamine in the rapid formation of iodic acid particles in marine areas. Npj Clim Atmos Sci 2022, 5, 1–9. [Google Scholar] [CrossRef]
- Price, D.J.; Clark, C.H.; Tang, X.; Cocker, D.R.; Purvis-Roberts, K.L.; Silva, P.J. Proposed chemical mechanisms leading to secondary organic aerosol in the reactions of aliphatic amines with hydroxyl and nitrate radicals. Atmos Environ 2014, 96, 135–144. [Google Scholar] [CrossRef]
- Qiu, C.; Wang, L.; Lal, V.; Khalizov, A.F.; Zhang, R. Heterogeneous reactions of alkylamines with ammonium sulfate and ammonium bisulfate. Environ Sci Technol 2011, 45, 4748–4755. [Google Scholar] [CrossRef]
- Shen, J.; Elm, J.; Xie, H.; Chen, J.; Niu, J.; Vehkamäki, H. Structural effects of amines in enhancing methanesulfonic acid-driven new particle formation. Environ Sci Technol 2020, 54, 13498–13508. [Google Scholar] [CrossRef] [PubMed]
- Shen, X.; Chen, J.; Li, G.; An, T. A new advance in the pollution profile, transformation process, and contribution to aerosol formation and aging of atmospheric amines. Environmental Science: Atmospheres 2023, 3, 444–473. [Google Scholar] [CrossRef]
- Smith, J.N.; Barsanti, K.C.; Friedli, H.R.; Ehn, M.; Kulmala, M.; Collins, D.R.; Scheckman, J.H.; Williams, B.J.; McMurry, P.H. Observations of aminium salts in atmospheric nanoparticles and possible climatic implications. Proc. Natl. Acad. Sci. 2010, 107, 6634–6639. [Google Scholar] [CrossRef]
- Wang, Y.; Hu, M.; Lin, P.; Tan, T.; Li, M.; Xu, N.; Zheng, J.; Du, Z.; Qin, Y.; Wu, Y.; Lu, S.; Song, Y.; Wu, Z.; Guo, S.; Zeng, L.; Huang, X.; He, L. Enhancement in particulate organic nitrogen and light absorption of humic-like substances over Tibetan Plateau due to long-range transported biomass burning emissions. Environ Sci Technol 2019, 53, 14222–14232. [Google Scholar] [CrossRef]
- Yao, L.; Garmash, O.; Bianchi, F.; Zheng, J.; Yan, C.; Kontkanen, J.; Junninen, H.; Mazon, S.B.; Ehn, M.; Paasonen, P.; Sipilä, M.; Wang, M.; Wang, X.; Xiao, S.; Chen, H.; Lu, Y.; Zhang, B.; Wang, D.; Fu, Q.; Geng, F.; Li, L.; Wang, H.; Qiao, L.; Yang, X.; Chen, J.; Kerminen, V.; Petäjä, T.; Worsnop, D.R.; Kulmala, M.; Wang, L. Atmospheric new particle formation from sulfuric acid and amines in a Chinese megacity. Science 2018, 361, 278–281. [Google Scholar] [CrossRef]
- Zhang, W.; Zhong, J.; Shi, Q.; Gao, L.; Ji, Y.; Li, G.; An, T.; Francisco, J.S. Mechanism for rapid conversion of amines to ammonium salts at the air–particle interface. J Am Chem Soc 2021, 143, 1171–1178. [Google Scholar] [CrossRef] [PubMed]
- Cai, R.; Yin, R.; Yan, C.; Yang, D.; Deng, C.; Dada, L.; Kangasluoma, J.; Kontkanen, J.; Halonen, R.; Ma, Y.; Zhang, X.; Paasonen, P.; Petäjä, T.; Kerminen, V.; Liu, Y.; Bianchi, F.; Zheng, J.; Wang, L.; Hao, J.; Smith, J.N.; Donahue, N.M.; Kulmala, M.; Worsnop, D.R.; Jiang, J. The missing base molecules in atmospheric acid–base nucleation. National Science Reviewnational Science Review 2022, 9. [Google Scholar] [CrossRef]
- Yin, R.; Yan, C.; Cai, R.; Li, X.; Shen, J.; Lu, Y.; Schobesberger, S.; Fu, Y.; Deng, C.; Wang, L.; Liu, Y.; Zheng, J.; Xie, H.; Bianchi, F.; Worsnop, D.R.; Kulmala, M.; Jiang, J. Acid–base clusters during atmospheric new particle formation in urban Beijing. Environ Sci Technol 2021, 55, 10994–11005. [Google Scholar] [CrossRef] [PubMed]
- Ge, X.; Wexler, A.S.; Clegg, S.L. Atmospheric amines – Part I. A review. Atmos Environ 2011, 45, 524–546. [Google Scholar] [CrossRef]
- Ge, X.; Wexler, A.S.; Clegg, S.L. Atmospheric amines – Part II. Thermodynamic properties and gas/particle partitioning. Atmos Environ 2011, 45, 561–577. [Google Scholar] [CrossRef]
- Pankow, J.F. Phase considerations in the gas/particle partitioning of organic amines in the atmosphere. Atmos Environ 2015, 122, 448–453. [Google Scholar] [CrossRef]
- Chen, D.; Shen, Y.; Wang, J.; Gao, Y.; Gao, H.; Yao, X. Mapping gaseous dimethylamine, trimethylamine, ammonia, and their particulate counterparts in marine atmospheres of China's marginal seas – Part 1: Differentiating marine emission from continental transport. Atmos Chem Phys 2021, 21, 16413–16425. [Google Scholar] [CrossRef]
- Hu Q, Qu K, Gao H, Cui Z, Gao Y, Yao X. Large increases in primary trimethylaminium and secondary dimethylaminium in atmospheric particles associated with cyclonic eddies in the Northwest Pacific Ocean. J. Geophys. Res. Atmos. 2018, 123, 112–133, 146. [Google Scholar] [CrossRef]
- Teng X, Hu Q, Zhang L, Qi J, Shi J, Xie H, Gao H, Yao X. Identification of major sources of atmospheric NH₃ in an urban environment in Northern China during wintertime. Environ. Sci. Technol. 2017, 51, 6839–6848. [Google Scholar] [CrossRef]
- Clegg SL, Kleeman MJ, Griffin RJ, Seinfeld JH. Effects of uncertainties in the thermodynamic properties of aerosol components in an air quality model – Part 1: Treatment of inorganic electrolytes and organic compounds in the condensed phase. Atmos. Chem. Phys. 2008, 8, 1057–1085. [Google Scholar] [CrossRef]
- Andrews, DG. An Introduction to Atmospheric Physics. Cambridge University Press: Cambridge, 2010.
- Du W, Wang X, Yang F, Bai K, Wu C, Liu S, Wang F, Lv S, Chen Y, Wang J, Liu W, Wang L, Chen X, Wang G. Particulate amines in the background atmosphere of the Yangtze River Delta, China: Concentration, size distribution, and sources. Adv. Atmos. Sci. 2021, 38, 1128–1140. [Google Scholar] [CrossRef]
- Liu F, Bi X, Zhang G, Peng L, Lian X, Lu H, Fu Y, Wang X, Peng P, Sheng G. Concentration, size distribution and dry deposition of amines in atmospheric particles of urban Guangzhou, China. Atmos. Environ. 2017, 171, 279–288. [Google Scholar] [CrossRef]
- VandenBoer TC, Petroff A, Markovic MZ, Murphy JG. Size distribution of alkyl amines in continental particulate matter and their online detection in the gas and particle phase. Atmos. Chem. Phys. 2011, 11, 4319–4332. [Google Scholar] [CrossRef]
- Ondov JM, Wexler AS. Where do particulate toxins reside? An improved paradigm for the structure and dynamics of the urban mid-Atlantic aerosol. Environ. Sci. Technol. 1998, 32, 2547–2555. [Google Scholar] [CrossRef]
- Tsai J, Lai W, Chiang H. Characteristics of particulate constituents and gas precursors during the episode and non-episode periods. J. Air Waste Manage. 2013, 63, 27–40. [Google Scholar] [CrossRef]
- Kittelson, DB. Engines and nanoparticles: a review. J. Aerosol Sci. 1998, 29, 575–588. [Google Scholar] [CrossRef]
- Yao X, Fang M, Chan CK, Ho KF, Lee S. Characterization of dicarboxylic acids in PM₂.₅ in Hong Kong. Atmos. Environ. 2004, 38, 963–970. [Google Scholar] [CrossRef]
- Yao XH, Fang M, Chan CK. Experimental study of the sampling artifact of chloride depletion from collected sea salt aerosols. Environ. Sci. Technol. 2001, 35, 600–605. [Google Scholar] [CrossRef]
- Tao Y, Murphy JG. Evidence for the importance of semivolatile organic ammonium salts in ambient particulate matter. Environ. Sci. Technol. 2019, 53, 108–116. [Google Scholar] [CrossRef]
- Ehn M, Thornton JA, Kleist E, Sipilä M, Junninen H, Pullinen I, Springer M, Rubach F, Tillmann R, Lee B, Lopez-Hilfiker F, Andres S, Acir I, Rissanen M, Jokinen T, Schobesberger S, Kangasluoma J, Kontkanen J, Nieminen T, Kurtén T, Nielsen LB, Jørgensen S, Kjaergaard HG, Canagaratna M, Maso MD, Berndt T, Petäjä T, Wahner A, Kerminen V, Kulmala M, Worsnop DR, Wildt J, Mentel TF. A large source of low-volatility secondary organic aerosol. Nature 2014, 506, 476–479. [Google Scholar] [CrossRef]
- Chan CK, Yao X. Air pollution in mega cities in China. Atmos. Environ. 2008, 42, 1–42. [Google Scholar] [CrossRef]
- Chang L, Tsai J, Chang K, Lin JJ. Water-soluble inorganic ions in airborne particulates from the nano to coarse mode: a case study of aerosol episodes in southern region of Taiwan. Environ. Geochem. Hlth 2008, 30, 291–303. [Google Scholar] [CrossRef]
- Wei X, Zhu Y, Gao Y, Gao H, Yao X. Statistical analysis and environmental impact of pre-existing particle growth events in a Northern Chinese coastal megacity: A 725-day study in 2010–2018. Sci. Total Environ. 2024, 933, 173227. [Google Scholar] [CrossRef]
- Zhu Y, Shen Y, Li K, Meng H, Sun Y, Yao X, Gao H, Xue L, Wang W. Investigation of particle number concentrations and new particle formation with largely reduced air pollutant emissions at a coastal semi-urban site in Northern China. J. Geophys. Res. Atmos. 2021, 126, e2021JD035419. [Google Scholar] [CrossRef]
Figure 1.
Map of the coastal sampling sites (© Google Earth) and oceanic zones (a); picture for measuring Nano-MOUDI outside surface temperature in sampling (b); pictures for top view of outside and inside stages (c) and measured Nano-MOUDI surface temperature in sampling (d).
Figure 1.
Map of the coastal sampling sites (© Google Earth) and oceanic zones (a); picture for measuring Nano-MOUDI outside surface temperature in sampling (b); pictures for top view of outside and inside stages (c) and measured Nano-MOUDI surface temperature in sampling (d).
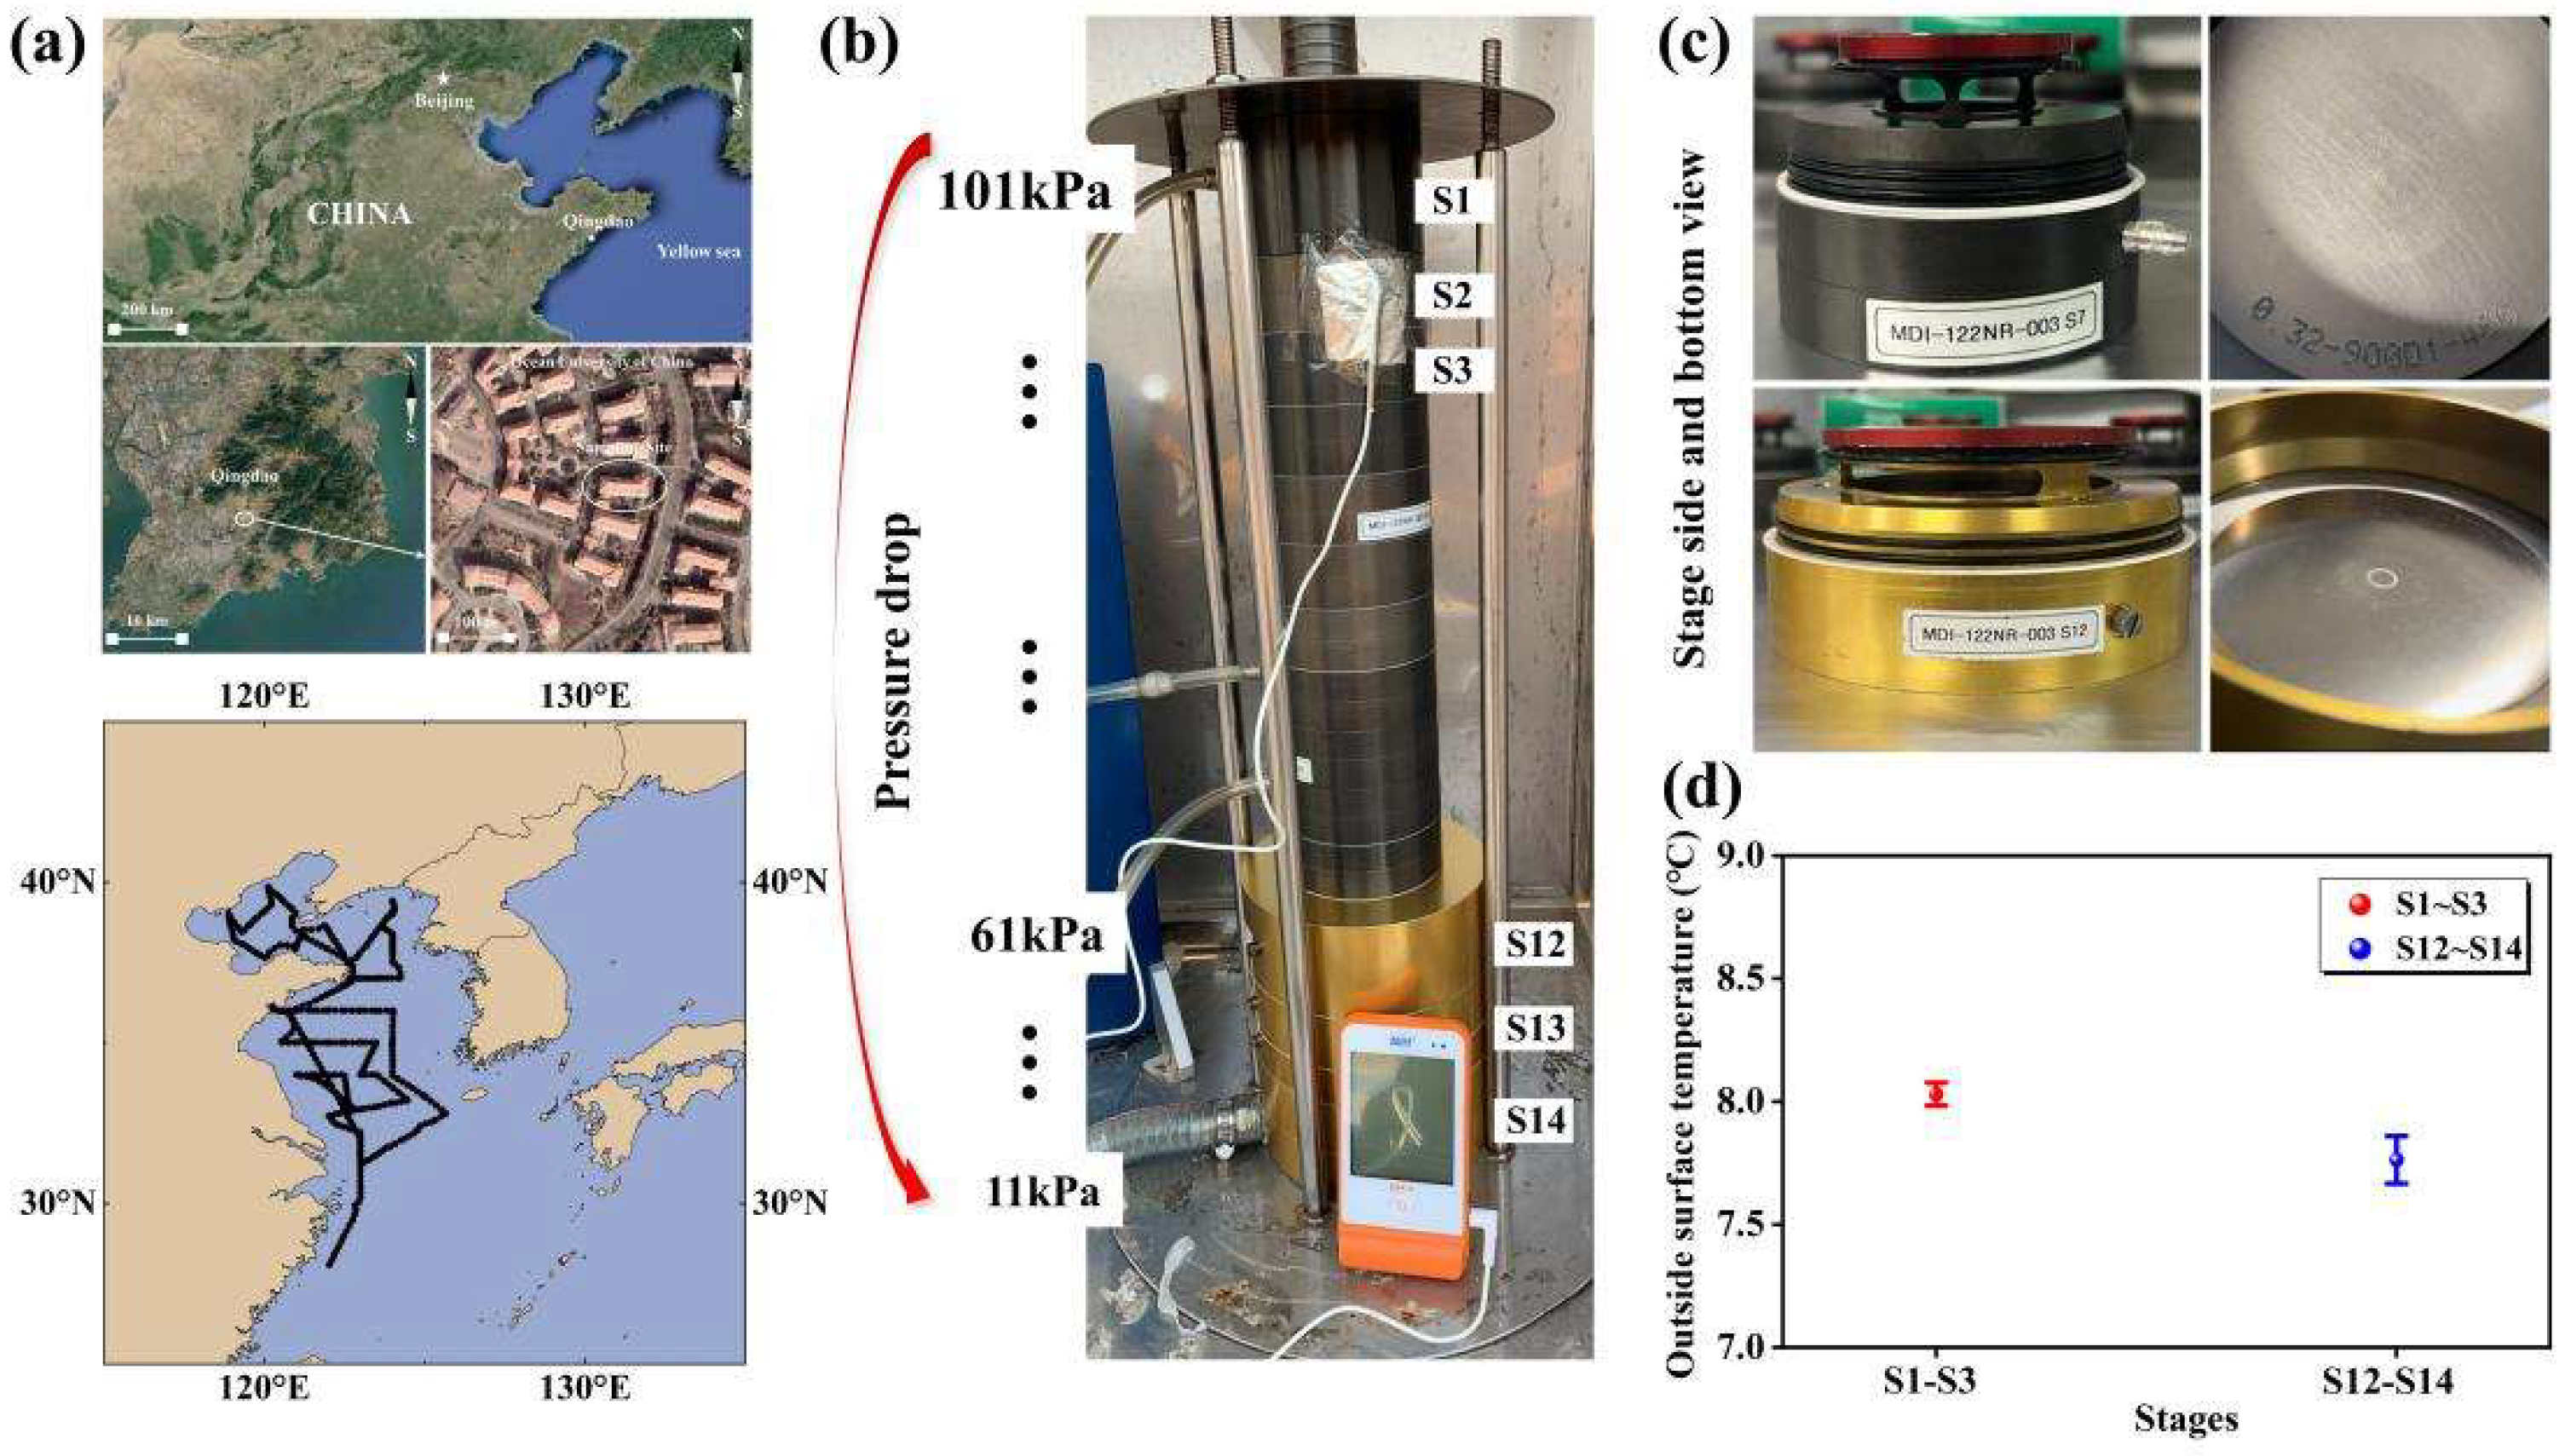
Figure 2.
Molar concentration size distributions of NH4+ (a), SO42- (b), NO3- (c), DMAH+ (d) and TMAH+ (e); [NH4+]PM2.5 vs. [NH4+]PM0.056-3.2 (f); similar to (f) but for SO42- (g); similar to (f) but for NO3- (h); [NH4+]PM2.5 and [NH4+]PM0.056-3.2 vs. the corresponding values of [N+2*S] (i); ([SO42-]PM0.056-3.2 - [SO42-]PM2.5)*2 vs. ([NO3-]PM2.5 - [NO3-]PM0.056-3.2) (j) (N and S in (i) represent NO3- and SO42-, respectively; [NH4+]PM2.5 and [NH4+]PM0.056-3.2 were NH4+ concentrations measured by the AIM-IC and collected by the Nano-MOUDI, which were defined in the text, respectively).
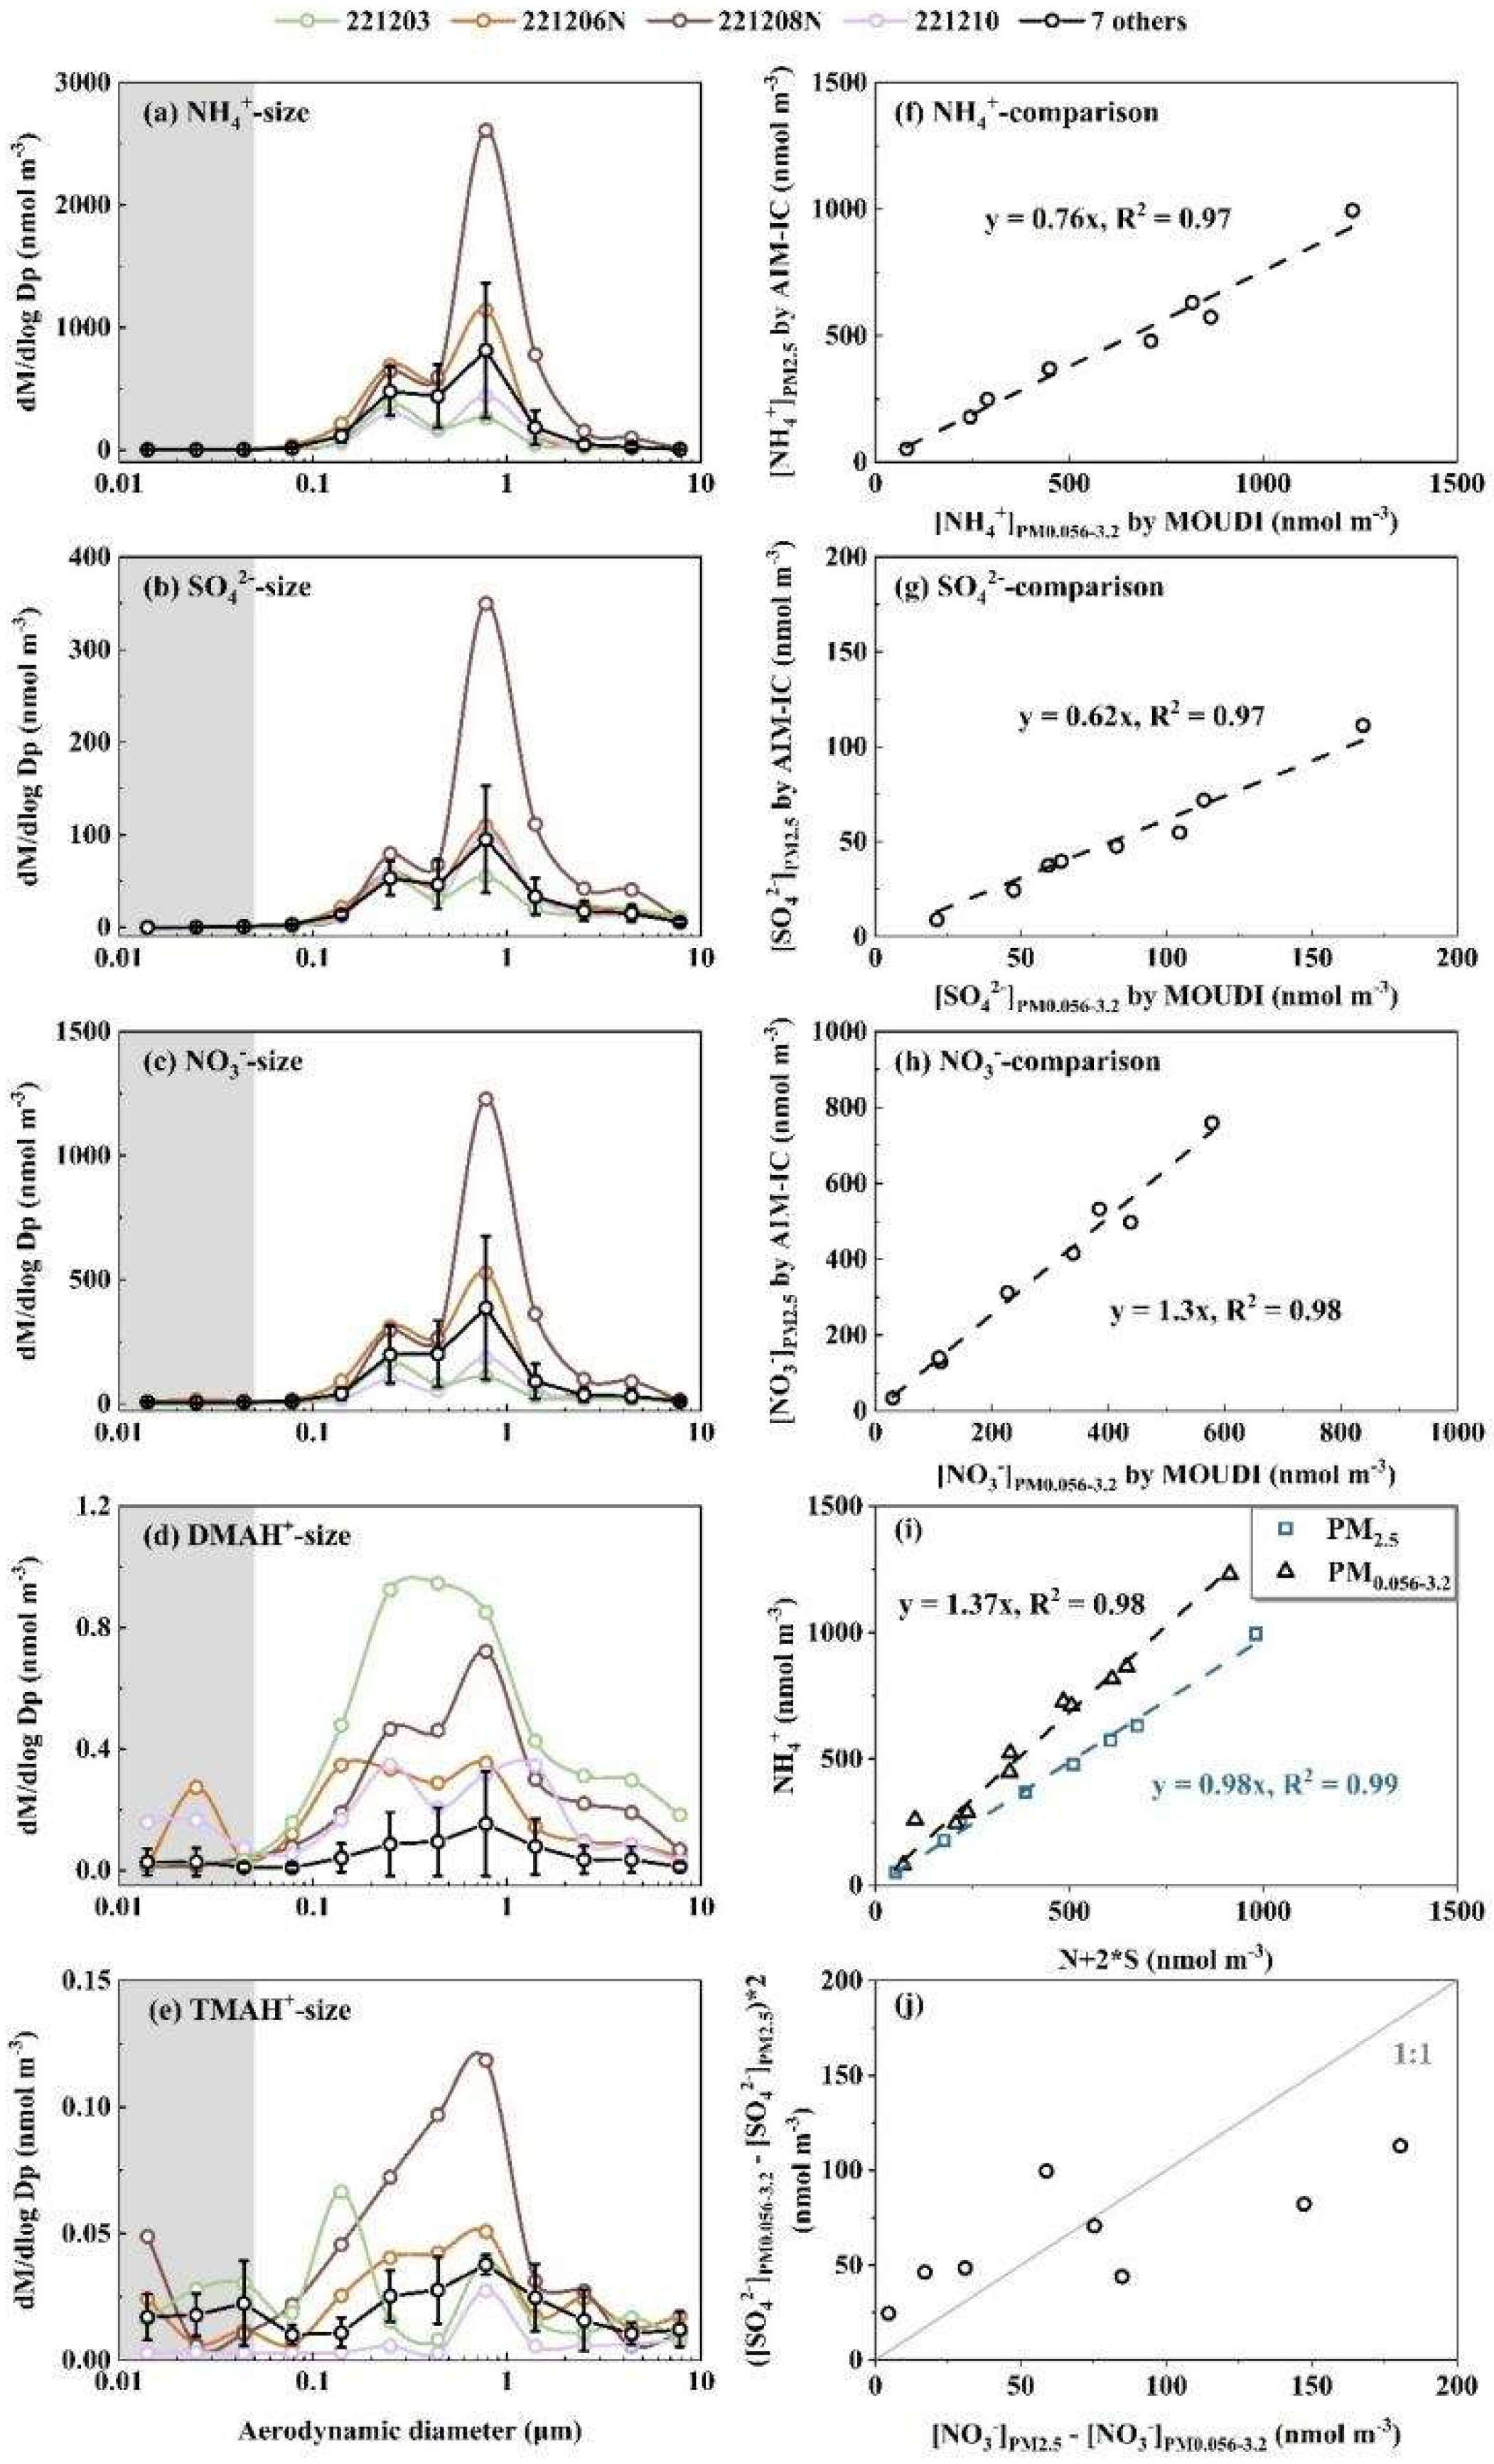
Figure 3.
Molar concentration size distributions of DMAH+ (a), TMAH+ (d), NH4+ (g) and SO42- (i); [DMAH+]PM2.5 measured by AIM-IC vs. [DMAH+]PM0.056-3.2 collected by MOUDI (b); similar to (b) but for TMAH+ (e); similar to (b) but for NH4+ (h); similar to (b) but for SO42- (j); [DMAgas] + [DMAH+]PM2.5 measured by AIM-IC vs. [DMAH+]PM0.010-3.2 collected by MOUDI (c); similar to (c) but for TMAH+ (f). Blue and black markers in (b, c, e, f, h, j) represent the data measured on 27-30 November and on 4-6, 14,15 December, respectively.
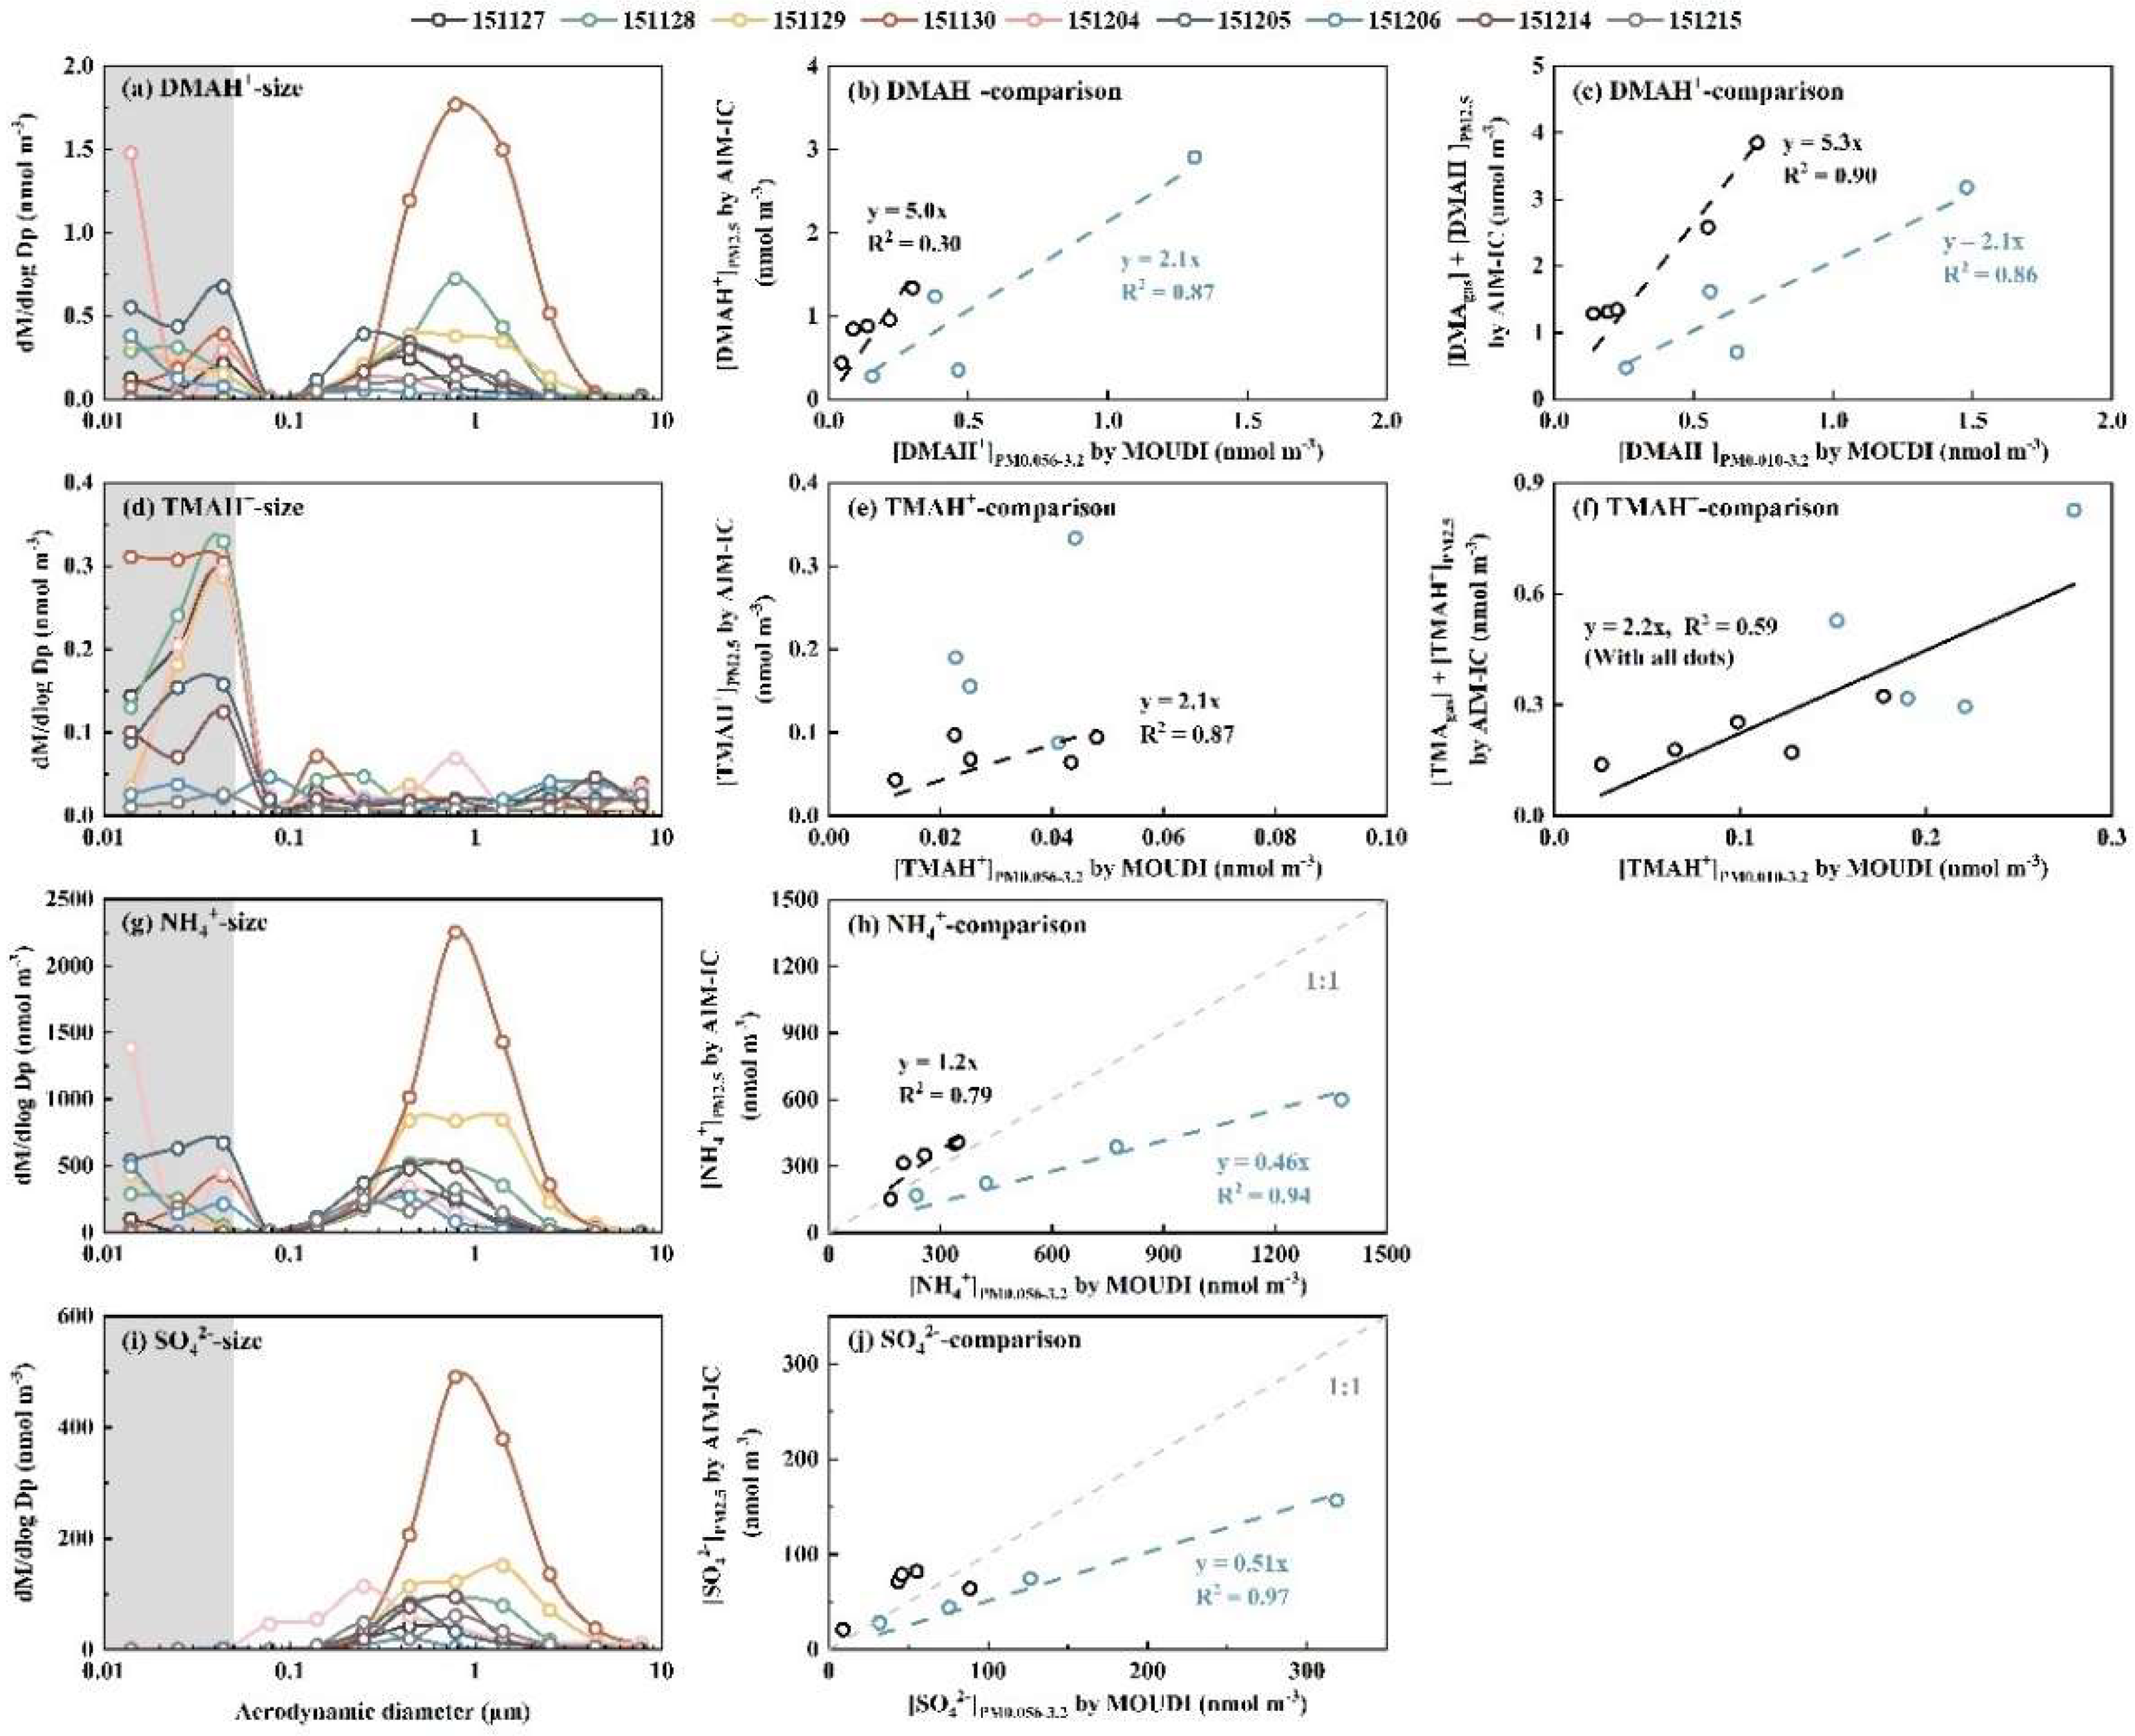
Figure 4.
Relationship between different variables for DMAH+ vs. NH4+ in particles collected in PM<0.056 (a), TMAH+ vs. NH4+ in PM<0.056 (b), DMAH+ vs. NH4+ in PM0.056-3.2 (c), TMAH+ vs. NH4+ in PM0.056-3.2 (d), NH4+ vs. N+2*S in PM0.056-3.2 (e); NO3- vs. NH4+ in PM<0.056 (f).
Figure 4.
Relationship between different variables for DMAH+ vs. NH4+ in particles collected in PM<0.056 (a), TMAH+ vs. NH4+ in PM<0.056 (b), DMAH+ vs. NH4+ in PM0.056-3.2 (c), TMAH+ vs. NH4+ in PM0.056-3.2 (d), NH4+ vs. N+2*S in PM0.056-3.2 (e); NO3- vs. NH4+ in PM<0.056 (f).
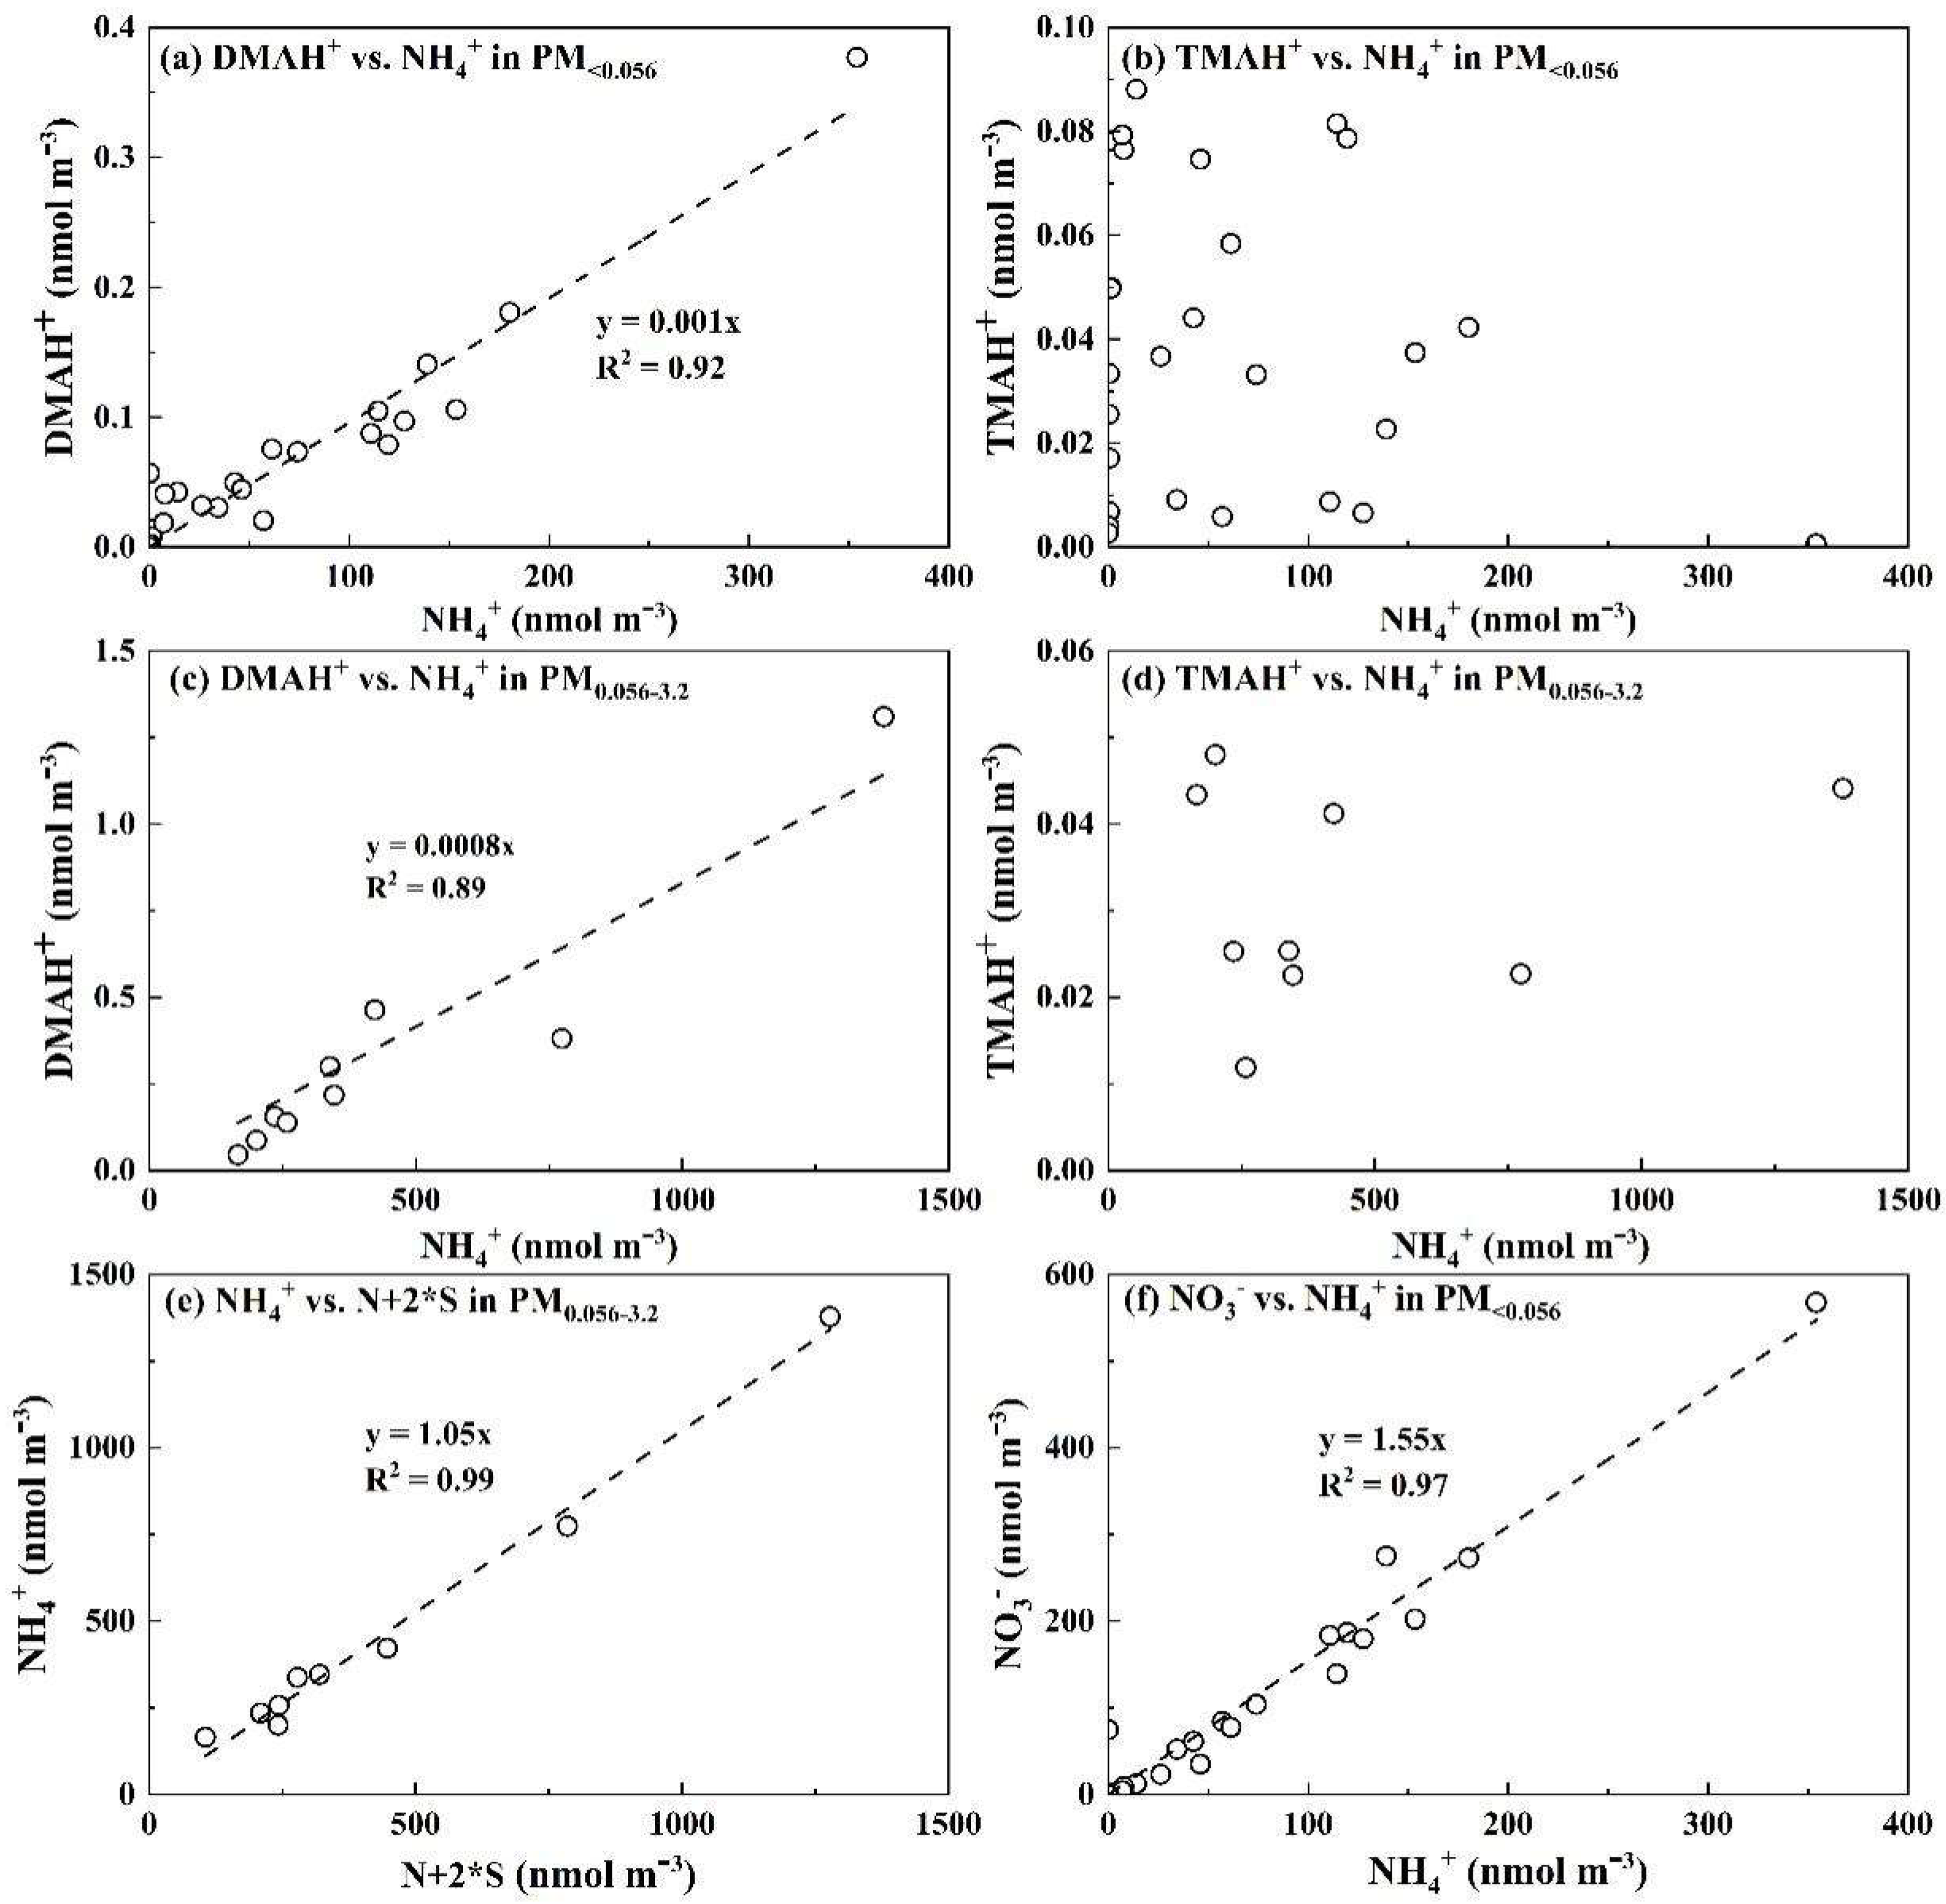
Figure 5.
Molar concentration size distributions of DMAH+ over the Yellow Sea (a) and the Bohai sea (b); TMAH+ collected on 7, 8, 10, 11, 12, 13 November over the Yellow Sea and on 16, 20 November over the Bohai Sea (c), and TMAH+ collected on 6 November over the Yellow Sea and on 18, 19, 21, 22, 23, 24 November over the Bohai Sea (d); SO42- over the Yellow Sea (e) and the Bohai Sea (f) in 2013.
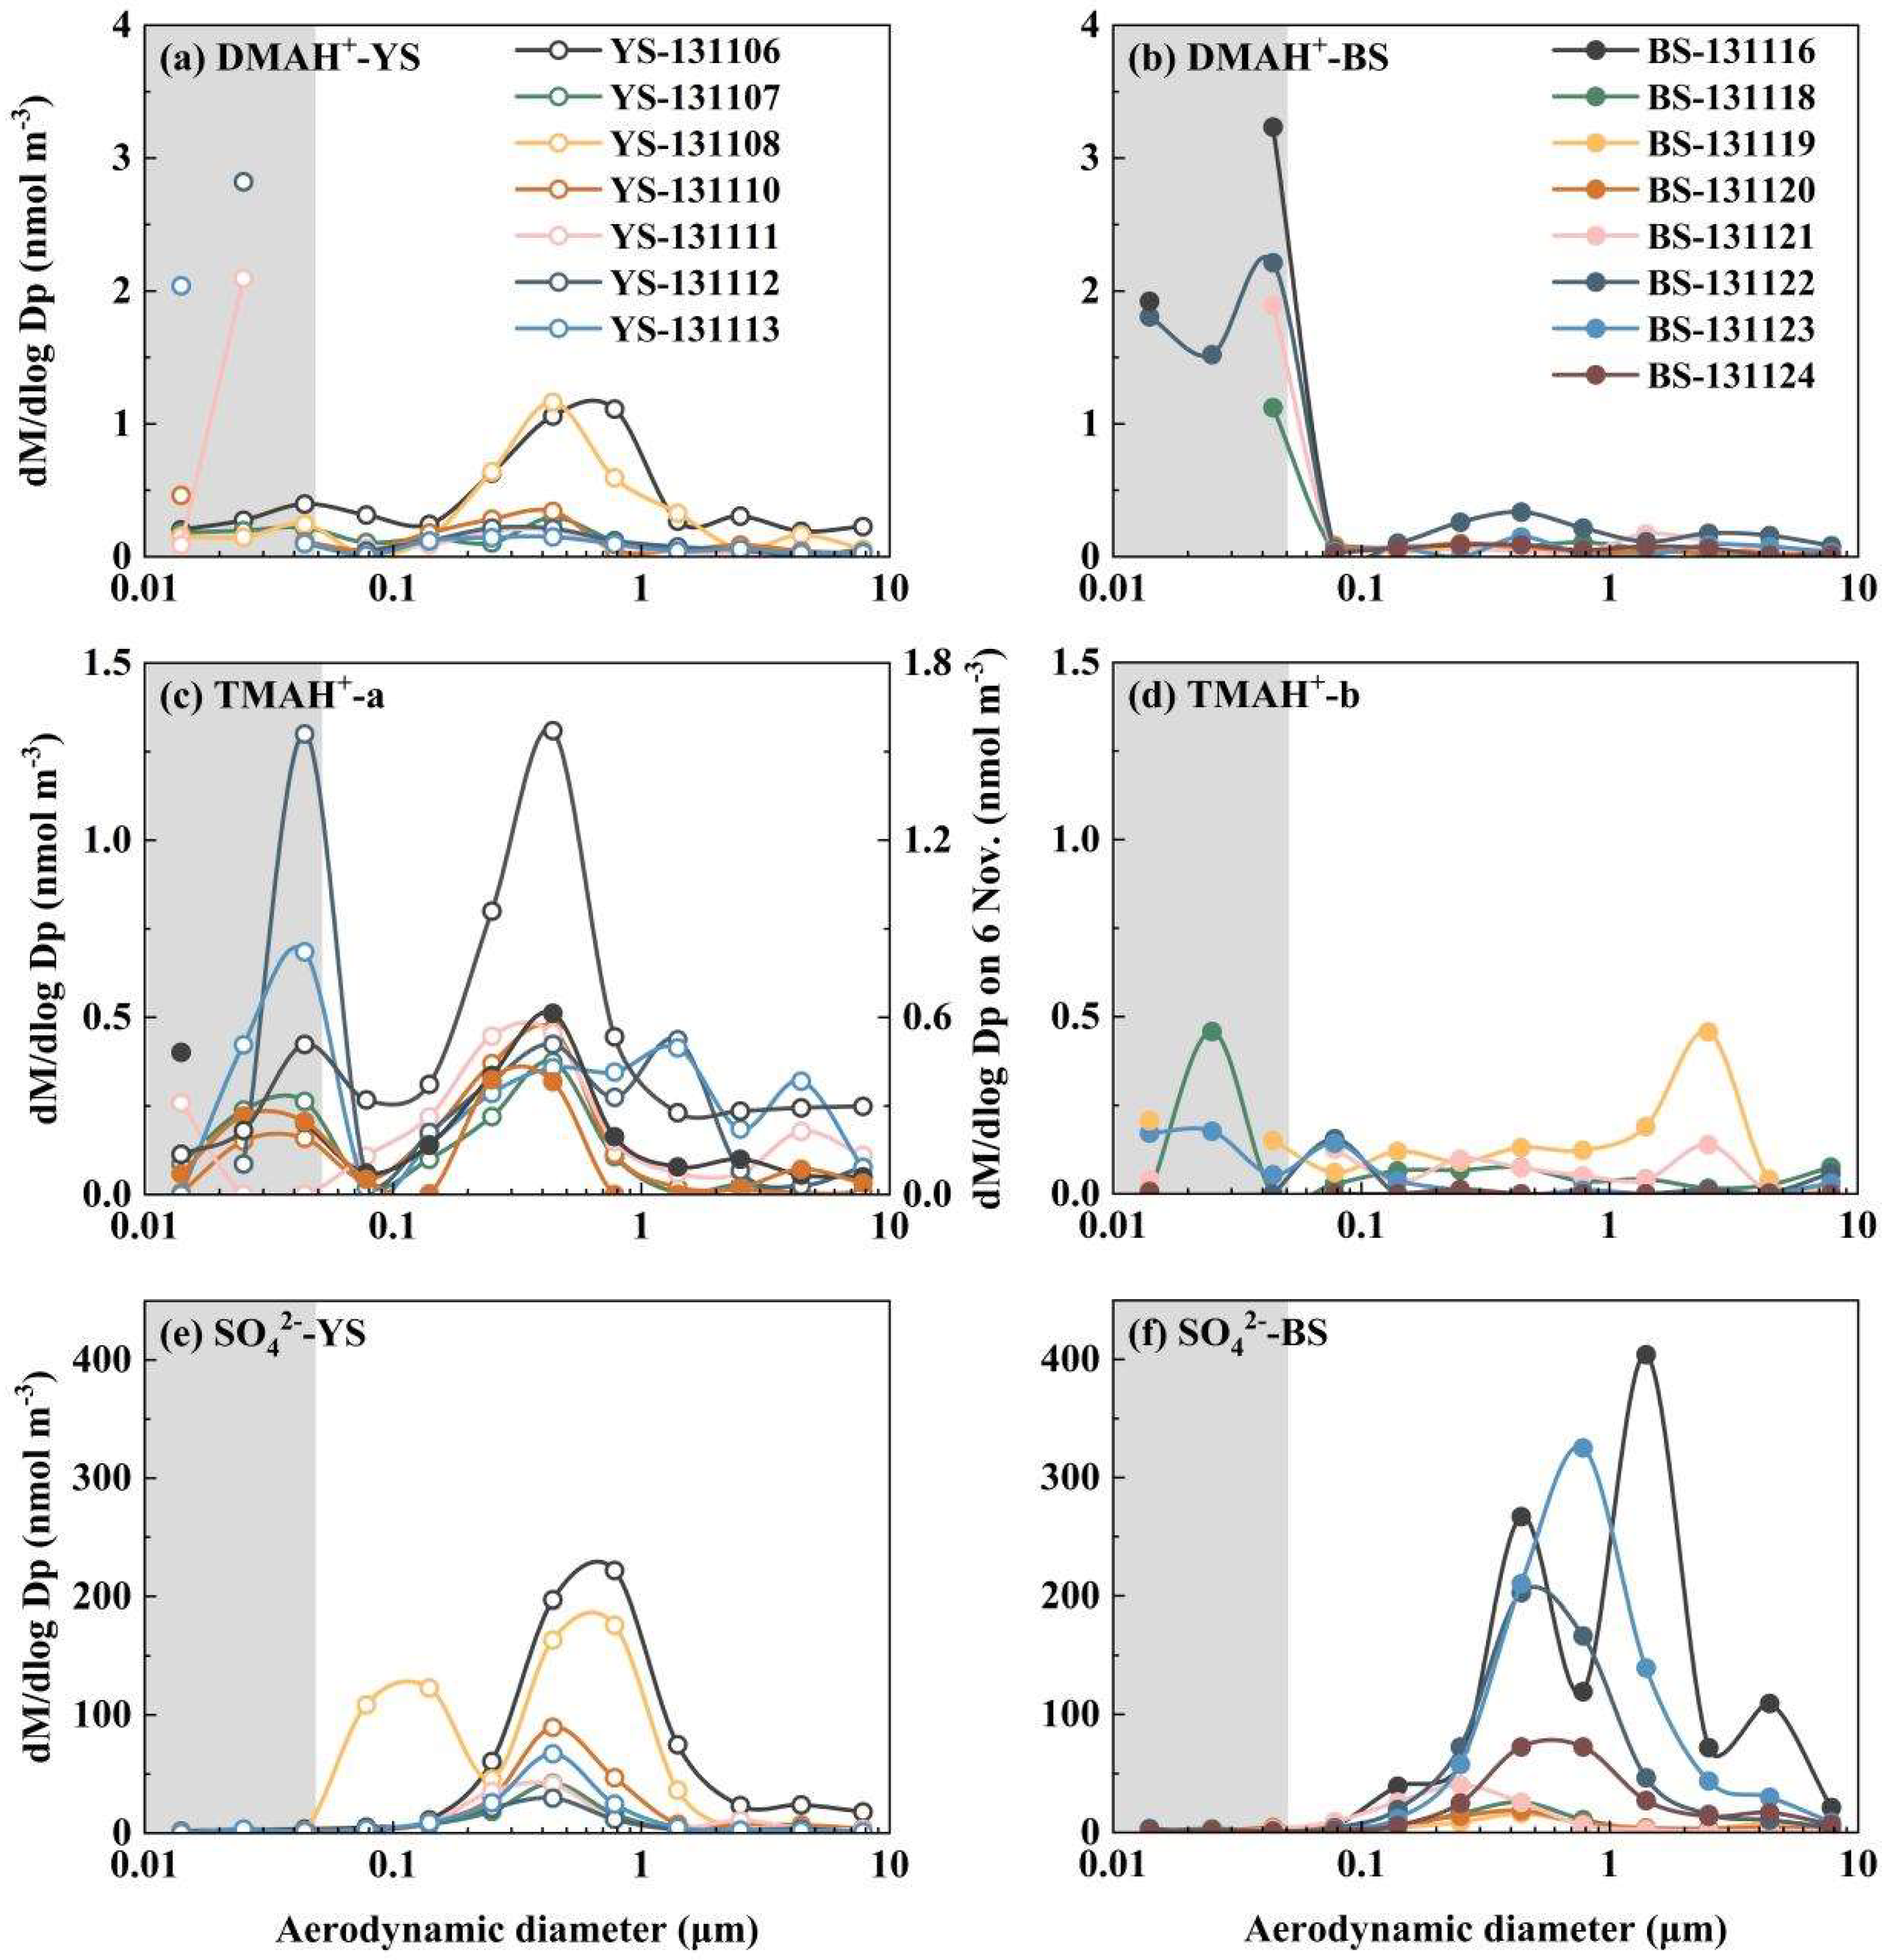
Figure 6.
Correlations between different variables in PM<0.056 for DMAH+ vs. NH4+ (a) and TMAH+ vs. NH4+ (b).
Figure 6.
Correlations between different variables in PM<0.056 for DMAH+ vs. NH4+ (a) and TMAH+ vs. NH4+ (b).
Figure 7.
Molar concentration size distributions of DMAH+ (a), TMAH+ (b), NH4+ (c), and SO42- (d); and correlations of DMAH+ vs. NH4+ in PM0.056-3.2 (e); TMAH+ vs. NH4+ in PM0.056-3.2 (f); TMAH+ vs. DMAH+ in PM0.056-3.2 (g); and NH4+ vs N+2*S in PM0.056-3.2 (f).
Figure 7.
Molar concentration size distributions of DMAH+ (a), TMAH+ (b), NH4+ (c), and SO42- (d); and correlations of DMAH+ vs. NH4+ in PM0.056-3.2 (e); TMAH+ vs. NH4+ in PM0.056-3.2 (f); TMAH+ vs. DMAH+ in PM0.056-3.2 (g); and NH4+ vs N+2*S in PM0.056-3.2 (f).
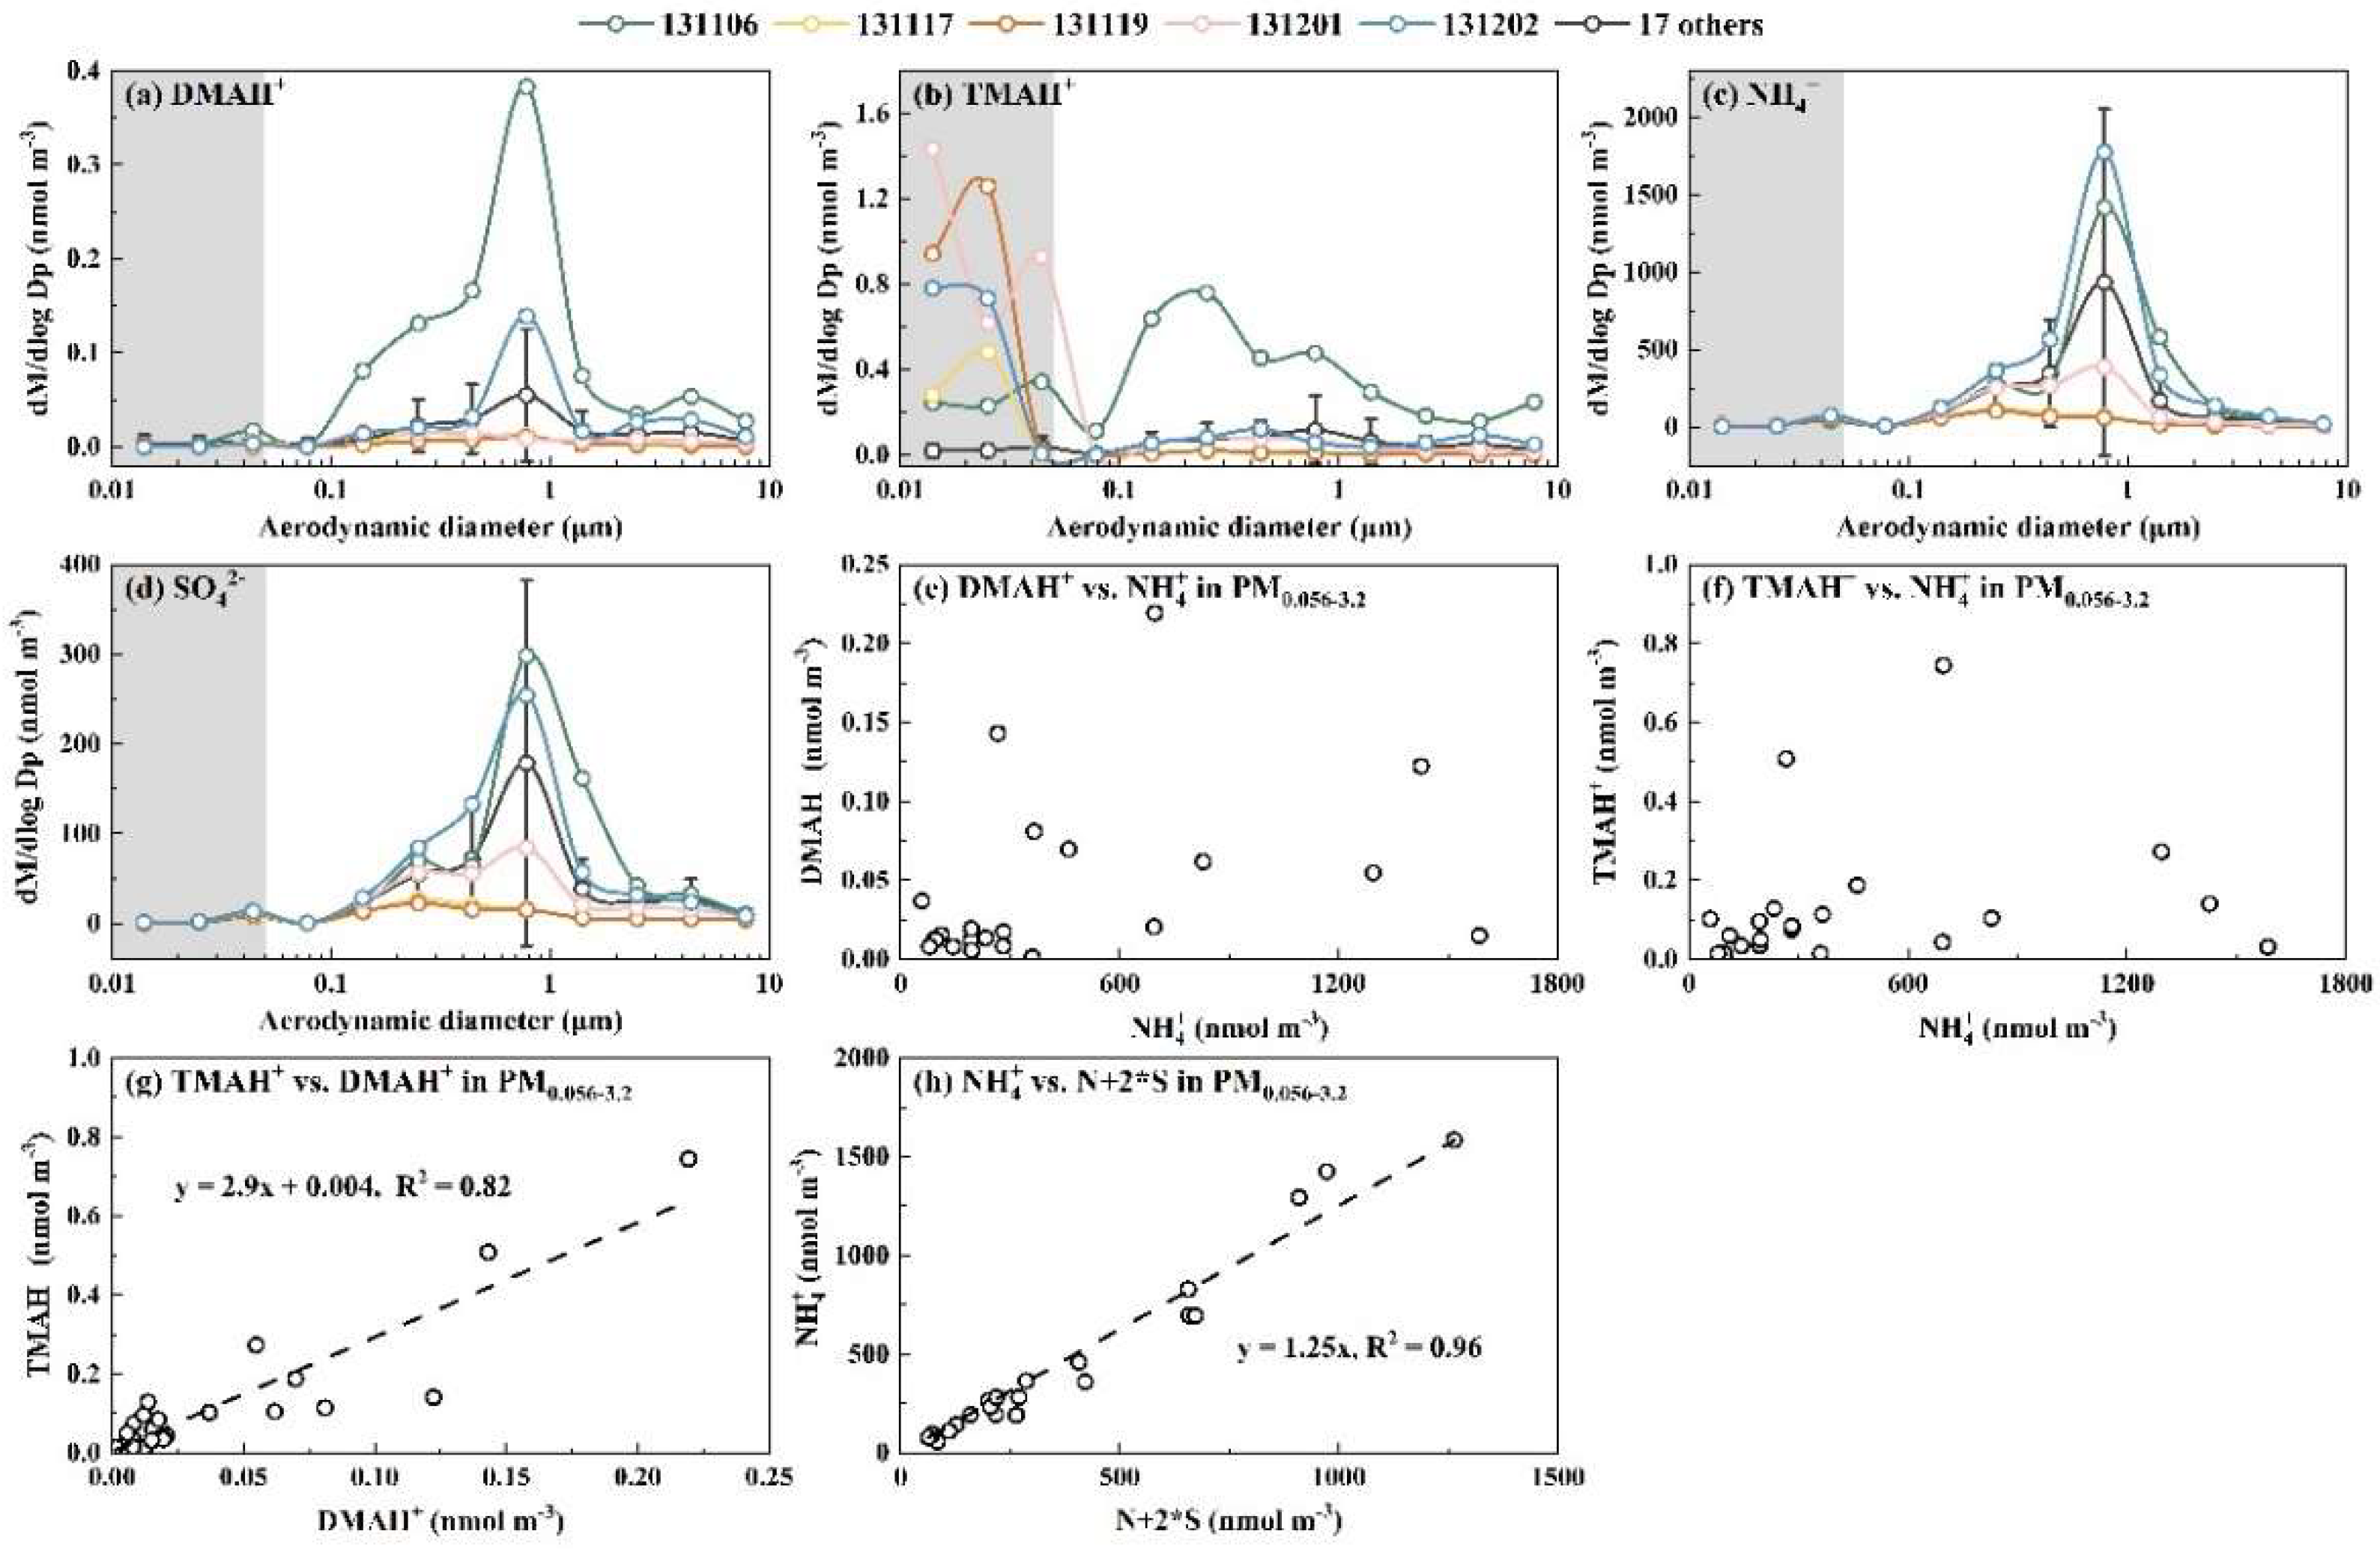
Figure 8.
Molar concentration size distributions of DMAH+ (a), TMAH+ (b), and NH4+ (c); and correlations of ions in PM0.056-3.2 for DMAH+ vs. NH4+ (d); TMAH+ vs. NH4+ (e); TMAH+ vs. DMAH+ (f) during Campaign 7.
Figure 8.
Molar concentration size distributions of DMAH+ (a), TMAH+ (b), and NH4+ (c); and correlations of ions in PM0.056-3.2 for DMAH+ vs. NH4+ (d); TMAH+ vs. NH4+ (e); TMAH+ vs. DMAH+ (f) during Campaign 7.
Figure 9.
Correlation between modeled DMAgas vs. observed DMAgas by AIM-IC in base case (a); modeled TMAgas vs. observed TMAgas by AIM-IC in base case (b); modeled concentration vs. observed concentration of NH3gas and NH4+ in PM2.5 by AIM-IC in base case (c); modeled DMAgas vs. modeled DMAH+ in test 1-3 (d); same as (d) but for TMAH+ (e); molar ratio of modeled TMAgas/TMAH+ vs. molar ratio of modeled DMAgas/DMAH+ in test 1-3 (f); same as (d-f) but for test 4-6 (g-i).

Table 1.
Frequency of different perturbation formation levels of E-DMAbelow0.056 and E-TMAbelow0.056 in each campaign.
Table 1.
Frequency of different perturbation formation levels of E-DMAbelow0.056 and E-TMAbelow0.056 in each campaign.
| Species | Campaigns | Levels | |||||
|---|---|---|---|---|---|---|---|
| Level-0 | Level-1 | Level-2 | Level-3 | Level-4 | |||
| DMAH+ | Campaign 1 | 12/13* | 1/13 | - | - | - | |
| Campaign 2 | 20/22 | 1/22 | - | 1/22 | - | ||
| Campaign 3 | 3/9 | - | 3/9 | 1/9 | 2/9 | ||
| Campaign 4 | 9/11 | 2/11 | - | - | - | ||
| Campaign 5 | Phase 1# | 6/7 | - | 1/7 | - | - | |
| Phase 2 | - | 1/7 | 5/7 | 1/7 | - | ||
| Campaign 6 | Phase 1& | - | 2/7 | 2/7 | - | 3/7 | |
| Phase 2 | 4/8 | 1/8 | - | - | 3/8 | ||
| Campaign 7 | 6/6 | - | - | - | - | ||
| Total | 60/90 | 8/90 | 11/90 | 3/90 | 8/90 | ||
| TMAH+ | Campaign 1 | 4/13 | 5/13 | 3/13 | 1/13 | - | |
| Campaign 2 | 11/22 | 4/22 | 1/22 | 2/22 | 4/22 | ||
| Campaign 3 | - | - | 2/9 | 1/9 | 6/9 | ||
| Campaign 4 | 2/11 | 2/11 | 7/11 | - | - | ||
| Campaign 5 | Phase 1 | - | 4/7 | 3/7 | - | - | |
| Phase 2 | 3/7 | - | 1/7 | 3/7 | - | ||
| Campaign 6 | Phase 1 | 1/7 | 3/7 | 3/7 | - | - | |
| Phase 2 | 2/8 | 1/8 | 3/8 | 2/8 | - | ||
| Campaign 7 | - | 1/6 | 4/6 | - | 1/6 | ||
| Total | 23/90 | 20/90 | 27/90 | 9/90 | 11/90 | ||
* represents 12 samples in the total of 13 samples; # represents 7 samples collected on 2, 3, 5, 6, 7, 8, 9 November 2021 over the Yellow Sea; & represents 7 samples collected on 6, 7, 8, 10, 11, 12, 13 November 2013 over the Yellow Sea.
Disclaimer/Publisher’s Note: The statements, opinions and data contained in all publications are solely those of the individual author(s) and contributor(s) and not of MDPI and/or the editor(s). MDPI and/or the editor(s) disclaim responsibility for any injury to people or property resulting from any ideas, methods, instructions or products referred to in the content. |
© 2025 by the authors. Licensee MDPI, Basel, Switzerland. This article is an open access article distributed under the terms and conditions of the Creative Commons Attribution (CC BY) license (http://creativecommons.org/licenses/by/4.0/).
Copyright: This open access article is published under a Creative Commons CC BY 4.0 license, which permit the free download, distribution, and reuse, provided that the author and preprint are cited in any reuse.


