
Submitted:
24 March 2025
Posted:
26 March 2025
You are already at the latest version
Abstract
Over the past 170 years clothing industries have changed from custom fitting and assembly of hand sewn garment to mass production and distribution of ready to wear products in the modern market. And most of the Ethiopian clothing industries in face a problem to competitive globally because of different problems when they produce their product. For example, most of the company doesn't optimize their resources, inadequate of raw materials, poor quality. Therefore, the optimal assignment of resource for the task and proper assignment of work stations is becoming the industries competitive. This research is addressed an optimization of assembly line of long pant product through discrete event simulation (DES) modeling. In this research, the simulation modeling and optimal line balancing of the long pant sewing line is carried out by using arena 14 version. Based on the simulation model run, results the operations that have high queue length and high resource utilization are facing serging, pocket positioning, size by size zip tack to body and front fly topstitch and a resources which have been low utilizations or below 50% utilizations are like BH machine, manual operator2, helper a2, and heat machine are idle operations in the production lines of the long pant model. And the operations that have high waiting time are bottlenecks for the production lines. identified bottlenecks are eliminated or minimized using sharing and adding of the existing resources (operators and machines) in order to optimize the resources as much as possible.Finally, a new model has developed by using opt quest model of arena with different types of scenarios by considering the constraints of the resources and controls and responses of the results. Therefore, the production system produces 498 long pants and by reducing one operator and one 4TOL machine. The researchers have identified the main bottle necks which have high work in process and low work in process, high queue length, low and high utilized resource specially the operators and the machines that allocated in the assembly lines.
Keywords:
discrete event simulation
; Opt quest
; long pant
; optimization
; bottleneck
1. Introduction and Background of the Study
Every manufacturing company wants to improve and adapt their operating system in order to survive the industry competition. The success of textile and garment companies in their competition for global market control their focus on more effective and efficient manufacturing processes. The necessity to reduce the cost of production has also caused manufacturers to focus on waste minimization. Garment industries are among the most labor intensive industries known in many countries.
It is important to understand exactly what waste is and where, how and why it exists. Waste is an uneconomical use of resources and This waste includes materials, machines, labor, time, and revenue, resulting in a supply of products in an unwanted quantity (over and above, less and below). For any waste, there is a strategy to reduce or eliminate its effect on a company, and improve overall performance and quality of the product or service delivered by the factory.
In manufacturing organizations, to improve their system it might mean to reduce the operating costs that come from the wastes in production line by Optimization and simulation of Manufacturing Processes are choice in problem solving.
The main work for balancing production lines is using of Line balancing technique to solve problems occurred in assembly line process. It is a technique to minimize unbalance between the workers and workloads to achieve required run rate. This can be done by equalizing the amount of work in each station and assign the smallest number of workers in the particular workstation [1]. But the major obstacle to attaining a perfectly balanced line is the difficulty of forming task bundles that have the same duration. Here the job is divided into small part called job element. The aim job element is to keep up production at equal rate. Line that is perfectly balanced will have a smooth flow of work as activities along the lines are synchronized to achieve maximum utilization of labor and equipment. On the basis of time taken of each operation the reason for line balance is that; Maximum output, avoid any bottleneck, Smooth flow of work (production), less supervision and effort.
Improving Productivity could come from reduction in wastage of resources such as labor, machines, materials, power, space, time, capital, and by initiating operators and offer incentives to produce more and more with less and less inputs of resources. It leads for the development of an attitude of mind and a constant urge to find better performance of operators and their leaders. Aims at the maximum utilization of resources for yielding as many goods and services as possible, of the kinds most wanted by consumers at lowest possible cost. Provide improvements in the layout of lines and work, better working conditions and simplification of work [2].
Using a valid simulation model gives several benefit and advantages in developing a better system and in predicting the manufacturing processes behavior under varying set of circumstances in order to improve the manufacturing processes performance. Since Optimization and simulation are potential engineering tools for analysis as well as increase productivity by eliminates processes constraint in apparel of garment industries. The visual simulation of manufacturing processes is connected with automated preparation and realization of the production.
Optimize and simulation Process operation is one of the best engineering tools to eliminate production constraints during operation and to balance work load distribution in each work line. Optimization methods typically include line balancing, minimize production cost, minimize deliver time but can also involve more specialized types of simulation, such as work-center simulation or whole-factory discrete event simulation.
Thus, these industries are not as profitable as they were expected to be [3]. Due to these reasons this research has concerned with development optimization and simulation of manufacturing processes in garment industries for eliminate manufacturing processes constraints.
1.1. Problem Statement
Most of these Tigray garment industries are not as profitable as they were expected to be and their customers are becoming dissatisfied due to different manufacturing constraints. The common problem existing in Tigray garment industries are high production costs, late deliver time to their client, low quality of products, expansion defects and non-value added processes which leads the companies to low productivities.
To design new manufacturing processes and implement optimization, simulation techniques to improve the manufacturing processes in order to eliminate bottleneck or constraints of the processes.
There is also unbalanced line that hinders production efficiency, speed and effectiveness of the company in one and another way. There is a difference between the planned and real outputs of products on sewing line that have a huge amount of variations.
1.2. Objective of the Study
1.2.1. General Objective
General objective of this paper is optimization of manufacturing processes using ARENA simulation and algorithm tools to enhance productivities of the garment industries.
1.2.2. Specific Objective
- ❖
- To set prioritize of the problem based on their degree of negative impacts for productivities
- ❖
- To analyze the standard minute value of each activity and the long pant
- ❖
- To analyze the standard performance of each operation.
- ❖
- To provide a comprehensive review of the existing manufacturing processes through value stream mapping
- ❖
- To optimize the processes by eliminate the problems (manufacturing process constraints)
- ❖
- To simulate the optimize manufacturing processes using arena software
- ❖
- To propose an improved model for the sewing sections
1.3. The Scope of the Study
Scope of this research is on optimization using arena simulation and algorithm tools to enhance productivities of Tigray garment industries. The research shows that; how the garment industry increases their productivities and to be competitive in a sustainable manner and can contribute to national economic growth, employment generation, foreign exchange earning etc. Even though the research aims on the general country level, due to time and financial limitation, this research focuses on garment industries in Tigray region. This research work makes an assessment on productivities related problems in selected Tigray garment industries and provides concrete and applicable study and improvement production system so that the overall activities of the industries can be improved overall their productivities and can be competitive in the local as well as international markets.
1.4. Significance of the Study
This research focus on garment industries on manufacturing process optimization to enhance productivities of the companies as we know in Ethiopia garment factories are more expanded and the Ethiopia government as well as Tigray region, however the companies have not become productive as much as possible due to so many manufacturing constraints. Thus implementing the findings of this research will improve productivities of the companies since optimization tools are a key for enhancement of the manufacturing processes.
2. Literature Review
2.1. Productivity
Productivity is a measure to the efficiency and effectiveness to which organizational processes are utilized or the creation of products or services (output). In garment production output is the number of parts manufactured, while input is the people, machinery and factory resources required to create those products within the specified time. In an ideal situation, input should be controlled and minimized, while output is maximized. Productivity can be expressed in different ways but mostly productivity is measured as labor productivity, machine productivity or value productivity. Productivity gains are important to the company because they allow us to accomplish our goals with more output with less time. It is also believed that employees who are happier or more satisfied with their job will also be better performers on their jobs. Despite the emotional flavor of secular conceptions of happiness, job satisfaction scales generally don't focus on emotions, but ask employees to rate their satisfaction with payment, working conditions, work as a whole, etc. (for example, [4]suggests that this type of measurement decision contributes to weak or inconsistent findings. The garment industries need to produce large amount of quantities in shorter lead times as garment product is highly correlated with high level of productivity [4].
Productivity is also a ratio of total output to total input use, in other words productivity is nothing more than the arithmetic ratio between the amount produced and the amount of any resources used for producing of the product in the entire production line.
Productivity= total output/total input, which is identical to total results achieved/total resources consumed or effectiveness or efficiency discarded or annotated [4].
Productivity enhancement is one of the best strategies towards manufacturing excellence and it also is necessary to achieve good financial and operational performance. It improves customer satisfaction and reduce time and cost to develop, produce and deliver products and service. Productivity has a positive and significant relationship to performance measurement for process utilization, process output, product costs, and work-in-process inventory levels and on-time delivery. productivity enhancement can be in the form of elimination, repairing (correction) of ineffective processing, simplifying the process, optimizing the system, reducing variation, maximizing throughput, reducing cost, improving quality or responsiveness and reducing set-up time [4].
2.2. Assembly Line Balancing
The line balancing is the assignment process of tasks or workstations so that the workstations have roughly the same time requirements.
This results in minimizing stop times along the line and high use of labor and equipment and minimizing the cycle time of the production line. Cycle time is the maximum time allowed for each workstation in the production of system of assembling garment products, clothing parts or components are collected in a finished output which is the final product of the subassembly process [4]. And the process has a different number of operators, workstations and installation components. Therefore, a good line balancing increases the efficiency of the stitching section production line [5]. In the production of apparel, responsible would have been able to check whether the assembly work will be completed in time for delivery, how man, operators and machines are used, if any station on the line assembly line is late it is global. To achieve this approach, the study of working time is the duration for each part to be assembled on production lines [5,6] and activities. The assembly lines are generating production systems to meet the customer needs that have been growing from time to time. The goals of these systems produce products that have high production rates in the shortest time, in a more productive, economical and quality manner. The purpose of the case study was to design the assembly line to achieve maximum line efficiency using the optimum machine working time for constant cycle time [7]. Line Balancing is commonly used to solve problems that have occurred in the garment assembly line. Line balancing is a technique to minimize the distance between workers and workload in order to achieve the desired flow rate [8]. This can be done by equating the amount of work at each station and assigning the least number of workers to the particular workstation. A line balancing can be classified into three categories according to the numbers Mounted on the line and in accordance with the rhythm of line [9] and [8] are models;
Single line Model: - can be described as a line that combines a single model. This line produces many units of an unchanged product. The tasks performed at each station are the same for all units. Products with strong demand are destined for this line [10].
Mixed model line: - Mixed model line is producing more than one model. They are made simultaneously on the same line. Once a model is running at a station, other products are made in other seasons. Therefore, each station is equipped to perform various operations necessary to produce any model that moves through it. Many consumer products are assembled in Mixed Model [11].
Batch line: - This line produces every batch model. Typically, the workstations are set to produce the required quantity of the first model then stations are rebuilt to produce another model. The products are often assembled in batches required when the average. It is cheaper to use a mounting chain to produce various batch products to build a separate line for each model. The research will take place in the field applied a mixed model line. Simulation is one of the tools that have been widely used in various sectors and manufacturing. Using a valid simulation model gives numerous benefits and benefits in creating better manufacturing in order to improve system performance simulation models are used to identify bottlenecks in the production line and evaluate a few proposed solutions [10].Systems simulation modeling objectives are producing products that have high production rates in the shortest time in a more productive, economical and agreed manner. An assembly line garment was selected and simulated using Arena simulation and statistical methods to solve the balanced problem [7] have been used.
2.3. Simulation Modelling
Simulation based optimization is also known as optimization via simulation, simulation optimization, parametric optimization, black box optimization, stochastic optimization [12]. It is a state-of-art garment assembly line design approach that generate a number of scenarios from a probabilistic model and then select the best alternative solution by applying scheduling decisions and aggressive search approaches to these scenarios to obtain the best solution from the different alternative solutions[13].
Simply put, simulation-based optimization is a combination or integration of simulation and optimization or metaheuristic approaches.
The inherent complexity of assembly line and large number of feasible design scenarios make it extremely difficult to identify a global best solution with only simulation technique [14] and [15]. For this reason, integrating simulation with optimization means that all the advantages of the two design techniques can be harnessed. Moreover, simulation-based optimization can be applied to solve system design as well as the scheduling problem [15]. In general, it has been used to solve a number of industrial engineering problems [16].
Arena Simulation software can be used in a manufacturing industry to test and implement a well-balanced line that has the flexibility to hit the goal throughput consistently. In Line balancing simulation can be used to identify system bottlenecks, test production schedules, and evaluate the impact of design and scheduling decisions. Simulation has been helped the manufacturers around the globe to perform and imitate any rigorous and meaningful analysis on a modern production line by establishing confidence levels around results for a wide range of issue. Simulation modeling, is a complicated activity that combines art and science. Nevertheless, from a high-level standpoint, one can distinguish the following major steps;
- Problem analysis and information collection: The first step in building a simulation model is to analyze the problem itself. System modeling is rarely undertaken for its own sake. Rather, modeling is prompted by some system-oriented problem whose solution is the missions of the underlying project in this case a line balancing problem.
- Data collection: Data collection is needed for estimating model input parameters.
- Model construction: Once the problem is fully studied and the requisite data collected, the analyst can proceed to construct a model and implement it as a computer program. A special purpose simulation language or environment like arena can be used to modeling assembly lines.
- Model verification: verification makes sure that the model conforms to its specification and does what it is supposed to do.
- Model validation: Model validation examines the fit of the model to empirical data (measurements of the real-life system to be modeled). A good model fit means here that a set of important performance measures, predicted by the model, match or agree reasonably with their observed counterparts in the real-life system.
- Designing and conducting simulation experiments: The analyst selects a number of scenarios and runs the simulation to glean insights into its workings.
- Output analysis: The estimated performance measures are subjected to a thorough logical and statistical analysis.
- Final recommendations: Finally, the analyst uses the output analysis to formulate the final recommendations for the underlying systems problem.
2.4. Optimization
many researchers have improved the performance of a number of systems using simulation-based optimization. [17] for example, applied simulation-based metaheuristic optimization technique to optimize inspection strategies for multistage manufacturing processes. According to [18], designed assembly line for footwear production using simulation-based optimization on Arena software. And [19] conducted that, study on production planning in manufacturing industry using simulation-based optimization. A study by [20] improved the conformation of the production line using simulation-based optimization. Another study conducted by [21] proposed that, an integrated simulation-optimization framework based on metaheuristic method to overcome an inherited complexity of classical production planning in multiproduct production systems and optimizes several production objectives simultaneously. To some extend simulation-based optimization has been applied beyond manufacturing industries and thus covering defense, agriculture, transport and healthcare. For instance, [22] conducted a study on minimization of patient waiting time in emergency department of a public hospital using simulation-based optimization approach. While, [15] applied simulation-based optimization technique to rescheduling train traffic in uncertain conditions during disruptions. Likewise, [23] applied Simulation-based optimization in transportation. [24] demonstrated the applicability of simulation-based optimization in agriculture. [25] reviewed surrogate-based method for black box optimization. While, [26] integrated both meta model and metaheuristics method for exploring design parameters in a defense system (hybrid system). So far so good, enormous methods and tools or techniques for simulation-based optimization have been developed or used by the previous studies. [27] for example, applied a multi-objective simulation-based optimization framework consisting of a hybrid immune-inspired algorithm named Suppression-controlled Multi-objective Immune Algorithm and a simulation model for solving a real-life multi-objective optimization problem. [28] optimized production line conformation, and proposed several simulation-based optimization approaches based on ant-colony, myopic search, simulated annealing and response-surface methodologies. [29] applied simulation and Response Surface Methodology in optimizing logistics process for electronic goods.
2.4.1. Opt Quest
A strategy can be defined as a convinced set of values for the controls. Others words for strategy include state and solution. refers to the control values (inputs to the Arena simulation), not to the resulting values of the performance measures ( responses, or outputs from the Arena simulation) [30] and [31].If your goal were to find the best strategy (without using Opt Quest), you would have to enter the control values for one strategy you are considering into the Arena model, run the Arena simulation, analyze the results, then enter a new set of control values, run the simulation again, and so on. Often it is not clear how to adjust the controls from one simulation to the next. This type of search is tedious and, in problems with thousands or millions of potential alternatives, impractical. Opt Quest enhances Arena by programming the search for an optimal strategy. The local optimal is obtained from simulation experimentation and is adopted for optimization process. The opt Quest tool is used to solve a single objective function (throughput) optimization problem [32] . When Opt Quest is thrown, it checks the Arena model and loads information from the model, including the defined controls and responses, into its own database. The user then proceeds to express the optimization problem using Opt Quest’s boundary. Opt Quest reiterations this process, running multiple simulations. Its ultimate goal is to find the solution that optimizes (maximizes or minimizes) the value of the model’s objective. An optimization model in Opt Quest for Arena has three major fundamentals constraints, controls and objective.
Controls: - Are variables or resources that can be meaningfully operated to affect the performance of a simulated system.
Constraints: - Are relationships among controls and/or responses. For example, a constraint might confirm that the total amount of money allocated among various investments cannot outdo a specified amount, or at most one machine from a certain group can be selected.
Objective: - Is a response or an expression used to represent the model's objective, such as minimizing queues or maximizing outputs.
[33] revealed that Arena/OptQuest optimization platform outperforms the Taguchi optimization method. [34] used OptQuest and Arena to search for the optimal supply chain network decisions under 3 levels of uncertainty. Similarly, [35] used Arena and OptQuest to determine the best number of workstations in garment assembly line. While [36] demonstrated the possibility of integrating Arena and CPLEX software tools for simulation-based optimization.
Evidence from the previous studies shows an integral of Arena and Opt Quest as the most commonly used simulation-based optimization software tool [37]. However, in any design problem selection of software to be used for simulation study is very important and majorly based on the number of criteria including the ease of use, animation capability, model development and input category [38].
3. Methodology
3.1. Data Collocation
3.1.1. Primary Data Collection
- ❖
- Visual observations; Conducted to know where the bottleneck was and Observing overall of the company specifically on sewing section.
- ❖
- Interview; conducted to know a detailed know how on garment section specifically in sewing area by doing interview with production manager, planning manager, time study and line balance man, line supervisors and workers of the company.
- ❖
- Direct recording of data; conducted to know standard minute value (SMV) for each operation and the researchers have taken direct recording on operation time of each tasks and have taken 20 times for each operation.
3.1.2. Secondary Data Collection
The secondary data sources that used for conducting this study are recorded planning activities, Daily reports inputs and outputs of the long pant, performance of each operator, Official documents and Referring to some books.
3.2. Data Analysis
This research is analyzed by reviewing of the existing time study and line balancing for Identification of bottle necks area and Applying different line balancing techniques and calculations such as labor productivity, machine productivity, output per day, theoretical man labor and profit for comparison of existing line before and after line balanced. In addition, in this study arena software was used for constructing bar diagram that is used to show the bottleneck area.
3.3. Sewing Operation Line Parameters
This study needs a lot of data like man power, machine capacity, and sequence of jobs; inter arrival of parts for assembling, processing time at each machine, efficiency, quality product outputs (number of defects, rework, and normal). Such data are used for model the production line. Therefore; the researchers have used primary data and secondary data. And the researchers have used different tools for recording some necessary information like processing time for new products transfer time from one station to the next one. The researchers have tried to find the causes; why the company did not achieve its goals. And finally discussed the causes of poor efficiency and its remedy action to attain the profit maximization by optimization the processes.

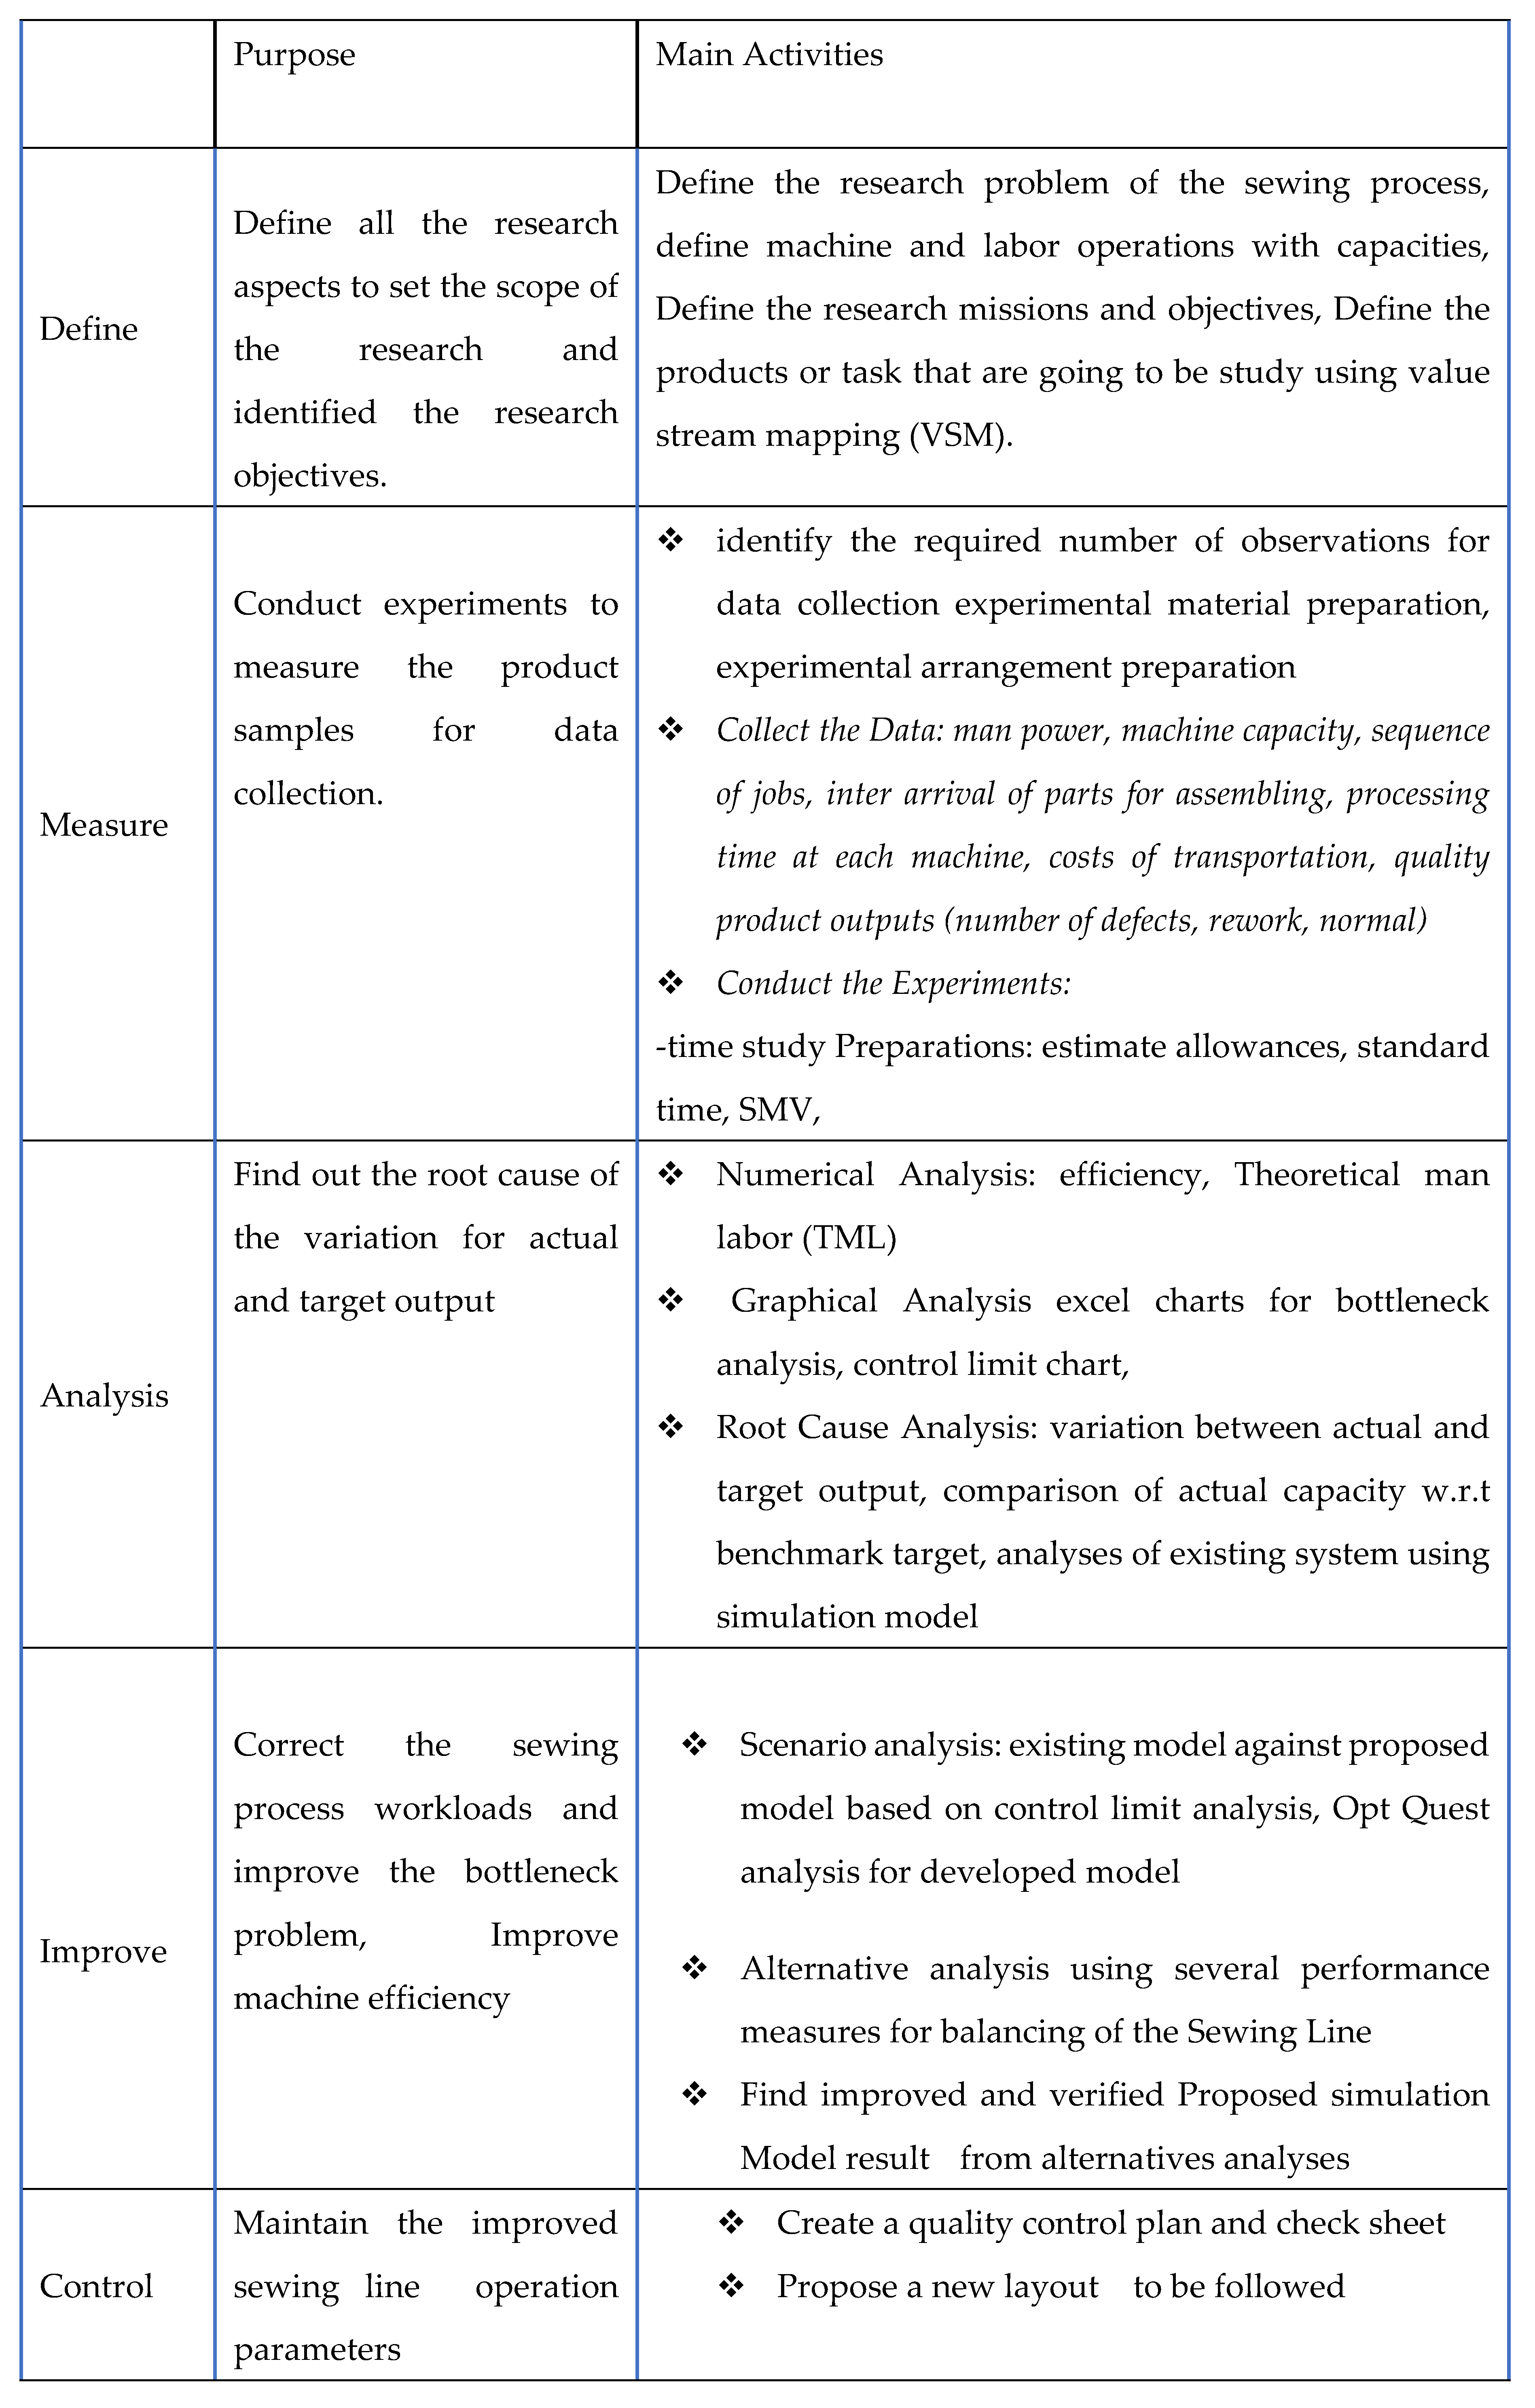
Table 1.
The DMAIC process route & content of the research .
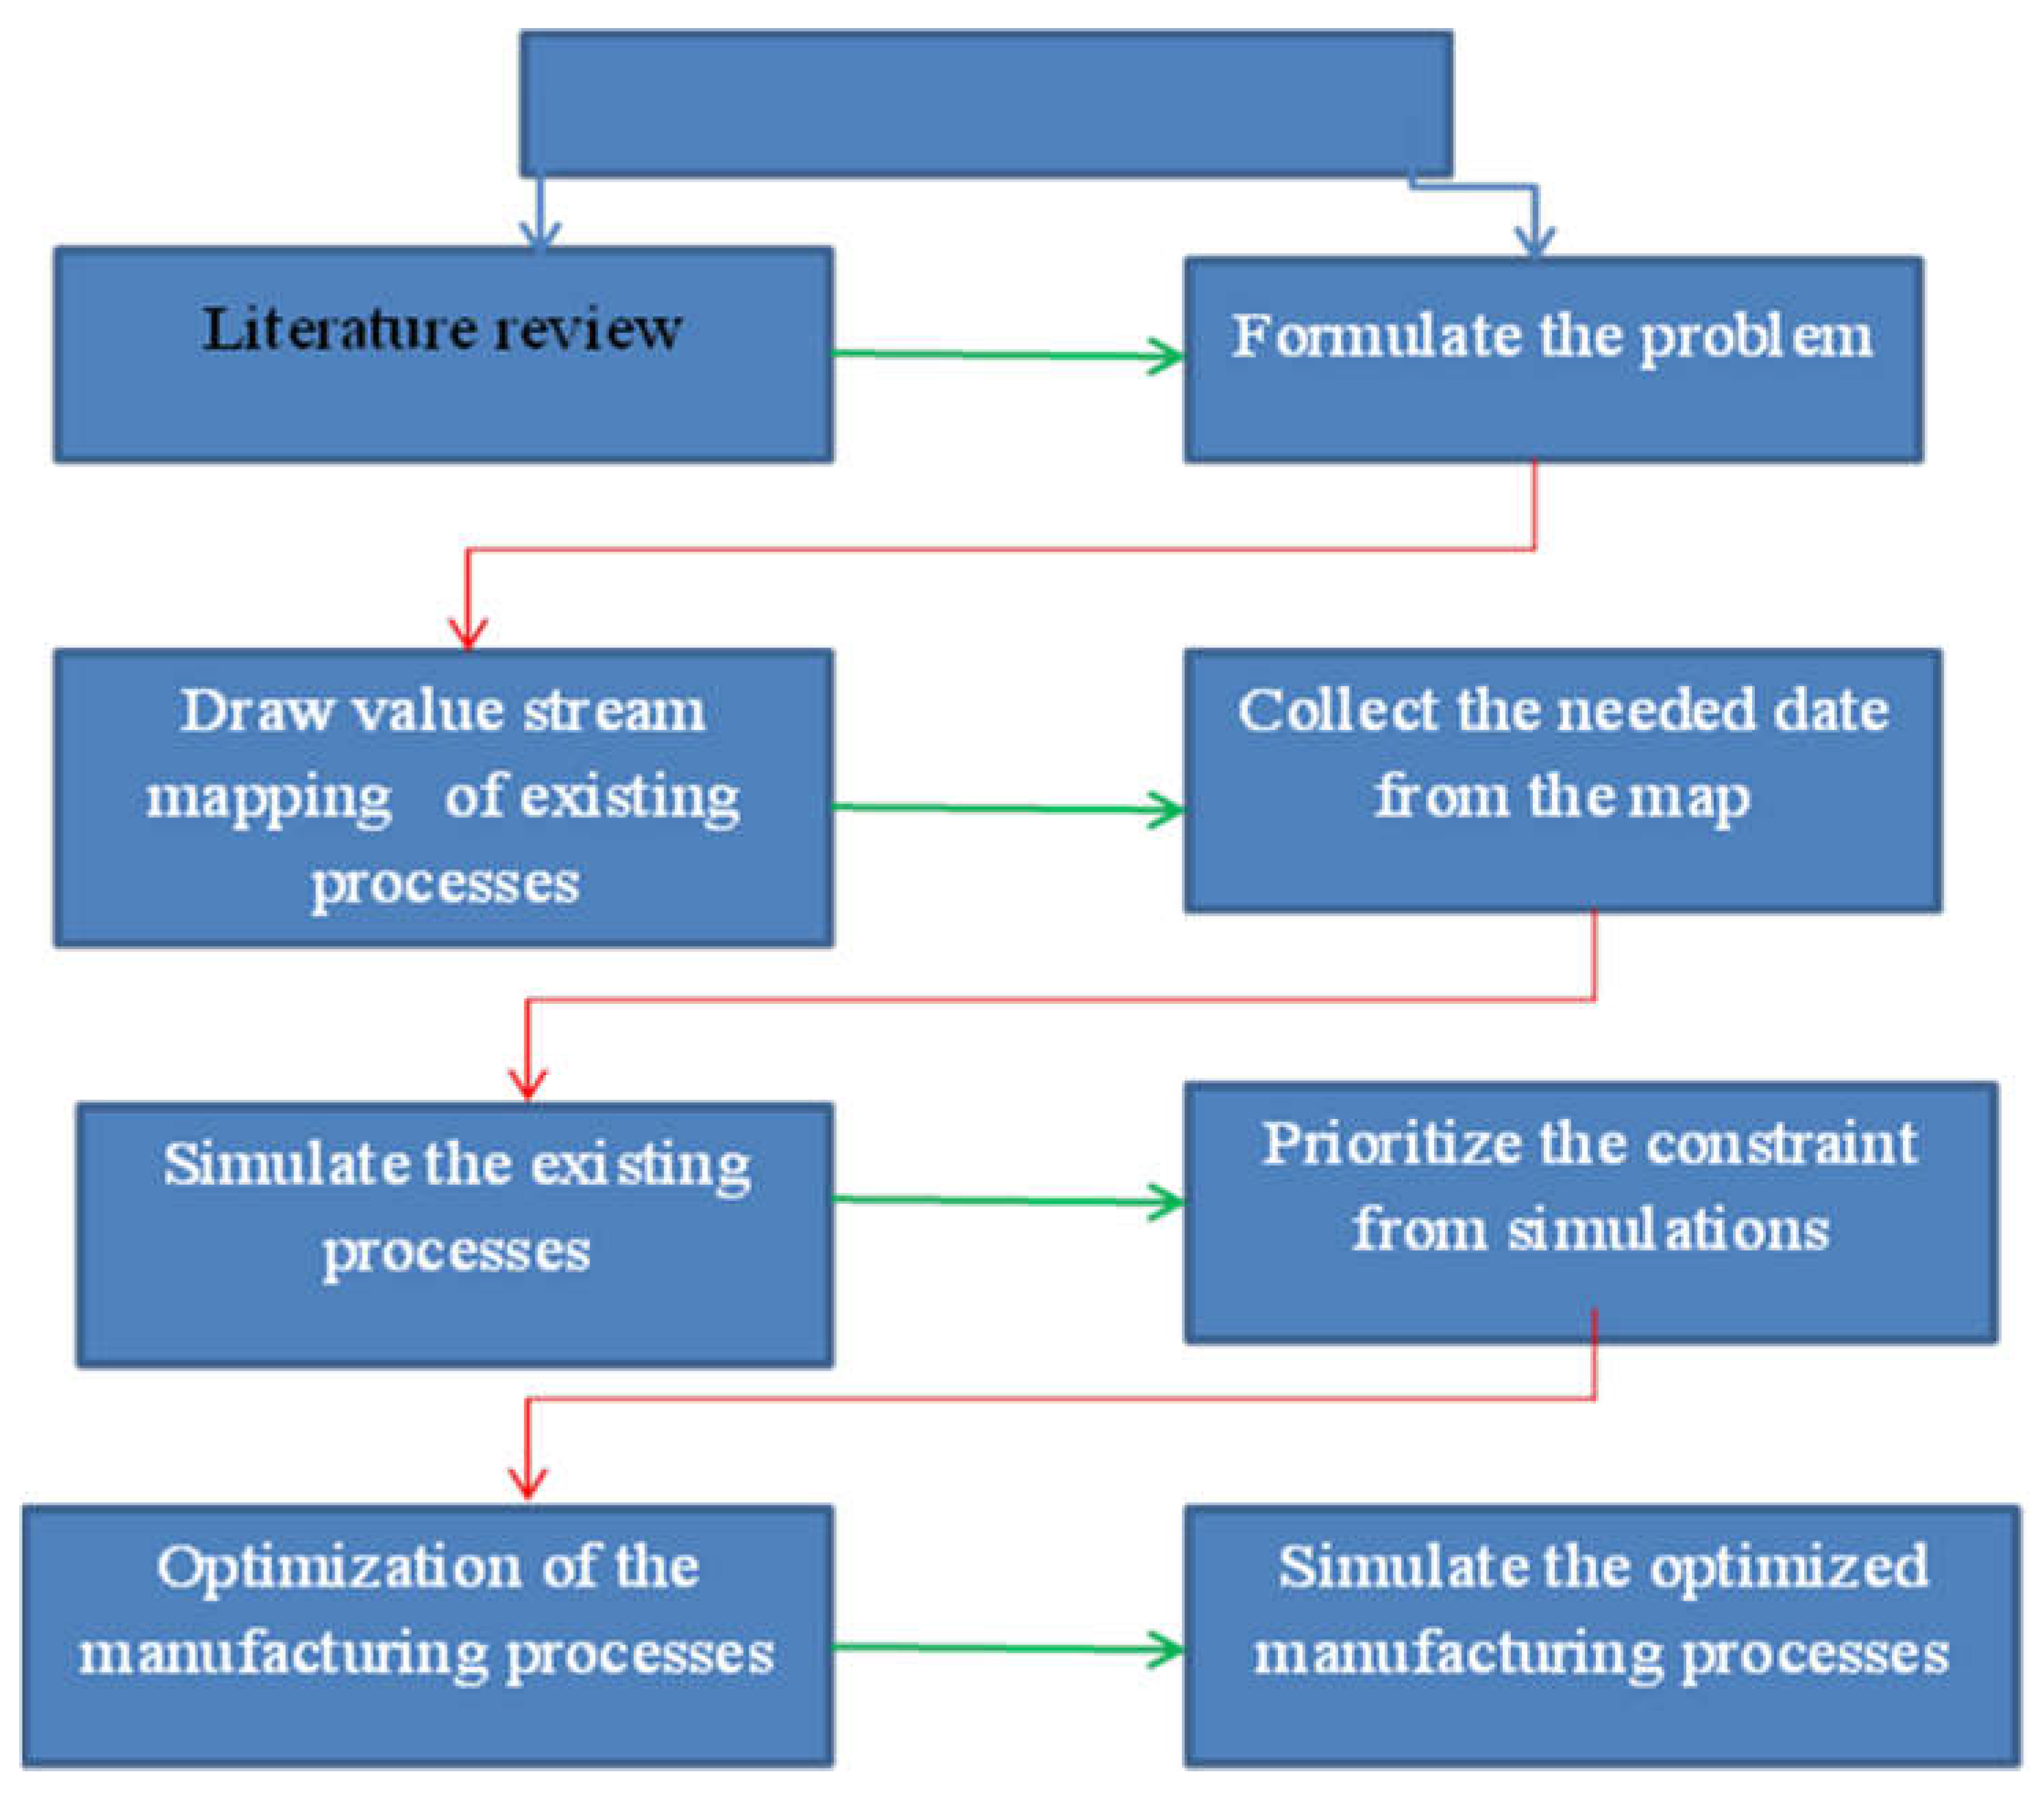
This methodology will use both qualitative and quantities approach and the methodology flows as the figure indicate.
Figure 1.
research methodology.
3.4. DMAIC Approach Methodology
Step 1 Defines;
This stage is very important phase, an organization has to ask or to identify themselves some very crucial questions like what are the flaws in the production process and what how have any problems affected business operations. At these phase to measure effectiveness of the garment industries by comparing their plan and actual status in terms of effectiveness and efficiencies.
Step 2 Measurement phase;
At this phase garment industry here needs to look at their production system and see what’s working and what isn’t. When everything is measured up, an organization is able to know what the root cause of their production problem is and start looking for ways to solve it. Having a data collection plan is very useful when conducting this phase. At this phase the magnification tools like fishbone diagram to identify the root cause of the problem.
Step 3 Analysis phase;
During this phase, the researcher will analyze what they have gathered during the measurement phase about their production process. When data is analyzed by the management, an organization is able to narrow down the cause of their production problems and figure out ways to maximize things.
Step 4 improvement phase;
At this phase the production problem is will well understand by everyone, it is time for everyone in the organization to start brainstorming ideas on how to make things better. This is the stage where garment industries test and implements all their ideas in terms of improving production and makes any changes if needed. At this phase the optimization by algorithm will conduct.
Step 5 control phase;
At this phase Implement the optimize production system or solution to the production problem is only the beginning; on the garment industries has to make sure that they maintain it. This is the last stage of the continuous improvement process and it is all about coming up with strategies to maintain high levels of production all the time. At this stage the new optimize production system will introduce to the companies by giving training for the responsible persons.
Data Collection methods
Part arrival rates, part processing rates, number and availability of resources, workload distribution, and operation time are essential parameters to calculate system performance measures and identify the problem as well as to know such as average waiting time, resource utilization, and average time in the system. For each part, the arrival time of parts, part’s processing start time, and processing end time from each work station using time study method has been recorded for seven working days each of seven work hours using stop watch to the responsible person for primary data. And as secondary data; manual of the companies and literature has been used for conducting this research.
Data Analysis tools and techniques
- ➣
- All collected data have been evaluated by the Arena Input Analyzer software in order to determine distribution function and simulate the modeling.
- ➣
- Optimization tools and techniques like opt quest
3.5. Verification and Validation of the Research
The simulation model has been verified using traces and animation technique; the sample t- test with the confidence interval 95% will use to compare the mean throughput from Arena simulation model and the throughput sample from the production line system. The hypothesis test has been accomplished with the help of Minitab statistical software (version 18) to validate the simulation model with a t-test and p-value (0.05). The regression Meta model will analyze using ANOVA analysis of the response (throughput) versus factors with the help of Minitab software.
4. Result and Discussion
4.1. Techniques of Standard Time
The standard time of an operation (tasks) can be determined using the following techniques;
1. time study
2. predetermined motion time system
3. standard data system
4. work sampling
4.2. Method of Calculation
The standard time is the product out of the three factors and these are listed as fellows;
1. Observed time:- the time measured to complete the operation (task) or the activity.
2. Performance rating factor: - this factor is calculated by an experienced worker who is trained to observe and determine the rating factor.
3. Personal, delay allowance and fatigue: - allowance is the adjustment done to the normal time to obtain the standard time for the purpose to recover the lost time due to fatigue, personal needs, and unavoidable delays by providing a small increase can still be able to cover lost time and complete the work assigned to the operator (groover, 2007). And then, standard time can be calculated using the formula below;
Standard time (TS) = normal time (TN) + allowance time (TA)
Normal time =observed time (TO) *rating factor (RF)
Standard time= (observed time) *(rating factor) *(1+allowance)
Standard time = normal time*(1+ allowance)
4.2.1. Allowance Technique
There are two types of interruption;
1. Interruption related to work
2. Interruption not related to work for example rest break to overcome fatigue machine break down and receiving instruction from manager are the interruption related to work, but personal needs, lunch break and personal calls are the interruption not related to work. However, the two types of interruption are essential for the worker because it seems to be impossible to work continually during a regular shift.
Figure 2.
types of allowance.
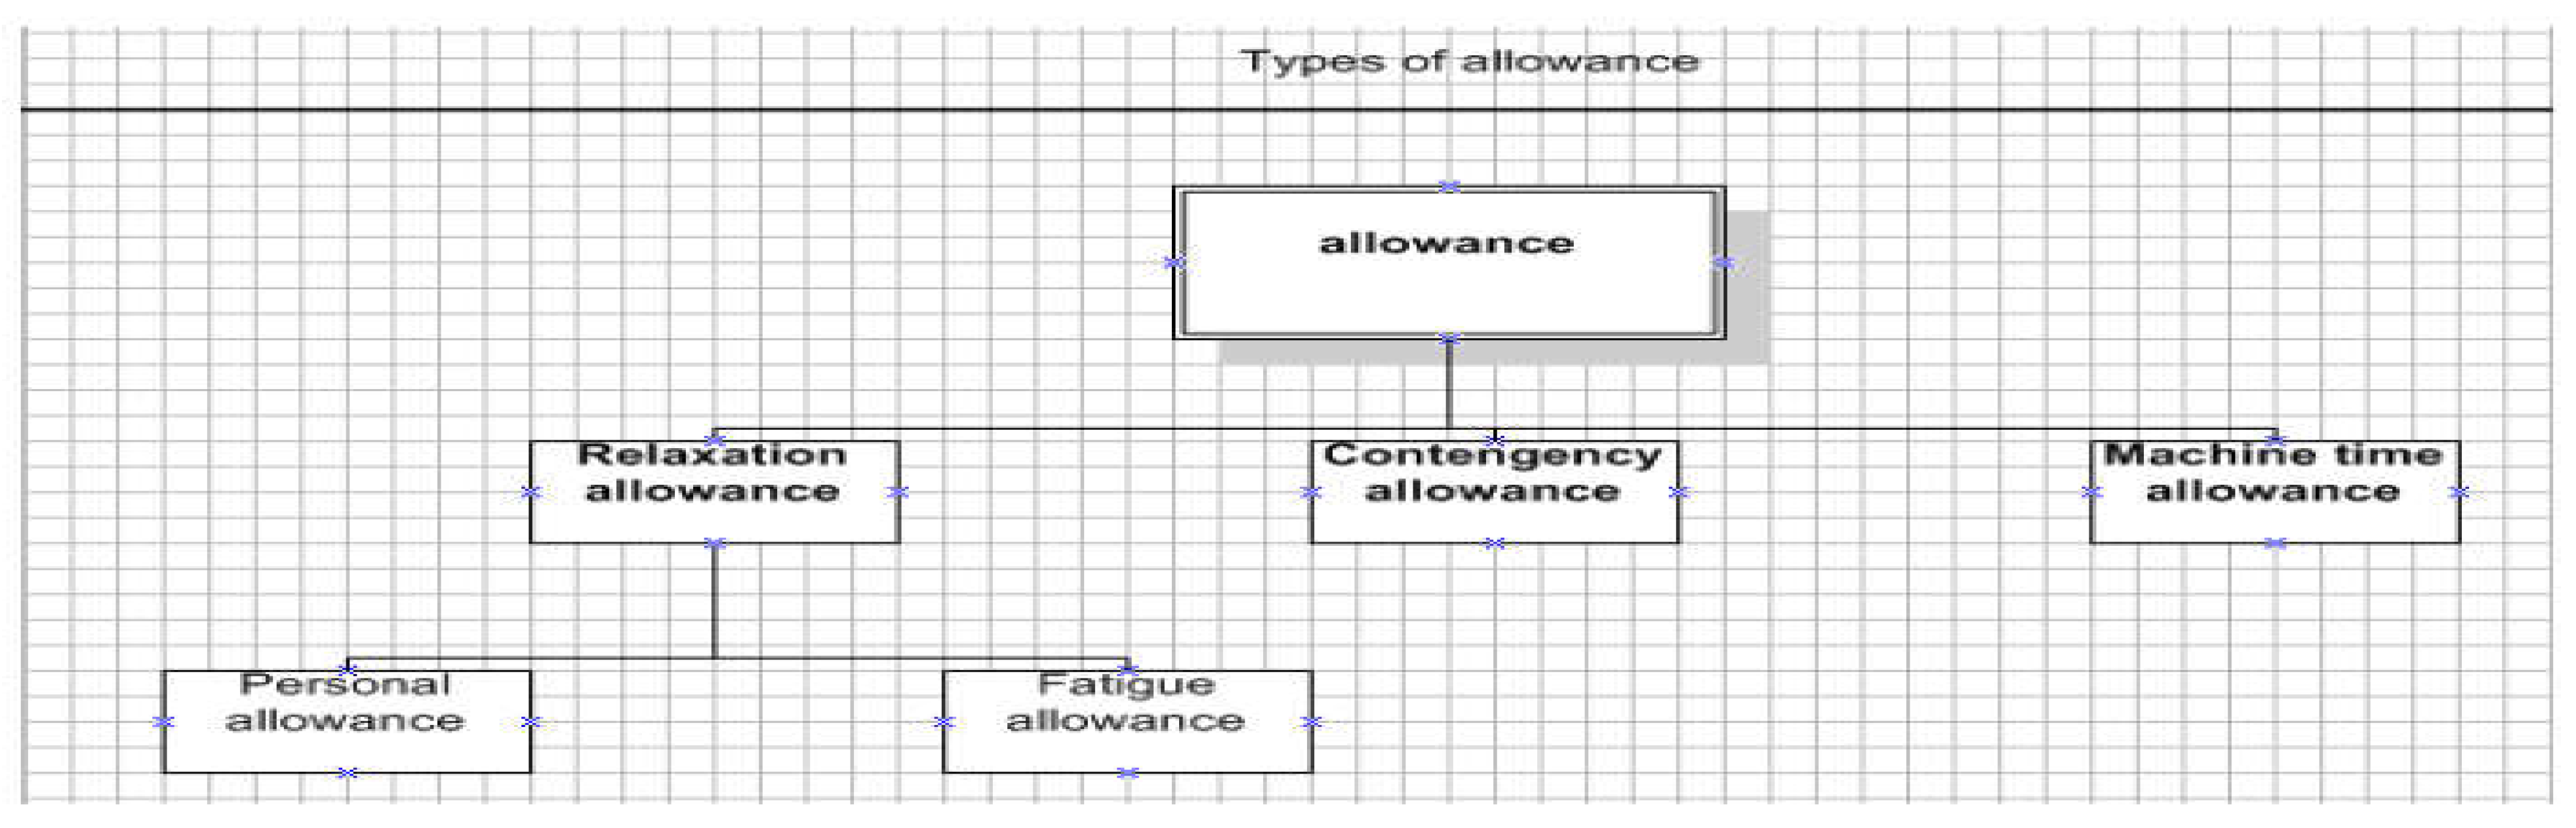
4.2.1.1. Personal Needs Allowance
The personal needs allowance is the time that is associated with workers daily personal needs which include restroom, phone call, going to wash room, fetching a drink etc the common figure is about 5-7 % of the basic time. And it is conditional to work environment in term of uncomfortably and temperature for example.
4.2.1.2. Fatigue Allowance
The fatigue allowance is intended to cover the time that the worker should give to overcome fatigue due to work related stress and conditions. There are three factors that cause fatigue: 1. physical factor like standing and use of force 2. mental and eye strain 3. environmental and work factor like poor lighting, noise and heat. Normally it is counted as 4% on basic time.
4.2.1.4. Contingency Allowance
A Small amount of allowance which is given to meet the legitimate delay of work is counted less than 5%.
Standard allowances for determining standard time of operations are;
Table 2.
allowances.

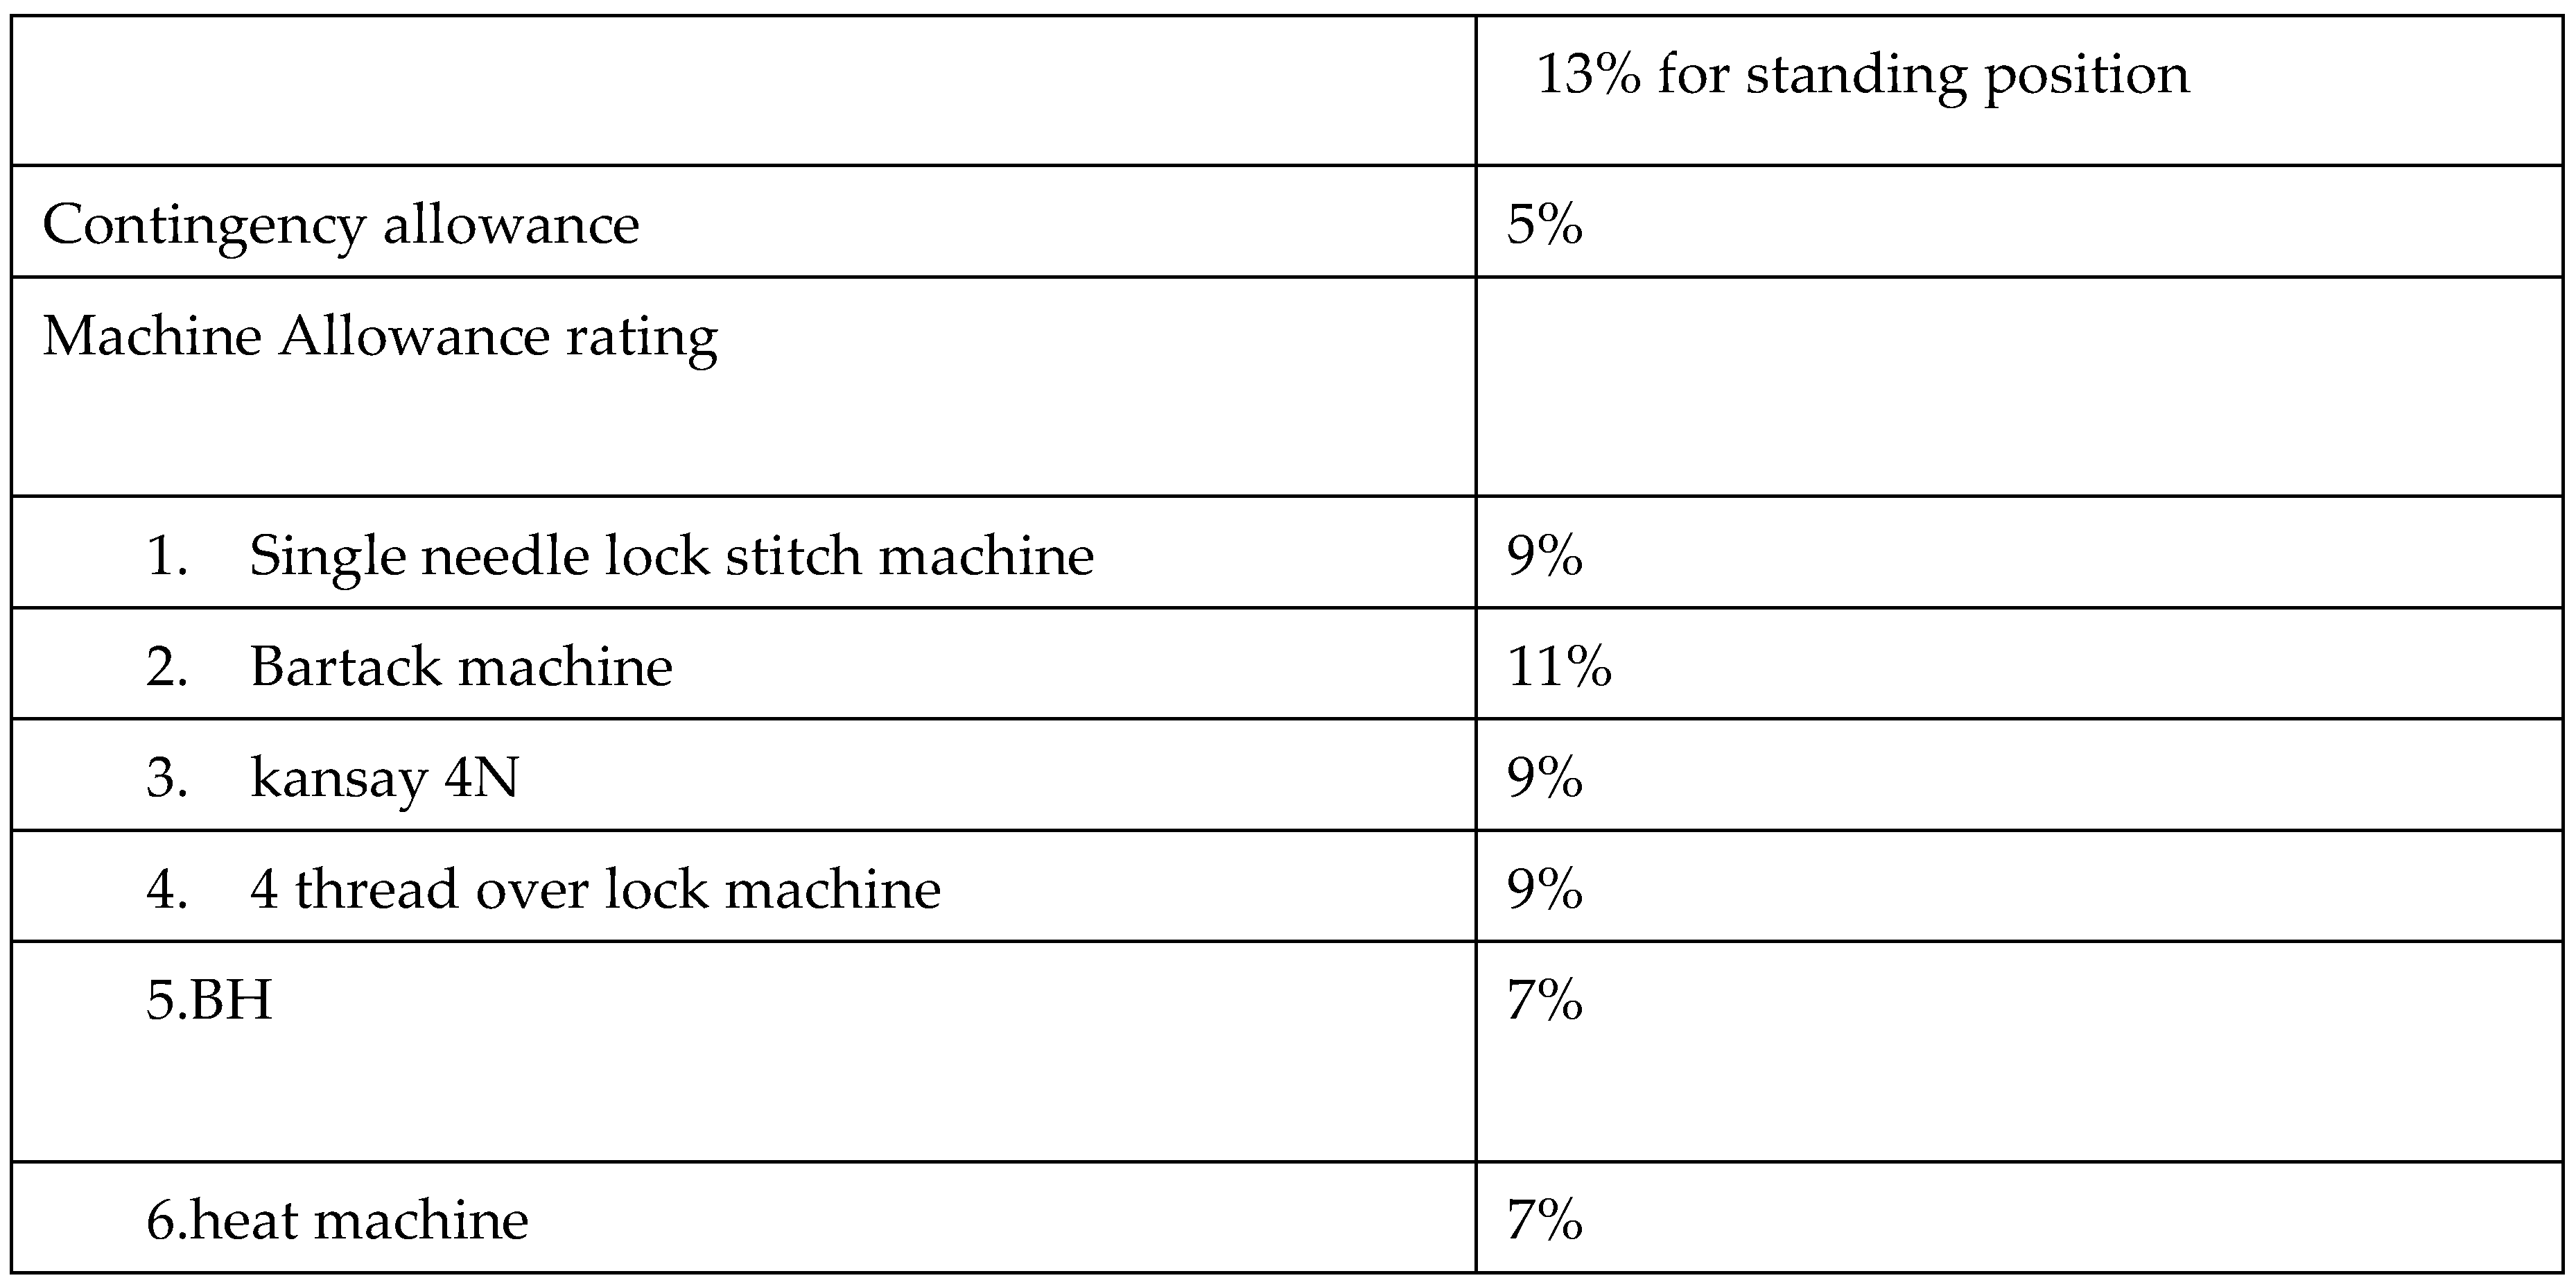
According to the company’s information the performance rate of the operators is assumed to as 100%.
4.3. Standard Time
Standard time for each operation of the long pant type model is as follows.
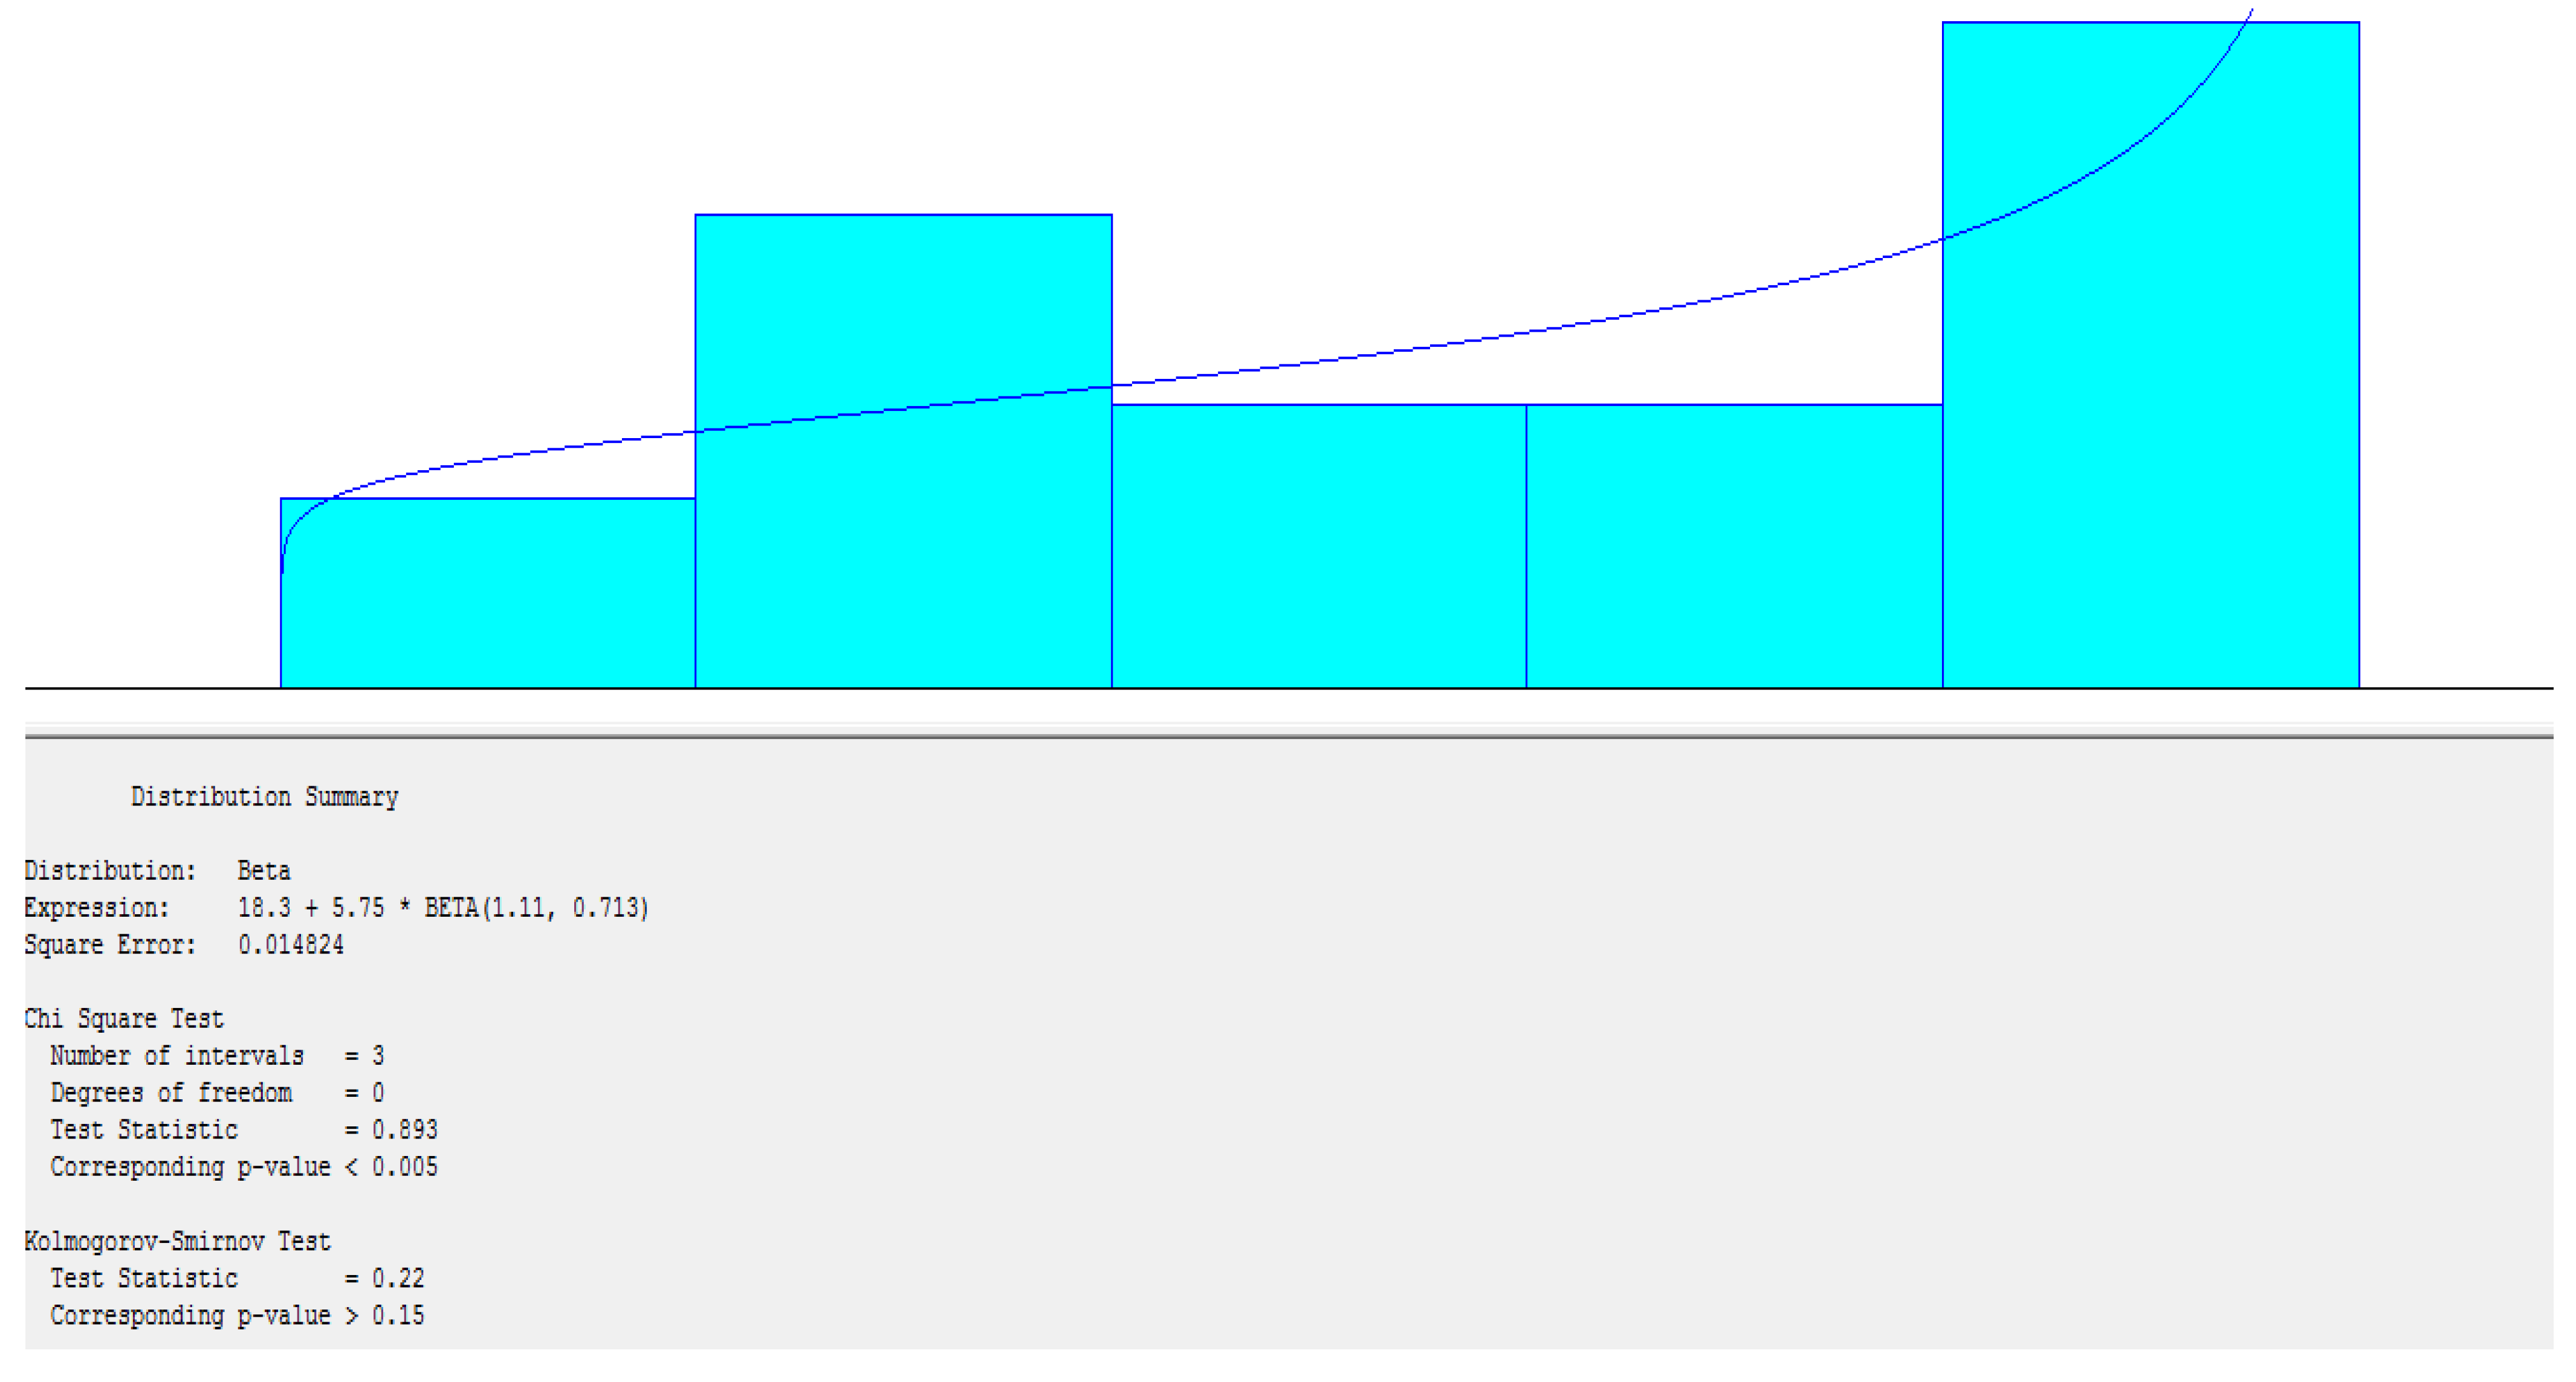
4.4. Data Input Analyzer
All collected data have been evaluated by the Arena Input Analyzer software in order to determine distribution function and used as an input parameter for simulation modeling of the production.
Table 3.
distribution time.
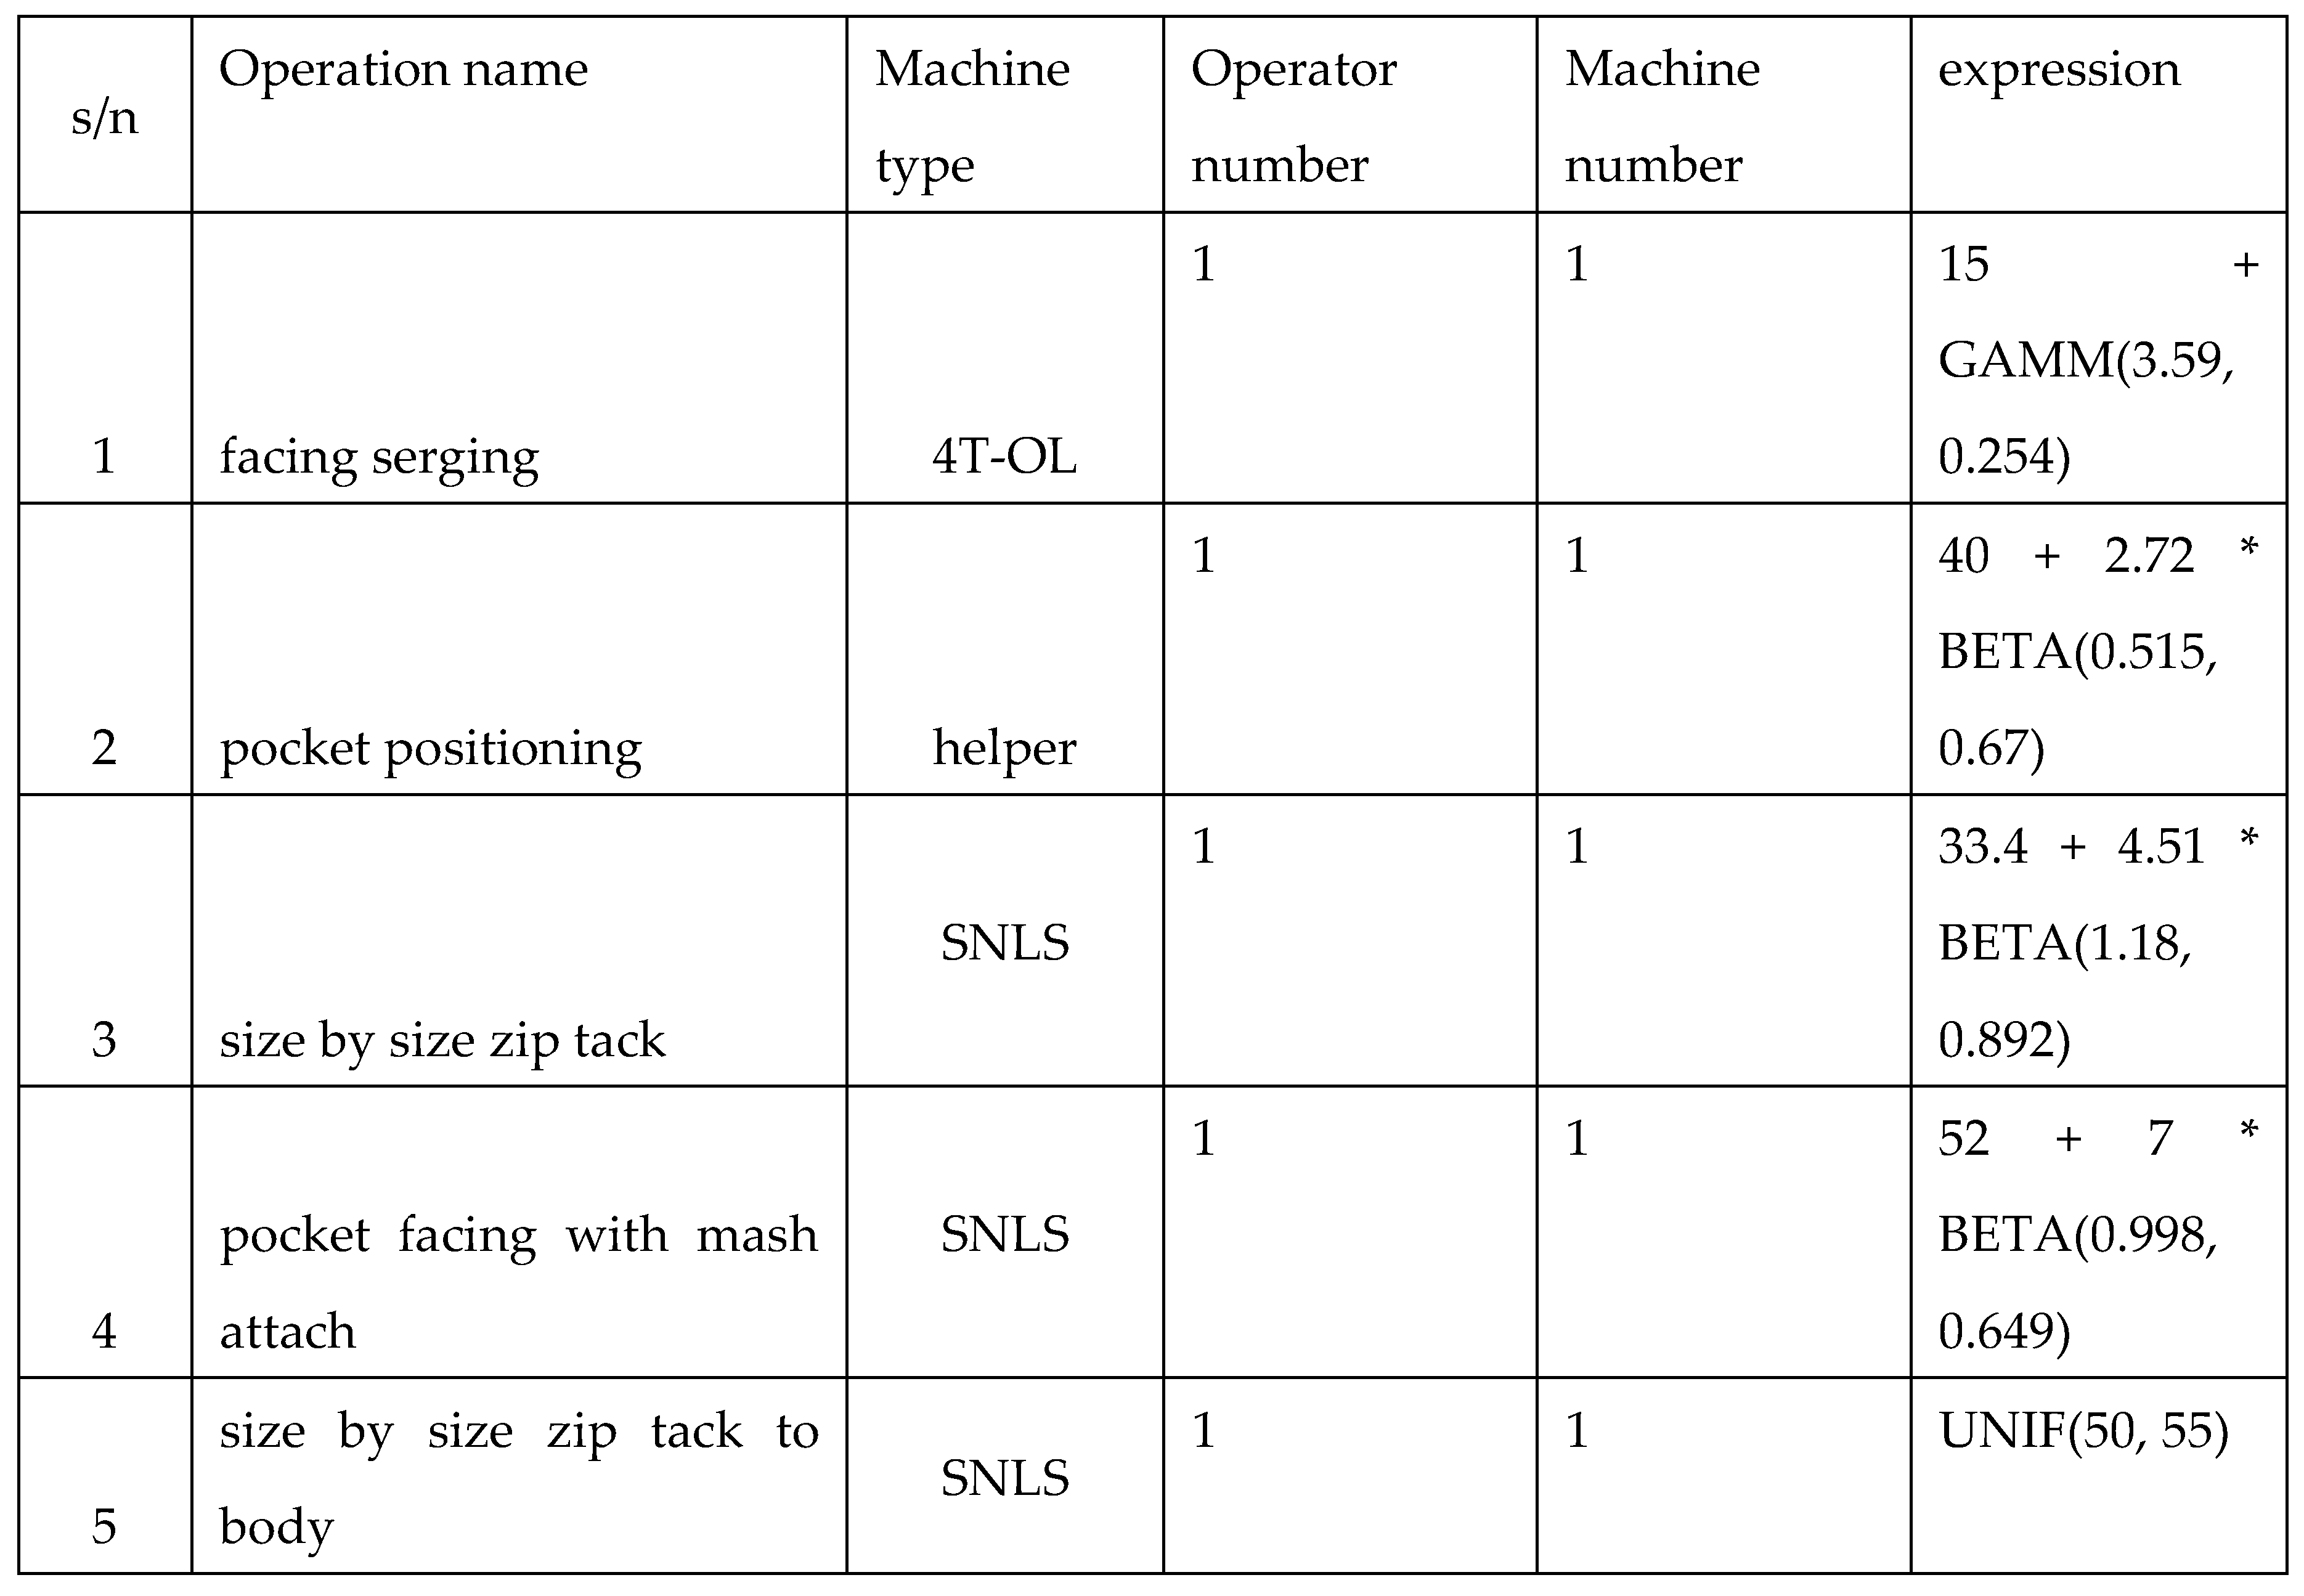
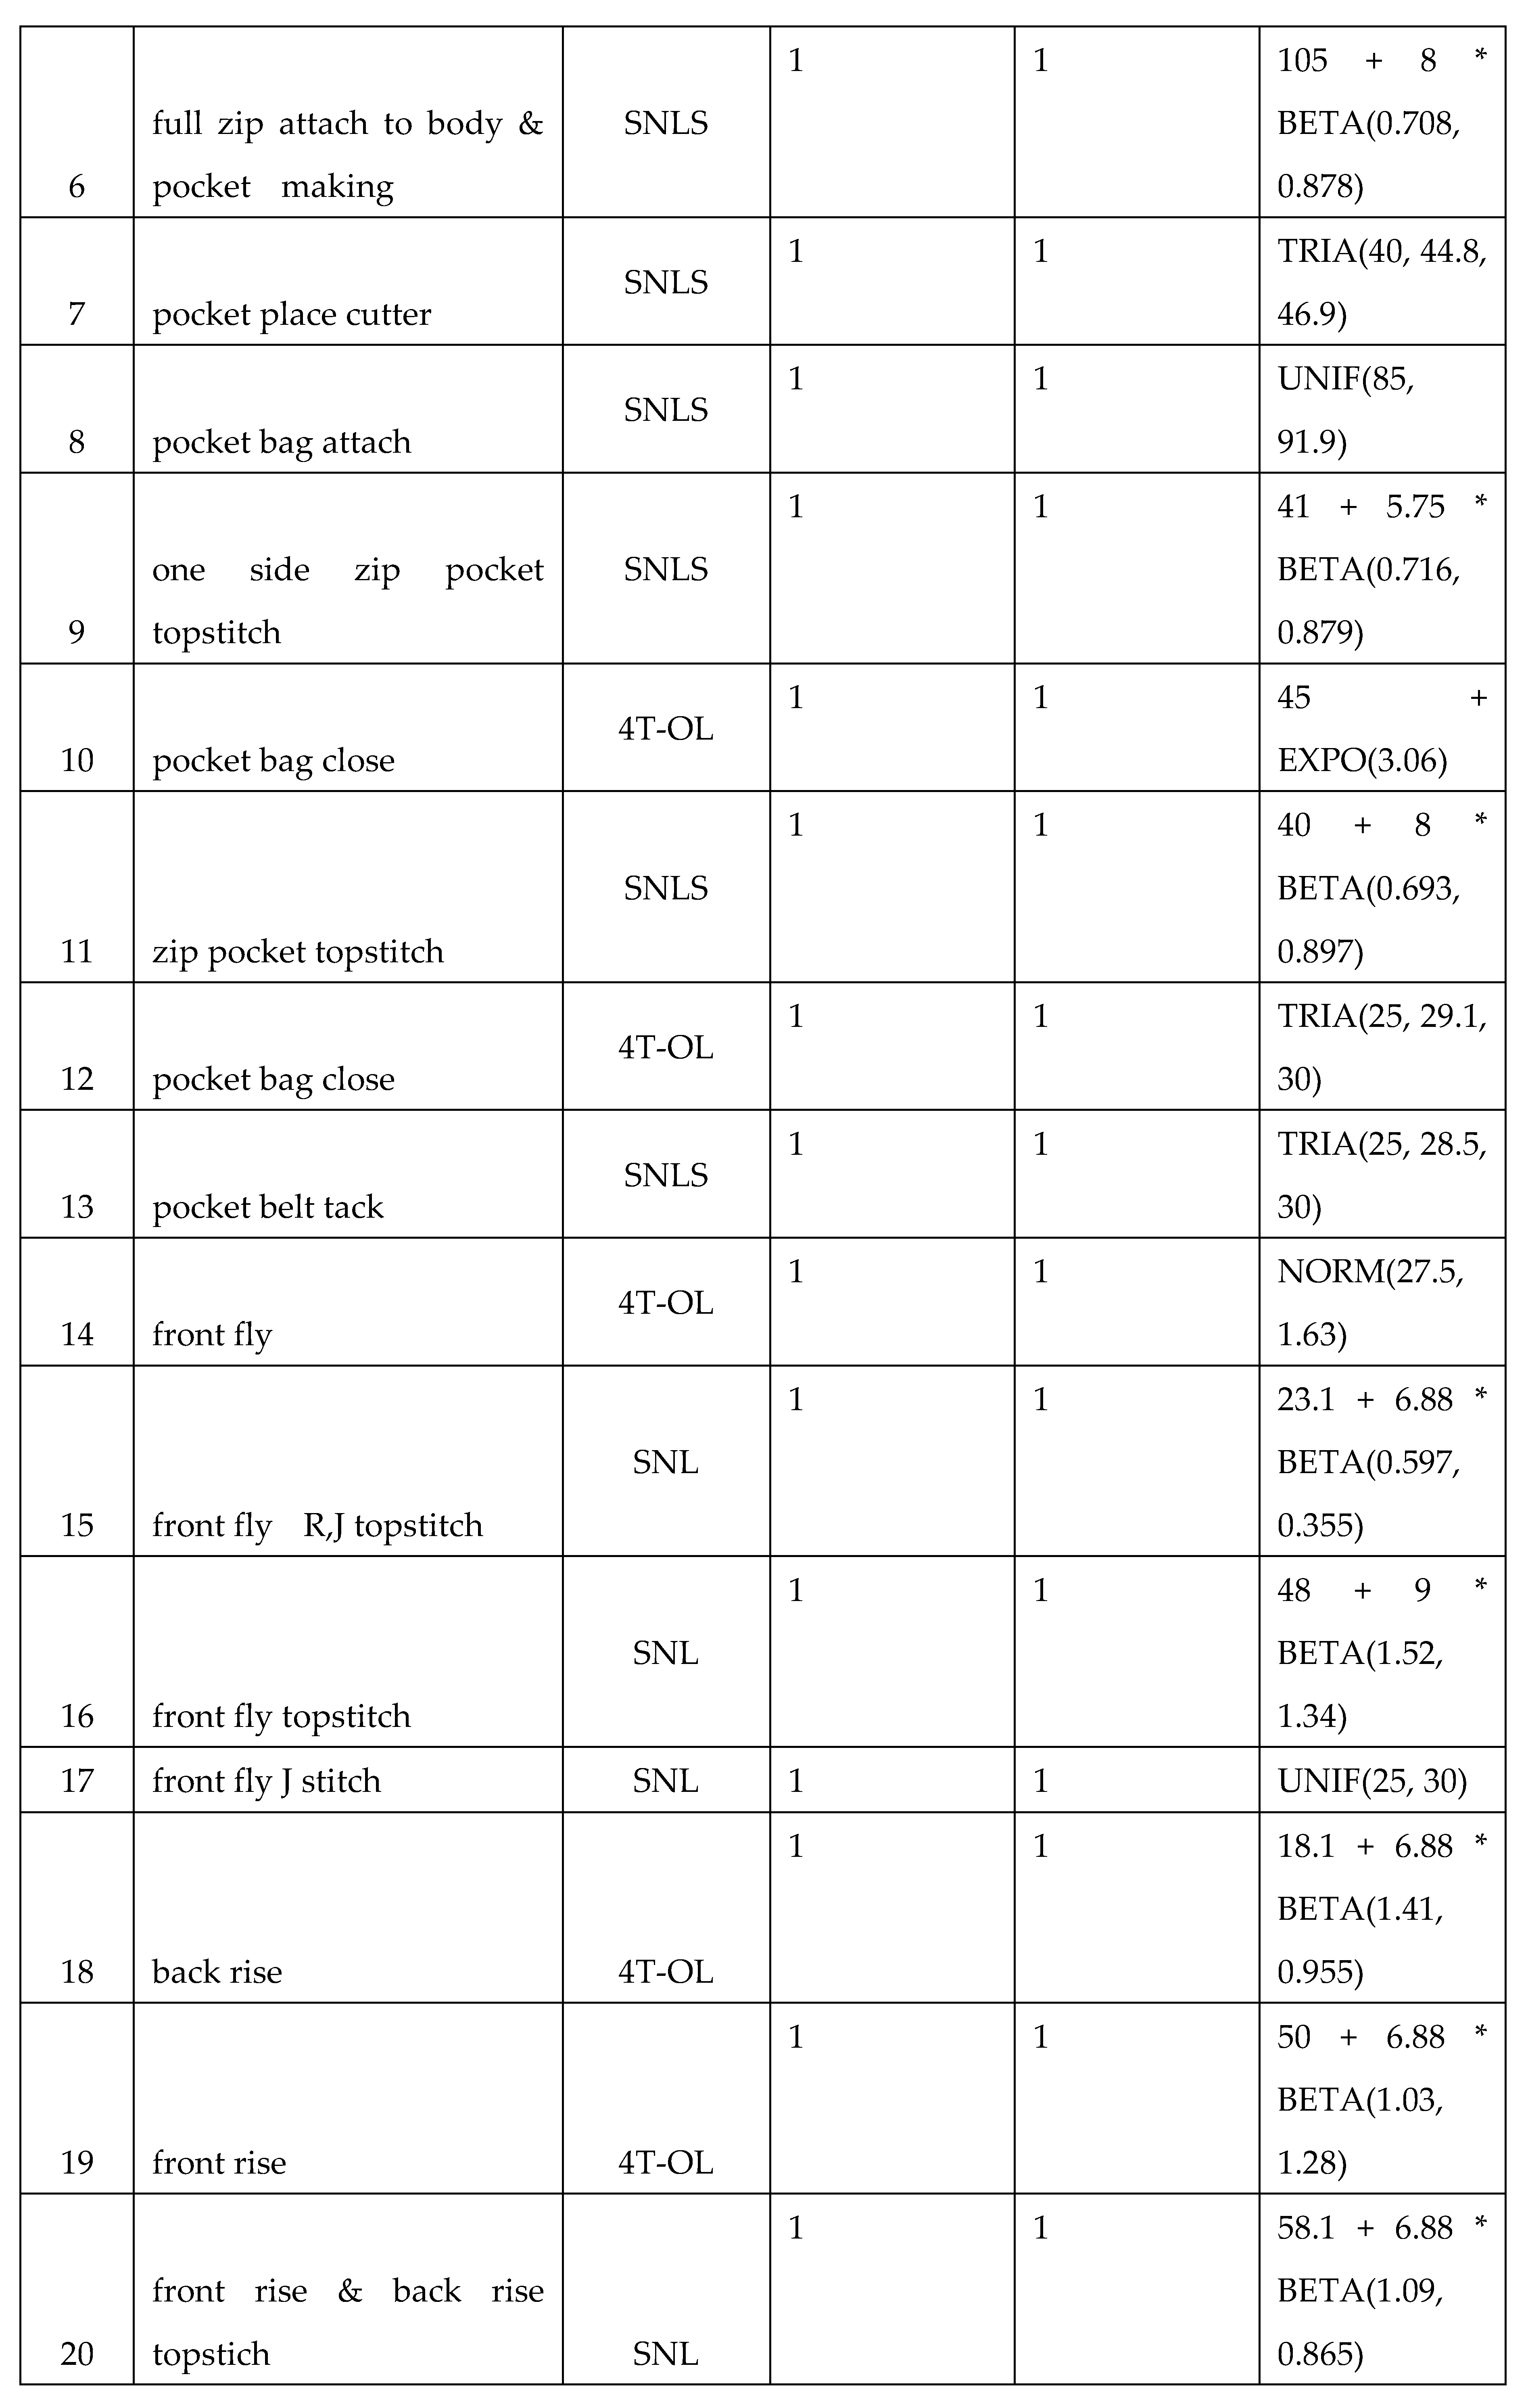
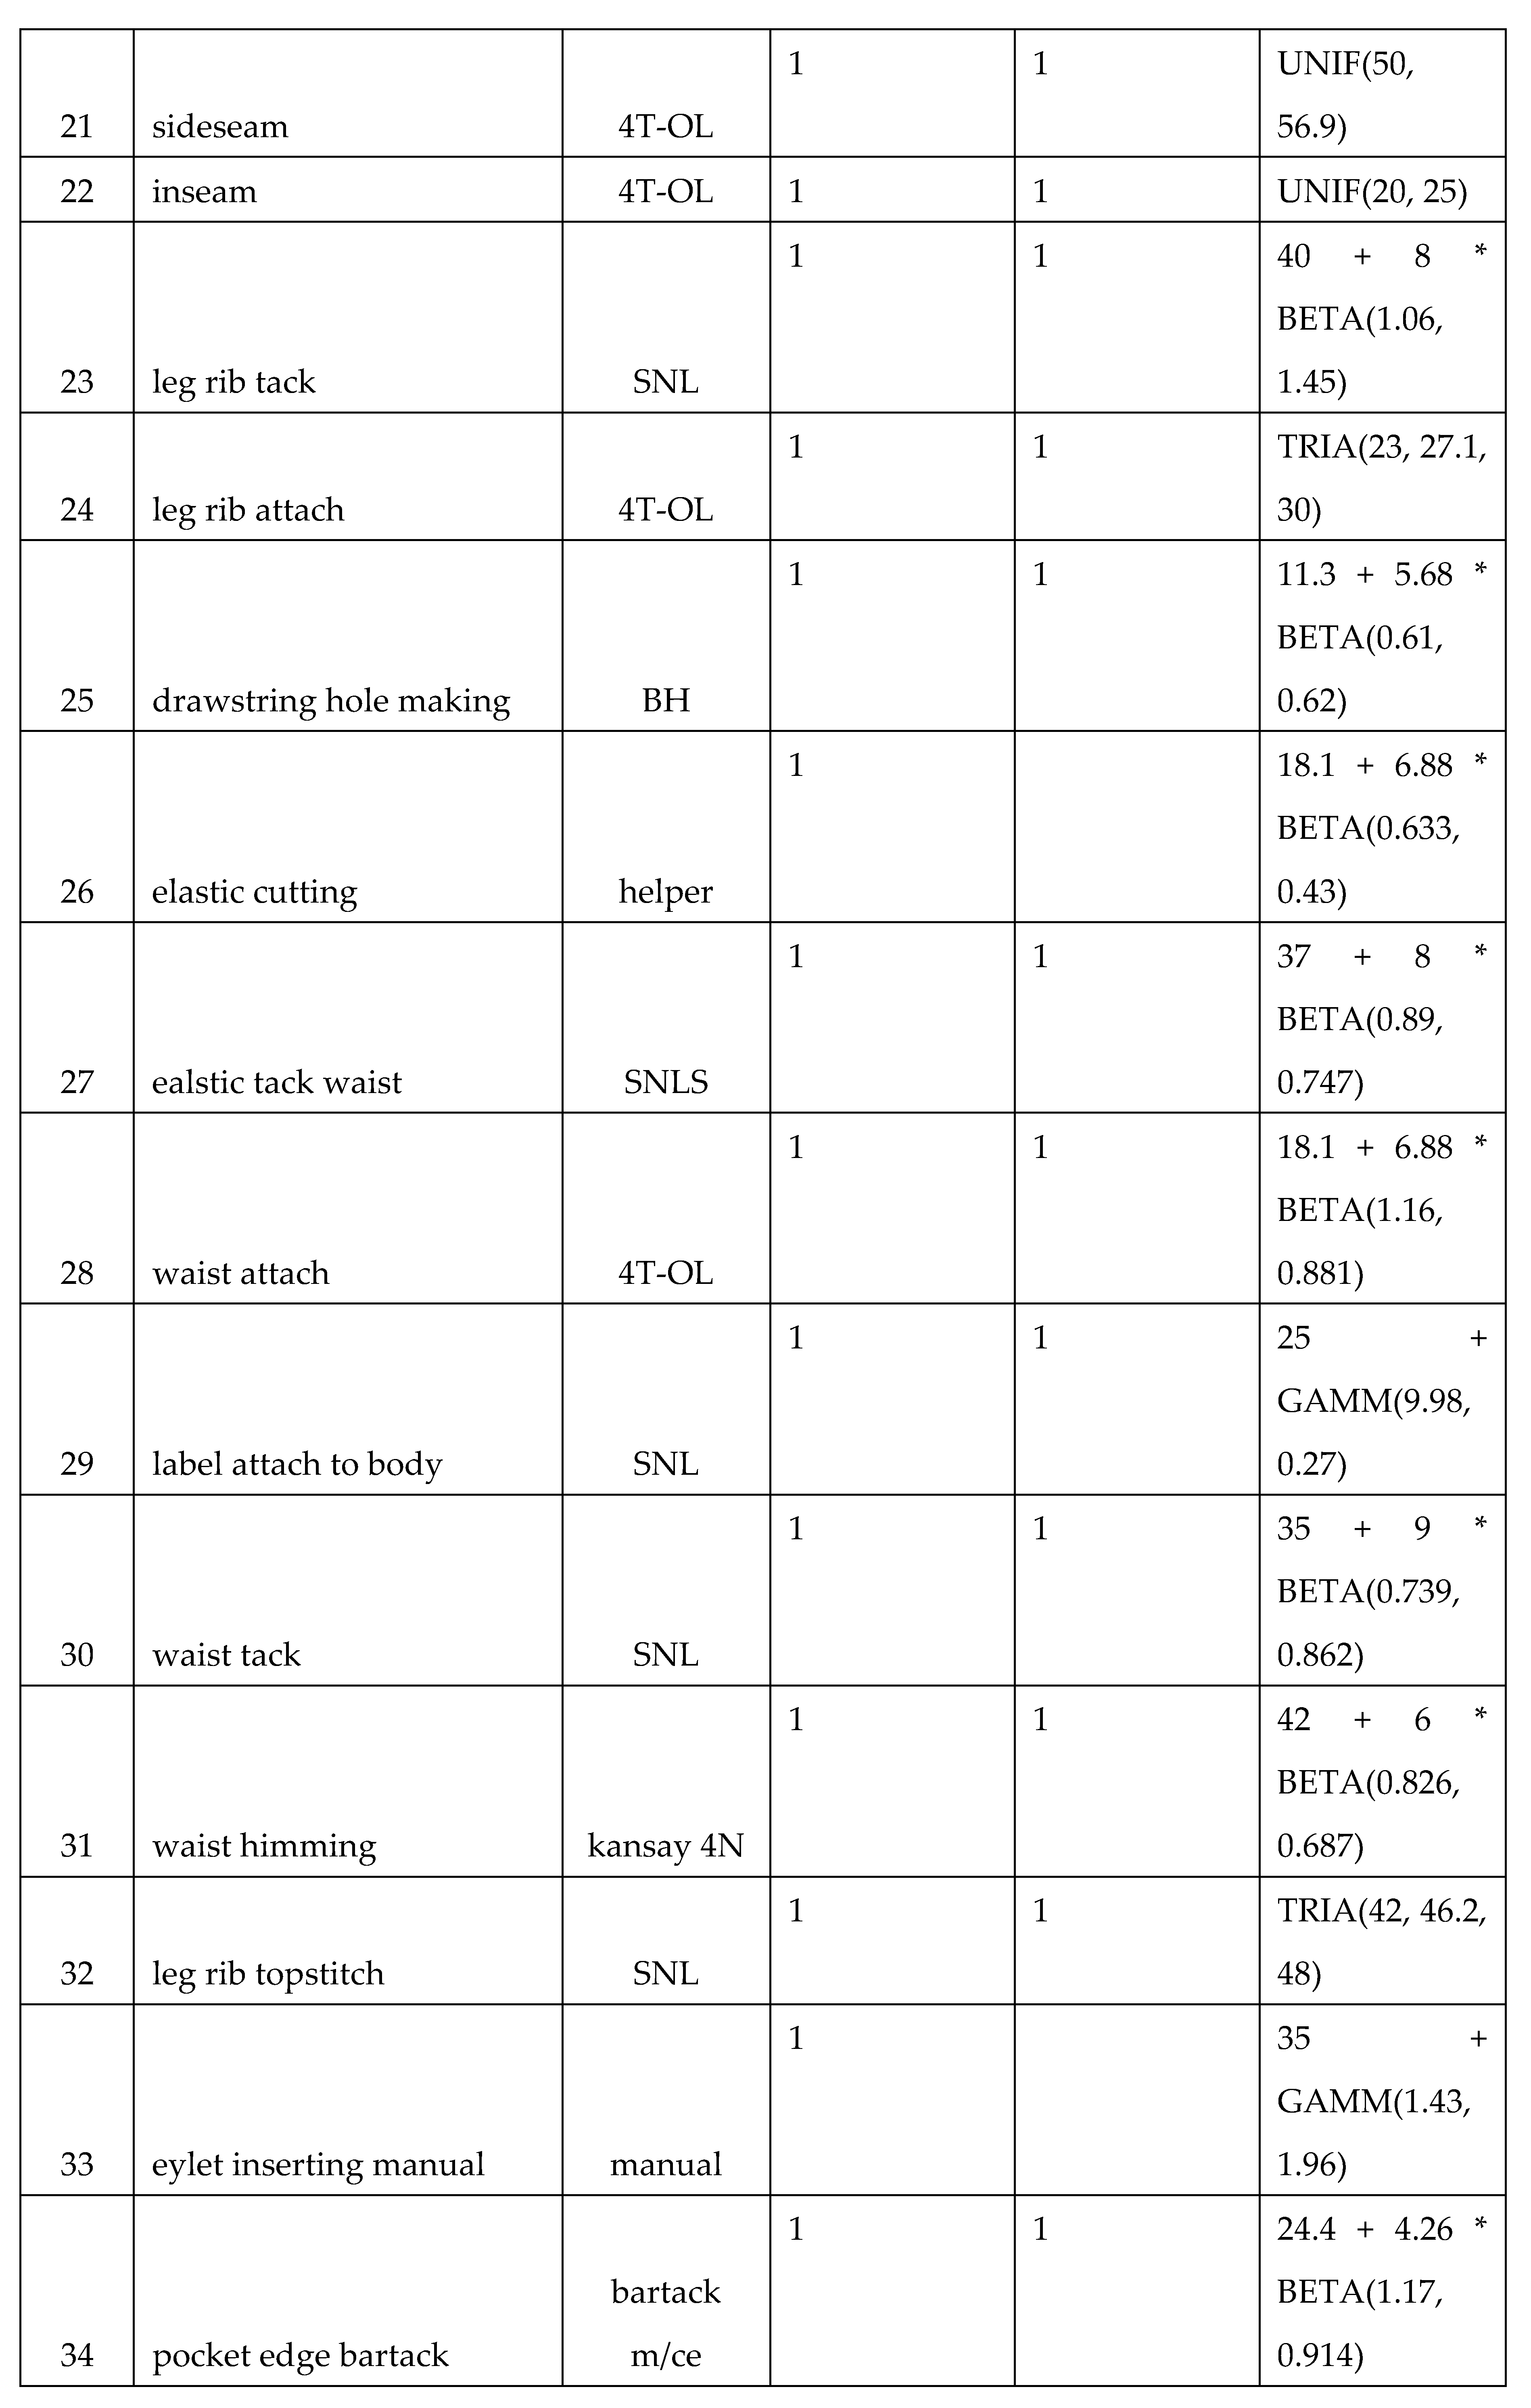
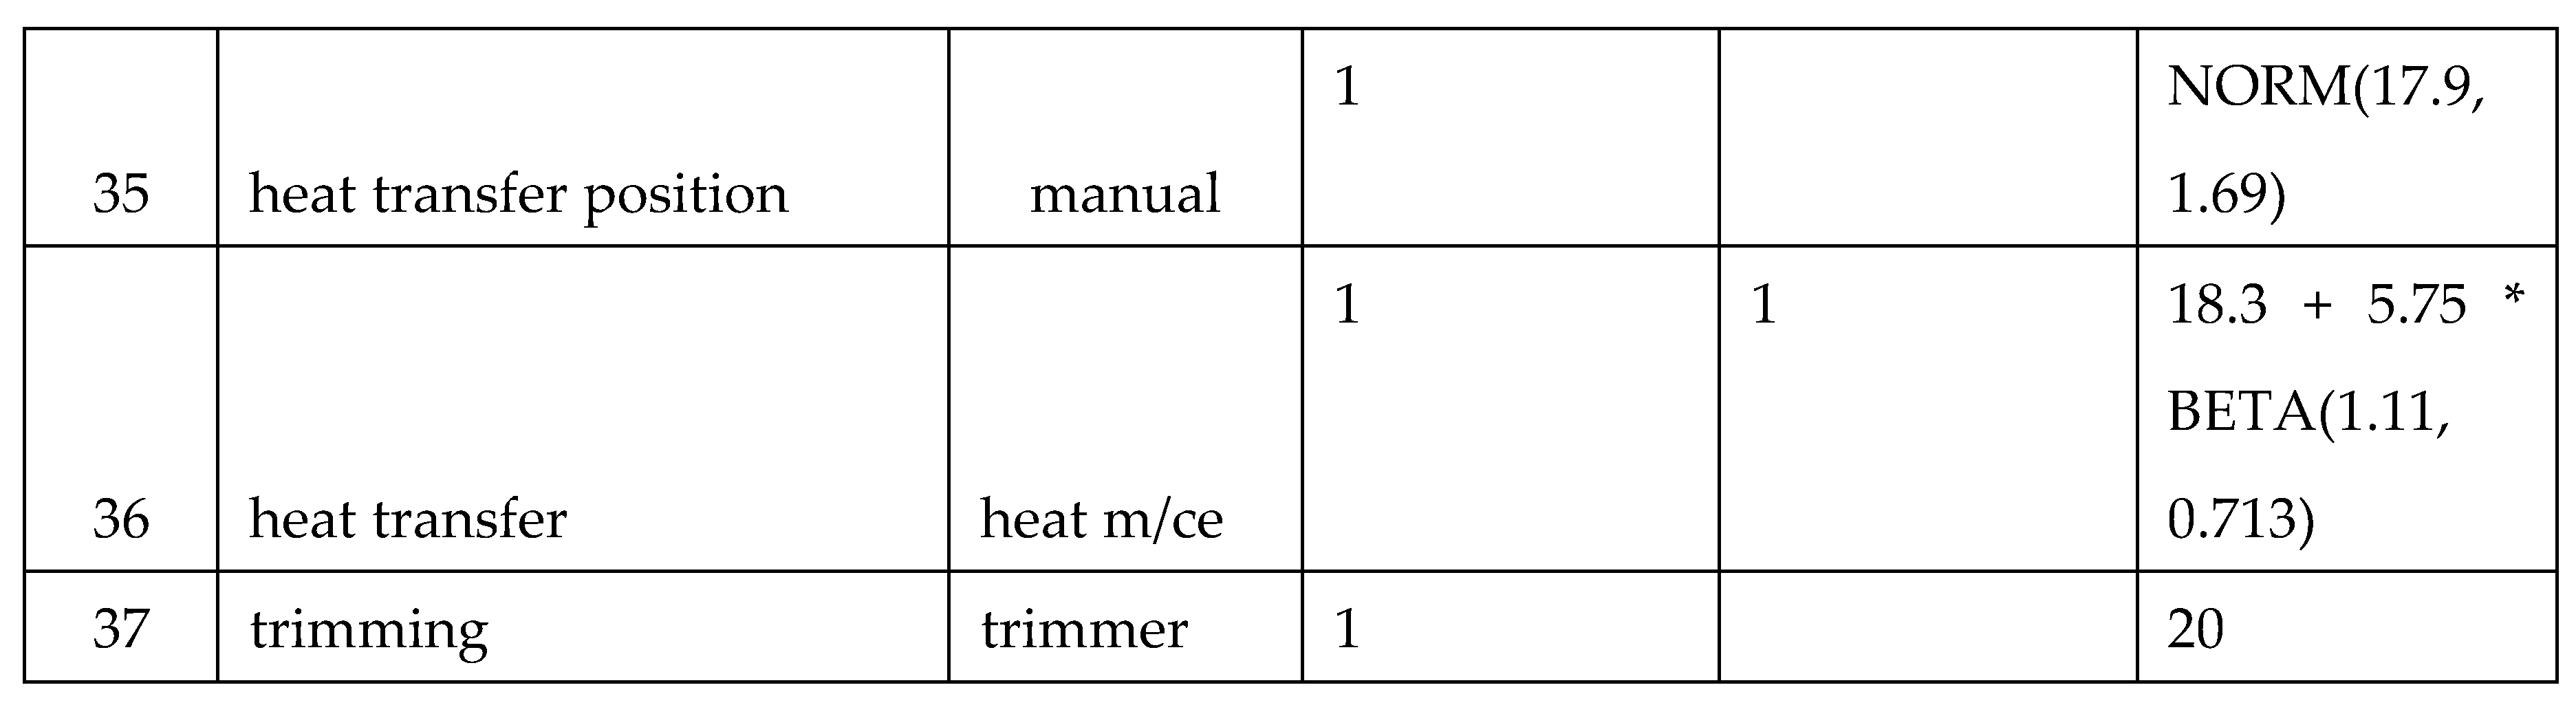
Figure 3.
distribution summarysequence of operations.
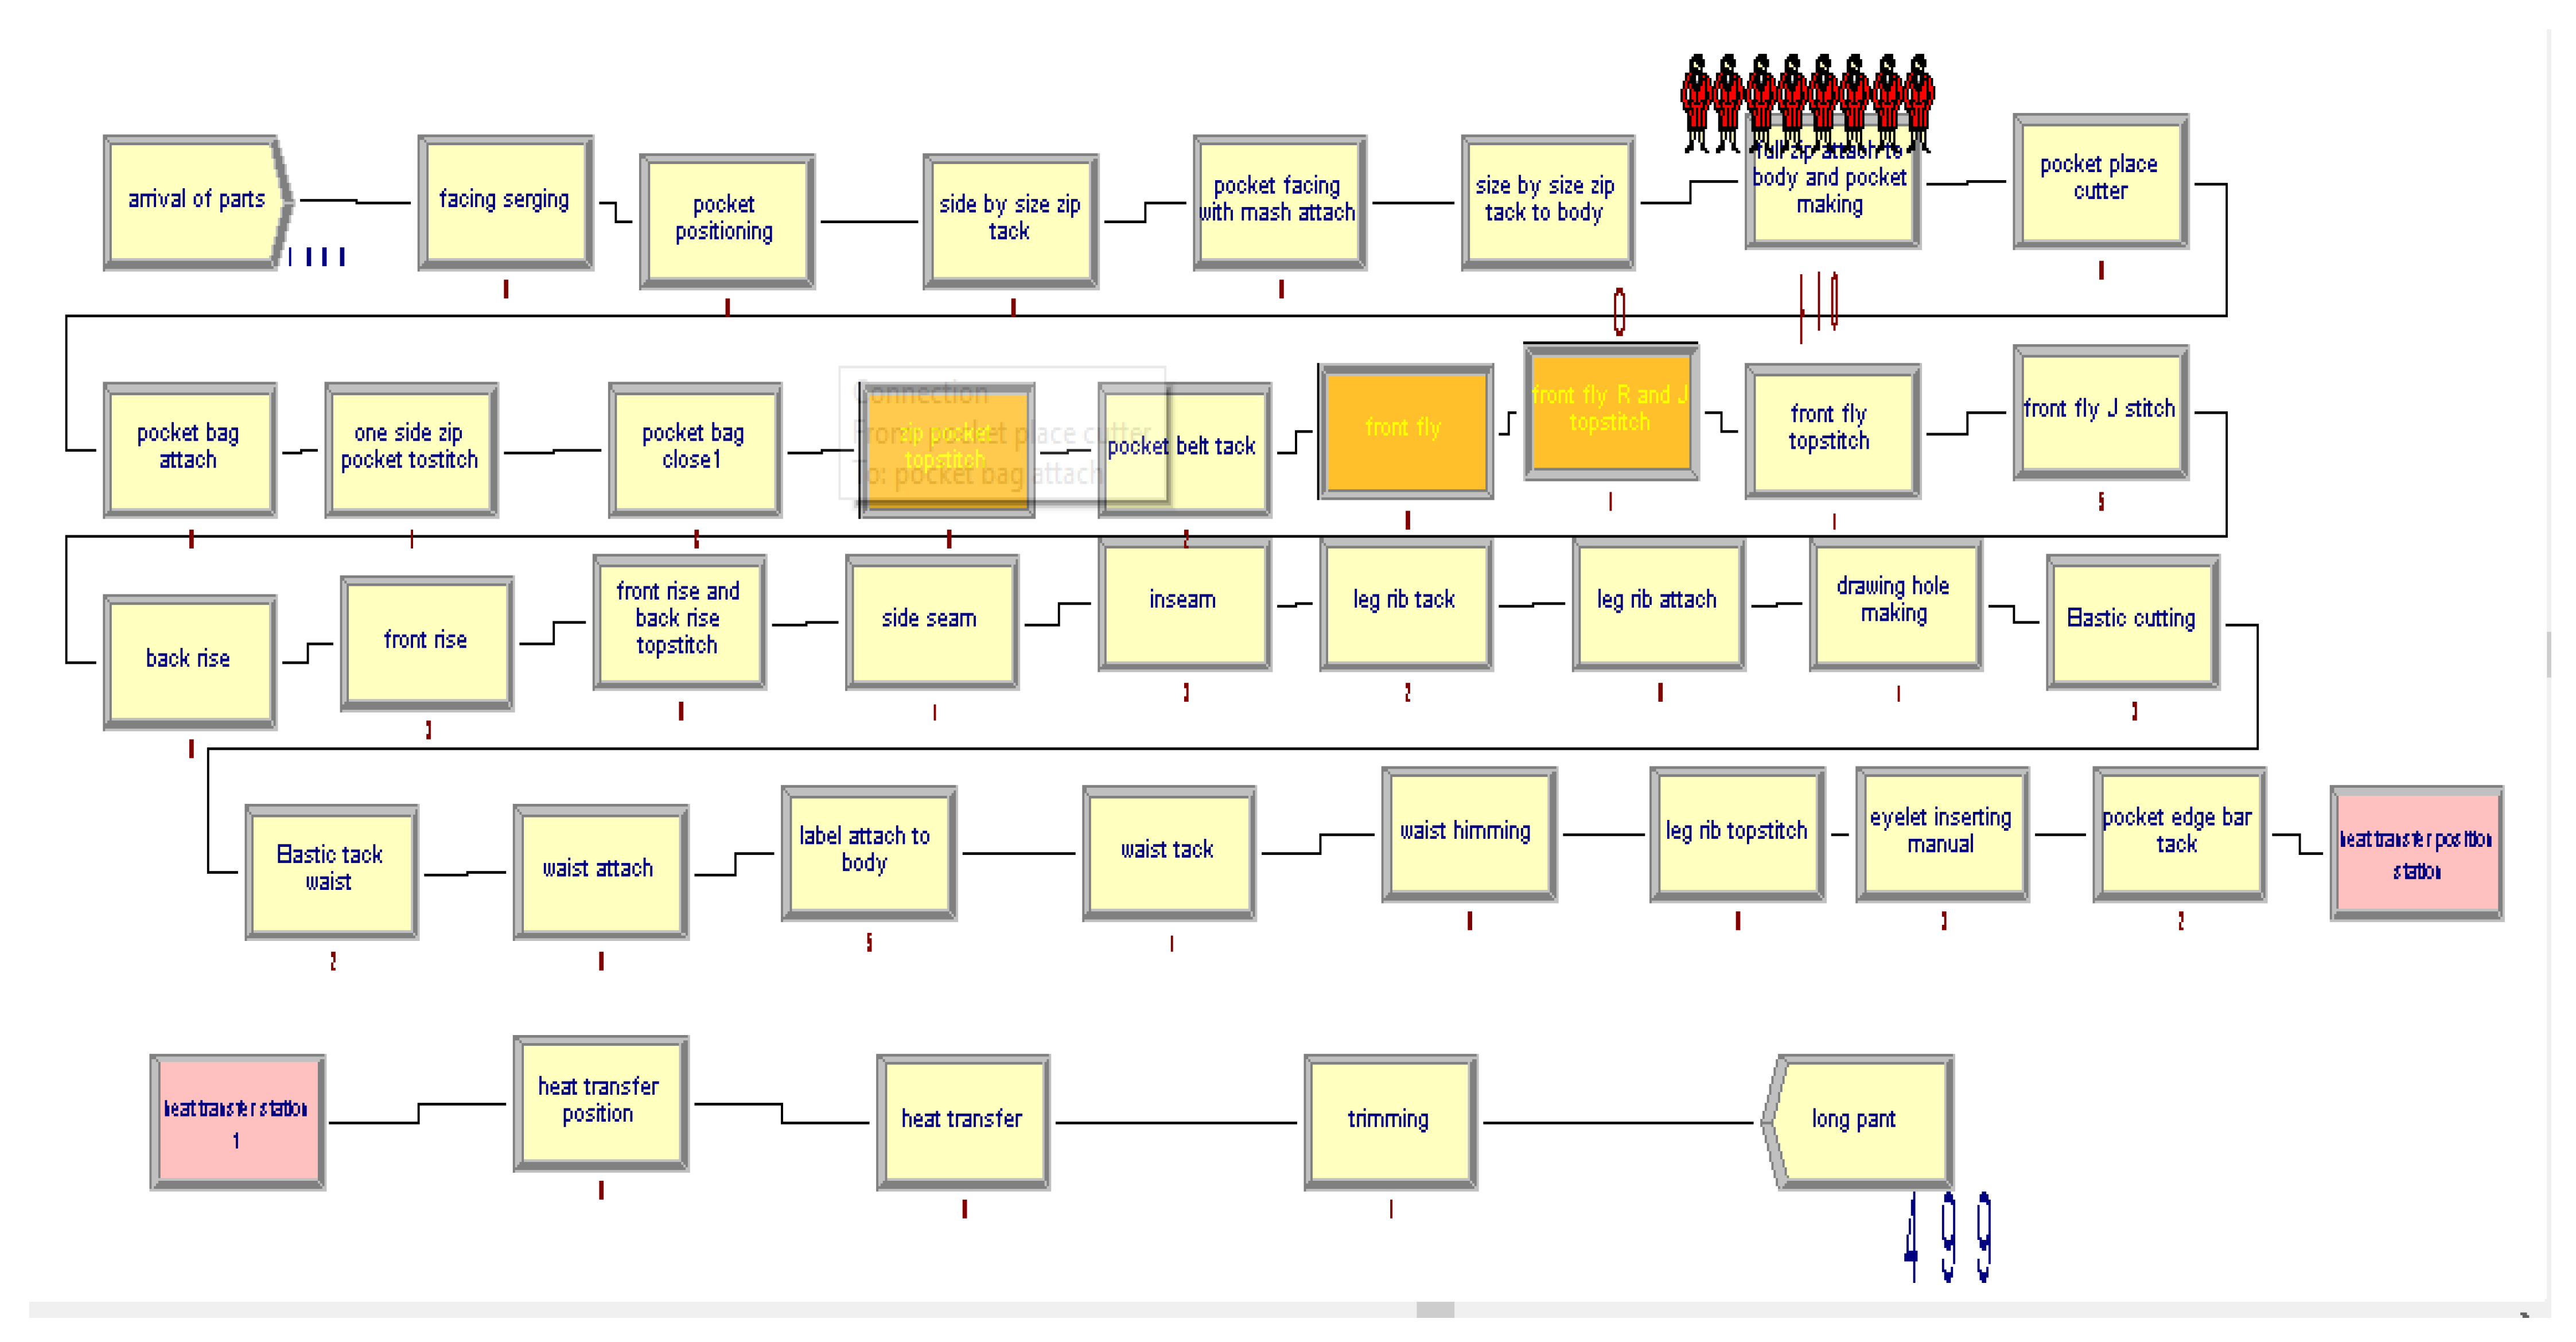
4.5. Development of Standard Simulation Model
The simulation model of the current production system is developed with the aim of identifying bottlenecks in the production system and further experimentation on the system using various what if conditions or scenarios and finally selecting one scenario and develop an optimization for the selected scenario constraints, responses and objective function for the developed model by using opt quest as a tool.
The simulation model is developed based on a production process flow of the company’s long pant assembly line. This study represents discrete-event simulation modeling and the long pant assembly line works for 450 minutes (7.5 hours) in a shift. The following assumptions have been taken in to consideration while modeling the production system;
- ➣
- The long pant assembly line is never lacking input materials from cutting section
- ➣
- Initially each operation in the sewing assembly line is assumed to begin empty
- ➣
- Set-up times are not taken into consideration while modeling the system, because in a real system the setup process is usually carried out at the end of the working hours
- ➣
- Maintenance work is not carried out during the working hours
- ➣
- 450 minutes which is the working time does not include tea or any other breaks
Figure 4.
existing production model.
4.6. Model Verification and Validation
A model is simplified representation of a real system which includes the most important system components and the interaction between them, a model cannot represent the real system exactly rather it can approximate the system how it behaves and interact. This is mainly due to the assumptions made while developing the model. The performance measures extracted from a model will only represent the real system if the model is a good representation of the system. So verification and validation of the simulation model of this study were carried out using the daily production statistic validity by comparing the actual system and the simulation model results for the existing long pant model. One way for verification is by reviewing the SIMAN code and check if the model is performing exactly what was planned for it to do. But, this way of verification requires a skill in the SIMAN programming language. So the best way for us to verify the model is by looking at the animation. In this verification method it’s allowed only a single entity to enter the system and follow that entity to be sure that the model logic and data are correct. In this simulation model, allowing only a single entity to go through the system has shown that the entity is going through every module as per programmed.
The researchers have made simulation trial runs under a variety of settings of the run parameters, and checked the model output result for its appropriateness. The researchers have taken the real data i.e. the assembly line produces 500 long pants per shift on average from the production line. The simulation model output is tested to run for 7.5 hours and its output is 499 which is almost the same with that of actual data and this is a clear indication that the model is valid [16]. In addition to this some work stations which are found to be idle and at the same time busy in the actual system were having low and high utilization in the simulation model.
Model validation for this study is made using statistical validity by comparing the daily output of long pant model of the real system as well as the simulation modeling outputs for the long pant of the existing system. If there is no significant statistical difference between the data sets, therefor, the simulation model considered as a valid model. If not the model needs additional works before analyzing the model reports. In this case the average outputs of long pant per day or working hour of eight hours is ranges from 470-520 long pants per day with an average of 500. And the simulation model output is 499 long pants per shift of a day. There for, the simulation model outputs are approaches to the real system outputs. In this case the simulation system representing the real system so this model is valid. In addition to this in the simulation model result some workstations have high work in progress and low work in progress in the real system as well as the simulation model.
4.7. Calculation of Replication Number
In order to determine the number of replication for the model first the researcher have been calculated the mean, standard deviation and half width of the first ten replications of the simulation outputs. In other words, half width is a sampling error that introduce in taking sample. Therefore, the value of half width can be calculated by considering a 95% confidence level where as the value of t can be read from students t probability distribution table (yemane, 2013), (gorema , et al., 2014), (herell, et al., 2004) and for initial number of replication determination it is recommended 10 number of replication for 95% confidence level and arena have 95% confidence level by default (w.david kelton, et al., 2000).
Table 4.
initial number of replication.
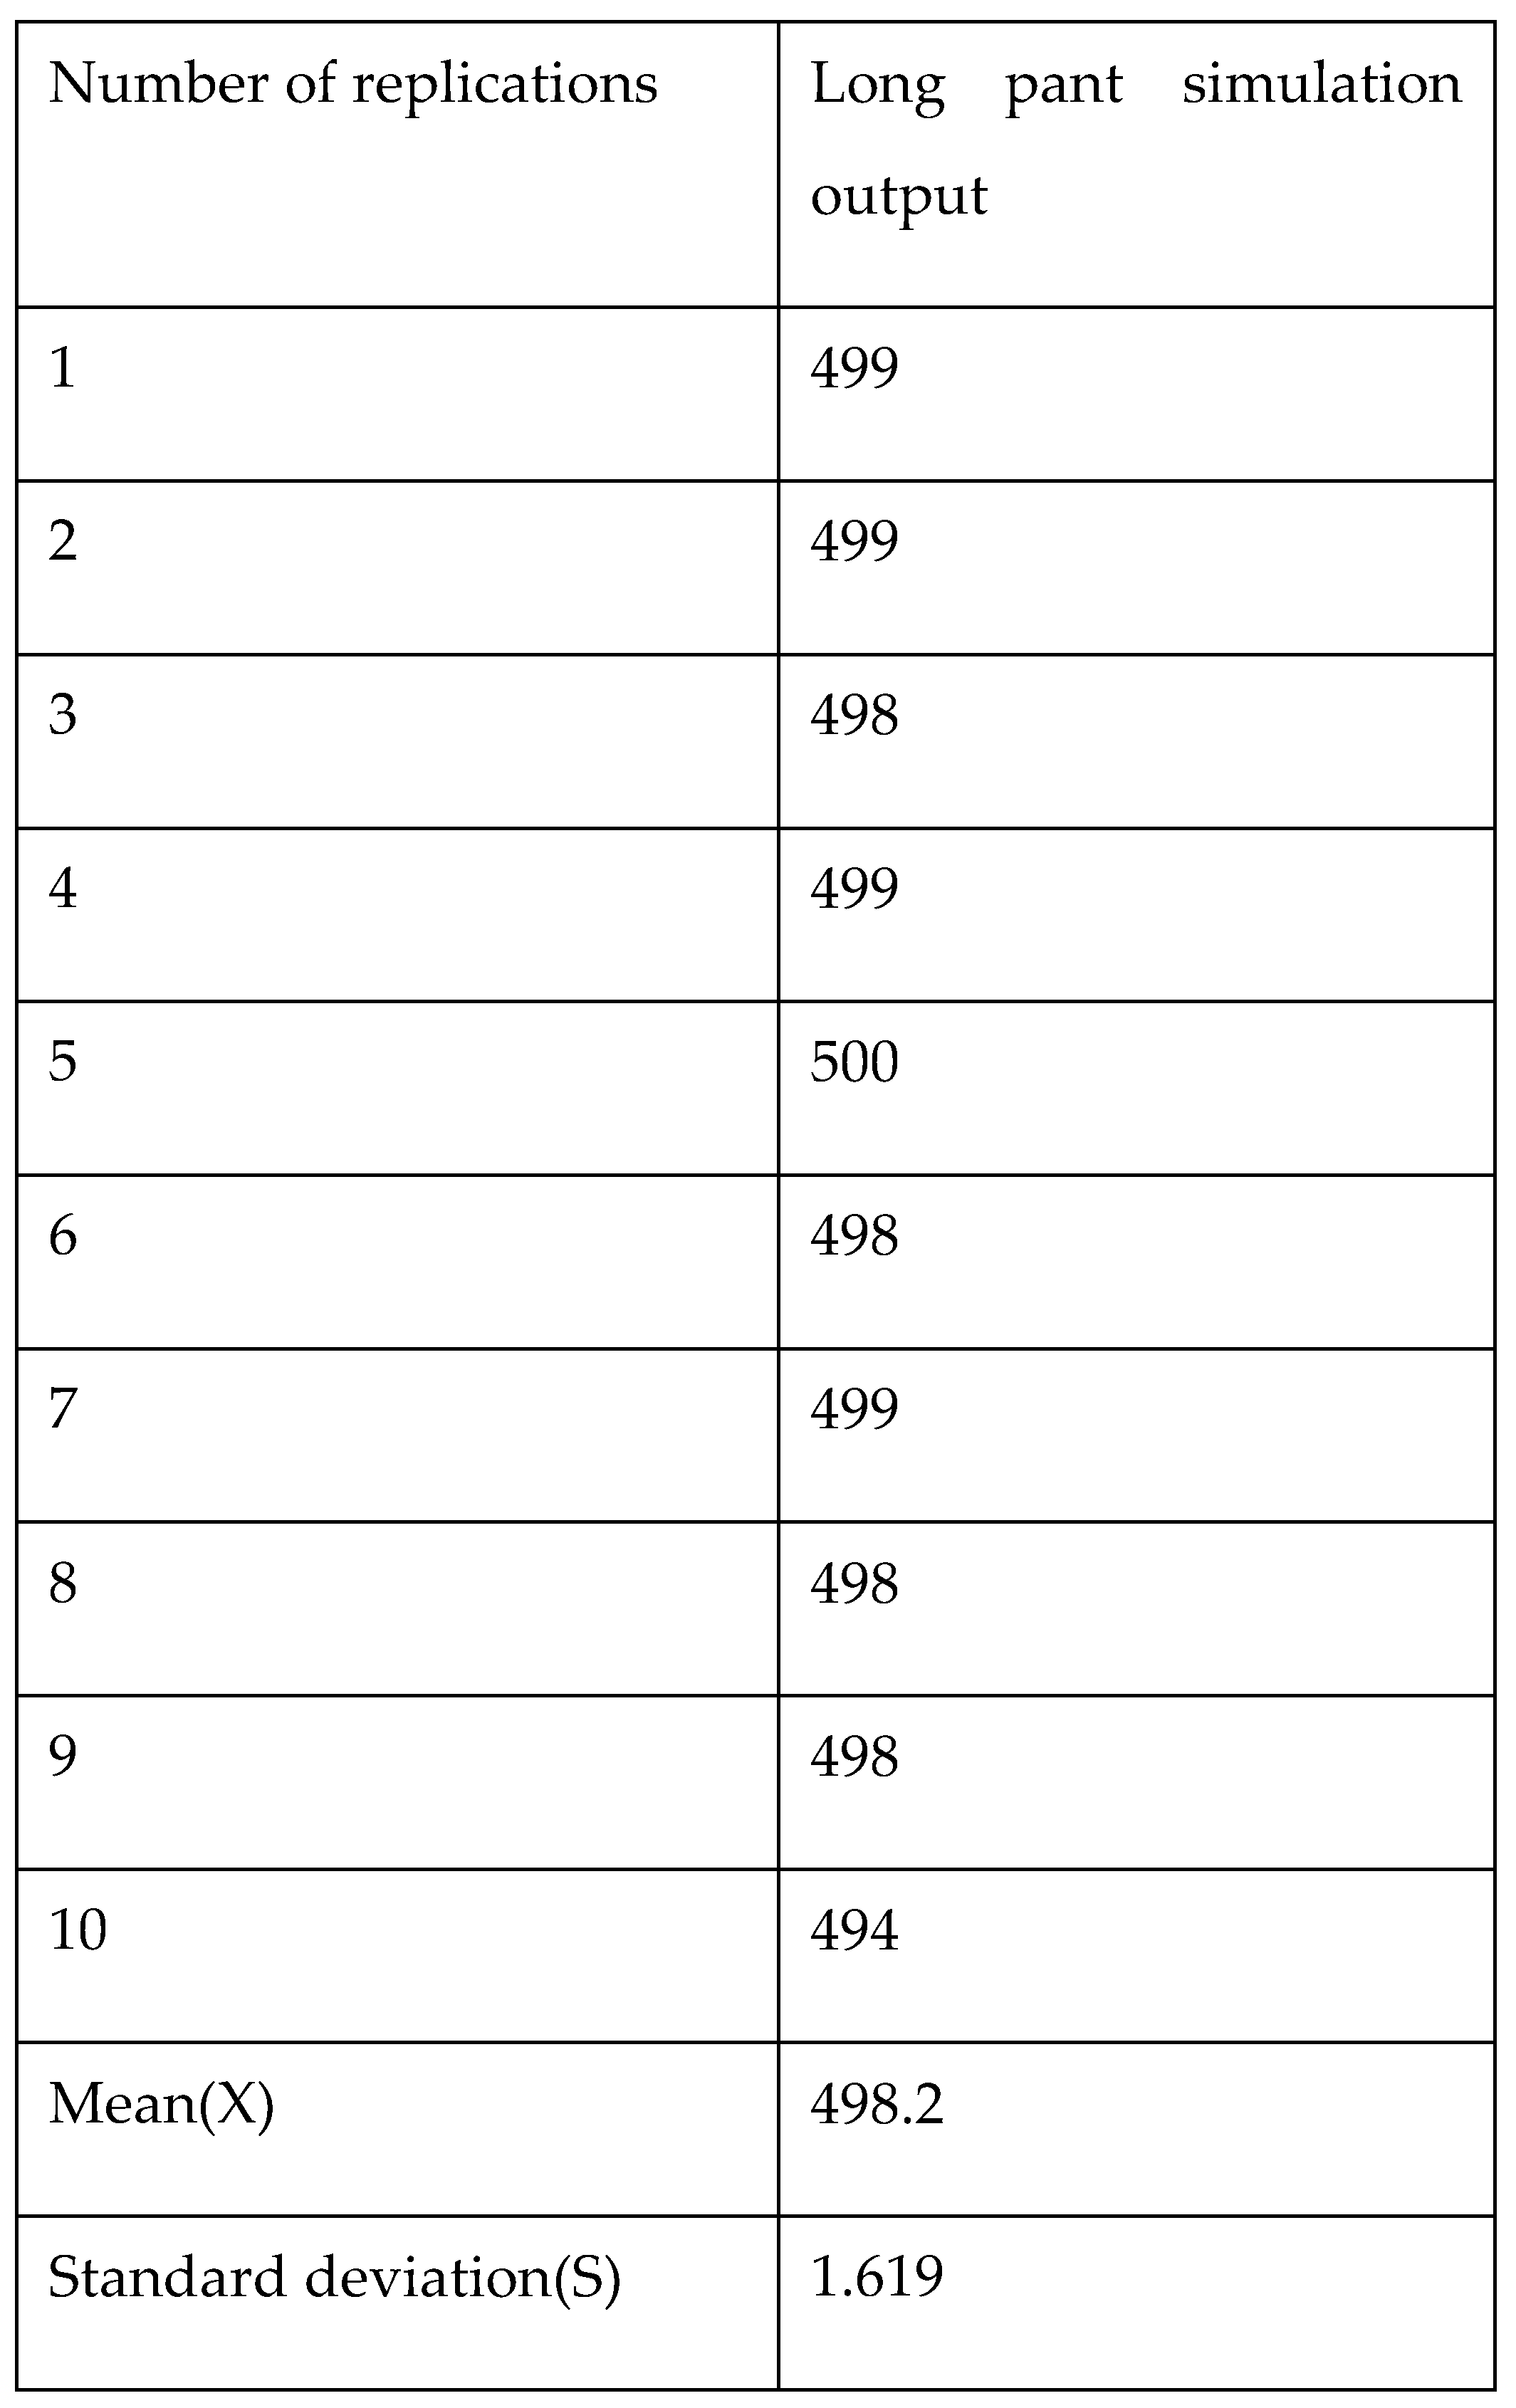
Mean = summation of long pant output/number of replication
X = (500+498+499+498+498+494+499+498+499+499)/10
X = 498.2
Standard deviation(S):
where; n = number of replications
S =1.619
where α is 0.05 from the 95% confidence interval 95%.
h0=t90.975*s/√n from the t table t90.975 is 2.2622.
Half width for long pant model is: -
h0 = 2.2622*1.619h0 = 1.158185
Actual number of replication
Actual replication of the production system is:
n= Z20.975*S2/h22, but h2=1.158185/4 = 0.289546
n = (1.96)2*(1.619)2/ (0.289546)2
n = 121 --------------------------option 1
n n0*h02/h22
n 10*[(1.158185)2/ (0.289546)2]
n 160 -------------------------option 2
Therefore, from the two alternatives the maximum number of replication has been selected and that is 160 [4].
4.8. Simulation Model Run Results and Interpretation
The output generated from run simulation model is used to know and predict the performance of the production system. The output analysis also used to predict the initial model performance measurements of the production system of the long pant model. Therefore, based on the output of the simulation model run the performance measurements analyzed for the production system of the long pant are measures as follows.
The performance measurements are selected to analysis the entity performance, queue performance, process performance and resource performance.
Entity performance: the following points are identified from the entity performance:
- ❖
- The WIP of the production line of long pant is high for some resources for instance number waiting for full zip attach and body pocket making is 314, for pocket facing with mash attach is 187, pocket positioning is 118 and for facing serging queue is 36.
- ❖
- The time required for entities to wait is higher due to the large number of queues for operations which have high WIP and the waiting time is greater than the value added time, it shows that additional resources should be required to minimize the waiting time of the entity.
Queue performance: from the model run result of queue performance, the waiting time and number waiting in full zip attach and body pocket making and pocket facing with mash is higher. Conversely, the waiting time and number waiting of back rise, front fly R and J topstitch, front fly, waist attach, heat transfer position and heat transfer is low. This result shows that, there is unbalance allocation of resources to each station.
Process performance: from the simulation model run results of process performance, the following points are identified and briefly discussed as below:
- ❖
- The average waiting time of full zip attach body and pocket making is higher than their value added time. It also has higher waiting time of any other process of the production system of long pant. This means, the entities at this station spend more waiting time have been processed.
- ❖
- Average waiting time for processes like waist attach, back rise, front fly, front fly R and J topstitch, heat transfer positioning and heat transfer is low.
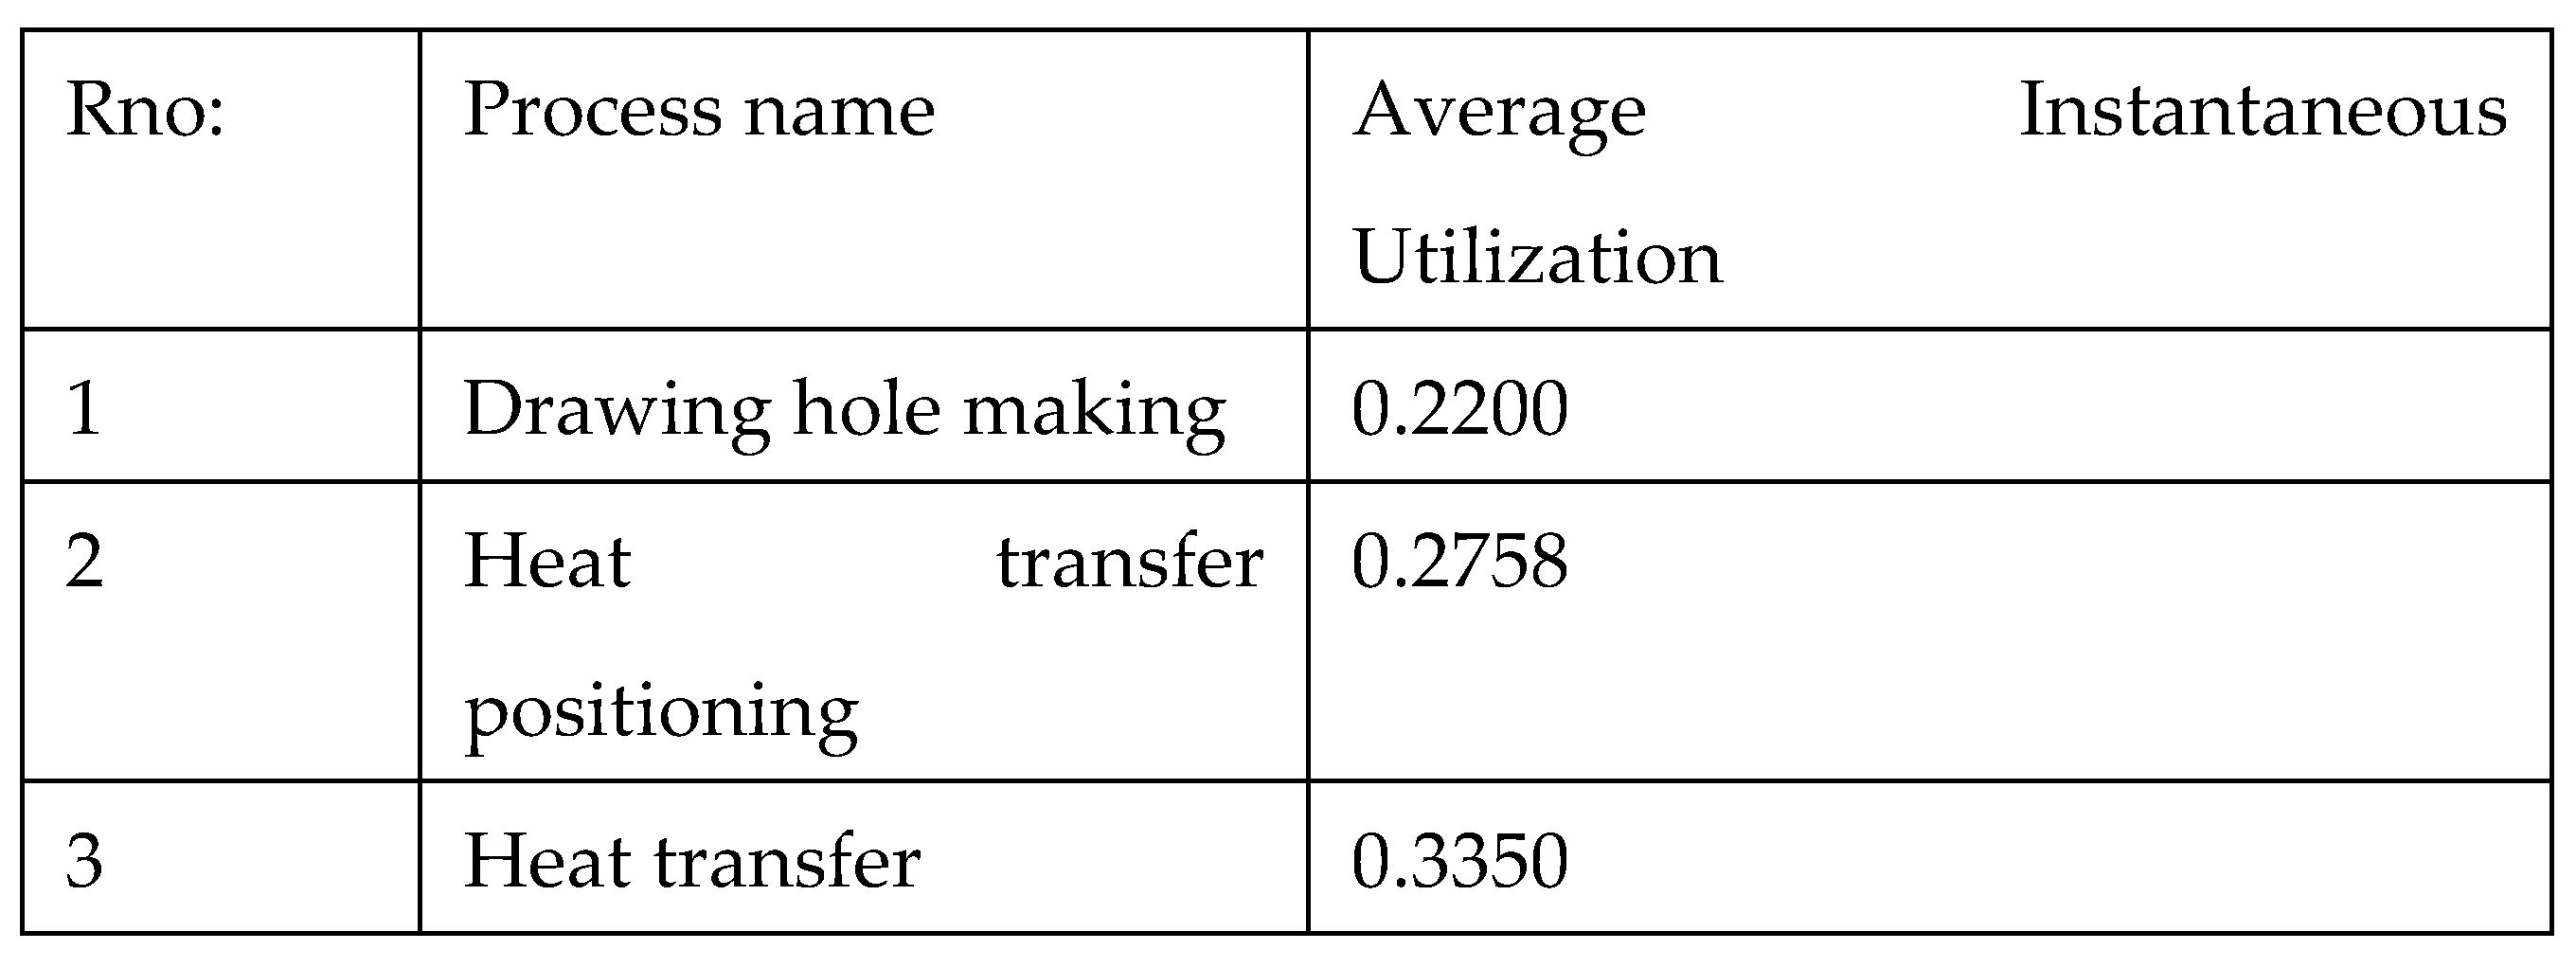
Resource performance: the model can give us, a usage of resources like instantaneous utilization, number busy, number scheduled, scheduled utilized and total number seized. In this case some resources are over utilized like SNLa3, SNLa4 and SNLb2 are over utilized resources. And resources like 4TOLa1,4TOLa10,4TOLa2a,4TOLa2b, BH, manual operator 2 and trimmer are below utilized.
Bottleneck identification: the waiting and number of waiting in the full zip attach and body pocket making and pocket making with mash attach are higher than other operations. The resources attached in these operations are highly utilized while; on the back rise and front fly R and J topstitch, resources are less utilized. Therefore, the full zip attach and body pocket making and pocket making with mash attach stations are bottleneck operations. Therefore, the production system of the long pant model requires an improvement.
4.9. Simulation Run Results and Interpretation
Once the model is developed and run for 160 number of replications; there are many possibilities to manipulate the developed simulation model, but since the objective of this research is to model the long pant assembly line and balance the activities that assemble the long pant components; the researchers have identified the bottleneck and idle operations for further analysis so as to balance the assembly line of the long pant model. A bottleneck is one process in the chain of processes, such that its limited capacity reduces the capacity of the whole assembly process or simply the output of the system is determined by this process; whereas those which work under capacity are termed as idle processes. Total production has been blocked in these 3 work stations and large WIP has been stuck in these bottleneck processes. The bottlenecks and idle processes of the existing system are summarized as follows;
Table 5.
Bottleneck operations in the current production system.
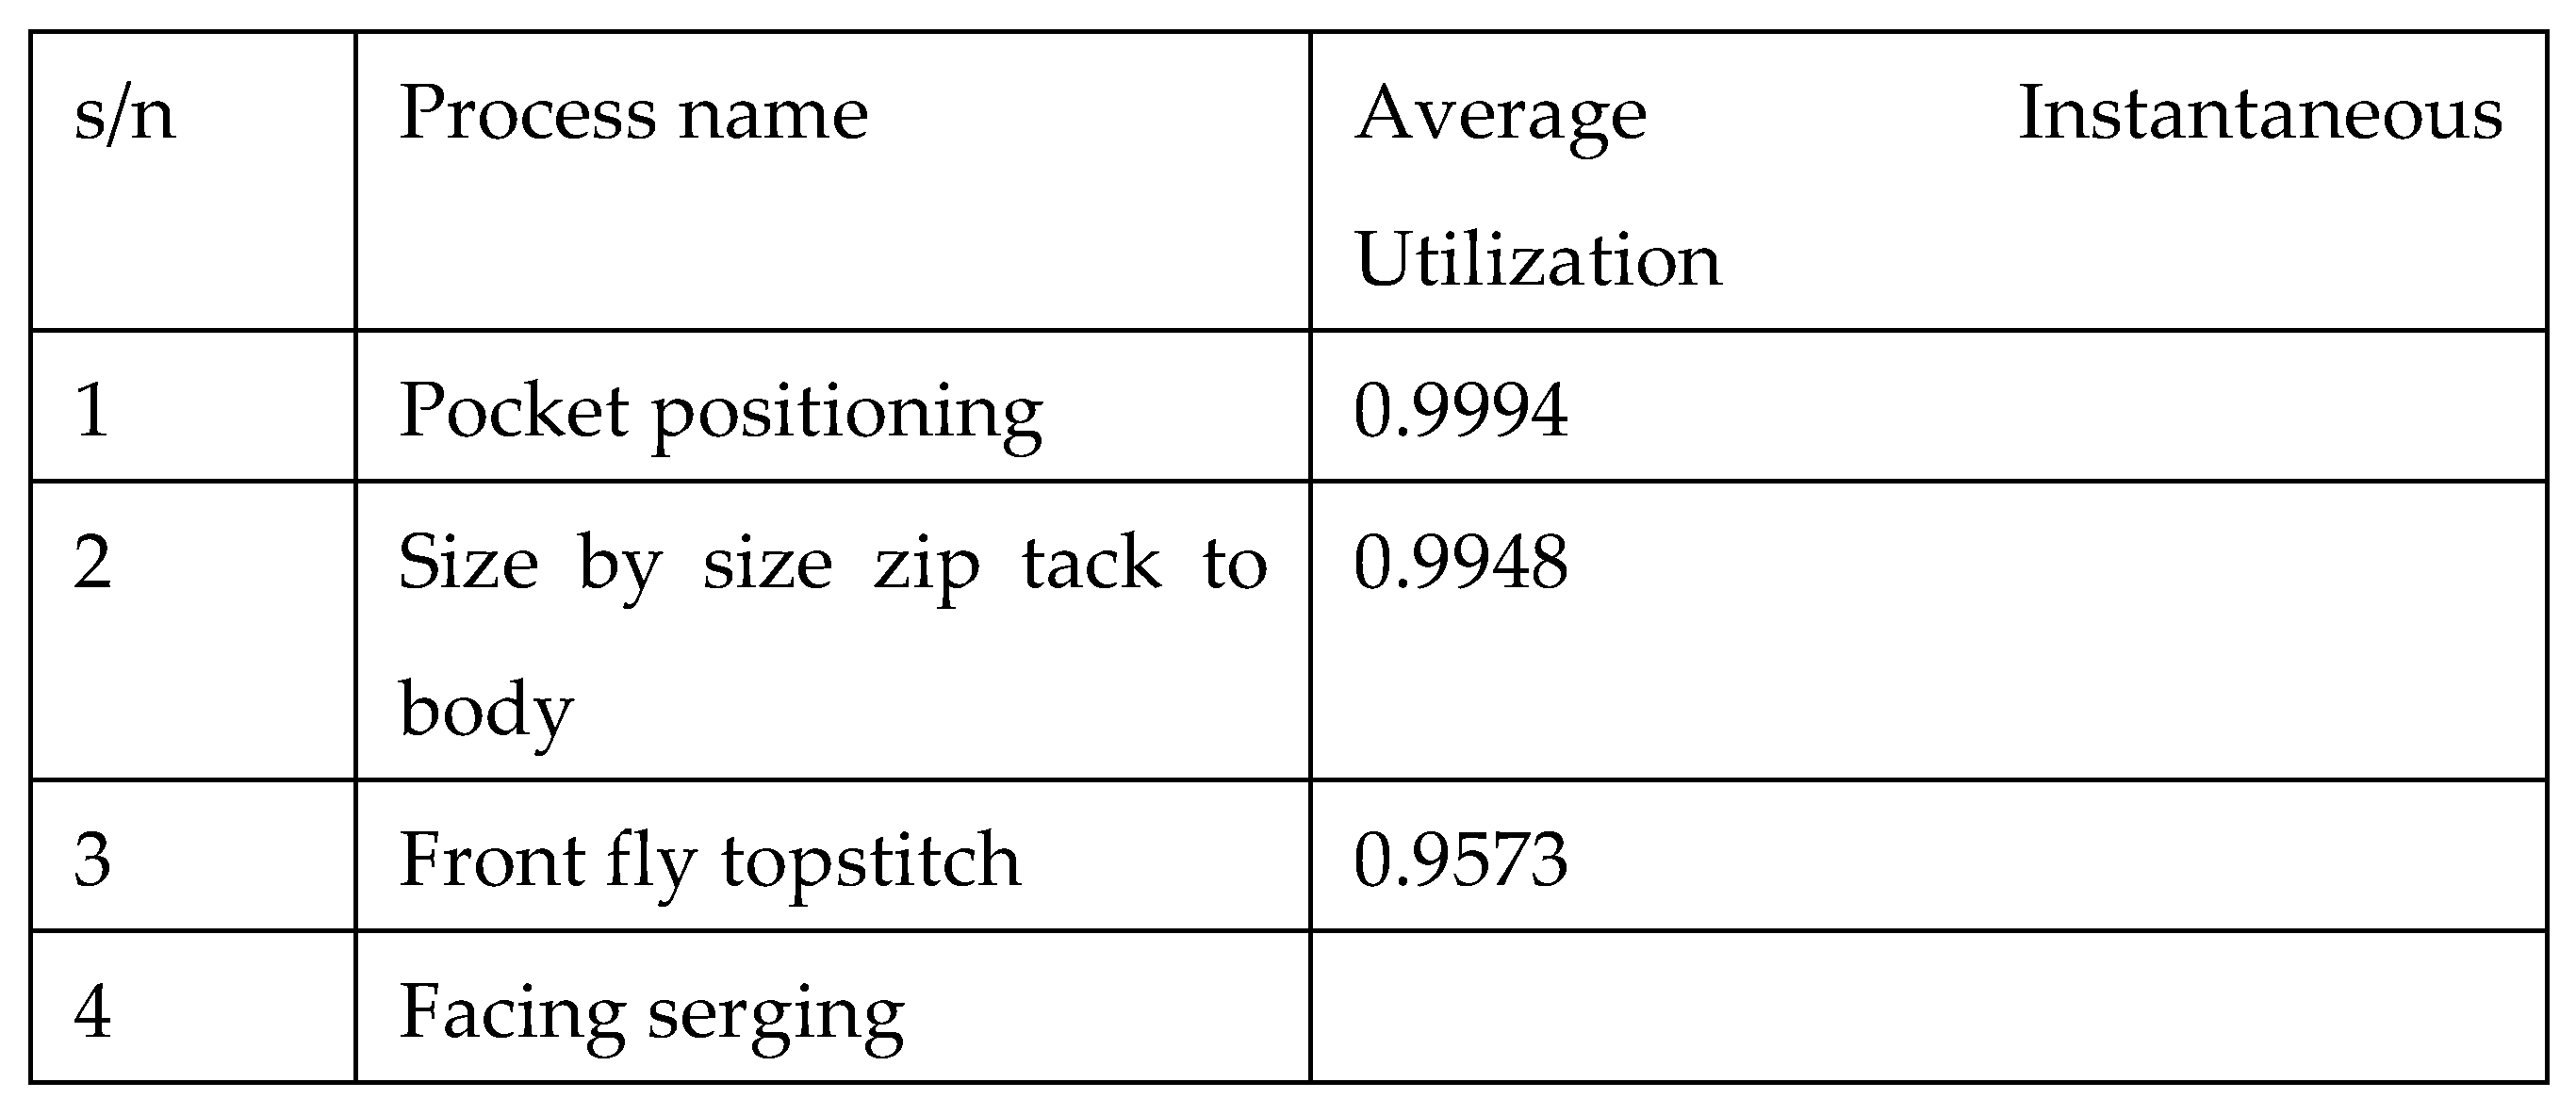
Table 6.
Idle stations of the current production system.

From the study of the current system simulation model the researchers have found out the idle and bottleneck stations. This will be the input for carrying out line balancing calculations and developing alternatives using various what if scenarios and an optimized assembly line.
- Balancing the assembly line
Line balancing is very essential to make the production flow smoother compare to the previous layout or the current assembly line of the long pant model. Considering working distance, type of machines and efficiency and workers’ skill; various what if scenarios are developed and tested. These various alternatives to the current system are developed mainly by adding capacity, sharing resources and a combination of all the methods.
Scenario 1 add resources: - The result of the simulation run shows that face serging, pocket positioning, front fly topstitch and size by size zip tack to body are bottleneck operations in the long pant assembly line because the machines and operators in these processes are over utilized and this have made the waiting line lengthy. For this reason, the researchers have added extra three machines and three operators in the current system to develop this scenario.
Scenario 2 share resources: - The result of the simulation run shows that not only are some resources over utilized but some are also under-utilized creating idle resources in processed like heat transfer positioning, heat transfer, drawing hole making and elasting cutting. The current production system uses two machines for drawing hole making and heat transfer and one operator in each of these processes making them idle in most of the working hours. For this reason, the researchers have reduced two operators from the four operations. So that, the in production line one operator can share in heat transfer positioning and heat transfer and the second operator can share in operations drawing hole making and elasting cutting.
Scenario 3 combined (Add resources+ share resources): One of the best ways to increase the efficiency of an assembly line is by decreasing length of the assembly line as much as possible and one way to do this is by sharing nearest operations which are idle or under-utilized in some way. based on this the researchers have developed the third alternative from scenario 1 and 2. The following figure summarizes the performance measures of the various alternatives and their respective output.
Scenario 4 reduce: - The current production system uses two TOLa1 in the pocket close process making them idle in most of the working hours. For this reason, the researchers have reduced one operator and machine from this operation without affecting the final output to minimize labor cost.
Scenario 5 a combination of scenario 3 and scenario 4: - in this case reduce 4TOLa1 from pocket close and add resources and share resources and finally the researchers have developed a model for the long pant.
Figure 5.
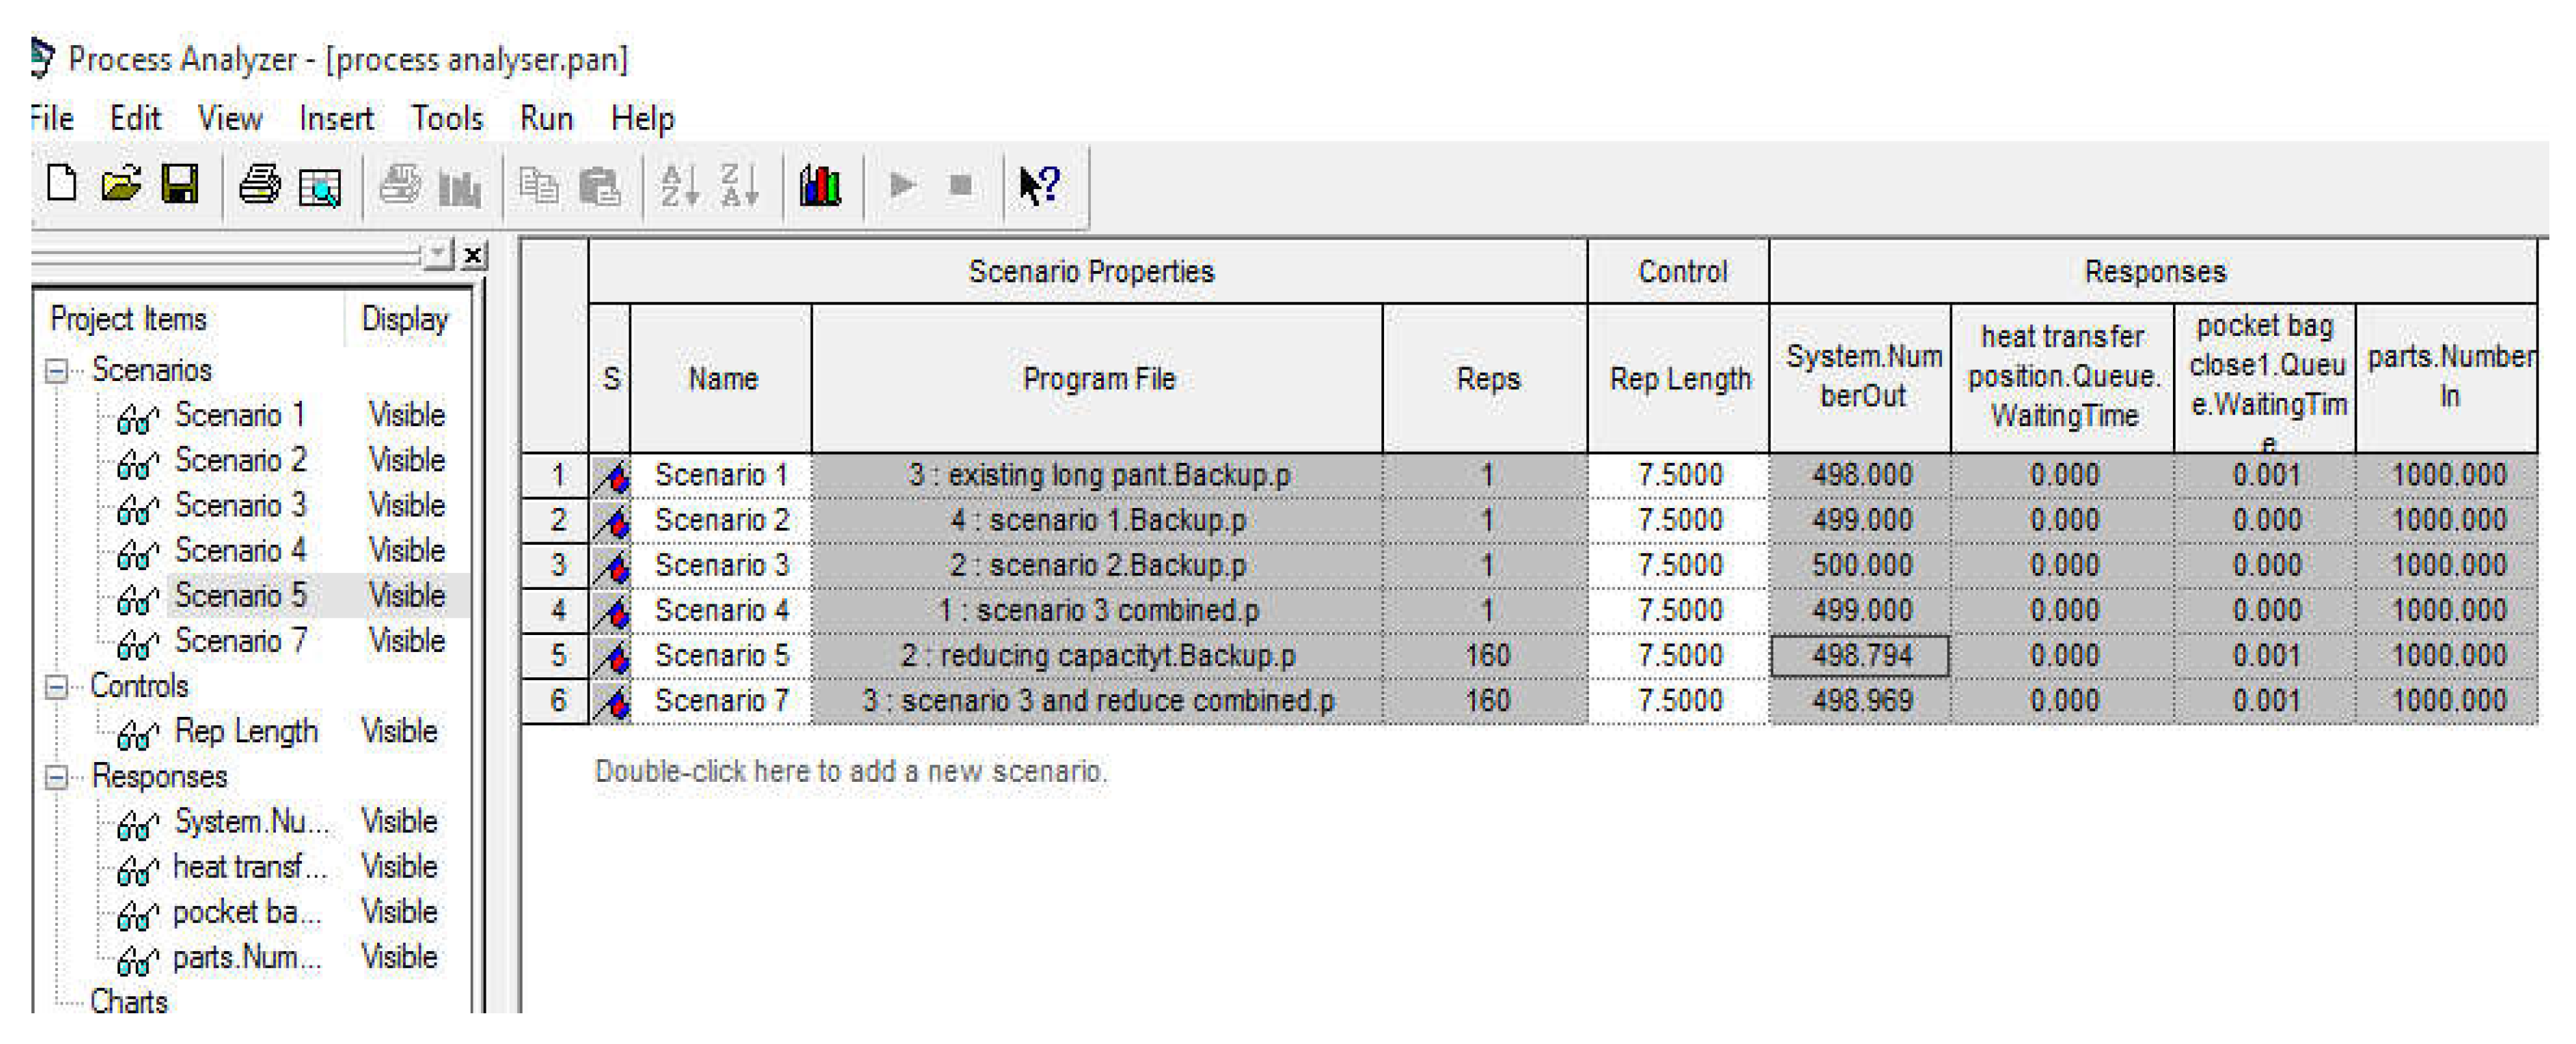
The comparison of the current system with various alternatives and their respective output.
Figure 5.
The comparison of the current system with various alternatives and their respective output.
5. Proposed Model Development
In this research, the researchers have focused and selected one product that is the long pant model in the MAA garment of textile factory. The long pants simulation model is built based on the existing parameters and has analyzed its performance. During the analysis the idle resources and bottlenecks were identified based on its’ number waiting in queue and resource utilization. The idle resources are that resources with low utilization that is below 50% utilizations like BH machine, manual operator2, helper a2 and heat machine and some of stations have also high waiting queue like facing serging queue, pocket positioning queue, size by size zip tack to body front fly tostitch. In developing the alternative solutions, the researchers have developed a proposed models and experimented with different scenarios and come up with the following optimal solutions by selecting the best developed model. In today's highly competitive global environment, people are faced with many difficult decisions, such as allocating financial resources, building facilities, managing inventories, determining product mix strategies, and more. Simulation modeling a decision problem in Arena tells us; what performance measures can expect using a certain strategy (allen, 2012).
5.1. OPT QUEST
A strategy can be defined as a certain set of values for the controls the resources that can the model developers could have been controlled. Others words for strategy include scenario and solution refers to the control values the inputs to the arena simulation modelling. not to the resulting values of the performance measures like responses or the outputs from the developed model.in this case Opt Quest enhances the Arena by automating the search for an optimal solution by alternating different scenarios by controlling the resources and gives as different responses from a set of replications.
Opt Quest analyzes the results of the simulation and uses its intelligent search procedures to generate a new potential solution, and its ultimate goal is to find the solution that to maximizes or minimizes the value of the model’s objective. Opt Quest for Arena has three major elements and these are constraints, controls and objective that can be optimized.
Controls: - Are variables or resources that can be meaningfully manipulated to affect the performance measurement of a simulated production system.
Constraints: - Are relationships among controls like resources that can we use in the production line and that expected to give us, a responses of the outputs like number of resources in its appropriate amount and type in the production lines.
Objective: - and the last element of an opt quest a response or an expression used to represent the model's objective, such as minimizing queues or maximizing outputs that can be generated from the simulated model run like waiting time in each resources, WIP and cycle time of the production system.
5.1.1. Control Resources
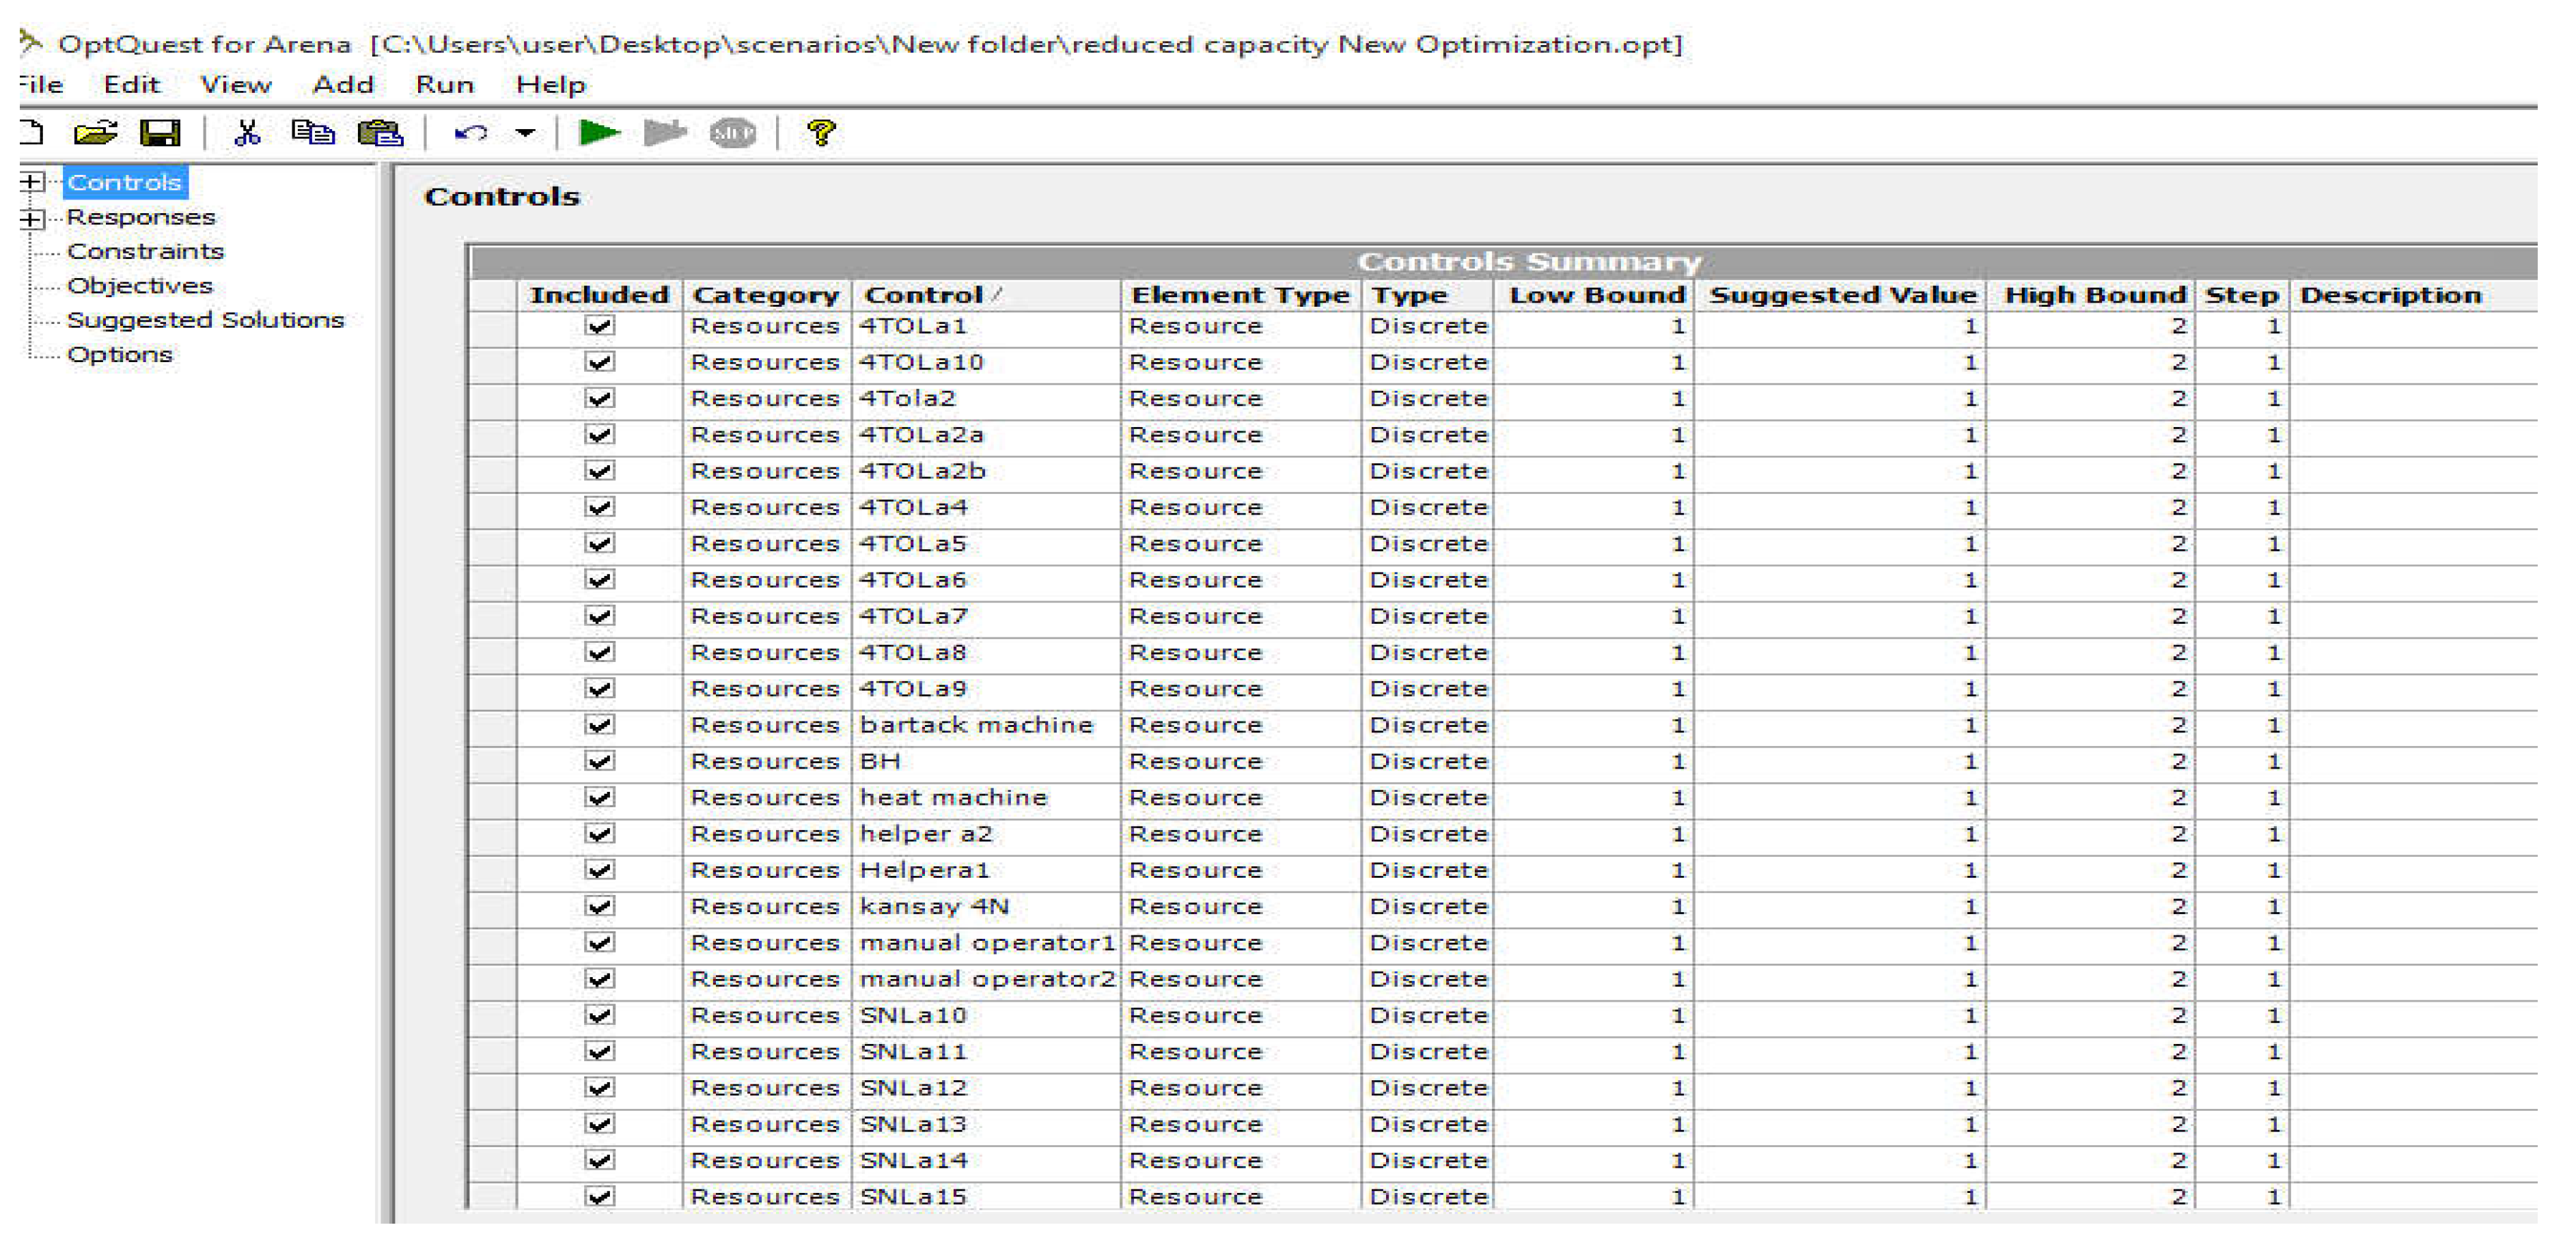
Controls: - Are variables or resources that can be meaningfully manipulated to affect the performance of a simulated system. The resources that have a bottleneck in the production line are quality checker 1, quality checker 2, trimmers, sleeve hemming machines and operators, shoulder attach machines and operators, or those which have high number in queue and have high waiting time in queue are the controls in the simulation model.
Figure 6.
controls.
5.1.2. Responses
Responses: - are the performance measurements of the resources when they have different alternatives declared or when the controls vary then, measure the queue waiting number and queue waiting time, resources utilization etc.
5.1.3. Constraints
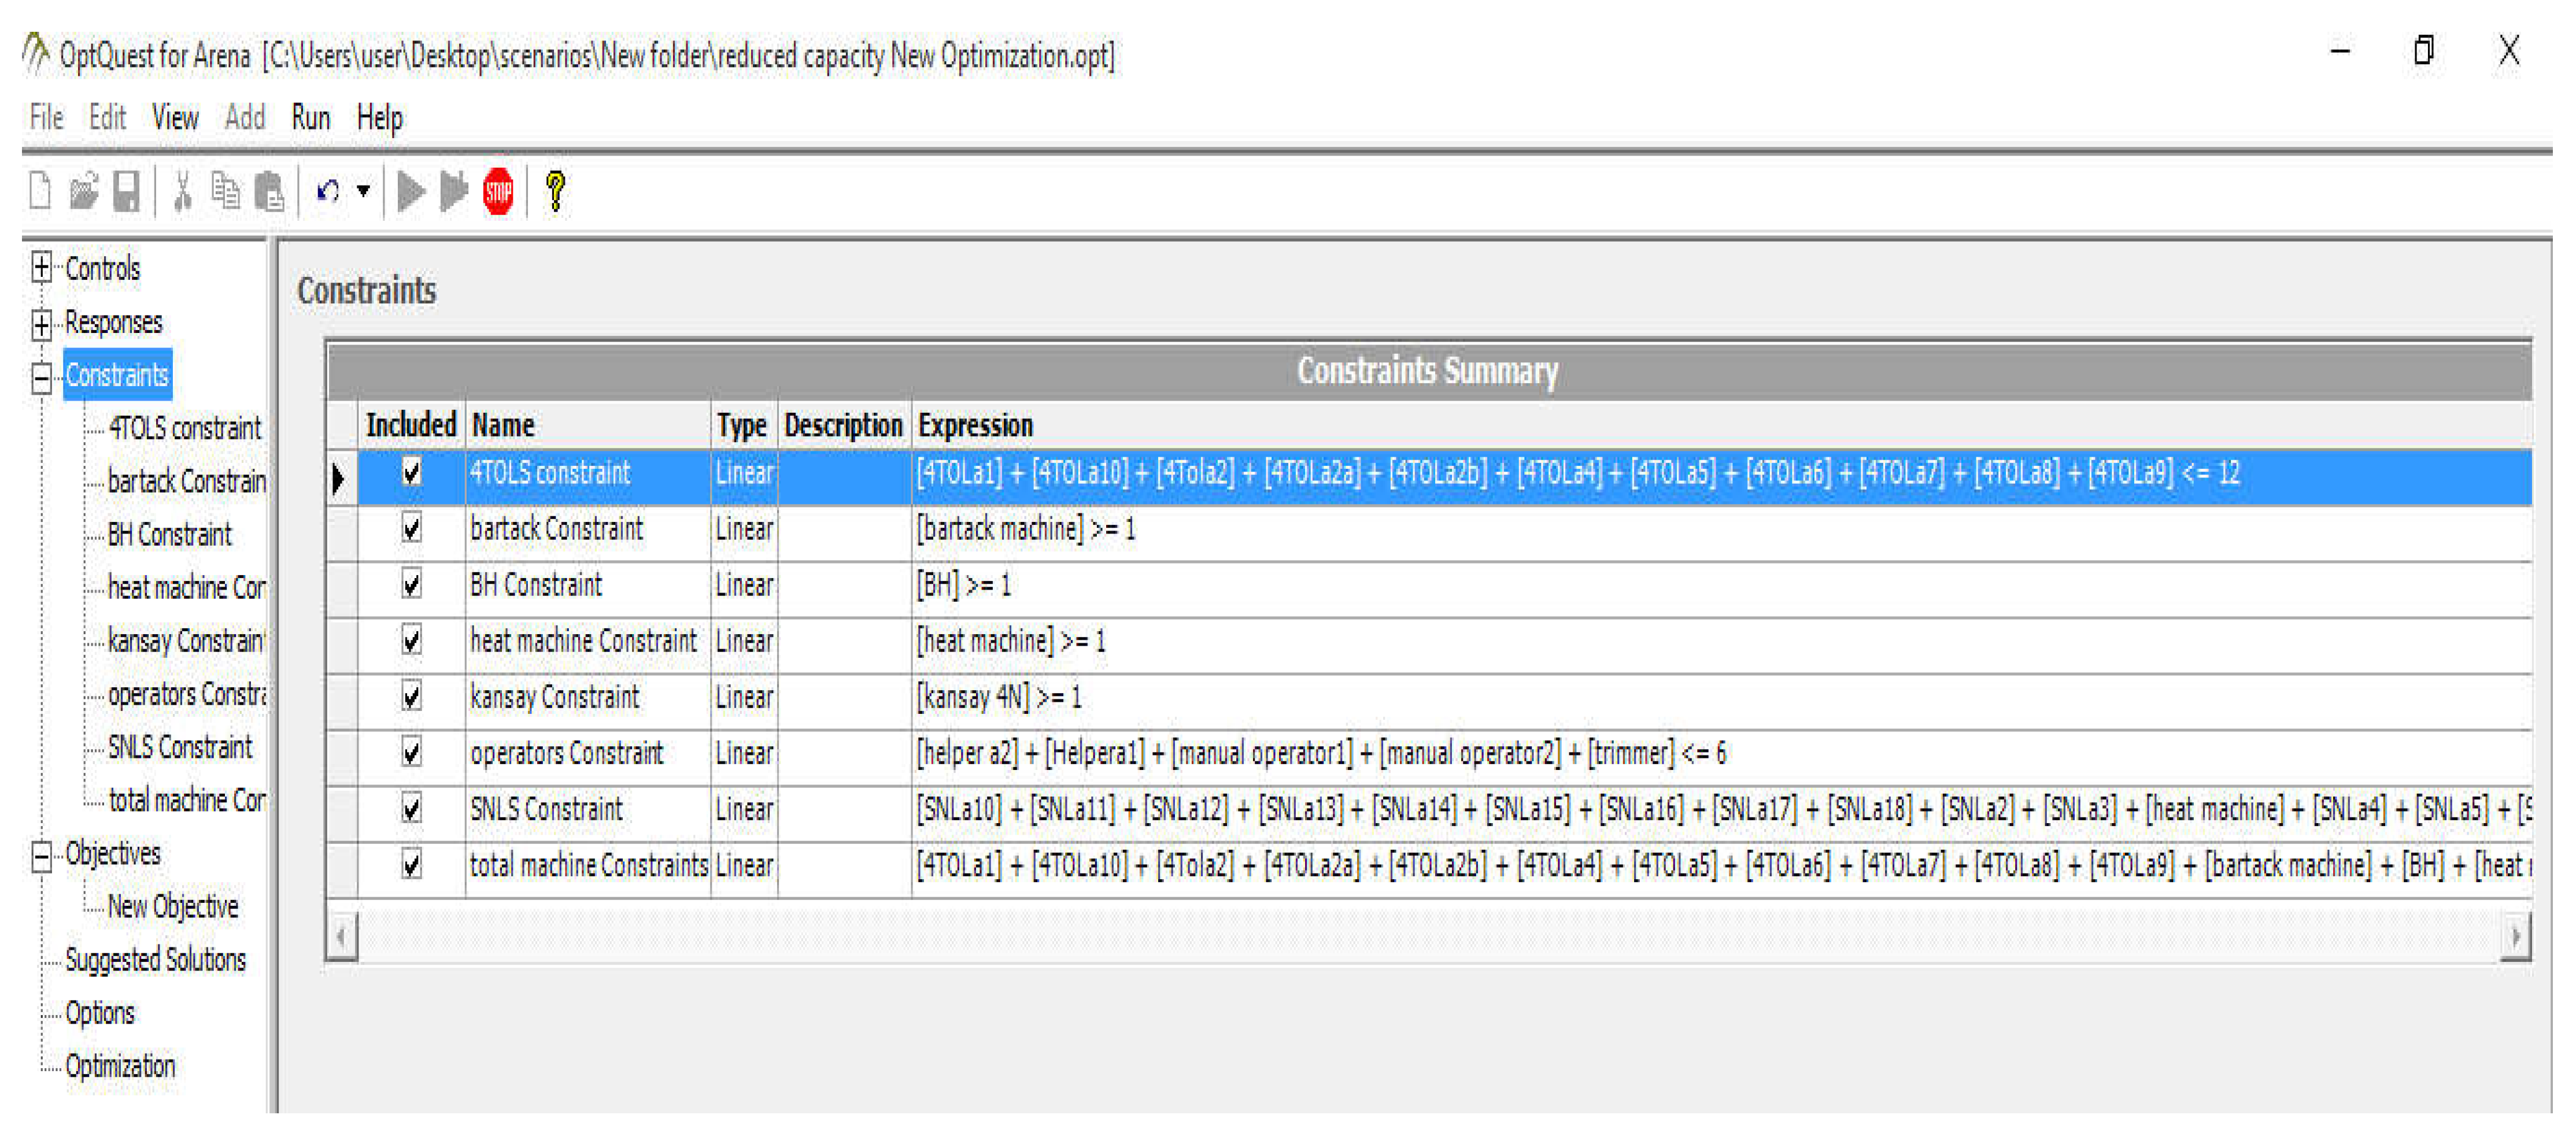
Constraints: - Are relationships among controls and/or responses. For example, a constraint might ensure that the total amount of machines allocated among various operations exceed a specified amount, or at most one machine from a certain group can be selected. So, from these constraints table the sleeve hemming operation needs at least one machine to perform the operation and the number of machines that in the line must be below fifteen machines and the operators assigned for the line a maximum of nineteen in each of the production lines.
Figure 7.
constraints.
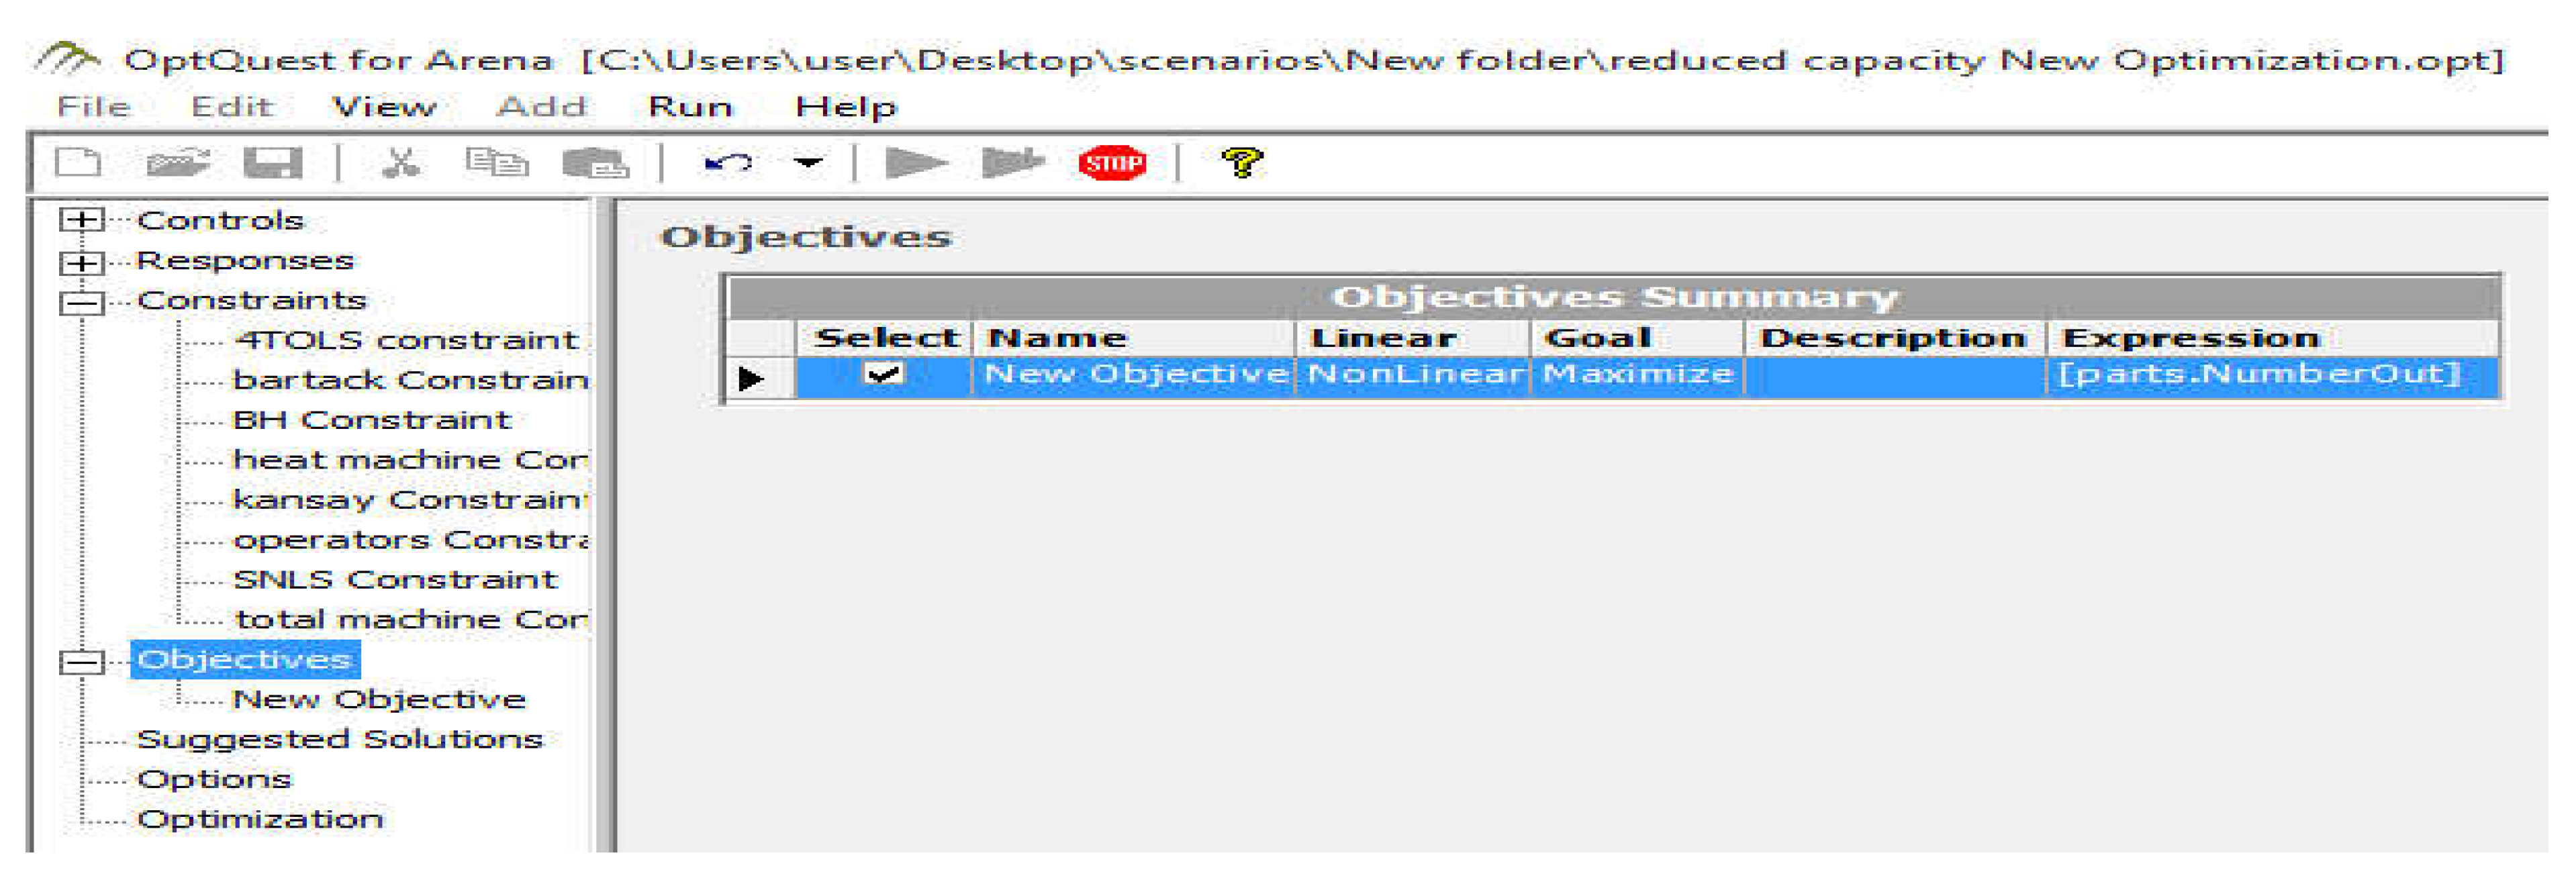
5.1.4. Objectives
Objective: - it is an expression or a response used to represent the model's objective, such as minimizing queues waiting time, queue waiting number in the bottlenecks or maximizing outputs. According to (allen, 2012) the number of simulations for the opt quest are 2000 because there are 38 controls and the best solution is set at the first row in the grid will be the best solution. The simulation column identifies the simulation that generated that solution. For this research the first row shows simulation 1, the best solution is found at the 1st simulation. The number of controls greatly affects Opt Quest’s performance. Opt Quest has no physical limit on the number of controls you can use in any given problem. However, the performance might deteriorate if you use more than 100 controls.
Figure 8.
objectives.
Also, as the number of controls increases, you need more simulations to find high-quality solutions. General guidelines for the minimum number of simulations required for a given number of controls in a problem are:
Table 6.
simulation number.
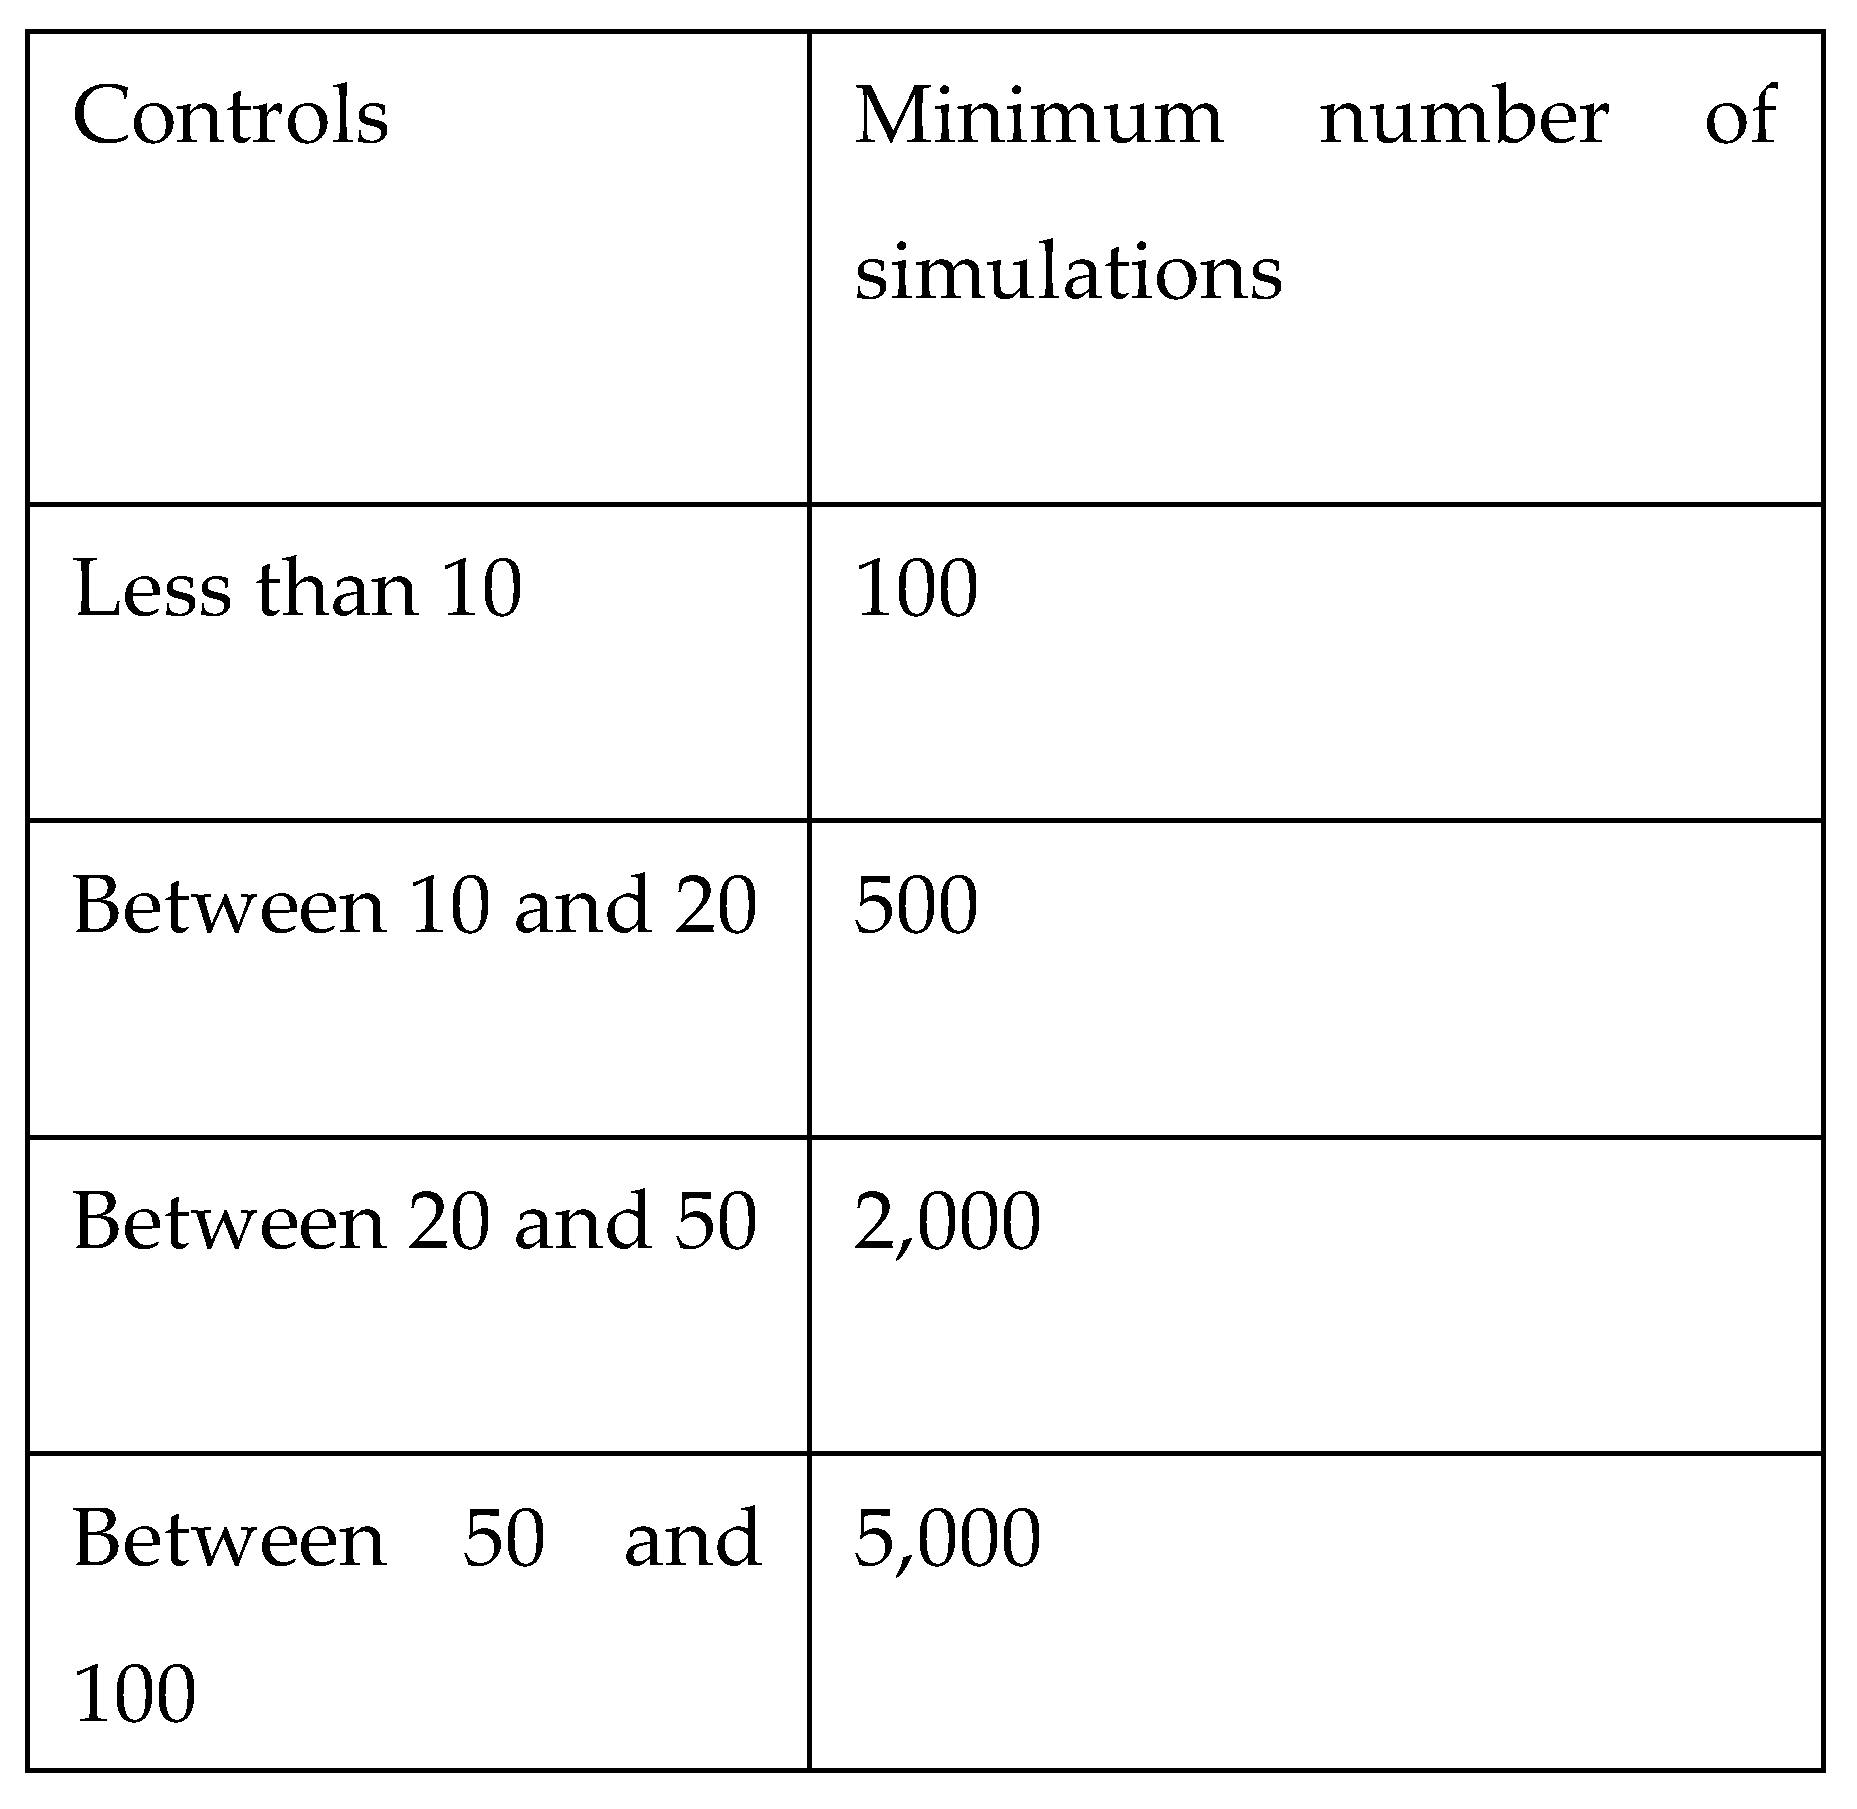
Figure 9.
best simulation number From the result of the opt quest the optimal solution is in simulation 1 and the researchers have developed a model to represent the real manufacturing system and it produces 498.
Figure 9.
best simulation number From the result of the opt quest the optimal solution is in simulation 1 and the researchers have developed a model to represent the real manufacturing system and it produces 498.
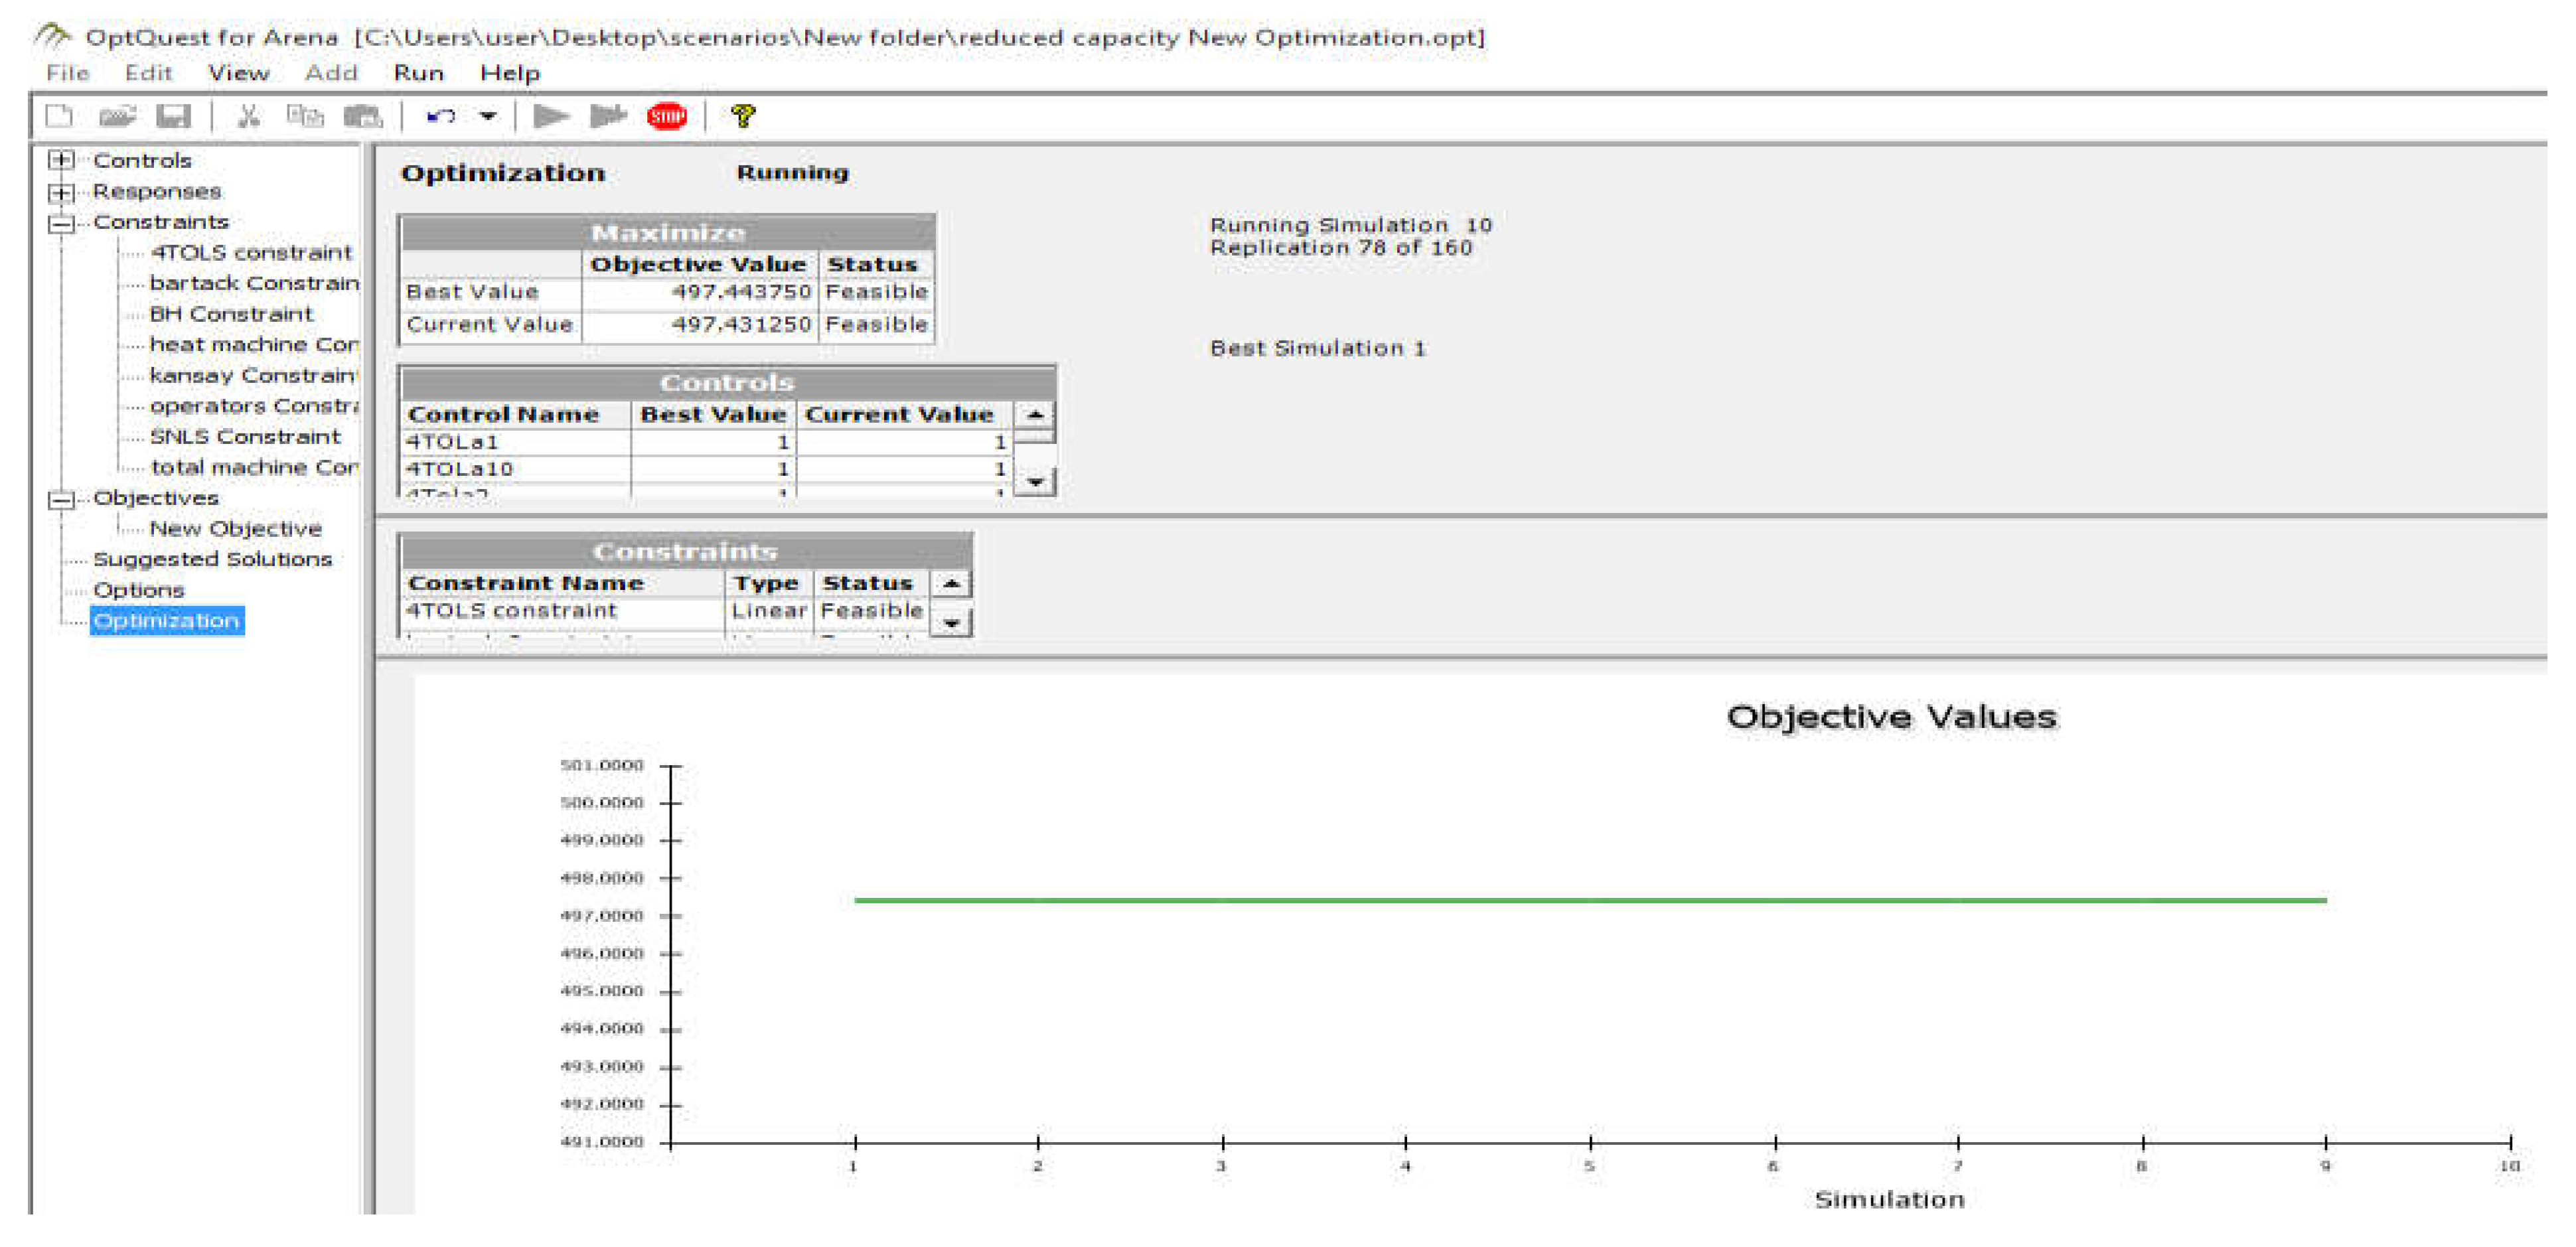
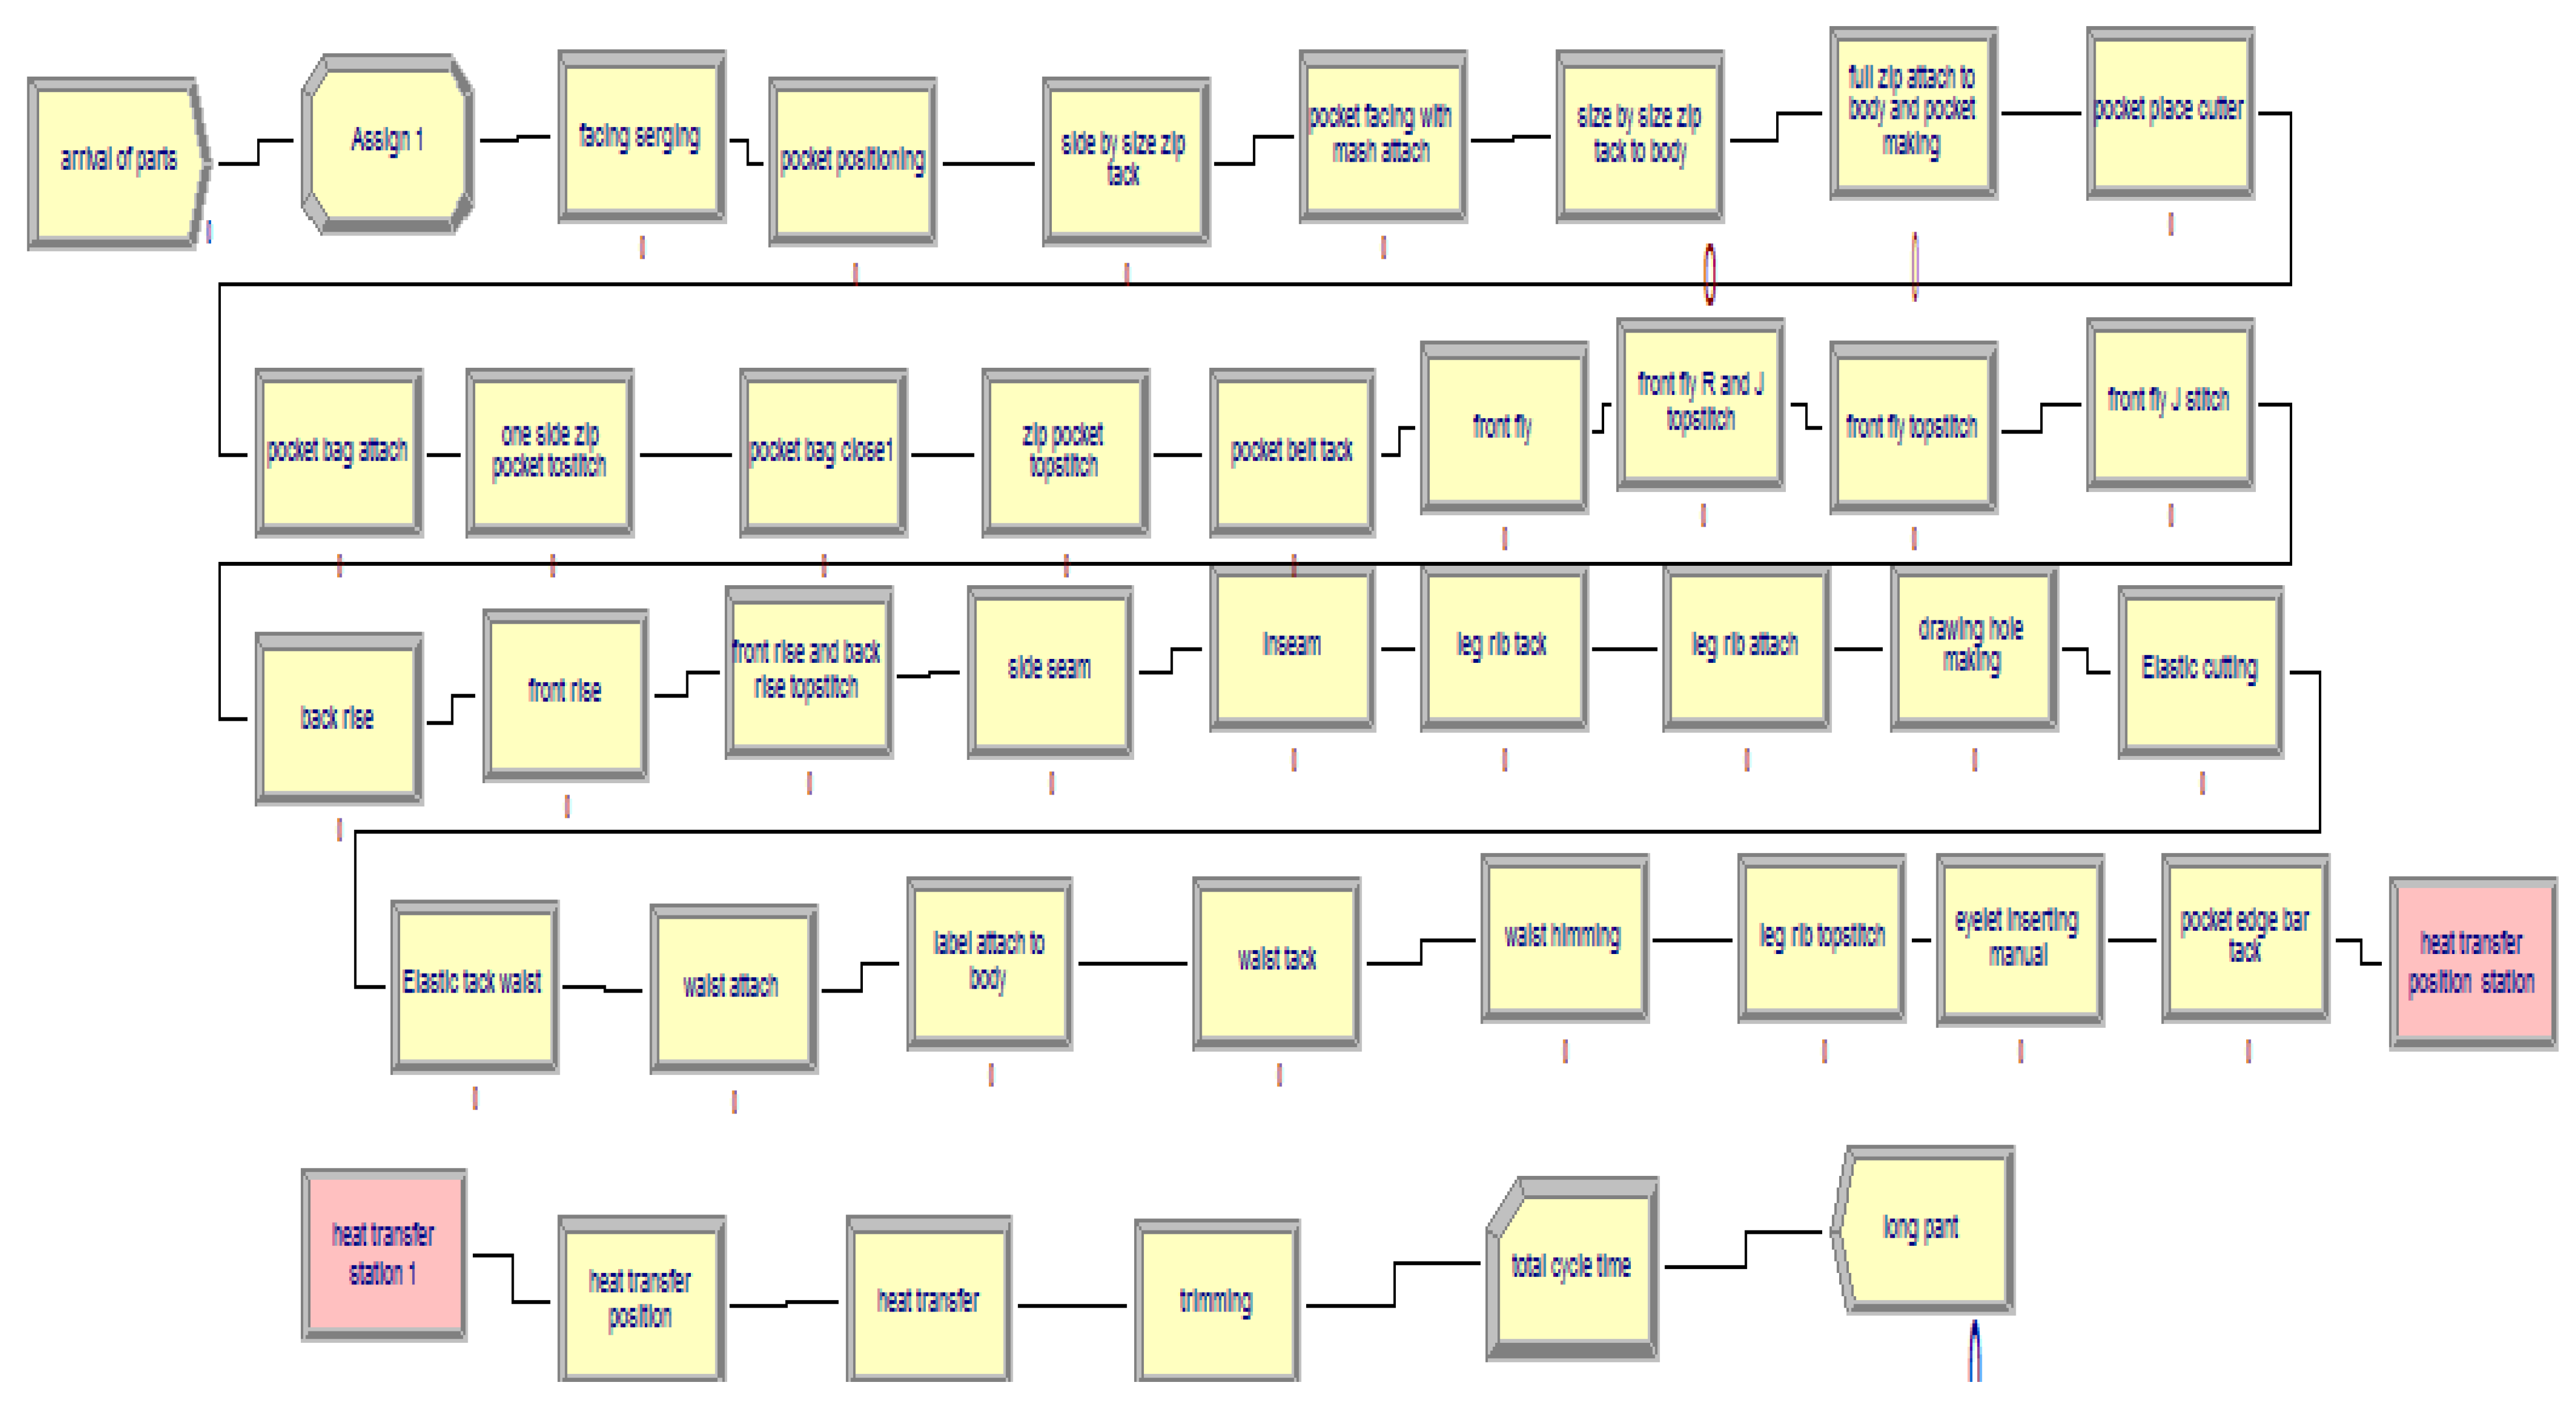
Figure 10.
optimized model This model is developed based on the opt quest output by reducing one operator in the pocket bag close and one 4TOL machine from it.
Figure 10.
optimized model This model is developed based on the opt quest output by reducing one operator in the pocket bag close and one 4TOL machine from it.
6. Conclusion
In this research, the simulation modeling and optimal line balancing of the long pant sewing line is carried out by using arena 14 version. Based on the simulation model run, results the operations that have high queue length and high resource utilization are facing serging, pocket positioning, size by size zip tack to body and front fly topstitch and a resources which have been low utilizations or below 50% utilizations are like BH machine, manual operator2, helper a2, and heat machine are idle operations in the production lines of the long pant model. And the operations that have high waiting time are bottlenecks for the production lines. identified bottlenecks are eliminated or minimized using sharing and adding of the existing resources (operators and machines) in order to optimize the resources as much as possible.
Finally, a new model has developed by using opt quest model of arena with different types of scenarios by considering the constraints of the resources and controls and responses of the results. Therefore, the production system produces 498 long pants and by reducing one operator and one 4TOL machine.
The researchers have identified the main bottle necks which have high work in process and low work in process, high queue length, low and high utilized resource specially the operators and the machines that allocated in the assembly lines. Based on the research findings the researcher will implement the model in the production areas and will have analyzed different alternatives to enhance the productivity of the company with integrating with different line balancing methods.
References
- M. Azizul, "line balancing and optimization for single model assembly line at a small medium industry," 2007.
- A. yemane, h. serajul and s. ivan, "Optimal Layout Design by Line Balancing Using Simulation Modeling (Case Study MAA garment textile factory)," in IEOM, 2017.
- A. Matebu, "Model development of quality management system for Ethiopian textile industries," desertation, 2013.
- Shuman, Arif-Uz-Zaman and Rahman, "productivity improvement through line balancing in apparel industries," in proceesings of the international conference on industrial engineering and operations management, Bangladesh, 2010.
- S. Biswas, A. Chakraborty and N. Bhowmik, " Improving Productivity Using Work Study Technique," International Journal of Research in Engineering and Applied Sciences (IJREAS), 2016.
- Y. Aregawi, G. Gebremedhin, M. Teklewold and H. Misgna, "Productivity Improvement through Line Balancing by Using Simulation Modeling (Case study Almeda Garment Factory)," Journal of Optimization in Industrial Engineering, pp. 153-165, 2020.
- Bahadir and k. Senem, "assembly line balancing in garment production by simulation," 2013.
- Mominul, Mehidi and Mohiuddin, "An optimal layout design in apparel industry by appropriate line balancing garment," 2014.
- S. Eryuruk, "clothing assembly line design using simulation and heuristic line balancing techniques," 2012.
- Hapaz and b. Hazmil, "Productivity improvement through line balancing," 2008.
- Mokhtar and b. Azizul, "line balancing and optimization for single model assembly line at a small medium industry," 2007.
- K. Maheshr and Jadhav, "Process flow analysis of diesel engine crankshaft machining line layout," 2014.
- M. Sudar and Anindya, "Apparel analysis for layout planning in sewing section golder," 2015.
- S. Amaran, N. V. Sahinidis, B. Sharda and S. J. Bury, "Simulation optimization : A review of algorithms and applications," pp. 1-28, 2017.
- M. Dehghani mohammadabadi, T. K. Keyser and S. H. Cheraghi, "A novel Iterative Optimization-based Simulation (IOS) framework: An effective tool to optimize system’s performance," Comput. Ind. Eng., pp. 1-17, 2017. [CrossRef]
- A. T. Bon and N. N. Shahrin, "Assembly Line Optimization using Arena Simulation," in International Conference on Industrial Engineering and Operations Management, 2016.
- M. Shakibayifar, A. Sheikholeslami and F. Corman, "A simulation-based optimization approach to rescheduling train in uncertain conditions during disruptions," pp. 646-662, 2018. [CrossRef]
- W. T. D. S. Junior, J. A. B. Montevechia, R. d. C. Miranda and A. T. Campos, "Discrete simulation-based optimization methods for industrial engineering problems : A systematic literature review," Comput. Ind. Eng., pp. 526-540, 2018. [CrossRef]
- V. Sarhangian, A. Vaghefi, H. Eskandari and M. K. Ardakani, "Optimizing inspection strategies for multi-stage manufacturing processes using simulation optimization," in Proceedings of the 2008 Winter Simulation Conference, pp. 1974-1980, 2008.
- Q. V. Dang and K. Pham, "Design of a Footwear Assembly Line Using Simulationbased ALNS," in in 13th Global Conference on Sustainable Manufacturing - Decoupling Growth from Resource Use, 2016.
- E. L. D. Juan, "Simulation-Based Optimization for Production Planning: Integrating Meta-Heuristics, Simulation and Exact Techniques to Address the Uncertainty and Complexity of Manufacturing Systems," SiD.Phil. Thesis: Alliance Manchester Business School, Manchester, 2016.
- M. F. Yegul, F. S. Erenay, S. Striepe and M. Yavuz, "Improving configuration of complex production lines via simulation-based optimization," Comput. Ind. Eng., p. 295–312, 2017. [CrossRef]
- W. L. S. Alvandi and S. Kara, "An Integrated Simulation Optimisation Decision Support Tool for Multi-Product Production Systems," Mod. Appl. Sci., pp. 56-71, 2017.
- I. M. Ibrahim, C. Liong, S. A. Bakar, N. Ahmad and A. F. Najmuddin, "Minimizing patient waiting time in emergency department of public hospital using simulation optimization approach," in in The 4th International Conference on Mathematical Sciences, 2017.
- C. Osorio, G. Flötteröd and C. Zhang, "A metamodel simulation-based optimization approach for the efficient calibration of stochastic traffic simulators," Transp. Res. Procedia, pp. 213-223, 2015. [CrossRef]
- S. Masoud, Y.-J. Son, C. Kubota and R. Tronstad, "Evaluation of Simulation-Based Optimization in Grafting Labor Allocation," Appl. Eng. Agric, pp. 479-489, 2018. [CrossRef]
- V. K. Ky, C. D. Ambrosio, Y. Hamadi and L. Liberti, "Surrogate-based methods for black-box optimization," Int. Trans. Oper. Res., pp. 1-26, 2016.
- H. H. Jeong, S. Kyung-Min and T. G. Kim, "Simulation-based optimization for design parameter exploration in hybrid system: a defense system example," Simul. Trans. of the Soc. Model. Simul. Int., pp. 1-19, 2013.
- C. S. K. Leung and H. Y. K. Lau, "Multiobjective Simulation-Based Optimization Based on Artificial Immune Systems for a Distribution Center," J. Optim., pp. 1-15, 2018. [CrossRef]
- M. Fatih, F. Saf, S. Striepe and M. Yavuz, "Computers & Industrial Engineering Improving configuration of complex production lines via simulation-based optimization," Comput. Ind. Eng., pp. 295-297, 2017.
- J. González-reséndiz, K. C. Arredondo-soto, A. Realyvásquez-vargas, H. Híjar-rivera and T. Carrillo-gutiérrez, "Integrating Simulation-Based Optimization for Lean Logistics : A Case Study," Appl. Sci., pp. 1-18, 2018. [CrossRef]
- Y. Aregawi, H. Serajul and s. M. Evan, "Optimal layout Design by line balancing using simulation modeling," in proceeding of the international conference on Industrial engineering and operation management Bogota, Bogota, 2017.
- Aregawi, yemane; Serajul, haque; Ivan, "Bottleneck Identification Using Time Study and Simulation Modeling of Apparel Industries," in industrial engineering and operation management, Bogota, 2017.
- B. Ocident, I. Josphat, E. O. Nganyi and Ildephonse Nibikora, "Improvement of garment assembly line efficiency using line balancing technique," Engineering Reports, wileyonlinelibrary.com/journal/eng2 , 2020.
- A. Jerbi, A. Ammar and M. Krid, "Performance optimization of a flexible manufacturing system using simulation : the Taguchi method versus OptQuest," in Simul. Trans. of the Soc. Model. Simul. Int., 2019. [CrossRef]
- N. Chiadamrong and V. Piyathanavong, "Optimal design of supply chain network under uncertainty environment using hybrid analytical and simulation modeling approach," J. Ind. Eng. Int., pp. 465-478, 2017. [CrossRef]
- G. Elnaggar, "Effect of Operator Skill Level on Assembly Line Balancing in Apparel Manufacturing : A Multi-Objective Simulation Optimization Approach," in in Proceedings of the International Conference on Industrial Engineering and Operations Management, 2019.
- V. Borodin, J. Bourtembourg, F. Hnaien and N. Labadie, "COTS software integration for simulation optimization coupling : case of ARENA and CPLEX products," Int. J. Model. Simul., pp. 178-189, 2019. [CrossRef]
- N. Prajapat and A. Tiwari, "A review of assembly optimisation applications using discrete event simulation," Int. J. Comput. Integr. Manuf., pp. 215-228, 2017. [CrossRef]
- A. Magno, C. Guimarães, J. E. Leal and P. Mendes, "Discrete-event simulation software selection for manufacturing based on the maturity model," journal of computing industrial engineering, pp. 14-28, 2018.
Disclaimer/Publisher’s Note: The statements, opinions and data contained in all publications are solely those of the individual author(s) and contributor(s) and not of MDPI and/or the editor(s). MDPI and/or the editor(s) disclaim responsibility for any injury to people or property resulting from any ideas, methods, instructions or products referred to in the content. |
© 2025 by the authors. Licensee MDPI, Basel, Switzerland. This article is an open access article distributed under the terms and conditions of the Creative Commons Attribution (CC BY) license (http://creativecommons.org/licenses/by/4.0/).
Copyright: This open access article is published under a Creative Commons CC BY 4.0 license, which permit the free download, distribution, and reuse, provided that the author and preprint are cited in any reuse.


