Submitted:
24 March 2025
Posted:
25 March 2025
You are already at the latest version
Abstract
Implied by the terminologies “Harang Reversal” and “Harang Discontinuity”, there are two significant features of the Harang region. (i) The reversal of auroral electrojet along with the underlying plasma convection flow and electric (E) fields and (ii) the discontinuity between the electrojets/convection flows/E fields. Even the earliest studies reported the discontinuity observed in the meridional E field. Conversely, some of the previous studies state that convection flow- and E field-reversals do not involve any physical discontinuity. We investigate these two features (i-ii) observed in five topside-ionosphere Harang scenarios. Each scenario occurred during a sequence of events, which led to the onset of substorm expansion phase, when the Harang region was newly formed. Results show (1) the newly-formed Harang region between the dusk and dawn convection cells, where one convection cell wraps around the other, (2) the zonal drift- and E field-reversals, (3) the discontinuity between the dusk and dawn convection flows and also between the reversing E field components, and (4) the earthward electromagnetic energy deposition locally minimizing or diminishing within the discontinuity and peaking within the reversing zonal drift and E fields. Thus, the convection flow- and E field-reversals observed involved the development of discontinuity.
Keywords:
topside ionosphere
; magnetosphere–ionosphere coupling
; energy deposition
; Poynting Flux
; polar convection
; convection E fields
; Harang Discontinuity
; Harang Reversal
; SAID
; STEVE arcs
1. Introduction
The Harang Discontinuity [1] is a magnetosphere-ionosphere (M-I) conjugate phenomenon [2]. Its ionosphere component was first reported in 1946 by Harang [3], who observed a discontinuity in the magnetic field perturbation (ΔH) pattern. However, the importance of the discontinuity, as a region of reversal, transition or change for most of the substorm- and polar convection-related phenomena, was first emphasized much later, in 1972, by Heppner [1]. In the ionosphere, the Harang Discontinuity occurs within the nighttime auroral zone, in a narrow longitude region. Mostly in the premidnight and midnight magnetic local time (MLT) sectors [1,2], but sometimes in the postmidnight MLT sector [4] and occasionally, even deep in the evening MLT sector [5].
To illustrate the Harang region plasma environment in the ionosphere, Figure 1a shows the two-cell polar convection pattern, where the F-region plasma is driven by the mapped-down magnetospheric electric (E) field. Ordered in a twin-cell vortex pattern [6], the plasma E×B drifts clockwise in the dusk cell and anticlockwise in the dawn cell. Plasma flows are antisunward across the polar cap (marked in light green) and sunward in the oval region (marked in gray). Ionospheric E fields (marked in blue) are directed poleward on the duskside and equatorward on the dawnside and drive the Pedersen currents (JP; marked in dark red) that flow poleward in the duskside oval and equatorward in the dawnside oval. Hall currents (JH; marked in dark green) flow antisunward: both in the duskside eastward electrojet (EEJ) and in the dawnside westward electrojet (WEJ).
The Harang Discontinuity (marked in red) appears near magnetic midnight, where the polar convection pattern becomes skewed (marked as shaded region in yellow). As was first reported by Harang [3], the dominating EEJ (ΔH>0) reverses in the clockwise direction to a WEJ (ΔH<0) along the discontinuity. Thus, across the discontinuity, the EEJ is located equatorward of the WEJ. Since auroral electrojets are mainly Hall currents, the reversal is also depicted by the Hall currents changing directions from antisunward to sunward. Also, by the meridional Pedersen currents (marked in dark red) and related E fields (marked in blue) changing directions from poleward to equatorward. Heppner ([1,7] explained the Harang Discontinuity as a convection flow discontinuity, separating oppositely directed convection flows, where sunward plasma convection flows (related to the dusk cell) become antisunward directed (related to the dawn cell). Thus, in terms of plasma convection, the Harang Discontinuity represents a convection boundary dividing the azimuthal westward (or duskward) and eastward (or dawnward) drifts [8].
In Figure 1b, the schematic diagram is modified after Figure 1 of Kamide [8] and illustrates the meridional E fields underlying the plasma convection. As shown, the dominating poleward E field gradually becomes equatorward directed through a clockwise rotation. The Harang Discontinuity (marked as shaded interval in yellow) is located between the poleward and equatorward E fields. Withing the discontinuity, the directional change occurs [1,2,9]. Thus, while the region of reversal may not be a physical discontinuity, the discontinuity itself may have a finite width wherein the actual transition or change occurs [8,10].
In the magnetosphere, the plasmasheet maps down to the auroral oval, while the magnetotail lobe maps down to the poleward oval boundary. Thus, the Harang Discontinuity’s poleward region is magnetically connected to the central region of the plasmasheet, while its equatorward region is connected close to the plasmasheet’s earthward edge [11]. In the magnetic midnight sector, where the Harang region magnetically connects to the magnetotail, the discontinuity can also be interpreted as a fault line separating the inflated and collapsed magnetic field during substorms [2.12]
The M-I conjugate Harang Discontinuity is also a common feature of substorms [1], and is associated with auroral activation [13], as the near magnetic midnight substorm onset occurs at the diffuse-discrete auroral boundary. Therefore, various auroral features (with plasmasheet driver mechanisms) are associated with the Harang region. These include many substorm-onset-related auroral signatures such as growth phase arcs [14], poleward boundary intensifications (PBIs) [15] and their frequent equatorward extensions known as auroral streamers [16,17,18,19,20,21].
Although the Harang Discontinuity has a significant role in the substorm triggering process, as was specified and put forward by Nishimura et al. [22], but (a) the documentation of Harang reversal itself is not covered in their study by ionospheric observations. Only the clockwise rotating Harang aurorae/streamers are shown by the all-sky imager (ASI) images. Furthermore, in our recent study [23], we reported our comprehensive investigation of the M-I conjugate clockwise rotating Harang reversal, but various aspects were not covered. We investigated only the near-midnight Harang reversal, (b) leaving other MLT sectors out. Also, (c) the Harang reversal appearing in the ionosphere was not documented with E field observations. Therefore, (d) the important observational evidence of clockwise E field rotation driving clockwise E×B drift rotation is still missing. Furthermore, (e) the scenario of anticlockwise rotating Harang reversal (when the dominating WEJ becomes an EEJ) was not investigated. Moreover, contradicting early E field studies documenting the discontinuity between the rotating E fields [1,2,8,9], some of the previous studies [20,21,24,25] state that (f) the rotations of convection flows and E field components within the Harang region do not involve any physical discontinuity.
In order to fill these gaps (listed above as a-f) in our knowledge and understanding, we investigate both the various reversal and the discontinuity itself in a comprehensive way. In five topside-ionosphere scenarios, we present the Harang region occurring in various MLT sectors, during a sequence of events that led to the onset of expansion phase. Our scenarios demonstrate (i) the rotating convection flows and E field components and (ii) the discontinuity between the convections flows/E field components, where the convection flows and E field components minimized, and (iii) the earthward electromagnetic energy deposition occurring withing the rotating drifts and E fields, but not within the discontinuity.
2. Materials and Methods
For observing the Harang region, depicted by a discontinuity between the reversing zonal drift components in the auroral oval, we surveyed the Defense Meteorological Satellite Program (DMSP) [26] data plots for the calendar years of 2012 and 2013. Since the detection of the actual discontinuity in the Harang region is quite rare, we found only a few observations. These observations were made by the DMSP F15, F16, F17, and F18 satellites and mainly over the Southern Hemisphere and in the nighttime MLT sector. As these DMSP satellites crossed the oval in the dawn-dusk direction, they followed the discontinuity oriented in the east-west (E-W) direction and were able to provide exceptional observations. Covered by continuous and good quality (Level 2) measurements, we present five observations taken in four events: three events in the Southern Hemisphere and one event in the Northern Hemisphere.
We used multi-instrument in situ measurements and imageries provided by the various DMSP satellites orbiting the Earth at ~840 km altitude in their ~98.7o inclined and 110 min polar orbits.
The DMSP measurements used are from the SSIES (Special Sensor for Ions Electrons Scintillations) and SSM (Special Sensor Magnetometer) instruments. These measurements are processed and published as Level 2 data by the Madrigal Database. Provided by the SSIES instrument, we used drift velocities measured in the ram (VRAM; m/s) or along-the-track direction and in the cross-track horizontal (VHOR; m/s) and vertical (VVER; m/s) directions. We also used the SSM-measured magnetic B field components (BX, BY, BZ; nT) and the computed perturbation B field (δB) or magnetic deflection components (δBX, δBY, δBZ; nT). By following the methodology of Kilcommons et al. [27], we computed the three E field components (EX, EY, EZ; mV/m) based on the basic equation of E=-Vions×B as EX=VZBY-VYBZ, EY=VXBZ-VZBX and EZ=VYBX-VXBY, where X denotes the ram directions and Y and Z represent the cross-track horizontal and vertical directions. By following the methodology of Huang and Burke [28] and Huang et al. [29], we computed the vertical component of the Poynting flux (S||; mW/m2) in spacecraft-centered coordinate system, where X is upward-downward, Y is forward-backward, and Z is eastward-westward. We used the equation of S||=1/μ0((VXBZ-VZBX)dBZ-(-VXBY)dBY), where μ0 is the permeability in vacuum (4π×10-7 H/m). Here, the values of S||<0 represent downward or earthward directed Poynting flux deposited into the coupled Ionosphere-Thermosphere (I-T) system. For better presentation, we converted the negative values to positive and plotted the earthward directed S|| data as positive values.
We also employed a small number of imageries. These include the DMSP imageries provided by the Special Sensor Ultraviolet Spectral Imager (SSUSI) instrument, which measures auroral and airglow emissions of Far Ultra-Violet (FUV) radiance produced by the upper atmosphere [30,31]. Therefore, SSUSI imageries provide auroral observations derived from N2 emissions in the 140-150 nm range, which is also known as the N2 LBHS (Lyman-Birge-Hopfield short) spectrum. Both equatorward and poleward oval boundaries are defined by the SSUSI model. But the SSUSI imageries show only the equatorward auroral boundary (marked in dark red). Therefore, we added the poleward auroral boundary (marked in red) to each SSUSI image shown. We also used horizontal magnetic perturbation (dB) vector plots provided by the Active Magnetosphere and Planetary Electrodynamics Response Experiment (AMPERE) project [32]. As the eastward and westward dB vectors depict the EEJ and WEJ respectively, we could observe the clockwise rotation of EEJ to WEJ or the anticlockwise rotation of WEJ to EEJ in the Harang region. We also used Super Dual Auroral Radar Network (SuperDARN) {34,35,36] convection maps depicting the convection streamlines, which are electrostatic equipotentials. For each convection map shown, we marked the Heppner-Maynard (H-M) Boundary (in dark green), which is an empirical boundary defined based on the underlying Interplanetary Magnetic Field (IMF) conditions [37]. The H-M Boundary marks the latitudinal extent of the polar convection [38] and is located near the equatorward oval boundary [39]. We also marked the SSUSI model defined poleward auroral boundary (in red). In the large-scale polar convection pattern, we could observe the dusk and dawn convection cells, and the Harang region where one convection cell wrapped around the other convection cell.
For observing the underlying interplanetary and geomagnetic conditions, we viewed the variations of the IMF BY (nT) and BZ (nT) components and of the various indices including the geomagnetic Kp index and the auroral AE (nT) and AL indices.
For observing magnetotail-reconnection-related particle injections, we used electron flux measurements provided by the Geostationary Operational Environmental Satellites (GOES) orbiting the Earth once a day at 6.6 RE. GOES-13 and GOES-15 traveled mostly in the nighttime MLT sector and provided average electron flux values measured at various keV channels including 40, 75, 150, 275 and 475 keV.
3. Results
3.1. Dawnside Harang Discontinuity and Clockwise Rotations Observed in Event-1
Figure 2 shows the underlying interplanetary and geomagnetic conditions of the four events of interest. These are depicted by the line plots constructed with the IMF BY and BZ components, with the geomagnetic index of Kp and auroral indices of AE and AL, and with the electron flux measured at various channels by GOES-13 or GOES-15.
Figure 2a is constructed for Event-1 (22 August 2013), when two dawnside scenarios occurred during 7-8 UT (marked as symbol dots in green, shaded interval in yellow). Under weak dawnward (BY<0) and southward (BZ<0) IMF conditions (BY≈-2 nT; BZ≈-1 nT), the underlying two-cell convection pattern appeared with a more elongated dusk cell that intruded dawnward and a round shaped dawn cell (as shown in Figure 3b, Figure 4b). Event-1 unfolded under moderate geomagnetic (Kp=2+) and weak substorm (AL≈-100 nT; AE≈200 nT) conditions. Observed by GOES-13 during the postmidnighttime (1-2 MLT) hours, both scenarios were preceded by strong particle injections during 6-7 UT.
Figure 3 and Figure 4 are constructed for the two scenarios of Event-1 (22 August 2013). In Event-1, three DMSP satellites observed the Harang region in the postmidnight MLT sector over the Southern Hemisphere.
Figure 3a shows the schematic diagram of the earlier observed (~7.25 UT or 7:15 UT) first scenario. Within the equatorward half of the oval, the duskside EEJ intruded dawnward, where the plasma was flowing antisunward (marked by the arrow in blue). On the dawnside, the dominating WEJ (shaded in cyan) occupied the poleward half of the oval, where the plasma was flowing sunward (marked by the arrow in blue). Thus, the Harang region developed on the dawnside, in the postmidnight MLT sector, where the discontinuity was directed E-W and located between the EEJ and WEJ.
Figure 3b illustrates the two-cell polar convection pattern operational at that time along with the Heppner-Maynard (H-M) boundary (marked in dark green) and the polar cap boundary (marked in dark red). Then, the F17 pass (in green) crossed the auroral region from dawn to dusk. We plotted the locations of EEJ (symbol square in green) and WEJ (symbol diamond in green). These show that the equatorward located EEJ is associated with the dawnward intruding dusk cell (marked in blue), while the poleward located dominating WEJ is related to the dawn cell (marked in red). Thus, as depicted by the schematic diagram in Figure 3a, Figure 3b shows that F17 observed the Harang Discontinuity on the dawnside and between the E-W directed dusk and dawn cells. Since the F17 pass crossed the auroral zone in the dawn-dusk (or E-W) direction, it was able to observe not only the clockwise drift and E field rotations, but also the discontinuity itself (as shown in Figure 3c).
Figure 3c shows a set of line plots constructed with the multi-instrument F17 data. These line plots are oriented in the poleward direction, similarly to the schematic diagram shown in Figure 1b, so comparisons can be made. By progressing from top to bottom, we show the line plots of horizontal drift (VHOR), E field components in the ram (ERAM) and vertical (EVER) directions, magnetic deflection components (δBY; δBZ) and Poynting flux (S||). We marked the midnight auroral zone and the polar cap. According to the VHOR line plot, F17 observed first the strong antisunward (-) flows (VHOR≈-2,600 m/s) in the regime of EEJ (shaded interval in magenta) on the dawnside, where the plasma was flowing antisunward (toward midnight; as shown also in Figure 3a). Then, the Harang Discontinuity (HD; shaded interval in yellow), where the zonal drift stopped (VHOR≈0 m/s). Finally, the strong sunward (+) flows (VHOR≈2,500 m/s) in the regime of WEJ (shaded interval in cyan). Next, the E field line plots depict the poleward (+; ERAM≈90 mV/m) and weaker outward (+; EVER≈10 mV/m) E field components associated with the EEJ, the equally strong equatorward (-; ERAM≈-90 mV/m) E field associated with the WEJ, and the discontinuity in both E field components (ERAM≈0 mV/m; EVER≈0 mV/m) depicting the Harang Discontinuity. Then, the deflection components show the reversals of Hall currents (JH; from sunward in the EEJ to antisunward in the WEJ) and Pedersen currents (JP; from poleward in the EEJ to equatorward in the WEJ). These currents (JH and JP) peaked within the electrojets and changed directions within the discontinuity. In good agreement with the study of Kamide [8], these JH and JP observations imply a current continuity in the Harang Discontinuity. Finally, the Poynting flux line plot depicts the earthward directed (+) electromagnetic energy deposition occurring from the magnetosphere to the ionosphere: S||≈14.5 mW/m2 within the EEJ and S||≈12.5 mW/m2 within the WEJ. But within the Harang Discontinuity, the earthward energy deposition decreased from ~2.5 mW/m2 through zero to -1.0 mW/m2.
Figure 3d shows the SSUSI imagery depicting the southern part of the auroral oval along with the north-south (N-S) aligned auroral arc that became E-W directed as the N-S arc followed the Harang reversal [22]. In good agreement with the findings of Nishimura et al. [22], the E-W directed auroral arc is located where the E-W directed Harang Discontinuity was observed by F17.
Figure 3e shows the AMPERE dB vector map. Based on the study of Kleimenova et al. [40], we marked the WEJ and EEJ (as arrows in dark green) within the Harang region, and the discontinuity (as line in red) between them. These illustrate the rotating WEJ to EEJ along the discontinuity.
Figure 4 is constructed the same way as Figure 3 and shows the second scenario (at 7.75 UT or 7:45 UT) of Event-1 (on 22 August 2013) observed by F16 and F18. As shown by the schematic diagram in Figure 4a, the dusk cell/EEJ intruded dawnward into the dawnside WEJ in such a way that the dawnward intruding EEJ (where the plasma was flowing toward midnight or antisunward) appeared between two WEJs (where the plasma was flowing sunward). According to the polar convection map in Figure 4b, F16 and F18 were traveling poleward and observed the EEJ (related to the dawnward intruding dusk cell) first and then the WEJ (related to the dawn cell).
In Figure 4c, the two sets of line plots depict the reversals of zonal drifts from antisunward (in the regime of EEJ; VHOR: ~-2,000 m/s and ~-3,000 m/s) to sunward (in the regime of WEJ; VHOR: ~3,200 m/s and ~2,800 m/s). We show also the clockwise rotation of E field components: from poleward (in the regime of EEJ; ERAM: ~70 mV/m and ~180 mV/m) to equatorward (in the regime of WEJ; ERAM: ~150 mV/m and ~100 mV/m) and from outward (in the regime of EEJ; EVER: ~8 mV/m and ~48 mV/m) to inward (in the regime of WEJ; EVER: ~-20 mV/m and ~-25 mV/m). Both the F16 and the F18 observations show the discontinuity’s narrow region of (shaded interval in yellow) where the zonal drift (VHOR) and meridional E field (ERAM) became zero and where the Poynting flux became close to zero. In the Harang region, the earthward energy deposition derived from the F18 data (S||≈5 mW/m2 within the EEJ and S||≈4 mW/m2 within the WEJ) was weaker compared to that derived from the F16 data (S||≈12 mW/m2 within the EEJ and S||≈9 mW/m2 within the WEJ).
Finally, we show the deflection components only for the F16 observations. These depict the reversals of Hall currents (from sunward to antisunward) and Pedersen currents (from poleward to equatorward), and the continuation of the currents in the regime of the discontinuity. Figure 4d shows with the SSUSI imagery that the N-S directed auroral arc was still there and was still following the Harang Discontinuity (i.e. became E-W directed). Thus, the discontinuity’s location is marked by the E-W aligned auroral arc where F16 and F18 made their observations. At the same dawnside location, the AMPERE dB vector map depicts the rotating WEJ to EEJ along the discontinuity as marked in Figure 4e.
3.2. Duskside Harang Discontinuity and Anticlockwise Rotation Observed in Event-2
Returning to Figure 2b, the duskside scenario of Event-2 (9 April 2013) was observed under stronger duskward (BY>0) and southward (BZ<0) IMF conditions (BY≈3.5 nT; BZ≈-2 nT), but quieter geomagnetic conditions (Kp=1+; AL≈-35 nT) conditions (compared to Event-1), and without any particle injections occurring in the 22-23 MLT sector. For such IMF orientation, the two-cell convection pattern operational was characterized by a more elongated dawn cell that intruded duskward and by a less elongated dusk cell (as shown in Figure 5b).
Figure 5 depicts the duskside scenario of Event-2 (9 April 2013) occurring over the Southern Hemisphere. As shown in Figure 5a by the schematic diagram, the dawn cell intruded duskward and therefore, the dawnside WEJ appeared near the equatorward edge of the oval, where the plasma was flowing back, toward midnight, or antisunward. Meanwhile, the duskside EEJ was located near the poleward edge of the oval, where the plasma was flowing sunward. Thus, in the Harang region, the dominating duskside EEJ became a WEJ via an anticlockwise rotation. In Figure 5b, the polar convection plot depicts the above-described two-cell convection pattern and the F15 pass. As the F15 satellite crossed the oval in the postmidnight-dusk direction, it observed first the duskward intruding dawn cell (associated with the WEJ), then the dusk cell (associated with the EEJ), and the discontinuity itself located between the two convection cells/electrojets where the duskward intruding dawn cell wrapped around the dusk cell.
In Figure 5c, the line plots cover the duskside auroral zone. According to data availability, we show here only the line plots of zonal drift and meridional E field driving the zonal drift. F15 observed the equatorward located antisunward flows (VHOR≈-2,200 m/s) in the regime of WEJ (shaded interval in cyan) as the dawn-cell-related plasma was drifting toward midnight and the poleward located sunward flows (VHOR≈1,600 m/s) in the regime of EEJ (shaded interval in magenta). Their respective underlying equatorward E field (ERAM≈60 mV/m) and poleward E field (ERAM≈50 mV/m) depict an anticlockwise rotation. Meanwhile, the clear signatures of Harang Discontinuity appear both in the zonal drift and in the meridional E field: both became zero. But earthward energy deposition (S||≈4.5 mW/m2) occurred only within the regime of WEJ, as the Poynting flux decreased to zero elsewhere.
In Figure 5d, the SSUSI imagery depicts a short section of the N-S auroral arc that became E-W directed on the duskside by following the Harang reversal [22]. In this MLT sector, the AMPERE dB vector map in Figure 5e shows the electrojet reversal along the discontinuity, where the EEJ rotated and became a WEJ.
3.3. Duskside Harang Discontinuity and Clockwise Rotation Observed in Event-3
Returning to Figure 2c, the line plots show that Event-3 (17 March 2012) occurred under strong dawnward (BY<0) and southward (BZ<0) IMF conditions (BY≈-4 nT; BZ≈-2 nT) and increasingly active geomagnetic conditions (Kp=4+), during an intense substorm (AL≈-500 nT), and soon after dispersed particle injections observed by GOES-15.
Figure 6 illustrates Event-3 (17 March 2012) observed by F15 over the Southern Hemisphere. As the schematic diagram shows in Figure 6a, at ~18 MLT, the duskside EEJ appeared within the equatorward half of the oval, while the duskward intruding WEJ appeared within the poleward half of the oval. With the Harang Discontinuity between the two electrojets, the clockwise rotating EEJ/poleward E field became a WEJ/equatorward E field. Further illustration is provided by the polar convection map in Figure 6b.
Figure 6b shows that the two-cell polar convection displayed a highly asymmetric pattern with a significantly stronger dawn cell than dusk cell, where the dawn cell intruded into the dusk sector, up to 18 MLT. At 18 MLT, the duskward intruding dawn cell occupied the poleward half of the oval while the dusk cell occupied the equatorward half of the oval. Such asymmetric convection pattern is unrelated to the IMF BY component, but consistent with the WEJ’s enhancement during substorm [41] and is produced by the westward substorm surge reaching 18 MLT [42].
Because of the dawn-dusk alignment of the F15 pass, the line plots in Figure 6c cover the duskside auroral zone and a small section of the polar cap. These plots depict the strong sunward (+) drift (VHOR≈3,000 m/s) and underlying poleward (-) E field (ERAM≈-90 mV/m) in the regime of EEJ, where the Hall currents were antisunward directed and also the strong antisunward (-) drift (VHOR≈-2,000 m/s) and underlying equatorward (+) E field (ERAM≈80 mV/m) in the regime of WEJ, where the Hall currents were sunward directed. Both the clockwise rotating meridional E field and the discontinuity itself were observed by F15. Earthward energy deposition reached ~11.5 mW/m2 within the auroral electrojets and minimized at ~1 mW/m2 within the discontinuity.
In Figure 6d, the SSUSI imagery shows the auroral bulge along with the N-S auroral arc that became E-W directed where the discontinuity was located, as the N-S auroral arc followed the Harang reversal [22]. In Figure 6e, the AMPERE dB vector map depicts the clear signatures of strong electrojet reversal and discontinuity in the dusk sector.
3.4. Harang Discontinuity and Clockwise Rotation Observed in Event-4
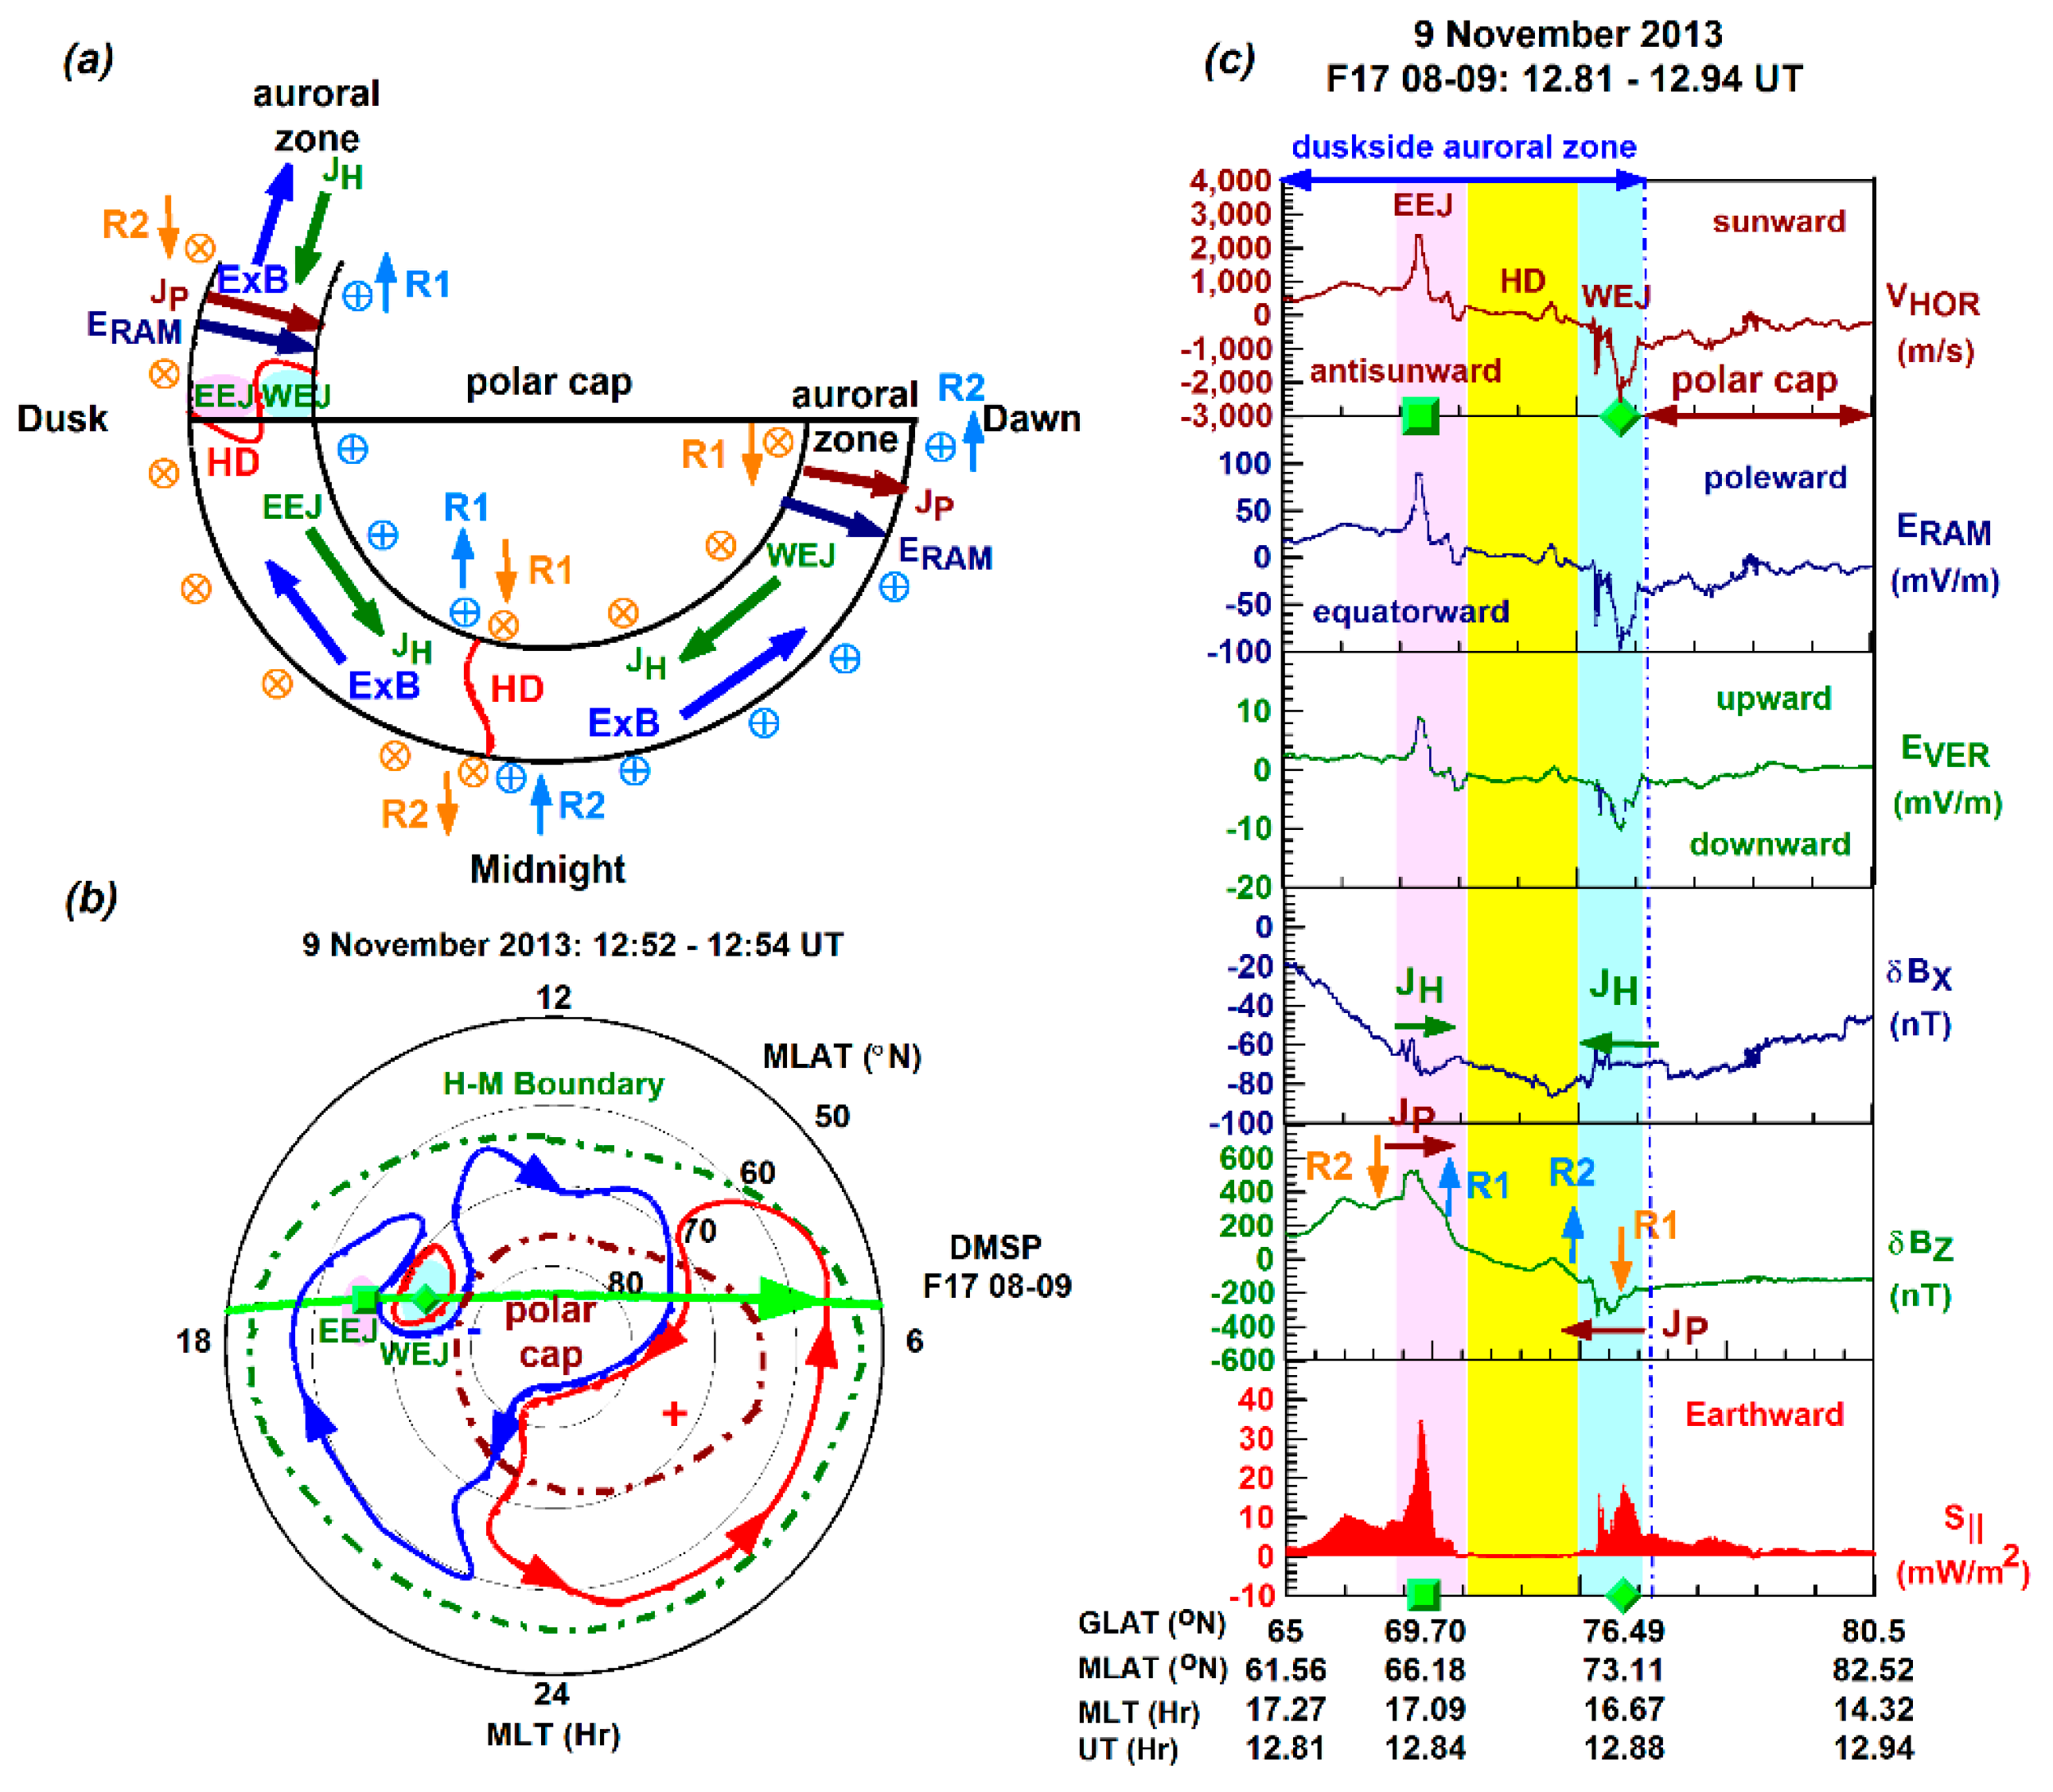
Returning to Figure 2d, Event-4 occurred under duskward IMF orientation (BY≈5 nT) and at the end of a long-lasting southward IMF alignment (BZ<0), when the IMF turned northward (max BZ≈9 nT), and during an intense substorm (AL≈-650 nT), when the declining geomagnetic activity was still intense (Kp=4-). In the postmidnight (2-4 MLT) sector, GOES-15 observed weak dispersionless particle injections in Event-4, but significantly stronger dispersed injections ~2 UT hours before Event-4.
Figure 7 shows the duskside scenario of Event-4 (9 November 2013) observed by F15 over the Northern Hemisphere. The schematic diagram in Figure 7a (like in Figure 6a), depicts the intrusion of dawn cell into the dusk cell at ~18 MLT and a scenario, when the EEJ appeared equatorward of the WEJ. Along the Harang Discontinuity, the EEJ rotated clockwise and became a WEJ. However, as the polar map shows in Figure 7b, the underlying polar convection was characterized by a two-cell pattern with a localized dawn cell at ~18 MLT because of the northward IMF. This resulted in a scenario, where the Harang reversal occurred at ~18 MLT. Then, in the auroral zone, the EEJ appeared at lower latitudes and the WEL at higher latitudes.
In Figure 7c, the F17 line plots cover the duskside auroral zone and a small section of the polar cap at ~18 MLT. These line plots depict the clockwise rotations of zonal drift (from sunward to antisunward) and E field components (from poleward/outward to equatorward/inward) and the discontinuity itself. These line plots show the sunward (+) drift (VHOR≈2,600 m/s) and underlying poleward (-) and outward (+) E fields (ERAM≈-90 mV/m; EVER≈10 mV/m) in the regime of EEJ. Also, the antisunward (-) drift (VHOR≈2,500 m/s) and underlying equatorward (+) and inward (-) E fields (ERAM≈100 mV/m; EVER≈10 mV/m) in the regime of WEJ. Earthward energy deposition was significantly stronger (S||≈33 mW/m2) in the regime of EEJ compared to the weaker (S||≈19 mW/m2) earthward energy deposition in the regime of WEJ. Between the reversals and earthward energy depositions, the discontinuity itself appears and is shown best by the line plots of vertical drift and Poynting flux, both reaching and remaining close to zero. Meanwhile, the deflection components depict the reversals of Hall currents (from antisunward to sunward) and Pedersen currents (from sunward to antisunward) within the discontinuity and thus demonstrate current continuity. In Figure 7d, the SSUSI imagery shows the N-S auroral arc and its turning into the E-W direction by following the Harang Discontinuity [22]. Since the F17 pass was dawn-dusk (E-W) directed, F17 was able to observe both the reversals of zonal drift and E field components and also the discontinuity itself.
4. Discussion
In this study, we investigated the ionosphere component of the M-I conjugate Harang phenomenon and focused on both the reversals and the discontinuity developed between the reversing vectors. We investigated the reversal of zonal drift (VHOR) along with the underlying E field components (observed in the meridional (ERAM) and radial (EVER) directions) and auroral electrojet. Unfolding in four events (Events 1-4), we illustrated five scenarios demonstrating clockwise rotations (in four scenarios) and anticlockwise rotations (in one scenario) along with the discontinuity itself developed between the rotating components.
To our investigation, the study of Nishimura et al. [22] is particularly relevant, as the Harang Discontinuity’s evolution is related to the onset of substorm expansion phase. Nishimura et al. [22] reported a repeatable sequence of events leading to substorm onset (i.e., onset of expansion phase) based on M-I conjugate observations provided by magnetosphere satellite observations and ground-based ASI imageries. These events include (i) auroral PBIs and (ii) PBIs’ evolvement into N-S auroral arcs, called auroral streamers, which (iii) become E-W directed auroral arcs by tracking (i.e., following) the Harang reversal. Nishimura et al. [22] called the N-S auroral arcs Harang streamers or Harang aurorae. It was also highlighted by the authors that some of the N-S auroral arcs follow the dawn convection cell and thus, generally lead to substorm onsets located in the midnight and postmidnight MLT sectors.
Based on the sequence of events defined by Nishimura et al. [22], we specified some important features of the Harang regions observed (listed below as 1-4) that are in good agreement with the findings of Nishimura et al. [22]. Our Harang scenarios occurred during the sequence of events that led to substorm onset (i.e., the onset of the expansion phase). Particularly, when the N-S auroral arcs -following the dawn convection cell- were still present and the E-W auroral arcs developed already (as shown by the DMSP SSUSI imageries). These imply that the Harang regions observed by DMSP were newly formed. Each scenario presented in this study depicts (1) the newly-formed Harang region developed between the dusk and dawn cells, where one cell wrapped around the other. (2) The reversals of zonal drift and underlying E field components and between the reversing drift/E field components (3) the discontinuity itself, where the N-S auroral arc rotated (i.e., just poleward of the substorm onset latitude) and became E-W directed by following the Harang Discontinuity. (4) The locally maximized earthward deposition of electromagnetic energy within the regimes of auroral electrojets, since the accumulated magnetic energy becomes released into the coupled M-I system during the expansion phase [43], while energy deposition was absent within the regime of discontinuity.
Importantly, our results demsotrate that one of the significant features of the Harang region is the discontinuity itself. Although the discontinuity itself was reported by early studies, it was not recognized by some of the previous studies that preferred to use the term “Harang Reversal” (see details in section 1). One possible reason is the discontinuity’s rare detection. For example, for this study, we surveyed two years of data plots, covering the calendar years of 2012 and 2013, and found only a few observations depicting both the drift reversal and the discontinuity between the reversing sunward/antisunward drift components. These observations are from those DMSP passes that traveled along the Harang Discontinuity and therefore were able to observe the discontinuity itself along with the zonal drift rotation in the Harang region. These observations provide direct evidence that within the Harang region observed, there was an actual discontinuity in terms plasma convection, E field vectors, and electromagentic energy deposition. Within the convection discontinuity, developed between the reversing zonal E×B drift, the zonal E×B drift decreased to zero. Similarly, within the E field discontinuity, developed between the reversing E field components, the meridional and radial E fields diminished. As a shortfall of this study, due to the poor quality azimuthal (or zonal) E field data obtained, our scenarios do not demonstrate the localized increase of westward E field within the discontinuity, as was first described by Kamide [8] and shown in Figure 1b. Furthermore, the earthward electromagnetic energy deposition (i.e. Poynting flux) locally maximized within the reversing electrojet/E×B drift/E fields and locally minized or diminished within the discontinuity. Thus, within the Poyniting flux discontinuity, electromagnetic energy deposition minized or ceased. Finally, in good agreement with the early study of Kamide [8], there was a current continuity within the Harang Discontinuity, where the Hall and Pedersen currents reversed.
Understanding the M-I conjugate Harang phenomenon is crutial for the better understanding of various subauroral phenomena, which strongly degrade trans-ionosphere satellite signals leading to serious navigation and posinitioning errors [44,45]. These phenomena include the STEVE (Strong Thermal Emission Velocity Enhancement) arc [46,47,48] that is the optical manifetsion of SAID (Sub-Auroral Ion Drifts) [49,50,51] and that is closely linked to SAID [52,53,54]. For example, the STEVE arc prefers to develop in the pre-midnight Harang region lasting longer than usual. In that preferred region, the STEVE-associated poleward subauroral E field becomes amplified and drives extremely strong SAID flows [41,55]. These imply that the longer-lasting Harang region has a significant role in the developemnt of both STEVE arc and amplified SAID flows. In future studies, we plan to invetsigate the amplified SAID in the Harang region based on M-I conjugate obseravtions. According to our knowledge, this study is the first to investigate electromagnetic energy depistion (approximated with the Poynting flux) in the Harang region. We highlighted the earthward Poynting flux’s absence within the discontinuity and localized increas within the reversing drifts/E fields. Understanding the pattern of earthward Poynting flux is vital, since earthward electromagnetic energy deposition adversely impacts the thermosphere and causes thermospheric drag on spacecraft leading to difficulties both in tracking and in orbit determination/prediction [56].
5. Conclusions
In this study, we focused on the ionosphere component of the M-I conjugate Harang phenomenon. By utilizing multi-instrument DMSP data and various imageries, we used a diverse database. These include the computed values of E field components for observing E field rotations and of Poynting flux for quantifying the electromagnetic energy transfer in the coupled M-I system. Also, the satellite imageries showing the N-S auroral arc rotating (by following the Harang Discontinuity) and becoming E-W directed along the discontinuity, as was first reported by Nishimura et al. [22].
Our experimntal observations demostrate the Harang Discontinuity appearing as a finite width of discontinuity and occurring (1) in the zonal E×B drift and underlying E fields and aslo in the Poynting flux. We demostrate the disconinuity appearing between the electrojets/drifts/E fields reversing through a (2) clockwise rotation with our two dusk and two postmidnight scenarios or through an (3) anticlockwise rotation with our premidnight scenario. Meanwhile, the correlated auroral imageries depict (4) the N-S auroral arc following the dawn convection cell and becoming E-W directed along the discontinuity.
We note here that these new findings (1-4) are significant, since they contribute to the better understanding of the various features of the Harang region along with the underlying electromagnetic energy deposition estimated with the Poynting flux. These features include, as our scenarios demostrate, (i) the Harang Reversal of the clockwise or anticlockwise rotating zonal E×B drift and underlying meridional and radial E fields, where the earthward Poynting flux locally maximized. And also (ii) the Harang Discontinuity that was observed as an actual discontinuity appearing between the rotating E×B drift/E field vectors and also in the Poynting flux.
Author Contributions
Conceptualization, I.H..; methodology, I.H.; software, I.H. and B.C.L.; validation, I.H. and B.C.L.; formal analysis, I.H.; investigation, I.H..; resources, B.C.L.; data curation, I.H.; writing—original draft preparation, I.H..; writing—review and editing, B.C.L. and I.H.; visualization, I.H..; supervision, B.C.L.; project administration, B.C.L.; funding acquisition, B.C.L. All authors have read and agreed to the published version of the manuscript.
Funding
This research was funded by the United States Office of Naval Research, grant number N62909-23-1-2057.
Institutional Review Board Statement
Not applicable.
Informed Consent Statement
Not applicable.
Data Availability Statement
The DMSP data set can be accessed online through http://cedar.openmadrigal.org (accessed on 30 January 2025); The SSUSI auroral images can be accessed online through https://ssusi.jhuapl.edu/gal_AUR (accessed on 2 February 2025); The SuperDARN convection maps can be accessed online through http://vt.superdarn.org/plot/quickconvection (accessed on 9 February 2025); The AMPERE vector maps can be accessed online through https://ampere.jhuapl.edu/browse/ (accessed on 3 January 2025); The GOES data sets can be accessed online through https://cdaweb.gsfc.nasa.gov/cdaweb/istp_public/ (accessed on 19 February 2025); The IMF data AE and AL indices can be accessed online from the OMNI database through https://cdaweb.gsfc.nasa.gov/cdaweb/istp_public/ (accessed on 13 February 2025).
Acknowledgments
We gratefully acknowledge that this material is based upon research supported by the Unites States Office of Naval Research under award number N62909-23-1-2057. We also acknowledge the CEDAR Archival Madrigal Database for the DMSP data. The DMSP particle detectors were designed by Dave Hardy of Air Force Research Laboratory (AFRL). We also acknowledge the SSUSI images and the GOES data. We gratefully acknowledge the use of SuperDARN convection maps. SuperDARN is a collection of radars funded by national scientific funding agencies of Australia, Canada, China, France, Italy, Japan, Norway, South Africa, the United Kingdom, and the United States of America. We thank the AMPERE team and the AMPERE Science Data Center for providing data products derived from the Iridium Communications constellation, enabled by support from the National Science Foundation.
Conflicts of Interest
The authors declare no conflicts of interest.
Abbreviations
The following abbreviations are used in this manuscript:
| AMPERE | Active Magnetosphere and Planetary Electrodynamics Response Experiment |
| ASI | All Sky Imager |
| DMSP | Defense Meteorological Satellite Program |
| EEJ | Eastward Electrojet |
| E field | Electric field |
| ERAM | along-the-track ram Electric field |
| EVER | cross-track vertical or radial Electric field |
| E-W | East-West |
| FACs | Field-Aligned Currents |
| GOES | Geostationary Operational Environmental Satellites |
| HD | Harang Discontinuity |
| H-M | Heppner-Maynard |
| JH | Hall currents |
| JP | Pedersen currents |
| M-I | Magnetosphere-Ionosphere |
| MLT | Magnetic Local Time |
| N-S | North-South |
| R1 | Region 1 |
| R2 | Region 2 |
| S|| | Poynting Flux |
| SAID | Sub-Auroral Ion Drifts |
| SSUSI | Special Sensor Ultraviolet Spectrographic Imager |
| STEVE | Strong Thermal Emission Velocity Enhancement |
| SuperDARN | Super Dual Auroral Radar Network |
| VHOR | cross-track horizontal drift velocity |
| WEJ | Westward Electrojet |
References
- Heppner, J.P. The Harang discontinuity in auroral belt; Ionospheric currents. Geofys. Publ. 1972, 29, 105–120. [Google Scholar]
- Maynard, N.C. Electric field measurements across the Harang discontinuity. Journal of Geophysical Research 1974, 79, 4620–4631. [Google Scholar] [CrossRef]
- Harang, L. The mean field of disturbance of polar geomagnetic storms. Terrestrial Magnetism and Atmospheric Electricity 1946, 51, 353–380. [Google Scholar] [CrossRef]
- Rodger, A.S.; Cowley, S.W.H.; Brown, M.J.; Pinnock, M.; Simmons, D.A. Dawn-dusk (y) component of the interplanetary magnetic field and the local time of the Harang discontinuity. Planetary and Space Science 1984, 32, 1021–1027. [Google Scholar] [CrossRef]
- Kauristie, K.; Syrjäsuo, M.; Amm, O.; Viljanen, A.; Pulkkinen, T.; Opgenoorth, H. A statistical study of evening sector arcs and electrojets. Advances in Space Research 2001, 28, 1605–1610. [Google Scholar] [CrossRef]
- Dungey, J.W. Interplanetary magnetic field and the auroral zones. Physical Review Letters 1961, 6, 47–48. [Google Scholar] [CrossRef]
- Heppner, J.P. Empirical models of high-latitude electric fields. Journal of Geophysical Research 1977, 82, 1115–1125. [Google Scholar] [CrossRef]
- Kamide, Y. On current continuity at the Harang discontinuity. Planetary and Space Science 1978, 26, 237–244. [Google Scholar] [CrossRef]
- Madsen, M.M.; Iversen, I.B.; D’Angelo, N. Measurements of high-latitude ionospheric electric fields by means of balloon-borne sensors. Journal of Geophysical Research 1976, 81, 3821–3824. [Google Scholar] [CrossRef]
- Koskinen, H.E.J.; Pulkkinen, T.I. Midnight velocity shear zone and the concept of Harang discontinuity. Journal of Geophysical Research 1995, 100, 9539–9547. [Google Scholar] [CrossRef]
- Erickson, G.M.; Spiro, R.W.; Wolf, R.A. The physics of the Harang discontinuity. Journal of Geophysical Research 1991, 96, 1633–1645. [Google Scholar] [CrossRef]
- Lezniak, T.; Winckler, J. Experimental study of magnetospheric motions and the acceleration of energetic electrons during substorms. Journal of Geophysical Research 1970, 75, 7075–7098. [Google Scholar] [CrossRef]
- Akasofu, S.-I. The development of the auroral substorm. Planetary and Space Science 1964, 12, 273–282. [Google Scholar] [CrossRef]
- Lyons, L.R.; Zesta, E.; Samson, J.C.; Reeves, G.D. Auroral disturbances during the January 10, 1997 magnetic storm. Geophysical Research Letters 2000, 27, 3237–3240. [Google Scholar] [CrossRef]
- Lyons, L.R.; Nagai, T.; Blanchard, G.T.; Samson, J.C.; Yamamoto, T.; Mukai, T.; Nishida, A.; Kokubun, S. Association between Geotail plasma flows and auroral poleward boundary intensifications observed by CANOPUS photometers. Journal of Geophysical Research 1999, 104, 4485–4500. [Google Scholar] [CrossRef]
- Sergeev, V.A.; Sauvaud, J.-A.; Popescu, D.; Kovrazhkin, R.A.; Liou, K.; Newell, P.T.; Brittnacher, M.; Parks, G.; Nakamura, R.; Mukai, T.; et al. Multiple-spacecraft observation of a narrow transient plasma jet in the Earth’s plasma sheet. Geophysical Research Letters 2000, 27, 851–854. [Google Scholar] [CrossRef]
- Nakamura, R.; Baumjohann, W.; Schödel, R.; Brittnacher, M.; Sergeev, V.A.; Kubyshkina, M.; Mukai, T.; Liou, K. Earthward flow bursts, auroral streamers, and small expansions. Journal of Geophysical Research 2001, 106, 10791–10802. [Google Scholar] [CrossRef]
- Zesta, E.; Lyons, L.; Wang, C.-P.; Donovan, E.; Frey, H.; Nagai, T. Auroral poleward boundary intensifications (PBIS): Their two-dimensional structure and associated dynamics in the plasma sheet. Journal of Geophysical Research 2006, 111, A05201. [Google Scholar] [CrossRef]
- Weygand, J.M.; McPherron, R.L.; Frey, H.; Amm, O.; Kauristie, K.; Viljanen, A.T.; Koistinen, A. Relation of substorm onset to Harang discontinuity. Journal of Geophysical Research 2008, 113, A04213. [Google Scholar] [CrossRef]
- Zou, S.; Lyons, L.R.; Nicolls, M.J.; Heinselman, C.J.; Mende, S.B. Nightside ionospheric electrodynamics associated with substorms: PFISR and THEMIS ASI observations. Journal of Geophysical Research: Space Physics 2009, 114, A12301. [Google Scholar] [CrossRef]
- Zou, S.; Lyons, L.R.; Wang, C.-P.; Boudouridis, A.; Ruohoniemi, J.M.; Anderson, P.C.; Dyson, P.L.; Devlin, J.C. On the coupling between the Harang reversal evolution and substorm dynamics: A synthesis of SuperDARN, DMSP, and IMAGE observations. Journal of Geophysical Research 2009, 114, A01205. [Google Scholar] [CrossRef]
- Nishimura, Y.; Lyons, L.; Zou, S.; Angelopoulos, V.; Mende, S. Substorm triggering by new plasma intrusion: THEMIS all-sky imager observations. Journal of Geophysical Research 2010, 115, A07222. [Google Scholar] [CrossRef]
- Horvath, I.; Lovell, B.C. Magnetosphere–Ionosphere Conjugate Harang Discontinuity and Sub-Auroral Polarization Streams (SAPS) Phenomena Observed by Multipoint Satellites. Atmosphere 2024, 15, 1462. [Google Scholar] [CrossRef]
- Lyons, L.R.; Lee, D.-Y.; Wang, C.-P.; Mende, S.B. Relation of substorm disturbances triggered by abrupt solar-wind changes to physics of plasma sheet transport, in International Conference on Substorms-8, ed. by M. Syrjasuo and E. Donovan, p. 165, Institute for Space Research, University of Calgary, 2006.
- Gkioulidou, M.; Wang, C.-P.; Lyons, L.R.; Wolf, R.A. Formation of the Harang reversal and its dependence on plasma sheet conditions: Rice convection model simulations. Journal of Geophysical Research 2009, 114, A07204. [Google Scholar] [CrossRef]
- Rich, F.J.; Hairston, M. Large-scale convection patterns observed by DMSP. Journal of Geophysical Research 1994, 99, 3–827. [Google Scholar] [CrossRef]
- Kilcommons, L.M.; Knipp, D.J.; Hairston, M.; Coley, W.R. DMSP Poynting flux: Data processing and inter-spacecraft comparisons. Journal of Geophysical Research: Space Physics 2022, 127, e2022JA030299. [Google Scholar] [CrossRef]
- Huang, C.Y.; Burke, W.J. Transient sheets of field-aligned current observed by DMSP during the main phase of a magnetic superstorm. Journal of Geophysical Research 2004, 109, A06303. [Google Scholar] [CrossRef]
- Huang, C.Y.; Su, Y.; Sutton, E.K.; Weimer, D.R.; Davidson, R.L. Energy coupling during the August 2011 magnetic storm. Journal of Geophysical Research: Space Physics 2014, 119, 1219–1232. [Google Scholar] [CrossRef]
- Paxton, L.J.; Meng, C.I.; Fountain, G.H.; Ogorzalek, B.S.; Darlington, E.H.; Goldsten, J.; Kusnierkiewicz, D.Y.; Lee, S.C.; Linstrom, L.A.; Maynard, J.J.; et al. Special Sensor UV Spectrographic Imager (SSUSI): An instrument description. Instrumentation for Planetary and Terrestrial Atmospheric Remote Sensing, SPIE, 1992, 1745, 2–16. [CrossRef]
- Paxton, L.J.; Morrison, D.; Zhang, Y.; Kil, H.; Wolven, B.; Ogorzalek, B.S.; Humm, D.C.; Meng, C.-I. Validation of remote sensing products produced by the Special Sensor Ultraviolet Scanning Imager (SSUSI): A far UV-imaging spectrograph on DMSP F-16. Proceedings 2002, 4485, Optical Spectroscopic Techniques, Remote Sensing, and Instrumentation for Atmospheric and Space Research IV, (30 January 2002). [CrossRef]
- Anderson, B.J.; Korth, H.; Waters, C.L.; Green, D.L.; Merkin, V.G.; Barnes, R.J.; Dyrud, L.P. Development of large-scale birkeland currents determined from the active magnetosphere and planetary electrodynamics response experiment. Geophysical Research Letters 2014, 41, 3017–3025. [Google Scholar] [CrossRef]
- Anderson, B.J.; Olson, C.N.; Korth, H.; Barnes, R.J.; Waters, C.L.; Vines, S.K. Temporal and spatial development of global Birkeland currents. Journal of Geophysical Research: Space Physics 2018, 123, 4785–4808. [Google Scholar] [CrossRef]
- Greenwald, R.A.; Bristow, W.A.; Sofko, G.J.; Senior, C.; Cerisier, J.C.; Szabo, A. Super dual auroral radar network radar imaging of dayside high-latitude convection under northward interplanetary magnetic field: Toward resolving the distorted two-cell versus multicell controversy. Journal of Geophysical Research 1995, 100, 19661–19674. [Google Scholar] [CrossRef]
- Chisham, G.; Lester, M.; Milan, S.E.; Freeman, M.P.; Bristow, W.A.; Grocott, A.; McWilliams, K.A.; Ruohoniemi, J.M.; Yeoman, T.K.; Dyson, P.L.; et al. A decade of the Super Dual Auroral Radar Network (SuperDARN): Scientific achievements, new techniques and future directions. Surveys in Geophysics 2007, 28, 33–109. [Google Scholar] [CrossRef]
- Nishitani, N.; Ruohoniemi, J.M.; Lester, M.; Baker, J.B.H.; Koustov, A.V.; Shepherd, S.G.; Chisham, G.; Hori, T.; Thomas, E.G.; Makarevich, R.A.; et al. Review of the accomplishments of mid-latitude Super Dual Auroral Radar Network (SuperDARN) HF radars. Progress in Earth and Planetary Science 2019, 6, 27. [Google Scholar] [CrossRef]
- Heppner, J.P.; Maynard, N.C. Empirical high-latitude electric field models. Journal of Geophysical Research 1987, 92, 4467–4489. [Google Scholar] [CrossRef]
- Walach, M.-T.; Grocott, A.; Thomas, E.G.; Staples, F. Dusk-Dawn Asymmetries in SuperDARN Convection Maps. Journal of Geophysical Research: Space Physics 2022, 127, e2022JA030906. [Google Scholar] [CrossRef] [PubMed]
- Imber, S.M.; Milan, S.E.; Lester, M. The Heppner-Maynard Boundary measured by SuperDARN as a proxy for the latitude of the auroral oval. Journal of Geophysical Research: Space Physics 2013, 118, 685–697. [Google Scholar] [CrossRef]
- Kleimenova, N.G.; Gromova, L.I.; Gromov, S.V.; Malysheva, L.M.; Despirak, I.V. ‘Polar’ Substorms and the Harang Discontinuity. Geomagnetism and Aeronomy 2024, 64, 490–499. [Google Scholar] [CrossRef]
- Svaldi, V.; Matsuo, T.; Kilcommons, L.; Gallardo-Lacourt, B. (). High-latitude ionospheric electrodynamics during STEVE and non-STEVE substorm events. Journal of Geophysical Research: Space Physics 2023, 128, e2022JA030277. [Google Scholar] [CrossRef]
- Nishimura, Y.; Yang, J.; Weygand, J.M.; Wang, W.; Kosar, B.; Donovan, E.F.; Angelopoulos, V.; Paxton, L.J.; Nishitani, N. Magnetospheric conditions for STEVE and SAID: Particle injection, substorm surge, and field-aligned currents. Journal of Geophysical Research: Space Physics 2020, 125, e2020JA027782. [Google Scholar] [CrossRef]
- Akasofu, S.-I. Where is the magnetic energy for the expansion phase of auroral substorms accumulated? 2. The main body, not the magnetotail. Journal of Geophysical Research Space Physics 2017, 122, 8479–8487. [Google Scholar] [CrossRef]
- Sinevich, A.; Chernyshov, A.; Chugunin, D.; Clausen, L.B.N.; Miloch, W.J.; Mogilevsky, M.M. Stratified subauroral ion drift (SSAID). Stratified subauroral ion drift (SSAID). Journal of Geophysical Research: Space Physics 2023, 128, e2022JA031109. [Google Scholar] [CrossRef]
- Kotova, D.S.; Sinevich, A.A.; Chernyshov, A.A.; Chugunin, D.V.; Jin, Y.; Miloch, W.J. Strong turbulent flow in the subauroral region in the Antarctic can deteriorate satellite-based navigation signals. Scientific Reports 2025, 15, 3458. [Google Scholar] [CrossRef]
- MacDonald, E.A.; Donovan, E.; Nishimura, Y.; Case, N.A.; Gillies, D.M.; Gallardo-Lacourt, B.; Archer, W.E.; Spanswick, E.L.; Bourassa, N.; Connors, M.; et al. New science in plain sight: Citizen scientists lead to the discovery of optical structure in the upper atmosphere. Science Advances 2018, 4, eaaq0030. [Google Scholar] [CrossRef]
- Gallardo-Lacourt, B.; Nishimura, Y.; Donovan, E.; Gillies, D.M.; Perry, G.W.; Archer, W.E.; Nava, O.A.; Spanswick, E.L. A Statistical analysis of STEVE. Journal of Geophysical Research Space Physics 2018, 123, 9893–9905. [Google Scholar] [CrossRef]
- Gillies, D.M.; Liang, J.; Gallardo-Lacourt, B.; Donovan, E. New insight into the transition from a SAR arc to STEVE. Geophysical Research Letters 2023, 50, e2022GL101205. [Google Scholar] [CrossRef]
- Anderson, P.C.; Heelis, R.A.; Hanson, W.B. The ionospheric signatures of rapid subauroral ion drifts. Journal of Geophysical Research 1991, 96, 5–785. [Google Scholar] [CrossRef]
- Galperin, Y.L.; Ponomarev, V.N.; Zosimova, A.G. Plasma convection in the polar ionosphere. Annales de Geophysique 1974, 30, 1–7. [Google Scholar]
- Mishin, E.V. Interaction of substorm injections with the subauroral geospace: 1. Multispacecraft observations of SAID. Journal of Geophysical Research: Space Physics 2013, 118, 5782–5796. [Google Scholar] [CrossRef]
- Mishin, E.; Streltsov, A. On the kinetic theory of subauroral arcs. Journal of Geophysical Research: Space Physics 2022, 127, e2022JA030667. [Google Scholar] [CrossRef]
- Mishin, E.; Streltsov, A. The inner structure of STEVE-linked SAID. Geophysical Research Letters 2023, 50, e2023GL102956. [Google Scholar] [CrossRef]
- Mishin, E.V.; Streltsov, A.V. Toward the unified theory of SAID-linked subauroral arcs. Journal of Geophysical Research: Space Physics 2024, 129, e2023JA032196. [Google Scholar] [CrossRef]
- Sinevich, A.A.; Chernyshov, A.A.; Chugunin, D.V.; Klimenko, M.V.; Panchenko, V.A.; Yakimova, G.A.; Timchenko, A.V.; Miloch, W.J.; Mogilevsky, M.M. Multi-instrument approach to study polarization jet/SAID and STEVE. Journal of Geophysical Research: Space Physics 2024, 129, e2024JA033222. [Google Scholar] [CrossRef]
- Ma, R.; Xu, J.; Wang, W.; Lei, J.; Liu, H.-L.; Maute, A.; Hagan, M.E. Variations of the nighttime thermospheric mass density at low and middle latitudes. Journal of Geophysical Research 2010, 115, 301–324. [Google Scholar] [CrossRef]
Figure 1.
(a) The schematic diagram depicts the two-cell polar convection pattern along with the underlying E fields and currents. The Harang region (shaded in yellow) appears in the midnight MLT sector of the auroral zone. Between the two convection cells, the Harang Discontinuity (HD, in red) appears as a convection flow discontinuity. (b) The schematic diagram illustrates the meridional E field’s clockwise rotation, from poleward to equatorward. Here, the Harang Discontinuity (shaded in yellow) appears as a meridional E field discontinuity, where the azimuthal E field locally increases.
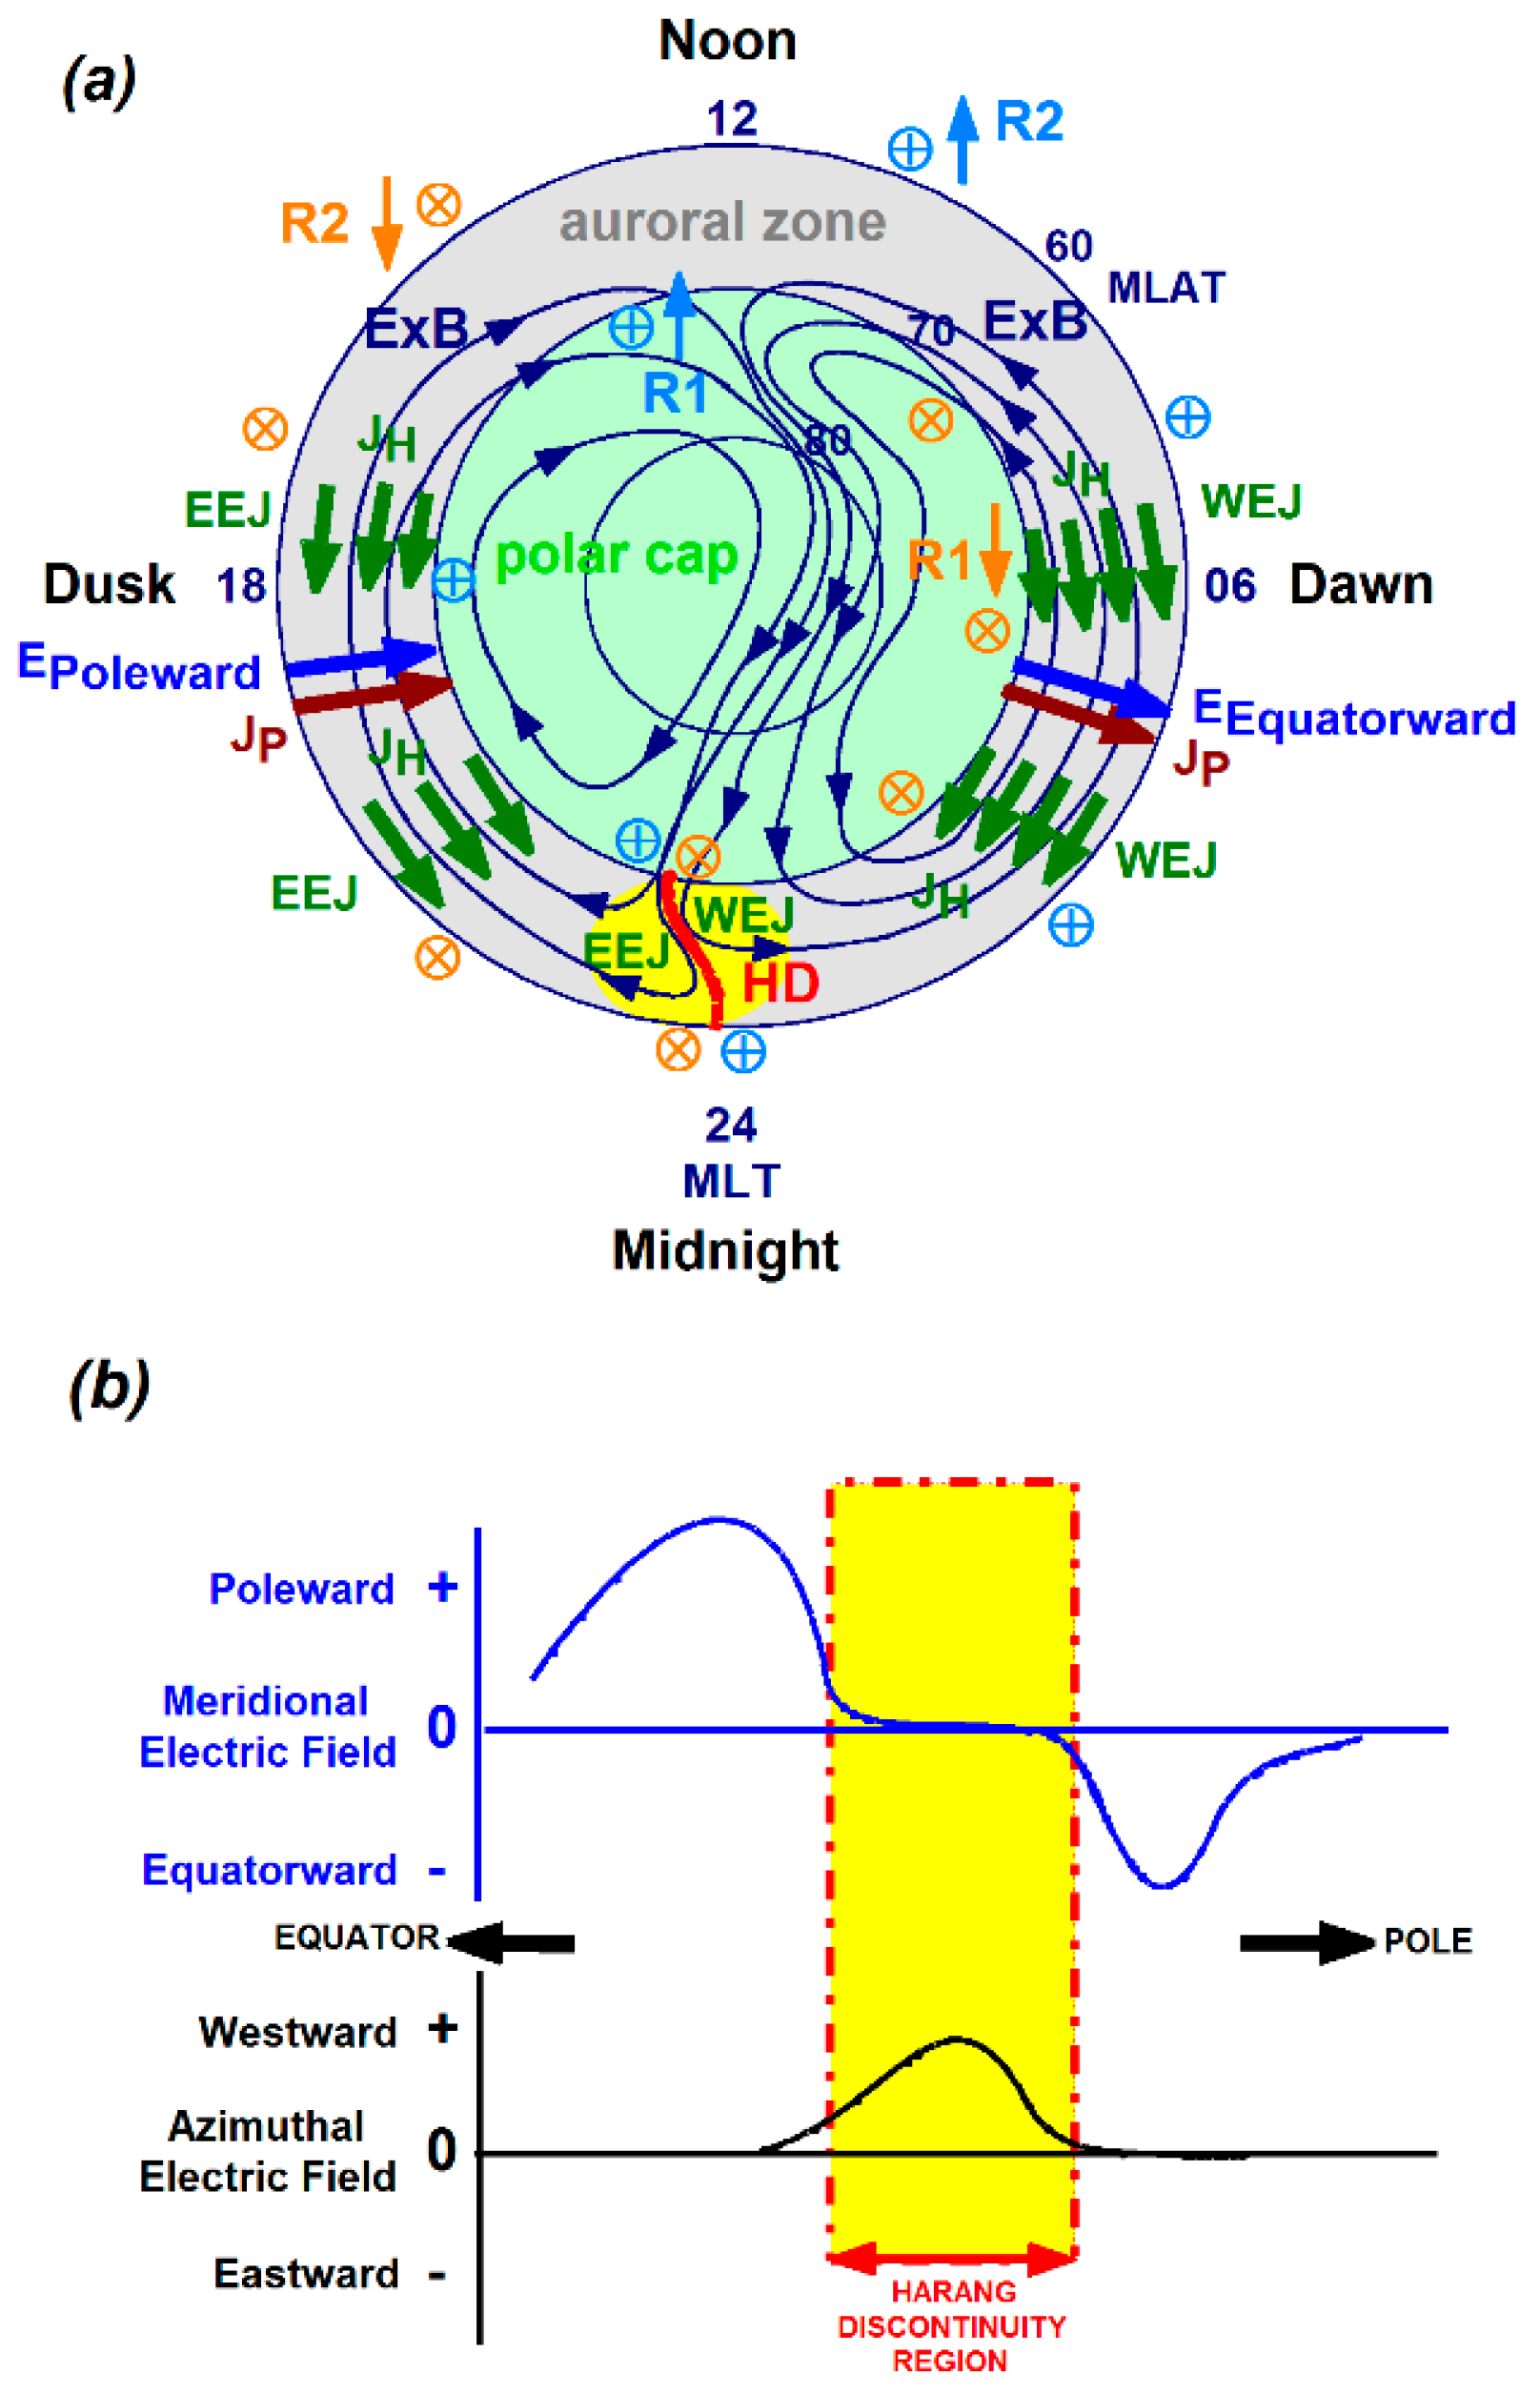
Figure 2.
The four sets of plots are constructed the four events investigated and depits the underlying interplanetary and geomagnetic conditions, during which the Haramg scenario (marked as symbol dot in green; shaded inetrval in yellow) occurred.
Figure 2.
The four sets of plots are constructed the four events investigated and depits the underlying interplanetary and geomagnetic conditions, during which the Haramg scenario (marked as symbol dot in green; shaded inetrval in yellow) occurred.
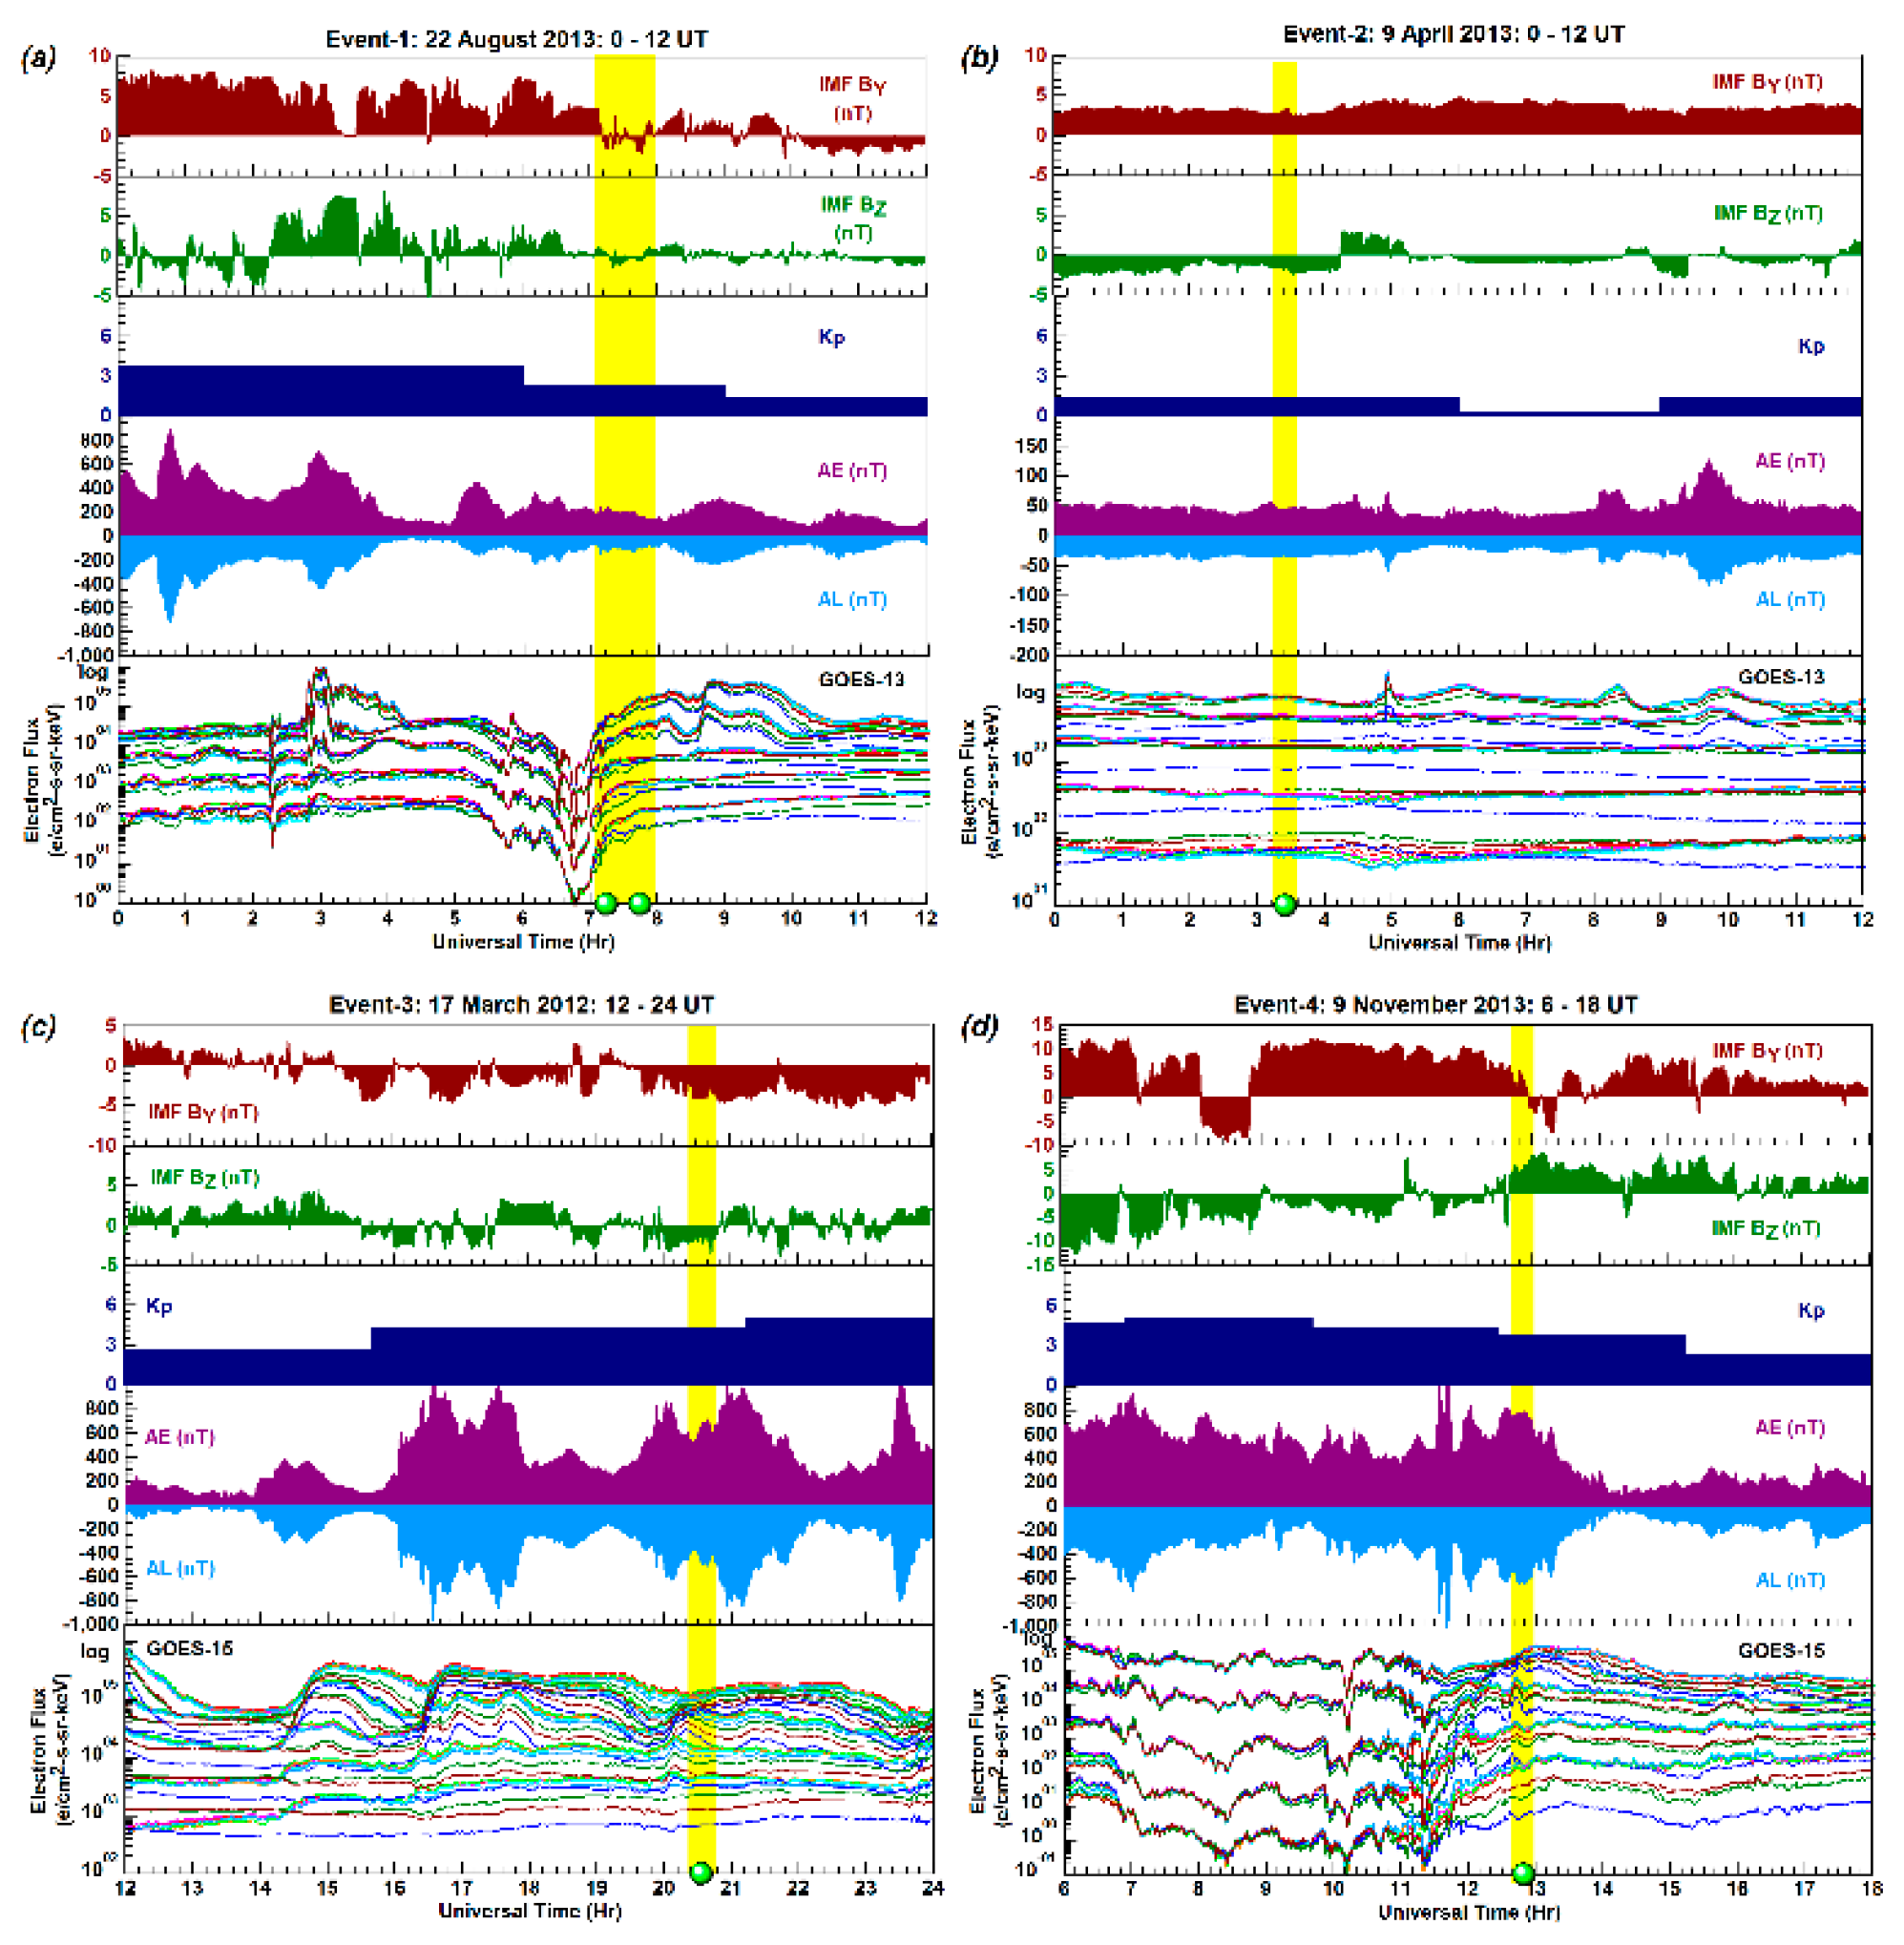
Figure 3.
In the first scenario of Event-1, DMSP F17 observed (near magnetic midnight) the Harang region characterized by both the electrojet/drift/E field rotation in the clockwise direction and the discontinuity. The N-S auroral arc appeared and, by following the discontinuity, became E-W directed.
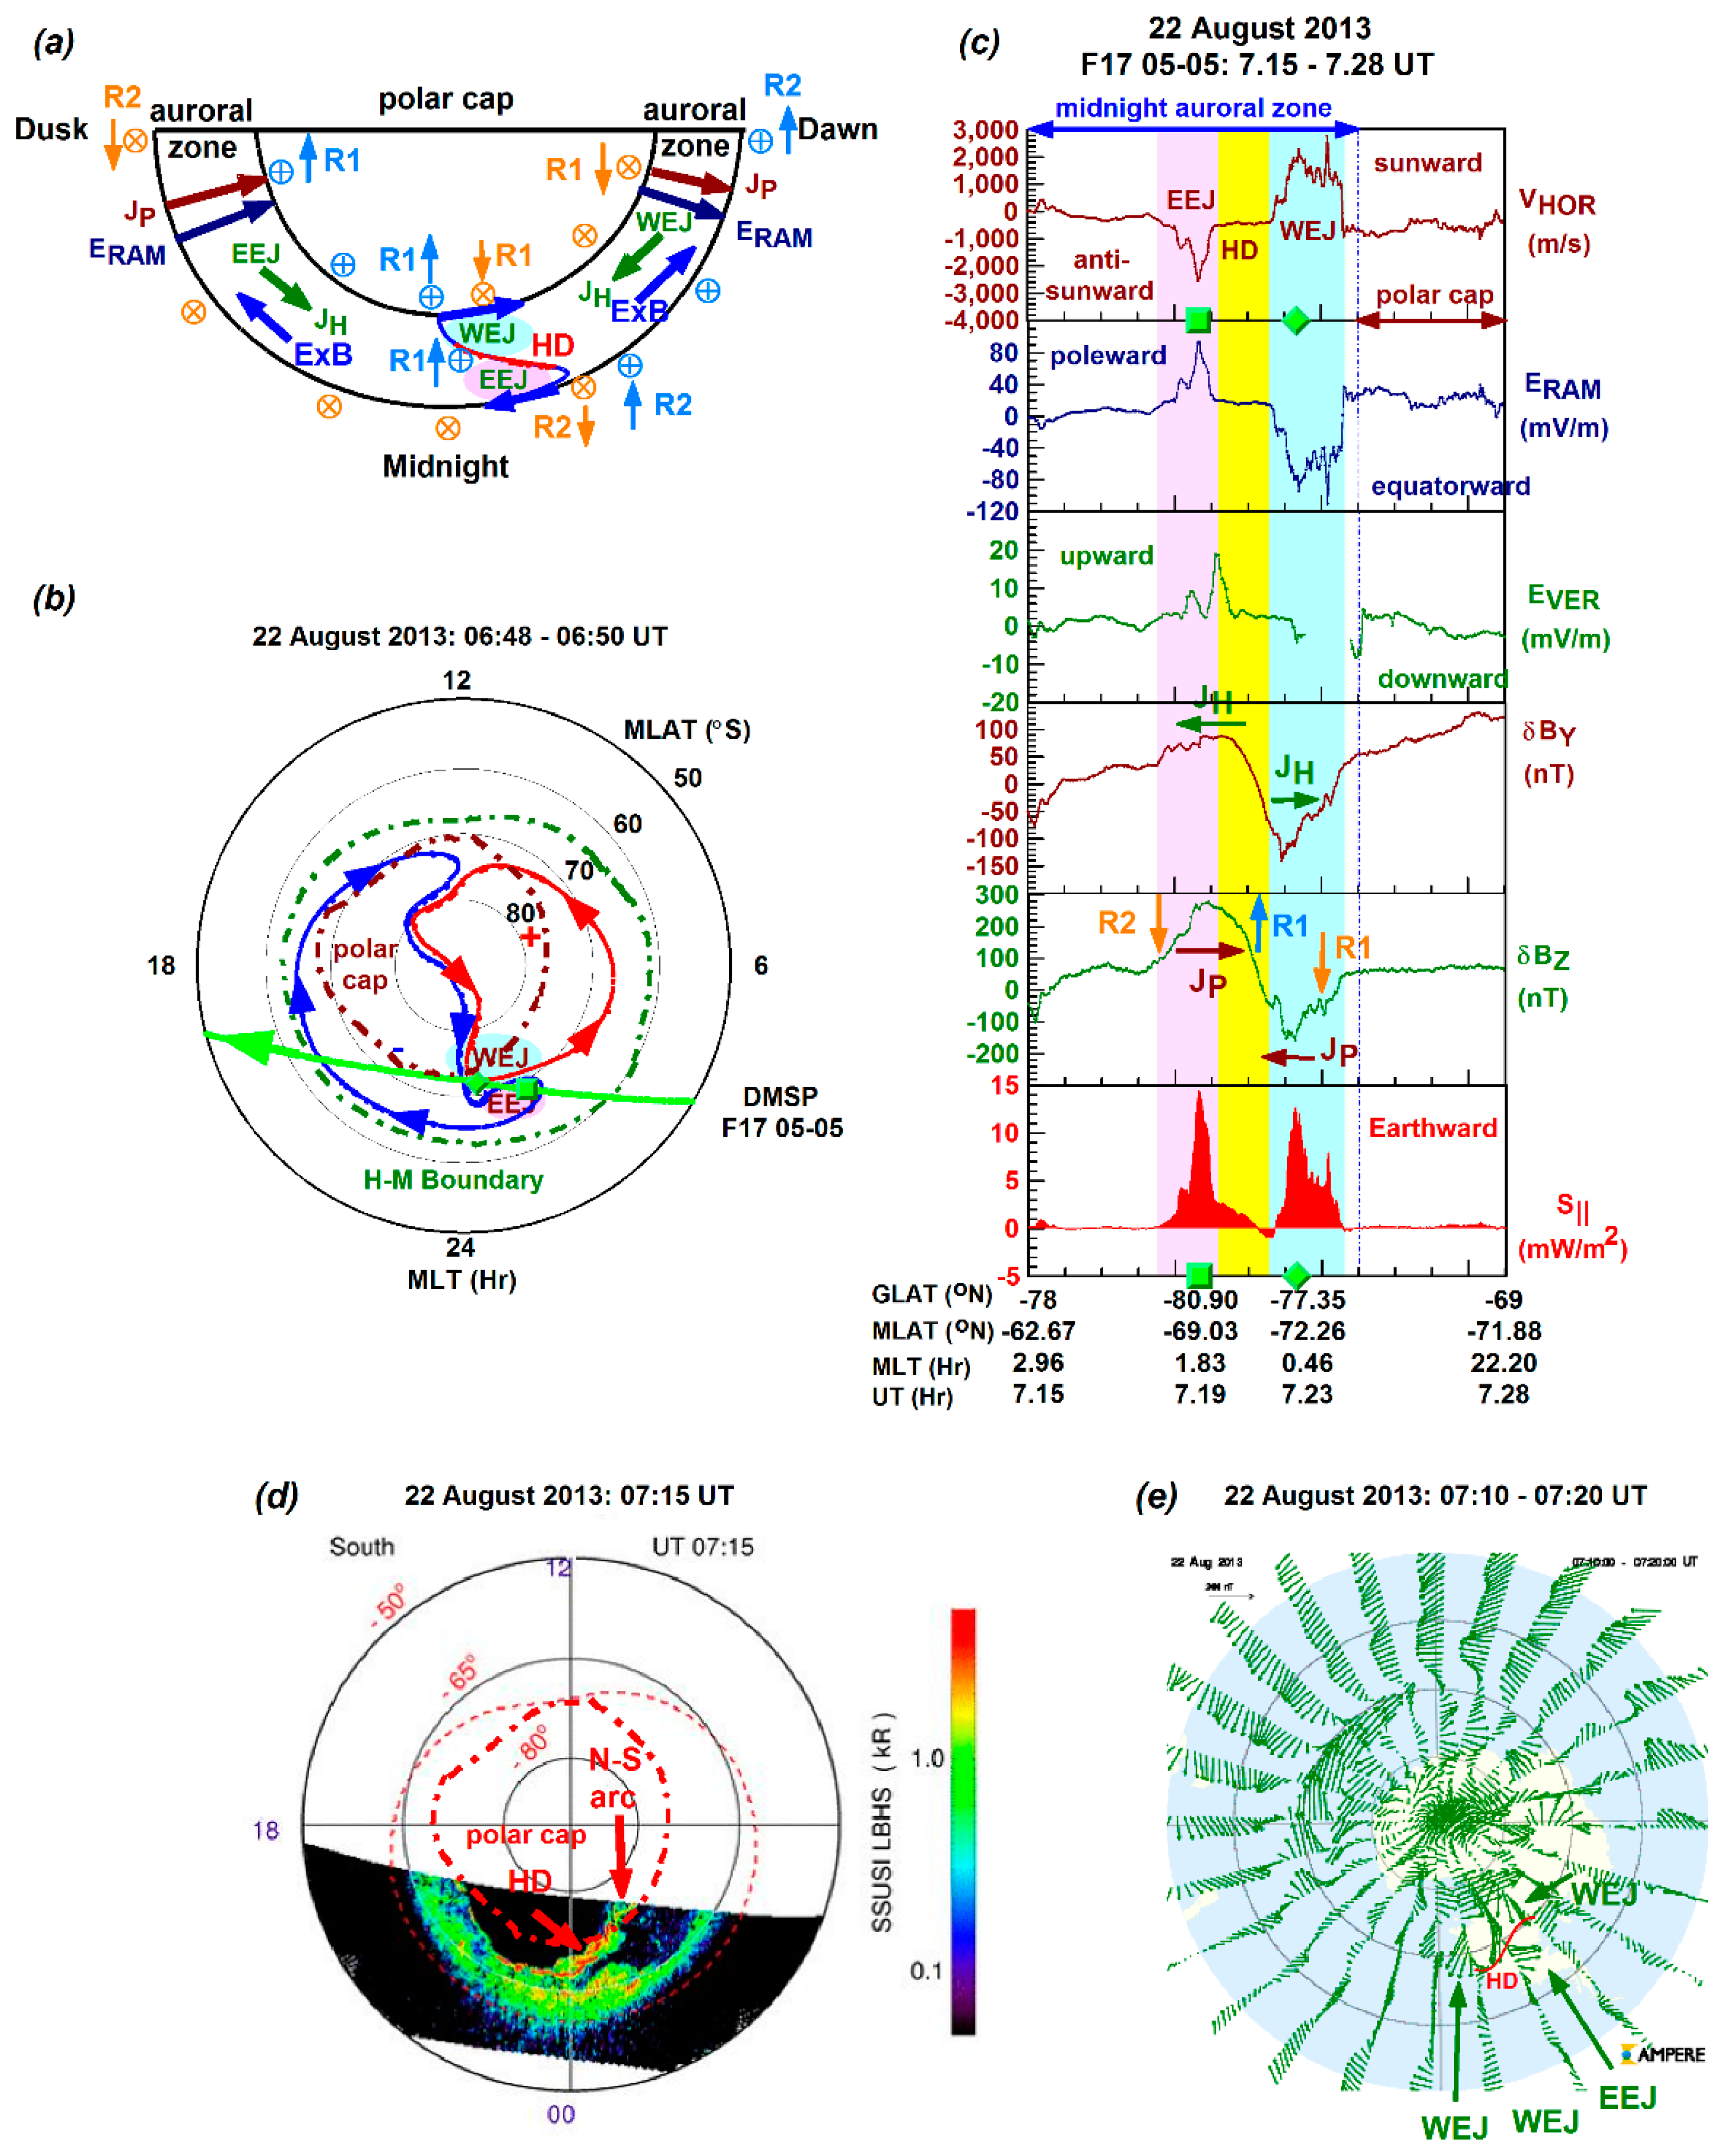
Figure 4.
In the second scenario of Event-1, two DMSP satellites (F16 and F18) observed (in the postmidnight MLT sector) the Harang region characterized by both the electrojet/drift/E field rotation in the clockwise direction and the discontinuity. Then, the N-S auroral arc was still present and, by following the discontinuity, became E-W directed.
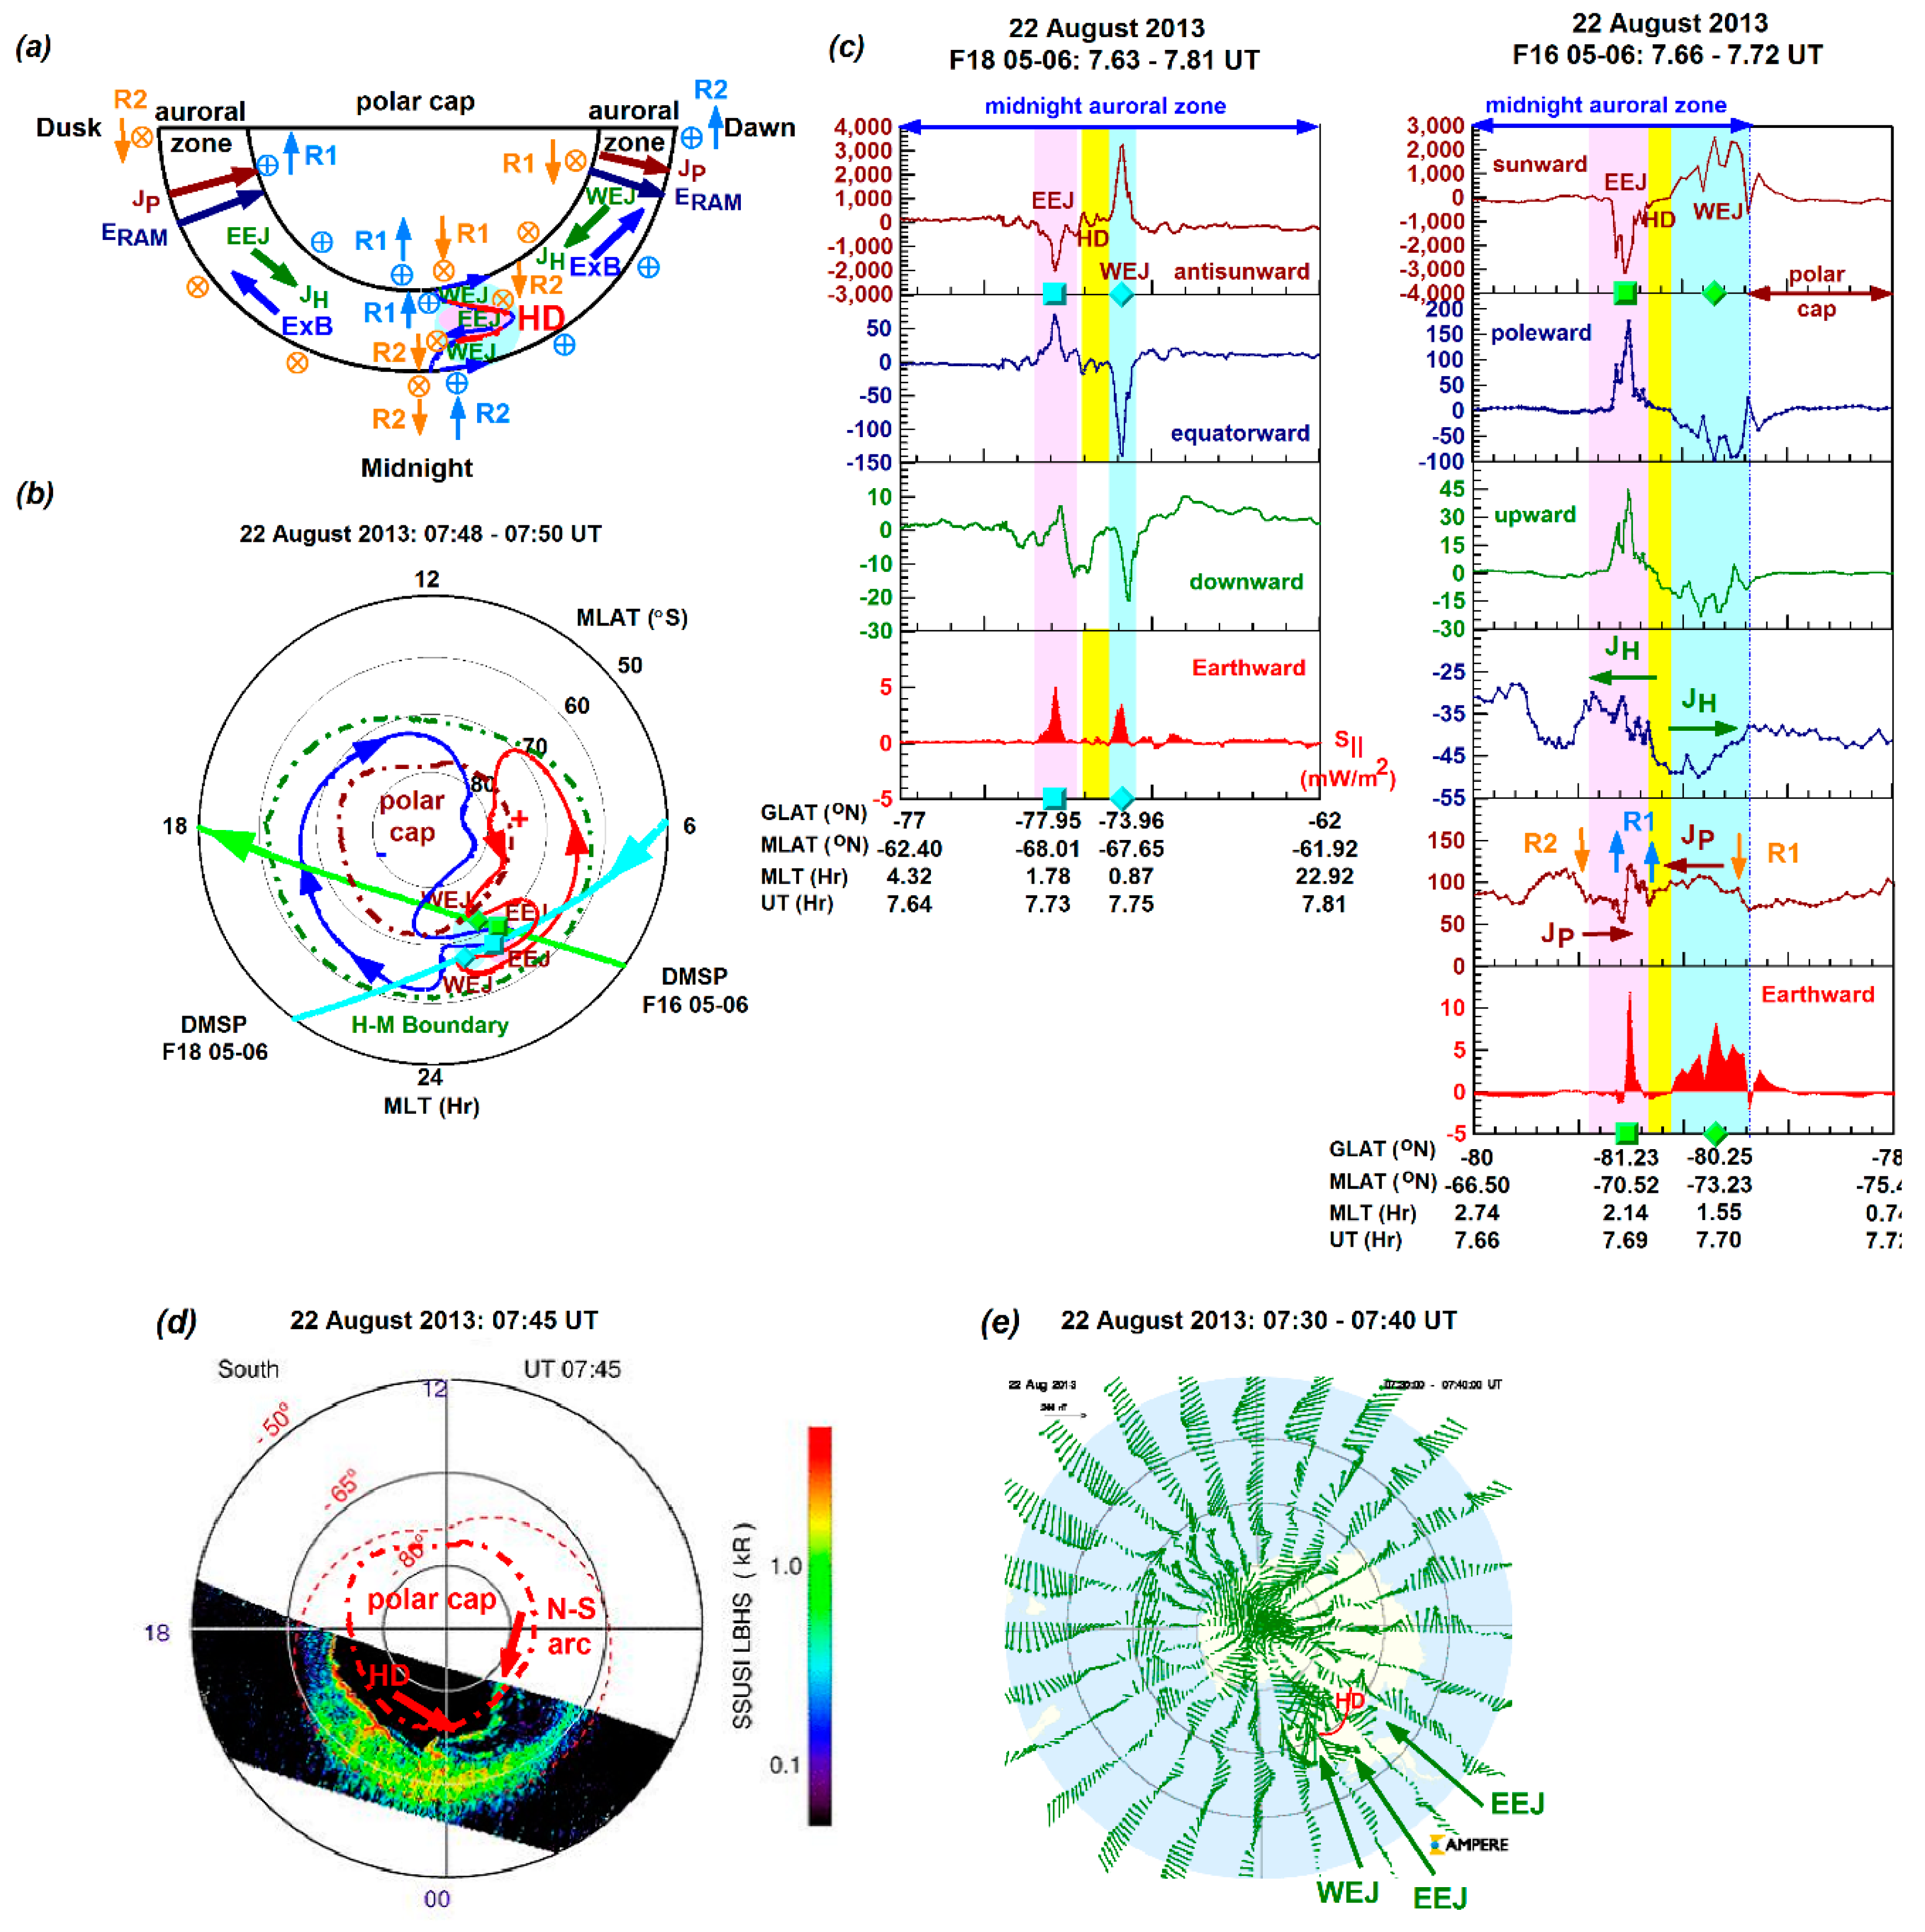
Figure 5.
In Event-2, the F15 satellite observed (in the evening MLT sector) the Harang region characterized by both the electrojet/drift/E field rotation in the anticlockwise direction and the discontinuity. Then, the N-S arc was still present and, by following the discontinuity, became E-W directed.
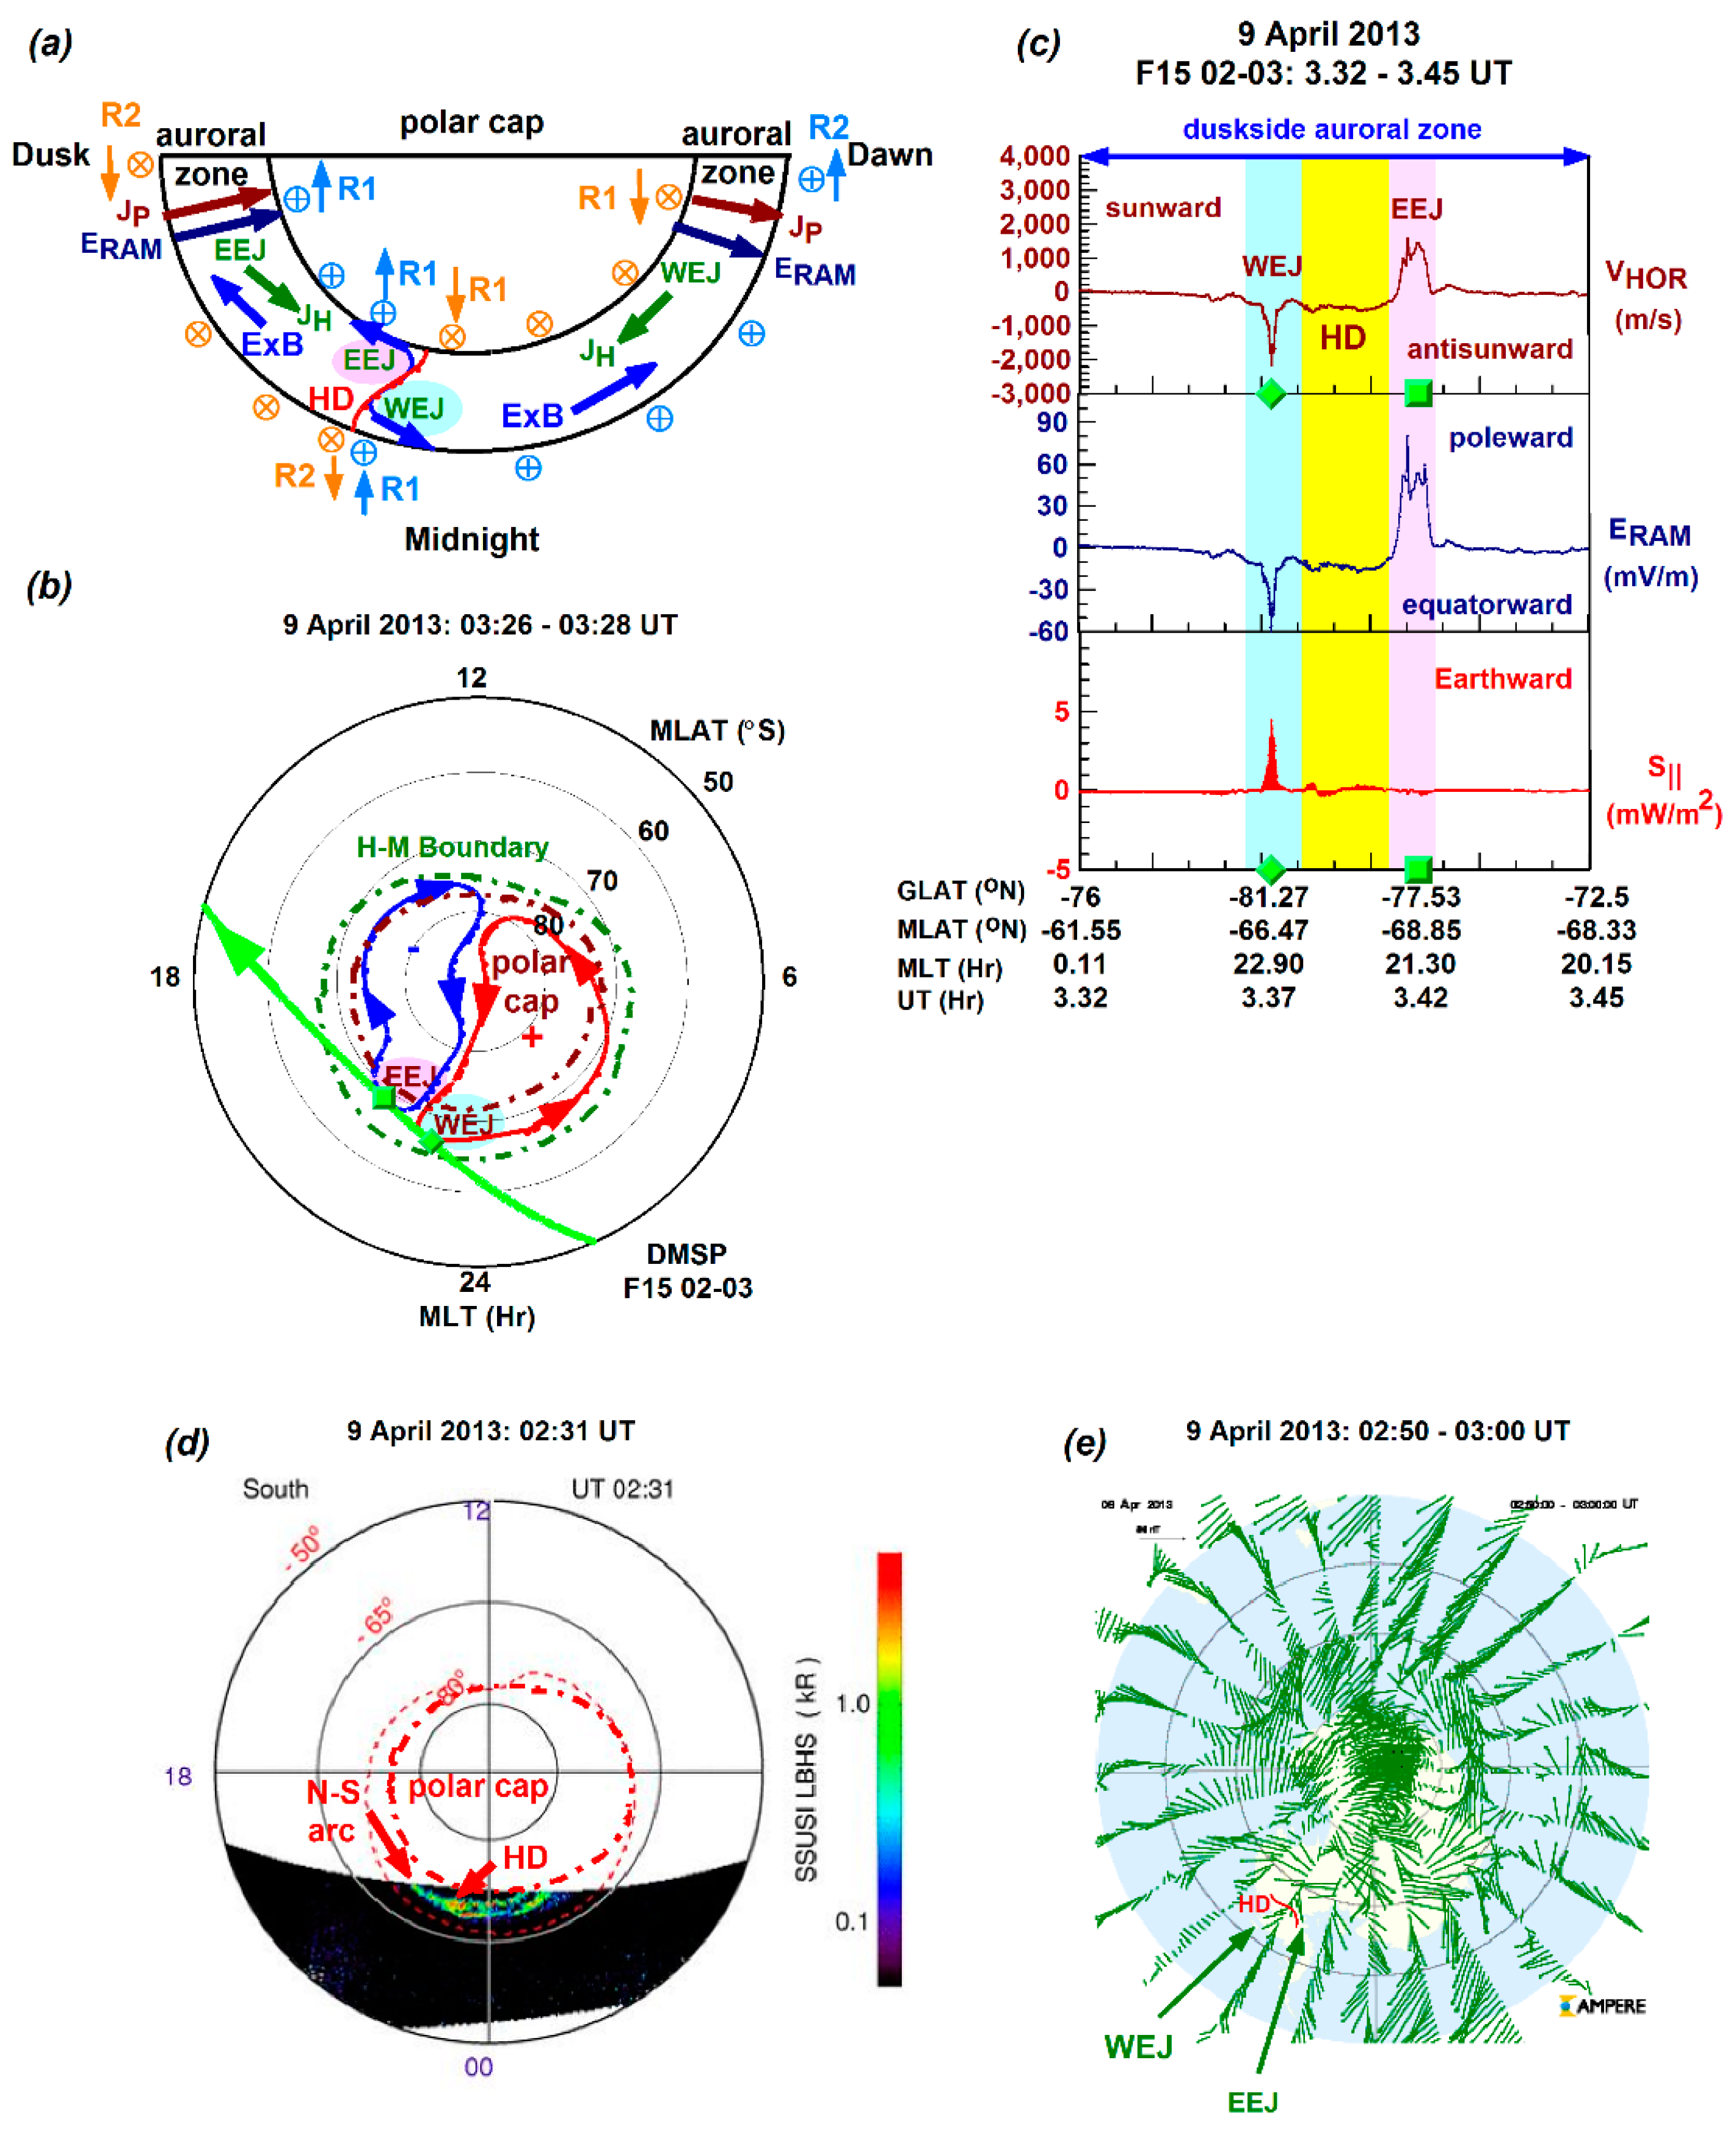
Figure 6.
In Event-3, the F17 satellite observed in the 18 MLT sector, which was reached by the westward substorm surge, the Harang region characterized by both the electrojet/drift/E field rotation in the clockwise direction and the discontinuity. Then, the N-S auroral arc became E-W directed by following the discontinuity.
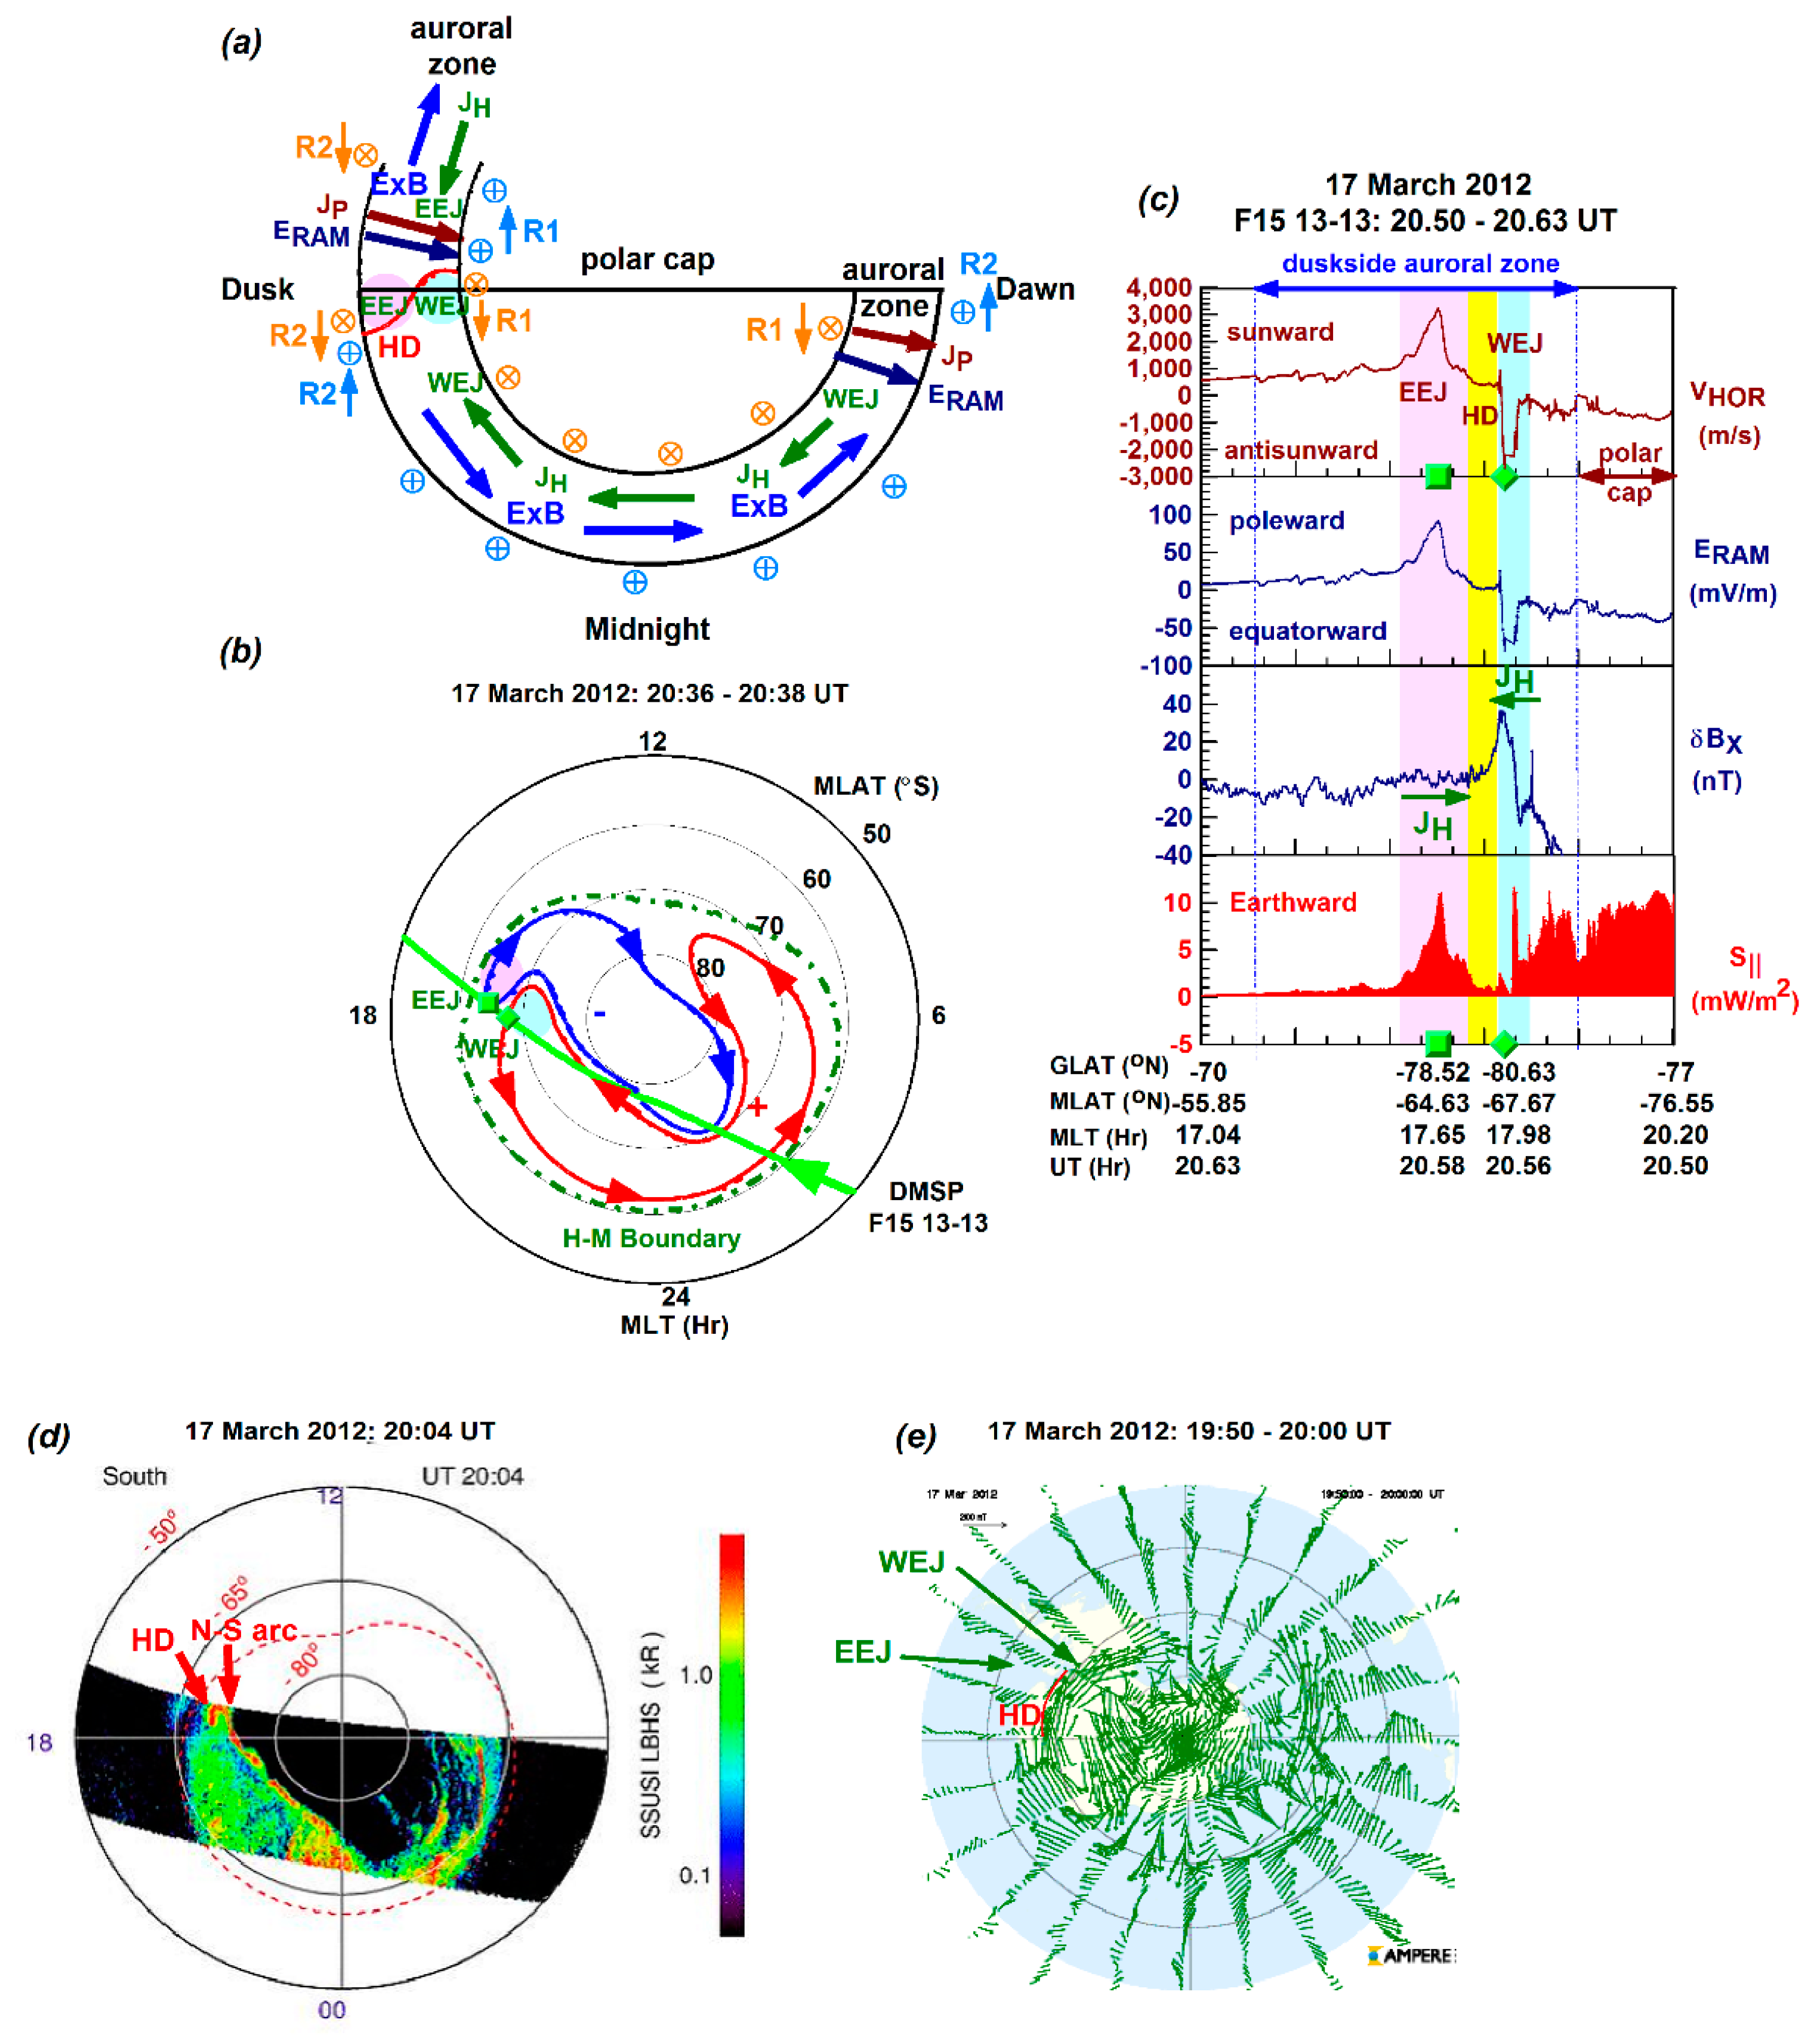
Figure 7.
In Event-4, the F17 satellite observed in the 18 MLT sector the Harang region characterized by both the electrojet/drift/E field rotation in the clockwise direction and the discontinuity. Then, the N-S auroral arc became E-W directed by following the discontinuity.
Figure 7.
In Event-4, the F17 satellite observed in the 18 MLT sector the Harang region characterized by both the electrojet/drift/E field rotation in the clockwise direction and the discontinuity. Then, the N-S auroral arc became E-W directed by following the discontinuity.

Disclaimer/Publisher’s Note: The statements, opinions and data contained in all publications are solely those of the individual author(s) and contributor(s) and not of MDPI and/or the editor(s). MDPI and/or the editor(s) disclaim responsibility for any injury to people or property resulting from any ideas, methods, instructions or products referred to in the content. |
© 2025 by the authors. Licensee MDPI, Basel, Switzerland. This article is an open access article distributed under the terms and conditions of the Creative Commons Attribution (CC BY) license (http://creativecommons.org/licenses/by/4.0/).
Copyright: This open access article is published under a Creative Commons CC BY 4.0 license, which permit the free download, distribution, and reuse, provided that the author and preprint are cited in any reuse.


