
Submitted:
22 March 2025
Posted:
24 March 2025
You are already at the latest version
Abstract
Background: Both depression and emesis (nausea and vomiting) are commonly seen during pregnancy. The two often coexist but their symptomatic structure and causal relationships remain unclear. Aim: To identify a clinical cluster with depression and emesis together among pregnant women. Methods: Using two independent follow-up data (Study 1 with women of 10 to 13 weeks of gestation [N = initially 382 and follow-up 129] and Study 2 with women of 12 to 15 weeks of gestation [N = initially 696 and follow-up 245]) sets of pregnant women, we measured depressed mood, loss of interest and three emesis symptoms (nausea, vomiting, and retching). The samples were re-examined with an interval. Results: The 5 symptoms were substantially correlated with each other at each time point and factor analyses identified two factors reflecting depression and emesis. However, depression and emesis were associated with clinical correlates in a very similar manner. Two-step cluster analysis yielded only two clusters: one with and another without depression and emesis simultaneously. Taxometrics indicated dimensionality rather than taxonicity. Conclusion: Findings suggest that emesis and depression during pregnancy are two discrete aspects of a single clinical phenomenon that we propose to name emesis-depression complex.
Keywords:
emersis
; japanese pregnant women
; antenatal depression
; observation survey
1. Introduction
Pregnancy is not a period immune to psychological maladjustment. One of such maladjustment is depression during pregnancy. This is also known as antenatal (prepartum) depression. Incidence of major depressive episode is about 5% [1] and, if including minor depressions, the incidence of antenatal depression was reported as high as 16% [2]. Many psychosocial correlates were found to be associated with antenatal depression [3]. Clinical manifestations of antenatal depression are similar to those of depressions observed in non-pregnancy-related situations. However, one of the specific features of antenatal depression is nausea [2].
Nausea and vomiting related to pregnancy (NVP) are termed emesis. Emesis is very frequently observed among pregnant women. Its prevalence is about 80% [4]. If accompanied by dehydration, ketonuria, and more than 5% body weight loss, emesis is called hyperemesis gravidarum (HG). The prevalence of HG is 2 to 4% [5]. Clinical definition of HG does not seem to have reached a consensus. Koot et al. [6] reviewed all the randomised controlled trials of HG (definition by researchers) and examined the definition of HG. They identified 34 reports. The items used for the definition were vomiting (100%), nausea (88%), ketonuria or acidosis (56%), need for hospitalisation (50%), weight loss (26%), dehydration (21%), electrolyte disturbances (15%), and inability to tolerate oral food/water intake (12%). This suggests lack of consensus on the definition of HG. Whether individual differences should be understood as differences of degree or of the kind is one of our interests. We are not aware of any taxometric studies about HG. We therefore think fair to consider emesis/HG dimensional.
Majority of pregnant women reported negative psychosocial changes due to emesis or HG [7,8]. Emesis or HG is often accompanied by depression [9,10,11,12,13], anxiety [13], tokophoia [7], or higher emotional distress [14]. Emesis/HG are often preceded or followed by history of mental illnesses. Past history of depression is higher among women with HG [5,15]. Women with HG are likely to have posttraumatic stress disorder or symptoms after childbirth [16,17,18] as well as postnatal depression [19,20].
Although there have been pieces of evidence suggesting an association between antenatal depression and emesis/HG, what remains to be studied is the relationship between antenatal depression and emesis/HG. There are at least three possibilities where two phenomena coexist. Firstly, one is resulted from another. Two are discrete and one of them is the cause of another. Secondly, the two phenomena are caused by a third variable. The third variable confounds the spurious association of the two phenomena. Finally, the two are aspects of a single construct. The two reflect different aspects of the same phenomenon. A main purpose of our report is to clarify the relationships between often coexisting antenatal depression and emesis/HG.
In our previous report, we distributed the the Japanese version [21,22] of the Patient Health Questionnaire-9 (PHQ-9: [23]) to 382 women in the first trimester [24]. Factor analyses of the PHQ-9 items releaved two factors: one with somatic symptoms (e.g., sleep change, appetite change, and fatigue) and another with non-somatic symptoms (e.g., depressed feeling and loss of interest). We then entered these two PHQ-9 subscale scores into a 2-step cluster analysis, yielding 3 clusters. Cluster 3 scored highly in the scores of the two PHQ-9 subscales and the two emesis scales. We thought that this was antenatal depression cluster. We were interested in ech PHQ-9 item’s capacity to identify this cluster. In the receiver operating characteristics (ROC) analysis, five items showed an area under curve (AUC) > .80. In the graded response model (GRM) 4 items were with high information and particularly two items (loss of interest, and depressed mood) showed apparently the highest information. We thought that these two items were core symptoms of antenatal depression and that antenatal depression was highly accompanied by nausea and vomiting. Hence, we think that antenatal depression and emesis are two discrete but to some extent related aspects of a single clinical phenomenon which we tentatively call emesis-depression complex. However, this study need further validation.
In order to provide supports for our proposal, we must present (a) depression and emesis are substantially correlated with one another among expectant women, (b) there is a single cluster of depression and emesis though depression and emesis construct two factors, (c) the two factors (depression and emesis) are associated almost equally with other variables that are reported to be linked to depression or emesis, and (d) when longitudinally followed up, depression at Time 1 does not predict the increase of emesis at Time 2 and vice versa.
Regarding external correlates, we hypothesised that both depression and emesis would be associated with disabilities in social functioning to a similar extent. Because infant bonding disorders are related to both depression and emesis [19], we hypothesise that both antenatal depression and emesis will be related to foetal bonding disorder. Finally, we expect that both depression and emesis will be associated with fear of childbirth (FOC: [7,25]). For these research questions, we performed secondary analyses of our previous two studies.
2. Methods
2.1. Study Procedures and Participants
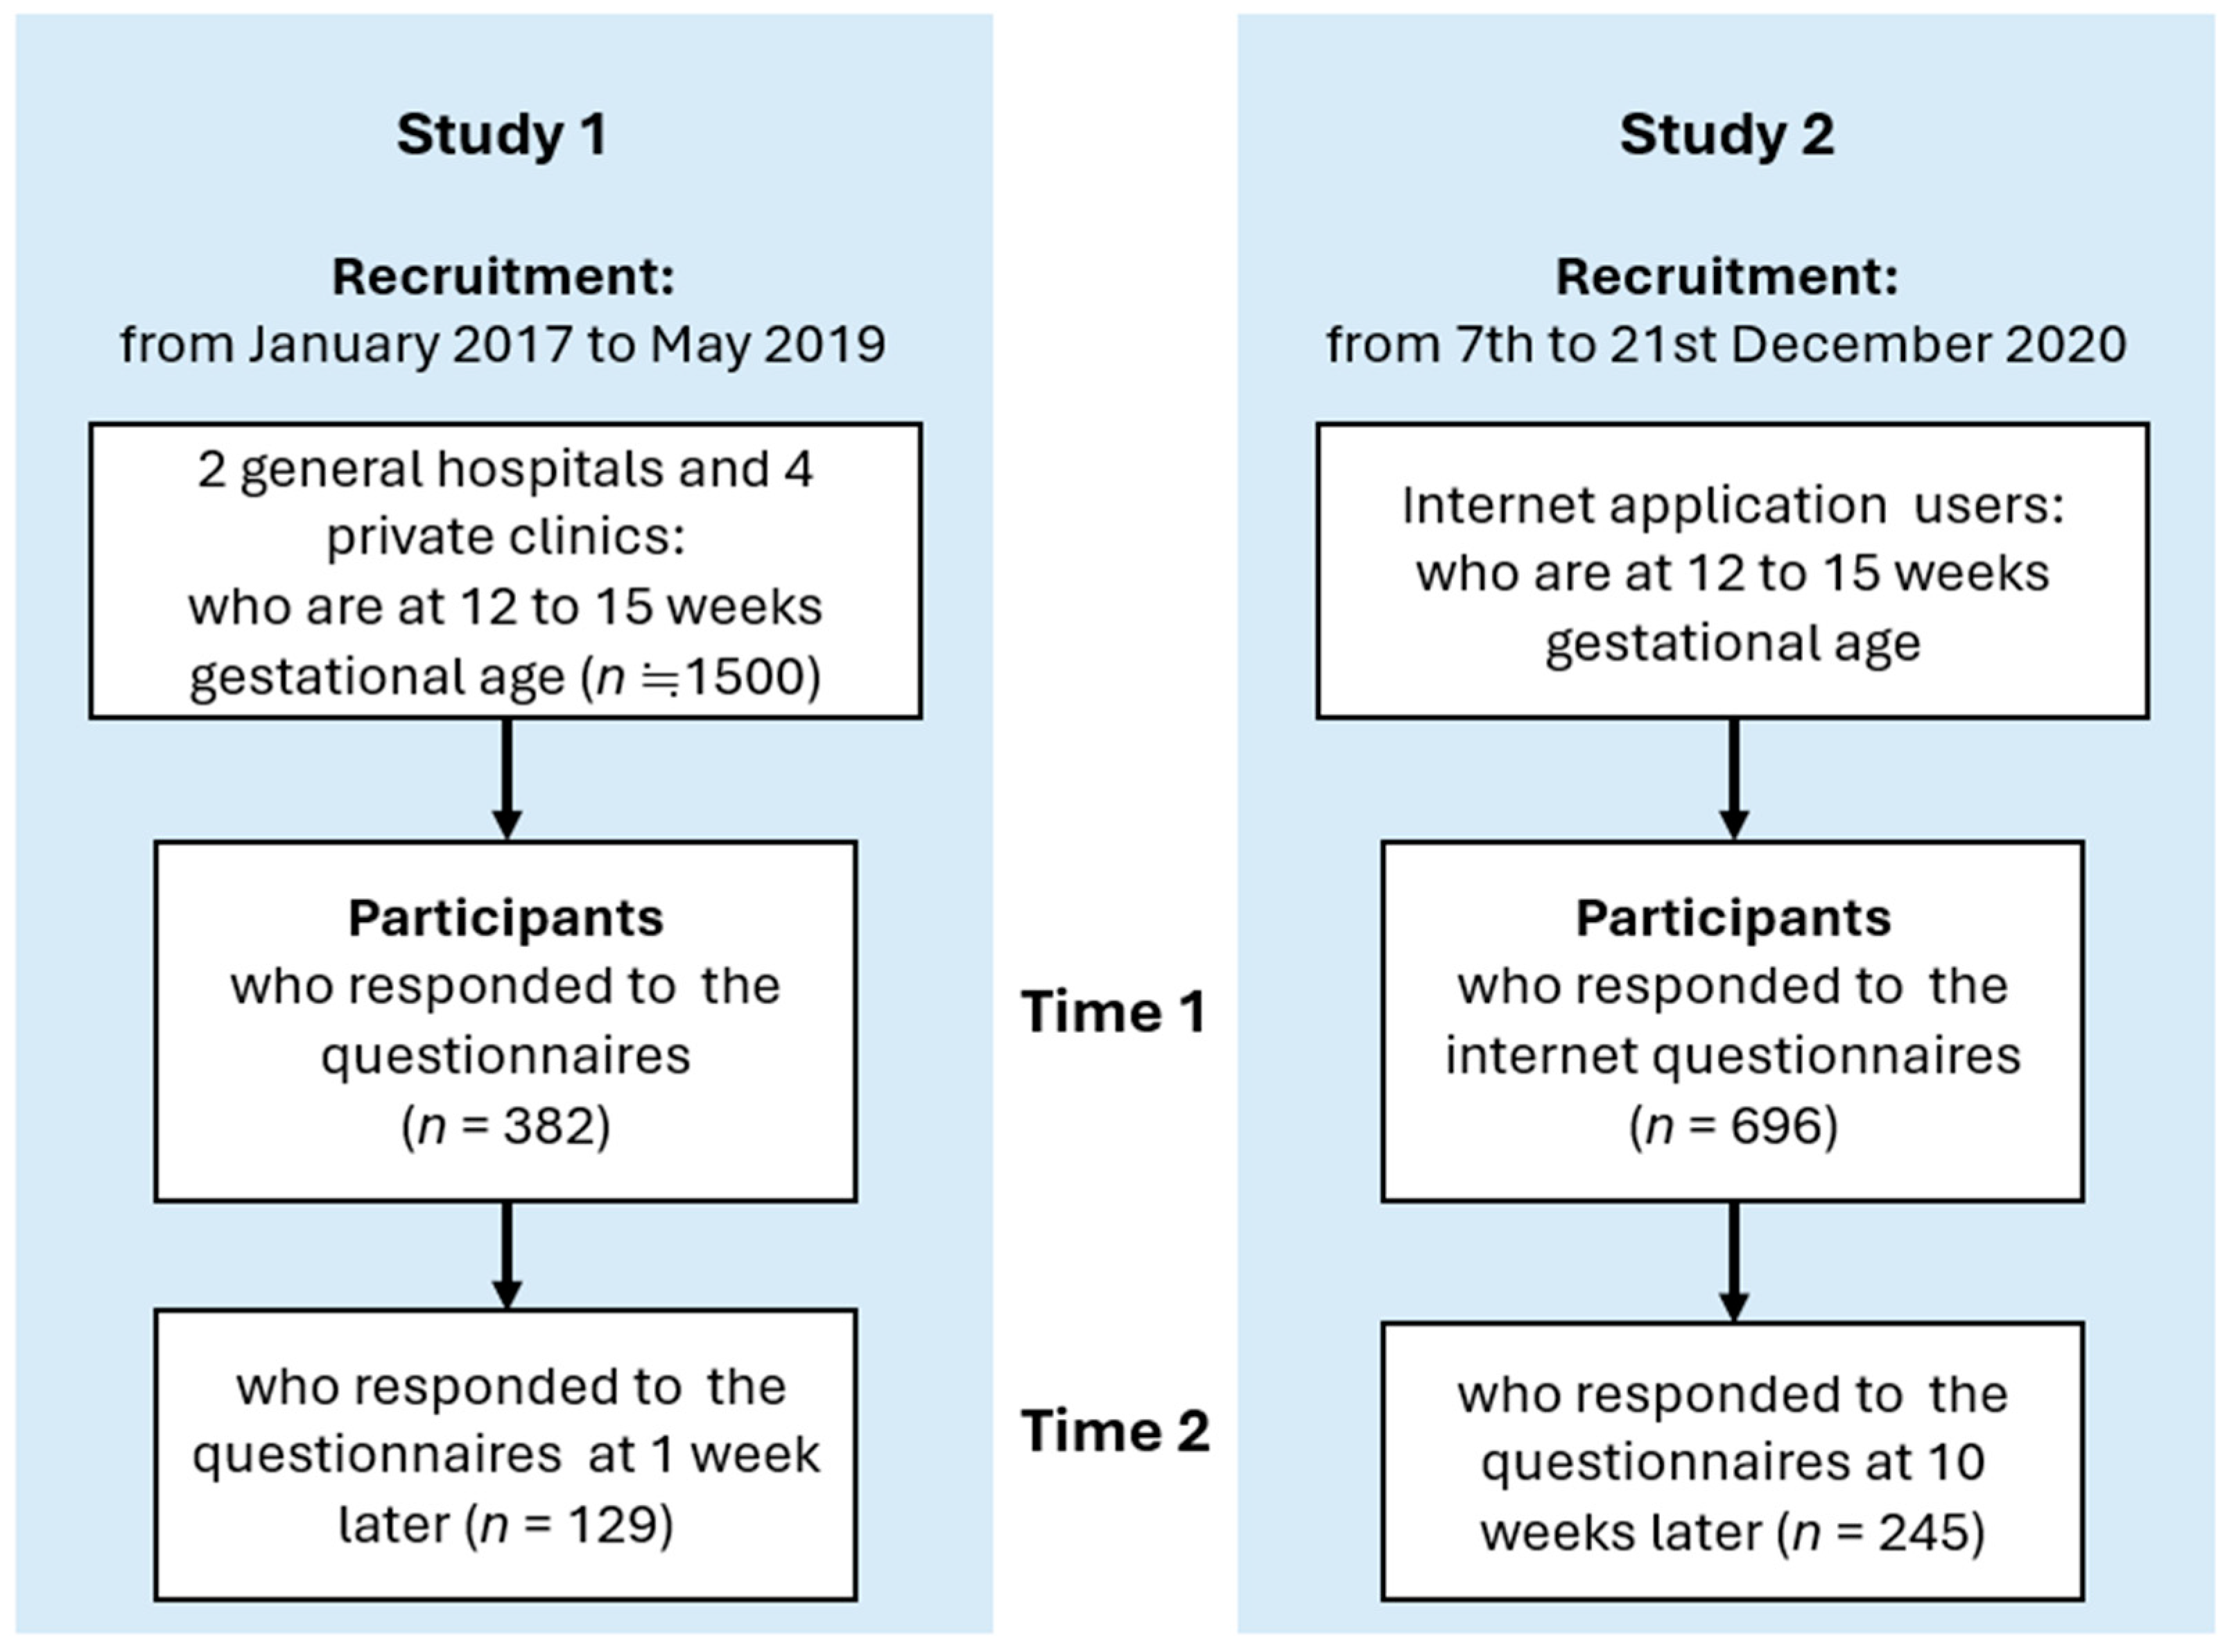
The data analysed in this study came from two sources: Studies 1 and 2. Study 1 was a secondary analysis of a longitudinal follow-up conducted at 1week interval [24,26,27]. Briefly, we solicited approximately 1500 pregnant women from 10 to 13 weeks of gestation at the antenatal clinic of two general hospitals and four private clinics located in Tokyo, Chiba, Ibaraki, and Kagoshima Prefectures in Japan. The total respondents were 382 (approximately 25%). They were provided with a set of the test and retest questionnaires and were asked to return the retest questionnaire one week later. Of them, 129 (34%) returned the retest questionnaire. Questionnaires of the two-time occasions were matched by a predetermined number on the first page of the questionnaires (for the sake of participant anonymity). Excluded were those women (a) who were not fluent in Japanese, (b) who were aged under 20, (c) who had eating disorders, (d) who had symptoms of vaginal bleeding or abdominal pain, (e) who had a subchorionic hematoma, and (f) who had the experience of recurrent miscarriages. This was a convenience sample. However, the sample consisted of those women receiving different types of obstetrical services in Japan. Data collection was conducted from January 2017 to May 2019.
Study 2 was a secondary analysis of a internet survey of pregnant women. The target was 696 pregnant women at 12 to 15 weeks’ gestational age. They were recruited for two weeks, from December 7th to 21st, 2020, via internet application by Luna Luna and Luna Luna Baby (MTI Ltd., Tokyo, Japan). The participants enrolled came from almost all prefectures in Japan. The questionnaire contained an information page, with the aims of the study, affiliations, information about informed consent, and the address of the consultation desk for the research. As an incentive, participants received electronic money which could be used for Amazon shopping. We sent an e-mail to invite these 696 pregnant women to participate in a follow-up study about 10 weeks later. Of the pregnant women, 245 (35.2%) responded to it. The questionnaires of the two occasions were matched by their e-mail address (anonymity was assured).
2.2. Measurements
Depression: We used the Japanese version [21,22] of the PHQ-9 [23]. This is a nine-item self-report measure of depression based on the Major Depressive Episode (MDE) criteria in the Diagnostic and Statistical Manual of Mental Disorder-Ⅳ (DSM-Ⅳ). This was virtually the same as that in DSM-5. Each item asks the frequency of MDE symptoms over the previous two weeks with a 4-point Likert scale from 1 (not at all) to 4 (nearly every day). The full version of the PHQ-9 was used in Study1 whereas only the first two items (depressed mood and loss of interest, i.e., anhedonia) were used in Study 2. Research showed that this 2-item set identifies fairly accurately cases of depression [28,29,30,31,32,33,34,35]. Throughout Studies 1 and 2, we added the scores of depressed mood and loss of interest as an index of the severity of depression. In Study 1 only, the DSM-IV diagnosis of MDE was made as a reference according to Spitzer et al. [23] by the existence of at least 5 symptoms of MDE (including either depressed mood or anhedonia) at least more than half of the days.
Emesis: We used the Japanese version [26] of the 24 hour-Pregnancy-unique Quantification of Emesis and Nausea (PUQE-24; 41]: This is a self-measure rating used widely in clinical and research settings. It measures (a) nausea (the length of nausea in hours for the last 24 hours), (b) vomiting (number of vomiting for the last 24 hours), and (c) retching (the number of retching for the last 24 hours) with a 5-point scale each. Higher scores indicate more severe emesis. The severe end of the emesis spectrum has serious clinical implications as it necessitates immediate interventions. The PUQE-24 has ability to identify and predict the occurrence of HG [37,38]. The PUQE-24 was translated into Japanese by M.M. and T.K. with permission from the original authors. This was back-translated and compared with the original English to verify wordings. The PUQE-24 was used in both Studies 1 and 2. As a concurrent measure of emesis, we used the Japanese version of the NVPQOL Questionnaire [39]. This is a self-report measure of health-related quality of life for nausea and vomiting during pregnancy. The NVP QOL was used only in Study 1.
Psychosocial disability: We used the Japanese version [40] of the Sheehan Disability Scale (SDS: 46] (@Copyright 1983-2020 Sheehan DV. All right reserved. Maybe reproduced only with the permission of Dr. David, V. Sheehan, copyright holder. For permission contact davidsheehan@gmail.com). The SDS is a three-item self-report scale covering the domains of (a) work and schoolwork, (b) social and leisure activities, and (c) family life and home responsibility. Each item is rated from 0 to 10. Its psychometric validation has been reported [42]. The SDS was used only in Study 1.
Foetal bonding: We used the abridged version of the Scale of the Parent-to-baby Emotion (SPBE: [43]) to assess the participant’s emotions towards the foetus [44]. The full version of the SPBE is unique in that it has 6 basic and 4 self-conscious emotion subscales each rated by two items with a 7-point scale. The instruction was “How strongly did you feel these emotions when you imagined your baby in your womb?” Under the rubric of basic emotions, the SPBE includes Happiness, Anger, Fear, Sadness, Disgust, and Surprise [45,46]. Under the rubric of self-conscious emotions, the SPBE includes Shame, Guilt, and Alpha- and Beta-prides [47]. Hada et al. [42] developed a short version of the SPBE (SPBE-20) consisting of 20 items, of whose construct was remaining the construct of the full version of the SPBE. The SPBE-20 was used only in Study 2.
Obsessive-compulsive symptoms: To measure obsessive and compulsive symptoms we used the Japanese version [48] of the Obsessive-Compulsive Inventory-Revised (OCI-R: [49]). This comprises 18 items with a 5-point scale. The grading was changed from 5-point to 7-point in this study.
Fear of childbirth (FOC): As a measure of FOC, we used the Japanese version [50] of the Wijma Delivery Expectancy/Experience Questionnaire (WDEQ) [51]. This instrument has 33 items rated on a 5-point scale. Higher scores indicate more severe fear of childbirth. Item 31 was erroneously deleted in the present study. The WDEQ was used only in Study 2.
Borderline personality traits: We measured borderline personality traits by the short version (IPO-SV: [52]) of the Inventory of Personality Organisation (IPO:[53]). The IPO-SV has 9 items on a 7-point scale. It has 3 subscales: Primitive Defence (PD), Identity Diffusion (ID), and Reality Testing (RT) disturbance. The IPO-SV was used only in Study 2.
Demographic variables: We examined (a) participant’s age, (b) partner’s age, and (c) parity.
2.3. Data Analysis
Analytic design: We selected depressed mood and loss of interest as symptoms of depression during pregnancy. This is because we used only these two symptoms to identify MDE in Study 2 as well as because some MDE symptoms were cast doubt as such [28]. For example, loss of appetite or loss of energy as indicators of MDE may reflect emesis among expectant women. We, then, examined the degree of correlation (Pearson product moment correlation coefficient) between depression and emesis symptoms followed by the identification of factors. This is because we speculated that depression and emesis would reflect different aspects of the same phenomenon. We thought that cluster analysis would give us an insight about hypotheses we proposed in Introduction. If depression and emesis, though often coexisting, were discrete clinical entities, we would find three clusters: depression, emesis, and healthy clusters. If emesis were an independent category and depression were another independent one usually accompanied by nausea and vomiting, we would find again three clusters: emesis, depression with emesis, and healthy clusters. If, on the other hand, depression and emesis were independent clusters and, in addition, there were another cluster characterised by both depression and emesis, we would find four clusters. If depression and emesis consisted of a single category, there would be two clusters: healthy cluster and cluster with emesis and depression. The clusters thus identified were then examined in their associations with depression score, prevalence of MDE, and emesis scores (PUQE-24 and NVP QOL) (criterion validity), their associations with clinical variables including social disability, foetal bonding disorder, obsessive compulsive symptoms, FOC, and borderline personality trait (construct validity) as well as demographic features. We also thought that, when such clusters were identified, we would further check whether they were taxonic or dimensional structure via taxometrics. Finally, we examined temporal relationships between emesis and depression in a cross-lagged design of structural equation modelling.
Factor structure of depression and emesis: In order to identify the factor structure of the two depression and three emesis items, we divided the samples of both Studies 1 and 2 into two separately: one (Group A) for exploratory factor analyses (EFAs) and another (Group B) for confirmatory analyses (CFAs). Using Group A, we calculated mean, SD, skewness, and kurtosis of each depression and emesis item. We used the Kaiser-Meyer-Olkin (KMO) index and Bartlett’s sphericity test [54] to conform the data of Studies 1 and 2 would be suitable for EFAs. A series of EFAs were performed by the maximum-likelihood method with PROMAX rotation: an oblique rotation. An oblique rotation was preferred than an orthogonal rotation because the resulting factors of psychological measures are usually correlated with each other to some extent. This was started from a single-factor structure model progressing to models with a greater number of factors (i.e., two- and three-factor structures, and so on). In order to identify the best fit model of the factor structure, these models were compared in a series of CFAs among Group B. The fitness of the models was expressed in terms of chi-squared, comparative fit index (CFI), and root mean square of error approximation (RMSEA). A good fit would be indicated by χ2/df < 2, CFI > .97, and RMSEA < 0.05, and an acceptable fit by χ2/df < 3, CFI > .95, and RMSEA < 0.08 [55,59]. Comparison of factor structure models derived from EFAs was performed as cross validation [57,58,59] using the second halved sample, Group B. Starting with the single-factor model, the subsequent model was judged as ‘accepted’ if χ2 decreased significantly for the difference of df. This was repeated until we reached the best model. The scores of subscales derived from EFAs were separately correlated with the scores of SDS, abridged version of the SPBE, OCI-R, FOC, and IPO-SV. Because of multiple correlations, we thought that we should set the Type 1 error at p < .001.
Cluster analysis of the participants: Next, we subjected the two PHQ-9 (depressed mood and loss of interest) and three PUQE-24 items to a two-step cluster analysis. Cluster analysis is a means to classify participants into groups that are homogenous within themselves and heterogenous between each other. This is based on the characteristics of symptoms in question [60]. Group created is a cluster. As compared to other cluster techniques such as k-mean and hierarchical cluster analyses, two-step cluster analysis has advantages in creating clusters based on both categorical and continuous variables [61]. On the other hand, k-mean and hierarchical cluster analyses only deal with continuous variables. The selection of the number of clusters is predetermined by the researcher in k-mean analysis. In hierarchical cluster analysis, while sequentially combining the nearest cases the occurrence of a big increase in the distance between the cluster from one stage to another is the sign that the number of clusters just before that big ‘jump’ is the best cluster model. In contrast, the two-step cluster analysis selects the number of clusters automatically. It starts with the construction of a cluster features tree that creates ‘nodes’ containing multiple cases. In the second step, agglomerative clustering is used to produce a range of solutions. Two-step cluster analysis automatically confirms the possible maximum number of clusters. This is followed by the determination of the best cluster model in terms of the highest distance increase (measured by Schwarz’s Bayesian Criterion) between the two closest cluster models during each stage of the hierarchical clustering [62]. Silhouette coefficients were also calculated to assess discreteness of clusters.
As noted later, we found two clusters of the participants therefore we were concerned about the cut-off point of the total scores of two PHQ-9 and three PUQE items to distinguish the two cluster. We performed a receiver operating characteristics (ROC) analysis. We calculated area under curve (AUC) as an index of psychometric property of such a cut-off point.
Taxometric analysis of depression and emesis: Taxometrics is often used to determine whether a construct of interest is categorical or dimensional in the nature. Various taxometric procedures are applied to elicit a taxon. Mean Above Minus Below A Cut (MAMBAC; [63]), MAXimum COVariance (MAXCOV; [69]), MAXimum EIGenvalue (MAXEIG; [65]), and Latent Mode (L-Mode; [65]) were included in the taxometrics methods. Three hundred or more sample size is recommended for the taxometric analysis. A sample size of both Study 1 (N = 382) and Study 2 data (N = 696) was appropriate for taxometric analysis. Analysis was conducted through the same procedures using both Studies 1 and 2 samples. MAXEIG, and L-Mode requires three or more indicators. Depressed mood, loss of interest, nausea, vomiting, and retching were candidates for taxometric analysis. However, Depressed mood and loss of interest were 4-point Likert scale (from 1 [not at all] to 4 [nearly every day]) in Study 2. Forming the composite variable has the benefit that the resulting input indicator may contain a larger range of variables that provide more reliable rank-ordering cases. Therefore, a sum of scores of depressed mood and loss of interest was used as an indicator for taxometric analysis. Comparison Curve Fit Index (CCFI) is useful to specify and evaluate several operationalizations of consistency testing, which examines whether the empirical data are a closer match to those for the taxonic or dimensional comparison data. CCFI values can range from 0 (strongest support for dimensional structure) to 1 (strongest support for taxonic structure), with .50 representing the most ambiguous outcome [66,67]. CCFI profile is thus a summary index of series of taxometric analysis procedures (i.e., MAMBAC, MAXEIG, and L-Mode). We used Rtaxometrics package [68] for all taxometric analysis procedures. We examined whether our data were acceptable for taxometric analysis in terms of Cohen’s d, within-group correlation for the putative taxon, and within-group correlation for putative complement with checkdata function before conducting taxometric analysis.
Temporal relationship between depression and emesis: We set up a structural equation model separately using the follow-up data from Studies 1 and 2. In this cross-lagged model, it was posited that both depression and emesis at Time 1 would predict its counterpart at Time 2. In addition, depression at Time 1 would predict emesis at Time 2 while emesis at Time 1 would predict depression at Time 2. This classical model is called cross-lagged panel model and is known to converge well with the data [69]. As an alternative model, we tried non-recursive SEM model [70]. Here, we set paths from Emesis to Depression and vice versa without paths from one at Wave 1 to another at Wave 2. Recursive and non-recursive models are equivalent in goodness-of-fit. Stability of non-recursive model was checked by stability test which, if not less than 1.0 indicates good stability [71,72].
2.4. Ethical Consideration
Study 1 was approved by the Institutional Review Board (IRB) of Kitamura Institute of Mental Health Tokyo (No. 2015052301) and Kagoshima University (No.170247). Study 2 was approved by Institutional Review Board (IRB) of Kitamura Institute of Mental Health Tokyo (No. 2020101501).
3. Results
In Study 1, most of the participants were married (94%). The mean (SD) age of the participants was 31.9 (4.9) years and the mean age (SD) of their partner was 33.5 (5.5) years. Of them, 43.9 % were nulliparas and 54.8 % were multiparas. Parity was unknown about 6 women. In Study 2, the mean (SD) age of the participants was 31.7 (4.5) years. The mean (SD) gestational age was 13.4 (1.14) weeks. Of them, 73.6% were nulliparae and 26.4% were multiparae. Most of them (99%) were married (99%).
We calculated mean, SD, skewness, and kurtosis of the two depressive and three emesis items in the halved samples from Studies 1 and 2 (Table 1). Except for vomiting, skewness and kurtosis were all within normal ranges for all the variables studied. Thus, all the variables seemed normally distributed. The five variables were all correlated significantly with each other.
EFAs of these 5 symptom items were performed for Group A in both Studies 1 and 2. Data were factorable for both Studies 1 and 2: KMO = .688 and .632 in Studies 1 and 2, respectively; Bartlett’s sphericity χ2 (10) = 243.054 and 470.808, p < .001, in Studies 1 and 2, respectively. All the variables showed factor loadings > .33 in a 1-factor model, except for nausea and retching in Study 2 data set (Table 2). In a 2-factor model, high factor loadings were observed for depressed mood and lack of interest in one factor and the three PUQE-24 items in another factor separately.
In Group B from Study 1, the fit indices of the 1-factor model were poor: χ2/df = 13.445, CFI = .755, RMSEA = 0.251. Those of the 2-factor model were significantly much better: χ2/df = 0.579, CFI = 1.000, RMSEA = 0.000. Similarly in Group B from Study 2, the fit indices of the 1-factor model were poor: χ2/df = 32.651, CFI = .635, RMSEA = 0.303. Those of the 2-factor model were significantly much better: χ2/df = 1.828, CFI = .992, RMSEA = 0.049. Therefore, the 2-factor model was the best in both Studies 1 and 2. Then, we created two composite scores (Depression and Emesis) by adding the scores of the 2 PHQ-9 and 3 PUQE-24 items, respectively.
When correlating the Depression and Emesis scores with the other variables among all the samples (N = 382 and 696 for Studies 1 and 2, respectively), they differ only in a few areas (Table 3). Thus, Depression was correlated with low happiness and fear and surprise towards the foetus but this was not the case for Emesis. The two types of maternal Pride were all correlated negatively with Depression but not with Emesis. Otherwise, Depression and Emesis scores were correlated with the other variables in a very similar manner. Thus, both Depression and Emesis were associated with social disability (Study 1). The two were also associated with Anger, Sadness, Disgust, Shame, Guilt towards the foetus, obsessive compulsive symptoms, fear of child birth, and borderline personality traits (Study 2). Hence, Depression and Emesis were not distinguishable in divergent validity.
Two-step cluster analyses showed 2-cluster solutions in both Studies 1 and 2. Silhouette coefficients were 0.6 in both Studies 1 and 2. About 36% and 31% of the women in Studies 1 and 2 belonged to the first cluster, which is a minority of the participants (n = 134 and 215 in Studies 1 and 2). When comparing the women belonging to the second cluster in Studies 1 and 2, we found that the women of the first cluster were significantly higher in Depression in both Studies 1 and 2 (Table 4). In Study 1, the prevalence MDE was 32.8% and 0.4% for the first and second clusters, respectively. This was significant contrast (Fisher exact probability p < .001). The two clusters also differed in terms of emesis. The total scores of the PUQE-24 were significantly higher in the first cluster than the second cluster both in Studies 1 and 2. In Study 1, the total scores of the NVP QOL were significantly higher in the first cluster than the second cluster. Hence, it was thought that the first cluster was characterised by both depression and emesis whereas the second cluster was free from both of them. The two clusters differed in terms of clinical correlates including foetal bonding disorder, obsessive compulsive symptoms, fear of childbirth, and borderline personality traits in Study 2 (Table 5).
A clinical requirement is to identify the group of women who need nursing care and treatment, n this study, the cluster of women with both depression and emesis. The capacity of the total score of depression, loss of interest, and the three PUQE-24 items showed a remarkable area under curve (AUC) of .991 in Study 1. Sensitivity and specificity of the cut-off 9/10 were 1.000 and .77, respectively. Those of the cut-off 10/11 were .98 and .92, respectively. Those of the cut-off 11/12 were .84 and .1.00, respectively. Of the Study 1 participants, 30% of them were scored 11 or higher in this score. Similarly, in Study 2, the capacity of the total score of depression, loss of interest, and the three emesis items showed a remarkable AUC of .996. Sensitivity and specificity of the cut-off 8/9 were 1.000 and .72, respectively. Those of the cut-off 9/10 were .99 and .88, respectively. Those of the cut-off 10/11 were .95 and .1.00, respectively. Of the Study 2 participants, 30% of them were scored 10 or higher in this score.
For taxometric analysis, as the criteria of the distributional characteristics of indicators, Cohen’s d > 1.25 and within-group correlations < .3 are recommended for accurate and informative conclusions [73]. In the pre-taxometric analysis, our data met all requirements except for within-group correlation for putative complement (rCom) of Study 1 sample (Table 5). A number of simulation studies showed that failure to meet one or more criteria may be offset by especially favourable characteristics on other criteria in the same data set [74]. Our data were, therefore, appropriate for taxometric analysis.
CCFI values supported a dimensional structure for Depression and Emesis in both studies 1 and 2. CCFI MAMBAC = .325 and .252, CCFI MAXEIG = .473 and .315, CCFI L-Mode = .463 and .374, and CCFI mean = .403 and 303, for samples of Studies 1 and 2, respectively. In the graphical outputs, CCFI profiles were well below .50, and the curves of the base rate estimates showed nearly flat lines (Figure 1 and Figure 2).
These findings suggested that the symptoms of depression and emesis during pregnancy consist of two factors (Depression and Emesis) but they were substantially correlated to each other and did not differ markedly in terms of associations with relevant clinical correlates. We found only two clusters one of which is characterised by coexistence of both depression and emesis. Hence, we speculate existence of group of pregnant women suffering from symptoms in both physical and psychological domains simultaneously; nausea and vomiting in the physical domain and depression in psychological domain. However, distinction between the two clusters was not so clear that we could not identify an observable taxon with the nature, therefore, being more dimensional than taxonic. There appeared no clear-cut boundary between severe cases of depression and emesis and cases of milder severity.
A final enquiry was the causal relationships between depression and emesis: Which of them leads to another? We constructed a series of recursive cross-lagged structured equation model (SEM). In both Study1 (Figure 3) and Study 2 (Figure 4), depression and emesis at Time 1 significantly predicted their counterparts at Time 2 whereas there was no significant prediction of one at Time 1 to another at Time 2. Therefore, there were no causal relationships between depression and emesis. Additional analyses were conducted using non-recursive models. Stability tests of Studies 1 and 2 were .036 and .028, respectively, indicating acceptable stability. In Study 1, standardised coefficient from Emesis at Wave 2 to Depression at Wave 2 was .21 (p > .05) and that from Depression at Wave 2 to Emesis at Wave 2 was -.17 (p > .05). In Study 2, standardised coefficient from Emesis at Wave 2 to Depression at Wave 2 was -.11 (p > .05) and that from Depression at Wave 2 to Emesis at Wave 2 was .25 (p = .031).
4. Discussion
Our study started with a hypothesis that antenatal depression and emesis were discrete as symptomatic factors but would reflect two different aspects of the same phenomenon that we should like to propose to term emesis-depression complex. This hypothesis seemed to be supported. This phenomenon has been seen by perinatal psychiatrists and psychologists as ‘antenatal depression’ and by obstetricians and midwives as ‘emesis’ or, when severe, HG. The two kinds of professionals naturally have been approaching and providing with intervention and support to pregnant women with this clinical picture from different perspectives.
Our conclusion may be counter intuitive for many perinatal health professionals. For example, nausea and vomiting occur in most of pregnant women while it is only a handful of them who have an onset of antenatal depression. This disparity alone makes it hard to understand how emesis and depression could be strongly linked. This kind of argument is based on the categorical assumption of emesis and depression. In reality, however, these two are of linear nature. We assessed them as continuous variables. Of course, there is a group of pregnant women with emesis but without depression [27]. However, this does not refute a possible link between the two as well as an existence of cluster categorized by both emesis and depression. What remain are the total mechanism of emesis. They include multiple factors such as genetic, endocrine and infectious ones [75,76].
It is easily arguable that a person who is ill is likely to feel psychological down. Our focus was weather depression preceded emesis or vice versa during pregnancy period. This was discussed in our final enquiry. Here, in addition to a recursive model of structural equation model, we performed a non-recursive model, a direct feedback loop between depression and emesis at Time 2. This is a “snapshot” of an ongoing dynamic process assuming equilibrium [70] confirmed by good stability test (<1.00). The results indicated that, though weakly, depression influenced emesis but not the other way round at Time 2. Regardless of possible existence of depression starting before pregnancy, it is depression that worsens emesis during pregnancy.
Another criticism may come from use of the PHQ-9. One may choose the Edinburgh Postnatal Depression Scale [77] as a measure of antenatal depression [78,79,80]. Although the EPDS is world widely used, its factor structure is still debatable [81] and doubt has been cast on its measurement invariance [82,83]. On the other hand, the PHQ-9 is occasionally used for pregnant women [84] and we also excluded depression items (from the PHQ-9) that may come from emesis.
Another important aspect of our results is that emesis-depression complex has no taxon but is a continuous phenomenon. Analogy may be functional dyspepsia that is characterized by somatic symptoms (pain, fullness, bloating, early satiety, nausea, vomiting, epigastric burning, and belching) but at the same time is linked to somatization. The functional dyspepsia symptoms are in favour of a dimensional structure among functional dyspepsia patients [85].
There are differences between the present and our previous reports. We analysed Study 1 sample and reported a 3-cluster structure [27] while the present study reported a 2-cluster structure. The variables that were entered into cluster analysis were the two PHQ-9 subscale scores (Somatic and Non-somatic) in our previous analyses whereas two MDE symptom scores (depressed mood and loss of interest) in the present analyses. The second cluster of our previous study was characterized by emesis symptoms but was not accompanied by depression symptoms. Due to dimensional nature of emesis-depression complex, the 3-cluster structure in our previous anslyses may reflect simply difference of severity of emesis-depression complex. Emesis itself is less clear in terms of its symptomatic boundary [37] and has no evidence, at least to the best of our knowledge, of its taxonicity. It may be more appropriate to look at the clinical picture from a dimensional perspective.
Our study indicates that we should pay more attention to the psychological symptoms when a pregnant woman has gastrointestinal symptoms such as nausea and vomiting. As we discussed earlier, it may be recommended to assess those women with emesis carefully in psychiatric terms and to provide with psychological care for depressive symptoms in addition to treatment for nausea and vomiting. Therapeutic plans may come from understanding of psychological mechanisms of occurrence of emesis-depression complex. We can list several features as possible causes of antenatal depression: (a) obstetric factors (first pregnancy, first delivery, and past history of artificial abortion), (b) early experiences such as loss of father, (c) personality including Eysenck’s high neuroticism, (d) negative attitudes towards the current pregnancy, (e) poor accommodation such as non-detached housing and expected crowdedness after childbirth, and (f) lack of social support such as low level of partner intimacy [3,86]) psychodynamic treatment for pregnancy-related mental disorder is a possible treatment plan for emesis-depression complex. Sartori et al. [87] reported that expectant fathers' anxiety was associated with their partner’s severe nausea and vomiting, and they also expressed concerns about emotional changes in their partners. We, therefore, need to care for partners as well as pregnant women who have emesis-depression complex.
The present study is, of course, not without limitations. We focused on the two time points. Some pregnancy women experience very prolonged emesis up to even the day of delivery. Trajectory of emesis and depression needs further enquiry. Pregnancy is a time when expectant women experience many other psychological dysfunction such as those observed in Study 2. Factor structure as well as trajectory of all these psychological symptoms are another remaining topic of research. Biological changes accompanying emesis or depression including electrolytes disturbance, dehydration, anaemia (to name just a few) should be included in analyses in future studies. Postnatal consequences of emesis-depression complex may be another important clinical topic that should be cleared in future studies. Another drawback of the present study was its high attrition rate in both Studies 1 and 2. It is likely that the sickest and/or most depressed did not participate in the first and follow-up survey. Future replication studies should take a face-to-face interview method for assessment.
In the two data sets depression was measured only by self-rating questionnaires that enquired only about the current depression. Hence no attempt could be made to separate a new onset antenatal depression from depression that is simply carried over from before the woman conceived. There remains possibility that depression starting before pregnancy influenced emesis at Time 1. This was, however, expressed the covariance between depression and emesis at Time 1 in the structural equation model (Figs. 3 and 4).
Last but at least, future studies should focus on the aetiologies of emesis-depression complex. An amount of research was reported regarding clinical correlates of antenatal depression [3]. However, careful studies are needed to identify causes of emesis-depression complex. They may, of course, include demography features such as marital and occupational conditions to name just a few.
5. Conclusions
In conclusion, our findings suggest that emesis and depression during pregnancy are two discrete aspects of a single clinical phenomenon (entity) that we propose to name emesis-depression complex.
Conflicts of Interests
The authors declare that they have no conflict of interests.
Author Contributions
TK, MM, and ST planed the research design. MM and MW collected data. TK, AH, YU, and MT performed statistical analyses. ST supervised the project. TK and AH wrote the first manuscript.
Funding
Study 2 was funded by Health, Labour and Welfare Policy Research Grants: Special research: The Effects of Self-Restraint under the Novel Coronavirus Infection (Covid-19) Epidemic: A Survey on Unexpected Pregnancy, etc. and Research to Establish an Appropriate Support System for Women's Health (20CA2062; Principal Researcher-Tomoko Adachi).
Acknowledgments
We are grateful for all of the participants and Japanese Red Cross Medical Centre, Endou Ladies Clinic, Kubonoya Women’s Hospital, Tsuchiya Obsteric & Gynaecology Clinic, Aiiku Hospital, and Nakae Obstetiric & Gynaecology Clinic in Study 1. Gratitude is also due to all the net survey participants in Study 2.
References
- Kitamura, T.; Yoshida, K.; Okano, T.; Kinoshita, K.; Hayashi, M.; Toyoda, N.; Ito, M.; Kudo, N.; Tada, K.; Kanazawa, K.; Sakumoto, K.; Satoh, S.; Furukawa, T.; Nakano, H. Multicentre prospective study of perinatal depression in Japan: Incidence and correlates. Arch. Women Ment. Health 2006, 9, 121–130. [Google Scholar]
- Kitamura, T.; Sugawara, M.; Sugawara, K.; Toda, M. A.; Shima, S. Psychosocial study of depression in early pregnancy. Br. J. Psychiatry 1996, 168, 732–738. [Google Scholar] [PubMed]
- Kitamura, T.; Shima, S. : Sugawara, M.; Toda, M. A. Clinical and psychosocial correlates of antenatal depression: A review. Psychother. Psychosom. 1996, 65, 117–123. [Google Scholar] [PubMed]
- Gadsby, R.; Barnie-Adshead, M.; Jagger, C. A prospective study of nausea and vomiting during pregnancy. BJGP 1993, 43, 245–248. [Google Scholar]
- Seng, J. S.; Schrot, J. A.; van de Ven, C.; Liberzon, I. Service use data analysis or pre-pregnancy psychiatric and somatic diagnosis in women with hyperemesis gravidarum. J. Psychosom. Obstet. Gynaecol. 2007, 28, 209–217. [Google Scholar]
- Koot, M. H.; Boelig, R. C.; van’t Hooft, J.; Limpens, J.; Rosebom, T. J.; Painter, R. C.; Grooten, I. J. Variation in hyperemesis gravidarum definition and outcome reporting in randomised clinical trials: A systematic review. BJOG 2018, 125, 1514–1521. [Google Scholar]
- Poursharif, B.; Korst, L. M.; Fejzo, M.; MacGibbon, K. W.; Romero, R.; Goodwin, T. M. The psychosocial burden of hyperemesis gravidarum. J. Neonatol. 2008, 28, 176–181. [Google Scholar]
- Wood, H.; McKellar, L. V.; Lightbody, M. Nausea and vomiting in pregnancy: Blooming or bloomin’ awful? A review of the literature. Women Birth, 26.
- Aksoy, H.; Aksoy, U.; Karadağ, Ō. I.; Hacimusalar, Y.; Açmaz, G.; Aykut, G.; Çağli, F.; Yücel, B.; Aydin, T.; Babayiğit, A. Depression levels in patients with hyperemesis gravidarum: A prospective case-control study. SpringerPlus 2015, 4, 34. [Google Scholar]
- Fell, D. B.; Dodds, L.; Joseph, K. S.; Allen, V. M.; Butler, B. Risk factors for hyperemesis gravidarum requiring hospital admission during pregnancy. Obstet. Gynecol. 2006, 107, 277–284. [Google Scholar]
- Hizli, D.; Kamalak, Z.; Kosus, A.; Kosus, N.; Akkurt, G. Hyperemesis gravidarum and depression in pregnancy: Is there an association? J. Psychosom. Obstet. Gynaecol. 2012, 33, 171–175. [Google Scholar]
- Mitchell-Jones, N.; Gallos, I.; Farren, J.; Tobias, A.; Bottomley, C.; Bourne, T. Psychological morbidity associated with hyperemesis gravidarum: A systematic review and meta-analysis. BJOG 2016, 124, 20–30. [Google Scholar]
- Pirimoglu, Z. M.; Guzelmeric, K.; Alpay, B.; Balcik, O.; Unal, O.; Turan, M. Psychological factors of hyperemesis gravidarum by using the SCL-90-R questionnaire. CEOG 2009, 37, 56–59. [Google Scholar]
- Kjeldgaard, H. K.; Eberhard-Gran, M.; Benth, J. Š.; Vikanes, V. Å. Hyperemesis gravidarum and the risk of emotional distress during and after pregnancy. Arch. Womens Ment. Health 2017, 20, 747–756. [Google Scholar]
- Kjeldgaard, H. K.; Eberhard-Gran, M.; Benth, J. Š.; Nordeng, H.; Vikanes, V. Å. History of depression and risk of hyperemesis gravidarum: A population-based cohort study. Arch. Womens Ment. Health 2017, 20, 397–404. [Google Scholar]
- Christodoulou-Smith, J.; Gold, J. I.; Romero, R.; Goodwin, T. M.; MacGibbon, K. W.; Mullin, P. M.; Fejzo, M. S. Posttraumatic stress symptoms following pregnancy complicated by hyperemesis gravidarum. J. Matern.-Fetal Neonatal Med. 2011, 24, 1307–1311. [Google Scholar]
- Kjeldgaard, H. K.; Vikanes, Å.; Benth, J. Š.; Junge, C.; Garthus-Niegel, S.; Eberhard-Gran, M. The association between the degree of nausea in pregnancy and subsequent posttraumatic stress. Arch. Womens Ment. Health 2019, 22, 493–501. [Google Scholar]
- Mullin, P. M.; Ching, C.-Y.; Schoenberg, F.; MacGibbon, Romero, R. ; Goodwin, T. M.; Fejzo, M. S. Risk factors, treatments, and outcome associated with prolonged hyperemesis gravidarum. J. Matern.-Fetal Neonatal Med. 2012, 25, 632–636. [Google Scholar]
- Mitchell-Jones, N.; Lawson, K.; Bobdiwala, S.; Farren, J. A.; Tobias, A.; Bourne, T. Bottomley, C. Association between hyperemesis gravidarum and psychological symptoms, psychological outcomes and infant bonding: A two-point prospective case-control multicentre survey study in an inner city setting. BMJ Open 2020, 10, e039715. [Google Scholar]
- Muchanga, S. M. J.; Eitoku, M.; Mbelambela, E. P.; Ninomiya, H.; Iiyama, T.; Komori, K.; Yasumitsu-Lovell, K.; Mitsuda, N.; Tozin, R. R.; Maeda, N.; Fujieda, M.; Suganuma, N.; for the Japan Environment and Children’s Study Group. Association between nausea and vomiting of pregnancy and postpartum depression: The Japan Environment and Children’s Study. J. Psychosom. Obstet. Gynaecol. 2020, 43, 2–10. [Google Scholar]
- Inagaki, M.; Ohtsuki, T.; Yonemoto, N.; Kawashima, Y.; Saitoh, A.; Oikawa, Y.; Kurosawa, M.; Muramatsu, K.; Furukawa, T. A.; Yamada, M. Validity of the Patient Health Questionnaire (PHQ)-9 and PHQ-2 in general internal medicine primary care at a Japanese rural hospital: A cross-sectional study. Gen. Hosp. Psychiatry 2013, 35, 592–597. [Google Scholar]
- Muramatsu, K.; Kamijima, K. Puraimarikea shinnryou to utubyou sukuri-ningu tsuru: Patient Health Questionnaire-9 nihongoban ‘Kokoroto Karadano Shitsumonhyou’ (Primary care and depression screening tool: The Japanese version of the Patient health Questionnaire-9 ‘Questionnaire of Mind and Body’). Shindan to Chiryou 2009, 97, 1465–1473. (in Japanese). [Google Scholar]
- Spitzer, R. L.; Kroenke, K.; Williams, J. B. W. ; the Patient Health Questionnaire Primary Care Study Group Validation and utility of a self-report version of PRIME-MD: The PHQ primary care study. JAMA 1999, 282, 1737–1744. [Google Scholar] [PubMed]
- Wakamatsu, M.; Minatani, M.; Hada, A.; Kitamura, T. The Patient Health Questionnaire-9 among first-trimester pregnant women in Japan: Factor structure and measurement and structural invariance between nulliparas and multiparas and across perinatal measurement time points. Open J. Depress. 2021, 10, 121–137. [Google Scholar]
- Poursharif, B.; Korst, L. M.; MacGibbon, K. W.; Fejzo, M.; Romero, R.; Goodwin, T. M. Elective pregnancy termination in a large cohort of women with hyperemesis gravidarum. Contraception 2007, 76, 451–455. [Google Scholar]
- Hada, A.; Minatani, M.; Wakamatsu, M.; Koren, G.; Kitamura, T. The pregnancy-unique quantification of emesia and nausea (PUQE-24): Configural, measurement, and structural invari-ance between nulliparas and multiparas and across two measurement time points. Healthcare 2021, 9, 1553. [Google Scholar]
- Kitamura, T.; Usui, Y.; Wakamatsu, M.; Minatani, M.; Hada, A. Core symptoms of antenatal depression: A study using the Patient Health Questionnaire-9 among Japanese pregnant women in the first trimester. Healthcare 2023, 11, 1494. [Google Scholar] [CrossRef]
- Bowling, A. Just one question: If one question works, why ask several? J Epidemiol Community Health 2005, 59, 342–345. [Google Scholar]
- Chochinov, H. M.; Wilson, K. G.; Enns, M.; Lander, S. Are you depressed?”: Screening for depression in the terminally ill. Am. J. Psychiatry 1997, 154, 674–676. [Google Scholar]
- Cutler, C. B.; Legano, L. A.; Dreyer, B. P.; Fierman, A. H.; Berkule, S. B.; Lusskin, S. I.; Tomopoulos, S.; Roth, M.; Medelsohn, A. L. Screening for maternal depression in a low education population using a two-item questionnaire. Arch. Womens Ment. Health 2007, 10, 277–283. [Google Scholar]
- De Boer, A. G. E. M.; van Lanschot, J. J. B.; Stalmeier, P. F. M.; van Sandick, J. W.; Hulscher, J. B. F.; de Haes, J. C. J. M.; Sprangers, M. A. G. Is a single-item visual analogue scale as valid, reliable and responsive as multi-item scales in measuring quality of life? QUAL LIFE RES 2004, 13, 311–320. [Google Scholar]
- Mishina, H.; Hayashino, Y.; Fukuhara, S. Test performance of two-question screening for postpartum depressive symptoms. Pediatr Int. 2009, 51, 48–53. [Google Scholar] [PubMed]
- Mitchell, A. Are one or two simple questions sufficient to detect depression in cancer and palliative care? A Bayesian meta-analysis. Br. J. Cancer 2008, 98, 1934–1943. [Google Scholar] [PubMed]
- Mitchell, A. J.; Coyne, J. C. Do ultra-short screening instruments accurately detect depression in primary care? A pooled analysis and meta-analysis of 22 studies. Br J Gen Pract. 2007, 57, 144–151. [Google Scholar] [PubMed]
- Richardson, L. P.; Rockhill, C.; Russo, J. E. , et al. Evaluation of the PHQ-2 as a brief screen for detecting major depression among adolescents. Pediatrics 2010, 125, e1097–e11103. [Google Scholar]
- Ebrahimi, N.; Maltepe, C.; Bournissen, F. G.; Koren, G. Nausea and vomiting of pregnancy: Using the 24-Hour Pregnancy-Unique Quantification of Emesis (PUQE-24) Scale. J. Obstet. Gynaecol. Canada 2009, 31, 803–807. [Google Scholar]
- Koot, M. H.; Grooten, I. J.; van der Post, J. A.; Bais, J. M.; Ris-Stalpers, C.; Leeflang, M. M. . Painter, R. C. Determinants of disease course and severity in hyperemesis gravidarum. Eur J Obstet Gynecol Reprod Biol. 2020, 245, 162–167. [Google Scholar]
- Koren, G.; Cohen, R. Measuring the severity of nausea and vomiting of pregnancy; a 20-year perspective on the use of the pregnancy-unique quantification of emesis (PUQE). J Obstet Gynaecol. 2021, 41, 335–339. [Google Scholar]
- Magee, L. A.; Chandra, K.; Mazzotta, P.; Stewart, D.; Koren, G.; Guyatt, G. H. Development of a health-related quality of life instrument for nausea and vomiting of pregnancy. Am. J. Obstet. Gynecol. 2002, 186, S232–S238. [Google Scholar]
- Yoshida, T.; Otsubo, T.; Tsuchida, H.; Wada, Y.; Kamijima, K.; Fukui, K. Sheehan Disability Scale (SDISS) nihongoban no sakusei to shinraisei oyobi datousei no kentou (The Japanese version of the Sheehan Disability Scale (SDISS): Development, reliability and validity). Japanese J Clin Psychopharmacol 2004, 7, 1645–1653. [Google Scholar]
- Sheehan, D.V. The anxiety disease. Scribner 1983.
- Arbuckle, R.; Frye, M.; Brecher, M.; Paulsson, B.; Rajagopalam, K.; Palmer, S.; Innocenti, A. D. The psychometric validation of the Sheehan Disability Scale (SDS) in patients with bipolar disorder. Psychiatry Res. 2009, 165, 163–174. [Google Scholar] [PubMed]
- Hada, A.; Imura, M.; Kitamura, T. Development of a scale for parent-to-baby emotions: Concepts, design, and factor structure Psychiatry Clin. Reports 2022, 1; e30.
- Hada, A.; Takeda, S.; Imura, M.; Kitmamura, T. Development and validation of a short version of the Scale for Parent to Baby Emotions (SPBE-20): Conceptual replication among pregnant women in Japan. Psychol 2023, 14, 1085–1110. [Google Scholar] [CrossRef]
- Ekman, P. All emotions are basic. In P., Ekman, R., Davidson. (Eds.). The nature of emotion: Fundamental questions. Oxford University Press 1994.
- Ekman, P.; Levenson, R. W.; Friesen, W. V. Autonomic nervous system activity distinguishes among emotions. Science 1983, 221, 1208–1210. [Google Scholar] [PubMed]
- Tangney, J. P. Assessing individual differences in proneness to shame and guilt: Development of the Self-Conscious Affect and Attribution Inventory. J Pers Soc Psychol. 1990, 59, 102–111. [Google Scholar]
- Koike, H.; Tsuchiyagaito, A.; Hirano, Y.; Oshima, F.; Asano, K.; Sugiura, Y.; Kobori, O.; Ishikawa, R.; Nishinaka, H.; Shimizu, E.; Nakagawa, A. Reliability and validity of the Japanese version of the Obsessive-Compulsive Inventory-Revised (OCI-R). Curr. Psychol. 2020, 39, 89–95. [Google Scholar]
- Foa, E. B.; Huppert, J. D.; Leiberg, S.; Langner, R.; Kichic, R.; Hajcak, G.; Salkovskis, P. M. The obsessive-compulsive inventory: Development and validation of a short version. Psychol. Assess. 2020, 14, 485–496. [Google Scholar]
- Takegata, M.; Haruna, M.; Matsuzaki, M.; Shiraishi, M.; Murayama, R.; Okano, T.; Severinsson, E. Translation and validation of the Japanese version of the Wijma Delivery Expectancy/Experience Questionnaire version A. Nurs. Health Sci. 2013, 15, 326–332. [Google Scholar] [CrossRef]
- Wijma, K.; Wijma, B.; Zar, M. Psychometric aspects of the W-DEQ; A new questionnaire for the measurement of fear of childbirth. J. Psychosom. Obstet. Gynaecol. 1998, 19, 84–97. [Google Scholar]
- Yamada, F.; Kataoka, Y.; Kitamura, T. Development and validation of a short version of the primary scales of the Inventory of Personality Organization: A study among Japanese university students, Psychology 2022, 13, 872–890. 13.
- Kernberg, O. F.; Clarkin, J. F. IPO.1995, New York Hospital-Cornell Medical Center.
- Burton, L. J.; Mazerolle, S. M. Survey instrument validity Part I: Principles of survey instrument development and validity in athletic training education research. Athl. Train. Educ. J. 2011, 6, 27–35. [Google Scholar]
- Hu, L.-T.; Bentler, P. M. Cutoff criteria for fit indexes in covariance structure analysis: Conventional criteria versus new alternatives. SEM. 1999, 6, 1–55. [Google Scholar]
- Schermelleh-Engel, K.; Moosbrugger, H.; Müller, H. Evaluating the fit of structural equation models: tests of significance and descriptive goodness-of-fit measures. Methods of Psychol. Res. Online 2003, 8, 23–74. [Google Scholar]
- Cliff, N. Some cautions concerning the application of causal modelling methods. Multivariate Behav Res. 1983, 18, 115–126. [Google Scholar] [PubMed]
- Cudeck, R.; Browne, M. W. Cross-validation of covariance structure. Multivariate Behav Res. 1983, 18, 147–167. [Google Scholar] [PubMed]
- Romera, I.; Delgado-Cohen, H.; Prez, T.; Caballero, L.; Gilaberte, I. Factor analysis of the Zung self-rating depression scale in a large sample of patients with major depressive disorder in primary care. BMC Psychiatry 2008, 8, 4. [Google Scholar]
- Borgen, F. H.; Barnett, D. C. Applying cluster analysis in counselling psychology research. J. Couns. Psychol. 1987, 34, 456–468. [Google Scholar]
- Satish, S. M.; Bharadhwaj, S. Information search behaviour among new car buyers: A two-step cluster analysis. IIMB Manag. Rev. 2010, 22, 5–15. [Google Scholar]
- Sarstedt, M.; Mooi, E. A concise guide to market research: The process, data, and methods using IBM SPSS statistics. Springer 2014.
- Meehl, P. E.; Yonce, L. J. Taxometric analysis: I. Detecting taxonicity with two quantitative indicators using means above and below a sliding cut (MAMBAC procedure). Psychol. Rep. 1059; (3. [Google Scholar]
- Meehl, P. E.; Yonce, L. J. Taxometric analysis: II. Detecting taxonicity using covariance of two quantitative indicators in successive intervals of a third indicator (Maxcov procedure). Psychol. Rep. 1091; (3. [Google Scholar]
- Waller, N. G.; Meehl, P. E. Multivariate taxometric procedures: Distinguishing types from continua. Sage Publications. 1998.
- Ruscio, J.; Walters, G. D.; Marcus, D. K.; Kaczetow, W. Comparing the relative fit of categorical and dimensional latent variable models using consistency tests. Psychol. Assess. 2010, 22, 5–21. [Google Scholar]
- Ruscio, J.; Carney, L. M.; Dever, L.; Pliskin, M.; Wang, S. B. Using the Comparison Curve Fit Index (CCFI) in taxometric analyses: Averaging curves, standard errors, and CCFI profiles. Psychol. Assess. 2018, 30, 744–754. [Google Scholar]
- Ruscio, J.; Wang, S.B. RTaxometrics: Taxometric Analysis. R package version 3.2. 2021. https://cran.r-project.org/package=RTaxometrics.
- Orth, U.; Clark, D. A.; Donnellan, M. B.; Robins, R. W. Testing prospective effects in longitudinal research: Comparing seven competing cross-lagged models. J Pers Soc Psychol. 2021, 120, 1013–1034. [Google Scholar] [PubMed]
- Klein, R. B. Principles and practice of structural equation modelng (2nd ed.). Guilford, 2005. [Google Scholar]
- Bentler, P. M.; Freeman, E. M. Tests for stability in linear structural equation systems. Psychometrika 1983, 48, 143–145. [Google Scholar]
- Fox, J. Effect analysis in structural equation models. SMR 1980, 9, 3–28. [Google Scholar]
- Ruscio, J.; Ruscio, A.M.; Haslam, N. Introduction to the taxometric method: A practical guide (1st ed.). Routledge 2006. [CrossRef]
- Ruscio, J.; Ruscio, A. M.; Carney, L. M. Performing taxometric analysis to distinguish categorical and dimensional variables. J. Exp. Psychopathol. 2011, 2, 170196. [Google Scholar]
- Bustos, M.; Venkataramanan, R.; Caritis, S. Nausea and vomiting of pregnancy: What's new? Auton Neurosci. 2017, 202, 62–72. [Google Scholar] [CrossRef]
- Borner, T; Pataro A.M.; De Jonghe, B.C.; Central mechanisms of emesis: A role for GDF15. Neurogastroenterol Motil, e: 00, 1488. [CrossRef]
- Cox, J.L.; Holden, J.M; Sagovsky, R. Detection of postnatal depression. Development of the 10-item Edinburgh Postnatal Depression Scale. Br J Psychiatry. [CrossRef]
- Jomeen, J.; Martin, C. R. Replicability and stability of the multidimensional model of the Edinburgh Postnatal Depression Scale in late pregnancy. J Psychiatr Ment Health Nurs. 2007, 14, 319–324. [CrossRef]
- Soyemi, A. O.; Sowunmi, O. A.; Amosu, S. M.; Babalola, E. O. Depression and quality of life among pregnant women in first and third trimesters in Abeokuta: A comparative study. S Afr J Psychiatr. 2022, 28, 1779. [Google Scholar] [CrossRef]
- Suenaga, H. Comparison of response options and actual symptom frequency in the Japanese version of the Edinburgh Postnatal Depression Scale in women in early pregnancy and non-pregnant women. BMC pregnancy childbirth. 2022, 22, 937. [Google Scholar] [CrossRef]
- Kozinszky, Z.; Töreki, A.; Hompoth E., A.; Dudas, R. B.; Németh, G. A more rational, theory-driven approach to analysing the factor structure of the Edinburgh Postnatal Depression Scale. Psychiatry Res. 2017, 250, 234–243. [Google Scholar] [CrossRef]
- Fujita, K.; Otsuki, E. Factor structure and measurement invariance of the Edinburgh Postnatal Depression Scale during the perinatal period: a longitudinal study of Japanese women. Minerva Psychiatry. 2024, 65, 43–50. [Google Scholar] [CrossRef]
- Kubota, C.; Inada, T.; Nakamura, Y.; Shiino, T.; Ando, M.; Aleksic, B.; Yamauchi, A.; Morikawa, M.; Okada, T.; Ohara, M.; Sato, M.; Murase, S.; Goto, S.; Kanai, A.; Ozaki, N. Stable factor structure of the Edinburgh Postnatal Depression Scale during the whole peripartum period: Results from a Japanese prospective cohort study. Sci Rep. 2018, 8, 17659. [Google Scholar] [CrossRef] [PubMed]
- Stefana, A.; Langfus, J. A.; Palumbo, G.; Cena, L.; Trainini, A.; Gigantesco, A.; Mirabella, F. Comparing the factor structures and reliabilities of the EPDS and the PHQ-9 for screening antepartum and postpartum depression: A multigroup confirmatory factor analysis. Arch Womens Ment Health. 2023, 26, 659–668. [Google Scholar] [CrossRef] [PubMed]
- van Oudenhove, L.; Jasper, F.; Walentynowicz, M.; Witthöft, M.; van den Bergh, O.; Tack, J. The latent structure of the functional dyspepsia symptom complex: A taxometric analysis. NEUROGASTROENT MOTIL 2016, 28, 985–993. [Google Scholar]
- Salomonsson, B. Psychodynamic interventions in pregnancy and infancy: Clinical and theoretical perspectives. Routledge 2018.
- Sartori, J.; Petersen, R.; Coall, D. A.; Quinlivan, J. The impact of maternal nausea and vomiting in pregnancy on expectant fathers: Findings from the Australian Fathers’ Study. J. Psychosom. Obstet. Gynaecol. 2018, 39, 252–258. [Google Scholar]
Figure 1.
CCFI profile for Study 1 (N = 382) CCFI profiles are labeled as M for MAMBAC (mean above minus below a cut), X for MAXEIG (MAXimum EIGenvalue), and L for L-Mode (latent mode). Solid data points represent the mean CCFI profile.
Figure 1.
CCFI profile for Study 1 (N = 382) CCFI profiles are labeled as M for MAMBAC (mean above minus below a cut), X for MAXEIG (MAXimum EIGenvalue), and L for L-Mode (latent mode). Solid data points represent the mean CCFI profile.
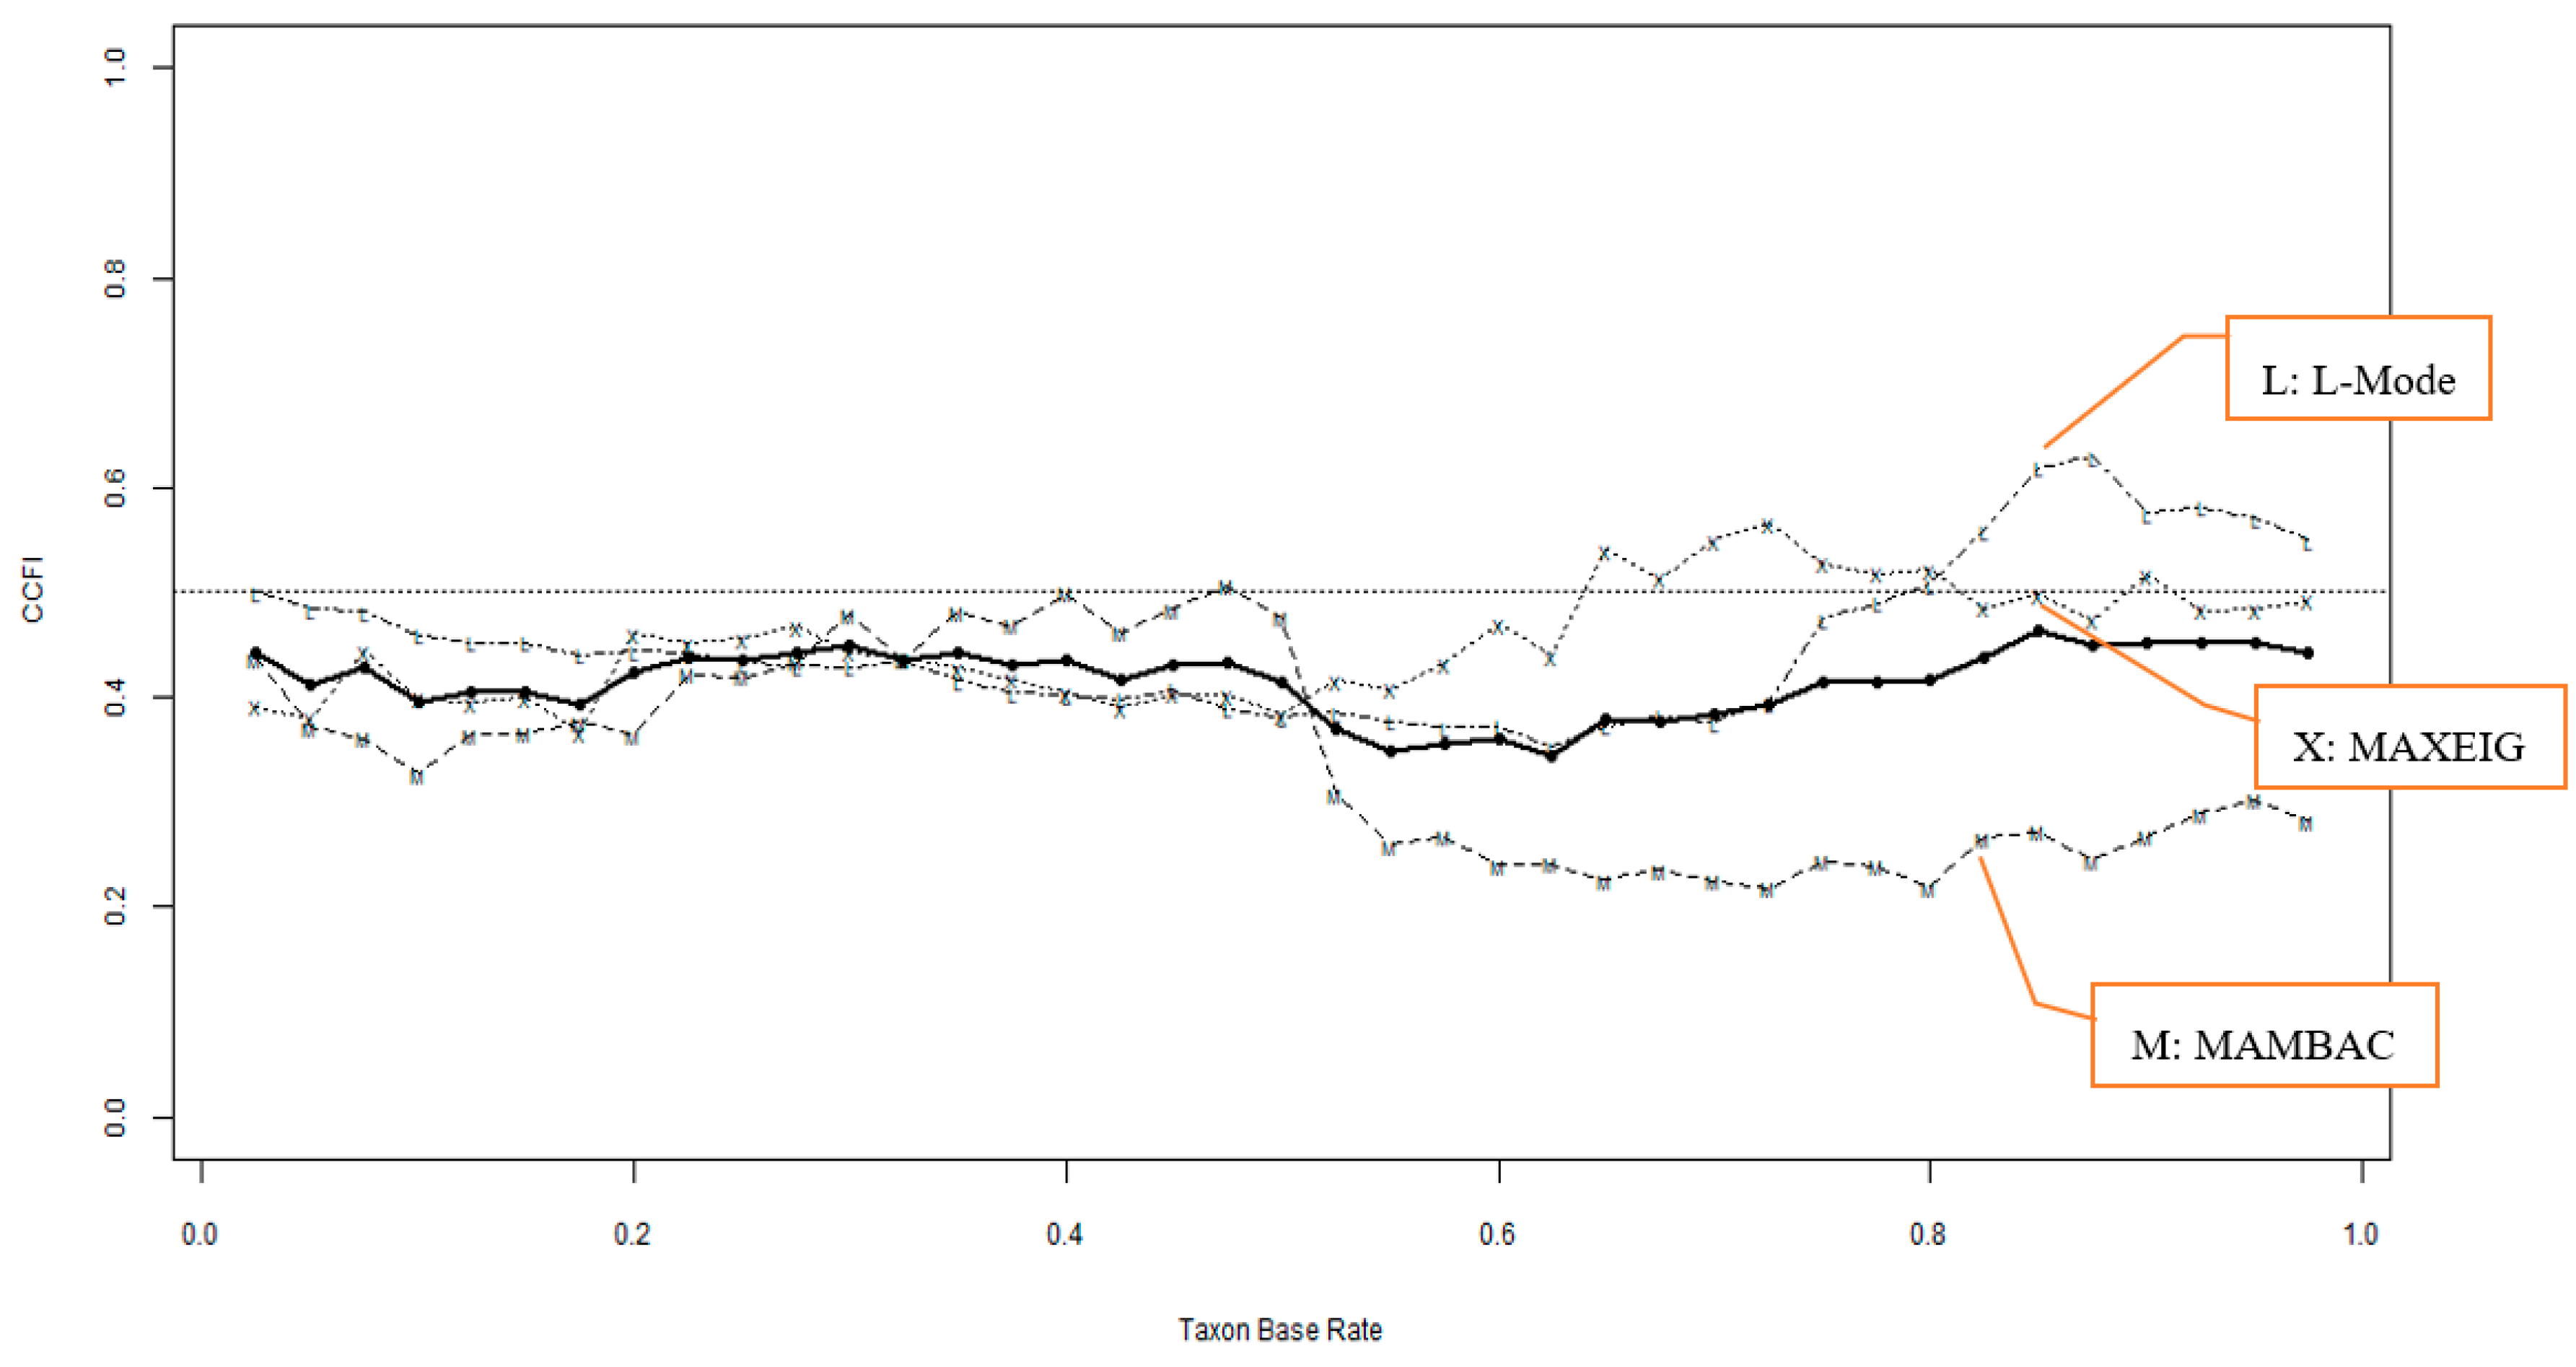
Figure 2.
CCFI profile for Study 2 (N = 696) CCFI profiles are labeled as M for MAMBAC (mean above minus below a cut), X for MAXEIG (MAXimum EIGenvalue), and L for L-Mode (latent mode). Solid data points represent the mean CCFI profile.
Figure 2.
CCFI profile for Study 2 (N = 696) CCFI profiles are labeled as M for MAMBAC (mean above minus below a cut), X for MAXEIG (MAXimum EIGenvalue), and L for L-Mode (latent mode). Solid data points represent the mean CCFI profile.
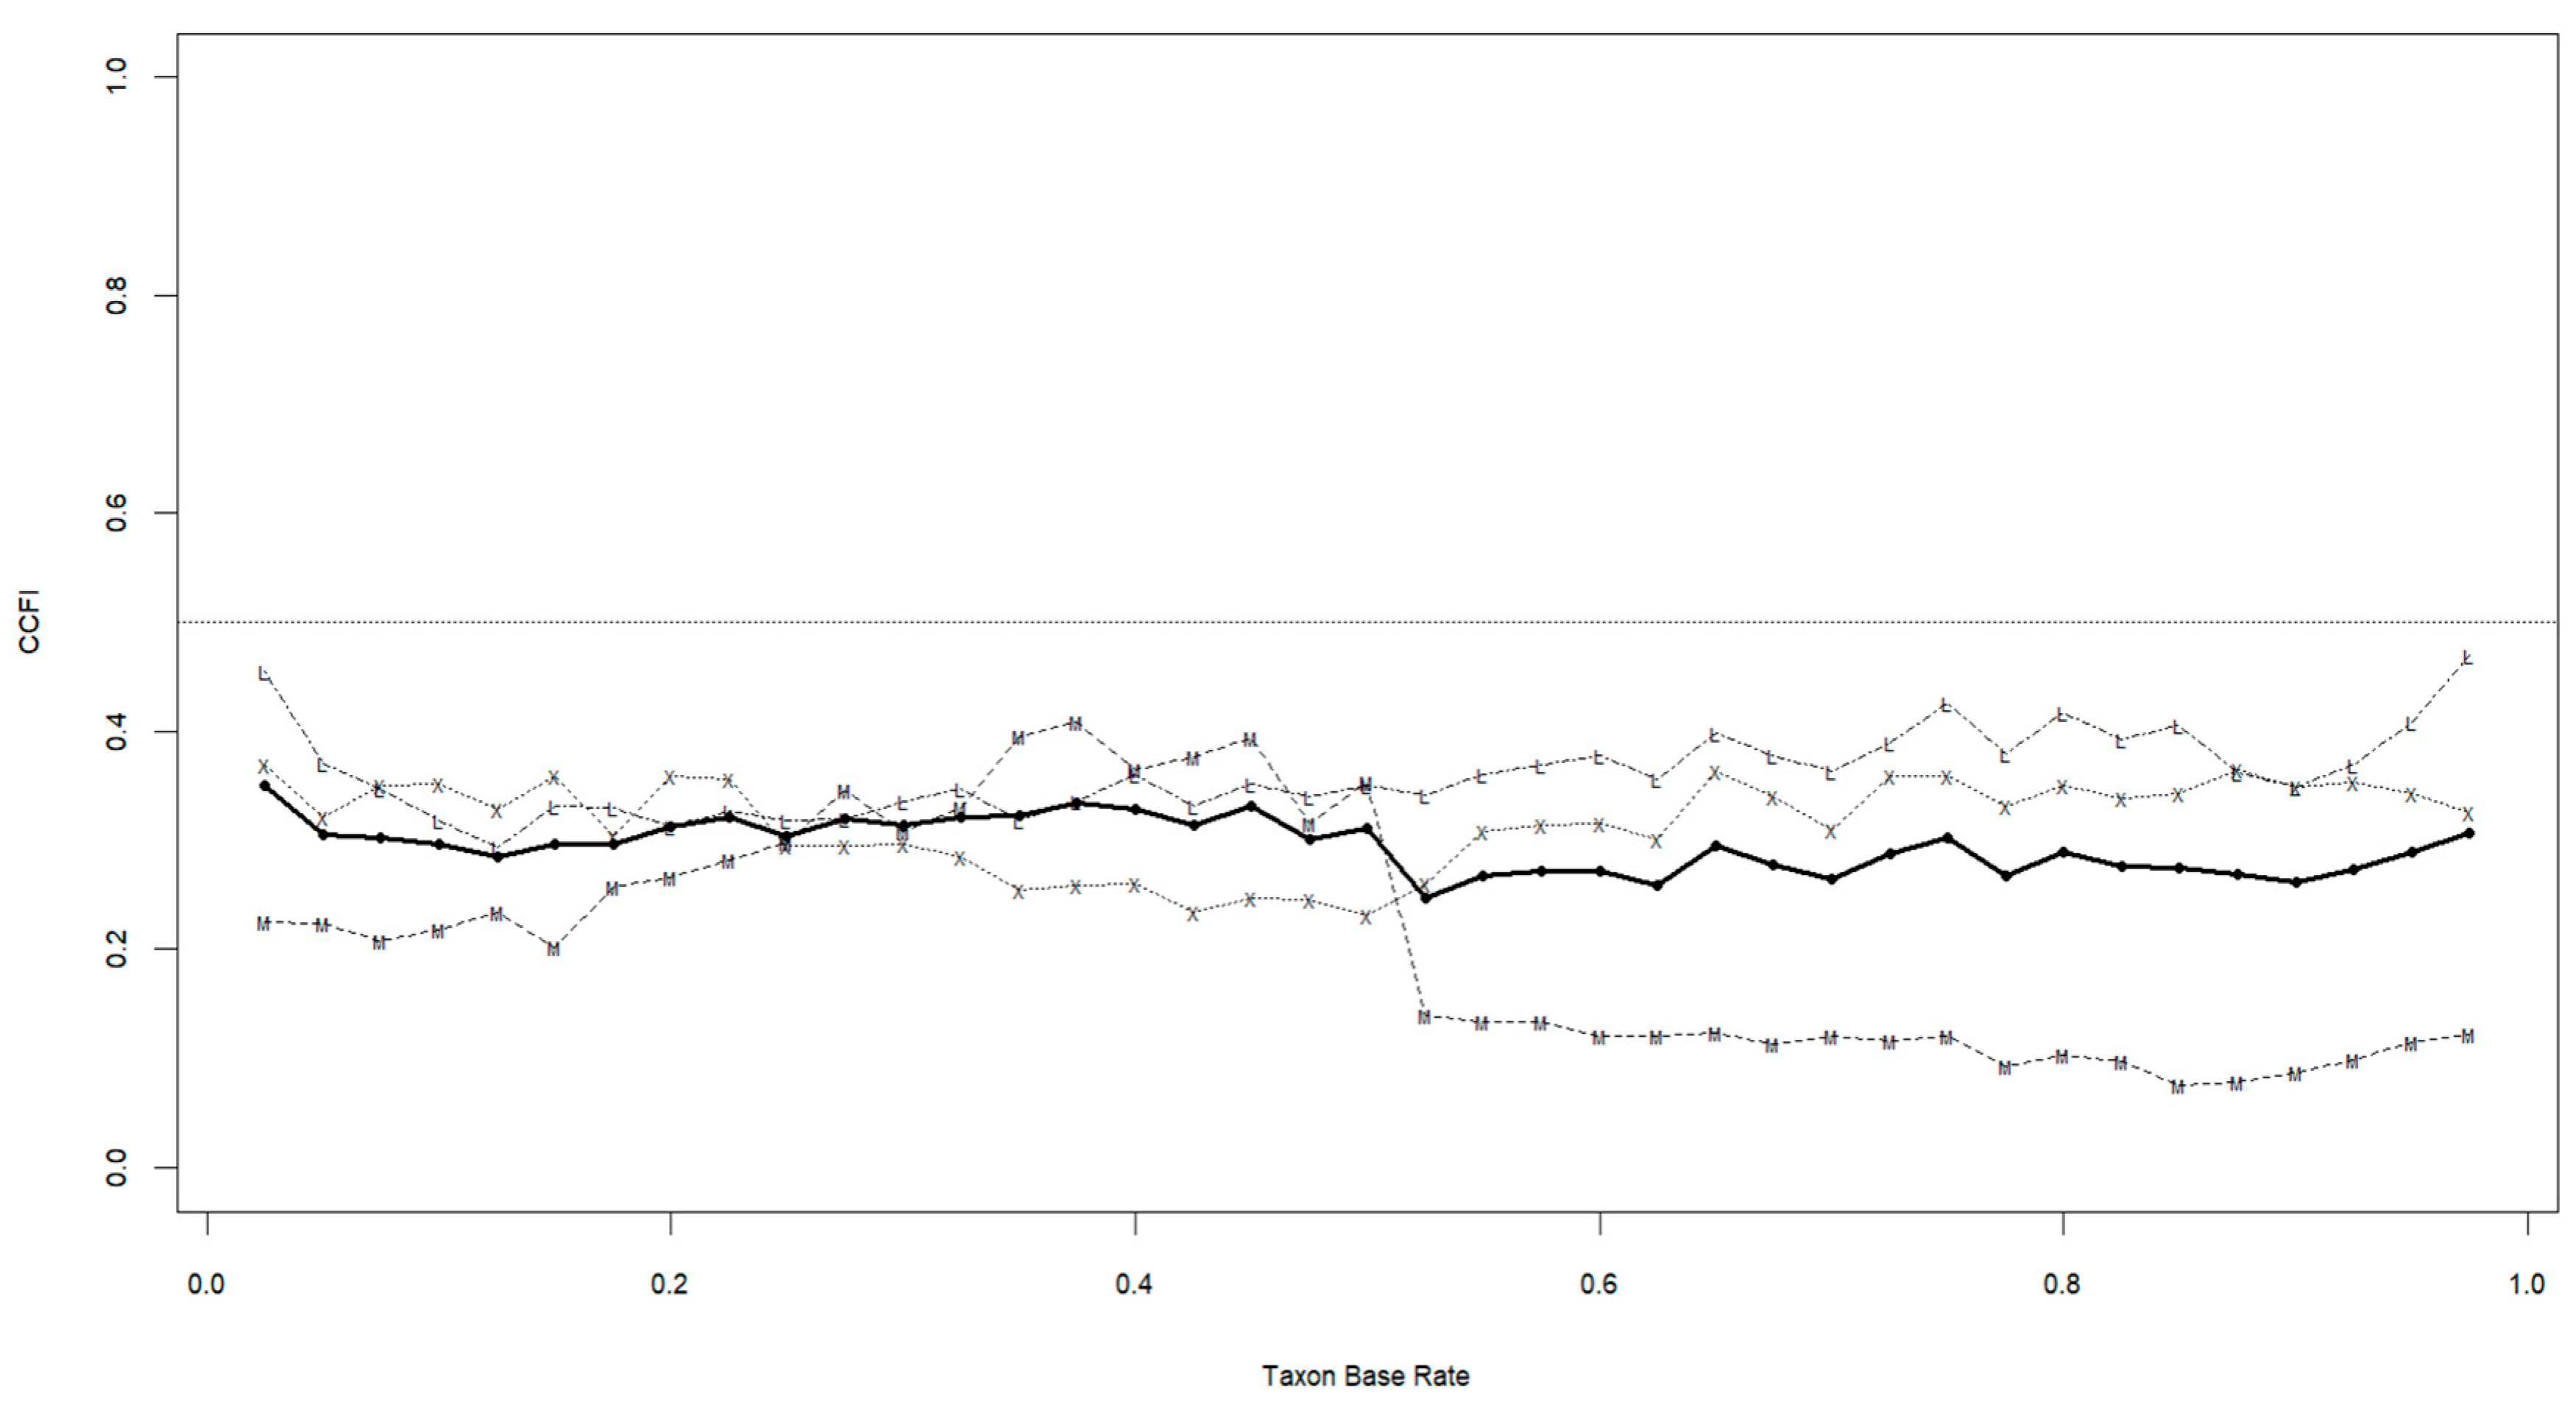
Figure 3.
Recurssive structured equation model in Study 1. dep11, depressed mood at Time 1; dep12, loss of interest at Time 1; dep21, depressed mood at Time 2; dep22, loss of interest at Time 2; DEP1, Depression at Time 1; DEP2, Depression at Time 2; P11, nausea at Time 1; P12, vomiting at Time 1; P13, retching at Time 1; P21, nausea at Time 2; P22, vomiting at Time 2; P23, retching at Time 2. Statistically significant paths are in bold. Correlations of error terms of each item between Time 1 and Time 2 are calculated but not shown for the sake of visibility.
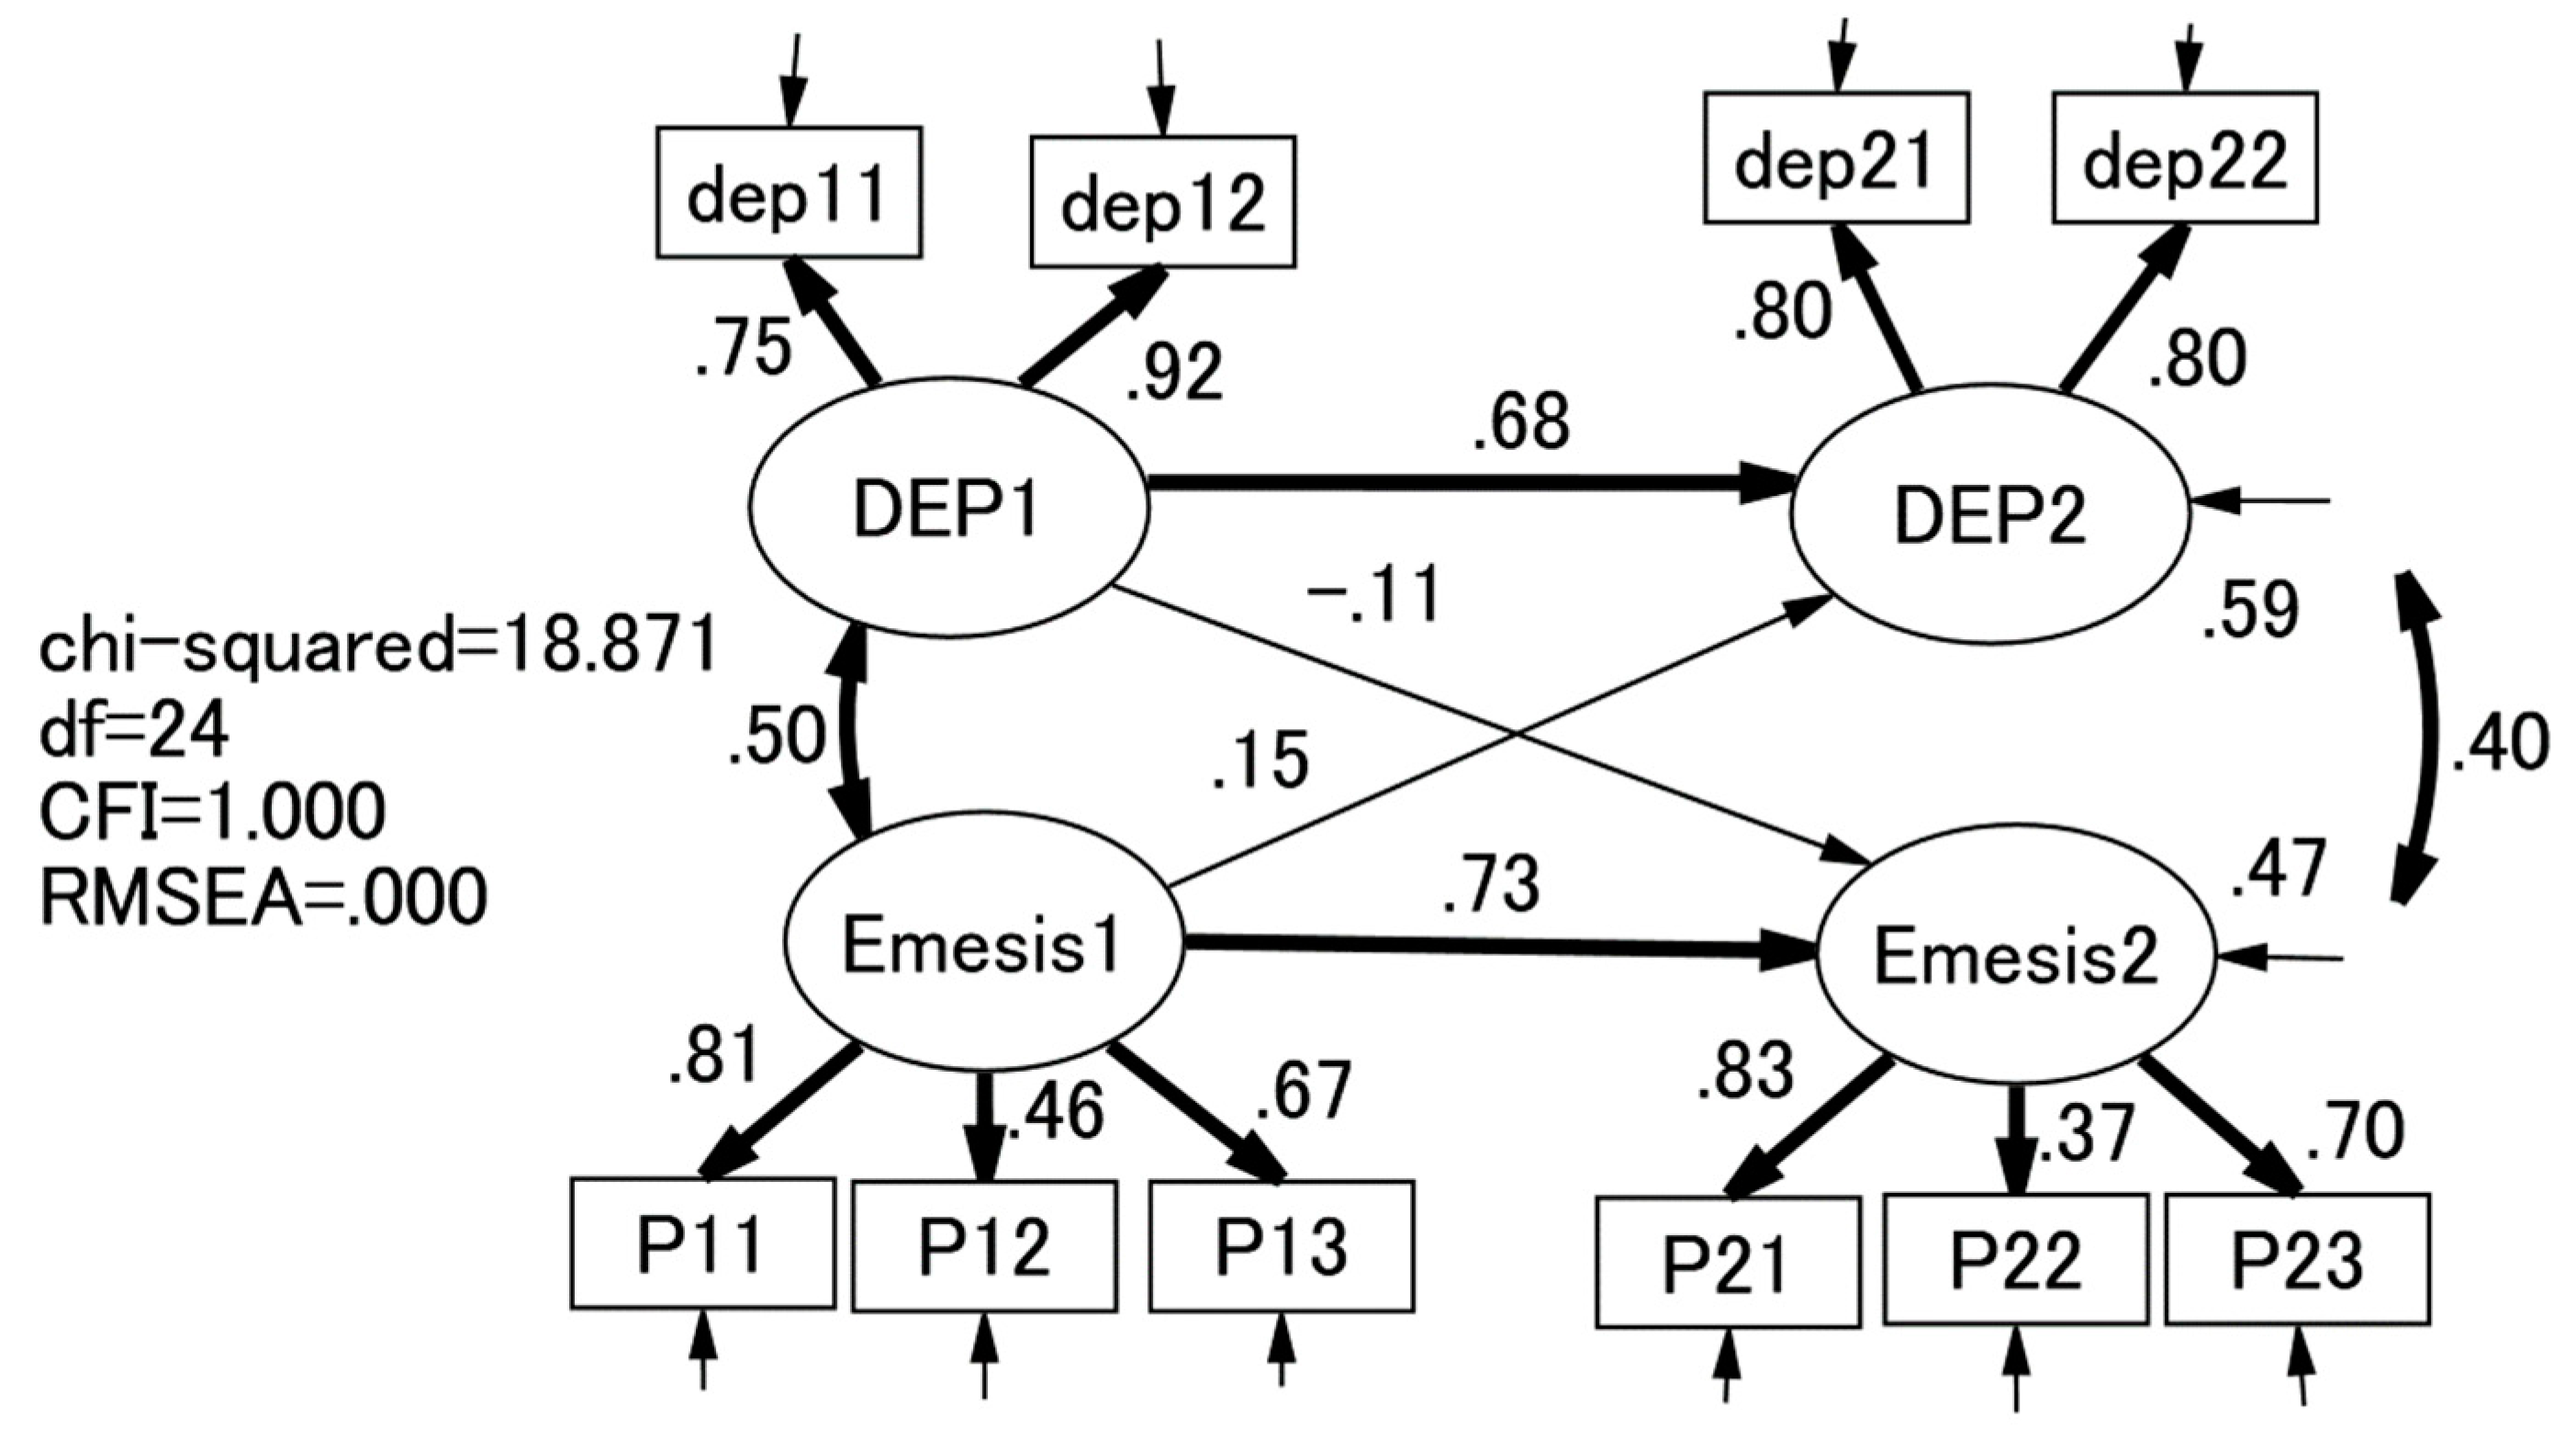
Figure 4.
Recurssive structured equation model in Study 2. dep11, depressed mood at Time 1; dep12, loss of interest at Time 1; dep21, depressed mood at Time 2; dep22, loss of interest at Time 2; DEP1, Depression at Time 1; DEP2, Depression at Time 2; P11, nausea at Time 1; P12, vomiting at Time 1; P13, retching at Time 1; P21, nausea at Time 2; P22, vomiting at Time 2; P23, retching at Time 2. Statistically significant paths are in bold. Correlations of error terms of each item between Time 1 and Time 2 are calculated but not shown for the sake of visibility.
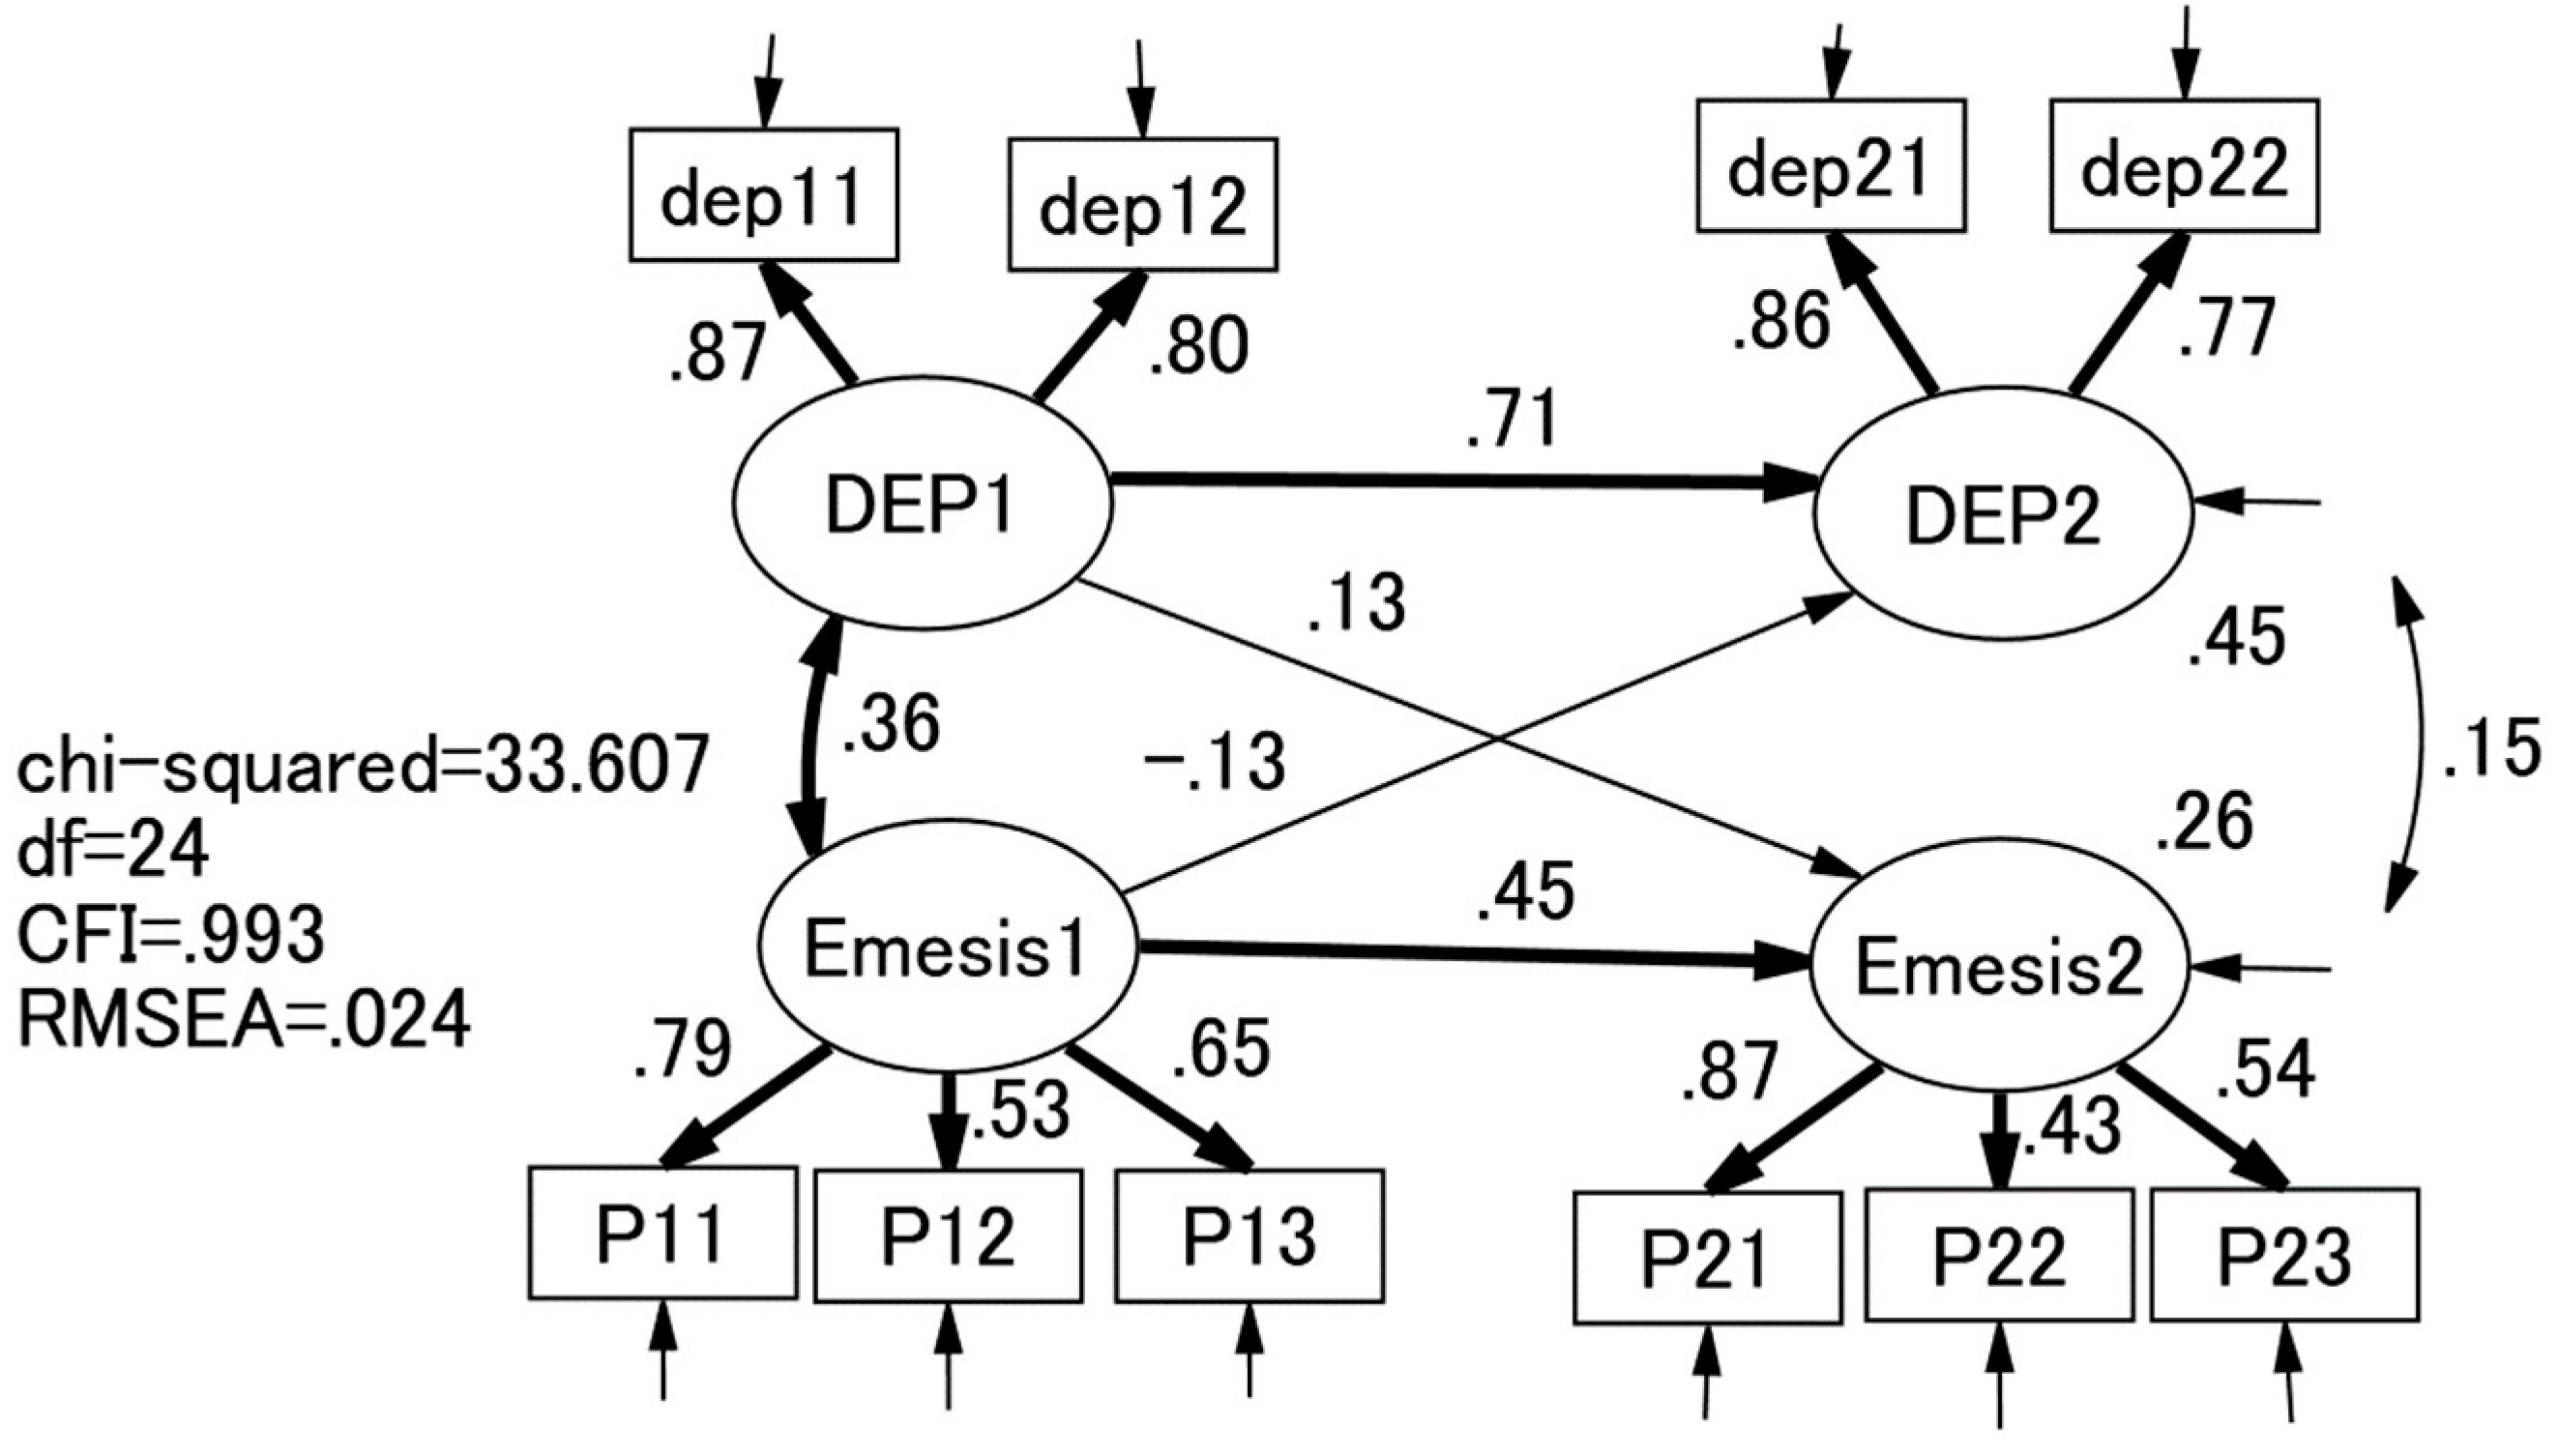

Table 1.
Means, SDs, skewness, kurtosis, and correlations of 7 items in the firt halved sample of Study 1 (n = 184) and Study 2 data sets (n = 350).
Table 1.
Means, SDs, skewness, kurtosis, and correlations of 7 items in the firt halved sample of Study 1 (n = 184) and Study 2 data sets (n = 350).
| Item | Mean | SD | skewness | kurtosis | 1 | 2 | 3 | 4 |
|---|---|---|---|---|---|---|---|---|
| 1: depressed mood | 1.52 1.62 |
0.73 0.80 |
1.53 1.33 |
2.37 1.39 |
--- | |||
| 2: loss of interest | 1.70 1.64 |
0.87 0.75 |
1.18 1.23 |
0.74 1.50 |
.63*** .73*** |
--- | ||
| 3: nausea | 3.10 2.70 |
1.50 1.45 |
-0.05 0.38 |
-1.36 0.13 |
.22*** .19*** |
.41*** .19*** |
--- | |
| 4: vomitting | 1.27 1.25 |
0.70 0.60 |
3.23 2.69 |
11.57 8.07 |
.26*** .23*** |
.31*** .26*** |
.37*** .40*** |
--- |
| 5: retching | 2.18 1.97 |
1.33 1.24 |
0.94 1.25 |
-0.31 0.13 |
.19** .21*** |
.35*** .25*** |
.54*** .50*** |
.45*** .33*** |
Upper and lower vlaues are those in Studies 1 and 2, respectively.
Table 2.
Exploratory factor analyses of depression and emesis variables in the the firt halved sample of Study 1 (n = 184) and Study 2 (n = 350).
Table 2.
Exploratory factor analyses of depression and emesis variables in the the firt halved sample of Study 1 (n = 184) and Study 2 (n = 350).
| Items | 1-factor | 2-factor | |
|---|---|---|---|
| I | I | II | |
| depressed mood |
.52 .83 |
-.03 .75 |
.68 .04 |
| loss of interest |
.66 .87 |
.05 .96 |
.92 -.01 |
| nausea |
.66 .27 |
.60 -.08 |
.11 .84 |
| vomitting |
.57 .33 |
.53 .12 |
.06 .47 |
| retching |
.66 .31 |
.89 -.05 |
-.10 .61 |
Upper and lower vlaues are those in Studies 1 and 2, respectively. Factor loadings > .3 are in bold.
Table 3.
Correlations of Depression and Emesis with social dysfunction, foetal bonding, obsessive compulsive symptoms, fear of childbirth, IPO, and own and partner’s age in Studies 1 and 2.
Table 3.
Correlations of Depression and Emesis with social dysfunction, foetal bonding, obsessive compulsive symptoms, fear of childbirth, IPO, and own and partner’s age in Studies 1 and 2.
| Correlates | Study 1 (N = 382) | Study 2 (N = 696) | ||
|---|---|---|---|---|
| Depression | Emesis | Depression | Emesis | |
| SDS | .59*** | .39*** | ||
| Foetal bonding; happiness | -.37*** | -.05 | ||
| Foetal bonding; anger | .30*** | .14*** | ||
| Foetal bonding; fear | .32*** | .08* | ||
| Foetal bonding; sadness | .37*** | .17*** | ||
| Foetal bonding; disguat | .36*** | .23*** | ||
| Foetal bonding; surprise | .11** | -.03 | ||
| Foetal bonding; shame | .42*** | .26*** | ||
| Foetal bonding; guilt | .35*** | .11** | ||
| Foetal bonding; alpha pride | -.25*** | -.04* | ||
| Foetal bonding: beta pride | -.34*** | -.08* | ||
| Obsessive compulsive symptoms | .39*** | .14*** | ||
| Fear of child birth | .41*** | .15*** | ||
| IPO total score | .40*** | .10** | ||
| Age | .07 | .07 | -.09* | -.02 |
| Partner’s age | .14** | .06 | ||
* p < .05; ** p < .01; *** p < .001.
Table 4.
Demographic and clinical characteristics of clusters in Studies 1 and 2.
| Study 1 (N = 382) | Study 2 (N = 696) | |||||
|---|---|---|---|---|---|---|
| Cluster I (n = 134) |
Cluster II (n = 240) |
t test (df)/χ2 | Cluster I (n = 215) |
Cluster II (n = 481) |
t test (df)/χ2 | |
| Criterion validity | ||||||
| Depression score (depressed mood + loss of interest) | 4.84 (1.64) | 2.60 (0.75) | 15.0 (164.250) *** | 4.38 (1.82) | 2.63 (0.79) | 13.5 (251.022) *** |
| Major Depressive Episose (MDE) | 44 (32.8%) | 1 (0.4%) | Fisher exact probability p < .001 | |||
| PUQE-24 total score | 8.96 (2.27) | 5.13 (1.79) | 16.9 (226.586) *** | 5.83 (2.28) | 1.65 (1.51) | 24.6 (301.843) *** |
| NVP QOL total score | 142.0 (29.1) | 84.4 (33.8) | 16.7 (300.849) *** | |||
| Construct validity | ||||||
| SDS | 12.99 (6.98) | 5.73 (5.69) | 10.3 (232.545) *** | |||
| Foetal bonding; happiness | 9.48 (2.17) | 10.30 (1.76) | 4.9 (345.350) *** | |||
| Foetal bonding; anger | 1.09 (1.99) | 0.43 (1.30) | 4.4 (298.705) *** | |||
| Foetal bonding; fear | 5.61 (2.89) | 4.44 (2.74) | 5.1 (694) *** | |||
| Foetal bonding; sadness | 2.22 (2.73) | 0.97 (1.87) | 6.1 (307.316) *** | |||
| Foetal bonding; disguat | 2.58 (3.06) | 1.06 (2.02) | 6.7 (300.546) *** | |||
| Foetal bonding; surprise | 4.04 (3.13) | 3.79 (3.23) | 1.0 (694) NS | |||
| Foetal bonding; shame | 2.88 (2.84) | 1.21 (1.91) | 7.9 (303.840) *** | |||
| Foetal bonding; guilt | 2.14 (2.86) | 1.03 (2.00) | 5.2 (310.810) *** | |||
| Foetal bonding; alpha pride | 3.91 (2.55) | 4.67 (2.54) | 3.7 (694) *** | |||
| Foetal bonding: beta pride | 8.27 (2.77) | 9.33 (2.56) | 4.8 (384.087) *** | |||
| Obsessive compulsive symptoms | 33.8 (17.1) | 25.2 (15.7) | 6.4 (694) *** | |||
| Fear of childbirth | 69.5 (22.9) | 57.9 (19.1) | 6.9 (694) *** | |||
| IPO total score | 17.3 (9.6) | 12.9 (9.3) | 5.7 (694) *** | |||
| Demographic features | ||||||
| Age | 32.6 (4.5) | 31.6 (5.0) | 1.9 (364) NS | 31.6 (4.5) | 31.8 (4.5) | 0.6 (694) NS |
| Husband’s age | 34.4 (5.0) | 33.0 (5.6) | 2.4 (304.393) * | |||
| Nulliparae | 55 (41.4%) | 111 (46.3%) | χ2 (df) = 0.64 (1) NS | |||
* p < .05; ** p < .01; *** p < .001.
Table 5.
Discritive statistics of indicators for taxometrics analysis.
| rTax | rCom | ||||||||
|---|---|---|---|---|---|---|---|---|---|
| Cohen’s d | 1: | 2: | 3: | 4: | 1: | 2: | 3: | 4: | |
| Study 1 (N = 382) | |||||||||
| intdicator 1: Depression |
1.70 | - | - | ||||||
| indicator 2: nausea |
1.59 | -0.20 | - | 0.20 | - | ||||
| indicator 3: vomitting |
1.39 | -0.14 | 0.18 | - | 0.07 | 0.22 | - | ||
| indicator 4: retching |
2.28 | -0.40 | 0.11 | 0.02 | - | 0.05 | 0.40 | 0.13 | - |
| Study 2 (N = 696) | |||||||||
| intdicator 1: Depression |
1.26 | - | - | ||||||
| indicator 2: nausea |
1.95 | -0.14 | - | -0.06 | - | ||||
| indicator 3: vomitting |
1.35 | 0.08 | 0.13 | - | -0.10 | 0.21 | - | ||
| indicator 4: retching |
2.10 | -0.28 | -0.07 | 0.11 | - | -0.08 | 0.29 | 0.17 | - |
rTax, within-group correlation for the putative Taxon; rCom, within-group correlation for putative Complement.
Disclaimer/Publisher’s Note: The statements, opinions and data contained in all publications are solely those of the individual author(s) and contributor(s) and not of MDPI and/or the editor(s). MDPI and/or the editor(s) disclaim responsibility for any injury to people or property resulting from any ideas, methods, instructions or products referred to in the content. |
© 2025 by the authors. Licensee MDPI, Basel, Switzerland. This article is an open access article distributed under the terms and conditions of the Creative Commons Attribution (CC BY) license (http://creativecommons.org/licenses/by/4.0/).
Copyright: This open access article is published under a Creative Commons CC BY 4.0 license, which permit the free download, distribution, and reuse, provided that the author and preprint are cited in any reuse.


