
Submitted:
21 March 2025
Posted:
24 March 2025
You are already at the latest version
Abstract
The article presents a model for simulation of changes over time in the activity concentration of radon and thoron, and their progeny in an open system. The open system means the stream of radon, thoron, and their progeny can flow into space, and a defined air stream can come outside. In this sense the system can be treated as open. It was also assumed that inside the space may be operating devices equipped with a filtering system, which will reduce the concentration of radon and thoron decay products. Therefore, these assumptions correspond to a situation when in an flow-through chamber, calibration of the devices for the radon or thoron exposure monitoring is carried out, where nuclides are supplied from an emanation or flow through sources inside or outside, but also to spaces in an environment where the source of nuclides is, for example, radon and thoron exhalation, and air stream which flows inside and outside the space. The differential equations were formulated with the assumption that the concentration of radionuclides of concern in space is or became uniform. The equations do not consider possible losses due to diffusion, as well as inertial or gravitational deposition of aerosols.
Keywords:
radon and its short-lived progeny
; thoron and its decay products
; calibration chambers
; above ground and underground facilities
; open system
; model
; tool
1. Introduction
Among the natural radioactive sources, the radon plays a leading role, especially such isotopes as Rn 222, belonging to the uranium series, and Rn 220 from the thorium series (Figure 1). According to the UNSCEAR report [1], the contribution to the average annual dose of 2.4 mSv from both isotopes is 1.3 mSv, therefore, their contribution is predominant. The thoron contribution (Rn 220) is usually smaller. Sometimes, however, the proportions may be reversed where the concentration of the nuclides belonging to the thorium series is greater in comparison to the nuclides from the uranium-series just like in China where in some provinces there are soils enriched with thorium [2].
The radon hazard covers a significant population because the main source of this isotope in the environment is its exhalation from the ground [3,4,5]. In this way, depending on its structure, ventilation, environmental conditions and building construction, residents become an exposed population [6]. Therefore, sometimes, in conditions of increased exposure, it is recommended that the designed buildings have a special structure or, in extreme situations, active forms of reducing the radon concentration are carried out, for example by pumping air from the basement of buildings.
Ventilation largely affects the concentration of radon and thoron. It is certainly worse in caves and underground active or show mines. It is not uncommon that very high concentrations of radon occur in active or show uranium mines, since the average concentration of Ra-226, which is the parent nuclide of radon, is strongly elevated [7,8], for example the both siliceous ore and the silver carbonate ore in the Great Bear Lake field where pitchblende was found, ten tons of ore are estimated to produce about 1 g of Ra-226 was corresponds to the activity concentration of 18,500 kBq/kg [8]. However, even if the radium activity concentration is relatively low, below the average values in the soil (0.025 kBq/kg), the radon concentration can reach very high levels. This is the case, for example, in Polish underground hard coal mines, where, as a result of rock crushing during mining radon exhalation increases, and as a result the potential alpha energy concentration, which is an indicator of this hazard, may reach 15 µJ/m3 [9], while the average value in the open air usually does not exceed 0.05 μJ/m3 in 1 m above the ground [10].
The dose resulting from the presence of radon and thoron in the environment is mainly related to the decay products of these nuclides. It is estimated that already during the first passage of blood through the lungs, the concentration of radon reaches 80-90% of saturation level in it. According to calculations based on the Jacobi-Eisfeld lung dosimetry model [11] for aerosols of 0.25 µm in size which are deposited in the airways with the least efficiency, radon contributes only 2% to the effective dose, while its short-lived progeny 98% assuming that all these isotopes are in radioactive equilibrium. Similar estimation is reported by the latest ICRP report [12]. The epidemiological studies showed that increasing radon activity concentration by 100 Bq/m3 increases the risk of lung cancer by 16% for prolonged exposure period [5], and according to US Environmental Protection Agency [13], radon is responsible for about 21,000 lung cancer deaths every year in U.S. and is considered as the second leading cause of lung cancer after the smoking.
Bearing in mind the importance of the radon hazard on human health, and especially its role in inducing lung cancer, many legal requirements have been developed to reduce this risk. Therefore, the Council Directive of the European Union introduced rules which should protect people against these hazards [14]. Also in other countries, there are rules governing these matters, for example in Australia [15], Canada [16], Great Britain [17] 2022), and the USA [18,19].
The rules for dose assessment have been significantly changed in the new ICRP report [12] as the conversion factors from potential alpha energy concentration to doses have been considerably increased (Table 1). The former recommended effective dose coefficient for occupational exposure due to radon progeny was equal to 1.4 mSv/(mJ/m3⋅h).
The common practice is to measure the radon concentration and calculate the doses based on the recommended equilibrium factors. However, the true equilibrium factors can vary significantly, especially when mechanical ventilation is applied [20,21,22]. Therefore, the ICRP recommendations are more flexible, and for sites where aerosol characteristics are significantly different from usually occurring conditions, and reliable aerosol data are available, and dose assessment based on this data warrants more detailed consideration, the modified dose conversion can be accepted. Therefore, in dubious situations and high exposure, more appropriate risk assessment should be based on direct measurement of the potential alpha energy concentration to avoid the need to accept a recommended equilibrium factor between radon and its decay progeny. Such an approach is recommended in some countries for specific locations, such as mining industry [9,18,19,23]. This approach could also be more appropriate for thoron exposure, where due to the half-life of thoron and its progeny, the most realistic dose estimation can be obtained by the direct measurement of the potential alpha energy concentration.
Both devices designed to measure the potential alpha energy concentration and only the activity concentration of radon and thoron require calibration. There are number of methods and such installations [24,25,26,27]. Typically, the calibration procedure is carried out in an isolated facility. The presented model makes it possible to calculate the activity concentrations inside such systems if the inflowing activity rate is known. It also considers the influence of devices operating inside and equipped with the filter modules, and the outflow of air stream from the system of the defined volume. The solutions can also be applied to objects occurring in an environment of known and limited volume. The possibilities of this model are presented in a schematic way in Figure 2.
2. Method
The basis for developing the model is a set of differential equations that correspond to the assumptions formulated above that a constant stream of air containing nuclides of known activity flows into a specific space, inside which air filtration can occur. Moreover, from the system to outside an air stream can flow, which reduces the activity concentration of nuclides inside. At the first step, the differential equations were formulated and then solved. The calculations were tested with the help of the Mathematica software [28]. In the end, the application was developed for the convenient use of these solutions. The application is based on the Excel worksheet and Visual Basic for Applications [29]. There is possible the automatic creation of charts for any parameters indicated and change of their ranges according to their own needs (Figure 3). All numerical values, such as nuclide concentrations and potential alpha energy concentration (PAEC) based on which the charts were created are available to the user in hidden cells of this Excel worksheet. These numerical values also contain information about radon and thoron equilibrium equivalent concentration (EEC) and equilibrium coefficients.
The following parameters are evaluated: the activity concentration of radon, thoron, and their progeny, the potential alpha energy concentration, and the partial contribution of individual isotopes to this value in absolute and percentage terms, and the equilibrium equivalent concentration. There is also possible to evaluate these parameters for two other variants, one of which corresponds to a single injection of radon or thoron into the system, and the other describes changes in the activity concentration of the progeny assuming that the concentration of the parent isotopes is constant, which may correspond to the situation in poorly ventilated facilities.
3. Model Description
The model assumes that the isotopes of radon or thoron, and their progeny can flow into the space with the volume V (m3) with the certain constant inflow activity rate Ei (Bq/s), and at the same period there is a reduction of their decay products because of the operation of devices equipped with filters with the efficiency F. Through the filter the air stream flows with intensity of QD (m3/s), and reduction of all these radionuclides as a result of the air outflow QOut (m3/s) from space. Under such assumptions, the concentrations Ci of the radionuclides (Bq/m3) must change according to the following differential equations:
where the Si, RD , and Rout parameters are equal
The inflow activity rate Ei can be also expressed by the inflow rate QIn and the inflow activity concentration CIni
The following notations were introduced to simplify the form of solutions of these equations:
Decay constants such are λi (or λj) are related to radon and its progenies in the following way: Rn-222 (i, j= 1), Po-218 (i, j = 2), Pb-214 (i, j = 3), Bi-214 (i, j = 4), and for thoron and its decay product: Rn-220 (i, j= 1), Po-216 (i, j = 2), Pb-212 (i, j = 3), Bi-212 (i, j = 4), Po-212 | Tl-208 (i, j =5). The all branch ratios εi for short-lived radon progeny are equal to one. It is different for the decay products of thoron, where ε5=0.638 (Po-212) or ε5=0.362 (Tl-208). Under these assumptions the solutions of the differential equations have the following form:
According to the differential equations the air stream QOut is not returned to the system. However, under certain assumptions, also such a system can be considered with good approximation by the obtained solutions. This issue is discussed in the next chapter.
Depending on the activity concentration, in some denominators there are terms like λi-λ1+RD (i≠1). This means that under specific conditions, singularities may occur in the solutions because such terms may be equal to zero, which is excluded for radon chain. However, these terms when RD=λ1-λ3 or RD=λ1-λ4 or RD=λ1-λ5 (when Tl-208 is considered) can be equal to zero for the nuclides from the thoron chain. The activities of nuclides depend on such factors as the initial concentration, the amount of inflow and outflow of nuclides from the chamber, their natural decay and the intensity of air filtration (RD). In the case of high filtration intensity, the reduction of concentration will not be supplemented by factors increasing their activity within a given space and then these singularities will appear. In practice, however, this is excluded. For example, considering the volume of 20 m3, the air flow in the filtering device would have to reach 15 m3/min (F=100%) and then such a singularity would occur for the concentrations of C3 and C4 in the thoron chain, and for C5 (Tl-208) at a flow of 10 m3/min. For a volume of 1 m3 this would occur at a flow rate of 0.75 m3/min (C3 and C4 concentrations) and 0.5 m3/min (C5 concentration for Tl-208).
The differential equations do not include possible reduction of the activity concentrations due to diffusion especially in relation to the ultrafine particles (below 100 nm in size), as well as inertial or gravitational deposition of aerosols in relation to larger particles and motion. If diffusion, inertia and gravity don’t matter much, the equations may be applied to predict the conditions inside the space with the defined volume or at least to design the calibration procedure. The solutions can be also used to evaluate the radon or thoron source capacity by measuring their activity concentration inside the chamber and then fitting the corresponding activity rate to the obtained measurement results.
4. Results
With a constant inflow of radon or thoron from the outside and an outflow of the same flow rate, the maximum activity concentration of these nuclides in the system with volume V reaches, according to the solutions, the value
If the initial activity concentration of these isotopes in the system is Co1 = 0 then 90% of the maximum value will be reached after time
However, the activity concentration of radon and thoron inside the system with volume V will never be equal to the concentration of these isotopes in the incoming stream because it is the limit when the volume becomes smaller and smaller:
where E1/QOut is the activity concentration in the inflowing air stream to the system, in a situation where the Inflow and outflow rates are the same.
Table 2 shows the C1Max concentrations in the systems for the three different volumes. Due to the differences in half-time, concentrations close to the maximum will be reached faster in the case of thoron. At the same time, however, for this nuclide the values will be much lower compared to the activity concentration in the incoming air stream. These necessitate the use of much more active sources in the case of calibration, especially if the devices intended for measuring the alpha potential energy concentration are calibrated (Figure 4 and Figure 5). The activity concentrations and potential alpha energy concentration for radon and its progeny are considerably higher (Figure 6 and Figure 7). The increase in the inflow rate will not increase the maximum value but will shorten the time until it is reached.
If the chamber works in a closed system, the decay nuclides flowing out of the system flow back into the chamber. In such cases, Coi ≠ 0, which will increase their activity concentration in the system. Such a case of the through-flow closed system corresponds mathematically to a situation where ROut = 0, if there is no significant loss in the meantime between outflow and inflow air travel because of the radioactive decay or filtration. That’s not true for very short-lived nuclides such as Po-216 and Po-212. However, the potential alpha energy concentration is mainly influenced by isotopes with a longer half-life. Moreover, they will be in radioactive equilibrium with their longer-lived parents. Therefore, in practice, their radioactive decay can be neglected in the available flow-through systems. Such calculations assuming ROut = 0 are presented in Figure 8 and Figure 9. In such a case activity concentration will be higher, and the corresponding potential alpha energy concentration is approximately three times as high as in the case where the air is not returned (Figure 5 versus Figure 9). A precise solution to this problem requires the formulation of much more complex differential equations, and the results will not be very different.
An alternative to the use of through-flow chamber can be a closed one with a thoron or radon emanation source. Then the maximum of radon or thoron activity concentration in such a closed system is
Table 3 shows the values of the maximum concentrations that are achievable in systems of three different volumes, assuming that the activity rate is 0.167 Bq/s, which is the same as in Table 1, but there is no outflow stream from the system. This will not change the situation for the thoron as the activity concentration is at the same level as for the flow-through system. However, both the activity concentration of thoron progeny (but Po-216) and corresponding potential alpha energy concentration will be several times higher. The conditions inside will be the same as those presented in Figure 8 and Figure 9. For radon, the activity concentrations will be much higher, while the times of reaching the maximum values will be longer, but for each volume they will be the same according to the formula (12).
The presence of the air filtering devices inside the system can significantly change the activity concentrations, especially if its volume is not large. Figure 10 and Figure 11 illustrate this impact (also Figure 4 versus Figure 10, and Figure 6 versus Figure 11). It is clearly greater in the case of thoron than radon.
Our institute has a climatic chamber with a capacity of 17 m3. The generation of a thoron atmosphere with a sufficiently high concentration of thoron decay products in a chamber with such capacity requires the use of a sufficiently strong source. Due to the short half-life of thoron, the generation of a stable atmosphere in the chamber will not be ensured by a single injection of nuclides or its short-term transmission from the source. For this purpose, a 50 ml thorium chloride solution was used, in which the actinium (Ac-228) activity was 300 Bq/g. Air was passed through the solution at a rate of 2 L/min, but this stream was filtered, which meant that only thoron could enter the chamber. Then, after approximately 80 hours from the beginning of thoron transfer, the potential alpha energy concentration of thoron progeny reached 54 µJ/m3. Therefore, from the equation it can be concluded that achieving such a concentration level in 17 m3 volume chamber requires a constant supply of thoron to the chamber at a constant activity rate inflow of about 150 Bq/s. During the one-hour calibration procedure, the devices were operated at an air flow rate of 4 L/min and filtration efficiency close to 99%. In such conditions, the decrease in the concentration of potential alpha energy would be small (Figure 12, left chart). However, if this procedure were repeated three times, the decrease would reach about 5% (Figure 12, right chart).
Achieving the same level of potential alpha energy concentration for radon decay products in such a chamber would require a source with an efficiency of 0.35 Bq/s (Rn-222).
During the calibration, an average size of generated aerosols were 200-300 nm (candles or 1% NaCl solution), which is larger than the maximum size of ultrafine aerosols and much larger than the average size of the unattached fraction of 1.2 nm [30], and the corresponding diffusion coefficient are much less. Moreover, the settling time of such aerosols under the influence of gravity is about 140 hours from a height of 1-1.5 m, which is a lot considering the possible calibration time.
5. Discussion
The differential equations have been formulated for the case when radon and thoron nuclides and their decay products flow to a system of a certain volume, and at the same time an air stream containing these nuclides can flow from it. In addition, it was assumed that there could be air filtering devices inside this system. All these variants can be used optionally by excluding or including them in calculations, and the results obtained allow to predict how both the activity concentrations and the corresponding potential alpha energy concentrations will change over time inside the system. Therefore, it is a flexible model that can be used both for a separate space in the environment (mines, caves, buildings, etc.) and for installations in which devices intended for the assessment of radon (thoron) exposure are calibrated. Some of the results presented in the article show that obtaining stable conditions for device calibration is easier in case of radon than thoron. If these are active devices, equipped with a filtration system, the installation should be more spacious. Then, however, the thoron source must also have a sufficiently high capacity so that the concentrations inside the installation are stable and sufficiently high. Regardless of whether the thoron flows to the chamber from an external flow-through source and air flows outside with the same flow rate, or there is an emanation thoron source of the same efficiency, and the installation is isolated, the activity concentration of thoron will be at the same level. However, in the case of an emanation source, the activity concentrations of the decay products after reaching equilibrium conditions will be, except for Po-216, several times higher. A similar effect in the case of a flow-through source can be achieved when the outflowing air is returned to the installation. An application based on Excel and VBA language was created to support model-based calculations. The developed tool can be used to assess the possibility of a calibration installation taking into account its capacity and the type of calibrated devices.
Supplementary Materials
The following supporting information can be downloaded at the website of this paper posted on Preprints.org. Radon_Thoron_Open_System.xlsb, a file that supports the model-based calculations
Funding
This research was funded by the European RadoNorm project. This project has received funding from the Euratom Research and Training Programme 2019–2020 under grant agreement No 900009 and Polish Minister of Science and Higher Education Programme “PMW” (international co-found projects) under grant agreement No 5156/H2020-Euratom/2020/2021/2.
Institutional Review Board Statement
Not applicable
Informed Consent Statement
Not applicable
Data Availability Statement
All data that refers to the calculations can be found in Radon_Thoron_Open_System.xlsb file which was provided as supplementary material.
Conflicts of Interest
The author declares no conflict of interest.
References
- United Nations Scientific Committee on the Effects of Atomic Radiation (UNSCEAR). Report to the General Assembly, with Scientific Annexes. 1993.
- Hiromi, K., Shinji, Y., Xiaoliang, Li., Shujie, L., Shouzhi, Z., Quanfu, S., Chihaya, K., Suminori, A., Shinji, T. The First Attempt to Reevaluate Radon and Thoron Exposure in Gansu Province Study Using Radon-Thoron Discriminating Measurement Technique. Public Health Front. 2021. https://doi.org/10.3389/fpubh.2021.764201.
- Canadian Centre for Occupational health and Safety (CCOHS). www.ccohs.ca/oshanswers/phys_agents/radon.html (accessed on 27 June 2022).
- Efstratios, G.,V., Nikolopoulos, D. Radon sources and associated risk in terms of exposure and dose. Front. Public Health. 2015. https://doi.org/10.3389/fpubh.2014.00207.
- World Health Organization (WHO). www.who.int/news-room/fact-sheets/detail/radon-and-health (accessed on 12 March 2025).
- Carvalho, C., Ferreira, A., Figueire, J.P. Study of Radon in dwellings-case study in Moimenta da Beira. Occupational Safety and Hygiene II, CRC Press. 2014. Taylor & Francis Group Iprint, ISBN 9780429227349.
- Efstathiou, M., Sarrou, I. & Pashalidis, I. Emanation studies of radium containing materials by a simple radon monitoring system. J. Radioanal. Nucl. Chem. 2013, 298, 673–677. https://Doi.Org/10.1007/S10967-013-2468-0.
- Traill, R., J., and W. B. McClelland, W., B. 1932. Radium from Canadian Pitchblende. Nature 1932, 130, 924. https://doi.org/10.1038/130924b0.
- Skubacz, K., Wysocka, M., Michalik, B., Dziurzyński, W., Krach, A., Krawczyk, J., Pałka, T. Modelling of radon hazards in underground mine workings, Sci. Total Environ. 2019, 695. https://doi.org/10.1016/j.scitotenv.2019.133853.
- Durrani, S.A., Ilić, R. (Eds), Radon measurements by etched track detectors: Applications in radiation protection, Earth sciences and the environment. World Scientific Publishing Co. Pte. Ltd, Singapore. 1997. ISBN: 978-981-02-2666-4. https://doi.org/10.1142/3106.
- Jacobi, W., Eisfeld, K. Dose to tissues and effective dose equivalent by inhalation of 222Rn, 220Rn and their Short-lived daughters, GSF Report S-626. 1980. Institut für Strahlenschutz, Munich-Neuherberg.
- International Commission on Radiological Protection (ICRP). Occupational Intakes of Radionuclides, Part 3, ICRP Publication 137, 2017, Ann. ICRP 46 (3/4).
- US Environmental Protection Agency (EPA). https://www.epa.gov/radon/health-risk-radon (March 12, 2025).
- Council Directive 2013/59/Euratom Of 5 December 2013 Laying down basic safety standards for protection against the dangers arising from exposure to ionising radiation, and repealing Directives 89/618/Euratom, 90/641/Euratom, 96/29/Euratom, 97/43/Euratom And 2003/122/Euratom.
- Australian Radiation Protection and Nuclear Safety Agency (ARPANSA). www.arpansa.gov.au/understanding-radiation/radiation-sources/more-radiation-sources/radon (accessed on 12.03.2025).
- Government of Canada. https://www.canada.ca/en/services/health/publications/health-risks-safety.html (accessed on 12.03.2025).
- UK Health Security Agency (UKHSA). https://www.ukradon.org/information/workplace (accessed on 12.03.2025).
- Agency for Toxic Substances and Disease Registry (ATSDR). www.atsdr.cdc.gov/csem/radon/standards.html (accessed on accessed on 27.06.2022).
- Occupational Safety and Health Administration (OSHA). https://www.osha.gov/laws-regs/regulations/standardnumber/1910/1910.1096 (accessed on 27.06.2022).
- Chen, J., Harley, N., H. A review of radon equilibrium factors in underground mines, caves, and thermal spas. Health Phys.2020, 119 (3), 342-350.
- Otahal, P.,P.,S., Burian, I., Fialova, E., Vosahlik, J. The influence of the equilibrium factor on the estimated annual effective dose from inhaled radon decay oroducts in selected workplaces, Radiat. Prot. Dosim. 2020, 191 (2), 188-191. https://doi.org/10.1093/Rpd/Ncaa165.
- Skowronek, J. 1999. Radiation exposure to miners in Polish coal mines. Radiat. Prot. Dosim., 82(4), 293-300.
- Wysocka, M., Skubacz, K., Michalik, B., Chałupnik, S., Skowronek, S., Bonczyk, M., Chmielewska, I., Samolej, K. The system of monitoring and controlling natural radiation hazards in Polish coal mines. Int. J. Min. Miner. Eng. 2021, 12 (3), 229-249. https://doi.org/10.1504/IJMME.2021.119216.
- Kobayashi, Y., Tokonami, S., Takahashi, H., Zhuo, W., Yonehara, H. Practicality of the thoron calibration chamber system at NIRS, Japan. International Congress Series. 2005, 1276, 281-282.
- Röttger, A., Honig, A., Arnold, D. The German thoron progeny chamber - Concept and application. Appl. Radiat. Isot. 2009, 67 (5), 839-842. https://doi.org/10.1016/J.Apradiso.2009.01.043.
- Shweikani, R., Badr, I., Maged, A.F., A. F., Andam, A.A., Durrani, S.A. A new calibrated chamber for parametric studies of radon and thoron gases. Radiat. Meas. 1995, 25 (1-4), 613-614. https://doi.org/10.1016/1350-4487(95)00198-N.
- Tokonami, S., Ishikawa, T., Sorimachi, A., Takahashi, H., Miyahara, N. The Japanese radon and thoron reference chambers. AIP Conference Proceedings. 2008, 1034, 202. https://doi.org/10.1063/1.2991208.
- Mathematica, 2010. VERSION 8.0.4.0. Wolfram, Long Hanborough Oxfordshire, United Kingdom.
- Excel, 2016. Microsoft Excel 2016. Microsoft Corporation, Redmond, USA.
- Reineking, A.; Porstendörfer, J. Unattached fraction of short-lived radon decay products in indoor and outdoor environments: An improved single-screen method and results. Health Phys. 1990, 58, 715–727.
Figure 1.
Radon and thoron decay diagrams.
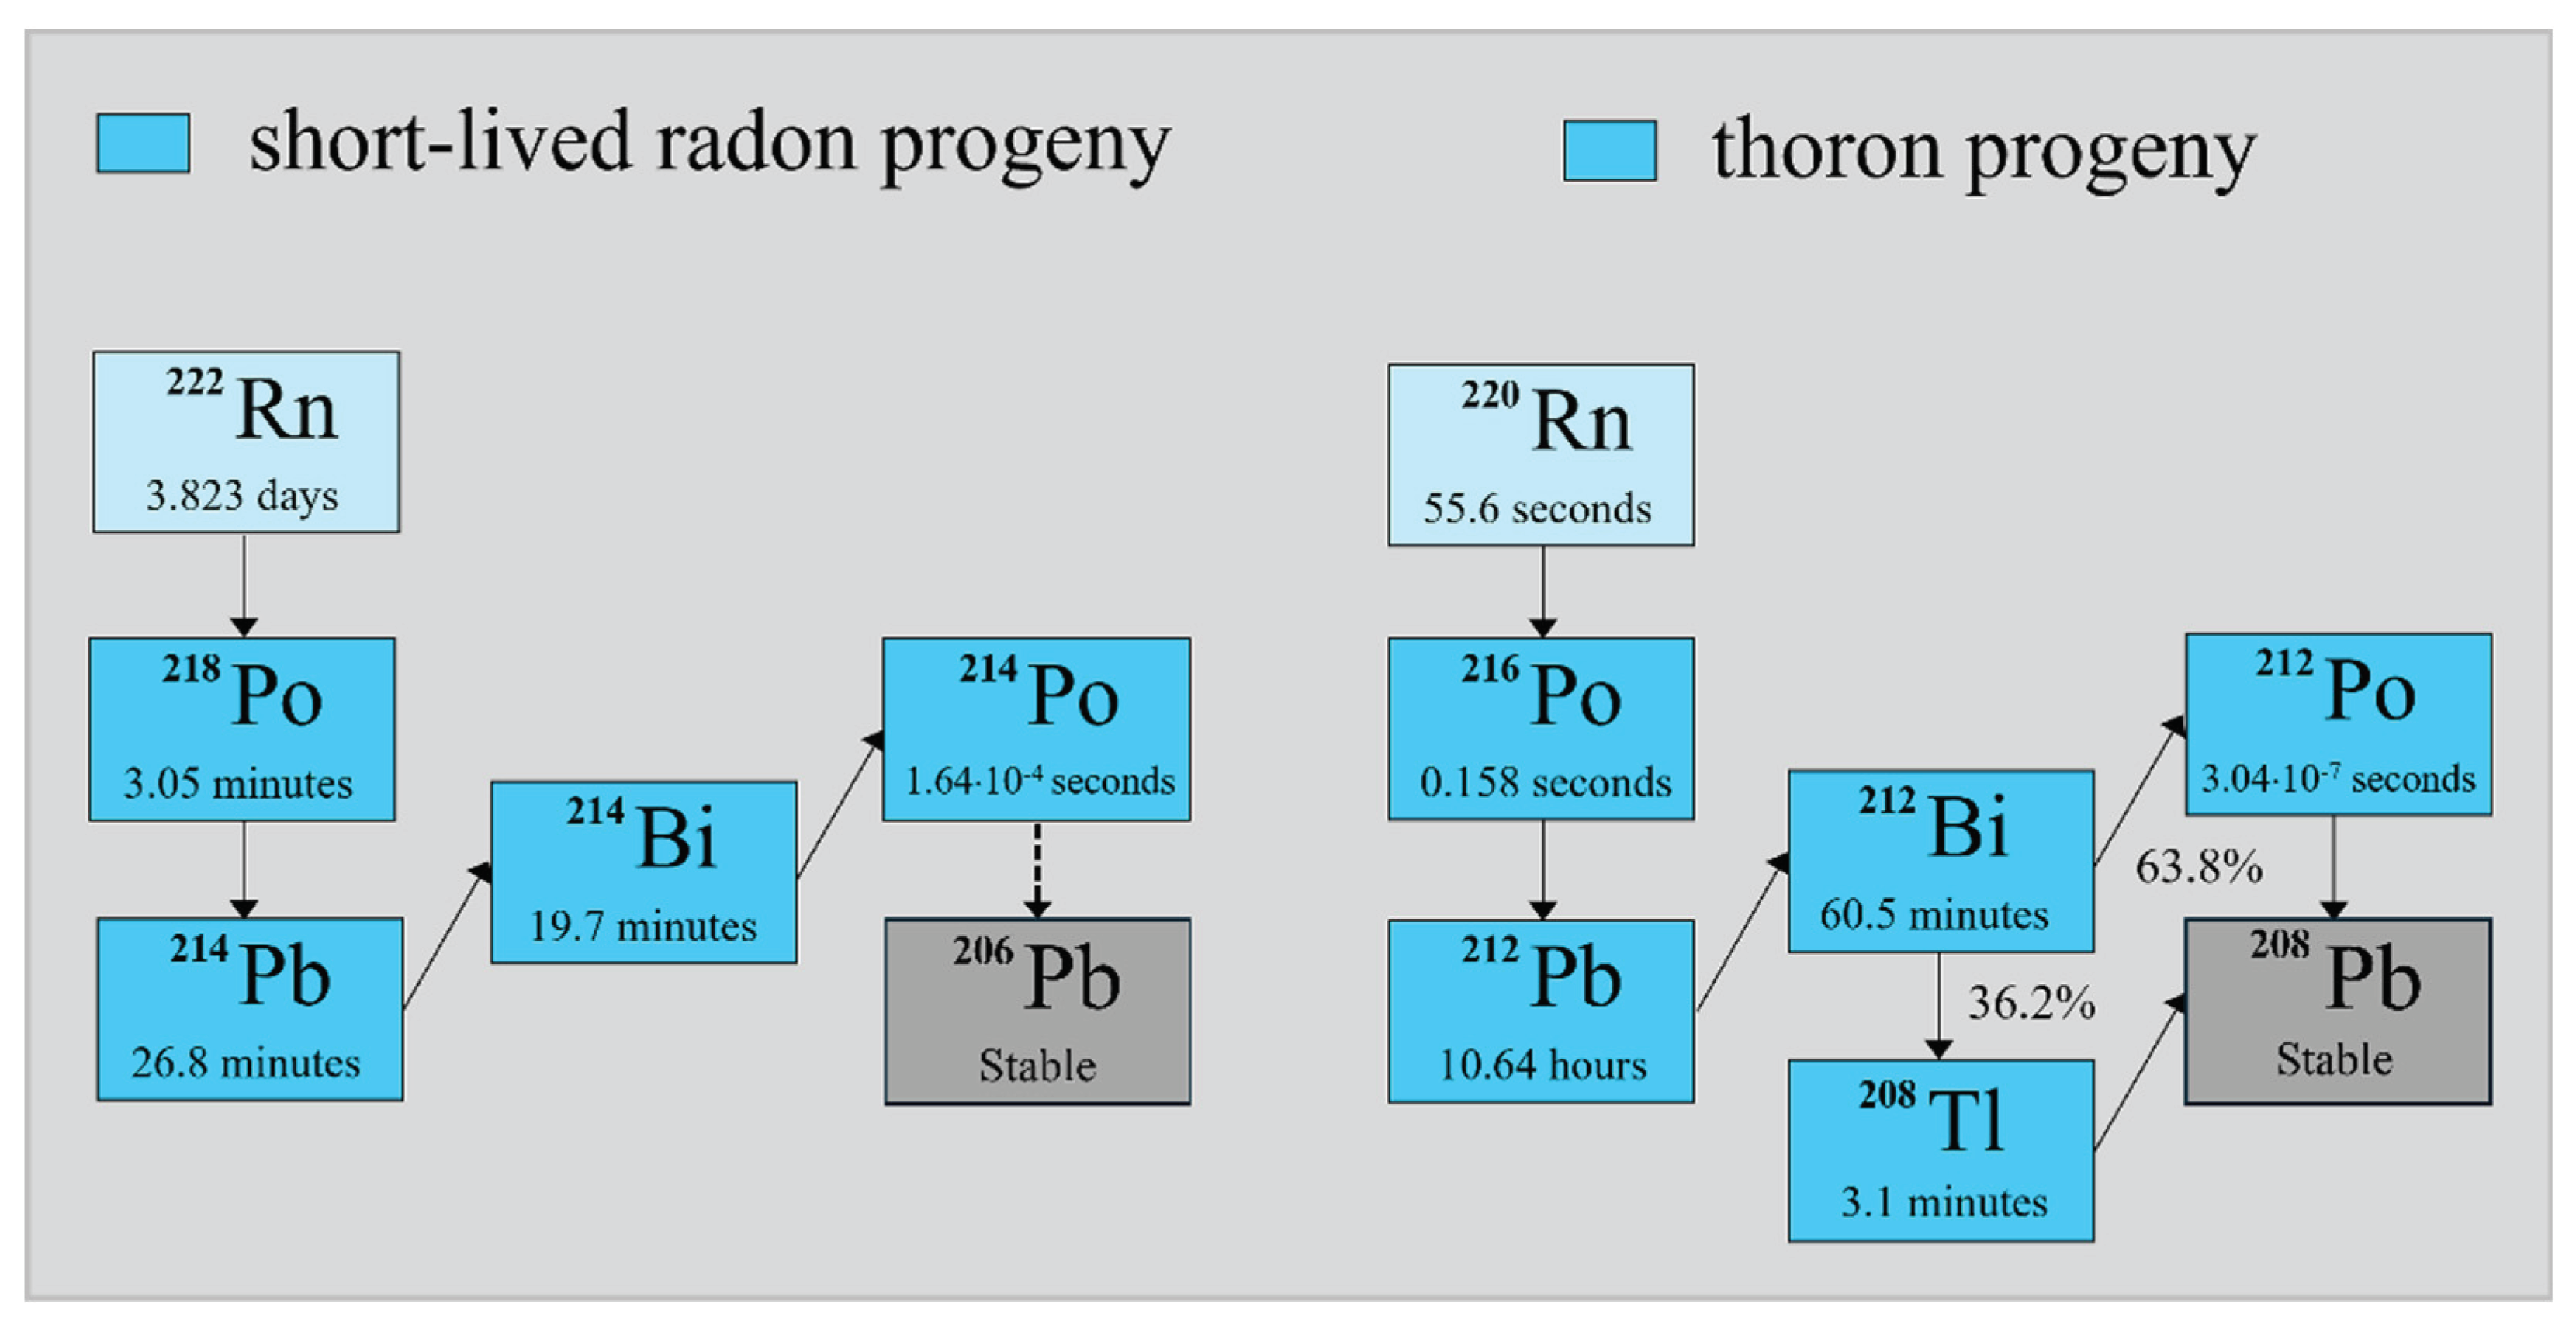
Figure 2.
Basic assumptions of the model.
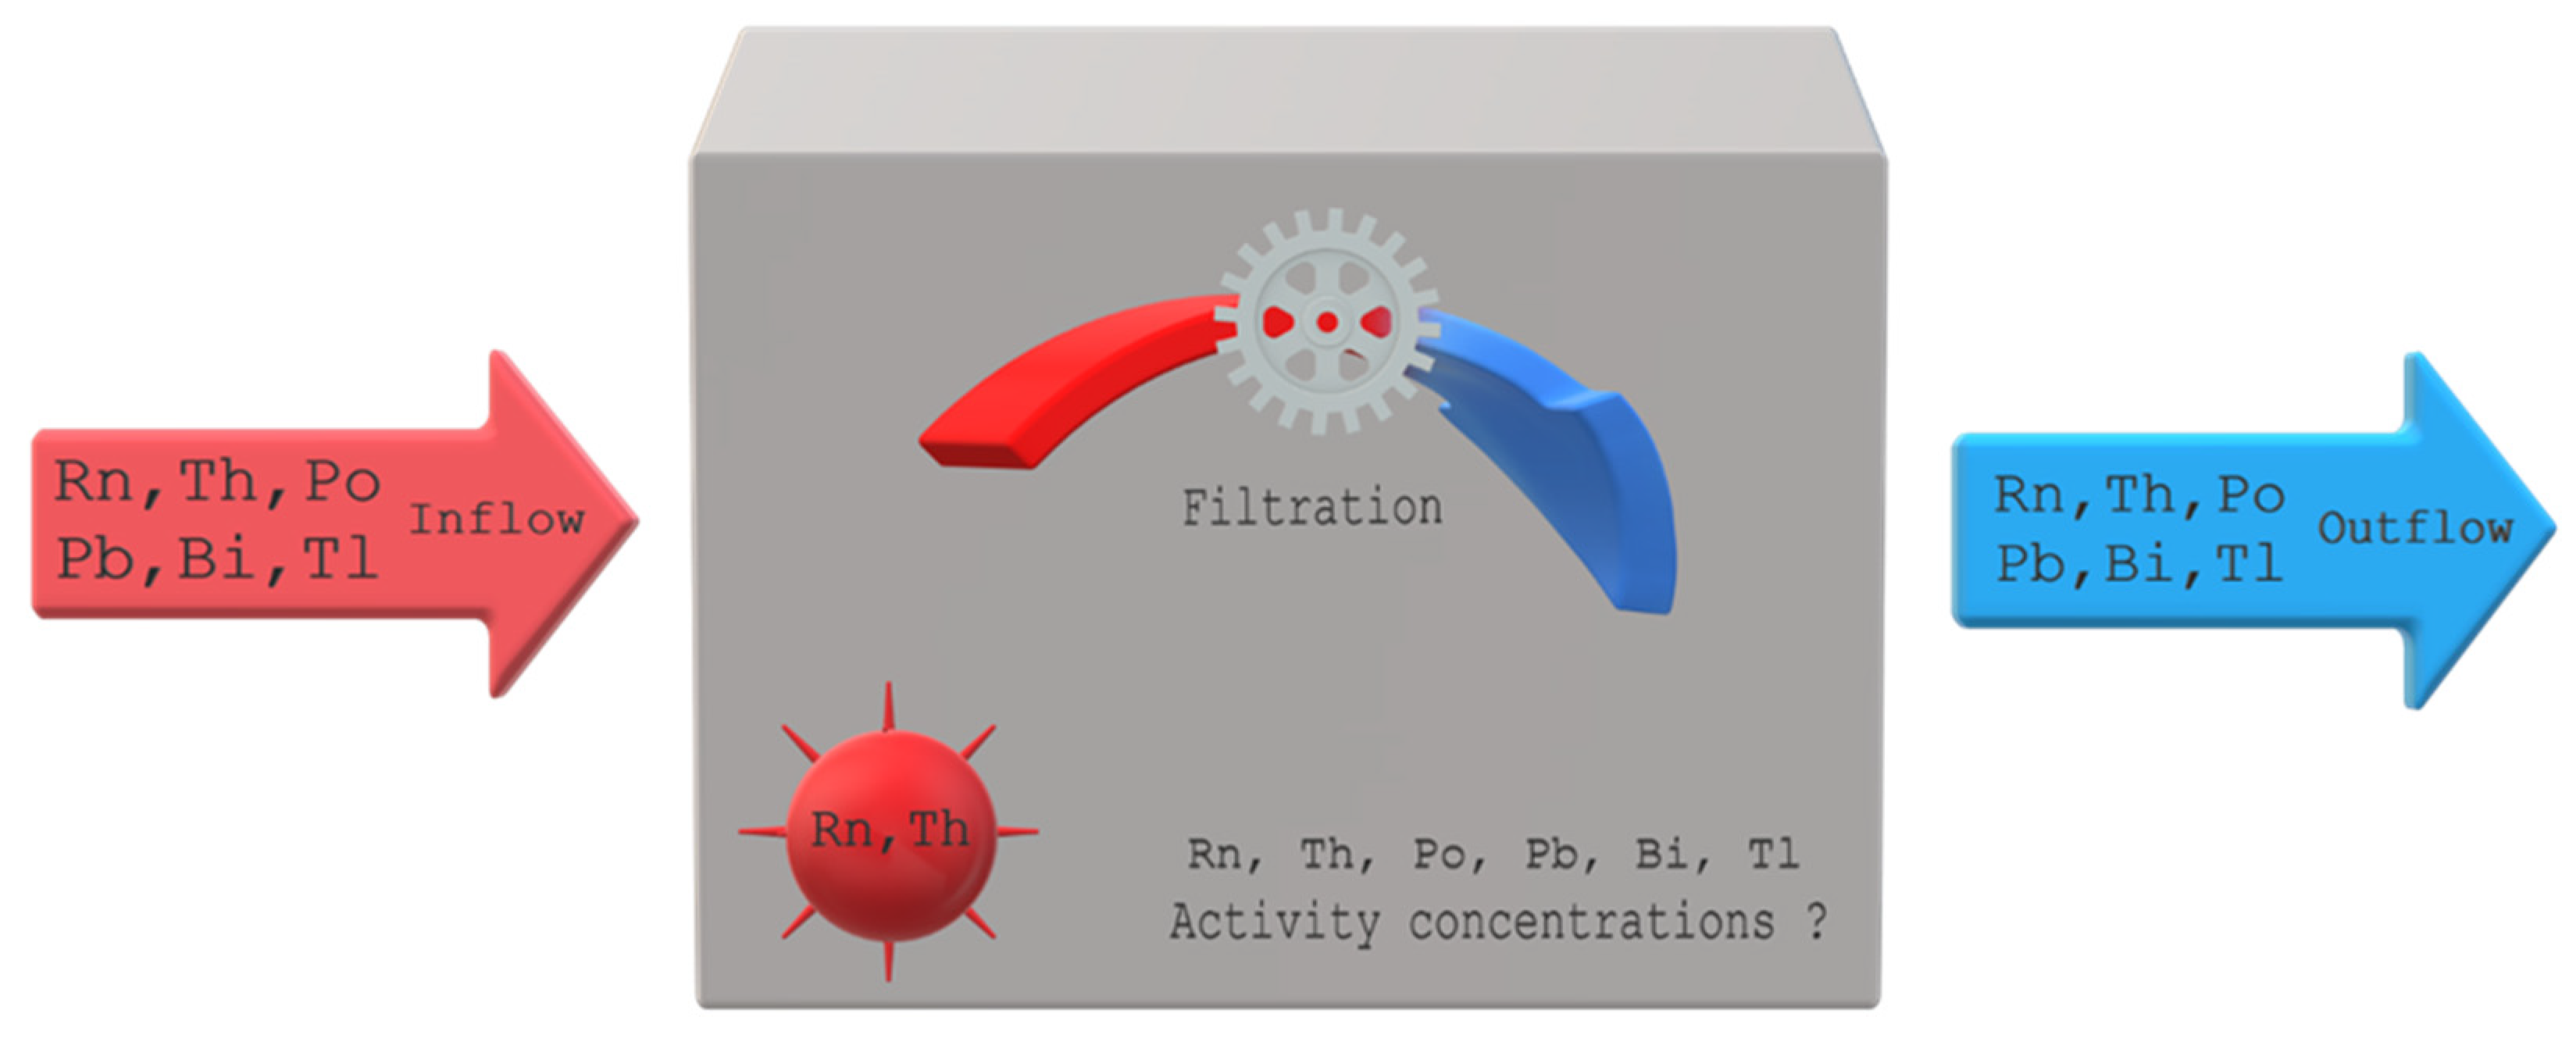
Figure 3.
User interface.
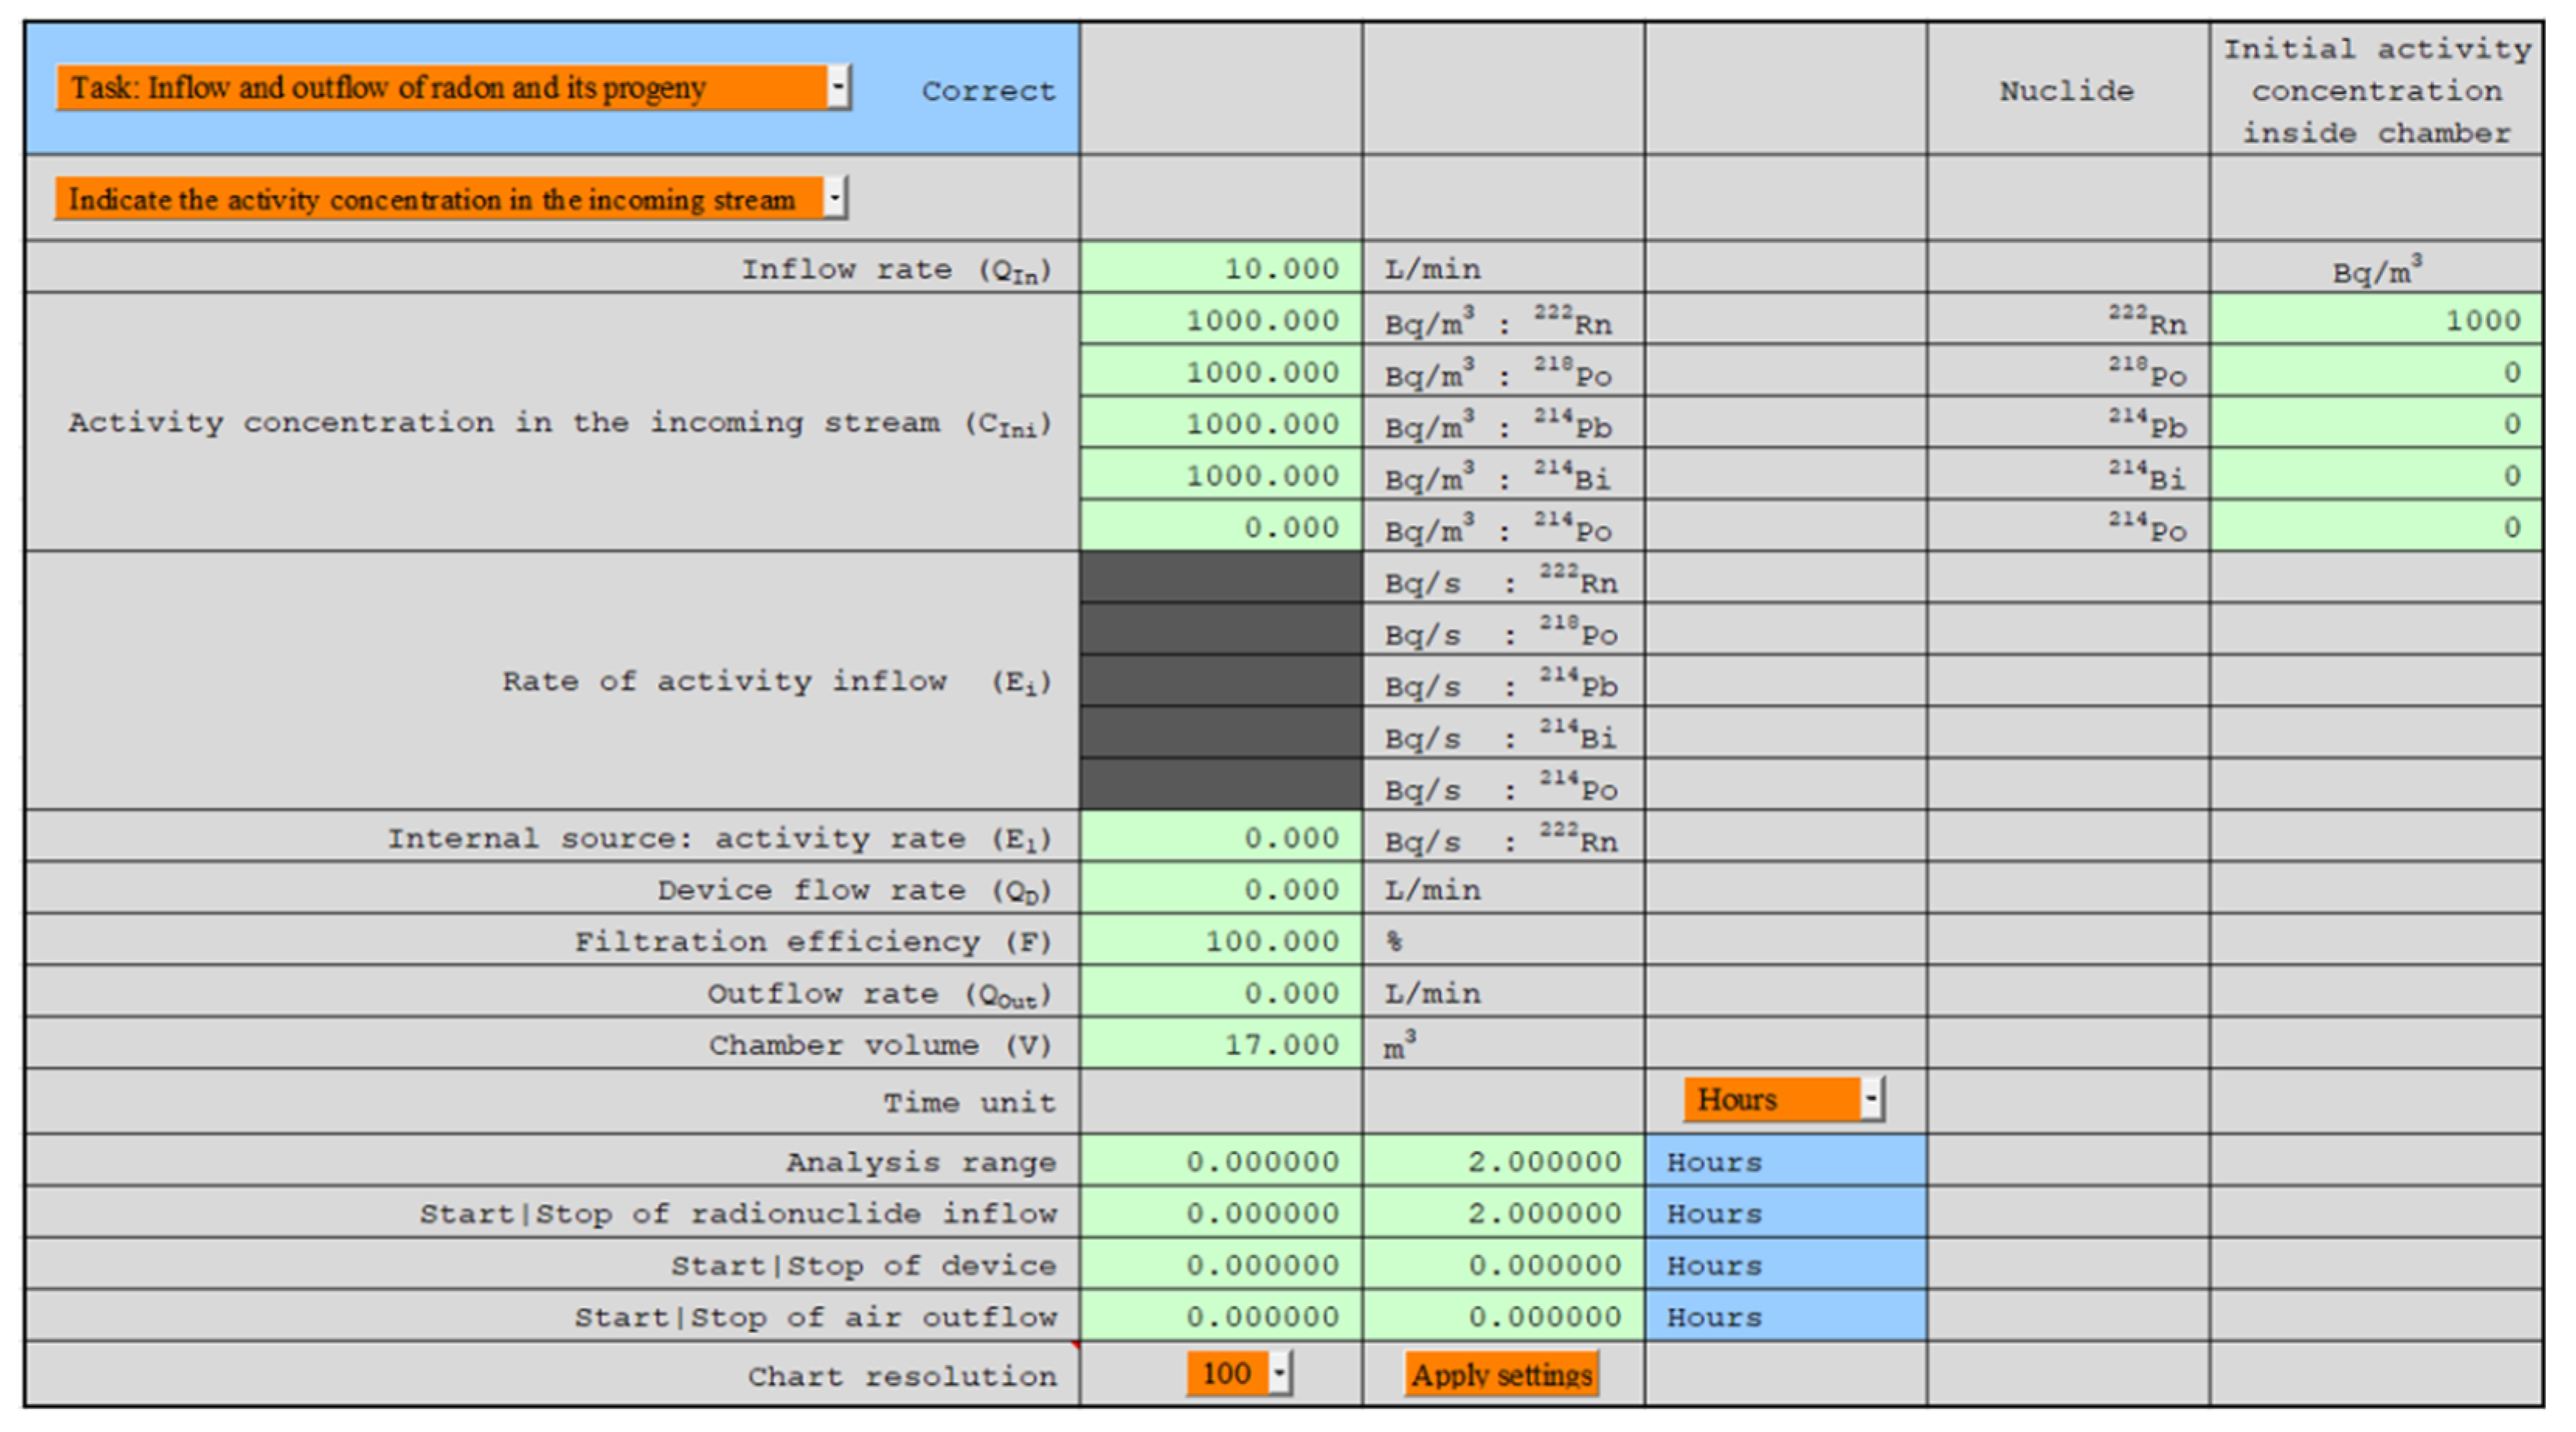
Figure 4.
Activity concentration of nuclides from the thoron chain: CIn1=1 kBq/m3, V=5 m3, QIn=QOut=10 L/min, Coi=0, QD=0.
Figure 4.
Activity concentration of nuclides from the thoron chain: CIn1=1 kBq/m3, V=5 m3, QIn=QOut=10 L/min, Coi=0, QD=0.
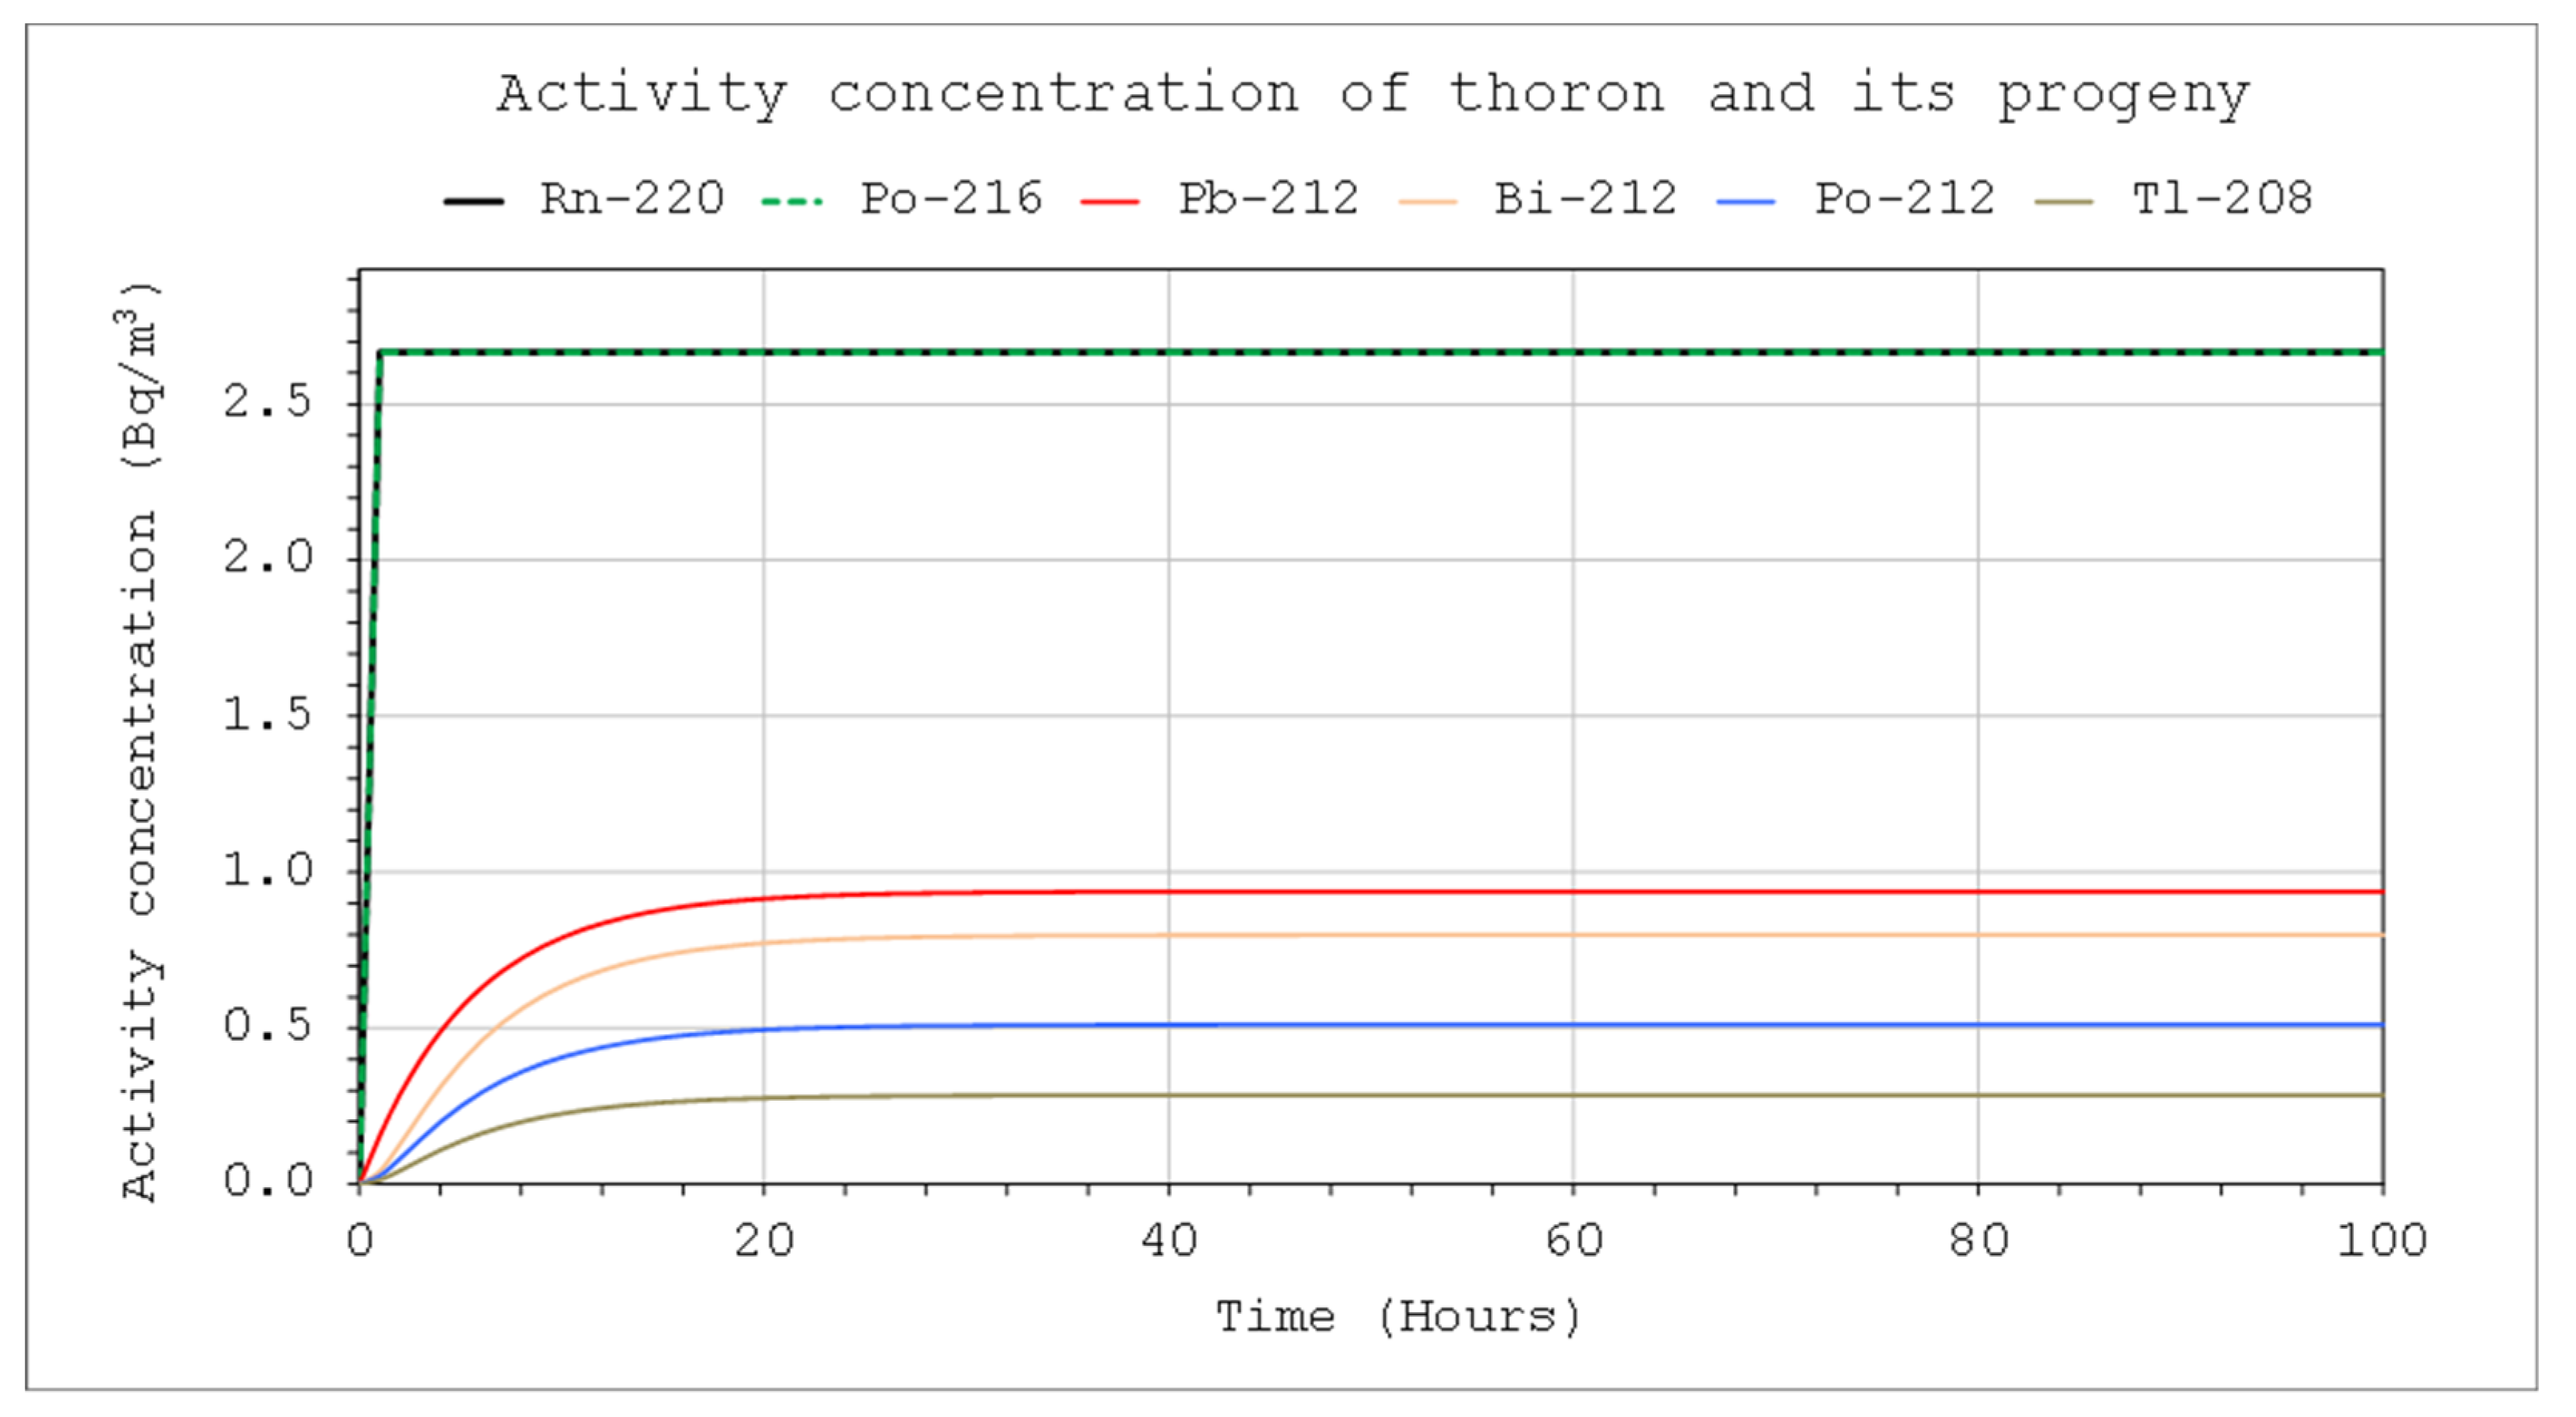
Figure 5.
PAEC concentration of thoron decay products: CIn1=1 kBq/m3, V=5 m3, QIn=QOut=10 L/min, Coi=0, QD=0.
Figure 5.
PAEC concentration of thoron decay products: CIn1=1 kBq/m3, V=5 m3, QIn=QOut=10 L/min, Coi=0, QD=0.
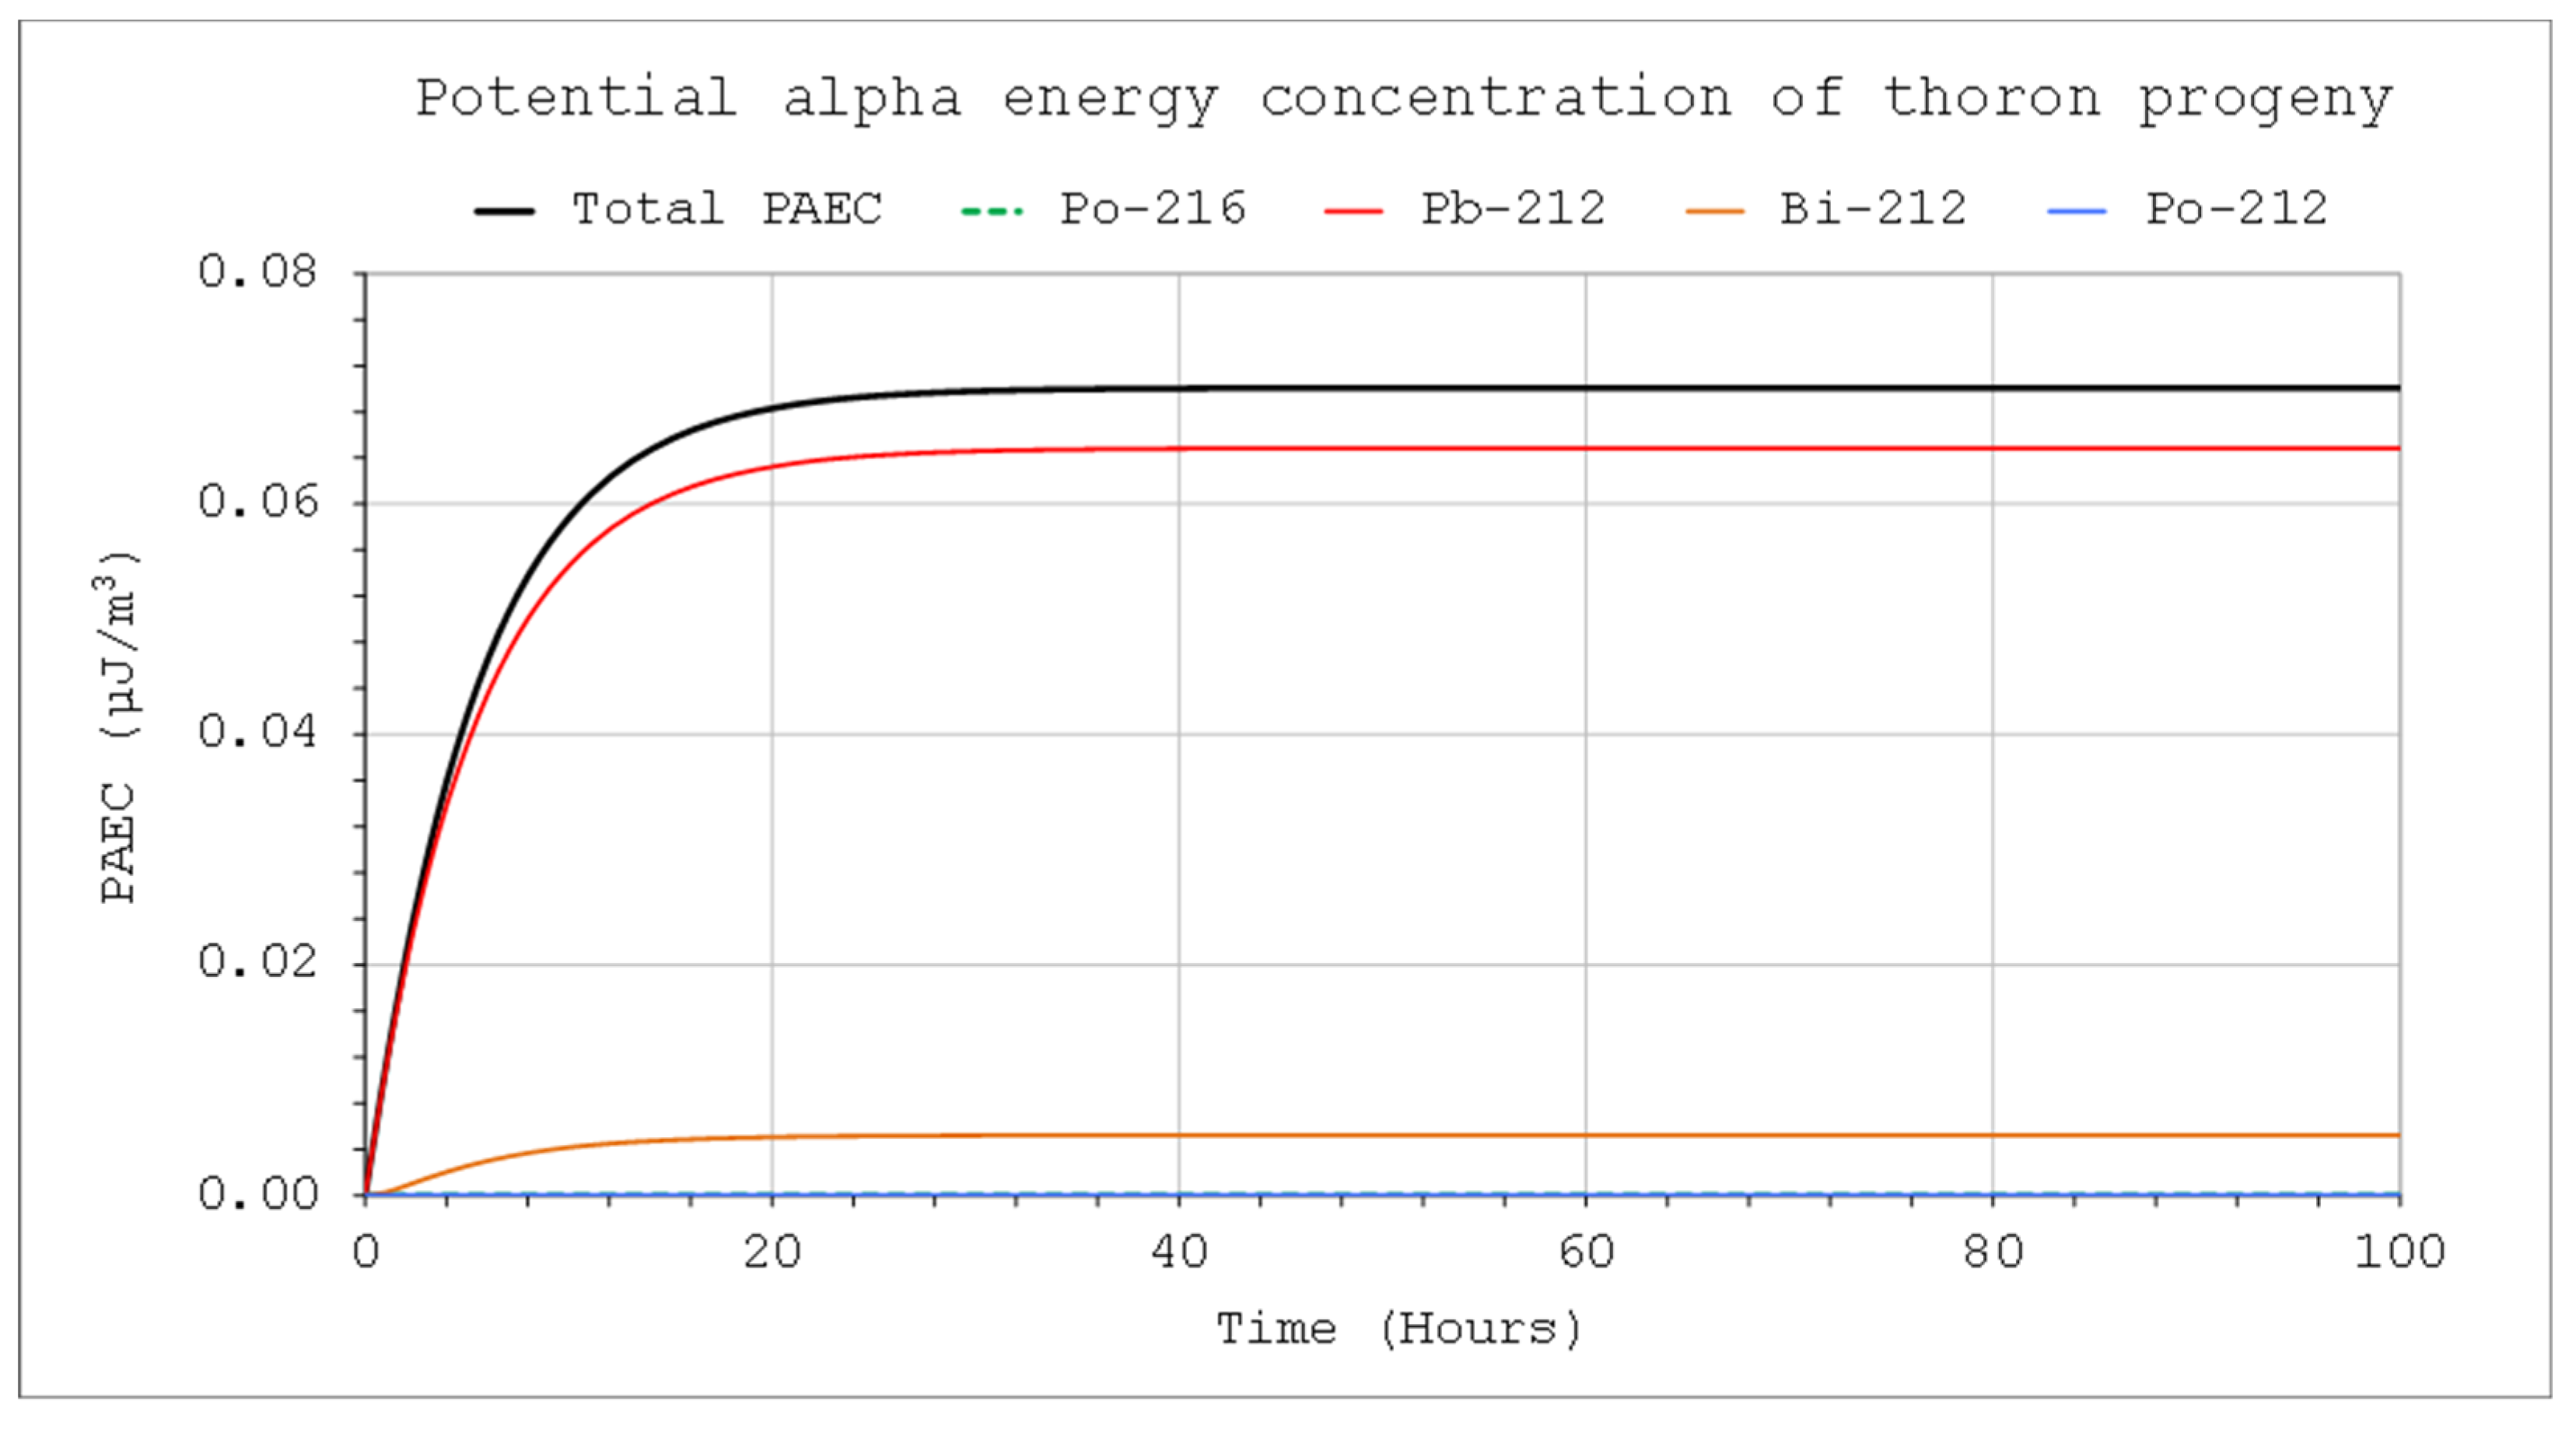
Figure 6.
Activity concentration of nuclides from the radon chain: CIn1=1 kBq/m3, V=5 m3, QIn=QOut=10 L/min, Coi=0, QD=0.
Figure 6.
Activity concentration of nuclides from the radon chain: CIn1=1 kBq/m3, V=5 m3, QIn=QOut=10 L/min, Coi=0, QD=0.
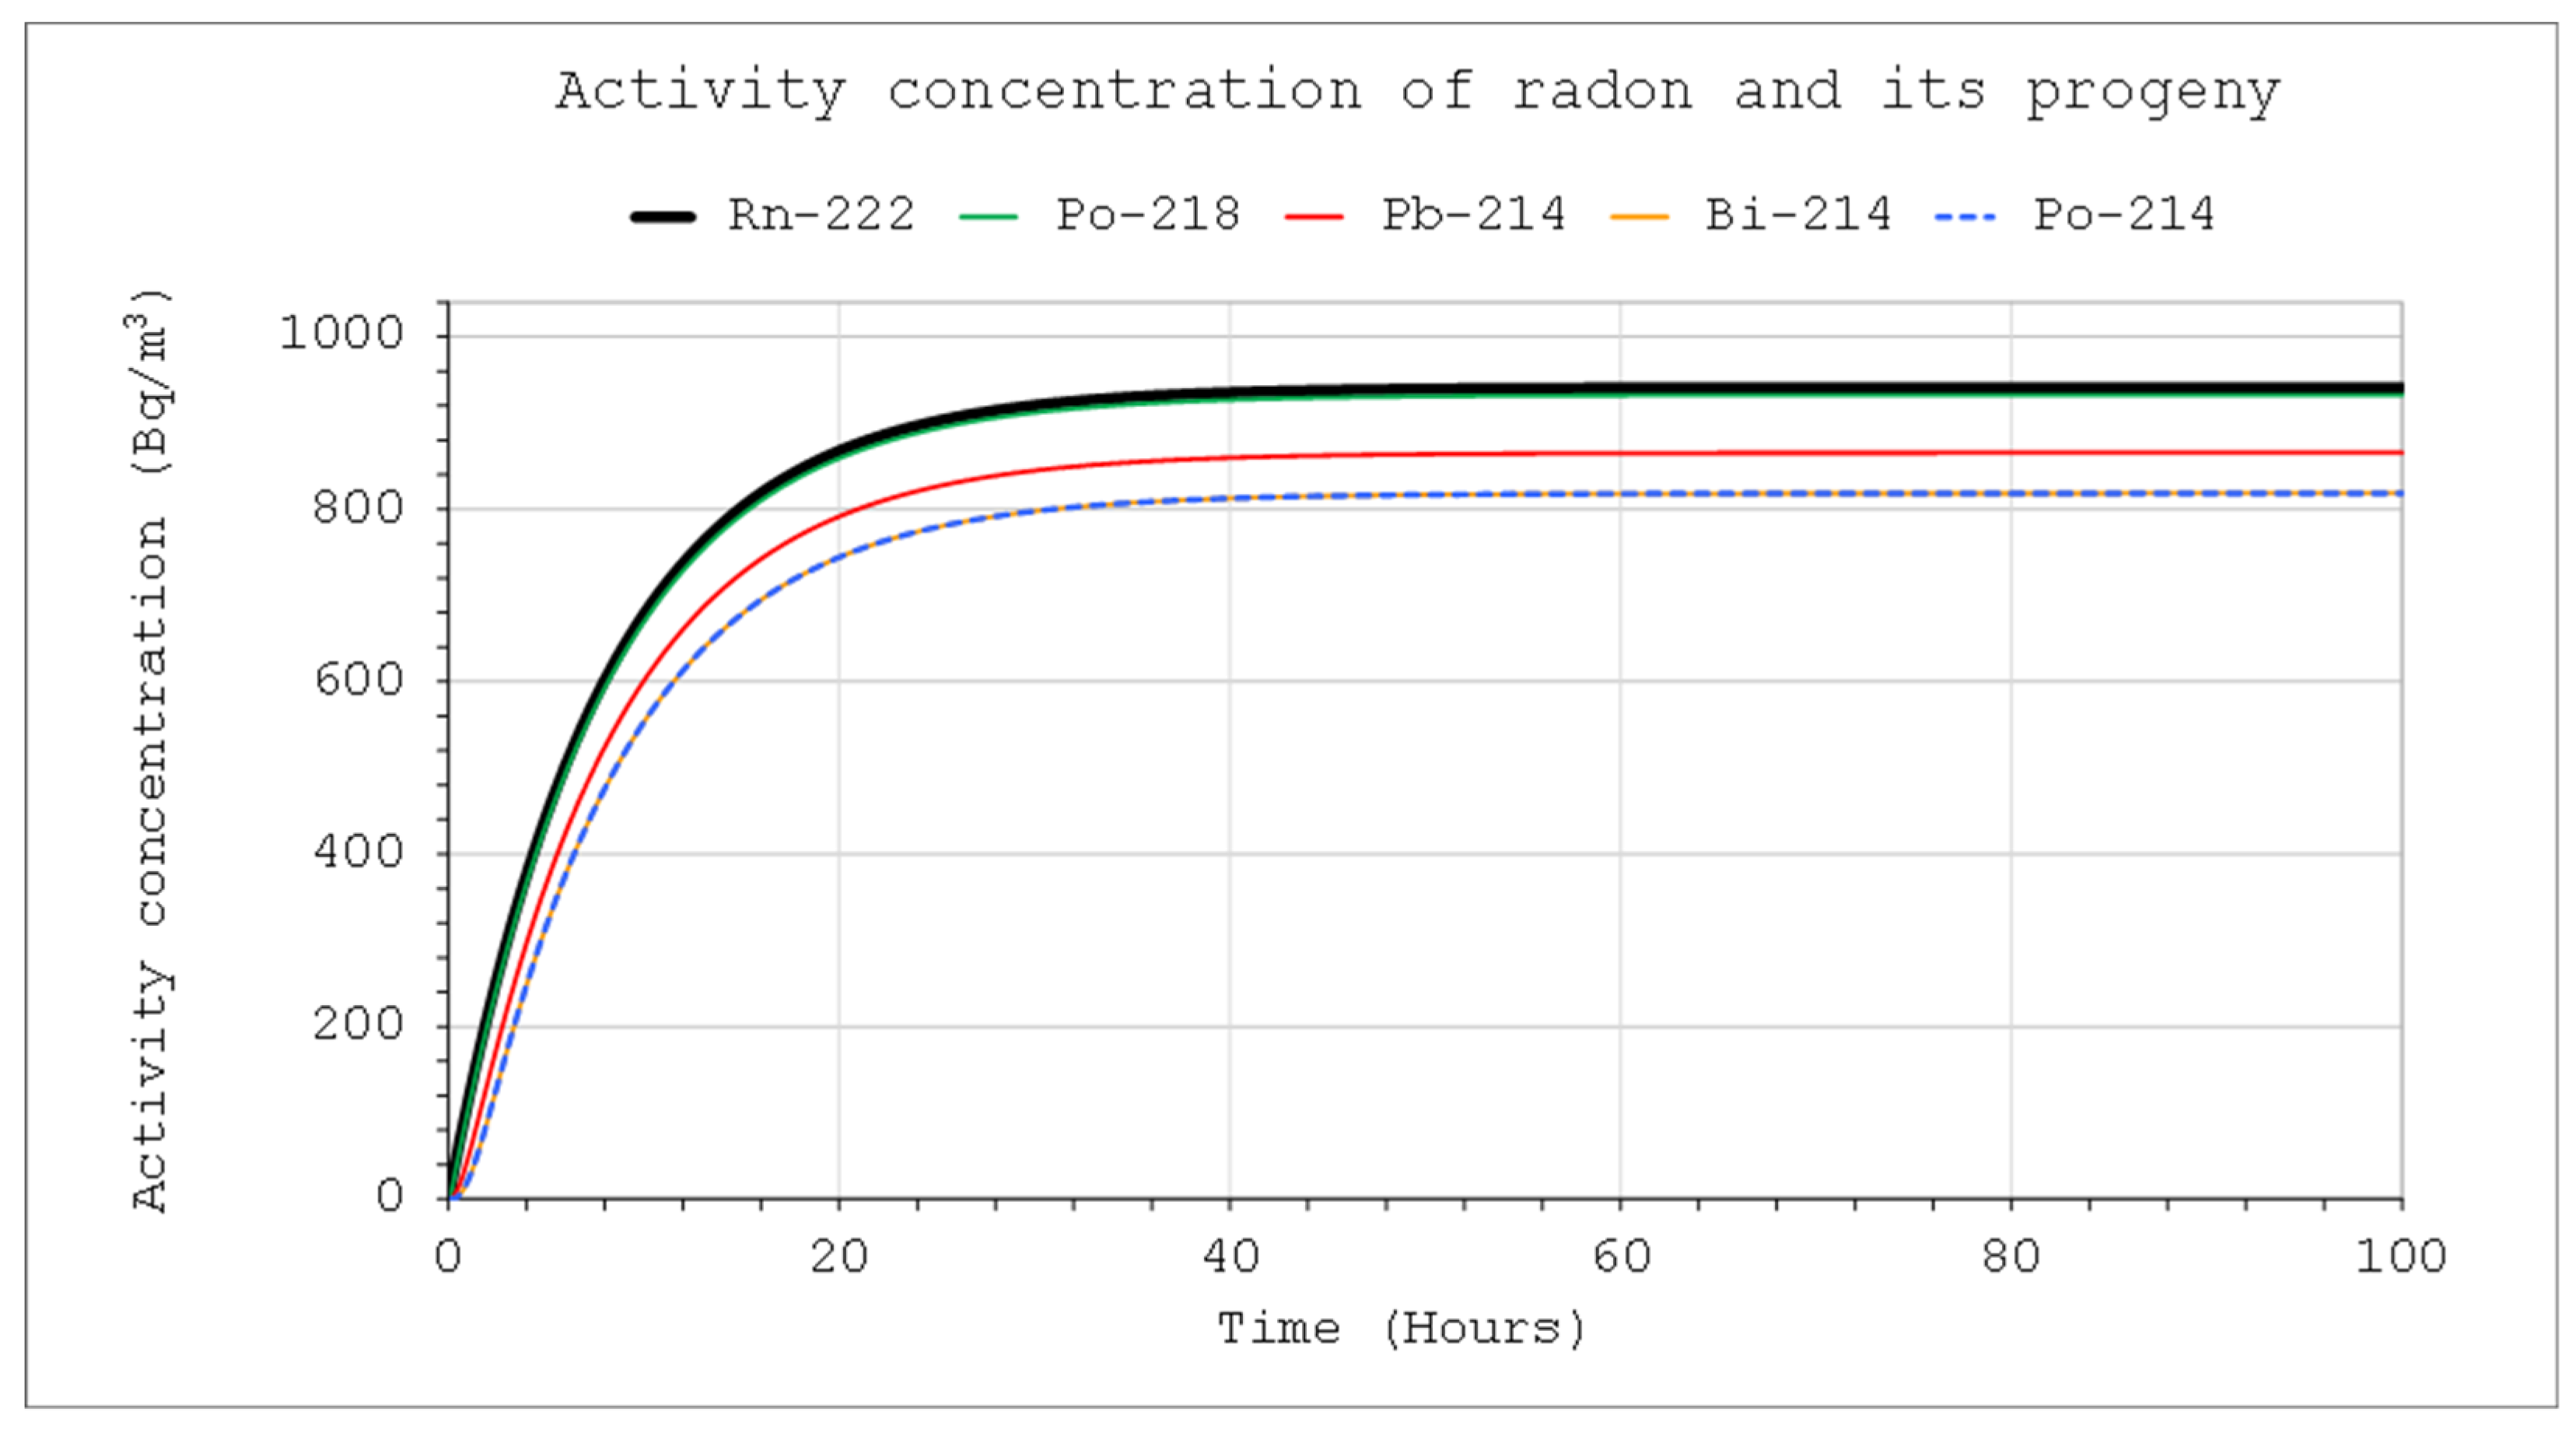
Figure 7.
PAEC concentration of short-lived radon decay products: CIn1=1 kBq/m3, V=5 m3, QIn=QOut=10 L/min, Coi=0, QD=0.
Figure 7.
PAEC concentration of short-lived radon decay products: CIn1=1 kBq/m3, V=5 m3, QIn=QOut=10 L/min, Coi=0, QD=0.
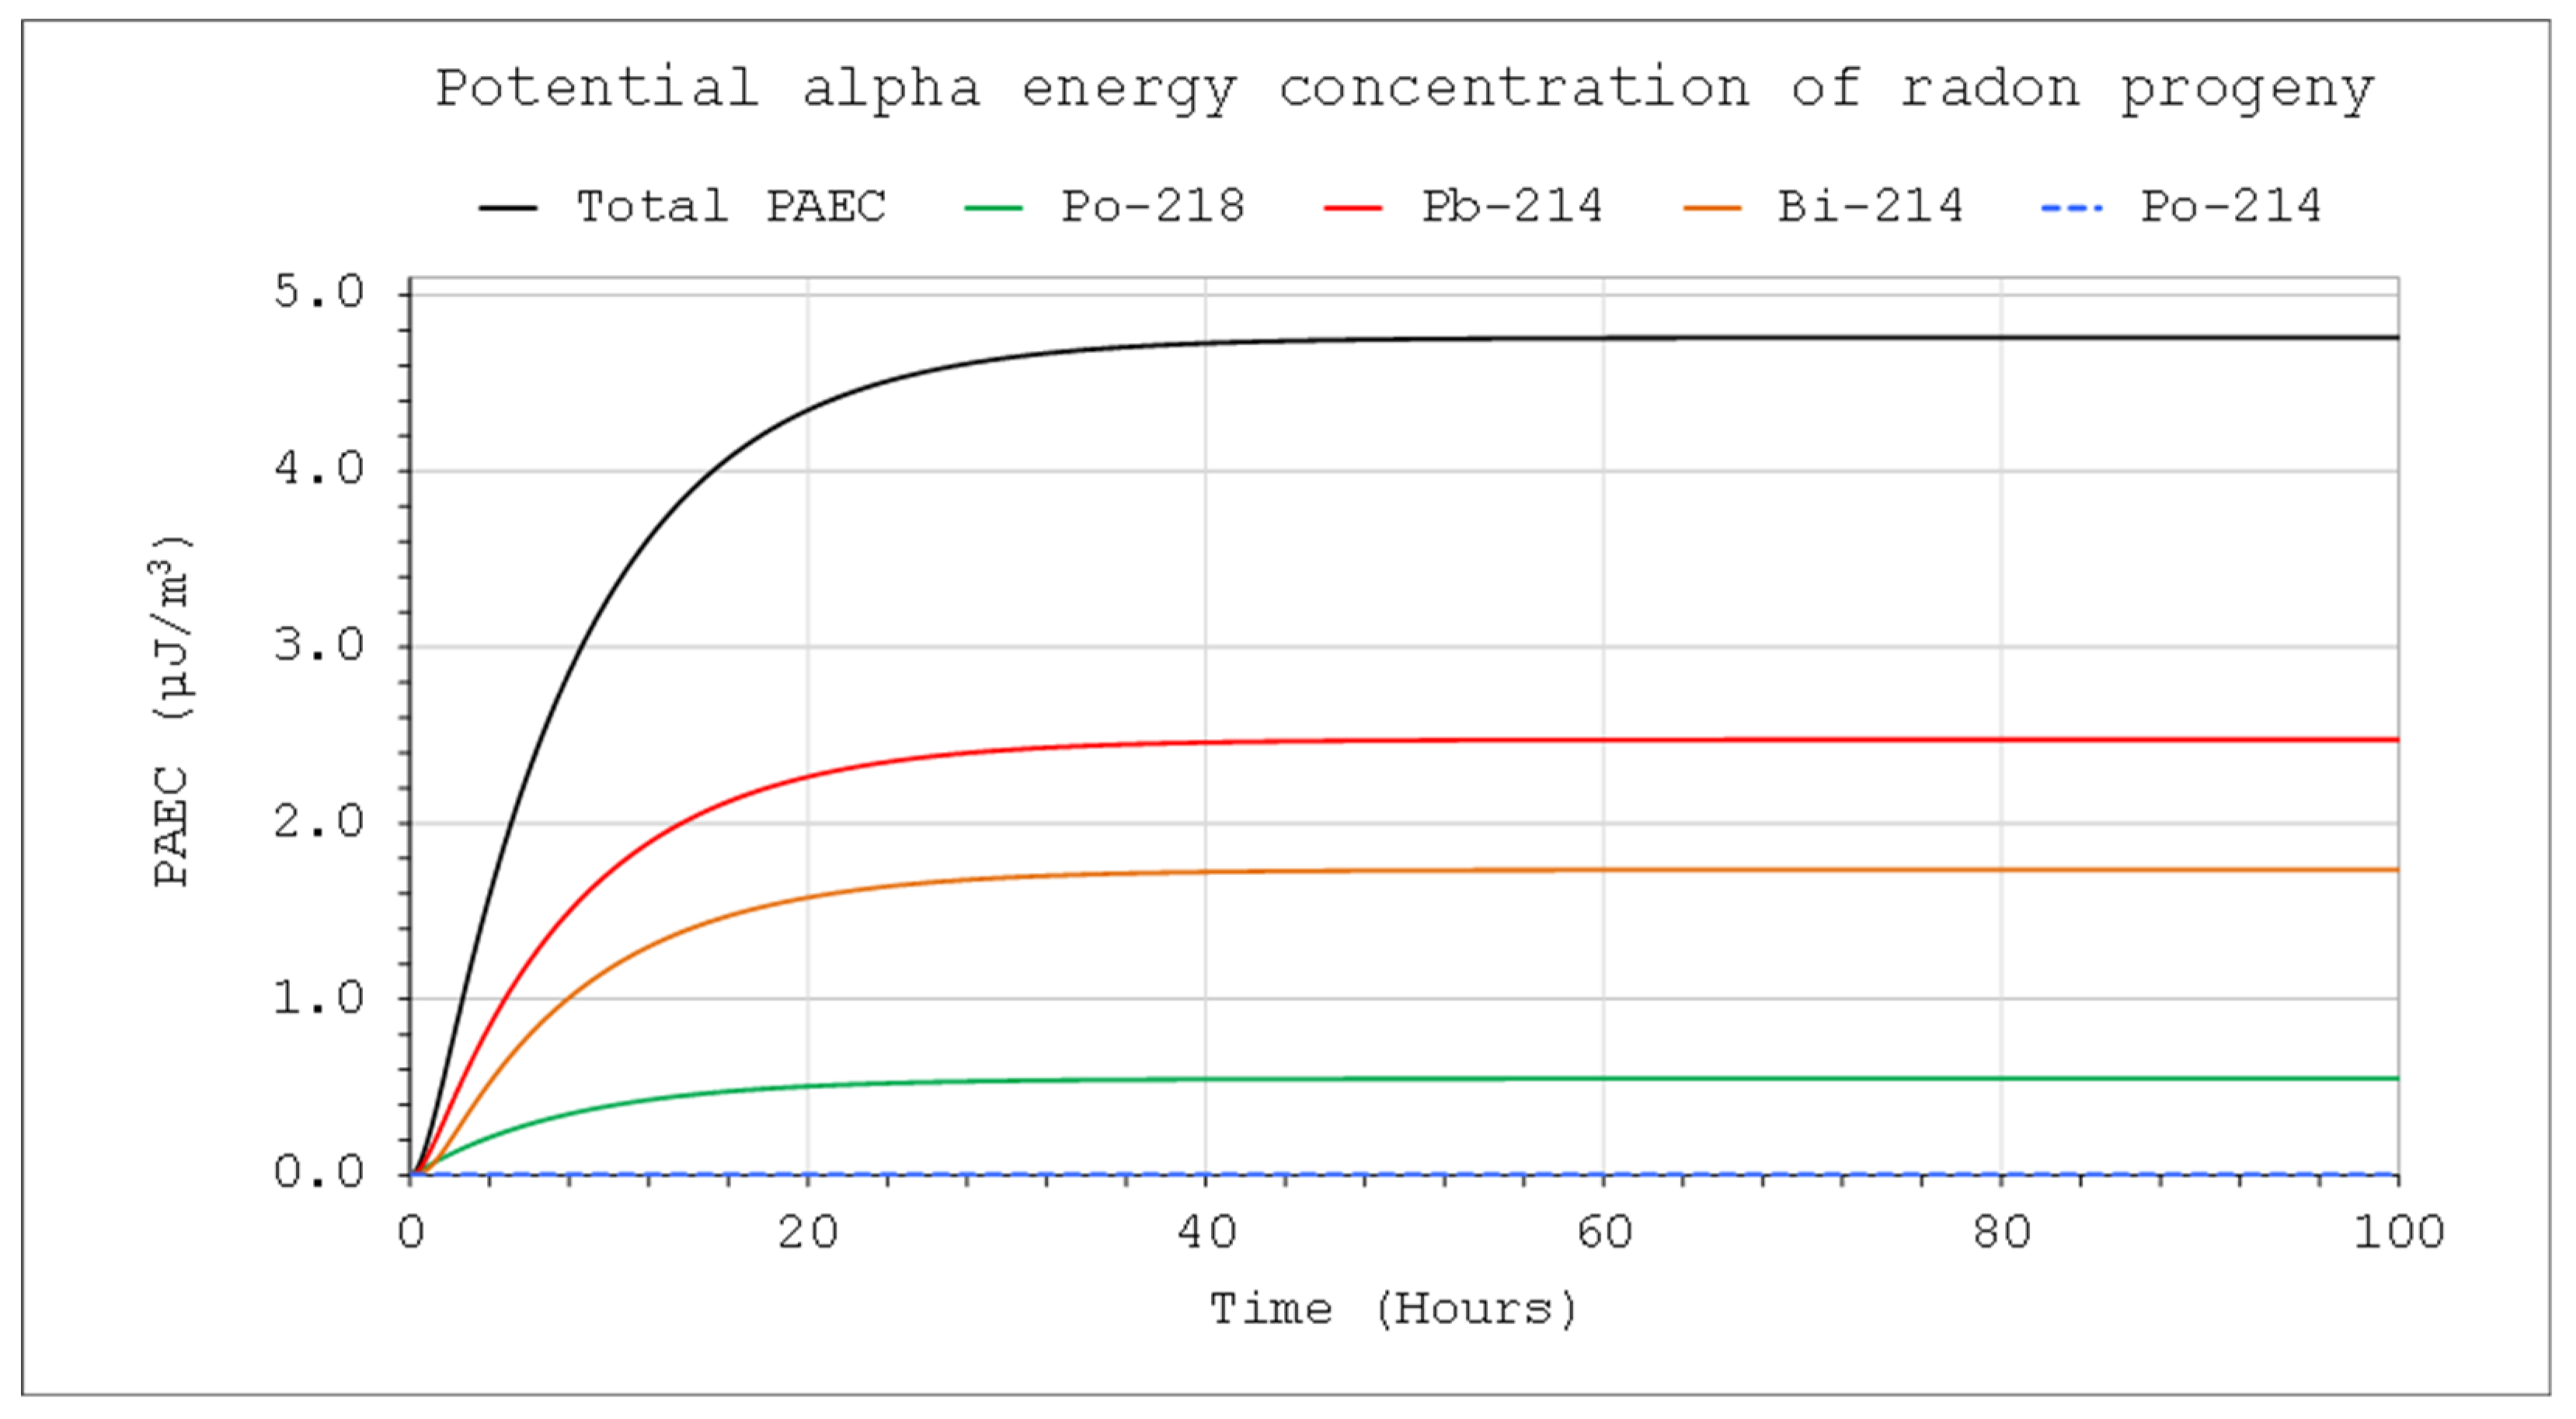
Figure 8.
Activity concentration of nuclides from the thoron chain: CIn1=1 kBq/m3, V=5 m3, QIn=10 L/min, QOut=0, Coi=0, QD=0.
Figure 8.
Activity concentration of nuclides from the thoron chain: CIn1=1 kBq/m3, V=5 m3, QIn=10 L/min, QOut=0, Coi=0, QD=0.
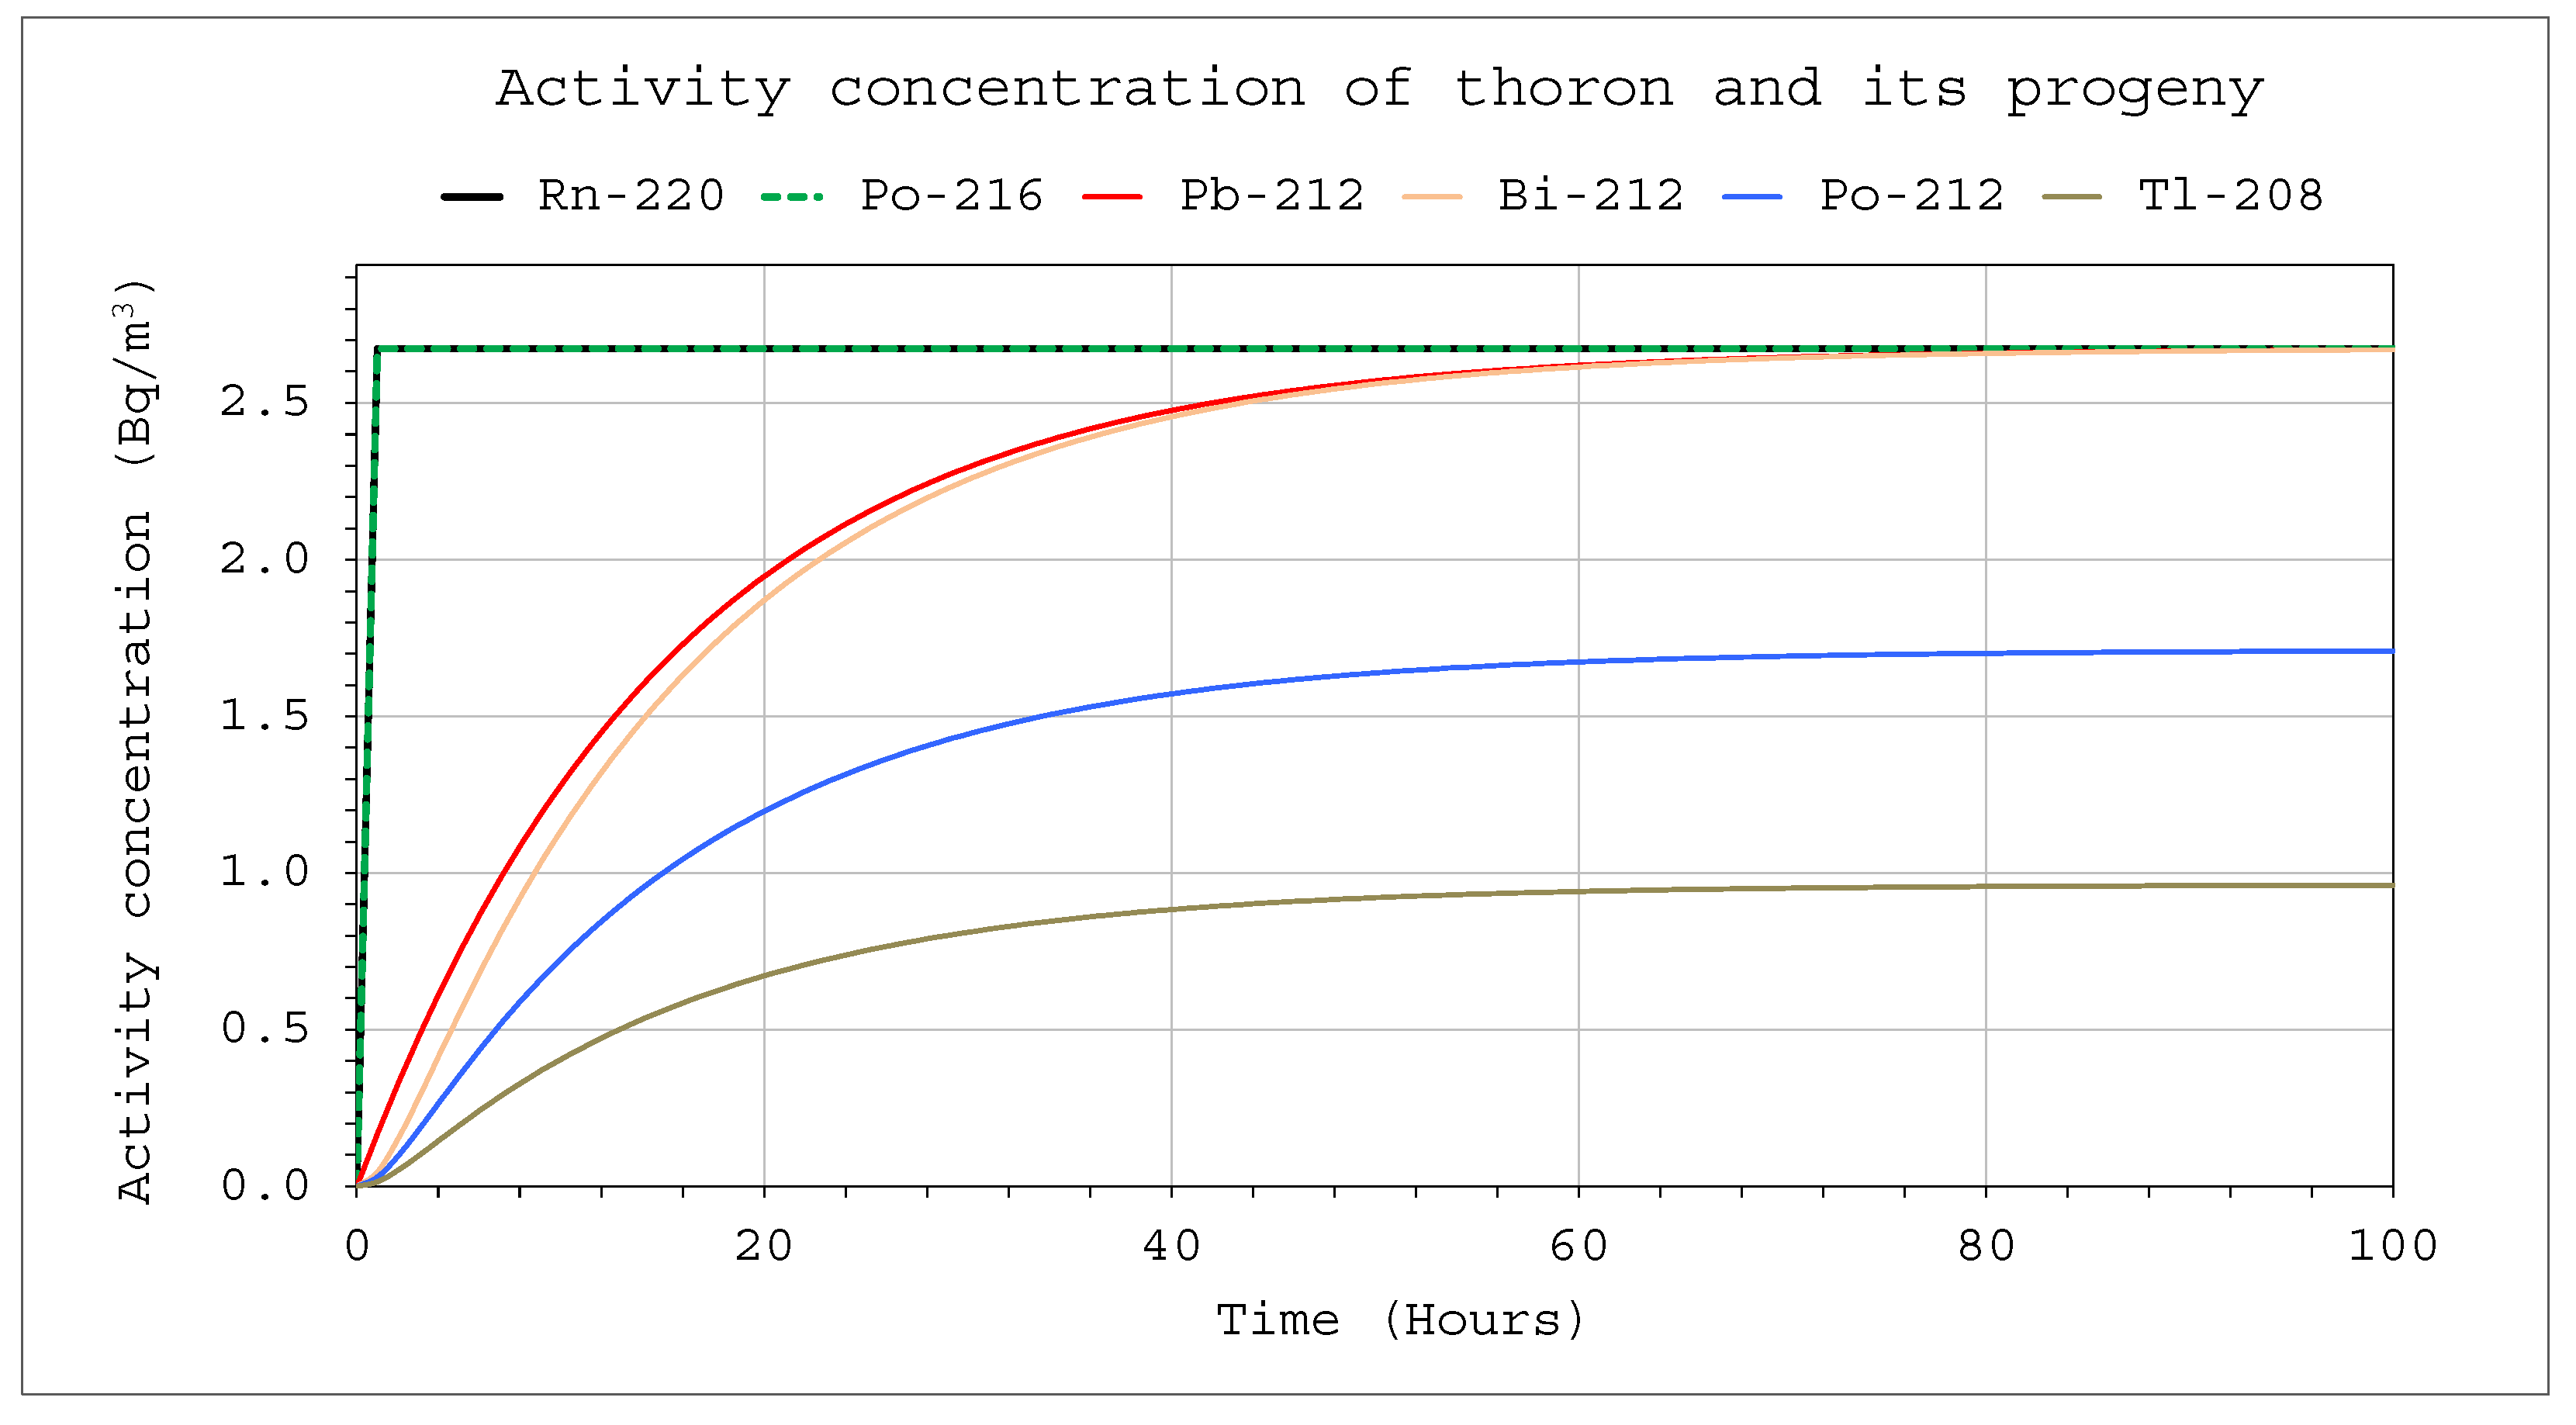
Figure 9.
PAEC concentration of thoron decay products: CIn1=1 kBq/m3, V=5 m3, QIn=10 L/min, QOut=0, Coi=0, QD=0.
Figure 9.
PAEC concentration of thoron decay products: CIn1=1 kBq/m3, V=5 m3, QIn=10 L/min, QOut=0, Coi=0, QD=0.
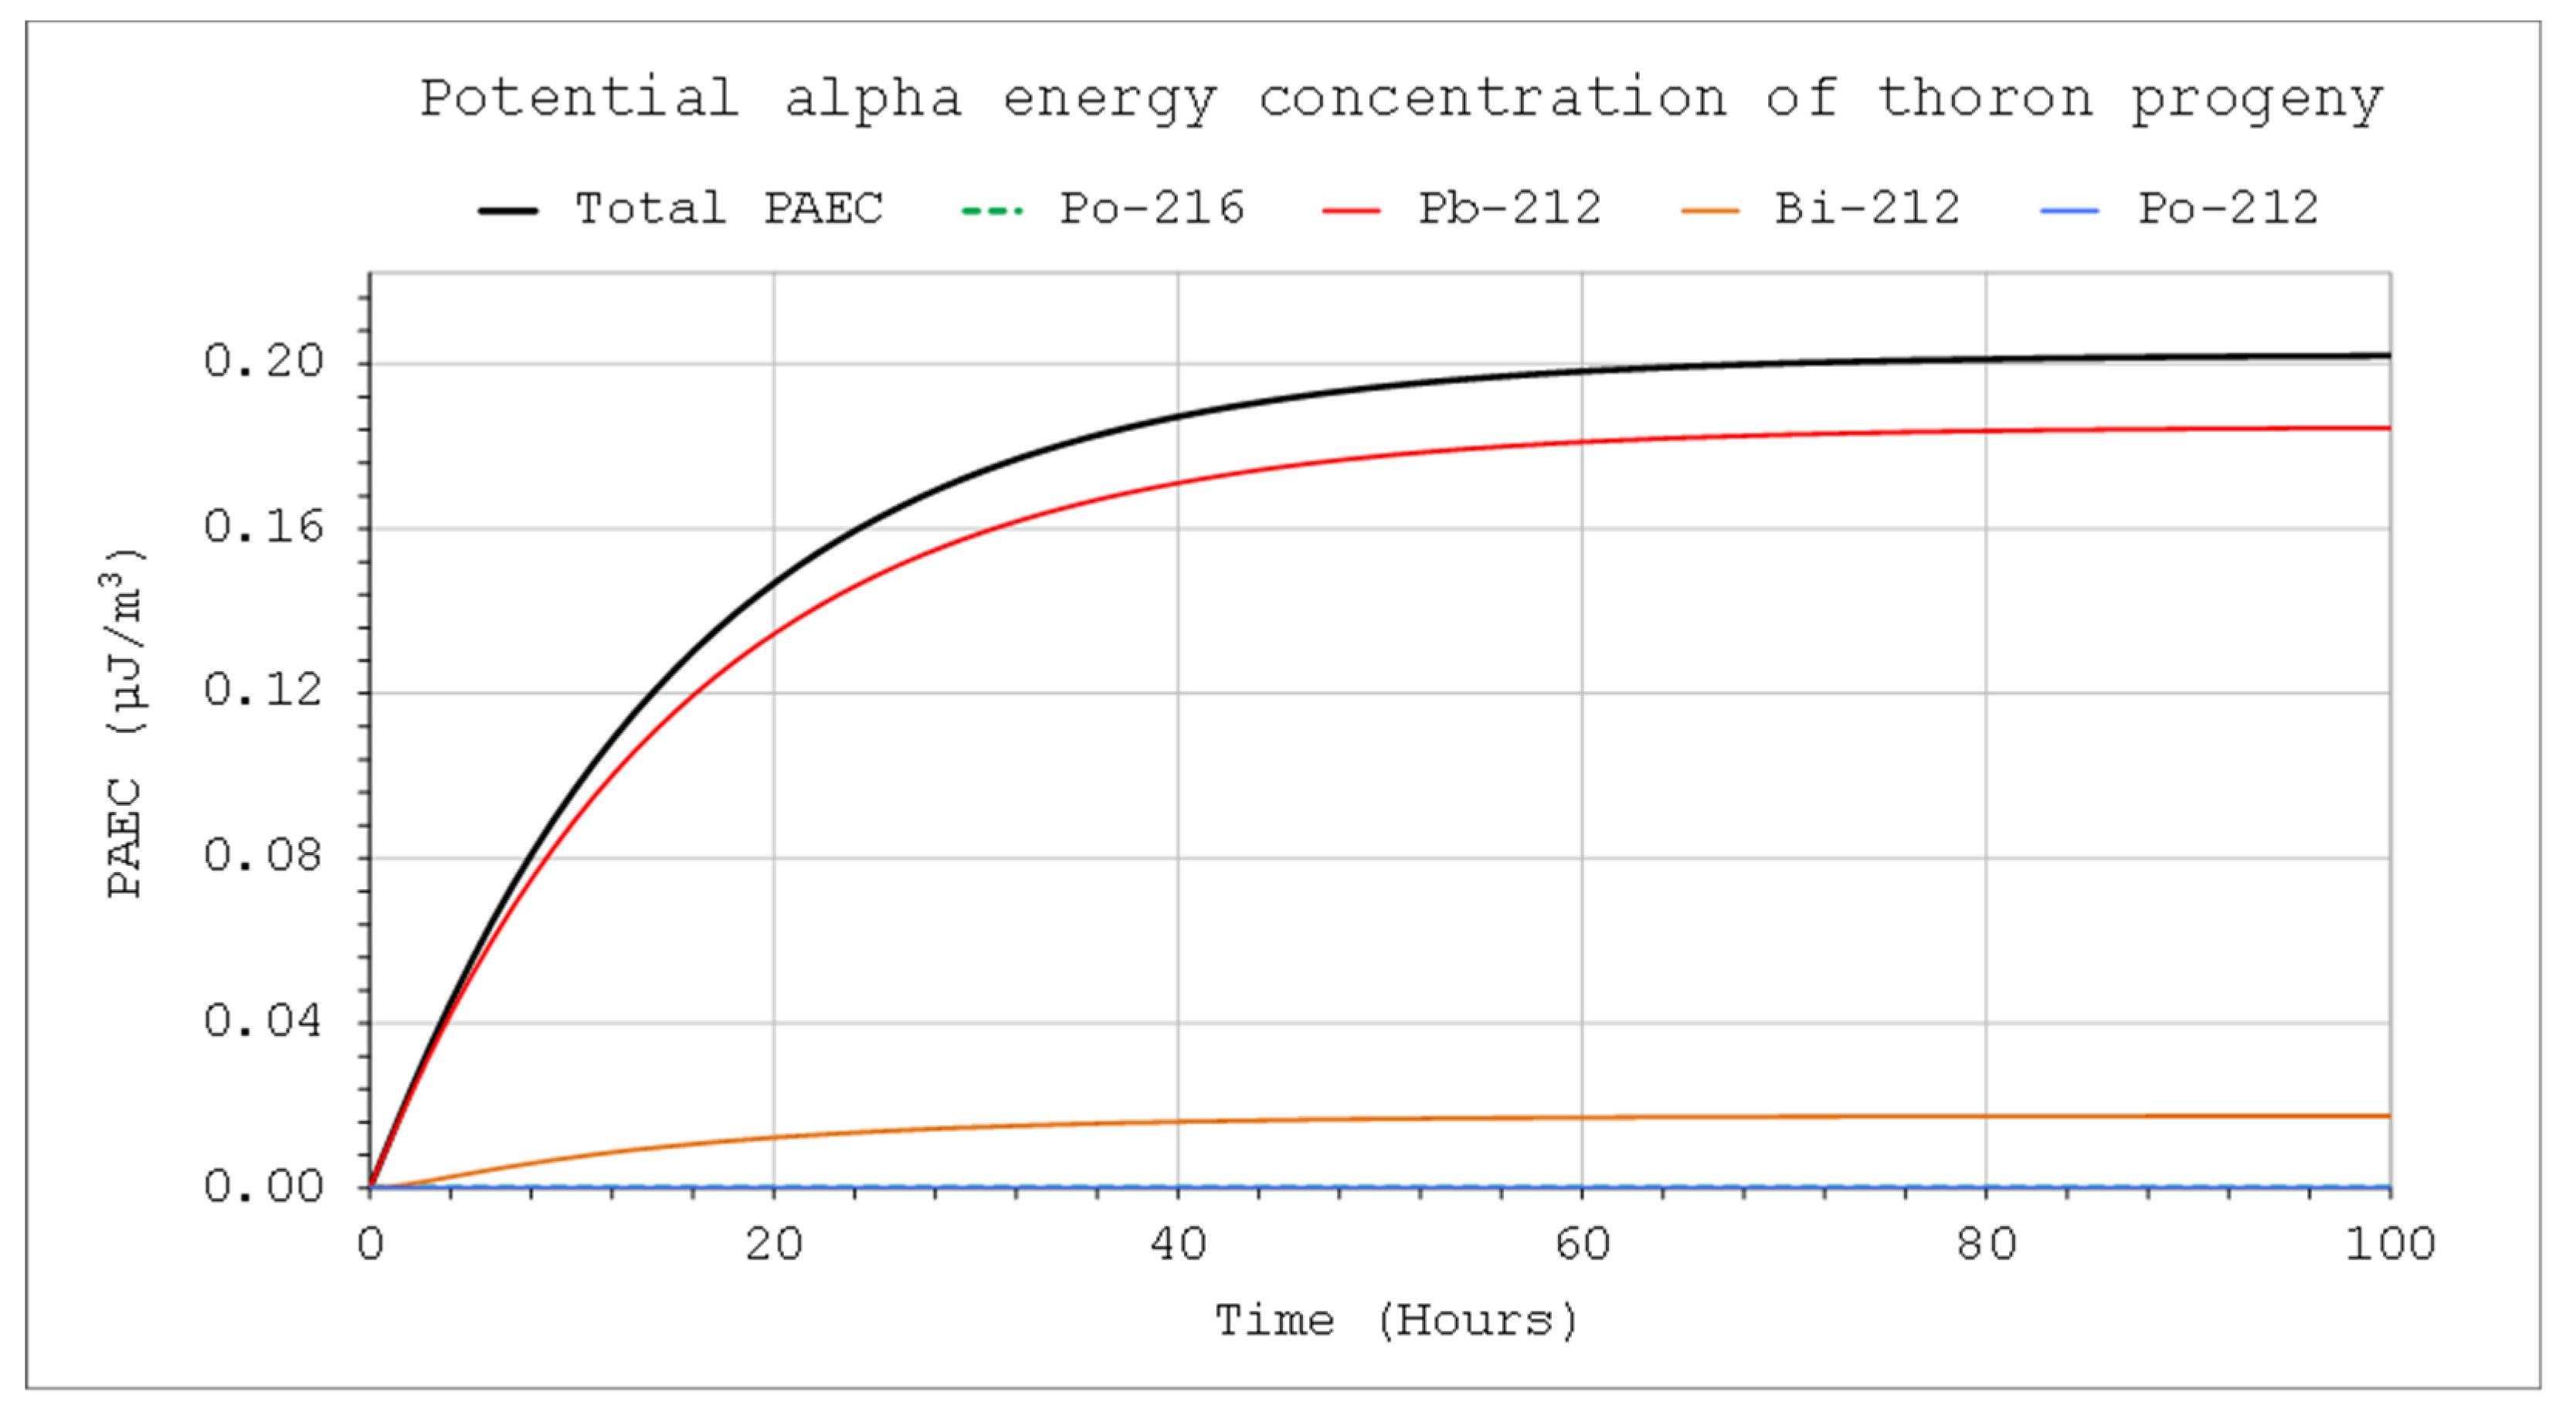
Figure 10.
Activity concentration of nuclides from the thoron chain: CIn1=1 kBq/m3, V=5 m3, QIn=QOut=10 L/min, QD=10 L/min (40 – 60 hours), F=100%.
Figure 10.
Activity concentration of nuclides from the thoron chain: CIn1=1 kBq/m3, V=5 m3, QIn=QOut=10 L/min, QD=10 L/min (40 – 60 hours), F=100%.
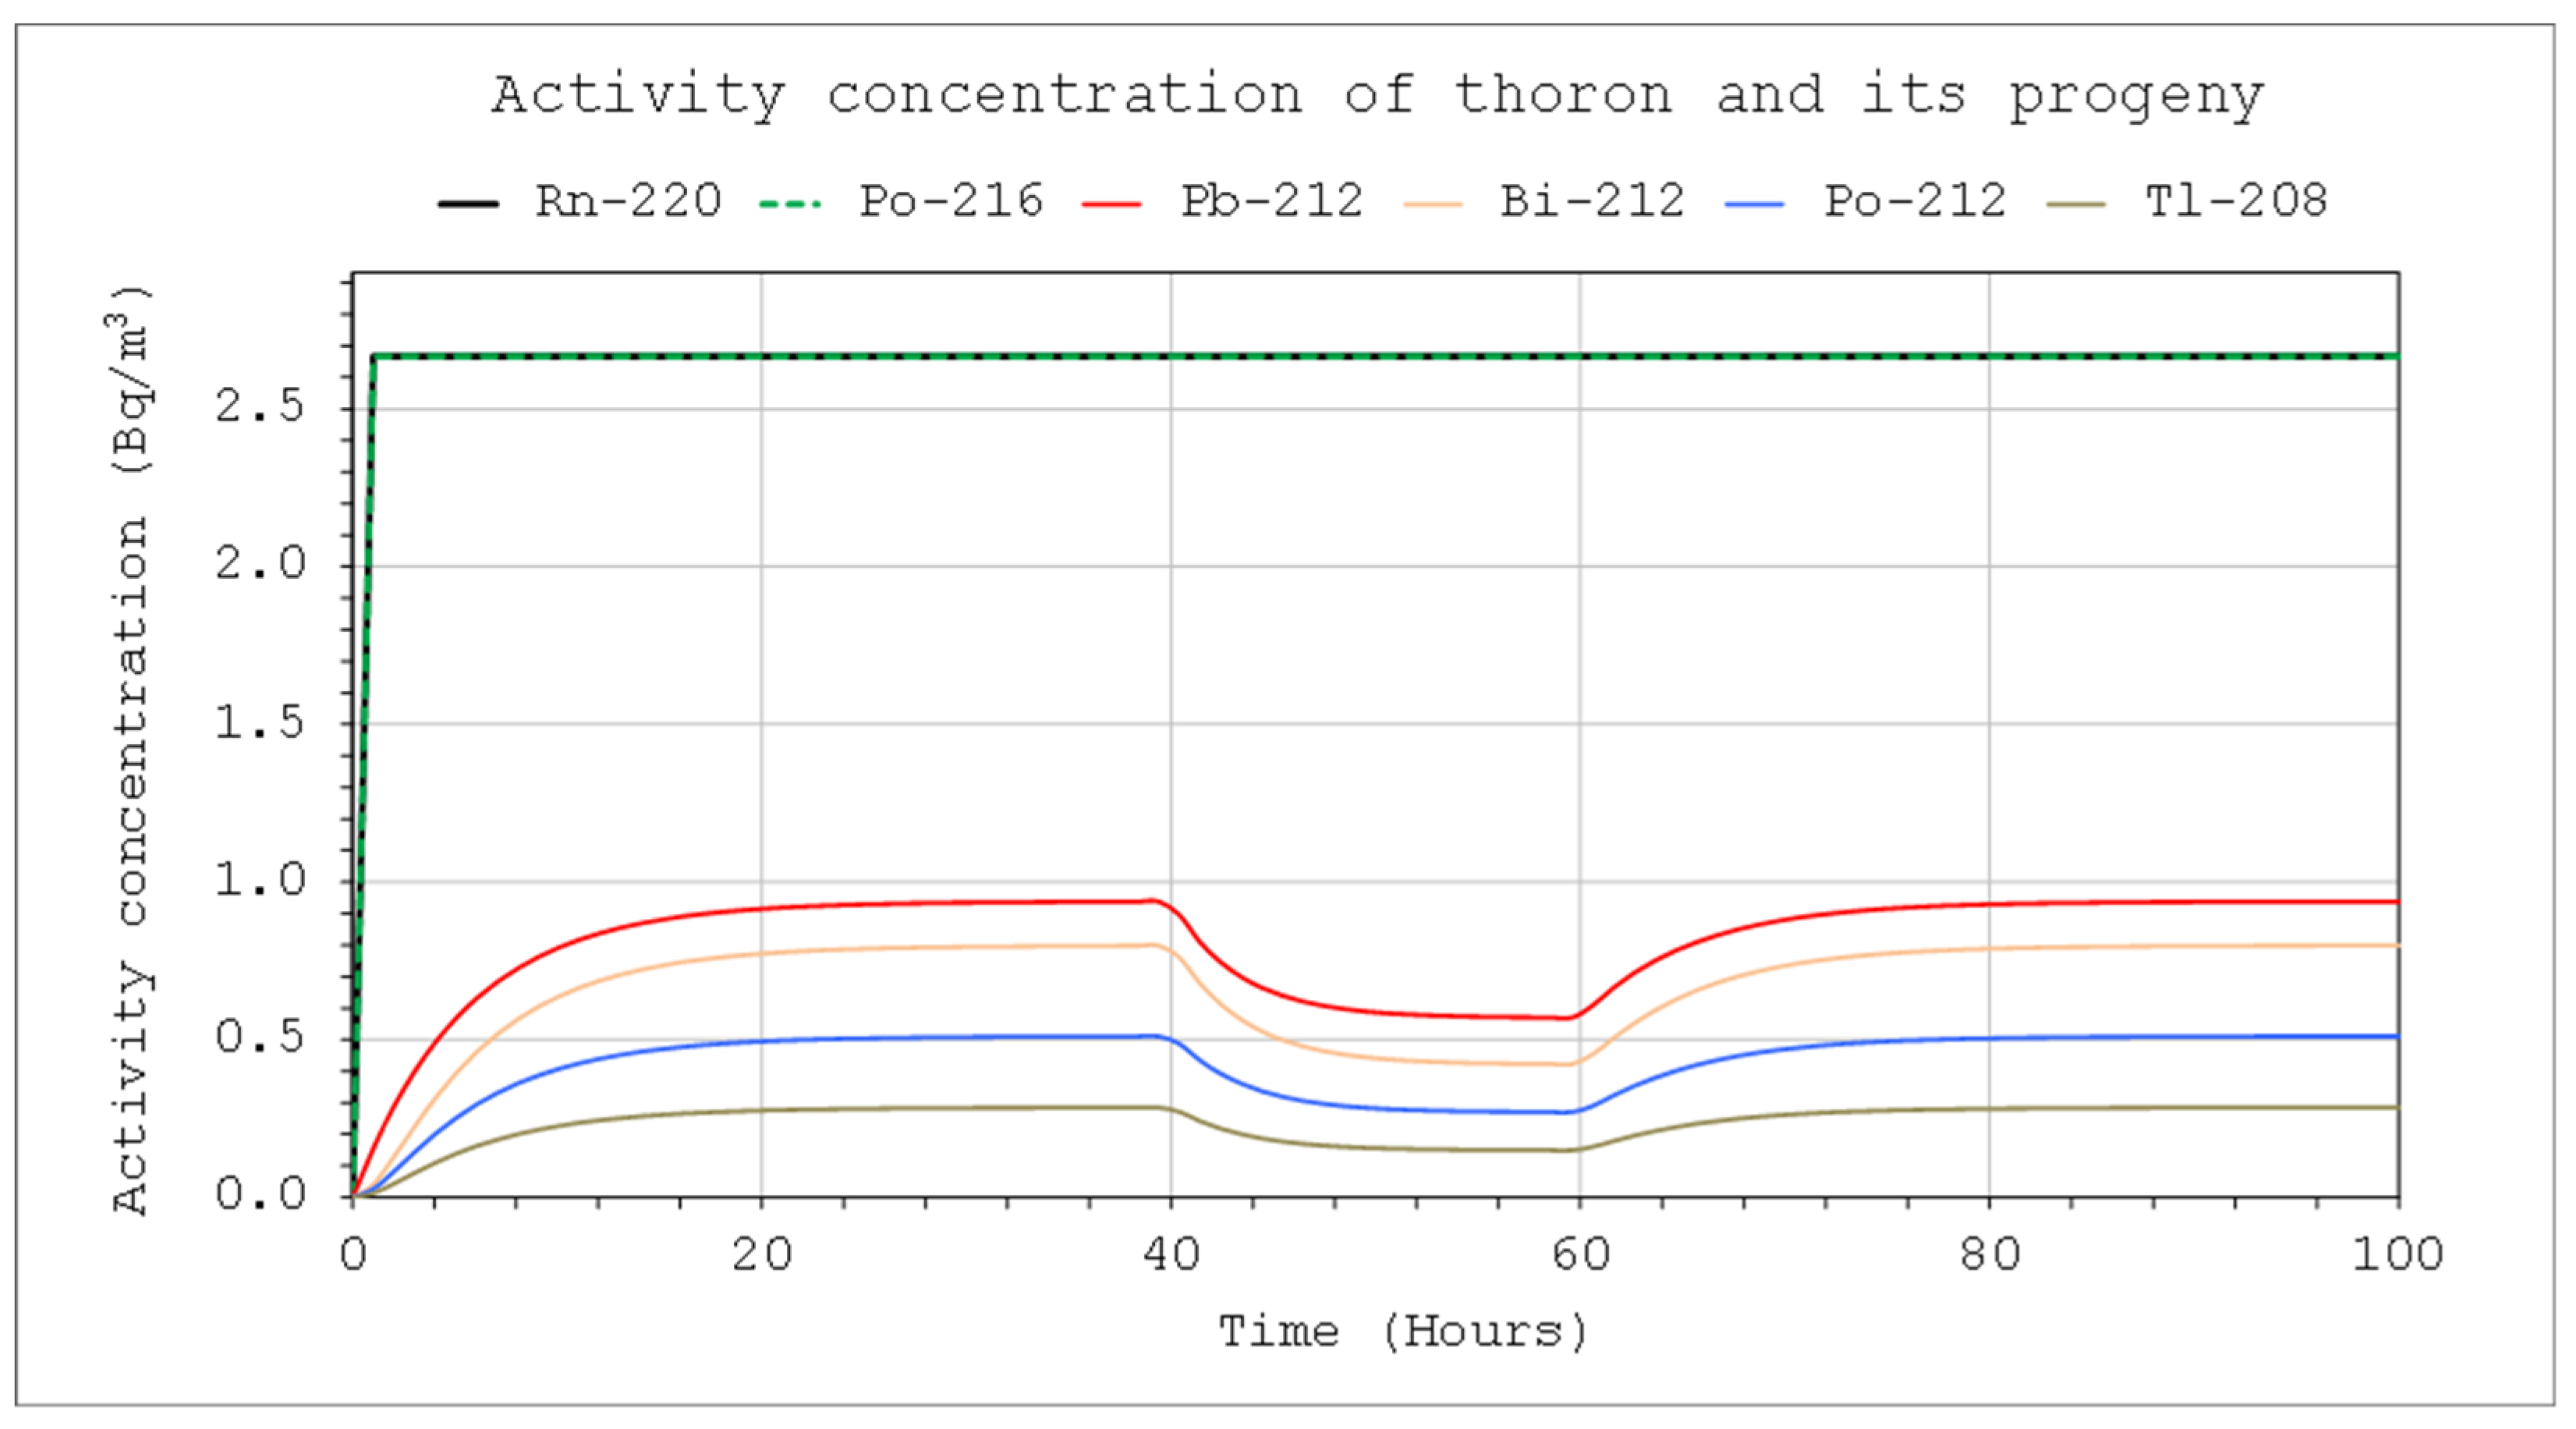
Figure 11.
Activity concentration of nuclides from the radon chain: CIn1=1 kBq/m3, V=5 m3, QIn=QOut=10 L/min, QD=10 L/min (40-60 hours), F=100%.
Figure 11.
Activity concentration of nuclides from the radon chain: CIn1=1 kBq/m3, V=5 m3, QIn=QOut=10 L/min, QD=10 L/min (40-60 hours), F=100%.
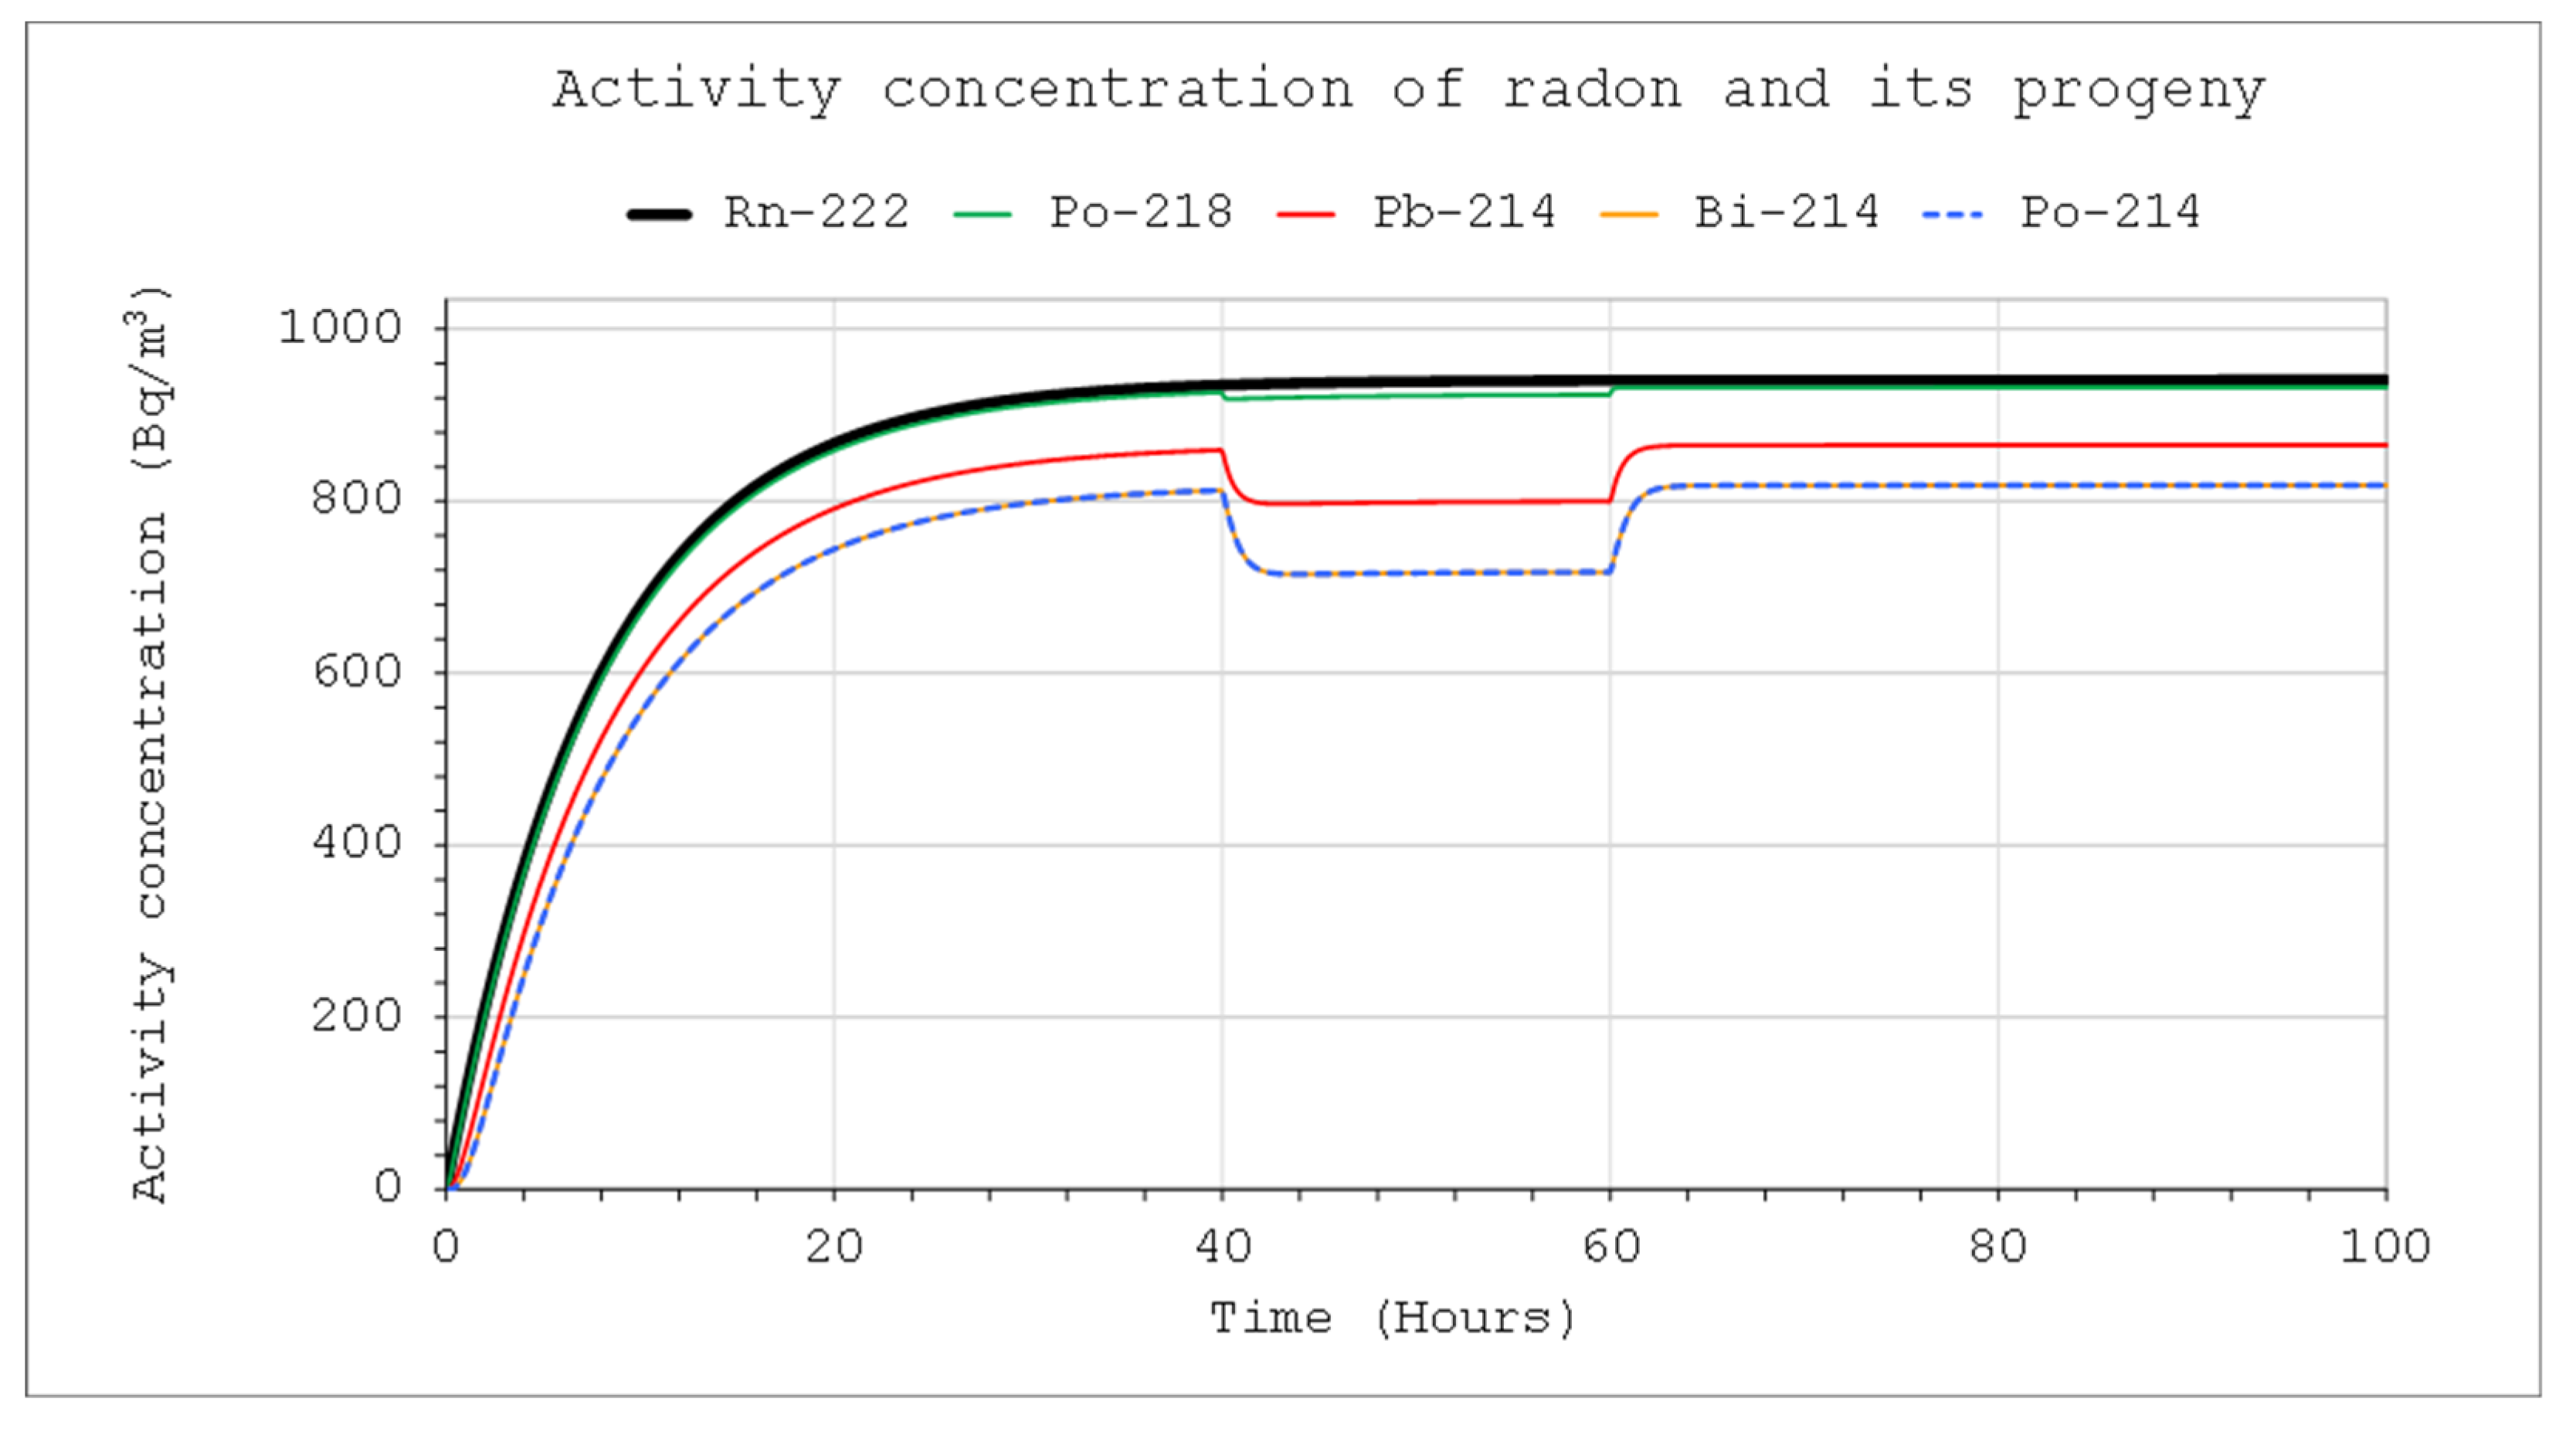
Figure 12.
Decreasing of PAEC concentration of thoron decay products: V=17 m3, QD=4 L/min, F=99%, E1=150 Bq/s. Operation time 1 h (left chart) and 3 h (right chart).
Figure 12.
Decreasing of PAEC concentration of thoron decay products: V=17 m3, QD=4 L/min, F=99%, E1=150 Bq/s. Operation time 1 h (left chart) and 3 h (right chart).
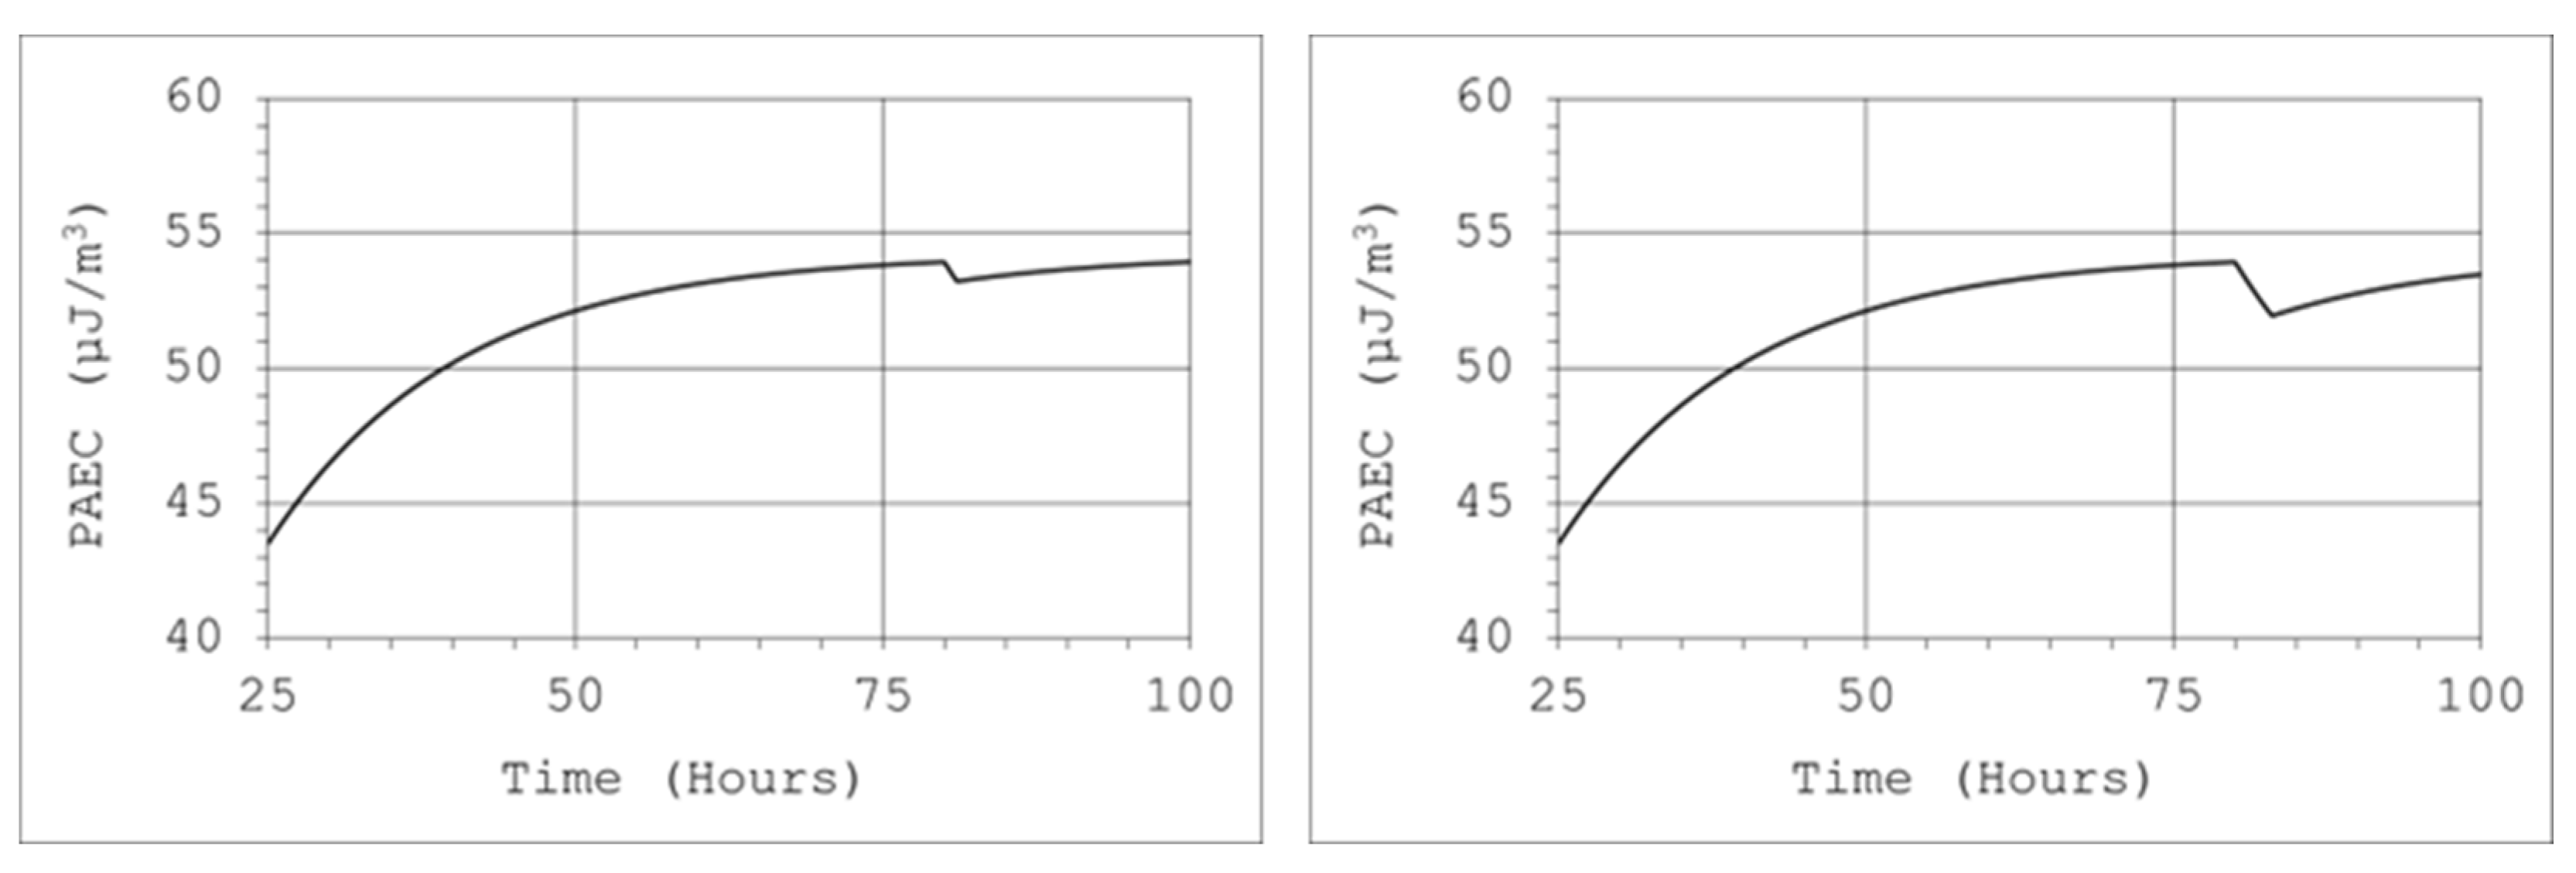

Table 1.
Recommended equilibrium factors and conversion coefficients [12].
Table 1.
Recommended equilibrium factors and conversion coefficients [12].
| Isotope | Place | Equilibrium factor | Effective dose coefficient (mSv/(mJ/m3⋅h) |
| Radon progeny | Mines | 0.2 | 3 |
| Caves, indoor workplaces | 0.4 | 6 | |
| Thoron progeny | All workplaces | - | 1.5 |
Table 2.
Comparison of the maximum values of radon and thoron activity concentration in systems with different volumes for the inflow and outflow of the air stream from the system.
Table 2.
Comparison of the maximum values of radon and thoron activity concentration in systems with different volumes for the inflow and outflow of the air stream from the system.
| Nuclide | System volume | CIn1 | QIn=QOut | ~C1Max | t0.9Max | C1LimMax |
| (-) | (m3) | (Bq/m3) | (L/min) | (Bq/m3) | (-) | (Bq/m3) |
| Radon | 1 | 1000 | 10 | 990 | 4 h | 1000 |
| 5 | 940 | 18 h | ||||
| 25 | 760 | 73 h | ||||
| Thoron | 1 | 1000 | 10 | 13 | 182 s | 1000 |
| 5 | 3 | 184 s | ||||
| 25 | 1 | 185 s |
Table 3.
Comparison of the maximum values of radon and thoron activity concentration in systems of different volumes in the case of a closed system.
Table 3.
Comparison of the maximum values of radon and thoron activity concentration in systems of different volumes in the case of a closed system.
| Isotope | System volume | E1 | ~C1Max | t0.9Max | C1LimMax |
| (-) | (m3) | (Bq/s) | (Bq/m3) | (-) | (Bq/m3) |
| Radon | 1 | 0.167 | 80,000 | 305 h | Infinity |
| 5 | 16,000 | ||||
| 25 | 3,000 | ||||
| Thoron | 1 | 0.167 | 13 | 185 s | Infinity |
| 5 | 3 | ||||
| 25 | 1 |
Disclaimer/Publisher’s Note: The statements, opinions and data contained in all publications are solely those of the individual author(s) and contributor(s) and not of MDPI and/or the editor(s). MDPI and/or the editor(s) disclaim responsibility for any injury to people or property resulting from any ideas, methods, instructions or products referred to in the content. |
© 2025 by the authors. Licensee MDPI, Basel, Switzerland. This article is an open access article distributed under the terms and conditions of the Creative Commons Attribution (CC BY) license (http://creativecommons.org/licenses/by/4.0/).
Copyright: This open access article is published under a Creative Commons CC BY 4.0 license, which permit the free download, distribution, and reuse, provided that the author and preprint are cited in any reuse.


