Submitted:
20 March 2025
Posted:
21 March 2025
You are already at the latest version
Abstract
This study presents the fabrication and characterization of magnetically active textiles using cotton fibers impregnated with suspensions of pumpkin seed oil, carbonyl iron microparticles, and propolis microparticles. The textiles were utilized to manufacture planar capacitors, enabling an investigation of the effects of static magnetic fields and the introduced microparticles on the components of complex dielectric permittivity. The results reveal that the dielectric properties of the fabricated textiles are highly sensitive to the applied magnetic field intensity, the frequency of the alternating electric field, and the composition of the impregnating suspension. The experimental findings suggest that the dielectric loss and permittivity can be finely tuned by adjusting the magnetic flux density and the proportion of propolis microparticles. The multifunctional nature of these magnetically responsive textiles, combined with the bioactive properties of the incorporated natural components, opens promising pathways for applications in smart textiles, biomedical devices, and sensor technologies.
Keywords:
magnetically active textile
; dielectric permittivity
; pumpkin seed oil
; propolis microparticles
; carbonyl iron
; planar capacitors
; eco-friendly functional materials
1. Introduction
Smart textile materials with tunable physical properties, modifiable by external stimuli such as electric, magnetic, and sound fields, vibrations, and pH changes, have attracted significant attention in the academic community [1,2,3]. These materials address the growing technological and medical needs of modern society. By integrating monitoring sensors into fabrics, it becomes possible to remotely track patients’ vital parameters, providing new opportunities in healthcare applications [4,5]. In the treatment of malignant neoplasms, localized heating using electromagnetic fields has shown significant potential [6,7]. The thermal destruction of malignant cells can be achieved using nano-micro polymeric fibers decorated with magnetite nanoparticles [8,9]. The localized temperature increase results from the immobilization of magnetite nanoparticles within absorbable nano-microfibers [10,11], following physical mechanisms similar to those observed in magnetizable gels under electromagnetic field exposure [12].
The use of textile fibers in this context is highly advantageous, as they serve both as monitoring tools and therapeutic agents [13]. Ref. [14] presents an approach where nano-microfibers decorated with magnetite nanoparticles and chemotherapeutic substances were developed. The resulting medical device is precisely directed to the tumor site, releasing well-defined amounts of therapeutic agents in response to the local pH environment. However, a drawback of this method is the need for multiple treatment cycles, leading to the gradual loss of magnetizable material. To address this issue, Ref. [15] proposes the use of textiles decorated with magnetite nanoparticles, where the therapeutic substance is absorbed directly onto the tumoral tissue.
Recent advancements have been focused on replacement the chemotherapeutic substances in smart textiles by natural ones. As such, sterile cotton bandages incorporating honey, carbonyl iron microparticles (CIMs), and turmeric powder have been developed into innovative medical devices [16,17]. In a magnetic field [16], the electrical conductivity of these textiles can be coarsely adjusted through the volumetric fraction of CIMs and finely controlled by varying the intensity of the magnetic field. However, the presence of turmeric reduces electrical conductivity. Ref. [17] demonstrates that applying a medium-frequency electric field over a static magnetic field results in frequency-dependent dielectric loss coefficients, which peak at specific magnetic field intensities. These findings indicate that the textiles can be effectively heated using medium-frequency electric fields. Additionally, bioactive compounds from honey and turmeric powder exhibit thermal activation, enhancing their penetration through cutaneous barriers during treatment.
This study aims to develop advanced textile-based medical dressings with tunable electromagnetic properties. Therefore, cotton fabric (CF) is soaked with pumpkin seed oil (PSO), propolis microparticles (PMs), and CIMs. PSO was chosen for its antibacterial properties [18]. Furthermore, it has cardioprotective, anti-atherosclerotic, and anticancer properties, while also stimulating fat metabolism in tissues [19]. PMs provide additional therapeutic benefits, including antiallergic, antioxidant, anticancer, antidiabetic, and anti-inflammatory effects [20,21]. When ingested, they also demonstrate anti-anemic properties [22].
The primary objective is to investigate how the composition of these textiles and the application of an external magnetic field and a medium-frequency electric field influence their dielectric properties. The focus is on their capacitance, dielectric permittivity, and loss tangent. To achieve this, we fabricated three types of textile-based capacitors with varying proportions of CIMs, PSO, and PMs, then systematically analyzed their dielectric response under different frequencies and magnetic flux densities. The experimental results demonstrate that both material composition and external fields significantly modulate the dielectric properties, enabling tunable electrical behavior. These findings highlight the potential of these textiles for applications in wearable electronics, biomedical devices, and electromagnetic shielding.
2. Manufacturing of Magnetically Active Textile Fabrics
2.1. Materials and Main Physical Characteristics
The materials required for the manufacture of magnetically active textile fabrics are the following:
- CF, for commercial use (Figure 1a), with dimensions 50 mm × 50 mm × 0.6 mm. Optical microscopy shows that the structure of CF consists of interwoven cotton threads (Figure 1b). Each thread in the fabric is made up of microfibers. The relative humidity of the ambient environment of 65 % the mass density of CF is g/cm3.
- PSO, purchased from BIODAC-Timisoara (Romania) and has the appearance shown in (Figure 2a). At 24∘C the bulk density of PSO is g/cm3.
- CIMs (Figure 2b; code C3518), are purchased from Sigma-Aldrich (Germany). They have an iron content of at least 97 %. The mass density is g/cm3.
- Raw propolis (Figure A1 in Appendix A) from Comana Natural Park (Romania). After grinding, PMs are obtained, as shown in Figure 3. Their mass density is g/cm3. It is observed from Figure 3 that by grinding (with a coffee grinder), the raw propolis, initially of millimetric dimensions, is transformed into a fine hygroscopic powder (Figure 3a). Under the optical microscope, one can see that this powder consists of microparticles of different shapes and mean diameter mm.
All the above mass densities are for a temperature of 24∘C.
2.2. Magnetic and Structural properties of CIMs
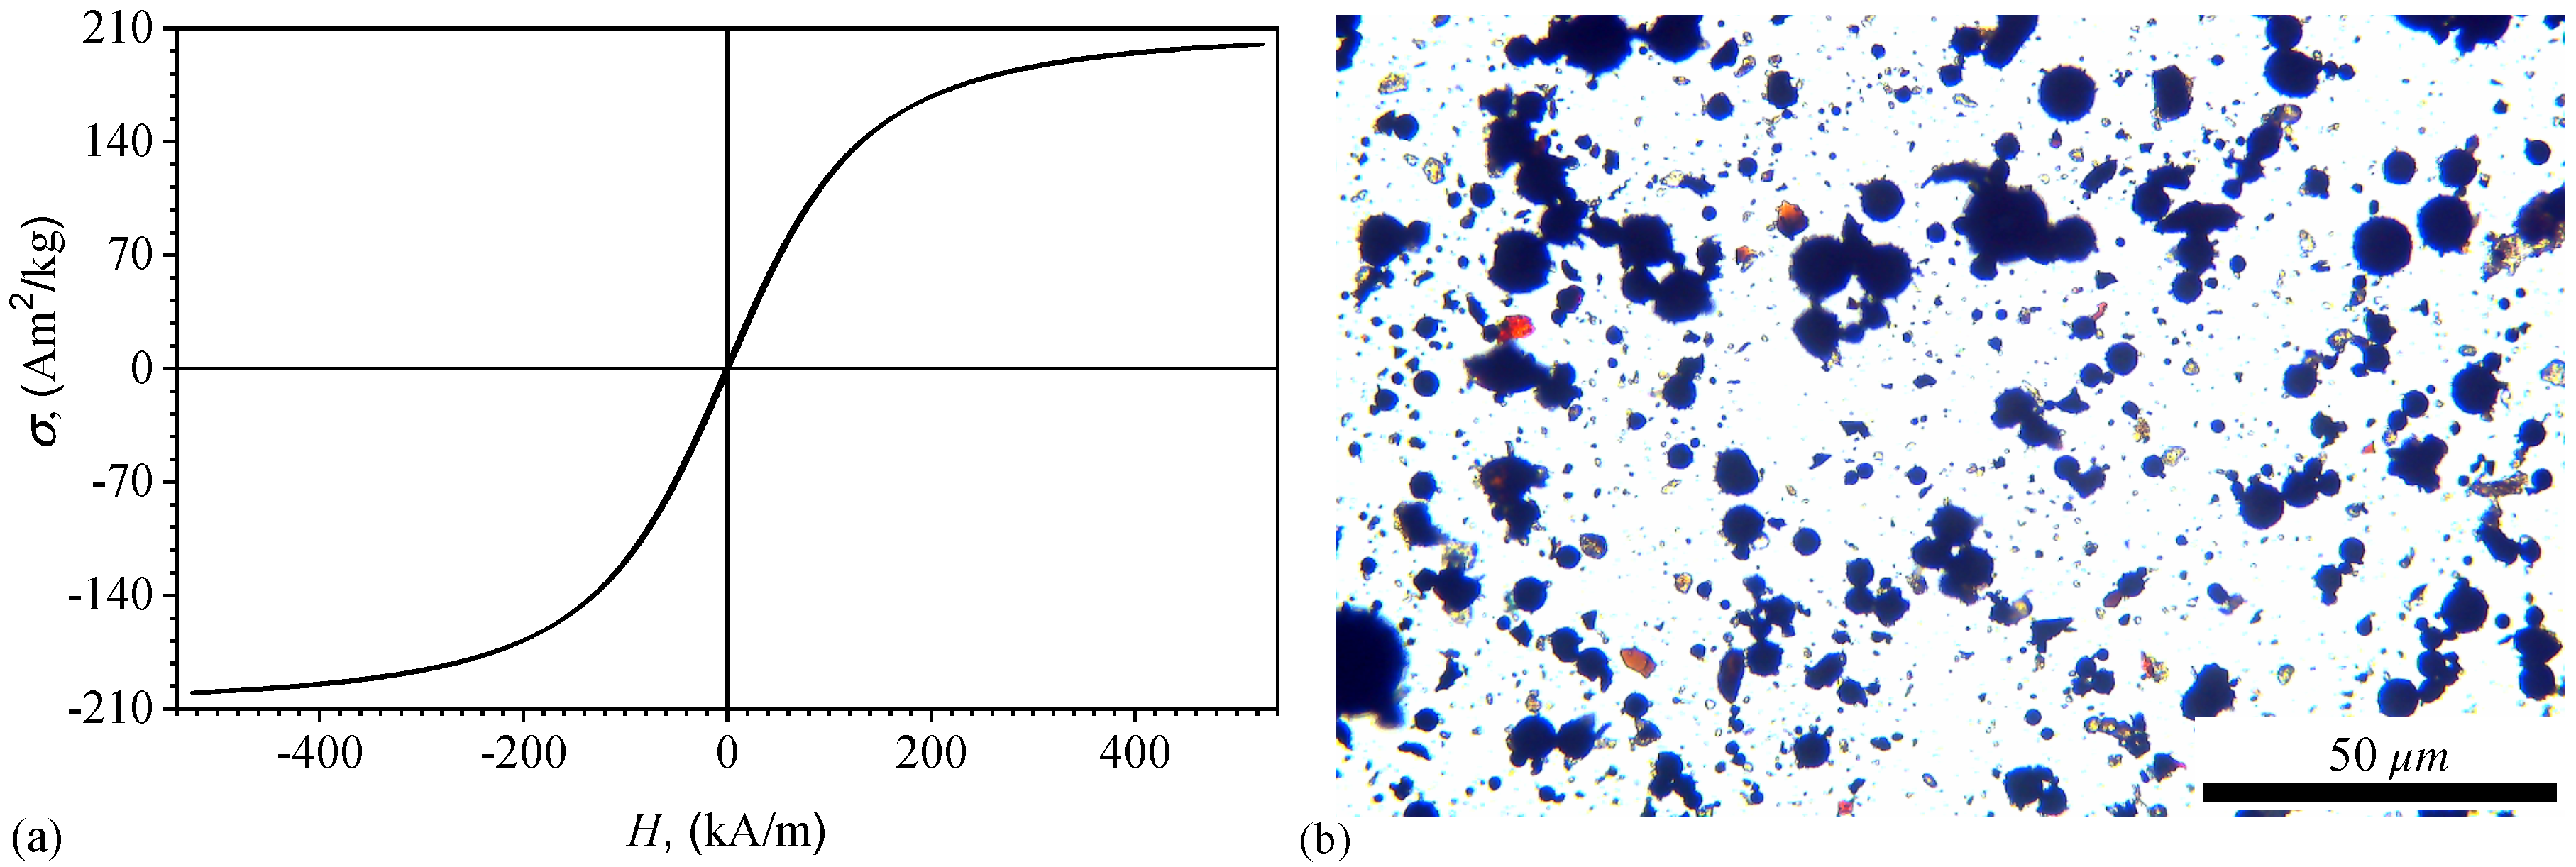
The magnetization curve of the microparticles is obtained with an experimental setup described in Ref. [23]. The results are presented in Figure 3a and show that for the relative magnetization of the microparticles increases fast and linearly with increasing the magnetic field intensity. For kA/m the increase is slower, reaching a maximum of about 200 Am2/Kg for kA/m.
Optical microscopy measurements show that CIMs have a spherical shape (Figure 3b). Their average diameter is .
Figure 4.
Magnetic and structural properties of CIMs. (a) Relative magnetization as a function of magnetic field intensity. (b) Optical microscopy. CIMs - black dots. Other colors - impurities.
Figure 4.
Magnetic and structural properties of CIMs. (a) Relative magnetization as a function of magnetic field intensity. (b) Optical microscopy. CIMs - black dots. Other colors - impurities.
2.3. Manufacturing Stages of Magnetorheological Suspensions (MRSs) Used for Smart Textiles
MRSs manufacturing involves the following steps:
- 1.
- 2.
- Three Berzelius beakers are prepared, each with a capacity of 25 cm3. In each of them, CIMs, PSO and PMs are introduced in the volumes and masses specified in Table 1. First a solution consisting of PSO and PMs is prepared (Figure 5a) and then CIMs are added (Figure 5b). The final mixtures formed are homogenized for about 120 s, at 14.000 rpm with a milk frother (type Xavax, code 00111106), distributed by Hama GmbH & Co Germany. At the end of this stage, the first magnetorheological suspension (MRS1) is obtained.
- 3.
- In the second Berzelius beaker, CIMs, PSO and PMs are introduced in the volumes and masses specified in Table 1. After homogenization with the same device and in the same period of time, MRS2 is obtained.
- 4.
2.4. Magnetic and Structural Properties of MRSs
To obtain the magnetization curves of the MRSs, we use the relation [24]: with being given in Table 1, is the vacuum magnetic constant, and is the relative magnetic susceptibility of the MRSs. Then, using the data from Figure 4a in the above equation, we obtain the magnetization curves of MRSs in Figure 6a. The results show that the magnetization curves of MRSs have the same shape as for CIMs but with saturation magnetizations scaled down by the factor . Since the largest quantity of CIMs, in absolute values, is in MRS1, the corresponding saturation magnetization is the largest one ( Am2/kg).
It is well known that in the absence of a magnetic field the magnetic particles are randomly distributed within the matrix. When subjected to a uniform magnetic field of flux density B, the CIMs form parallel chain-like structures oriented along magnetic field lines [25]. For the MRSs obtained here, the same phenomenon holds, but because of the presence of PMs, additional structural organization is observed.
In the absence of a magnetic field, the CIMs and PMs are randomly distributed within the PSO matrix, but the former tend to cluster around the larger propolis particles, as shown in Figure 7a. This preferential arrangement is likely driven by a combination of interfacial interactions, such as van der Waals forces, electrostatic attraction (if surface charges differ), and size-related effects, where the smaller CIMs exhibit higher mobility and a tendency to adhere to larger particles. Additionally, weak capillary forces or partial wetting effects may contribute to this initial organization. Since there is no external force aligning the particles, their distribution remains non-uniform, with PMs acting as passive inclusions surrounded by a loose aggregation of CIMs.
When a magnetic field is applied, the CIMs rapidly realign due to strong dipole-dipole interactions, forming chain-like structures parallel to the field direction, as shown in Figure 7b. The initially CIMs partially detach from the PMs surfaces as magnetic interactions dominate, reorganizing into anisotropic structures that span the matrix. Meanwhile, the PMs, being non-magnetic, remain randomly distributed and are largely unaffected by the field. Their spatial arrangement is maintained due to the lack of direct magnetic forces acting on them, while local changes in viscosity and particle movement may result in minor adjustments in their positioning. This dynamic restructuring highlights the competition between magnetic forces driving the alignment of CIMs and the passive behavior of the non-magnetic inclusions.
2.5. Manufacturing of Smart Textiles (STs), and Their Magnetic and Structural Properties
Three identical pieces CFi, with are cut from CF. From each of the prepared MRSi (), a quantity cm3 is extracted. Each CFi is impregnated with the corresponding MRSi, and medical dressings STi, with are obtained (Figure 8a). The volume of CF used in each MRSs is cm3. Therefore, the corresponding volume fraction is vol%. Thus, Table 1 is adapted to Table 2 to reflect the compositions of the components of dressings STs.
Optical microscopy reveals that MRS primarily accumulates in the spaces between the yarns of CF rather than uniformly coating individual fibers (Figure 8a). This structural arrangement is governed by a combination of capillary action, surface wetting, and viscous flow dynamics. Cotton, being a highly porous and hydrophilic material, promotes the absorption of the liquid matrix through capillary forces, drawing the mixture into the gaps between yarns where the fiber intersections create small reservoirs. The distribution of the suspension is further influenced by the interfacial energy between the oil-based fluid and the cotton fibers; if the surface energy of the fibers is lower than that of the liquid, the suspension tends to accumulate in regions where it can minimize interfacial tension. Additionally, the viscosity of the suspension affects its ability to penetrate the fabric structure — if sufficiently low, it spreads easily, but if too high, it may remain localized in larger voids. As the liquid matrix is absorbed, the solid microparticles (propolis and carbonyl iron) follow the flow path but may experience filtering effects, where larger particles are more likely to remain trapped in wider pores, while finer ones distribute more evenly throughout the fabric. This results in a non-uniform but structured impregnation, where the active components are concentrated in the inter-yarn spaces, potentially enhancing their release and interaction with the skin when the dressing is applied.
Magnetic properties are obtained in a similar way as for MRSs (see discussion above in Section 2.4). The magnetization of STs reveal that while the overall magnetic behavior remains the same, the saturation magnetization decreases as compared to pure MRS (compare Figure 6b and Figure 6a). In particular, the saturation magnetization for ST1 decreases to about 34 Am2/kg from about 60 Am2/kg for MRS1. This reduction in saturation magnetization is proportional to the quantity of the cotton fibers (from 30 vol.% to 17 vol.%), suggesting a dilution effect caused by the presence of the non-magnetic cotton matrix. In the impregnated state, the total volume of the sample now includes a significant fraction of cotton, which does not contribute to magnetization, thereby reducing the overall magnetization per unit volume. This effect follows a simple volumetric averaging rule, where the magnetization of the composite is weighted by the relative fractions of magnetic and non-magnetic components. Additionally, while the spatial distribution of CIMs within the MRSs is relatively homogeneous, the absorption process into the CF may introduce local variations in particle concentration, potentially leading to partial immobilization or reduced effective particle alignment under an external magnetic field. However, since the saturation magnetization is determined primarily by the intrinsic properties of the magnetic particles, the fundamental response remains unchanged, and the observed decrease is primarily due to the increased proportion of non-magnetic material in the medical dressing.
3. Dielectric Properties
For investigating the dielectric properties of STs, we use them as dielectric materials in a parallel-plate capacitor configuration, with two copper plates serving as electrodes. The primary dielectric properties analyzed include the complex dielectric permittivity (), comprising both the real part (), which represents the material’s ability to store electrical energy, and the imaginary part (), which accounts for dielectric losses. Additionally, we examine the capacitance (C) to assess how the dielectric response of the STs is influenced by frequency and external magnetic fields. The loss tangent (), defined as the ratio of the imaginary to the real part of permittivity, is evaluated to determine energy dissipation due to dielectric losses. Furthermore, we measure the electrical resistance (R) and derive the electrical conductivity () of the STs to understand their resistive behavior under an applied alternating electric field. The influence of an external static magnetic field on these dielectric parameters is also explored, allowing us to characterize potential magnetodielectric effects. By systematically analyzing these properties, we aim to gain insight into the tunability of the STs for applications in sensors, medical textiles, and smart materials.
3.1. Materials for Manufacturing the Capacitors
For the manufacture of capacitors the following materials are used:
- A simple copper-clad glass-textolite board, with dimensions 100 mm × 75 mm × 0.8 mm, from Electronic Light Tech (Romania). The board is based on an epoxy resin, type FR4 and reinforced with glass fiber, with one side covered with a copper layer. The thickness of this layer is 35 m.
- The medical dressings, having the length and width equal to 50 mm and the thickness mm, mm and respectively mm.
- Self-adhesive insulating tape from 3M (USA). The tape is for general surgical use and is in the form of rolls. A roll of this tape has a length of 9.5 m, a width of 5 cm and a thickness of 0.20 mm.
3.2. Steps for Manufacturing the Capacitors
The main steps for manufacturing the capacitors are:
- 1.
- Six pieces are cut from the textolite board, with dimensions 50 mm × 50 mm × 0.8 mm.
- 2.
- On each board, two electrical conductors are soldered with lead alloy.
- 3.
- Between two boards with electrically conductive surfaces, the dressings STi (with ) are fixed one by one (Figure 9a).
- 4.
- To obtain a good electrical contact between the copper electrodes and the dressings surfaces, the electrode-STs assembly is pressed and consolidated with the self-adhesive tape (Figure 9b).
3.3. Experimental Setup
The experimental installation used to study the influence of the magnetic field and PMs on the components and the complex dielectric permittivity modulus has the overall configuration shown in Figure 10. The installation consists of a homemade direct current electromagnet, a direct current source (DCS; RXN-3020D type, from Shenzhen Ever Good Electronic Co., China), the impedance meter Br (E7-20 type, from MNIPI, Rep. Belarus) and the gaussmeter Gs (DX-102 type, from Dexing-Magnetic, China) with a Hall probe, h. The electromagnet consists of a coil fixed on a magnetic core. For values of the current intensity through the electromagnet coil, between the magnetic poles N and S, located at a distance of 5 mm apart from each other, the values B of the magnetic flux density can be continuously increased up to the maximum of 420 mT. For voltages of 30 Vdc at its terminals, it delivers an electric current with maximum intensities of 20 Adc. The equivalent components are measured when connected to an inductive or capacitive load, for frequencies between 25 Hz and 1 MHz. The effective voltage of the alternating signal applied to the inductive or capacitive load can be adjusted in the range 0.4 - 1.0 Vdc.
3.4. Capacitance and Relative Dielecric Permittivity of Capacitors with Medical Dressings STs
For the study of capacitance C of STs in an alternating electric field superimposed on a static magnetic field we introduce, in turn, the capacitors between the N and S poles together with the Hall probe. On the impedance meter panel we set the alternating voltage to the effective value V. On the same panel we set the frequency f of the alternating voltage to the 10, 20, 30, 40 and 50 kHz. For each value of f, the values of B are increased from 0 to 390 mT in steps of 30 mT. In these conditions, C and D are measured after the application of the magnetic field. For these measurements the impedance meter is connected to the capacitor terminals and fixed on the parallel measuring module for electrical circuit elements. The values obtained are graphically represented in Figure 11.
The results reveal a clear dependence on both frequency and material composition. In all cases, capacitance decreases with increasing frequency, a common behavior in dielectric materials where dipole polarization mechanisms become less effective at higher frequencies [26]. The differences in capacitance values among the three medical dressings can be primarily attributed to variations in the amounts of PSO and PMs. ST1, which contains the highest volume of PSO and no PMs Table 2, exhibits the highest capacitance across all frequencies. In contrast, ST3, with the lowest PSO content and the highest amount of PMs, shows the lowest capacitance values. ST2, which has an intermediate composition, has capacitance values between those of ST1 and ST3. The higher capacitance in ST1 suggests that PSO contributes significantly to the dielectric properties of the system. Oils generally have a high dielectric constant, which enhances charge storage capability. In contrast, the presence of PMs in ST2 and ST3 appears to reduce capacitance, likely due to interfacial polarization effects or disruptions in the dielectric uniformity caused by the solid particles. These microparticles may introduce microstructural inhomogeneities that hinder charge storage, effectively lowering the overall permittivity of the material.
Figure 11 also shows that the capacitance of all three smart textiles (ST1, ST2, and ST3) significantly depend on the applied magnetic flux density (B). This suggests that increasing B enhances charge storage in the textile systems. The dependence is strongest for ST3, indicating that the interaction between the magnetic field and the dielectric properties is most pronounced in the textile with the highest PMs content and lowest PSO content. ST1 and ST2 also show significant dependencies on B, implying that magnetodielectric effects play a crucial role in modulating capacitance in these materials. This strong dependence of capacitance on B can be attributed to the presence of CIMs, which induce magnetodielectric effects through mechanisms such as field-induced polarization enhancement or modifications in the internal electric field distribution. The alignment of iron microparticles under an applied magnetic field may lead to increased polarization of the surrounding dielectric medium, thereby increasing the effective permittivity of the system. Additionally, magnetically induced charge redistribution at the interfaces between PSO, PMs, and the conductive iron particles may contribute to an increase in capacitance.
For calculating the relative dielectric permittivity we assimilate the capacitor with medical dressings to a plane capacitor. Then from the formula for calculating the capacitance of a plane capacitor, for the common surface area of 25 × 10−4 m2, pF/m and the thicknesses of medical dressings listed in Section 3.1, we obtain the relative permittivities:
where the capacitances correspond to the dressings ST1, ST2 and ST3 from Figure 11a–c.
Therefore, the relative dielectric permittivities of ST1, ST2, and ST3 (Figure 11d–f) follow the same trends as their measured capacitance values, differing only by constant scaling factors. Since the geometric factors of the experimental setup, including plate area and separation distance remain fixed for all measurements, changes in capacitance directly reflect variations in , preserving the same trends across frequencies and magnetic flux densities. The slightly different scaling factors for each textile indicate variations in their structural composition, which subtly influence permittivity calculations. ST3, with the highest scaling factor, suggests a more significant contribution from interfacial polarization effects due to its high PMs content. Conversely, ST1, with the lowest scaling factor, likely exhibits a more uniform dielectric distribution with fewer interfacial disruptions.
3.5. Loss Tangent of Capacitors with Medical Dressings STs
The loss tangent D characterizes the energy dissipation in a dielectric material and provides insight into polarization and conduction losses. The measured values for all three smart textiles (ST1, ST2, and ST3) exhibit a decreasing trend with increasing frequency (Figure 12), indicating a dominant dielectric relaxation mechanism. At lower frequencies, dipoles and charge carriers have sufficient time to align with the applied electric field, leading to greater energy dissipation. As frequency increases, their response time is insufficient, reducing overall losses. No relaxation peaks are observed in any of the systems, suggesting that the dominant loss mechanisms are steady-state polarization and conduction rather than discrete frequency-dependent relaxation processes.
The composition of the textiles significantly influences the magnitude of dielectric losses. ST1, which contains the highest volume of PSO and no PMs, exhibits intermediate values across all frequencies, confirming that an oil-rich composition enhances charge storage efficiency while minimizing dissipation. ST2, with a moderate amount of PMs, shows consistently higher losses than ST1, likely due to increased interfacial polarization at the interfaces between the oil and solid microparticles. ST3, which has the highest concentration of PMs and the lowest oil content, exhibits generally the lowest loss tangent values across all frequencies, indicating that interfacial charge trapping and polarization losses dominate in this system.
A strong correlation between D and the applied magnetic flux density (B) is observed in all three systems (Figure 12), suggesting the presence of magnetodielectric effects. The presence of CIMs in the textiles may contribute to increased losses through magnetoresistance effects, which affect charge carrier dynamics, and through eddy current losses in the iron particles under an alternating electric field.
3.6. Resistance of Capacitors with Medical Dressings STs
The results obtained in Figure 11 and Figure 12 respectively suggest that from an electrical point of view, the capacitors can be represented as an electric dipole formed by a capacitor electrically connected in parallel with a resistor. Then, from the calculation relation of a planar electric capacitor and the calculation relation of a linear resistor and respectively using the definition of the loss tangent, the calculation formula for the resistor resistance is given by [27]:
Then, the resistance measurements for ST1, ST2, and ST3 are presented in Figure 13. The results show they exhibit distinct trends, complementing the previously analyzed capacitance and loss tangent behaviors. The resistance decreases with increasing frequency for all three textiles, which is expected in dielectric materials where conduction effects become less dominant at higher frequencies.
ST1, consistently shows the lowest resistance values, indicating that the oil-dominated composition supports better charge transport or reduced interfacial barriers. In contrast, ST3 exhibits significantly higher resistance across all frequencies, suggesting that the presence of solid microparticles introduces additional barriers to charge movement, leading to increased resistive losses. ST2, which has an intermediate composition, shows resistance values between those of ST1 and ST3, reinforcing the role of PMs in increasing resistivity. This effect is likely due to interfacial charge trapping and disrupted charge percolation pathways in the composite structure. The higher standard deviation of average resistance observed in ST3 suggests greater heterogeneity in resistive behavior, possibly due to variations in charge transport across different regions of the material.
3.7. Dielectric Loss of Capacitors with Medical Dressings STs
The dielectric loss () of the capacitors is calculated according to the formula:
where is given in Figure 11d–f, and D is given in Figure 12a–c.
The dielectric loss for ST1, ST2, and ST3 follow also a decreasing trend with increasing frequency (Figure 14), which is characteristic of dielectric relaxation mechanisms. At lower frequencies, energy dissipation is higher due to greater charge carrier mobility and dipole alignment with the electric field, whereas at higher frequencies, these effects weaken, leading to lower losses.
ST3, which contains the highest amount of PMs and the lowest PSO content, exhibits the lowest dielectric loss across all frequencies, suggesting reduced dipole mobility and a more resistive behavior compared to ST1 and ST2. The higher dielectric loss in ST1 and ST2, particularly at lower frequencies, indicates stronger polarization effects and charge transport mechanisms. ST1, with the highest PSO content, maintains slightly higher loss values than ST2 at all frequencies, suggesting that PSO contributes to increased dipole mobility and dielectric relaxation. In contrast, ST3, which contains the highest proportion of solid microparticles, exhibits lower losses, likely due to interfacial polarization barriers that limit charge movement. The standard deviation values are significantly higher for ST2 and ST3 compared to ST2. These observations align with previous capacitance and resistance trends, further confirming that dielectric loss is influenced by both composition and frequency.
The results in Figure 14 also show that is sinificantly influenced by the applied magnetic flux density (B) across all frequencies. This indicates that increasing B leads to a systematic increase in dielectric loss, suggesting that magnetodielectric effects play an important role in energy dissipation. The strongest dependence on B is observed in ST3, likely due to the higher content of PMs and their impact on interfacial polarization.
4. Discussions
The findings of this study not only confirm the expected dielectric behavior of the manufactured STs but also reveal additional insights into their tunability, interaction mechanisms, and potential technological impact. Beyond the direct experimental observations, several aspects require further exploration to deepen the understanding of these materials’ behavior in real-world applications.
4.1. Synergistic Role of Magnetic and Dielectric Properties
One key observation is the ability of CIMs to modulate dielectric properties in the presence of a magnetic field. While previous studies have explored magnetodielectric effects in various composite materials, the unique integration of biocompatible components such as PSO and PMs provides new insights. The results indicate that the reorganization of CIMs under an applied field alters charge distribution within the textile, indirectly influencing capacitance and loss tangent.
A more detailed microscopic investigation could clarify whether this behavior is purely due to magnetic realignment or if additional interfacial effects—such as localized charge trapping or microstructural polarization anisotropy—are contributing. Future studies incorporating imaging techniques like scanning electron microscopy coupled with energy-dispersive X-ray spectroscopy could provide a more detailed picture of how the internal structure of these materials evolves in response to an applied field.
4.2. Interfacial Interactions and Charge Distribution
Another intriguing aspect is the nonlinear variation of dielectric loss with PM content. While the presence of PMs generally reduces capacitance, its influence on dielectric loss appears more complex. The results suggest that at certain concentrations, PMs contribute to energy dissipation, possibly by disrupting charge pathways or introducing additional sites for interfacial polarization.
The role of PSO as a dielectric modifier is also worth further investigation. It is well known that oils can influence charge carrier mobility in composite systems, but the exact contribution of PSO to dielectric behavior remains partially speculative. A systematic comparison with other bio-oils could help differentiate between effects specific to PSO and general trends observed in oil-impregnated textiles. Such comparative studies could be explored in future research, providing deeper insights into the influence of different natural additives on the dielectric properties of STs.
4.3. Time-Dependent and Environmental Effects
The study primarily focuses on the immediate response of STs to electromagnetic fields, but long-term stability remains an open question. Factors such as:
- Oxidation or degradation of PSO over time,
- Possible migration or aggregation of CIMs and PMs under repeated exposure to varying magnetic fields, and
- Changes in the medical dressing’s mechanical flexibility due to repeated stress cycles,
could all impact their real-world performance. Future experiments should consider aging studies under different environmental conditions (e.g., humidity, temperature variations) to determine whether these materials maintain their tunability over extended use.
4.4. Broader Applications Beyond Energy Storage and Sensing
While the study highlights biomedical and wearable applications, the magnetodielectric effects observed here could also have implications for other areas:
- Soft robotics and actuators: The ability to manipulate charge storage via magnetic fields could be leveraged for field-controlled textile actuators.
- Flexible antennas and communication textiles: Materials exhibiting tunable dielectric properties can enhance reconfigurable radio-frequency (RF) devices, where adaptability to external fields is a key advantage.
- Bioelectronics: Since the components used (PSO, PMs) are biocompatible, these textiles could be explored for implantable capacitive sensors or electrophysiological monitoring tools.
4.5. Towards a More Predictive Model
Finally, the experimental results provide valuable data for developing a predictive theoretical model of magnetodielectric effects in hybrid bio-based materials. The observed trends suggest that capacitance and loss tangent could be described using a generalized effective medium approximation, incorporating magnetically induced structural realignment, frequency-dependent polarization relaxation, and interfacial charge redistribution effects.
Models based on the dipolar approximation have been used to describe dielectric behaviour in composite materials [28,29]. Improving or extending these models by incorporating field-dependent dipolar interactions and charge redistribution mechanisms would lead to a more predictive framework. This allows for a more precise tuning of STs properties.
5. Conclusions
This study successfully demonstrates the fabrication and characterization of magnetically active STs composed of cotton fabric impregnated with CIMs, PSO, and PMs. The integration of these components enables tunable dielectric properties.
The experimental findings highlight the potential of these STs for applications in wearable electronics, biomedical devices, and electromagnetic shielding. The results reveal that the dielectric response of the STs is highly dependent on frequency, composition, and magnetic field strength.
Capacitance decreases with increasing frequency due to reduced dipole polarization, while the presence of PSO enhances charge storage, increasing dielectric permittivity. Conversely, the inclusion of PMs reduces capacitance, likely due to interfacial polarization effects and microstructural inhomogeneities. The presence of CIMs introduces magnetodielectric effects, which enable dynamic tuning of electrical properties under an applied magnetic field. This effect is most pronounced in ST3, where a higher PM content leads to stronger field-dependent behavior. The analysis of electrical conductivity and resistance further supports these observations. ST1, which contains the highest proportion of PSO, exhibits lower resistance and better charge transport properties, making it suitable for applications that require efficient energy storage and minimal dielectric losses. In contrast, ST3, with a higher PM content, displays greater resistivity, suggesting an increased level of charge trapping and reduced electrical conductivity. The loss tangent follows a decreasing trend with frequency, with ST1 demonstrating the lowest dielectric losses, indicating that low-loss STs can be designed for high-performance energy storage and sensing applications.
These findings suggest a broad range of technological applications for these STs. Their tunable capacitance makes them ideal for flexible capacitors and bioelectronic sensors in wearable electronics. The incorporation of bioactive components such as PSO and PMs provides additional functionality, making these materials promising candidates for biomedical applications, including wound healing and controlled drug delivery. Additionally, their magnetodielectric tunability suggests their potential use in electromagnetic shielding and reconfigurable RF devices, where adaptive field-dependent responses are desirable.
To maximize the potential of these materials, future research should focus on microscopic structural analysis using advanced imaging techniques such as scanning electron microscopy and energy-dispersive X-ray spectroscopy to better understand the underlying charge transport mechanisms. Long-term stability studies are also necessary to evaluate the durability of these textiles under mechanical stress and environmental exposure. Additionally, theoretical modeling should be developed to describe the interplay between magnetic field effects, interfacial polarization, and charge redistribution, providing a predictive framework for optimizing textile performance. Further exploration of alternative bioactive components may expand their functionality and broaden their applicability in biomedical and electronic applications.
Overall, this study highlights the multifunctional and adaptive nature of magnetically active textiles. By strategically adjusting material composition and external magnetic fields, their electrical properties can be customized for diverse real-world applications. These results open promising avenues for the next generation of intelligent, responsive, and eco-friendly textile-based devices.
Author Contributions
Conceptualization, I.B. and E.M.A.; methodology, I.B. and E.M.A; validation, I.B., E.M.A., G.E.I and L.M.E.C.; formal analysis, I.B., E.M.A., G.E.I and L.M.E.C.; investigation, I.B. and E.M.A.; writing—original draft preparation, I.B. and E.M.A.; writing—review and editing, I.B. and E.M.A.; visualization, E.M.A.; supervision, I.B.; All authors have read and agreed to the published version of the manuscript.
Funding
This research received no external funding.
Institutional Review Board Statement
Not applicable.
Informed Consent Statement
Not applicable.
Data Availability Statement
The original contributions presented in the study are included in the article/supplementary material, further inquiries can be directed to the corresponding author/s.
Conflicts of Interest
The authors declare no conflicts of interest.
Appendix A Raw propolis
The row propolis (Figure A1) with particle diameters of few milimeters.
Figure A1.
A photograph of raw propolis used to obtain the PMs in Figure 3.
Figure A1.
A photograph of raw propolis used to obtain the PMs in Figure 3.

References
- Ruckdashel, R.R.; Venkataraman, D.; Park, J.H. Smart textiles: A toolkit to fashion the future. J. Appl. Phys. 2021, 129, 130903. [Google Scholar] [CrossRef]
- Júnior, H.L.O.; Neves, R.M.; Monticeli, F.M.; Dall Agnol, L. Smart Fabric Textiles: Recent Advances and Challenges. Textiles 2022, 2, 582–605. [Google Scholar] [CrossRef]
- Tat, T.; Chen, G.; Zhao, X.; Zhou, Y.; Xu, J.; Chen, J. Smart Textiles for Healthcare and Sustainability. ACS Nano 2022, 16, 13301–13313. [Google Scholar] [CrossRef]
- Choudhry, N.A.; Arnold, L.; Rasheed, A.; Khan, I.A.; Wang, L. Textronics—A Review of Textile-Based Wearable Electronics. Adv. Eng. Mater. 2021, 23, 2100469. [Google Scholar] [CrossRef]
- Boncel, S.; Jędrysiak, R.G.; Czerw, M.; Kolanowska, A.; Blacha, A.W.; Imielski, M.; Jóźwiak, B.; Dzida, M.H.; Greer, H.F.; Sobotnicki, A. Paintable Carbon Nanotube Coating-Based Textronics for Sustained Holter-Type Electrocardiography. ACS Appl. Nano Mater. 2022, 5, 15762–15774. [Google Scholar] [CrossRef] [PubMed]
- Sanz, B.; Calatayud, M.P.; Torres, T.E.; Fanarraga, M.L.; Ibarra, M.R.; Goya, G.F. Magnetic hyperthermia enhances cell toxicity with respect to exogenous heating. Biomaterials 2017, 114, 62–70. [Google Scholar] [CrossRef]
- Liu, X.; Zhang, Y.; Wang, Y.; Zhu, W.; Li, G.; Ma, X.; Zhang, Y.; Chen, S.; Tiwari, S.; Shi, K.; et al. Comprehensive understanding of magnetic hyperthermia for improving antitumor therapeutic efficacy. Theranostics 2020, 10, 3793–3815. [Google Scholar] [CrossRef] [PubMed]
- Amarjargal, A.; Tijing, L.D.; Park, C.H.; Im, I.T.; Kim, C.S. Controlled assembly of superparamagnetic iron oxide nanoparticles on electrospun PU nanofibrous membrane: A novel heat-generating substrate for magnetic hyperthermia application. Eur. Polym. J. 2013, 49, 3796–3805. [Google Scholar] [CrossRef]
- Rubia-Rodriguez, I.; Santana-Otero, A.; Spassov, S.; Tombacz, E.; Johansson, C.; De La Presa, P.; Teran, F.J.; Morales, M.d.P.; Veintemillas-Verdaguer, S.; Thanh, N.T.K.; et al. Whither Magnetic Hyperthermia? A Tentative Roadmap. Materials 2021, 14. [Google Scholar] [CrossRef]
- Sasikala, A.R.K.; Unnithan, A.R.; Yun, Y.H.; Park, C.H.; Kim, C.S. An implantable smart magnetic nanofiber device for endoscopic hyperthermia treatment and tumor-triggered controlled drug release. Acta Biomater. 2016, 31, 122–133. [Google Scholar] [CrossRef]
- Chen, Y.H.; Cheng, C.H.; Chang, W.J.; Lin, Y.C.; Lin, F.H.; Lin, J.C. Studies of magnetic alginate-based electrospun matrices crosslinked with different methods for potential hyperthermia treatment. Mater. Sci. Eng.: C 2016, 62, 338–349. [Google Scholar] [CrossRef] [PubMed]
- Kaczmarek, K.; Mrowczynski, R.; Hornowski, T.; Bielas, R.; Jozefczak, A. The Effect of Tissue-Mimicking Phantom Compressibility on Magnetic Hyperthermia. Nanomaterials 2019, 9. [Google Scholar] [CrossRef] [PubMed]
- Jozefczak, A.; Kaczmarek, K.; Bielas, R. Magnetic mediators for ultrasound theranostics. Theranostics 2021, 11, 10091–10113. [Google Scholar] [CrossRef]
- GhavamiNejad, A.; Sasikala, A.R.K.; Unnithan, A.R.; Thomas, R.G.; Jeong, Y.Y.; Vatankhah-Varnoosfaderani, M.; Stadler, F.J.; Park, C.H.; Kim, C.S. Mussel-Inspired Electrospun Smart Magnetic Nanofibers for Hyperthermic Chemotherapy. Adv. Func. Mater 2015, 25, 2867–2875. [Google Scholar] [CrossRef]
- Soares, P.I.; Romao, J.; Matos, R.; Silva, J.C.; Borges, J.P. Design and engineering of magneto-responsive devices for cancer theranostics: Nano to macro perspective. Progr. Mater. Sci. 2021, 116, 100742. [Google Scholar] [CrossRef]
- Bica, I.; Anitas, E. Magnetic field intensity effect on electrical conductivity of magnetorheological biosuspensions based on honey, turmeric and carbonyl iron. J. Ind. Eng. Chem. 2018, 64, 276–283. [Google Scholar] [CrossRef]
- Bica, I.; Anitas, E. Magnetodielectric effects in membranes based on magnetorheological bio-suspensions. Mater. & Des. 2018, 155, 317–324. [Google Scholar] [CrossRef]
- Petropoulos, S.A.; Fernandes, A.; Calhelha, R.C.; Rouphael, Y.; Petrovic, J.; Sokovic, M.; Ferreira, I.C.F.R.; Barros, L. Antimicrobial Properties, Cytotoxic Effects, and Fatty Acids Composition of Vegetable Oils from Purslane, Linseed, Luffa, and Pumpkin Seeds. Appl. Sci. 2021, 11. [Google Scholar] [CrossRef]
- Hu, Z.; Hu, C.; Li, Y.; Jiang, Q.; Li, Q.; Fang, C. Pumpkin seed oil: a comprehensive review of extraction methods, nutritional constituents, and health benefits. J. Sci. Food Agric. 2024, 104, 572–582. [Google Scholar] [CrossRef]
- Hossain, R.; Quispe, C.; Khan, R.e.a. Propolis: An update on its chemistry and pharmacological applications. Chin. Med. 2022, 17, 100. [Google Scholar] [CrossRef]
- Zullkiflee, N.; Taha, H.; Usman, A. Propolis: Its Role and Efficacy in Human Health and Diseases. Molecules 2022, 27. [Google Scholar] [CrossRef] [PubMed]
- Gordeuk, V.R.; Brittenham, G.M.; McLaren, C.E.; Hughes, M.A.; Keating, L.J. Carbonyl Iron Therapy for Iron Deficiency Anemia. Blood 1986, 67, 745–752. [Google Scholar] [CrossRef] [PubMed]
- Ercuta, A. Sensitive AC Hysteresigraph of Extended Driving Field Capability. IEEE Trans. Instrum. Meas. 2020, 69, 1643–1651. [Google Scholar] [CrossRef]
- Genc, S. Synthesis and Properties of Magnetorheological (MR) Fluids. PhD thesis, University of Pittsburgh., 2002.
- Filipcsei, G.; Csetneki, I.; Szilágyi, A.; Zrínyi, M. , Magnetic Field-Responsive Smart Polymer Composites. In Oligomers - Polymer Composites - Molecular Imprinting; Springer-Verlag Berlin, Heidelberg, Germany, 2007; pp. 137–189. [CrossRef]
- Barsoukov, E.; (Eds.), J.R.M. Impedance Spectroscopy Theory, Experiment, and Applications; John Wiley & Sons: New Jersey, USA, 2005. [Google Scholar] [CrossRef]
- Moliton, A. Applied Electromagnetism and Materials; Springer Science, New York, USA, 2007. [CrossRef]
- Bica, I.; Anitas, E.M.; Sfirloaga, P. Magnetizable Membranes Based on Cotton Microfibers, Honey, Carbonyl Iron, and Silver Nanoparticles: Effects of Static Magnetic Fields and Medium-Frequency Electric Fields on Electrical Properties. Magnetochemistry 2023, 9. [Google Scholar] [CrossRef]
- Bica, I.; Anitas, E.M.; Iacobescu, G.E. Electrical Capacitors Based on Silicone Oil and Iron Oxide Microfibers: Effects of the Magnetic Field on the Electrical Susceptance and Conductance. Micromachines 2024, 15. [Google Scholar] [CrossRef]
Figure 1.
Cotton fabric: (a) Photograph at actual size (1:1 scale); (b) Microscopic view, where the bright areas represent the loops formed by interwoven threads, while the twisted structures correspond to yarns composed of cotton microfibers.
Figure 1.
Cotton fabric: (a) Photograph at actual size (1:1 scale); (b) Microscopic view, where the bright areas represent the loops formed by interwoven threads, while the twisted structures correspond to yarns composed of cotton microfibers.
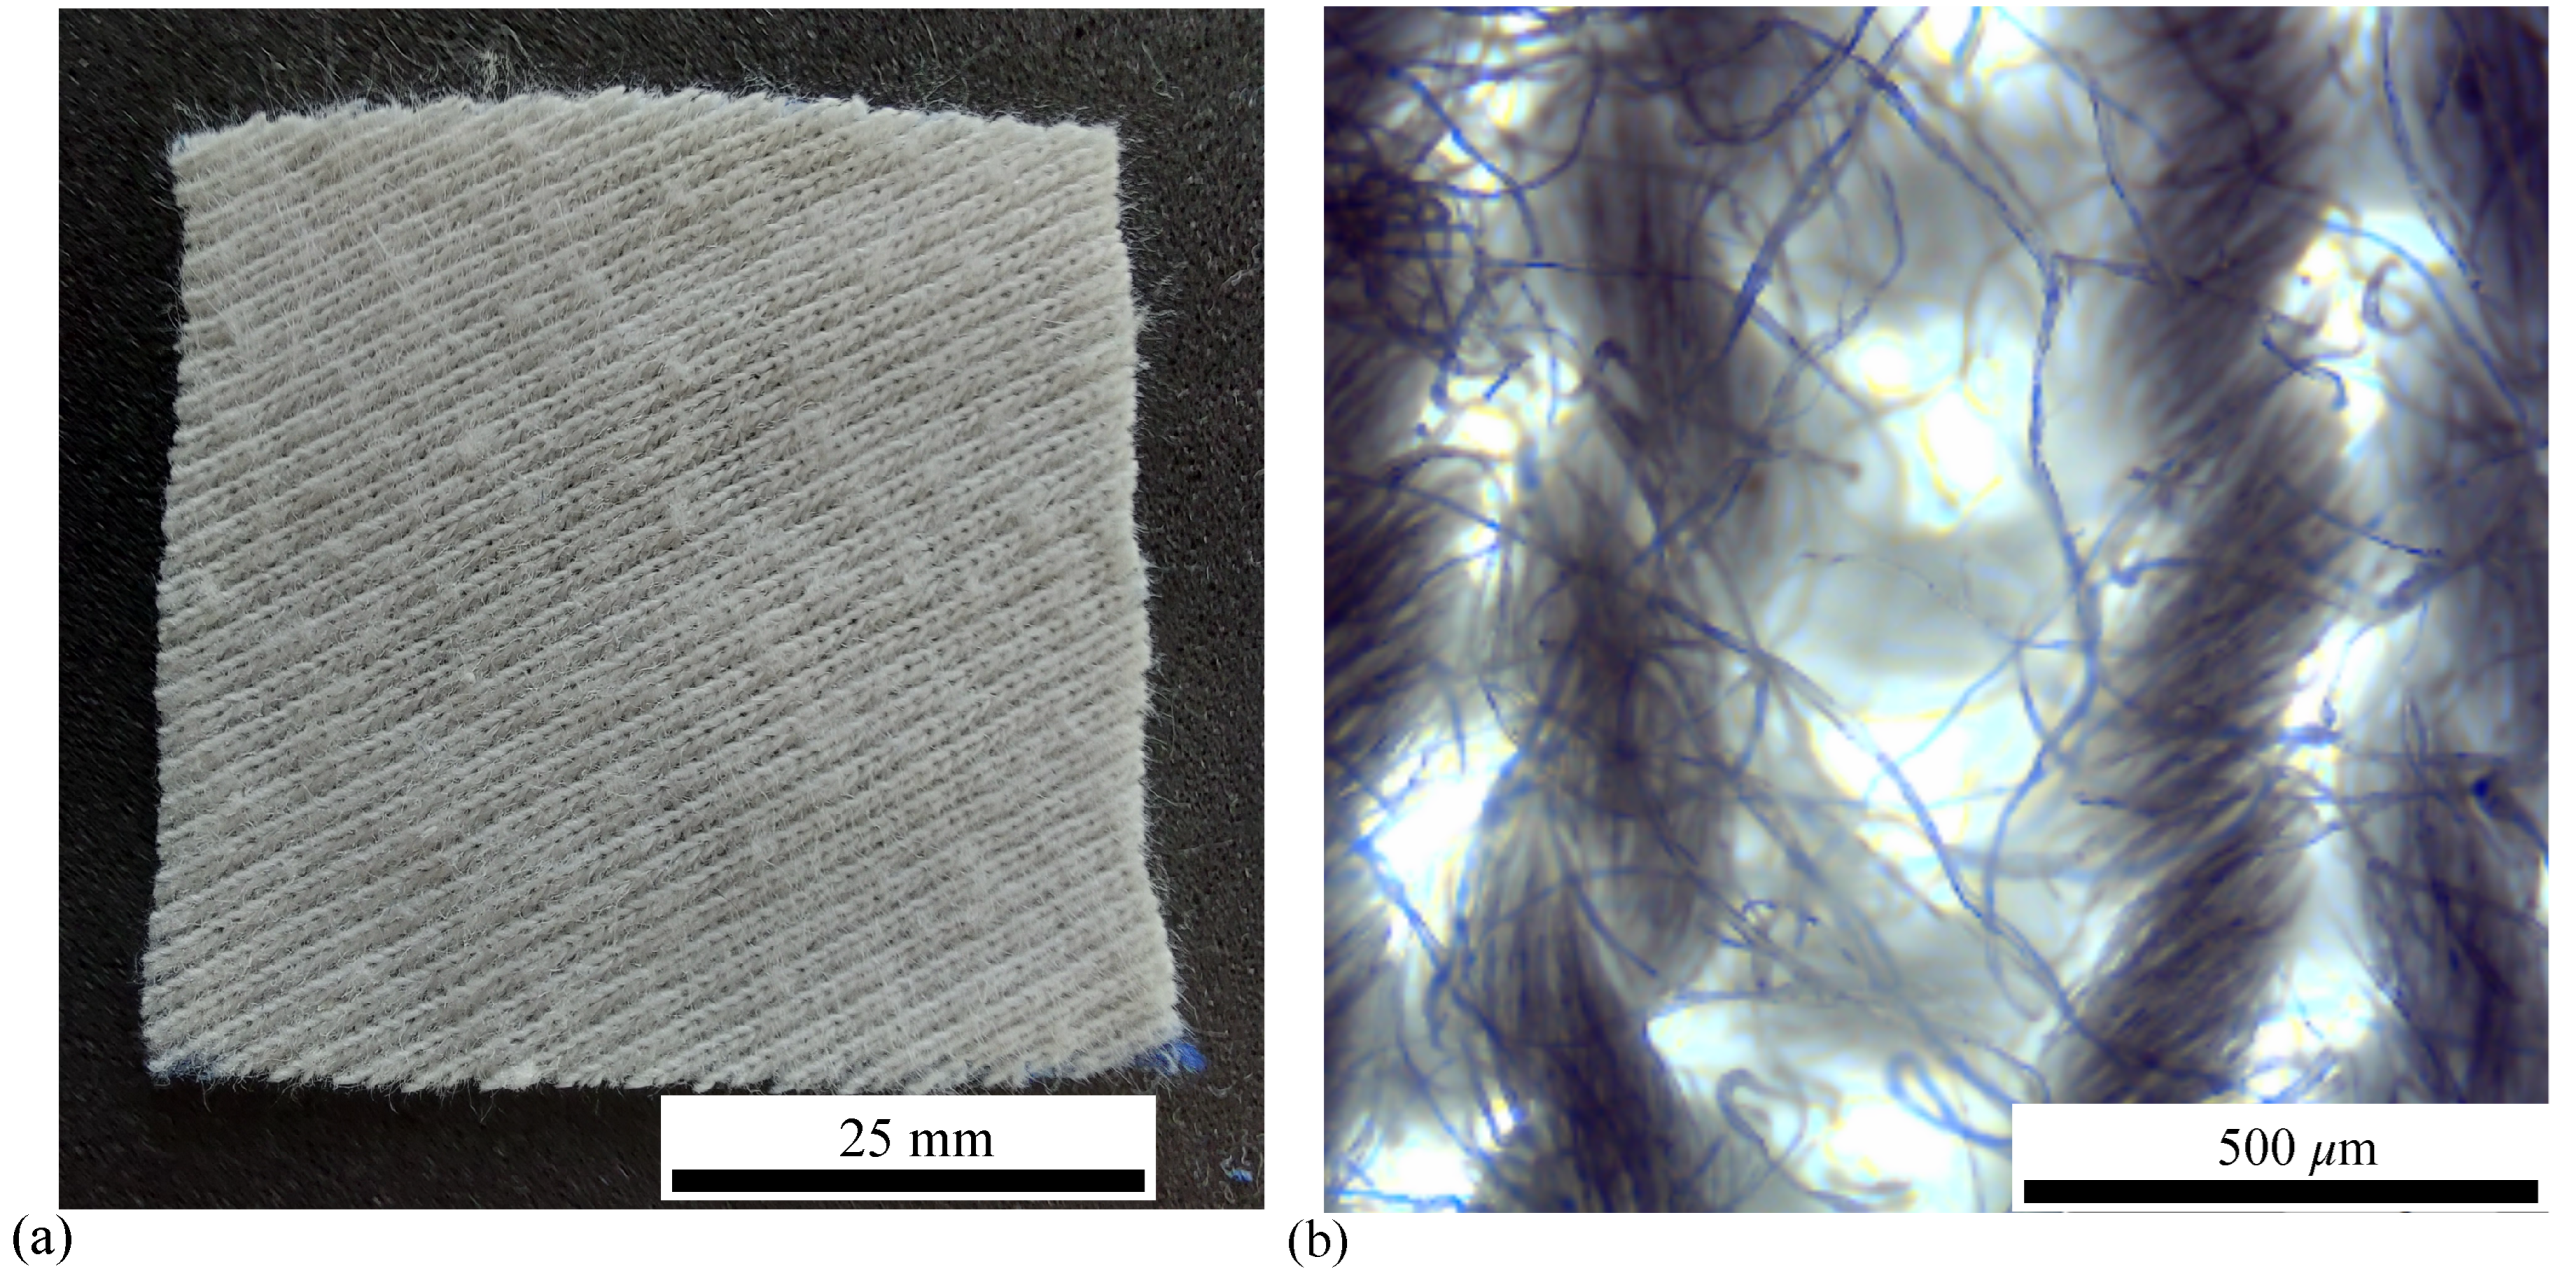
Figure 2.
Photographs of PSO (a) and CIMs (b). Each of them is placed in a Petri dish.
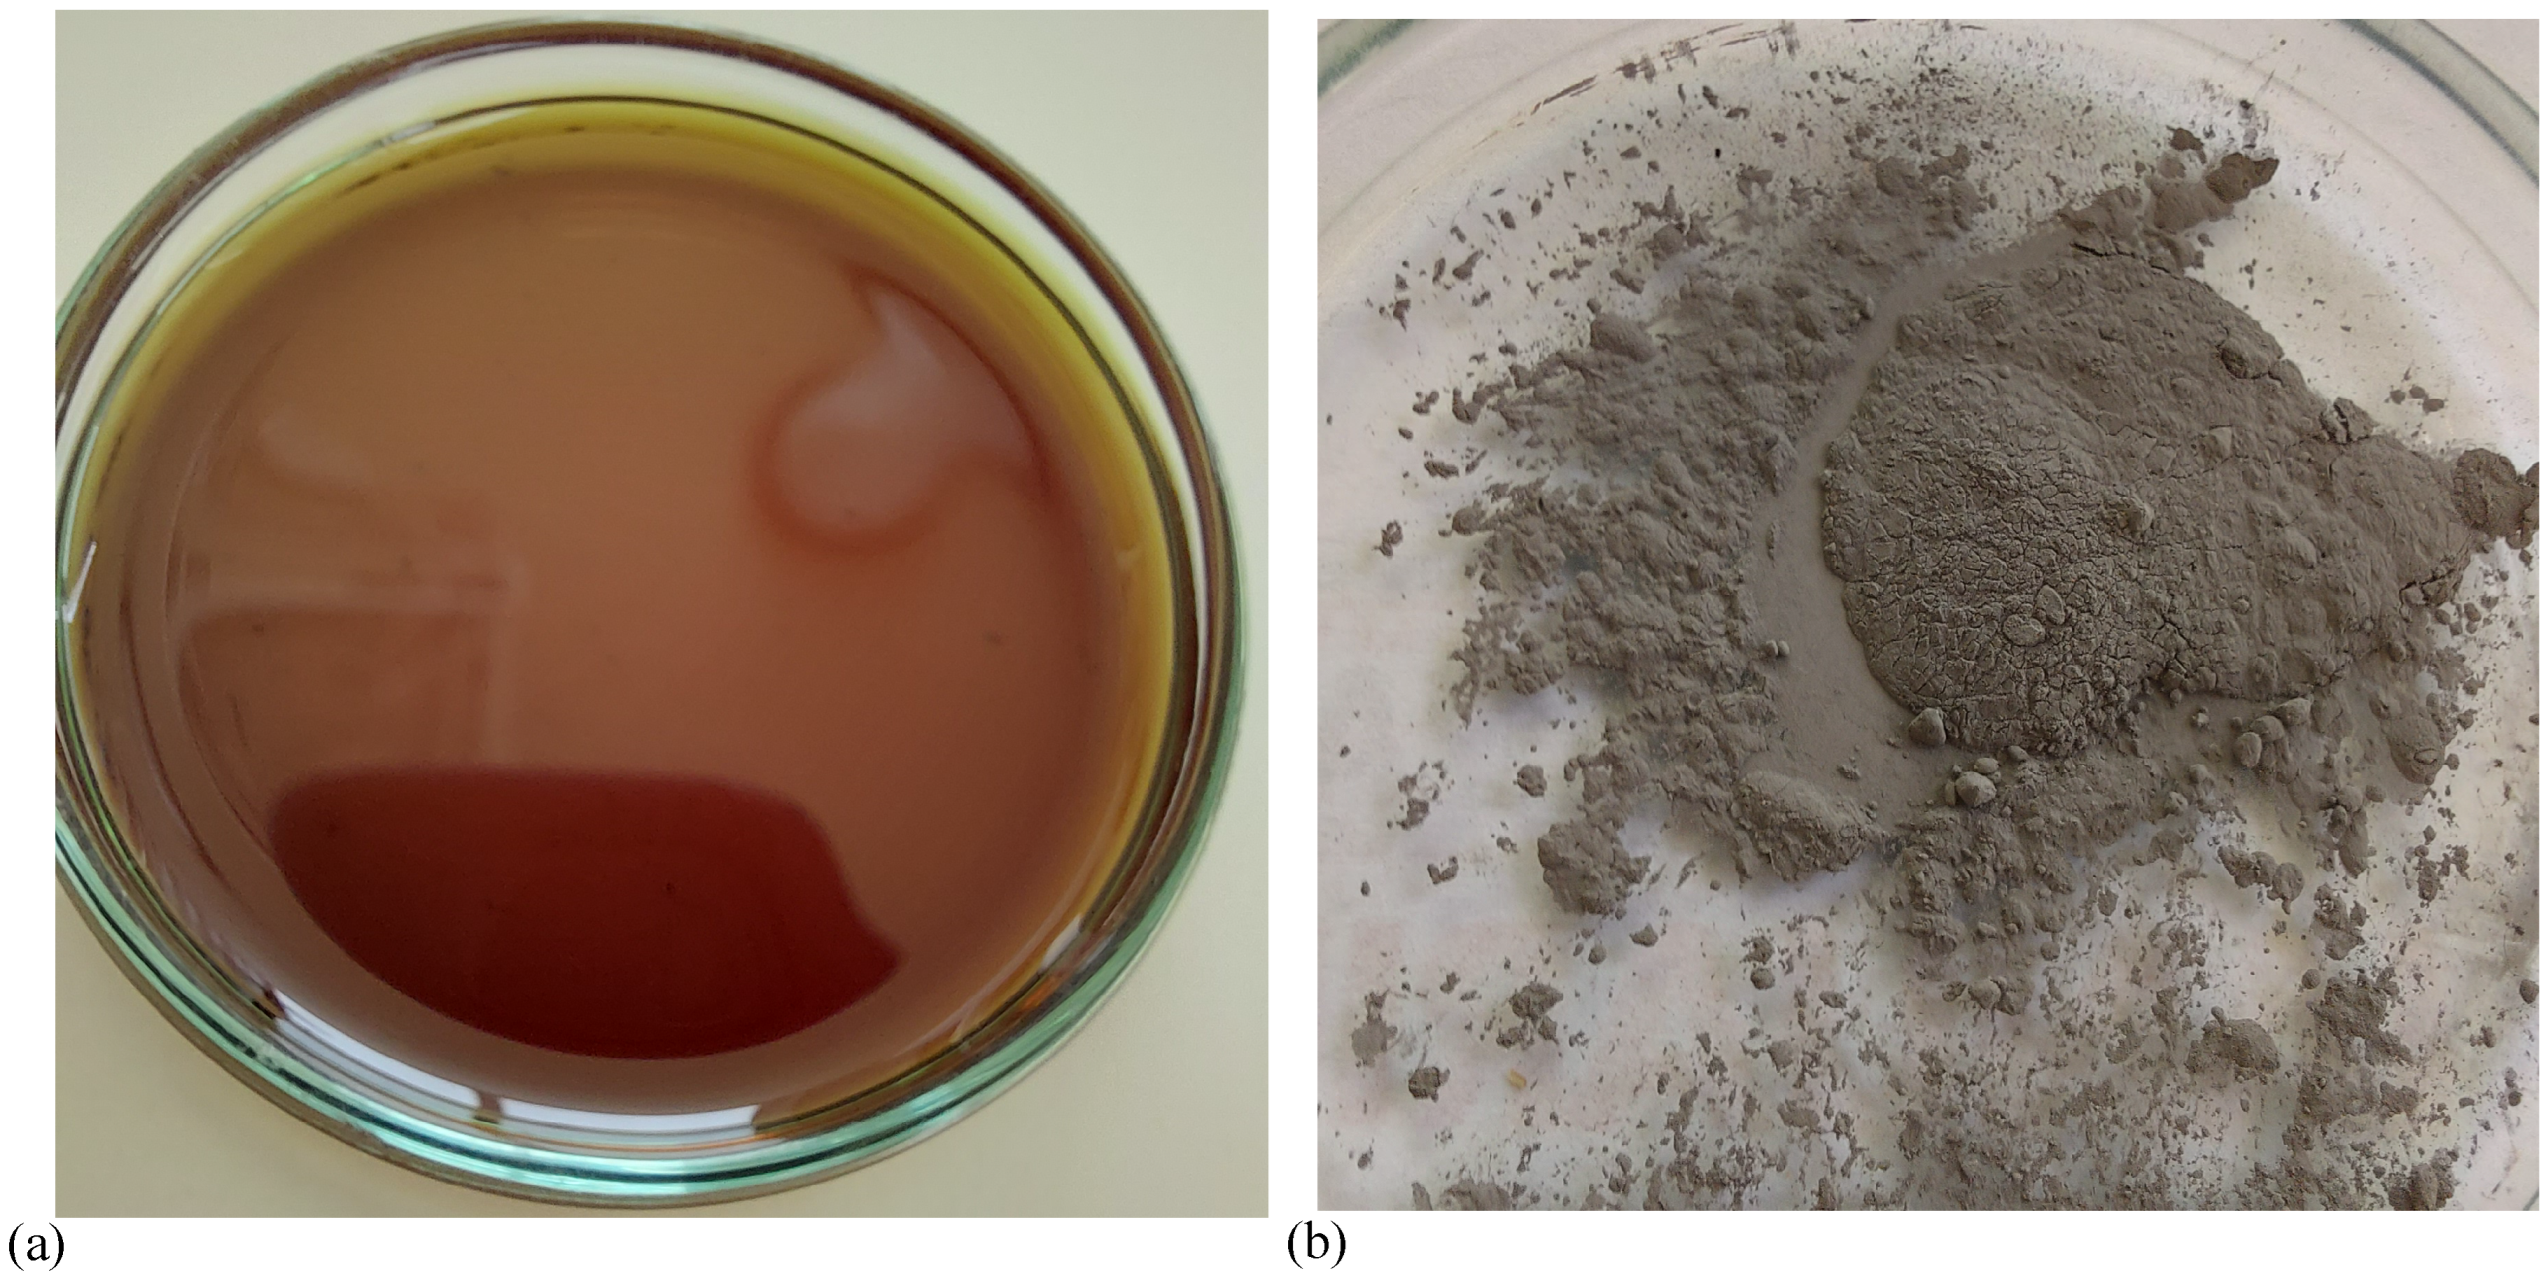
Figure 3.
PMs. (a) Photograph at actual size (1:1 scale). (b) Microscopic view.
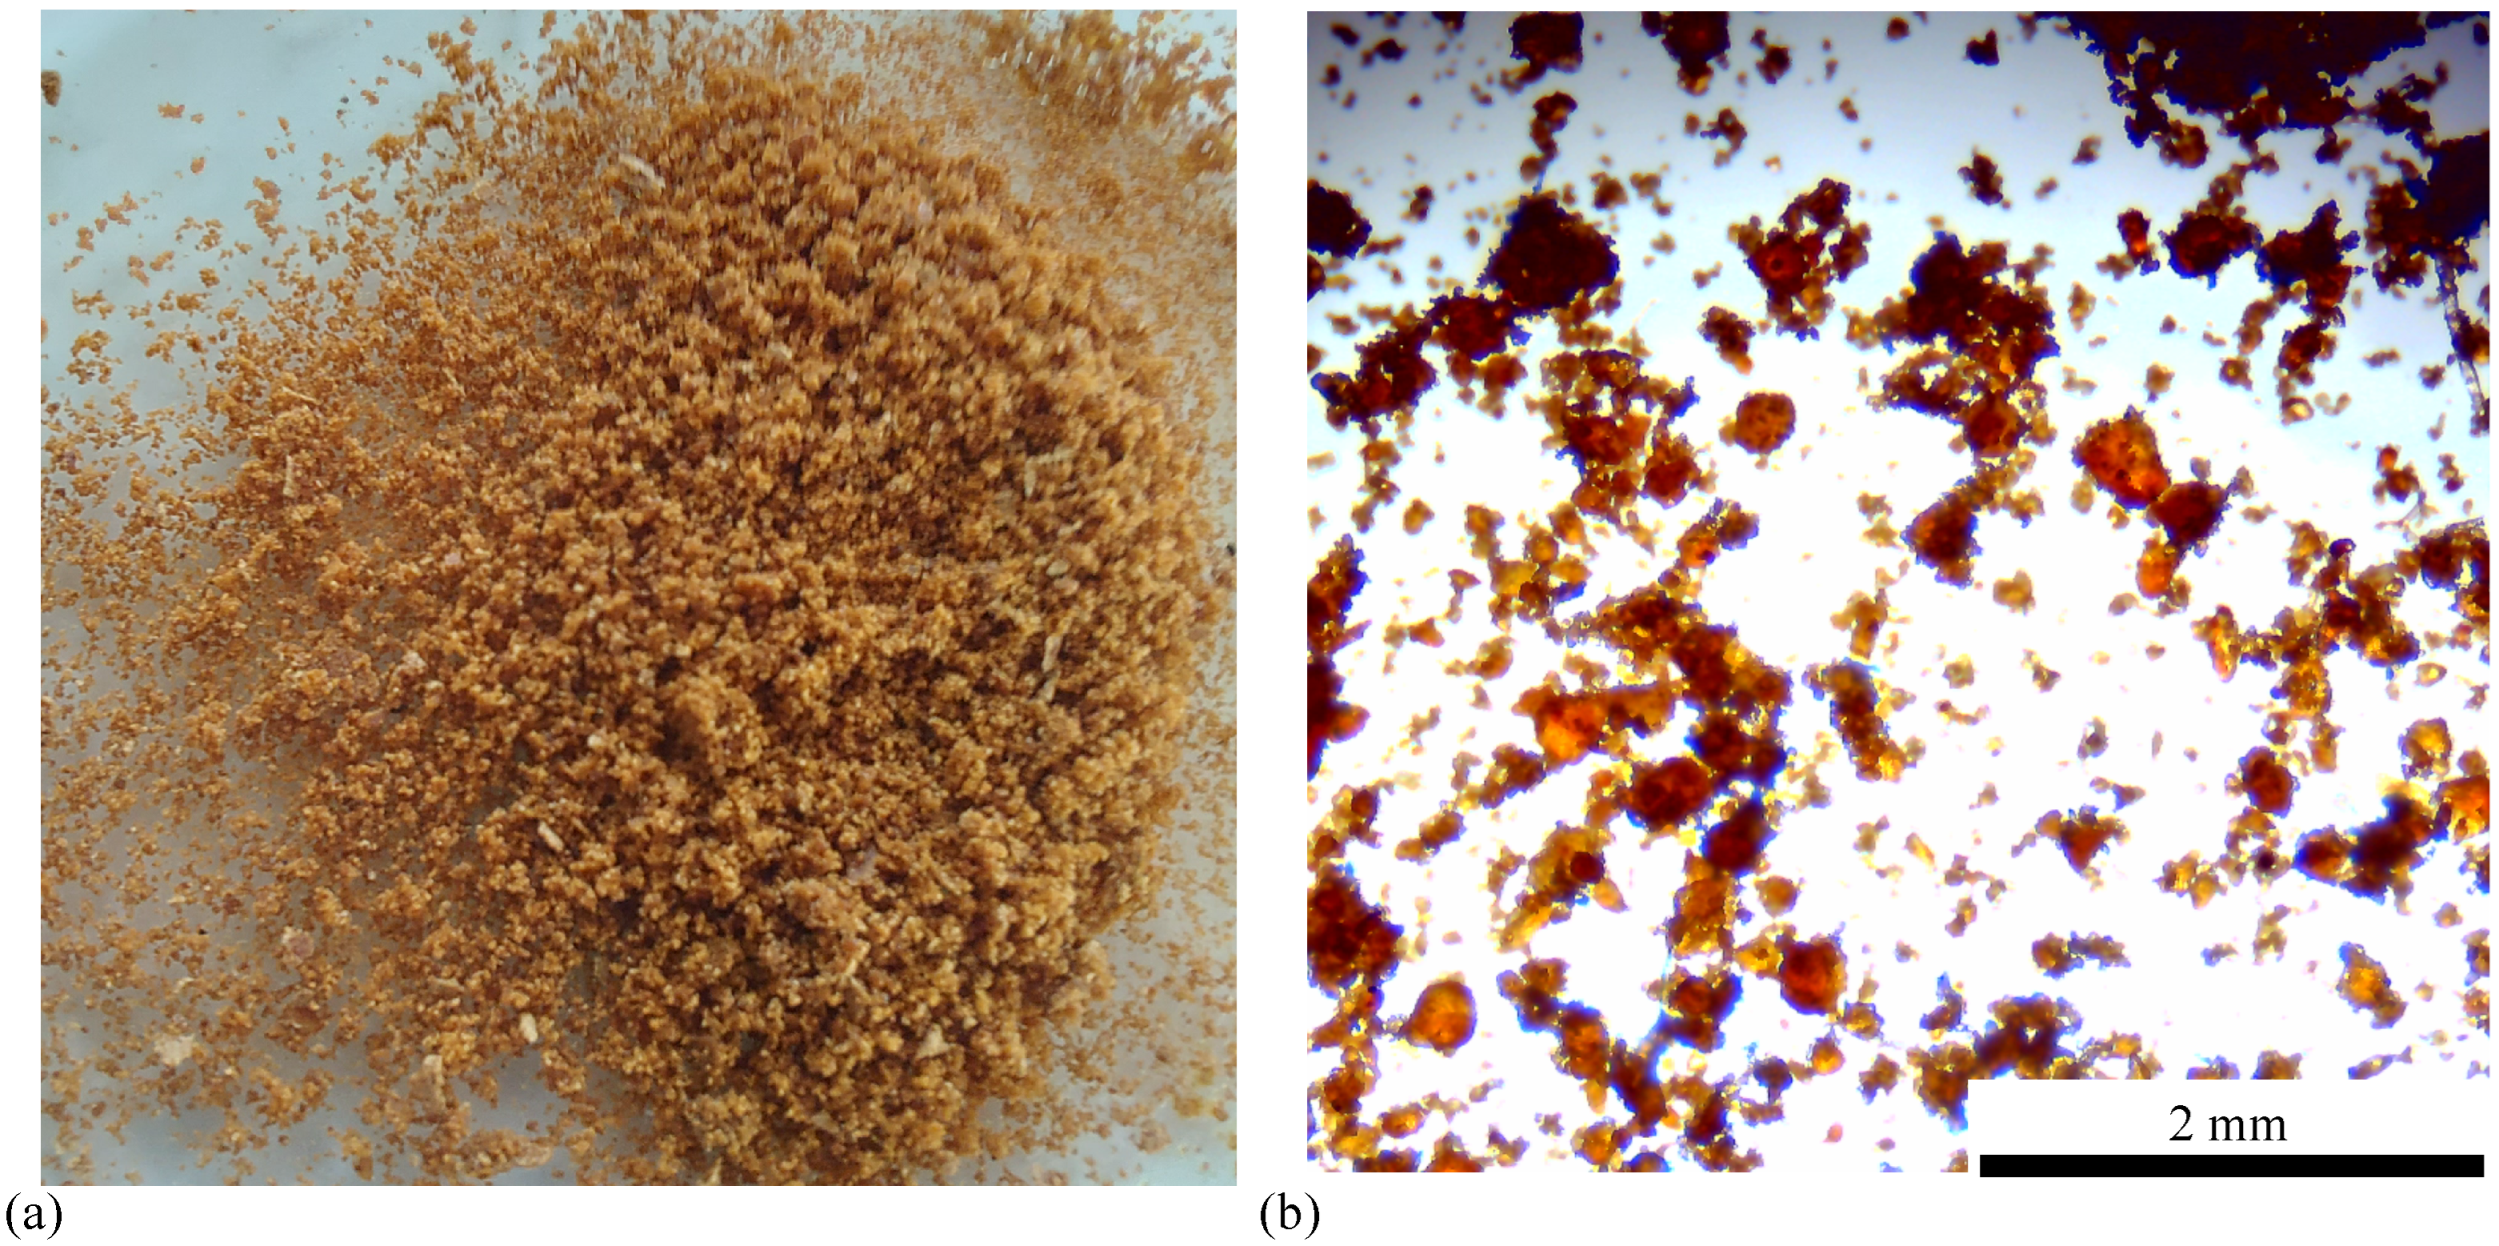
Figure 5.
Photographs of PSO + PMs (a), and PSO + PMs + CIMs (b; i.e. MRSi, with ).
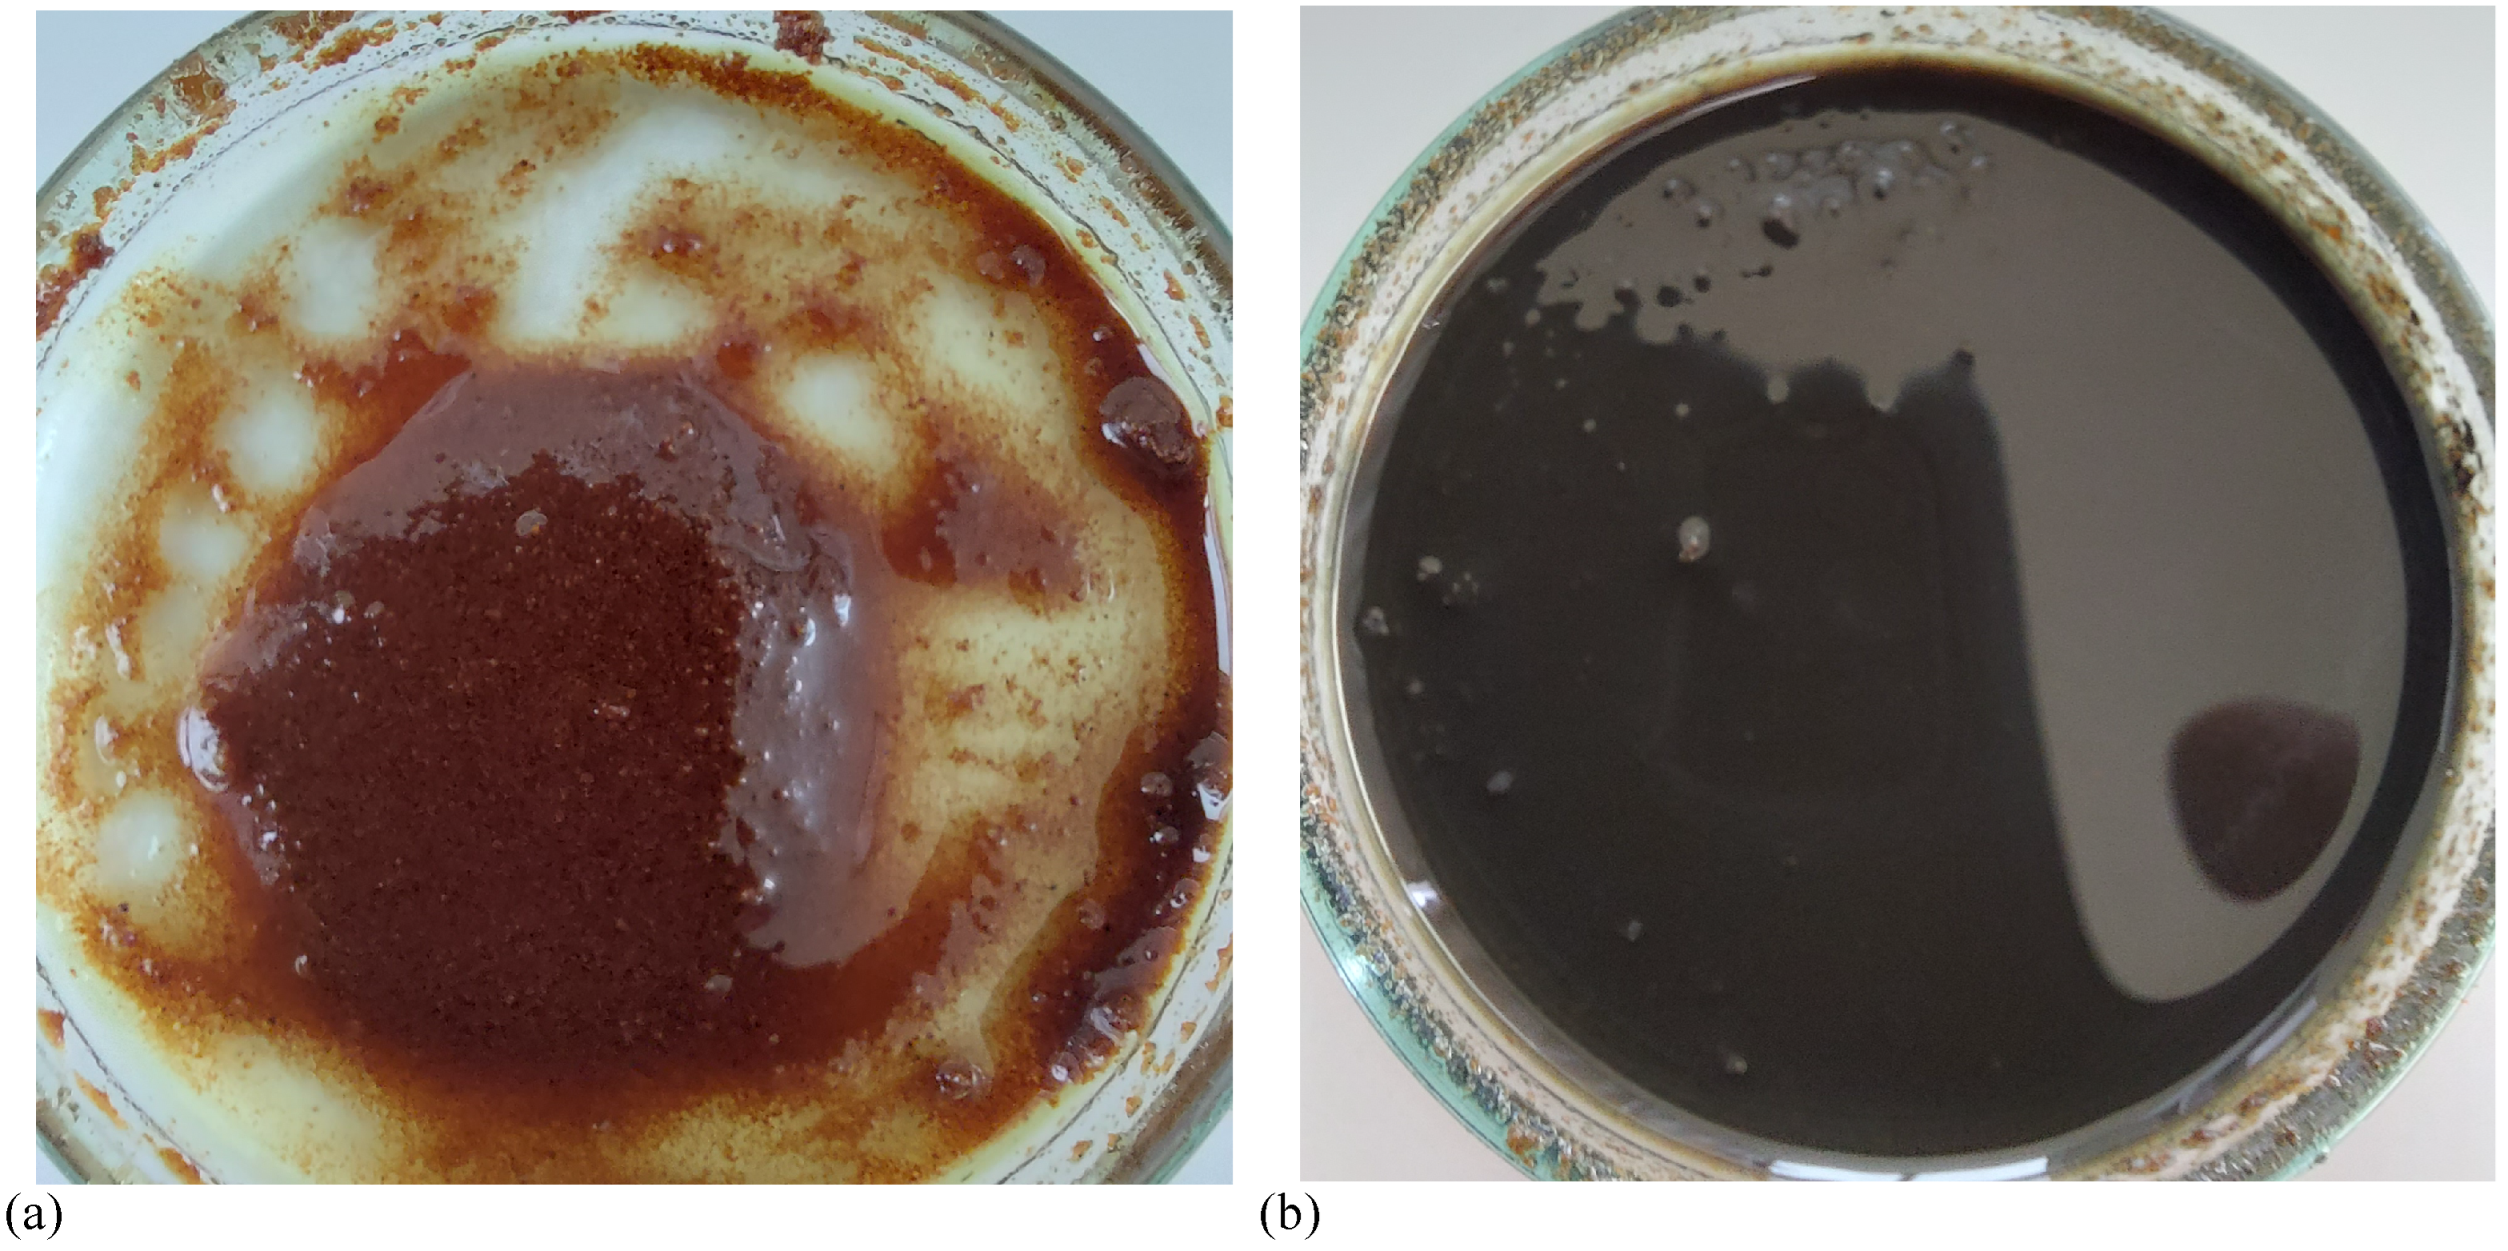
Figure 6.
Relative magnetization as a function of magnetic field intensity for MRSs (a), and STs (b).
Figure 6.
Relative magnetization as a function of magnetic field intensity for MRSs (a), and STs (b).
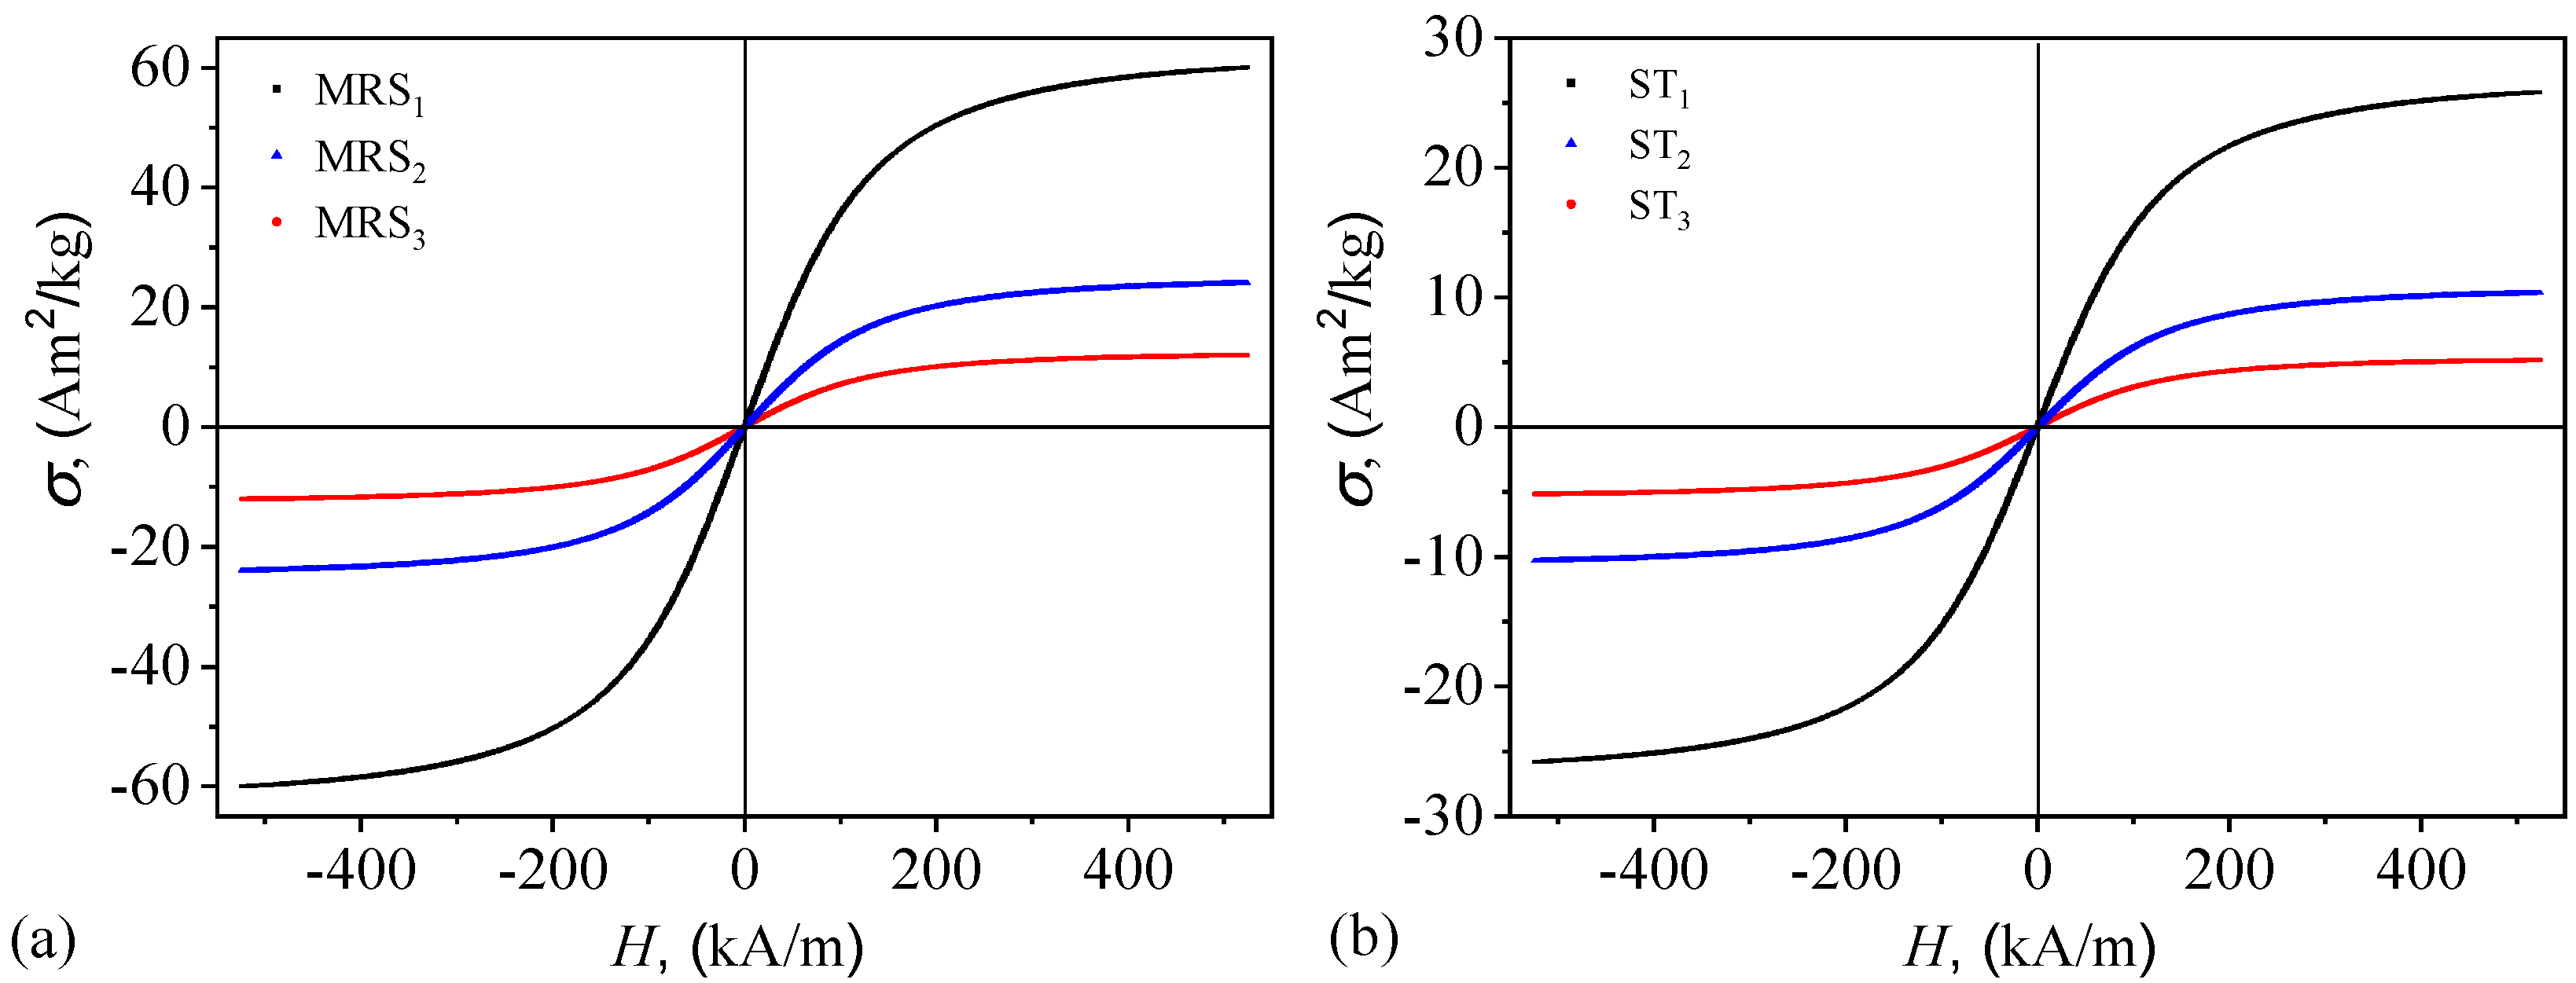
Figure 7.
Structural properties of MRSs. (a) Without a magnetic field. (b) With a magnetic field. CIMs - black dots (organized in parallel chain-like structures in part b). PMs - yellow-orange. The direction of the magnetic field is indicated by the magenta arrow.
Figure 7.
Structural properties of MRSs. (a) Without a magnetic field. (b) With a magnetic field. CIMs - black dots (organized in parallel chain-like structures in part b). PMs - yellow-orange. The direction of the magnetic field is indicated by the magenta arrow.

Figure 8.
Structural properties of medical dressings STs. (a) Photograph at actual size (1:1 scale). (b) Microscopic view.
Figure 8.
Structural properties of medical dressings STs. (a) Photograph at actual size (1:1 scale). (b) Microscopic view.
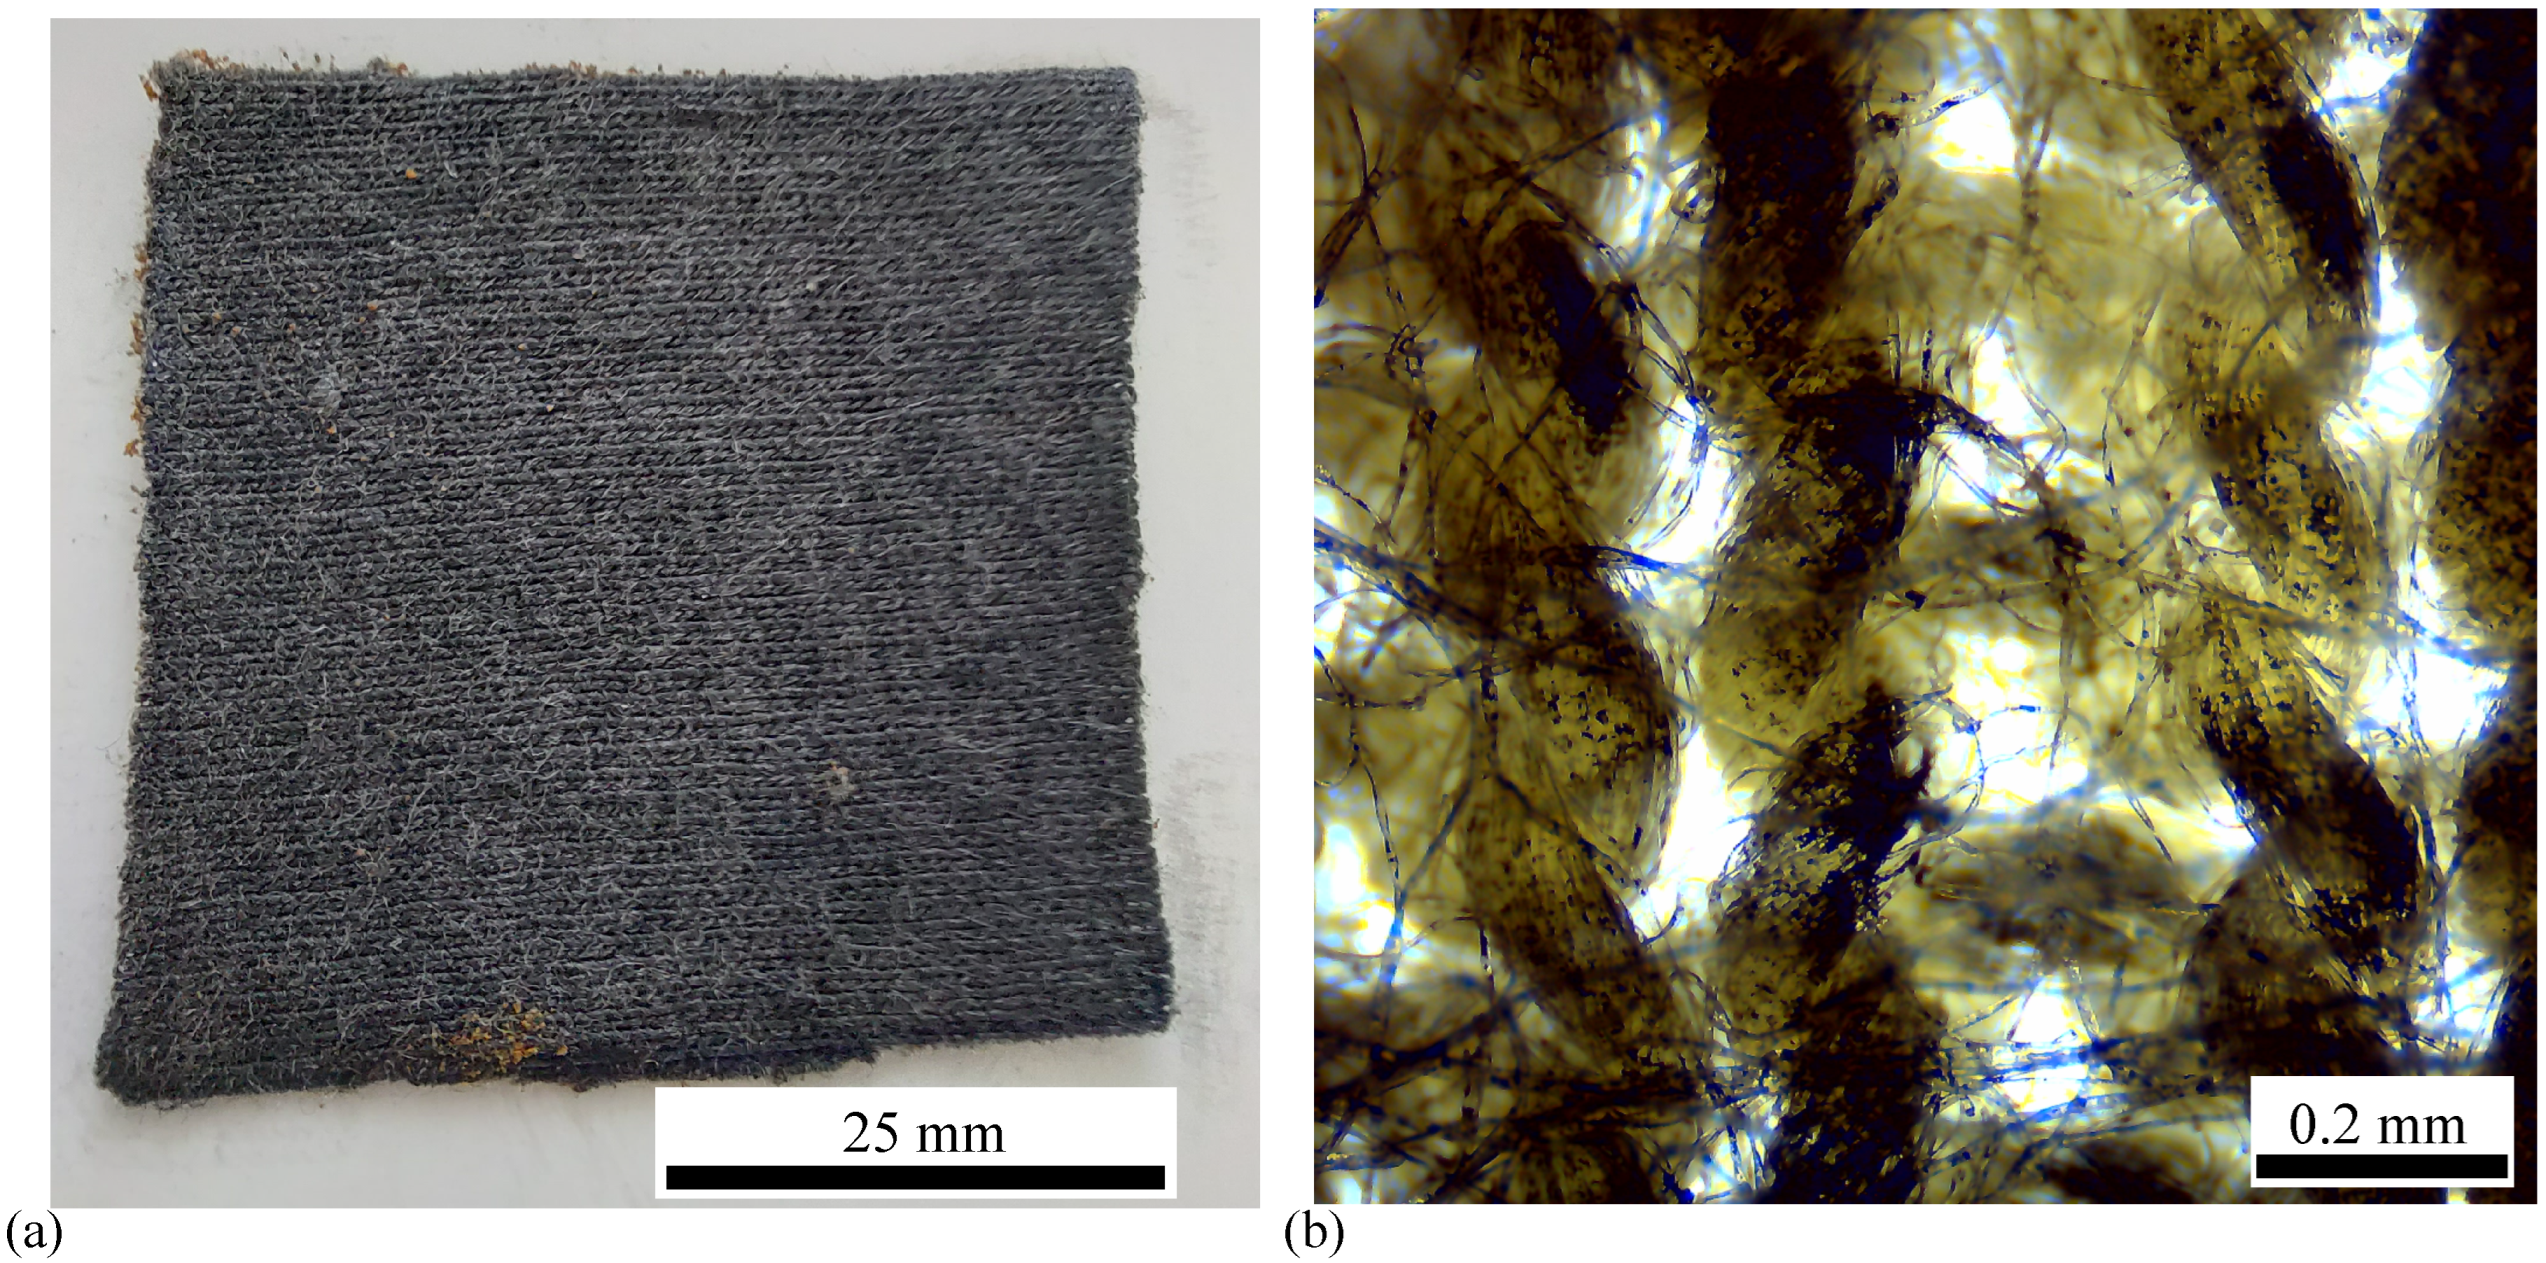
Figure 9.
Photograph at actual size (1:1 scale) of the textolite board soldered with lead alloy (a), and the capacitor (b).
Figure 9.
Photograph at actual size (1:1 scale) of the textolite board soldered with lead alloy (a), and the capacitor (b).
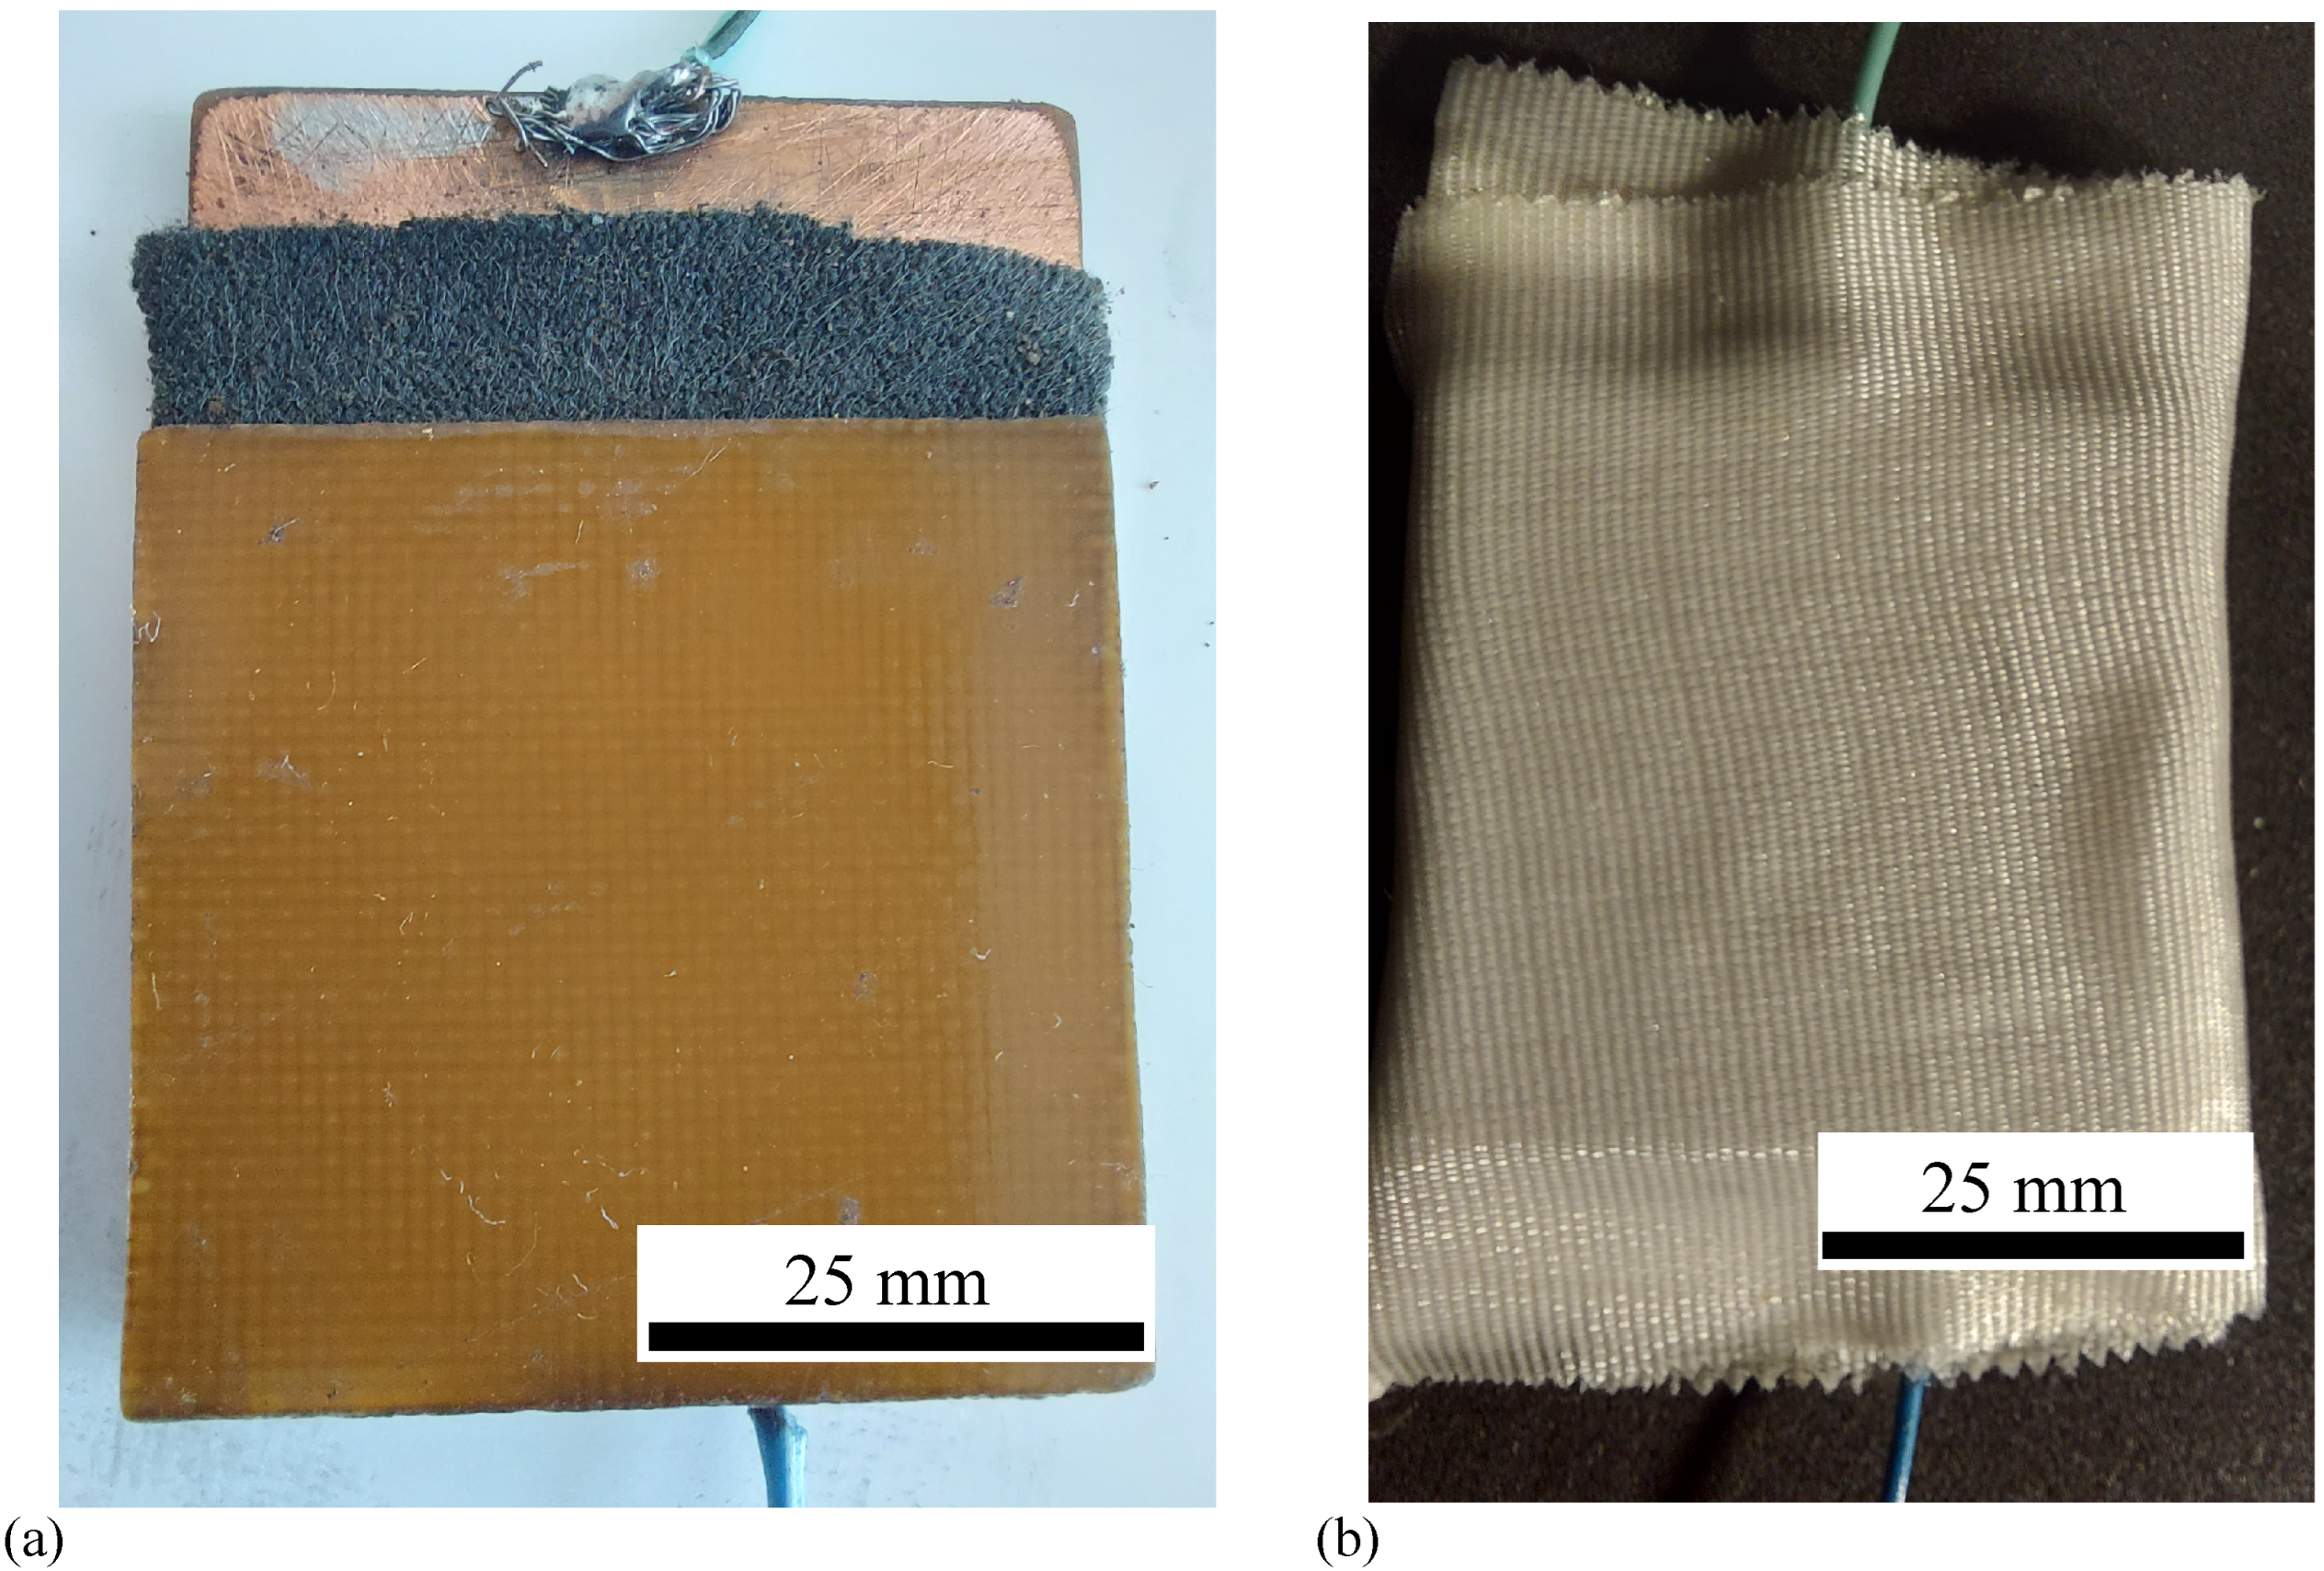
Figure 10.
Schematic representation of the experimental setup used to study the dielectric properties of STs: 1 - coil, 2 - magnetic yoke, N and S - magnetic poles, DCS - direct current source; FC - flat capacitor; Br - impedance meter; h - Hall probe; Gs - gaussmeter; Oz - coordinate axis, B - magnetic flux density vector. I - intensity of electric current through the coils of electromagnet.

Figure 11.
(Upper row) Variation of capacitance C with magnetic flux density B at fixed values of electric field frequency f for ST1 (a), ST2 (b), and ST3 (c). (Lower row) Variation of relative dielectric permittivity with magnetic flux density B at fixed values of electric field frequency f for ST1 (d), ST2 (e), and ST3 (f).
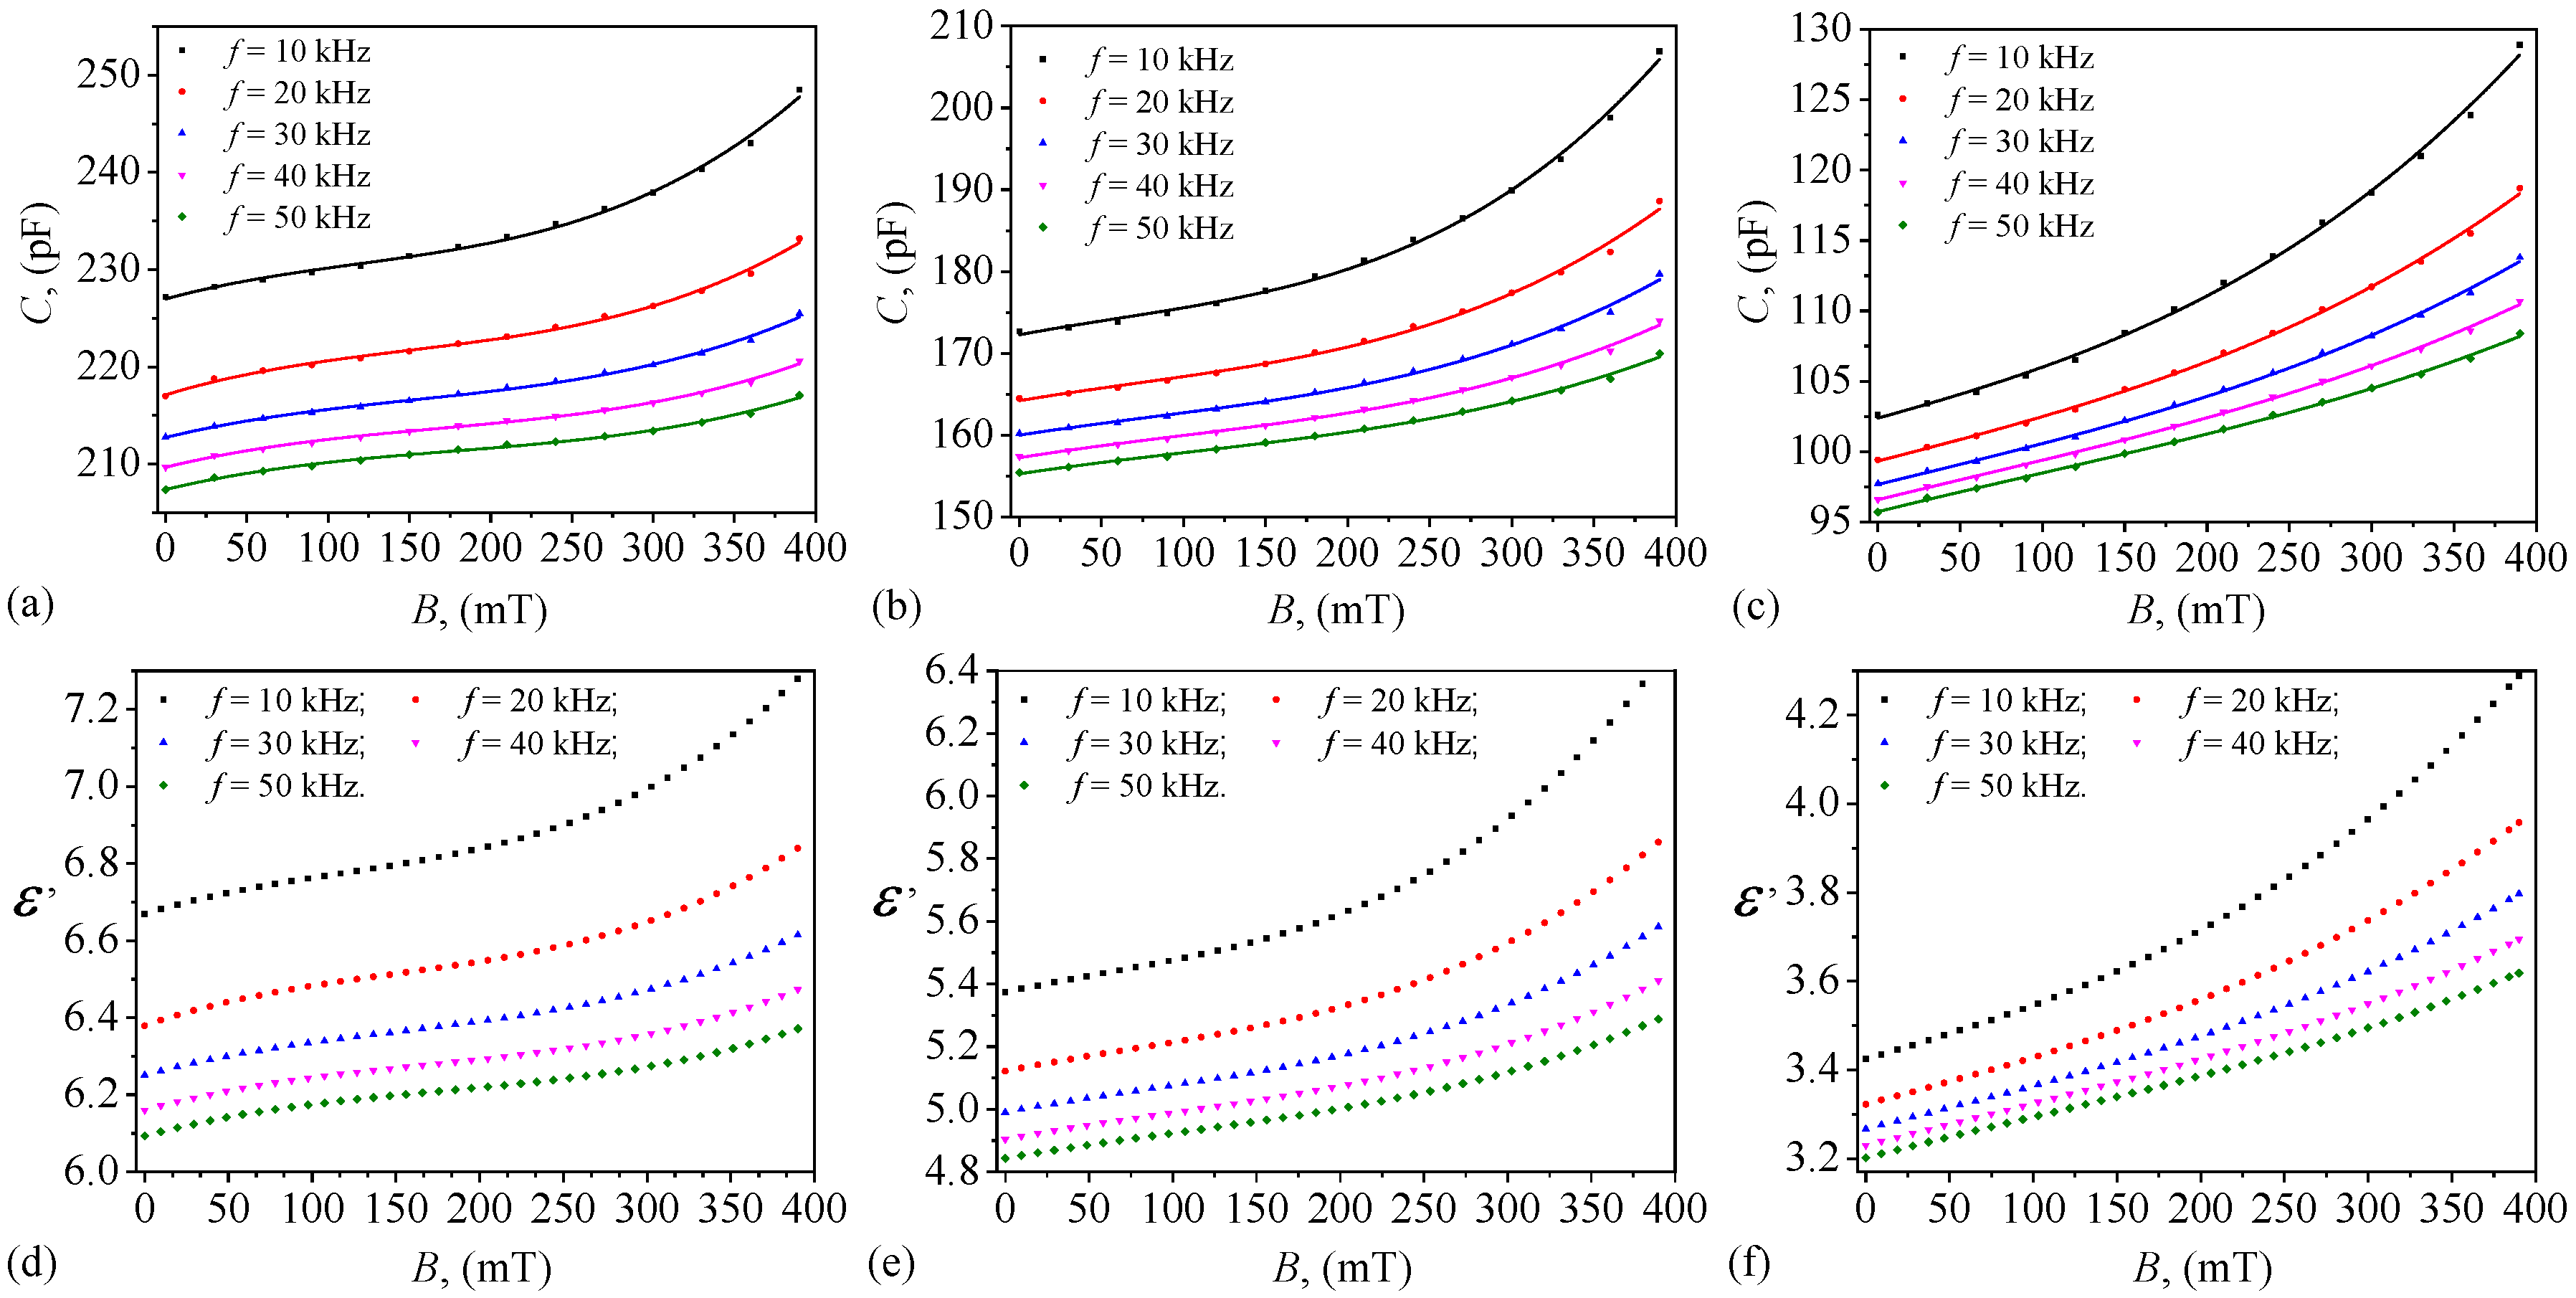
Figure 12.
Variation of loss tangent D with magnetic flux density B at fixed values of electric field frequency f for ST1(a), ST2 (b), and ST3 (c).
Figure 12.
Variation of loss tangent D with magnetic flux density B at fixed values of electric field frequency f for ST1(a), ST2 (b), and ST3 (c).
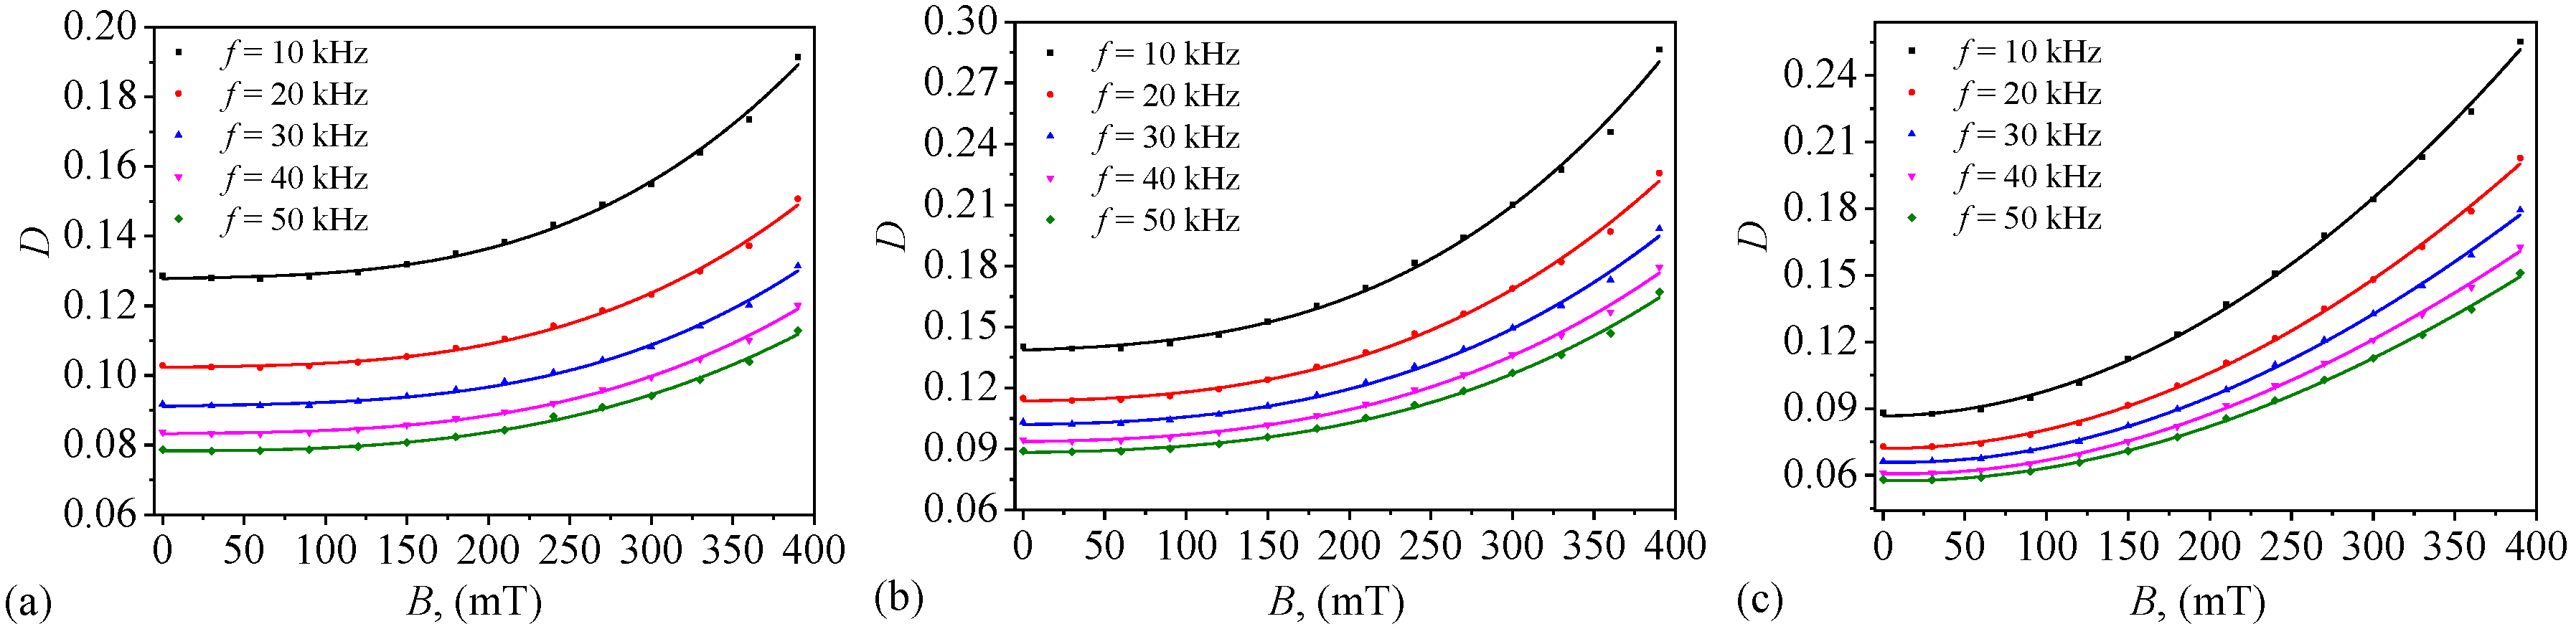
Figure 13.
Variation of resistance R with magnetic flux density B at fixed values of electric field frequency f for ST1 (a), ST2 (b), and ST3 (c).
Figure 13.
Variation of resistance R with magnetic flux density B at fixed values of electric field frequency f for ST1 (a), ST2 (b), and ST3 (c).
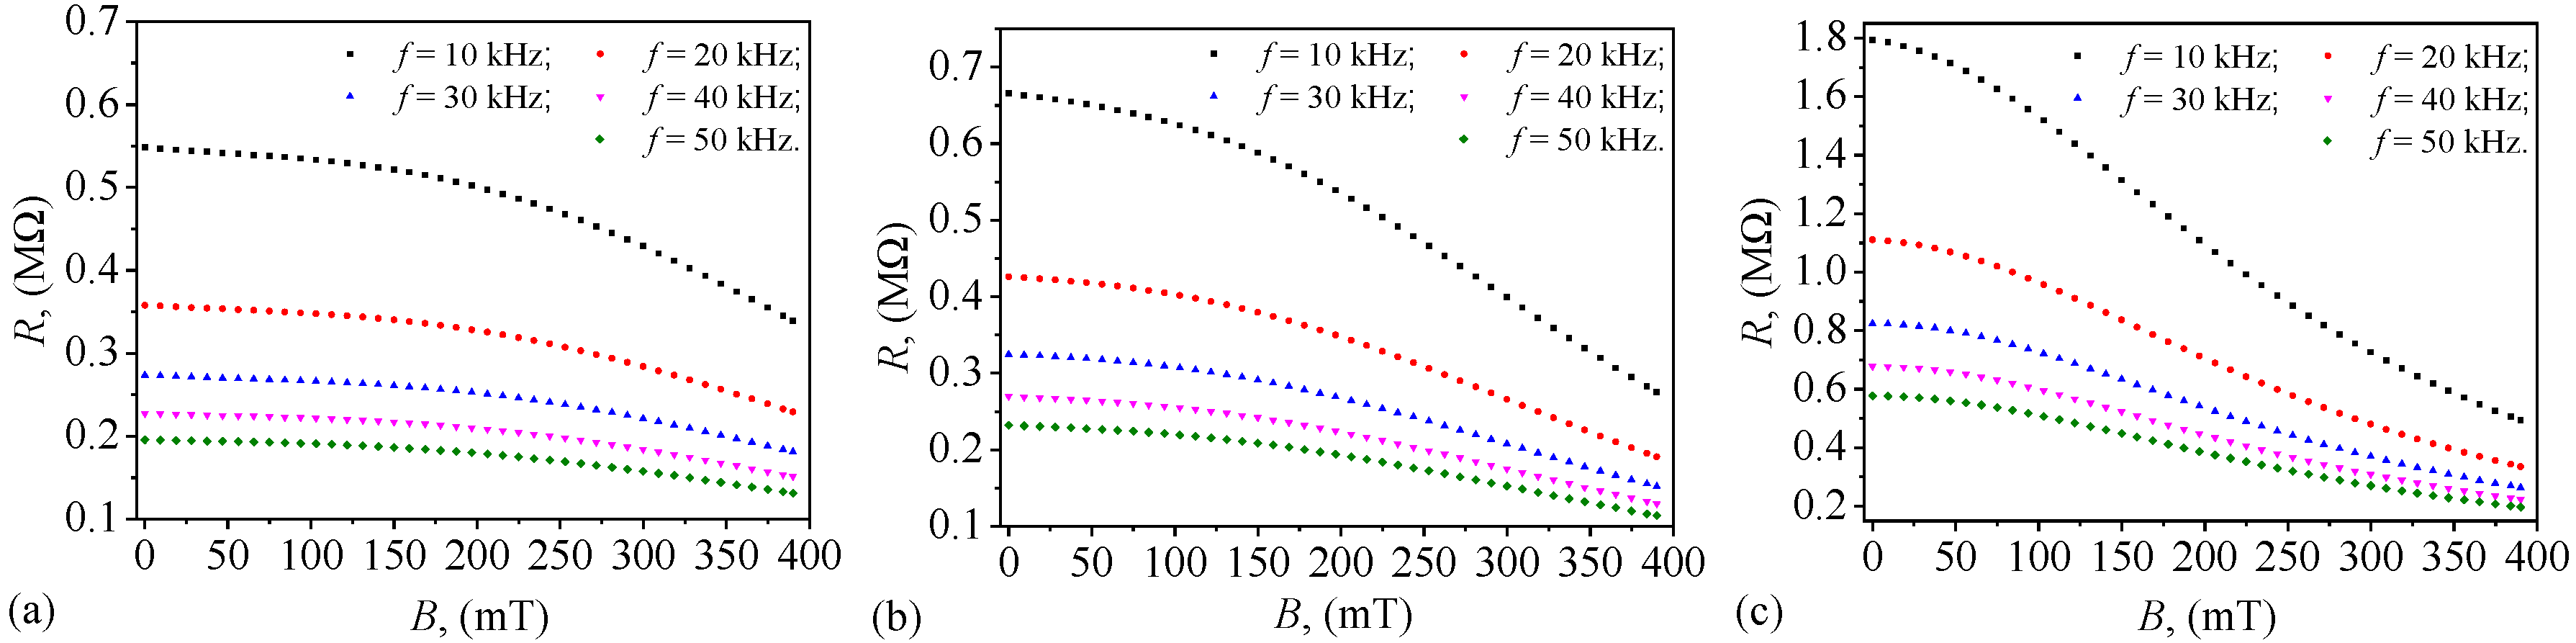
Figure 14.
Variation of dielectric loss with magnetic flux density B at fixed values of electric field frequency f for ST1 (a), ST2 (b), and ST3 (c).
Figure 14.
Variation of dielectric loss with magnetic flux density B at fixed values of electric field frequency f for ST1 (a), ST2 (b), and ST3 (c).
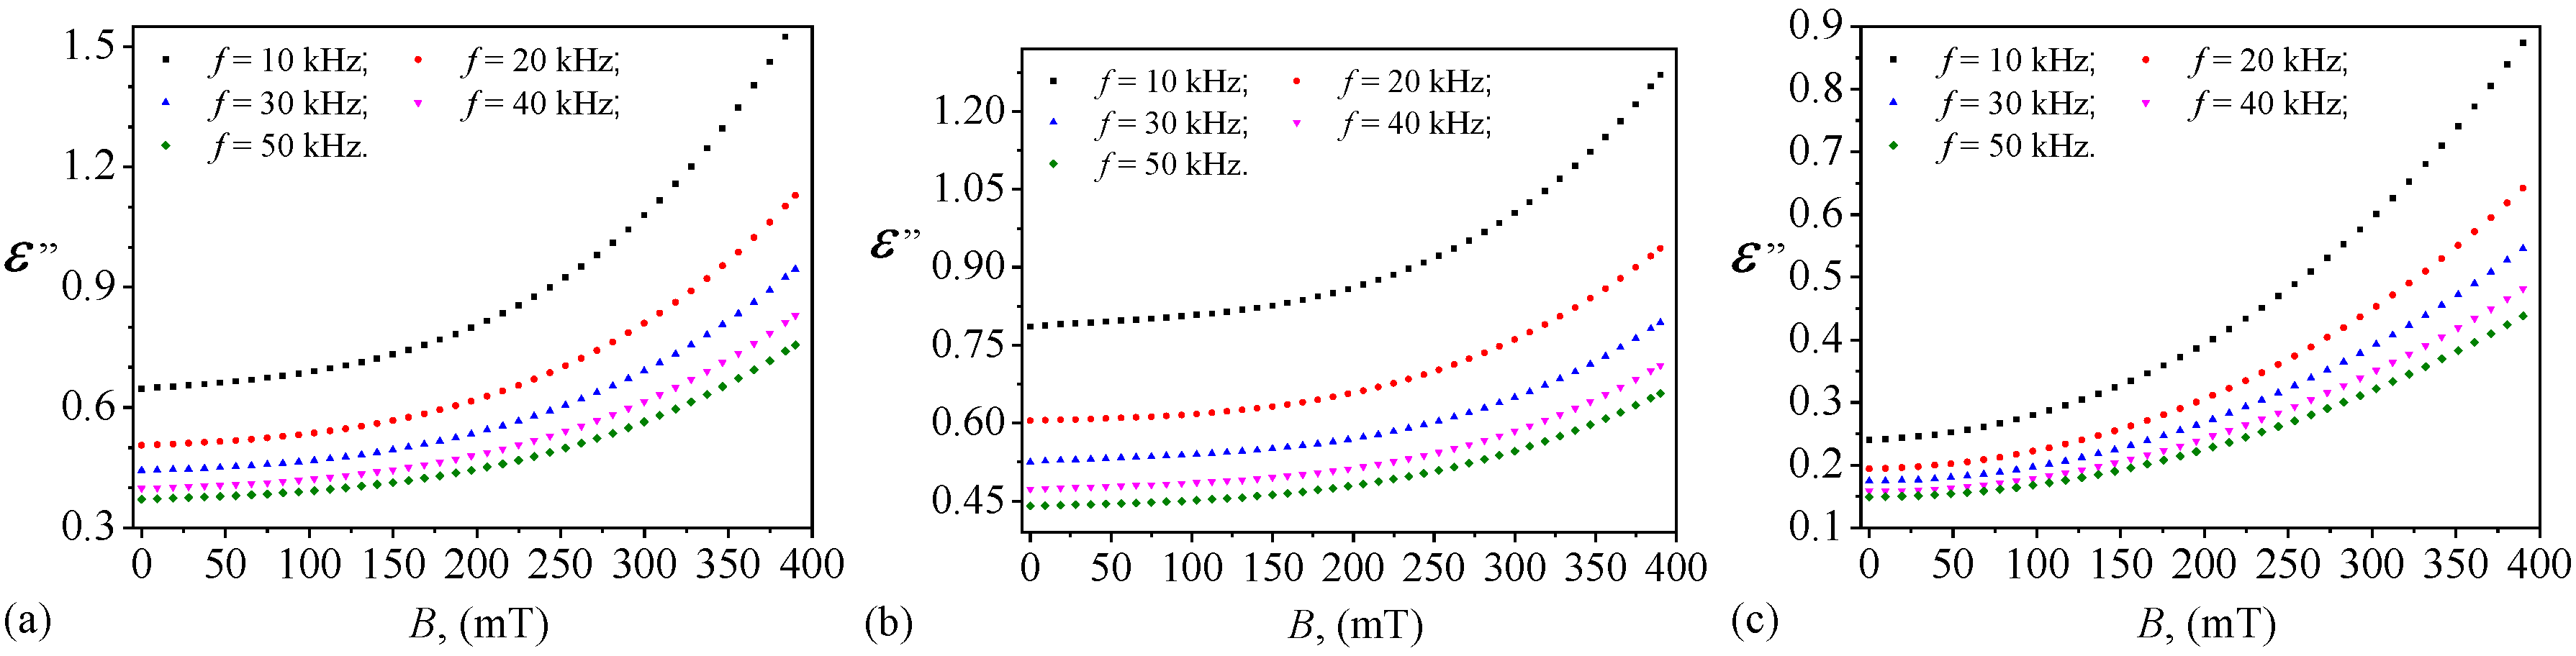

Table 1.
Volumes V and volume fractions of components CIMs, PSO and PMs in MRSi ().
| VCIMs (cm3) | VPSO (cm3) | VPMs (cm3) | (vol.%) | (vol.%) | (vol.%) | |
|---|---|---|---|---|---|---|
| MRS1 | 1.50 | 3.50 | 0.00 | 30.00 | 70.00 | 0.00 |
| MRS2 | 1.50 | 2.50 | 1.00 | 30.00 | 50.00 | 20.00 |
| MRS3 | 1.50 | 1.50 | 2.00 | 30.00 | 30.00 | 40.00 |
Table 2.
Volumes V and volume fractions of components CF, CIMs, PSO and PMs in medical dressings STi ().
Table 2.
Volumes V and volume fractions of components CF, CIMs, PSO and PMs in medical dressings STi ().
| VCF (cm3) | VCIMs (cm3) | VPSO (cm3) | VPMs (cm3) | (vol.%) | (vol.%) | (vol.%) | (vol.%) | |
|---|---|---|---|---|---|---|---|---|
| ST1 | 1.50 | 0.60 | 1.40 | 0.00 | 43.00 | 17.00 | 40.00 | 0.00 |
| ST2 | 1.50 | 0.60 | 1.00 | 0.40 | 43.00 | 17.00 | 29.00 | 11.00 |
| ST3 | 1.50 | 0.60 | 0.60 | 0.80 | 43.00 | 17.00 | 17.00 | 23.00 |
Disclaimer/Publisher’s Note: The statements, opinions and data contained in all publications are solely those of the individual author(s) and contributor(s) and not of MDPI and/or the editor(s). MDPI and/or the editor(s) disclaim responsibility for any injury to people or property resulting from any ideas, methods, instructions or products referred to in the content. |
© 2025 by the authors. Licensee MDPI, Basel, Switzerland. This article is an open access article distributed under the terms and conditions of the Creative Commons Attribution (CC BY) license (http://creativecommons.org/licenses/by/4.0/).
Copyright: This open access article is published under a Creative Commons CC BY 4.0 license, which permit the free download, distribution, and reuse, provided that the author and preprint are cited in any reuse.


