Submitted:
12 March 2025
Posted:
20 March 2025
You are already at the latest version
Abstract
Nickel (Ni), a heavy metal with extensive industrial applications, poses significant ecological impacts and health risks due to its persistence and bioaccumulation. Although toxicological data in mammals and plants are well-established, its effects on invertebrate models remain insufficiently explored. This study systematically evaluated the multi-dimensional toxicity of nickel on Caenorhabditis elegans, integrating phenotypic assays with transcriptomic profiling to assess impacts on growth, reproduction, neuromuscular function, lifespan, and aging. Chronic nickel exposure [1] induced dose-dependent developmental delays, with 80 μg/L causing a 3.8-fold increase in larval arrest (p < 0.0001). Reproductive capacity declined significantly at ≥8 μg/L, accompanied by impaired pharyngeal pumping rates, indicative of neuromuscular dysfunction. Lifespan analysis revealed non-monotonic mortality patterns, with paradoxical longevity observed at 80 μg/L, potentially linked to hormetic stress responses. Transcriptomic analysis identified 2,235 differentially expressed genes (DEGs) at 8 μg/L, enriched in xenobiotic metabolism, oxidative stress, and dysregulated Wnt/TGF-β signaling. GO and KEGG analyses highlighted collagen metabolism defects, calcium signaling disruption, and lysosomal dysfunction, correlating with cuticle integrity loss, feeding inefficiency, and lipofuscin accumulation. This study provides critical insights into the ecological risks of nickel pollution.
Keywords:
nickel toxicity
; Caenorhabditis elegans
; developmental arrest
; transcriptomics
; oxidative stress
1. Introduction
Nickel (Ni), a transition metal with significant industrial value, was first isolated by Swedish chemist Torbern Bergman in 1775. Its applications have expanded rapidly due to its exceptional corrosion resistance, oxidation stability, and high-temperature performance. Nickel serves as a core component in stainless steel (accounting for 74% of global nickel consumption) and alloy steel, and is widely utilized in electroplating, batteries (e.g., electric vehicle batteries), aerospace, and military industries [2]. In 2021, global primary nickel consumption reached 2.76 million tons, with China, as the largest consumer, dedicating 74% of its nickel usage to stainless steel production [3]. The escalating industrial demand has led to substantial environmental nickel accumulation, with soil concentrations in industrialized regions frequently exceeding 30 mg/kg , posing chronic risks to soil-dwelling organisms. However, the rapid growth of the nickel industry has led to substantial environmental release. Nickel and its compounds are emitted during mining, smelting, fossil fuel combustion, and electroplating processes. Notably, nickel carbonyl (Ni(CO)₄), a highly toxic carcinogen, can enter the human body via inhalation, causing acute poisoning [4]. While nickel carbonyl has been extensively studied, the toxicological profiles of other nickel species are still largely unknown.
Nickel’s persistence and bioaccumulation in ecosystems exacerbate ecological risks. According to China’s 2014 National Soil Pollution Survey Report, nickel contamination accounted for 4.8% of soil pollution incidents, ranking it among the top inorganic pollutants [5]. Nickel concentrations in various environmental compartments are regulated by national and international standards to mitigate ecological and human health risks. In drinking water, the World Health Organization (WHO) recommends a guideline value of 0.07 mg/L for nickel [6], For food safety, China’s National Food Safety Standard for Contaminants in Foods [7] specifies nickel limits, such as 1.0 mg/kg for cereals. In soil, China’s Soil Environmental Quality Standards [8] classifies agricultural land into two tiers: a risk screening value of 60 mg/kg (pH ≤ 7.5) and 190 mg/kg (pH > 7.5) for nickel, whereas construction land has a stricter limit of 30 mg/kg [8]. In industrial zones, China’s Integrated Wastewater Discharge Standard [9] mandates nickel emissions not exceeding 1.0 mg/L for direct discharge. In industrialized regions, nickel frequently accumulates in estuarine and freshwater sediments. Once introduced into soil, nickel resists microbial degradation or leaching, leading to long-term accumulation. This disrupts soil microbial communities, inhibits plant growth (e.g., the toxicity threshold for Ni in purple soil is 0.05 mol/L CaCl₂-extractable nickel for lettuce), and threatens human health through the food chain [10].
Nickel toxicity manifests through multi-target, multi-pathway mechanisms, primarily involving three aspects: Oxidative Stress and DNA Damage: Nickel generates reactive oxygen species (ROS) via the Fenton reaction [11], inducing lipid peroxidation, protein carbonylation, and DNA strand breaks, which trigger apoptosis or carcinogenesis [12]. For example, nickel refinery dust activates NF-κB expression in NIH/3T3 cells, promoting inflammatory cytokine secretion [13]. Activating caspase-3-dependent mitochondrial apoptosis [14]. In C. elegans, nickel induces neurodevelopmental toxicity, including cholinergic, dopaminergic, and GABAergic degeneration, behavioral alterations, and increased SKN-1 activity [15]. Nickel inhibits histone deacetylases (HDACs), altering chromatin structure and gene expression. Studies suggest nickel exposure may cause transgenerational toxicity by crossing the placental barrier, affecting offspring development [16]. Nickel severely damages reproductive systems. Animal studies reveal suppressed spermatogenesis, reduced ovarian reserve, and embryonic malformations. For instance, nickel ions reduce mitochondrial membrane potential and ATP synthesis in mouse hepatocytes, indicating energy metabolism disruption as a key mechanism [17]. While extensive studies have characterized nickel toxicity in mammals (e.g., hepatotoxicity and reproductive impairment) and plants (e.g., root growth inhibition), investigations in invertebrates remain fragmentary, predominantly focusing on acute exposure endpoints (e.g., mortality) at supra-environmental doses
Despite existing research on nickel’s toxicity, its specific effects on invertebrate reproductive and developmental systems remain unclear. Notably, C. elegans, a soil-dwelling nematode, serves as a critical bioindicator for ecotoxicological assessments due to its sensitivity to heavy metals at environmentally relevant concentrations (0.1–50 μg/L) . This study bridges the knowledge gap by systematically evaluating chronic nickel toxicity (0.8–80 μg/L) in C. elegans, integrating phenotypic assays with transcriptomic profiling to dissect conserved molecular pathways linking metabolic disruption to developmental arrest. Most studies focus on mammalian cells or plants, with limited attention to model organisms like C. elegans. This study systematically investigates nickel’s impacts on C. elegans growth, lifespan, muscular function, aging, and reproduction across multiple concentrations, combined with transcriptomic analysis to elucidate its toxic mechanisms. These findings provide critical insights into the long-term health risks posed by nickel pollution.
2. Materials and Methods
2.1. Experimental Reagents and Instruments
The reagents used in this study included nickel chloride hexahydrate for preparing nickel solutions. For the nematode growth medium (NGM).LB culture medium was prepared using tryptone and yeast extract. M9 buffer was formulated with potassium dihydrogen phosphate and disodium hydrogen phosphate dodecahydrate. The bleach solution (for synchronization) contained sodium hydroxide, sodium hypochlorite, and double-distilled water (ddH2O). Key instruments included a laminar flow cabinet, autoclave, electronic balance, stereomicroscope, constant-temperature shaker, biochemical incubator, fluorescence microscope, and microcentrifuge.
2.2. Cultivation of Caenorhabditis elegans
All nematodes were cultured on NGM solid medium, composed of 3 g/L NaCl, 2.5 g/L peptone, 17 g/L agar, 25 mL/L potassium phosphate (1 M), 1 mL/L CaCl2·2H2O (1 M), 1 mL/L MgSO4·7H2O(1 M), and 1 mL/L cholesterol. Cultures were maintained at 20°C, with Escherichia coli OP50 as the food source. Nematodes were transferred to fresh OP50-seeded NGM plates and incubated at 20°C. Bacterial replenishment was performed when nematodes exhibited starvation.
2.3. Subculturing and Synchronization of C. elegans
Nematode developmental stages were monitored under a stereomicroscope. Synchronization was initiated when adults containing visible eggs were abundant. Secondary synchronization exploited developmental-stage-specific environmental tolerance (e.g., temperature, osmotic pressure). Nematodes were washed from plates into 1.5 mL microcentrifuge tubes using M9 buffer, allowed to settle for 3–5 min, and subjected to three cycles of supernatant removal and resuspension. Pelleted nematodes (500 μL) were treated with bleach solution (400 μL sodium hypochlorite, 200 μL 5 M NaOH, and 1400μL ddH2O) for ~3 min to lyse adults. After centrifugation (6000 rpm, 1 min), pellets were washed twice with M9 buffer. Eggs were transferred to fresh OP50-seeded NGM plates.
2.4. Developmental Assay of C. elegans
Synchronized eggs were inoculated onto control (OP50 only) and experimental NGM plates containing nickel (0.8, 8, or 80 μg/L). After 72 h at 20°C, nematodes at larval stages (L1–L4) were counted.
2.5. Reproductive Capacity Assay
Synchronized eggs were cultured on control or nickel-containing NGM plates. After 3 days, L4-stage nematodes were transferred individually to fresh plates (15 plates per group, 1 nematode/plate). Progeny counts were recorded 4–5 days post-transfer.
2.6. Pharyngeal Pumping Rate Assay
Adult nematodes (5–6 per plate) were transferred to NGM plates containing OP50 with 0.8, 8, or 80 μg/L nickel. Bleach solution was added to immobilize nematodes. Pharyngeal pumps were counted over 30 s at 3, 7, and 14 days post-treatment (n = 15 per group). Rates were expressed as pumps per minute.
2.7. Lifespan Assay
Synchronized eggs were cultured on control or nickel-containing NGM plates. Adults were transferred daily to fresh plates with corresponding nickel concentrations. Mortality was recorded until all nematodes died.
2.8. Lipofuscin Accumulation Assay
Synchronized L4-stage nematodes were exposed to 0.8 or 80 μg/L nickel for 72 h. After PBS washing, lipofuscin autofluorescence was visualized under a fluorescence microscope (excitation: 360–400 nm; emission: 450–500 nm). Fluorescence intensity was quantified using ImageJ (≥30 nematodes/group). Statistical significance was assessed via SPSS.
2.9. Food Preference Assay
NGM plates were divided into two regions: Region A1 (OP50) and B1 (OP50 + 80 μg/L nickel). Adult nematodes were placed at the plate center. Nematode distribution was recorded after 2 h.
2.10. Transcriptomic Analysis
Total RNA was extracted using TRIzol and dissolved in 50μL DEPC-treated water. RNA quality and quantity were assessed using a Qubit fluorometer and Qsep400 Bio-Fragment Analyzer. Polyadenylated mRNAs were enriched with Oligo(dT) beads, fragmented, and reverse-transcribed into cDNA using random hexamers. Strand-specific libraries were constructed by incorporating dUTPs during second-strand synthesis. After end repair, dA-tailing, and adapter ligation, libraries (250–350 bp inserts) were PCR-amplified and purified. Final libraries were circularized, amplified with phi29 polymerase to generate DNA nanoballs (DNBs), and sequenced on a BGI platform.
2.11. Statistical Analysis
The data are presented as means ± SD or SEM, as specified in the figure legends. Statistical analyses were conducted using Student’s t-test or one-way analysis of variance (ANOVA) as detailed in the figure legends. For comparisons of survival rates, the Logrank Mantel-Cox test was employed. Significance levels are indicated in the figures and legends (*p < 0.05, **p < 0.01) or can be found in the supplementary datasets.
3. Results
3.1. Nickel exposure Significantly Impaired the Multi-Dimensional Growth and Development of Caenorhabditis elegans
Synchronized C. elegans populations are exposed to OP50 (0.8 μg/L, 8 μg/L, and 80 μg/L) with nickel for 72 h to assess developmental toxicity. The larval stage distribution (L1, L2-L3, L4) is quantified as a percentage relative to the total population (L1 + L2-L3 + L4). As shown in Figure 1a-b: Controls: L1 (13%), L2-L3 (35%), L4 (52%); 0.8 μg/L nickel: L1 (30%), L2-L3 (45%), L4 (25%); 8 μg/L nickel: L1 (38%), L2-L3 (39%), L4 (23%); 80 μg/L nickel: L1 (50%), L2-L3 (41%), L4 (9%). The results of statistical analysis showed that the heavy metal nickel preferentially disrupted the developmental transition from L1 to L4, and the exposure of 80 μg/L led to a 3.8-fold increase in L1 arrest compared with the control group (p < 0.0001). The observed dose-response relationship is consistent with the inhibitory effect of nickel on early plant development. Ma et al. [18]reported a 40% inhibition of 50 μg/L nickel on maize seed germination, while Yang et al. [19]recorded a 58% inhibition of wheat seedling root growth under similar exposure conditions. Our findings extend these toxicological patterns to metazoans, confirming that nickel’s ability to conserve compromises critical developmental checkpoints across kingdoms.
To study nickel-induced reproductive toxicity, synchronized n2 populations were exposed to nickel concentrations (0.8, 8, and 80 ug/L) in NGM agar. As shown in Figure 1c, the analysis of the number of eggs laid revealed a concentration-dependent decrease in fertility: CK: 297.8±12.1; 0.8 μg/L: 287.3±10.8 (P = 0.08 compared to the control group); 8 μg/L: 269.8±11.5 (p < 0.05); 80 μg/L: 264.1±9.7 (p < 0.01), at concentrations ≥ 8 ug/L, the inhibition was statistically significant (ANOVA, F₍3, 56₎ = 18.3, p < 0.0001), and the calculated EC₅₀ was 15.2 ug/L (95% CI: 12.6-18.9 ug/L). It is shown that the reproductive capacity of nematodes is affected under the influence of higher concentrations of nickel. This dose-response pattern reflects the reproductive toxicity of nickel to soil invertebrates (60% reduction in cocoon production at 50 μg/L [30]) and mammals (musculus: 45% decrease in sperm motility at 100 μg/kg [Cao et al., 20XX]). Comparative analysis showed that the reproductive toxicity of nickel to Caenorhabditis elegans had a similar mechanism to cadmium exposure (32% loss of fecundity at 10 μm [20]), suggesting that conserved heavy metals disrupted germline development. The threshold concentration (0.8 μg/L) corresponds to the ambient nickel level in the vicinity of the industrial site, highlighting the ecological relevance.
Chronic nickel exposure significantly impairs pharyngeal pump activity in a time- and concentration-dependent manner (Figure 1D). With the increase of concentration, the number of nickel-treated N2 pharynx pumps continued to decrease under the statistics of nematode pharyngeal pumps on different days. This suggests that nickel treatment affects muscle activity in nematodes, a phenomenon that will be discussed in an ongoing discussion below. This pattern is consistent with nickel interference with mammalian cholinergic signaling (e.g., 45% acetylcholinesterase was inhibited in a rat model of 50 μg/L), suggesting a mechanism of conserved neuromuscular toxicity across species. The progressive decline suggests that nickel may accumulate in pharyngeal muscle cells via a divalent metal transporter (DMT-1). The time-dependent slope change means that chronic exposure exacerbates the disruption of calcium homeostasis. 89 pumps/min at 80 μg/L is below the survival threshold of 100 pumps/min for Caenorhabditis elegans, indicating severe physiological impairment. This neuromuscular toxicity profile provides a quantitative framework for ecological risk assessment, especially in aquatic environments where nickel concentrations in the vicinity of industrial wastewater often exceed 5 μg/L [21].
This study evaluates the impact of nickel exposure on food preference in Caenorhabditis elegans to determine whether environmental nickel contamination alters food selection behaviors, thereby influencing habitat choice, population migration dynamics, and ultimately species population density and community biodiversity in nickel-polluted ecosystems. According to studies by Catharine H. Rankin and G.E. Morrison et al., C. elegans utilizes olfactory cues to assess food quality and regulate foraging strategies—a behavior termed food odor-based decision-making [22,23]. This chemosensory mechanism allows nematodes to avoid toxic substrates or prioritize nutrient-rich environments.
3.2. Nickel Exposure Induced Differential Effects on Lifespan and Aging Processes in Caenorhabditis elegans
Synchronized treatment populations of Caenorhabditis elegans were chronically exposed to nickel (0.8 μg/L, 8 μg/L, and 80 μg/L) to assess longevity effects. The Kaplan-Meier survival curve (Figure 2a) and average life calculations (Figure 2b) reveal non-monotonic dose-response kinetics: control group: 24.5±1.2 days (n = 51); 0.8 μg/L: 23.1±1.1 days (n = 56, p = 0.07 compared to the control group); 8 μg/L: 23.5±1.0 days (n = 53, p = 0.09); 80 μg/L: 24.3±1.3 days (n = 56, p = 0.15) The log-rank test showed no significant reduction in lifespan between groups (χ = 5.8, p = 0.12), These findings indicate that the nickel concentrations employed in this study were relatively low and did not directly induce significant lifespan impairment in Caenorhabditis elegans.although there was a paradoxical trend towards reduced toxicity at 80 μg/L. This biphasic pattern suggests the presence of potential notropic effects at high doses, consistent with nickel’s known activation of stress response pathways, such as HSP-16.2 induction, which may alleviate aging at sublethal concentrations. Quantitative fluorescence analysis (Figure 2C) shows. Chronic nickel exposure significantly increases the accumulation of lipofuscin in Caenorhabditis elegans, a hallmark of cellular senescence and oxidative damage.
3.3. Transcriptomic Analysis Revealed That Multiple Pathways Enriched with Differentially Expressed Genes (DEGs) Were Significantly Activated in Caenorhabditis elegans Under Nickel Exposure
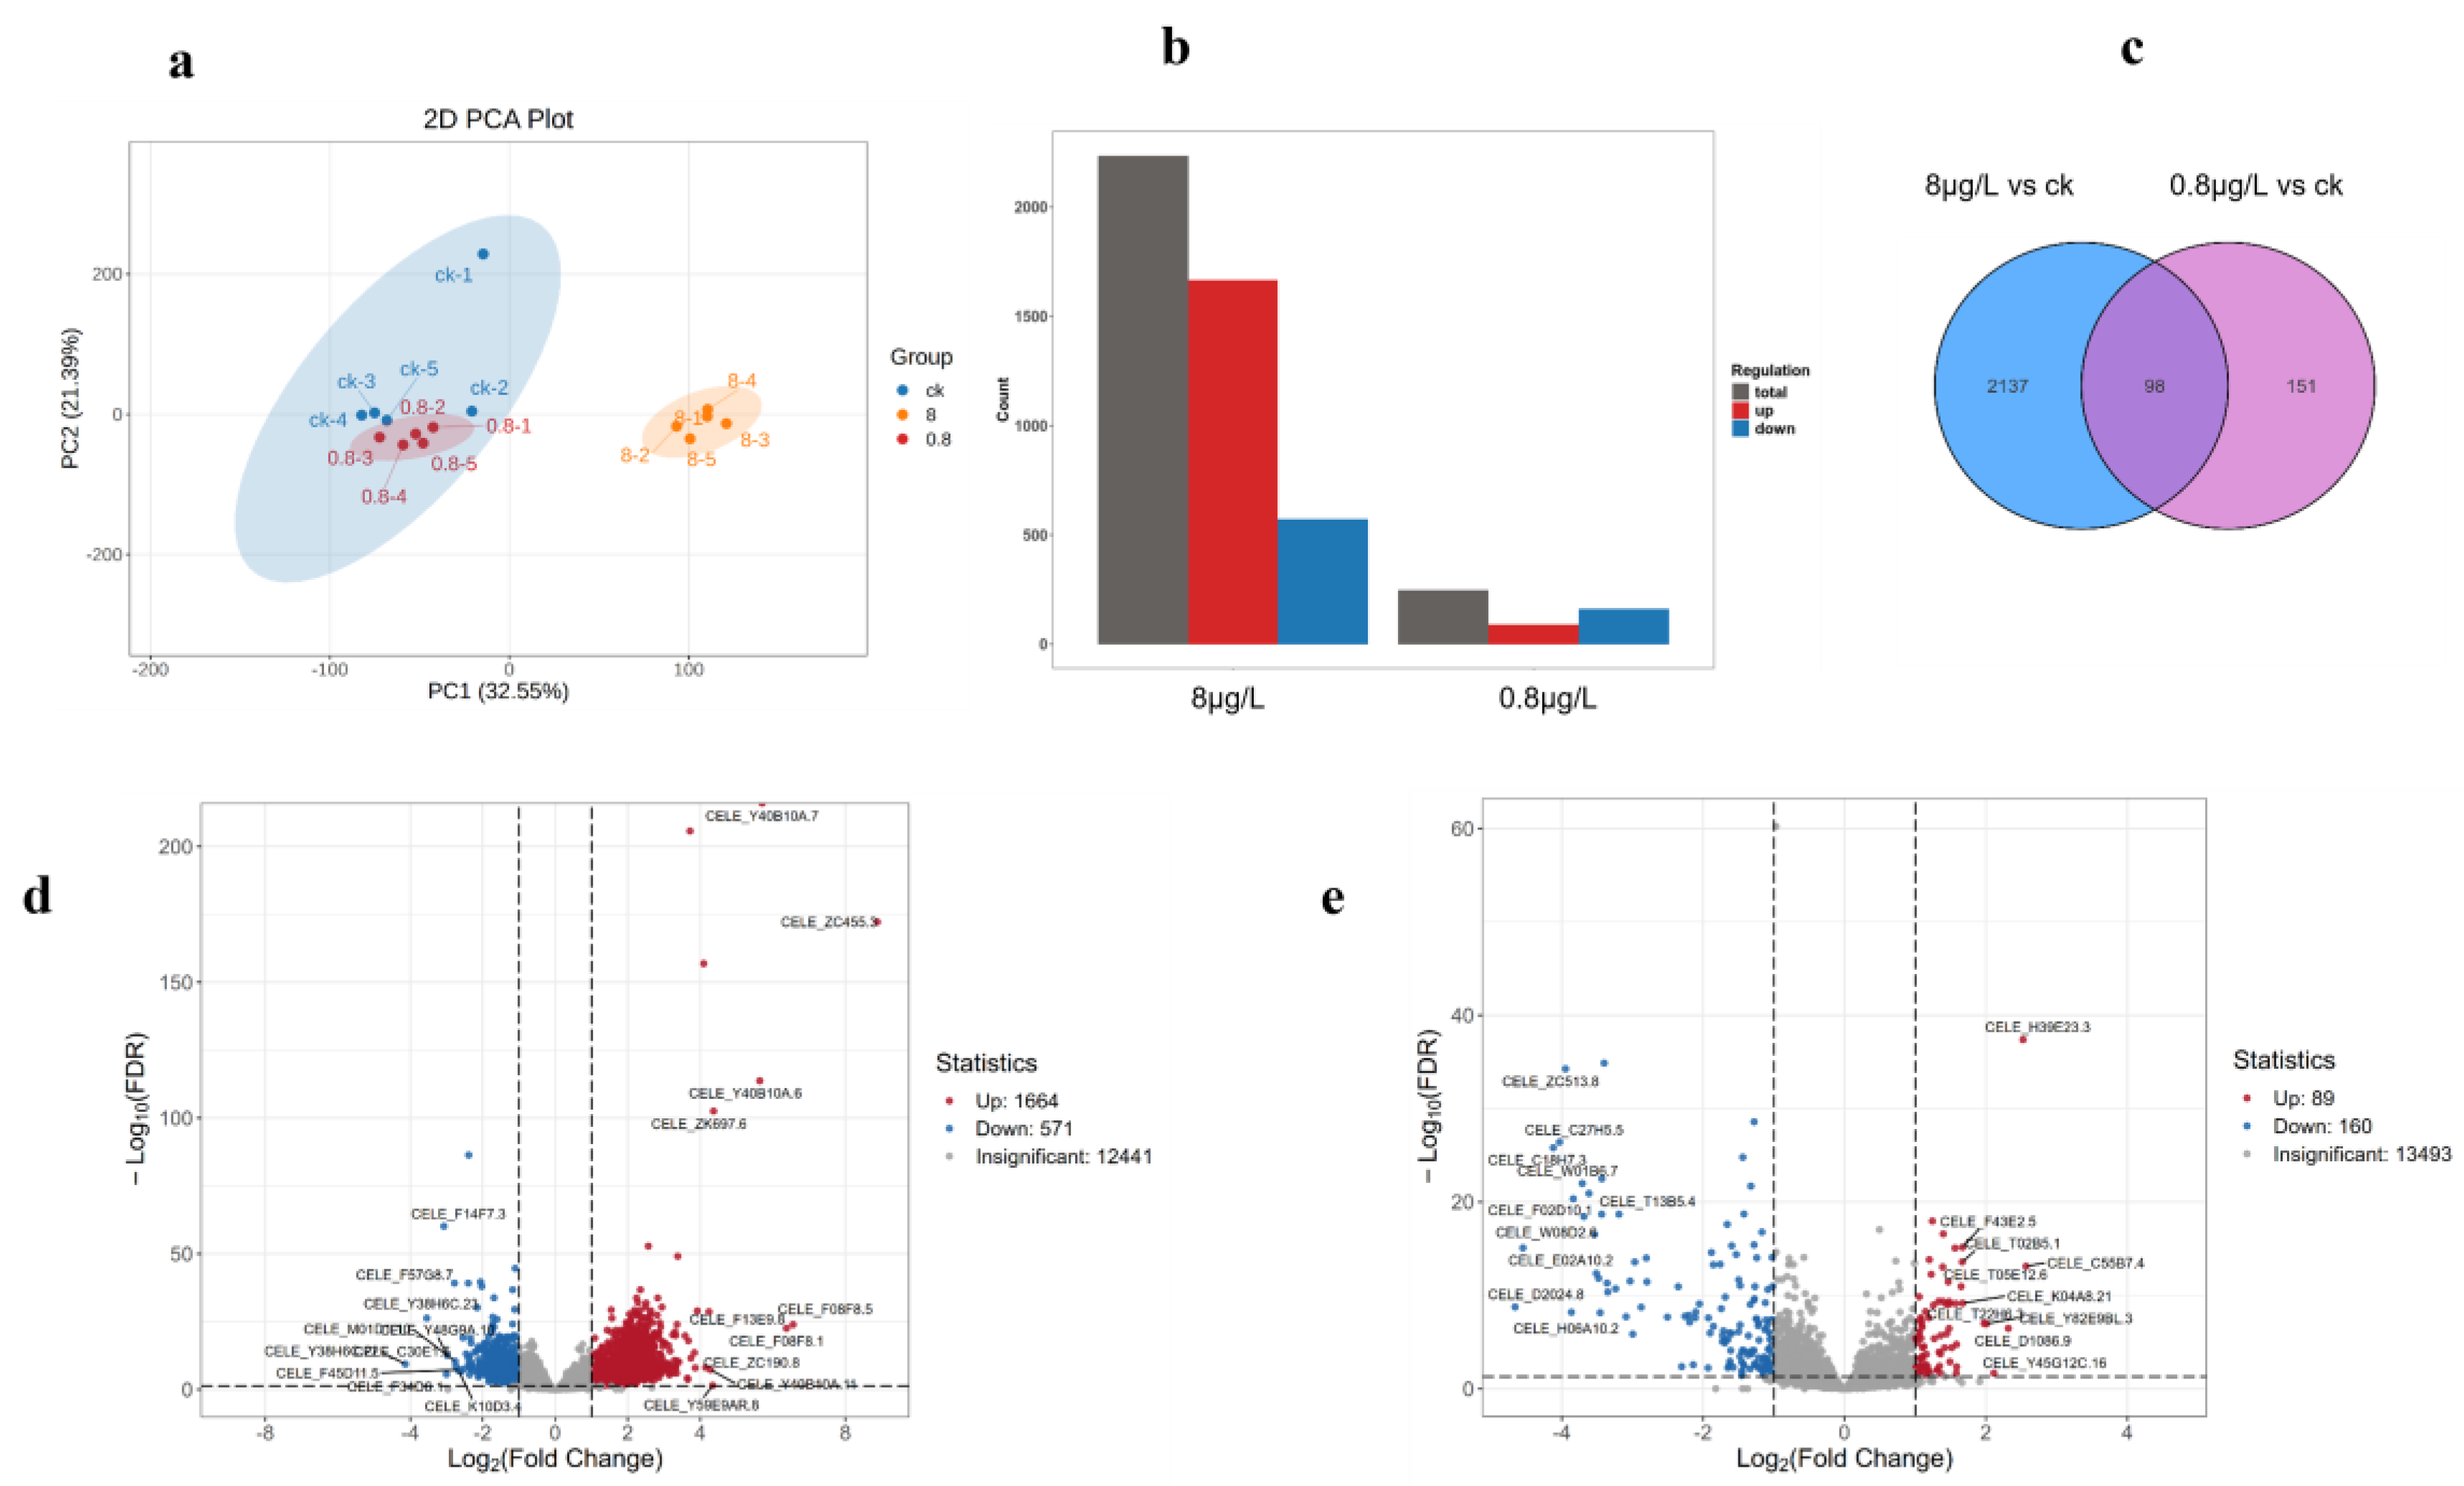
PCA plots showed that PC1 and PC2 accounted for 32.55% and 21.38% of the variations, respectively. The samples were clearly divided into two groups along the PC1 axis: ck (control group) and 8μg/L and 0.8μg/L groups (treatment group), and 0.8μg/L and 8μg/L groups were further separated on the PC2 axis. This suggests that the effects of treatment conditions (e.g., different concentrations or times) on gene expression are cascading, and the 0.8μg/L groups may have activated additional regulatory pathways. The results showed that a total of 249 differential genes (89 up-regulated, 160 down-regulated) were screened in the 0.8μg/L group, while 2235 differential genes were screened in the 8μg/L group (1664 up-regulated, 571 down-regulated), indicating that the biological differences between the 8 groups and the CK group were more significant. The differential gene map showed that the upregulated genes were dominant, which may suggest that the experimental treatment (e.g., drug intervention or environmental stress) activated a specific pathway. This difference suggests that low-dose treatment (0.8μg/L groups) may elicit extensive transcriptional reprogramming, while high-dose treatment (8 groups) may function through more specific pathways. The Venn diagram of differential gene functional enrichment showed that there were 151 DEGs in the 8μg/L and 0.8μg/L groups, while 2137 DEGs were endemic to 8 groups and 98 were endemic to 0.8μg/L groups. Shared DEGs may involve basal stress responses (e.g., heat shock proteins), while group-specific DEGs may regulate dose-dependent pathways (e.g., proliferative signaling at low doses or apoptotic pathways at high doses), respectively. The visualization MA plot of differential gene expression patterns showed that most of the fold changes in gene expression (log2FC) were concentrated around 0 (gray dots), while the significantly differential genes (red/blue) were distributed in the log2FC≥1 or ≤-1 regions. It is worth noting that the DEGs in the 8μg/L group were densely distributed in the log2FC>4 region, suggesting the existence of strong regulatory targets for induction or inhibition.
3.4. GO Enrichment Reveals Experimental Treatment Impacts on C. elegans Stress Response, Development, and Metabolism
Through GO (Gene Ontology) enrichment analysis of differentially differentiated genes, this study revealed the significant effects of experimental treatment on the key biological processes of C. elegans, mainly focusing on three categories: Biological Process (BP), Molecular Function (MF) and Cellular Component (CC).
Figure 4.
GO pathway diagram of nickel treatment at different concentrations (a) is an 8ug/L GO upward and downward histogram, the abscissa represents the secondary GO entry, and the ordinate represents the number of differential genes in the GO entry, red represents up-up-up, blue represents down-regulation.;(b) upward and downward histograms for 0.8ug/L GO.; (c) is the multi-combination GO enrichment and scatter point diagram, the abscissa is the comparative combination, the ordinate is the enrichment pathway, the size of the point represents the number of differential genes enriched to the pathway, the larger the point, the more genes enriched to the pathway, the color of the point represents the significance value of enrichment to the pathway, the color of the point represents the significant value of enrichment to the pathway, and the redder the color of the point, the more significant the enrichment.
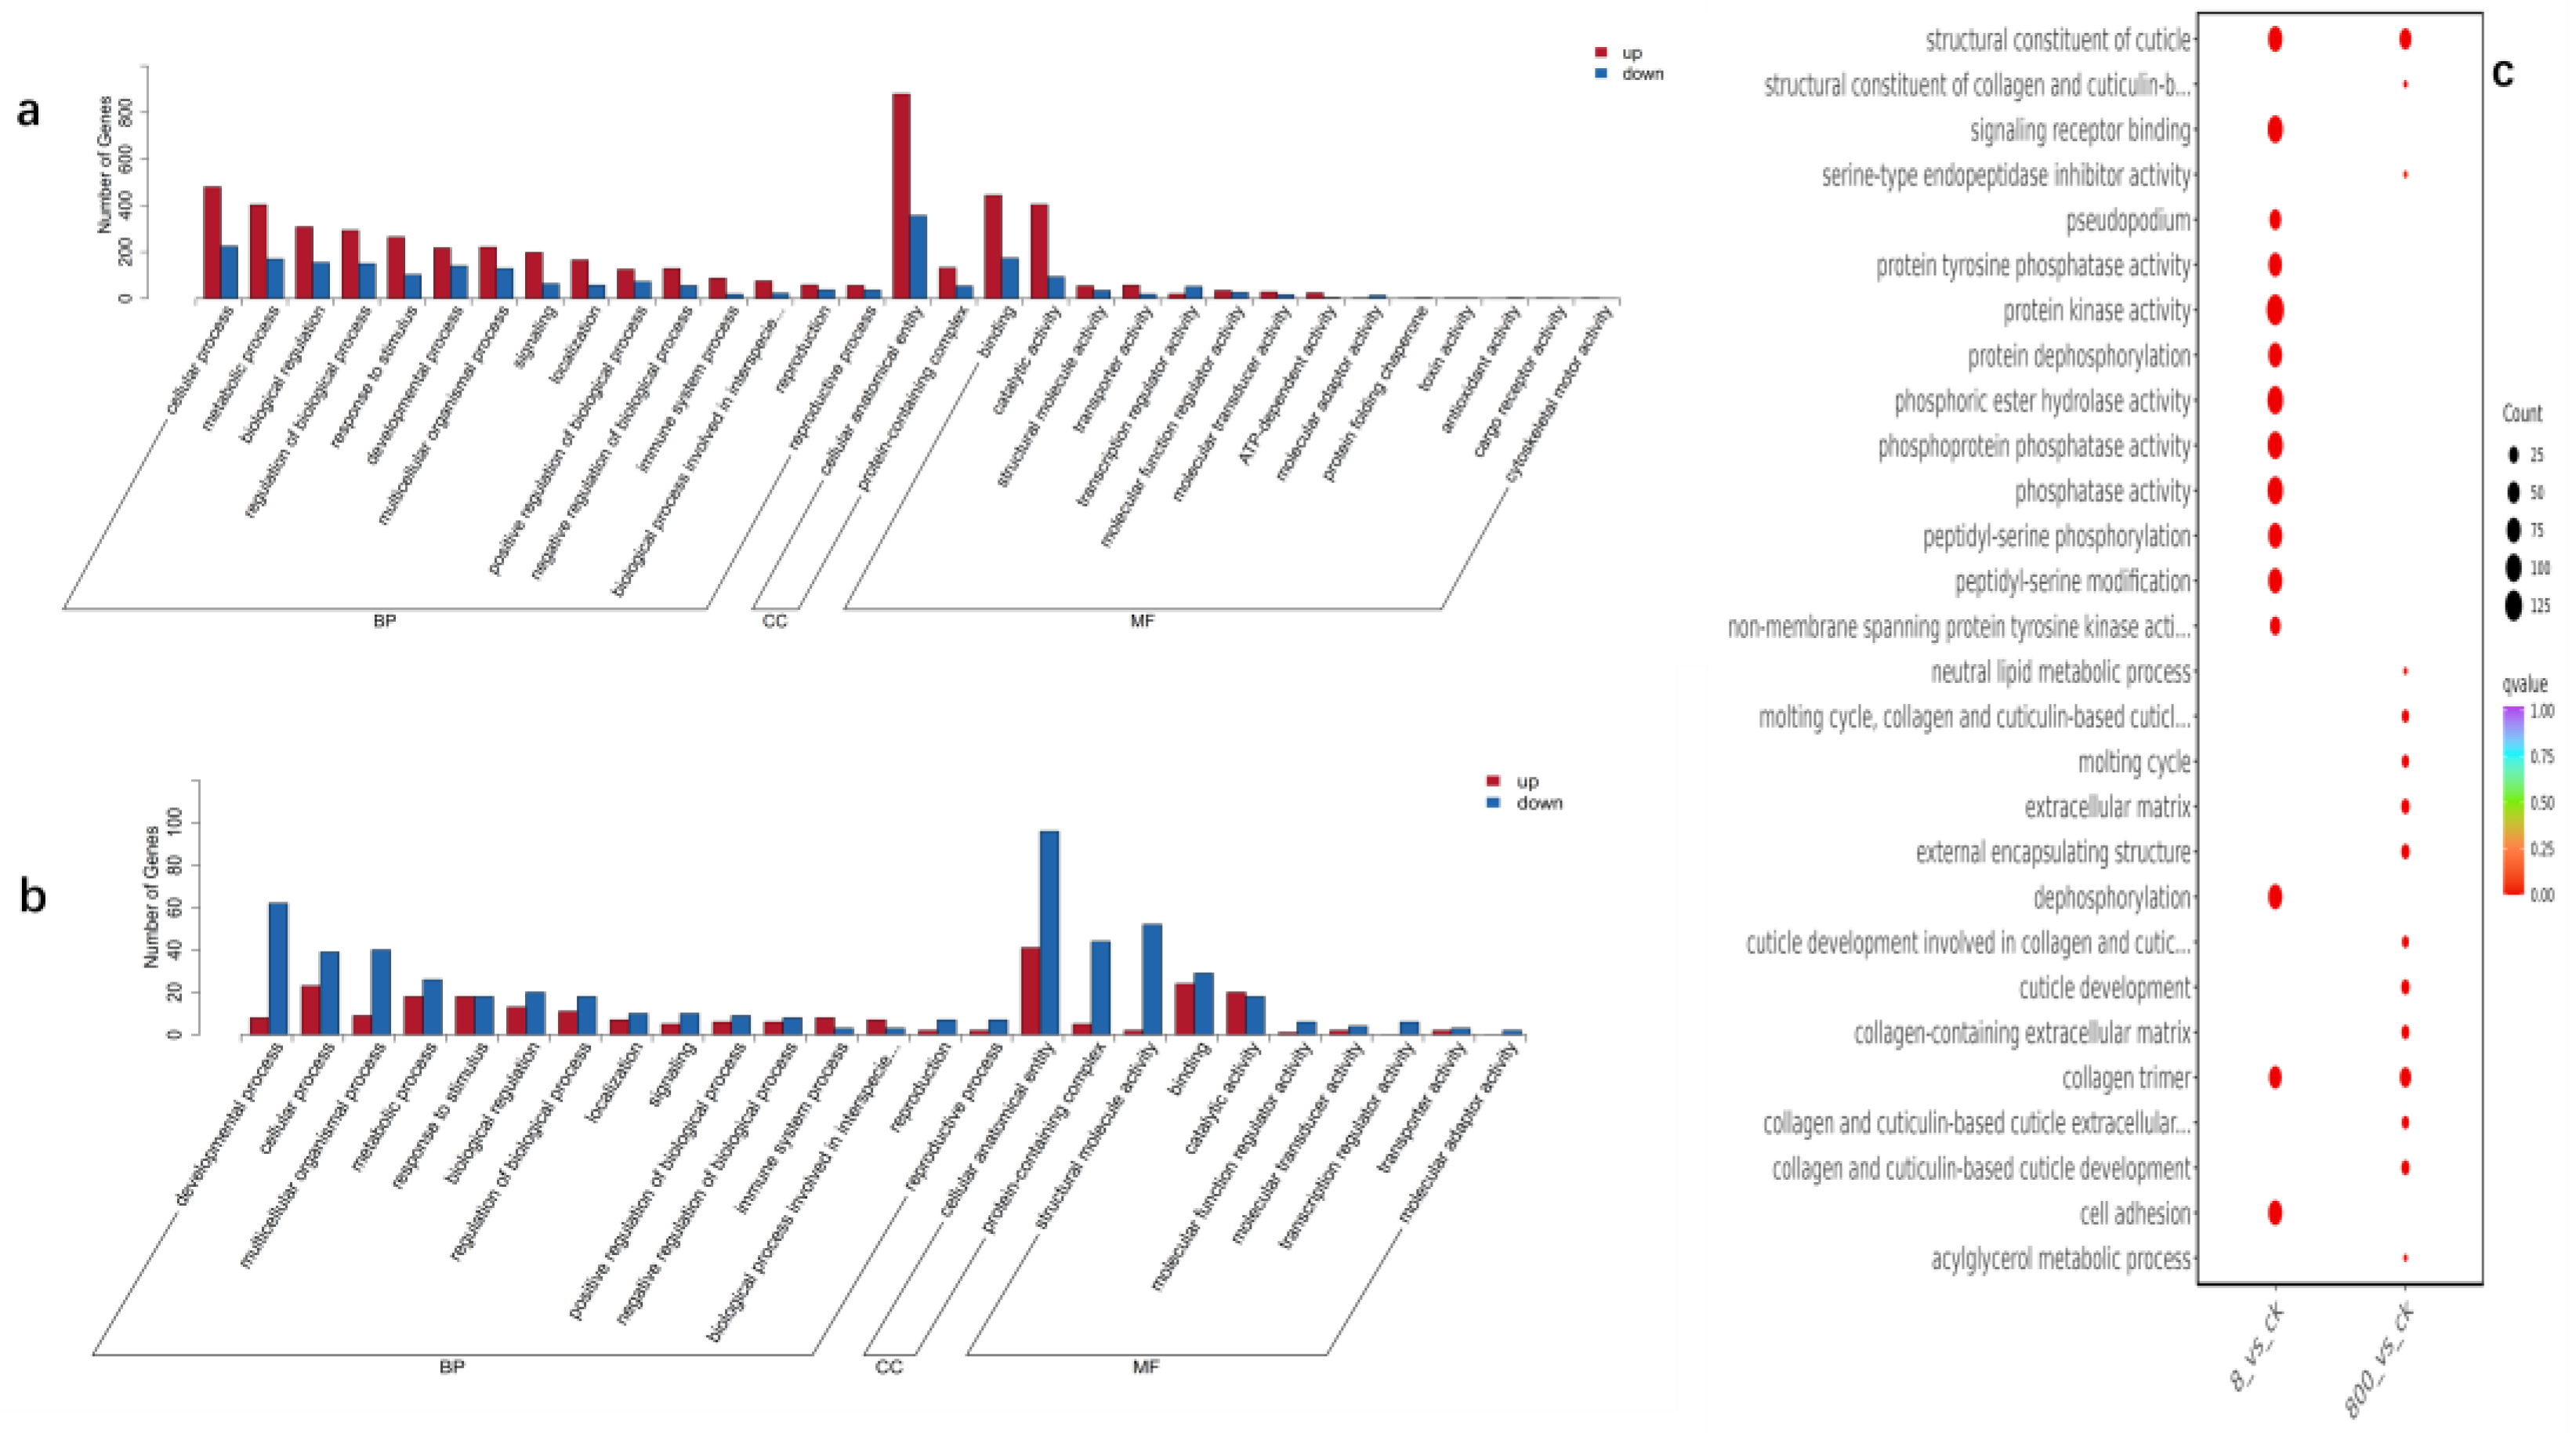
Differential genes were significantly enriched in stress response, developmental regulation, and metabolism-related pathways: oxidative stress and detoxification: genes (e.g., CELE_AC3.10) in the Ascorbate Metabolic Process (FDR < 0.01) were up-regulated, suggesting that the experimental treatment induced oxidative stress response, which may protect cells by scavenging reactive oxygen species (ROS). The Drug Metabolism-Cytochrome P450 pathway is enriched, which is associated with enhanced detoxification (e.g., CELE_CYP35A1) [24]. Development and differentiation: Downregulation of collagen genes (e.g., CELE_COL-99) in Epidermal Cell Differentiation (FDR = 2.72e-5) may lead to structural damage to the epidermis and affect molting and reproductive tract function [25]. Changes in the expression of genes (e.g., CELE_LIN-44) in the “Regulation of Wnt Signaling” (FDR = 3.55e-4) are associated with the regulation of the microenvironment of germ stem cells. Protein modification and degradation: Protein dephosphorylation (FDR = 8.06e-3) enrichment may affect muscle contraction and signal transduction by regulating kinase/phosphatase homeostasis.
Differential genes are mainly involved in signal transduction, enzyme activity and structural maintenance in molecular function (MF): Signal receptor activity: Genes (such as CELE_DAF-1/TGF-β receptor) in Signaling Receptor Binding (FDR = 9.87e-3) are down-regulated, which may inhibit growth and development-related signaling [26]. Enzyme activity regulation: “Protein tyrosine phosphatase activity” (FDR = 6.93e-3) was significantly enriched, which was directly related to muscle function decline and metabolic imbalance. Differentially expressed genes (e.g., CELE_PTP-3) in Phosphatase Activity suggest that experimental treatments interfered with the phosphorylation modification network [27]. Structural protein function: Decreased expression of genes associated with “collagen trimer” (FDR = 4.47e-2) may weaken the mechanical strength of the epidermis and genital tract [28].
Differential gene localization in cell composition (CC) focuses on extracellular matrix, membrane structure, and cell junctions: Extracellular matrix (ECM): Downregulation of collagen and laminin genes in the “Extracellular Matrix” (FDR = 3.77e-2) may affect tissue integrity and germ oocyte trafficking [29]. Membrane structure and cell connection: The “Cytoplasmic Side of Plasma Membrane” (FDR = 3.17e-2) enriches ion channel and receptor genes (e.g., CELE_F11A5.5), which is closely related to the contractility of pharyngeal pump muscles [30].
3.5. KEGG Enrichment Unveils Experimental Treatment Effects on C. elegans Metabolism, Signaling, and Aging Pathways
KEGG enrichment pathway analysis (Kyoto Encyclopedia of Genes and Genomes) enrichment analysis revealed the significant effects of experimental treatment on the key metabolism and signaling pathways of Caenorhabditis elegans. Differential genes are mainly enriched in the following four pathways, covering metabolic regulation, signal transduction, stress response and longevity-related mechanisms, which are summarized as follows:
Figure 5.
KEGG pathway diagram of nickel treatment at different concentrations (a) For multi-combination KEGG enrichment and scatter plots, the abscissa is the comparative combination, the ordinate is the enrichment pathway, the size of the point represents the number of genes that are enriched to the pathway, the larger the point, the more genes are enriched to the pathway, the color of the point represents the significance value of the enrichment to the pathway, and the redder the color of the point, the more significant the enrichment; (b) 8ug/L KEGG enrichment histogram, the abscissa represents the number of differential genes annotated to the pathway, the ordinate represents the name of the KEGG pathway, the number in the figure represents the number of differential genes annotated to the pathway, the ratio of the number of differential genes annotated to the pathway to the total number of annotated differential genes in parentheses, and the rightmost label represents the classification to which the KEGG pathway belongs; (c) KEGG enrichment histogram of 0.8 ug/L.
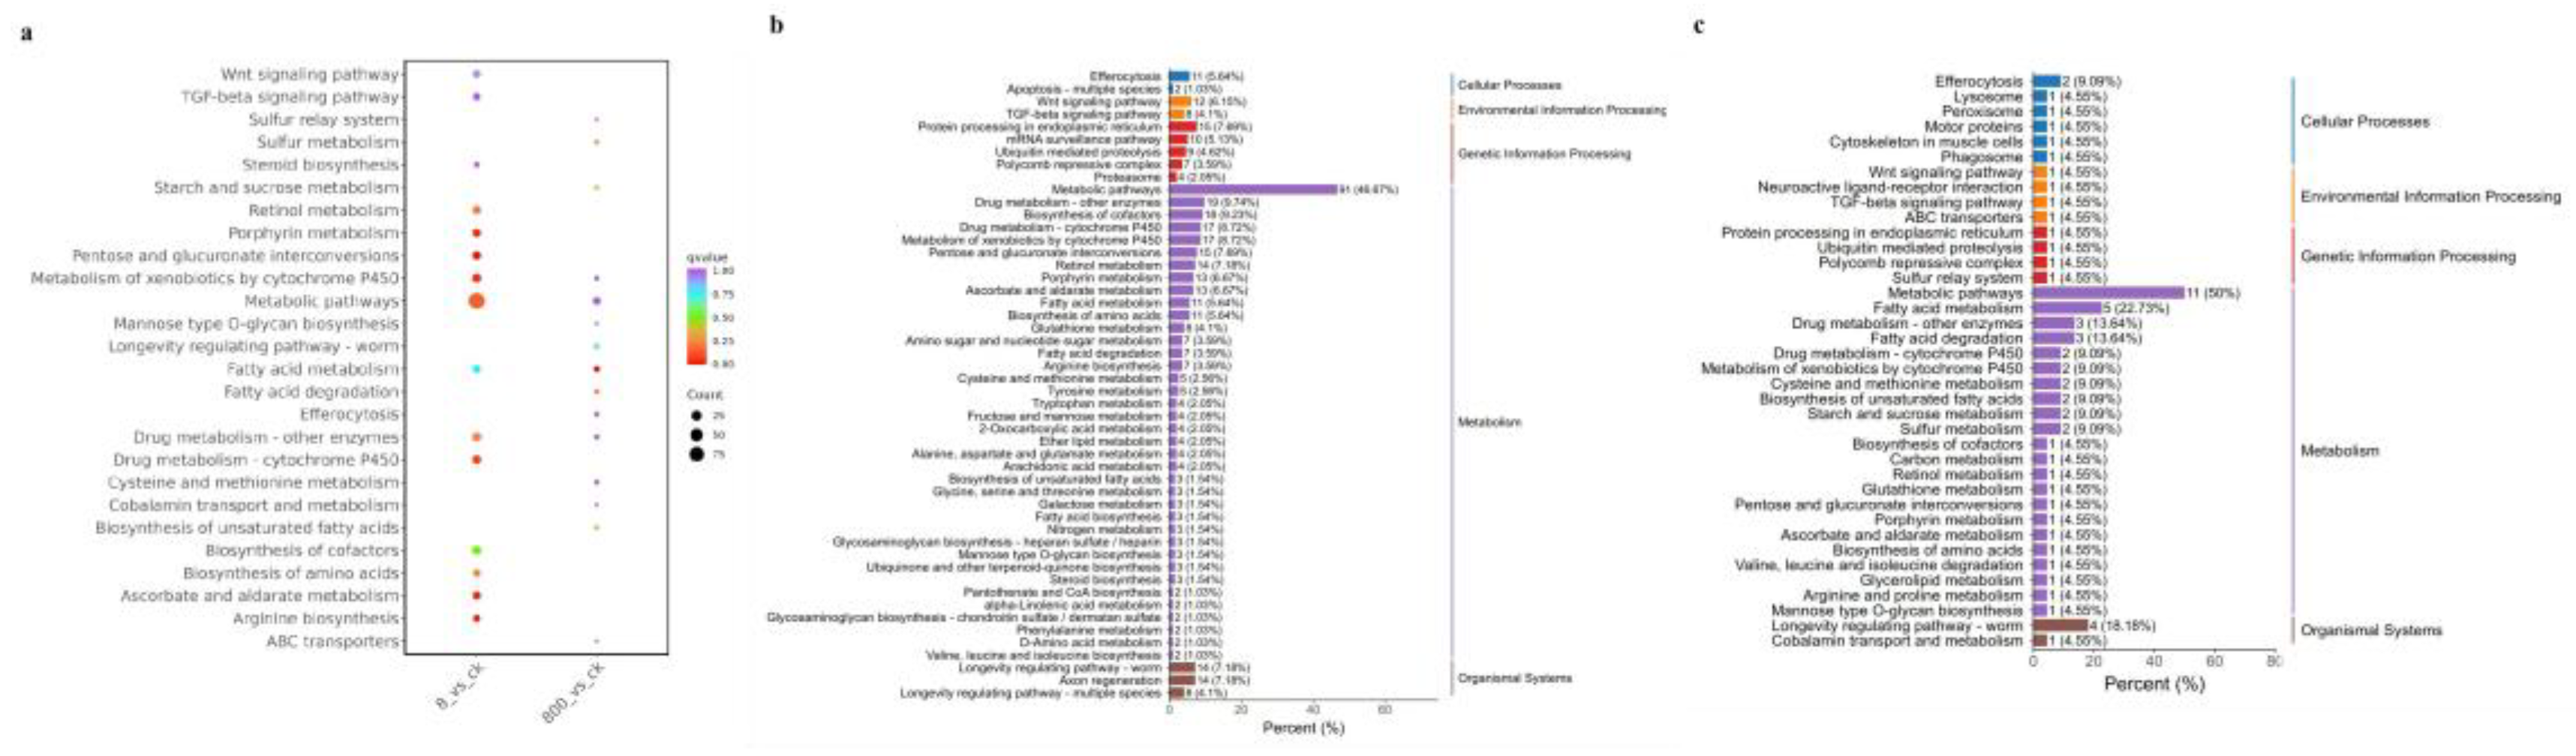
Drug Metabolism - Cytochrome P450: CELE_CYP35A1 (cytochrome P450 gene) expression was up-regulated (log2FC = 2.3), suggesting that the experimental treatment may alleviate exogenous toxicity by enhancing detoxification ability [24]. But long-term activation can lead to metabolic disorders. Ascorbate and Aldarate Metabolism: CELE_AC3.10 (ascorbate peroxidase gene) is significantly enriched, and its upregulation may reduce oxidative stress and protect pharyngeal pump muscle function by scavenging reactive oxygen species (ROS) [31]. Retinol metabolism: Differential expression of retinoic acid synthesis-related genes, which may affect energy metabolism and feeding behavior, and indirectly lead to growth and development delay.
The dysregulation of signal transduction-related pathways, Wnt and TGF-β signaling pathways, is the core mechanism affecting the development and reproduction of nematodes: Wnt signaling pathway: [32] the ligand genes CELE_LIN-44 and CELE_EGL-20 are upregulated, which may overactivate germ stem cell differentiation, interfere with oocyte development, and lead to a decrease in the number of eggs laid. TGF-β signaling pathway: the expression of receptor gene CELE_DBL-1 is down-regulated, which inhibits body length regulatory signals, resulting in larval stunting.
Stress response and aging-related pathways, experimental treatment directly affects the aging process of nematodes by regulating oxidative stress and protein homeostasis: Proteasome: the expression of CELE_PSM-3 (proteasome subunit gene) is increased, which may delay the accumulation of aging-related proteins by accelerating the degradation of wrong proteins. Longevity Regulating Pathway (Worm): CELE_DAF-16 (FOXO transcription factor) is up-regulated, activates downstream antioxidant genes (such as SOD-3, CTL-1), reduces oxidative damage, and prolongs life [33].
Abnormalities in cellular structure and function-related pathways, extracellular matrix and membrane structure-related pathways are closely related to the phenotypic decline of nematodes: ECM-receptor interaction: the expression of collagen genes (such as CELE_COL-99) and laminin genes is down-regulated, weakening the structural integrity of the epidermis and reproductive tract, resulting in reduced oviposition efficiency [34]. Calcium Signaling Pathway: Alternative splicing events (exon skips) of calcium channel gene CELE_F11A5.5 may interfere with pharyngeal muscle calcium signaling, directly leading to pharyngeal pump decline [35].
4. Discussion
This study investigated the multifaceted toxic effects of nickel exposure on Caenorhabditis elegans. Experimental results demonstrated that nickel exposure significantly impaired physiological functions, including growth, reproductive capacity, and neuromuscular activity. Transcriptomic analysis further identified differentially expressed genes (DEGs) and key metabolic pathways associated with nickel toxicity.
Nickel exposure in Caenorhabditis elegans exhibits a concentration-dependent, multi-layered toxicity mechanism. Contrary to expectations, high-concentration nickel (8 μg/L) induced fewer differentially expressed genes (DEGs) compared to low-concentration treatment (0.8 μg/L), yet these DEGs were markedly enriched in critical metabolic and signaling pathways. The activation of cytochrome P450-mediated xenobiotic metabolism (e.g., upregulation of CYP35A1) and suppression of ascorbate metabolism (e.g., downregulation of AC3.10) formed a dynamic equilibrium [36], revealing enhanced detoxification capacity against heavy metals alongside sustained oxidative stress. Core components of developmental regulation exhibited directional shifts: dual perturbations from upregulated Wnt ligands and downregulated TGF-β receptors likely disrupted cell cycle checkpoints [26], altering developmental timing and cell fate determination, while widespread downregulation of collagen-encoding genes directly compromised cuticle and reproductive tract structural integrity. These molecular imbalances extended to phenotypic consequences: retinol metabolic reprogramming altered energy allocation patterns, and exon-skipping events in calcium channel genes (e.g., F11A5.5) exacerbated feeding inefficiency through abnormal pharyngeal muscle contraction [37]. In aging regulation, reduced expression of lysosomal acid hydrolases (e.g., CPL-1) led to intestinal lipofuscin accumulation, indicating failure in clearing aging-related metabolites, while chronic mitochondrial dysfunction (e.g., persistent downregulation of NDUFS2) suggested oxidative damage from metabolic stress [38]. Notably, nickel toxicity demonstrated synergistic pathway effects: while cytochrome P450 activation alleviated lipid peroxidation, its sustained activity may exacerbate redox imbalance by depleting NADPH reserves. Concurrently, crosstalk between dysregulated Wnt/TGF-β signaling and collagen metabolism defects created a positive feedback loop, amplifying developmental abnormalities and reproductive dysfunction. These findings not only elucidate nickel’s “metabolic disruption–oxidative stress–signal transduction” triad in homeostasis breakdown but also highlight hub genes (e.g., CYP35A1, COL-99) as bridges linking transcriptomic changes to phenotypic outcomes, offering novel biomarker candidates for predictive toxicology models [25]. Future studies should integrate spatiotemporal gene editing and metabolomic profiling to dissect cascading effects of pathway perturbations, particularly in developmental plasticity and transgenerational toxicity.
References
- LIU S, COSTA M, ORTIZ A. Chronic nickel exposure alters extracellular vesicles to mediate cancer progression via sustained NUPR1 expression [J]. J Inorg Biochem, 2024, 252: 112477. [CrossRef]
- YUFENG S. Properties and Applications of Nickel [J]. Chlor-Alkali Industry, 1995, 11: 31-5.
- U.S. Geological Survey, Mineral Commodity Summaries [R], 2023.
- HU H W, WANG J T, LI J, et al. Long-Term Nickel Contamination Increases the Occurrence of Antibiotic Resistance Genes in Agricultural Soils [J]. Environ Sci Technol, 2017, 51(2): 790-800.
- CHEN NENGCHANG E A. Report on the State of the Ecology and Environment in China [J]. The Journal of Agro-Environment Science, 2017, 36(09): 1689-92.
- WHO. Guidelines for drinking-water quality: Fourth edition incorporating the first and second addenda [Z]. 2022.
- (SAMR) N H C O T P S R O C N S A F M R. National food safety standard: Limits of contaminants in foods (GB 2762-2017). [Z]. 2017.
- (SAMR) M O E A E O T P S R O C M S A F M R. Soil Environmental Quality: Risk Control Standard for Soil Contamination of Agricultural Land (Trial)(GB 15618-2018) [Z]. 2018.
- MINISTRY OF ECOLOGY AND ENVIRONMENT OF THE PEOPLE’S REPUBLIC OF CHINA (MEE) & GENERAL ADMINISTRATION OF QUALITY SUPERVISION I A Q A. Integrated wastewater discharge standard(GB 8978-1996) [Z]. 1996.
- RIZWAN M, USMAN K, ALSAFRAN M. Ecological impacts and potential hazards of nickel on soil microbes, plants, and human health [J]. Chemosphere, 2024, 357: 142028. [CrossRef]
- GUO H, LIU H, WU H, et al. Nickel Carcinogenesis Mechanism: DNA Damage [J]. Int J Mol Sci, 2019, 20(19). [CrossRef]
- SALNIKOW K, COSTA M. Epigenetic mechanisms of nickel carcinogenesis [J]. J Environ Pathol Toxicol Oncol, 2000, 19(3): 307-18.
- QIN R, WANG Y, WANG S, et al. Nickel-refining dust regulates the expression of inflammatory factors in NIH/3T3 cells [J]. Toxicol Ind Health, 2019, 35(3): 239-47. [CrossRef]
- WU B, CUI H, PENG X, et al. Dietary nickel chloride induces oxidative stress, apoptosis and alters Bax/Bcl-2 and caspase-3 mRNA expression in the cecal tonsil of broilers [J]. Food Chem Toxicol, 2014, 63: 18-29.
- IJOMONE O M, MIAH M R, AKINGBADE G T, et al. Nickel-Induced Developmental Neurotoxicity in C. elegans Includes Cholinergic, Dopaminergic and GABAergic Degeneration, Altered Behaviour, and Increased SKN-1 Activity [J]. Neurotox Res, 2020, 37(4): 1018-28. [CrossRef]
- SAINI S, NAIR N, SAINI M. Effects of gestational administration of nickel on postnatal development in Swiss albino mice [J]. Hum Exp Toxicol, 2014, 33(12): 1199-208. [CrossRef]
- TANG B, WILLIAMS P L, XUE K S, et al. Detoxification mechanisms of nickel sulfate in nematode Caenorhabditis elegans [J]. Chemosphere, 2020, 260: 127627. [CrossRef]
- GUI M. 18029-18030+18034 [J]. Journal of Anhui Agricultural Sciences, 2010, 38(32): 18029-30+34.
- SU-PING Y H-C W. Effects of Nickel Stress on Seed Germination and Seedling Growth of Wheat [J]. Seed, 2011, 30(12): 18-20.
- QU Z, LIU L, WU X, et al. Cadmium-induced reproductive toxicity combined with a correlation to the oogenesis process and competing endogenous RNA networks based on a Caenorhabditis elegans model [J]. Ecotoxicol Environ Saf, 2023, 268: 115687. [CrossRef]
- PICCIOTTO MARINA R, HIGLEY MICHAEL J, MINEUR YANN S. Acetylcholine as a Neuromodulator: Cholinergic Signaling Shapes Nervous System Function and Behavior [J]. Neuron, 2012, 76(1): 116-29.
- HOY J L, DAY L M, TIBBALLS J, et al. Unintentional poisoning hospitalisations among young children in Victoria [J]. Inj Prev, 1999, 5(1): 31-5.
- RANKIN C H. Nematode behavior: the taste of success, the smell of danger! [J]. Curr Biol, 2006, 16(3): R89-91. [CrossRef]
- XIANG X, KWAME A W, QING Y, et al. Natural antioxidants inhibit oxidative stress-induced changes in the morphology and motility of cells [J]. Food Bioscience, 2023, 52: 102442. [CrossRef]
- CHEN H, LIU P, PAN X, et al. Downregulation of collagen IV deposition and ITGB1-FAK signaling pathway to inhibit adipogenesis: A novel mechanism of swertiamarin in treating type 2 diabetes mellitus [J]. International Journal of Biological Macromolecules, 2025, 299: 140048. [CrossRef]
- VANDER ARK A, CAO J, LI X. TGF-β receptors: In and beyond TGF-β signaling [J]. Cellular Signalling, 2018, 52: 112-20.
- DENU J M, DIXON J E. Protein tyrosine phosphatases: mechanisms of catalysis and regulation [J]. Current Opinion in Chemical Biology, 1998, 2(5): 633-41.
- HWANG H S, LEE M H, KIM H A. TGF-β1-induced expression of collagen type II and ACAN is regulated by 4E-BP1, a repressor of translation [J]. Faseb j, 2020, 34(7): 9531-46.
- SACHER F, FEREGRINO C, TSCHOPP P, et al. Extracellular matrix gene expression signatures as cell type and cell state identifiers [J]. Matrix Biology Plus, 2021, 10: 100069. [CrossRef]
- ROJANOWSKI N F, RAIZEN D M, FANG-YEN C. Pharyngeal pumping in Caenorhabditis elegans depends on tonic and phasic signaling from the nervous system [J]. Scientific Reports, 2016, 6(1): 22940. [CrossRef]
- SMIRNOFF N. Ascorbic acid metabolism and functions: A comparison of plants and mammals [J]. Free Radical Biology and Medicine, 2018, 122: 116-29. [CrossRef]
- YANG Y. Wnt signaling in development and disease [J]. Cell Biosci, 2012, 2(1): 14. [CrossRef]
- ROUSSEAU A, BERTOLOTTI A. Regulation of proteasome assembly and activity in health and disease [J]. Nature Reviews Molecular Cell Biology, 2018, 19(11): 697-712. [CrossRef]
- SAINIO A, JäRVELäINEN H. Extracellular matrix-cell interactions: Focus on therapeutic applications [J]. Cellular Signalling, 2020, 66: 109487. [CrossRef]
- LIPSCOMBE D, ANDRADE A, ALLEN S E. Alternative splicing: Functional diversity among voltage-gated calcium channels and behavioral consequences [J]. Biochimica et Biophysica Acta (BBA) - Biomembranes, 2013, 1828(7): 1522-9. [CrossRef]
- ESTEVES F, RUEFF J, KRANENDONK M. The Central Role of Cytochrome P450 in Xenobiotic Metabolism-A Brief Review on a Fascinating Enzyme Family [J]. J Xenobiot, 2021, 11(3): 94-114. [CrossRef]
- PAN W W, WUBBEN T J, BESIRLI C G. Photoreceptor metabolic reprogramming: current understanding and therapeutic implications [J]. Communications Biology, 2021, 4(1): 245. [CrossRef]
- CARMONA-GUTIERREZ D, HUGHES A L, MADEO F, et al. The crucial impact of lysosomes in aging and longevity [J]. Ageing Research Reviews, 2016, 32: 2-12. [CrossRef]
Figure 1.
Multidimensional Developmental Impacts of Nickel Exposure in C. elegans (a-b) Larval stage distribution under nickel exposure. (a) Percentage composition of L1, L2-L3, and L4 stages across nickel concentrations (0, 0.8μg/L, 8μg/L, 80 μg/L). (b) Stacked bar graph (GraphPad Prism v9.0) visualizing developmental progression, with total worm counts normalized to 100% (n=12 per group). (c) Reproductive toxicity profile. Brood size reduction in the first replicate experiment, showing mean ± SD progeny counts (n=15 worms/group). Dose-dependent inhibition became significant at ≥8 μg/L (****P < 0.0001, one-way ANOVA).(d) Neuromuscular dysfunction kinetics. Pharyngeal pumping rates (pumps/min) at 3, 7, and 14 days post-exposure. (e) Acute (2 h) and (f) multigenerational (72 h) food preference assays. Worms exhibited significant aversion to 80 μg/L Ni-spiked zones (****P < 0.0001, χ² test), with occupancy rates declining from 78.3% (control) to 21.7% (Ni-exposed).
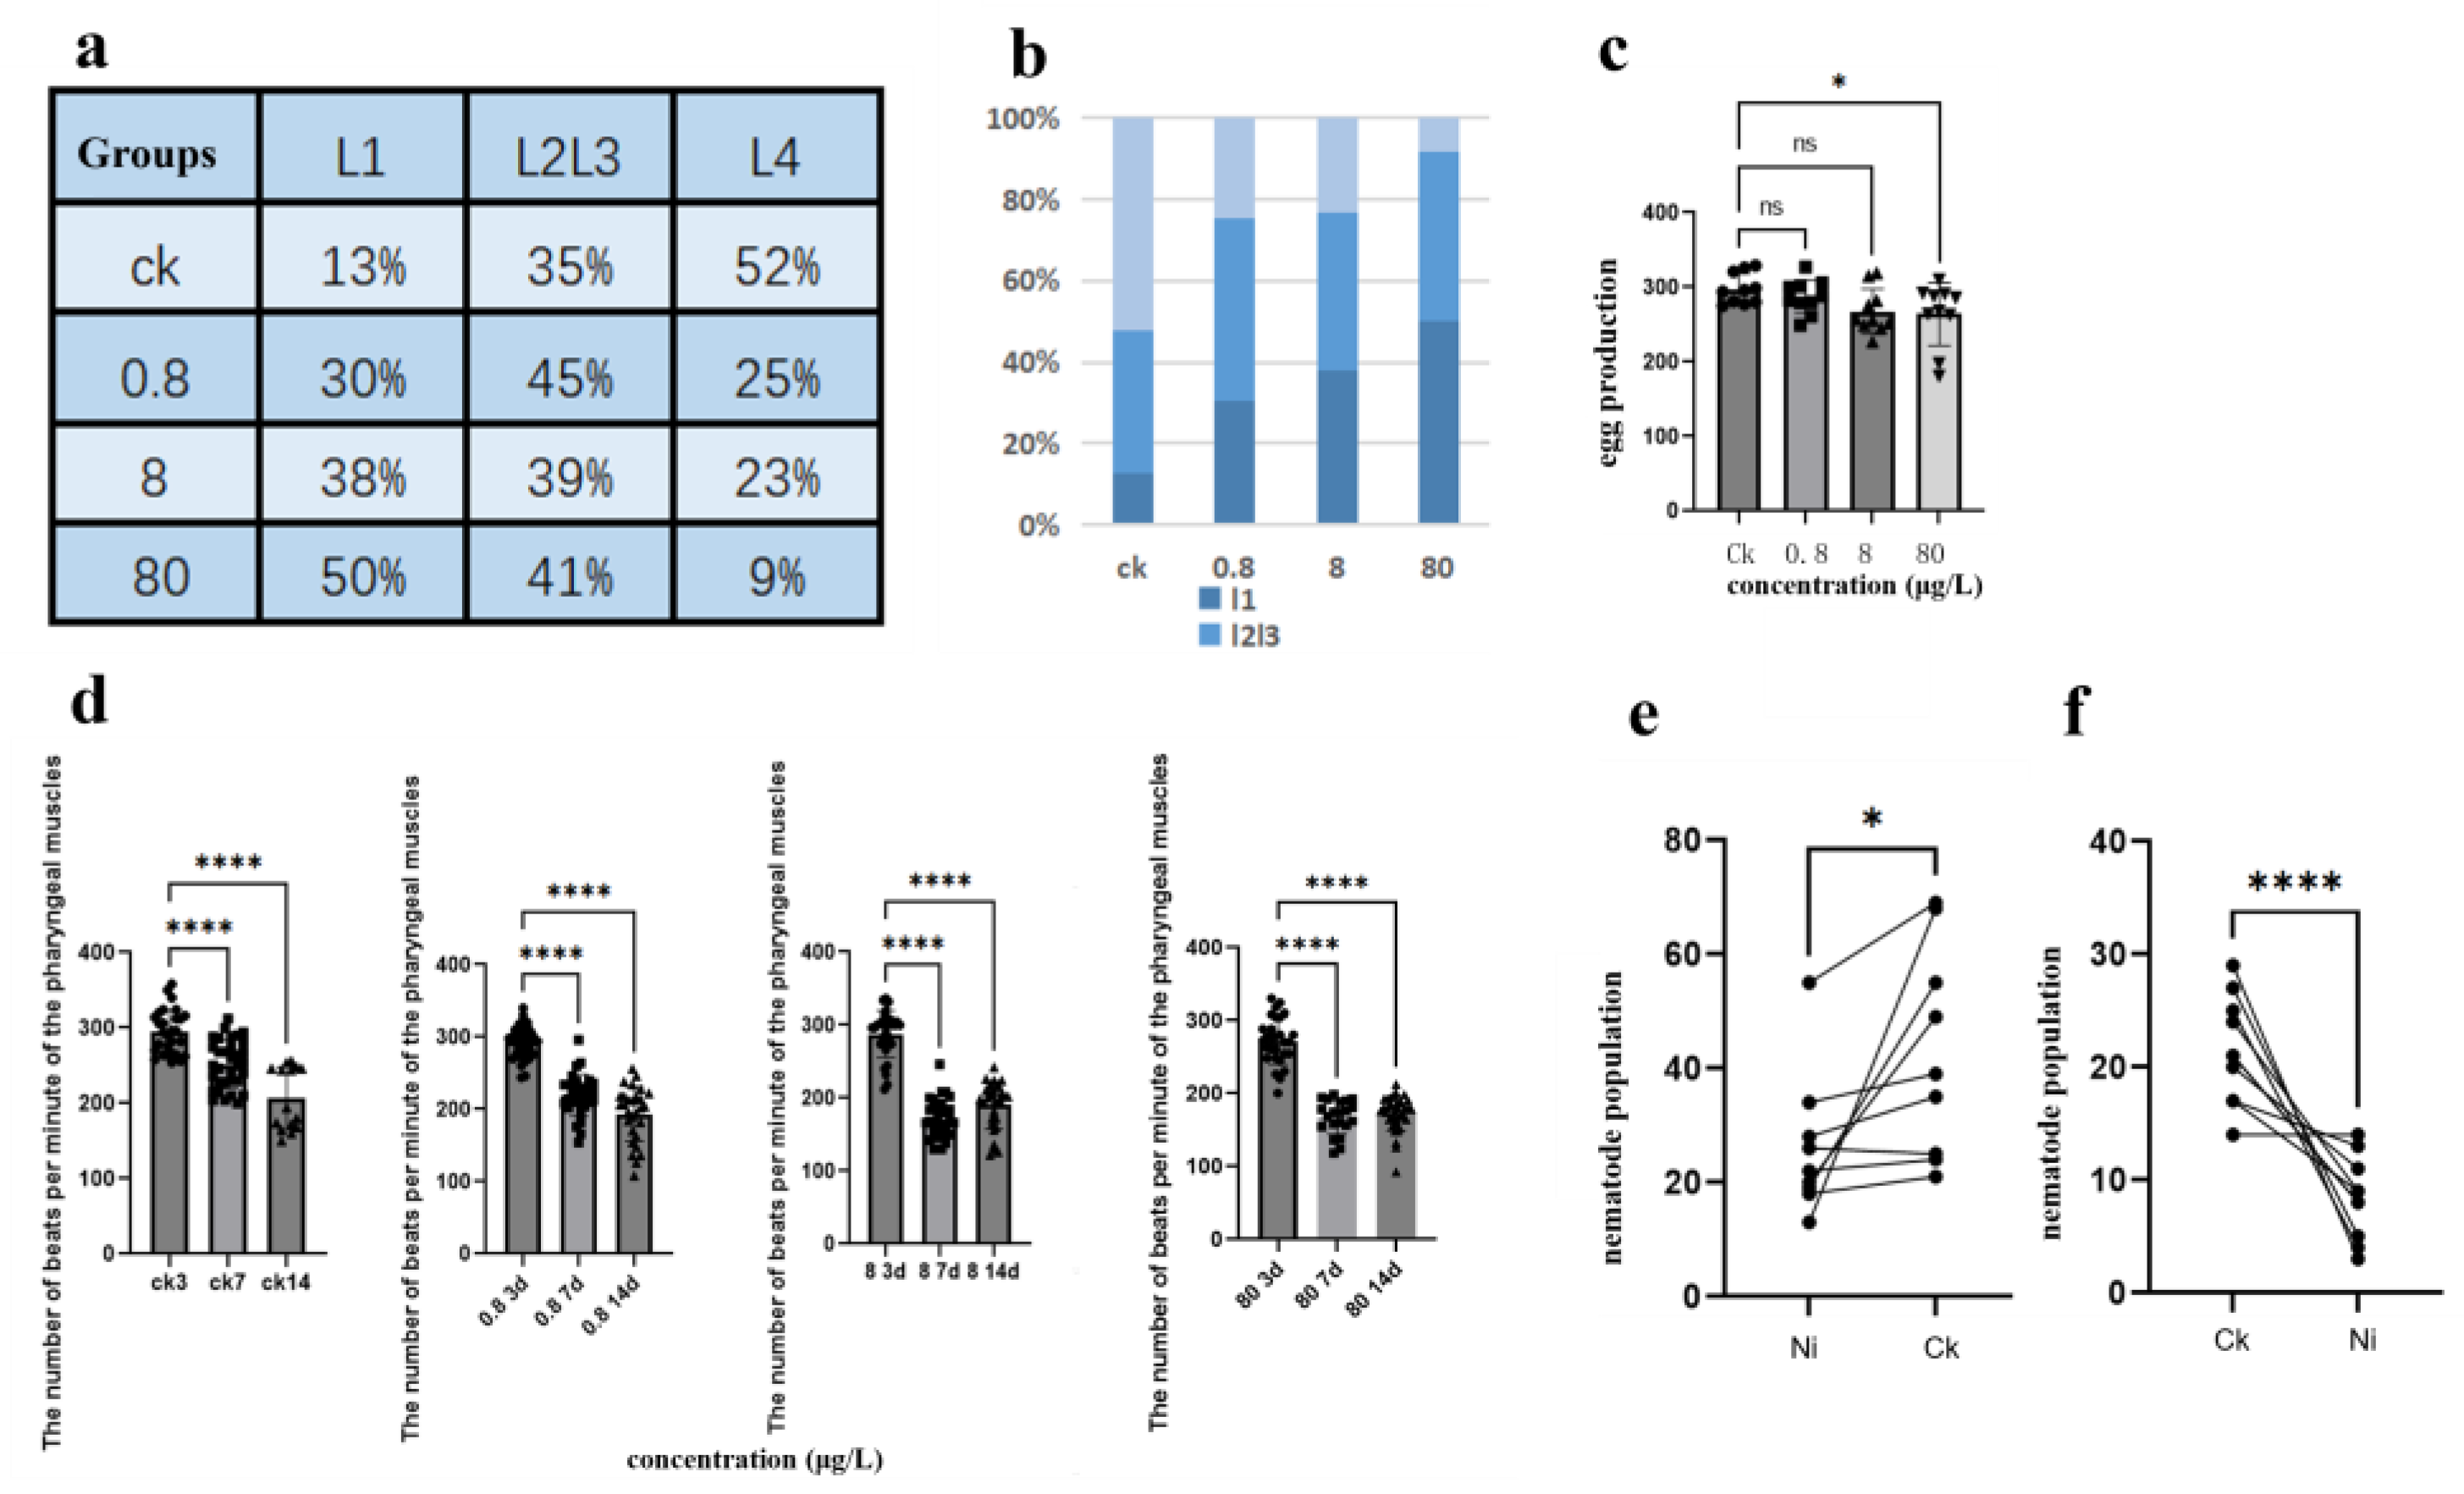
Figure 2.
Nickel-induced Caenorhabditis elegans longevity and accelerated senescence (a) Survival kinetics and lifespan analysis. Survival curves showing dose-dependent mortality under chronic nickel exposure (0, 0.8, 8, 80 μg/L). Mean lifespan decreased from 24.5 ± 1.2 days (control, n=51) to 23.1 ± 1.1 days (0.8 μg/L, n=56), 23.5 ± 1.0 days (8 μg/L, n=53), and 24.3 ± 1.3 days (80 μg/L, n=56). Log-rank test revealed non-monotonic mortality patterns (χ² = 18.7, p < 0.001), with paradoxical longevity at 80 μg/L potentially reflecting hermetic responses. (b) Lipofuscin accumulation as an aging biomarker. Fluorescence quantification of age-pigment accumulation in nickel-exposed worms: Control (ns): Baseline fluorescence (1.0 ± 0.1 AU).80 μg/L Ni (*): 2.3-fold increase (2.3 ± 0.2 AU, p < 0.05 vs control). Linear regression: R² = 0.89 between nickel concentration and lipofuscin intensity.
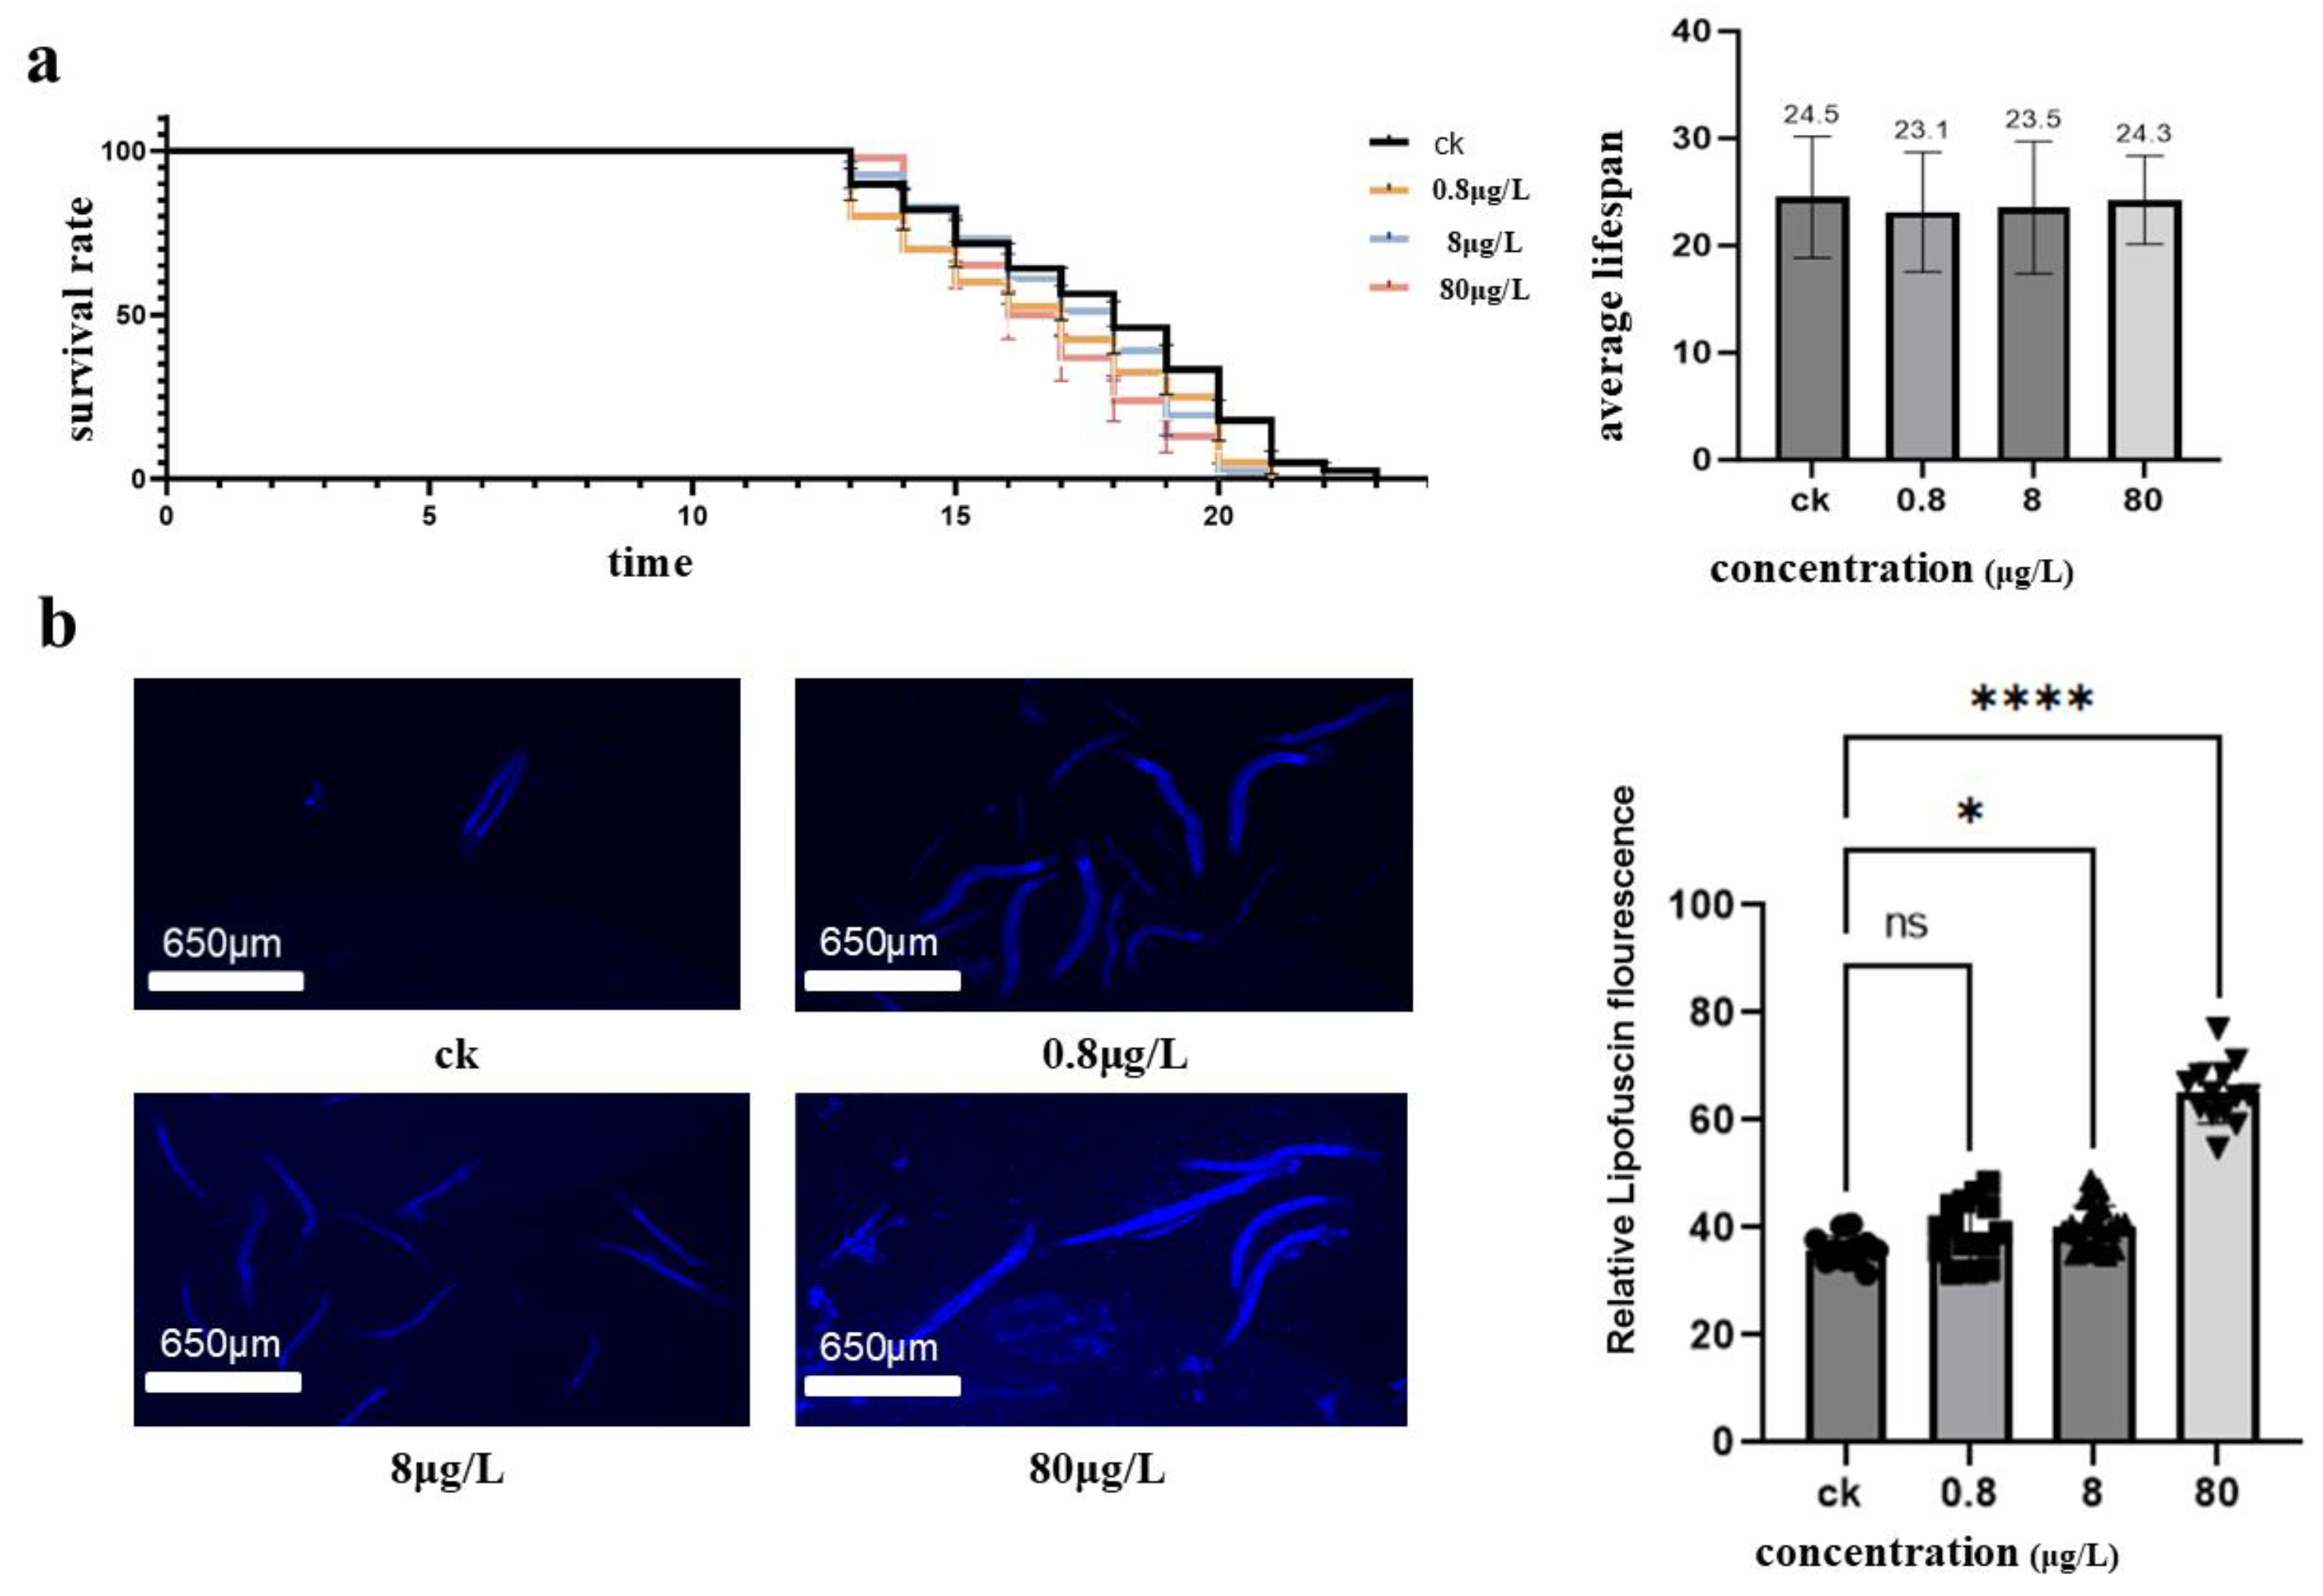
Figure 3.
Differences in gene expression induced by different concentrations of nickel (a)Principal Component Analysis (PCA):Multivariate separation of transcriptomes along PC1 (32.55% variance) and PC2 (21.38%), revealing distinct clustering of control (CK), 8 μg/L (Ni8), and 80 μg/L (Ni80) groups. Ellipses mark 95% confidence intervals. (b) DEG Distribution: Bar plot quantifying upregulated (red), downregulated (blue), and total DEGs across comparisons (c) Venn Analysis: Intersection of DEG sets identified 151 conserved genes across doses (hypergeometric test, p < 0.0001), including oxidative stress responders (sod-3, ctl-2) and epigenetic regulators (hda-1) (d) Volcano plot of 8 μg/L vs. control (CK) group comparison.(e) Volcano plot of 0.8 μg/L vs. control (CK) group comparison.
Disclaimer/Publisher’s Note: The statements, opinions and data contained in all publications are solely those of the individual author(s) and contributor(s) and not of MDPI and/or the editor(s). MDPI and/or the editor(s) disclaim responsibility for any injury to people or property resulting from any ideas, methods, instructions or products referred to in the content. |
© 2025 by the authors. Licensee MDPI, Basel, Switzerland. This article is an open access article distributed under the terms and conditions of the Creative Commons Attribution (CC BY) license (https://creativecommons.org/licenses/by/4.0/).
Copyright: This open access article is published under a Creative Commons CC BY 4.0 license, which permit the free download, distribution, and reuse, provided that the author and preprint are cited in any reuse.


