
Submitted:
19 March 2025
Posted:
20 March 2025
You are already at the latest version
Abstract
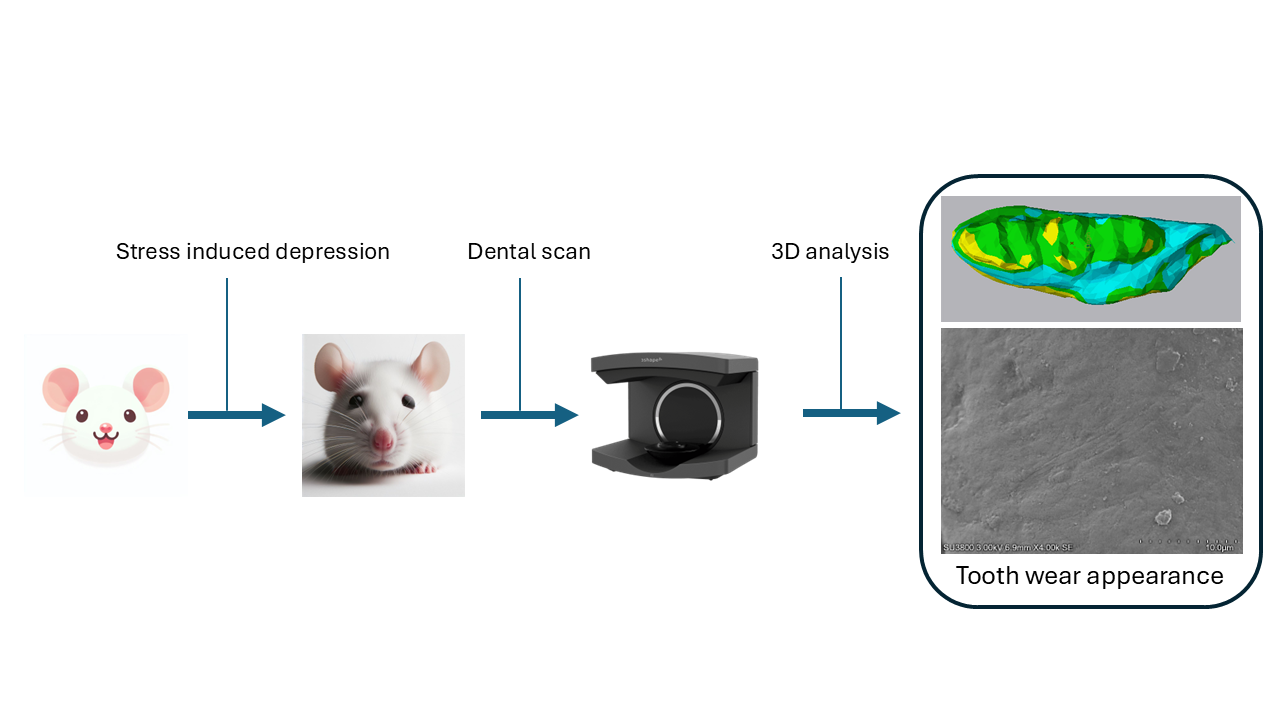
Background: In addition to behavioral and biochemical abnormalities, a parafunction associated with temporomandibular joint disorders (TMD) resulted in stress-induced depression in rats. By exploring how chronic stress influences molar-wear in rodents, providing insights into the understanding of depression, TMD, and oral health. This study aimed to conduct a three-dimensional (3D) analysis of first molar wear in an animal model of depression, by comparing molar attrition and cusp variation between stressed male rats and control groups. Methods: After a validated model of depression in male rats, we obtained 3D scans of lower molars to analyze wear patterns. The 3D analysis was applied to quantify cusps volume and the difference in first molar cusp morphological structure. The data were then compared to identify significant morphological differences between groups side-by-side. Results: The analysis revealed the reduction of cusps volume in the depression groups. Rats exposed to depression exhibited significantly greater occlusal table wear than their control counterparts (p < 0.05). Conclusions: As dentistry moves towards greater digital imaging, understanding the impact of psychological factors on TMD becomes increasingly necessary. This study demonstrates that chronic stress can lead to significant tooth wear, suggesting the occurrence of bruxism, leading to TMD cause by parafunction.
Keywords:
depression
; restrain stress
; tooth wear
; bruxism
; temporomandibular disorder
; dental digital scanner
; three-dimensional analysis
1. Introduction
Depression, a condition often associated with adulthood, is increasingly recognized as a significant issue among younger populations. The 2021 National Survey on Drug Use and Health in the USA revealed a concerning trend: out of 21.0 million adults, the prevalence of adults with a major depressive episode was highest among individuals aged 18-25 (18.6%) [1]. Depression also affects approximately 3.8% of the global population, with 5% of adults experiencing the condition, estimated 280 million individuals worldwide are living with depression [2]. Additionally, the World Health Organization report further emphasizes the gravity of this issue, ranking depression as the second leading cause of disability worldwide [3].
Biological, psychological, social, and environmental abnormalities are potential factors contributing to the development of depression. Interestingly, chronic stress can activate the hypothalamic-pituitary-adrenal (HPA) axis, resulting in sustained elevations of cortisol in humans and corticosterone in rodents, both of which are commonly referred to as stress hormones. Elevated levels of these stress hormones can have widespread effects on various physiological systems, playing a crucial role in maintaining homeostasis and supporting the proper functioning of multiple organ systems [4]. These demonstrate their effects extend beyond mental well-being, influencing overall health through various physiological mechanisms.
In depression, the complex interplay between mental and physical health has significant implications for oral health [5,6]. Studies have shown that depression can affect oral tissues, potentially leading to various oral health issues and temporomandibular joint disorders (TMD) [7]. The finding from research using rat models indicates that depressive states can induce inflammation in the temporomandibular condyle [8], mirroring the TMD observed in human patients. This finding underscores the intricate connection between mental health and oral health, suggesting that the effects of depression may manifest in uncertain ways.
Parafunctional habits, characterized by abnormal and repetitive behaviors beyond typical oral functions. The most common manifestations are bruxism and clenching, occurring both during sleep and waking hours. These habits are often associated with tooth wear, altered muscle function, and changes in temporomandibular joint dynamics, however, the exact nature of these relationships remains a subject of ongoing study [9]. While there are no definitive indicators for bruxism in patients, studies have suggested a potential link between this condition and depression such as individuals with bruxism tend to exhibit higher levels of depression compared to those without [10]. Yet, it remains unclear whether the observed TMD originates from abnormal inflammatory responses or from parafunctional habits influenced by depressive states.
Currently, bruxism detection can be accomplished through both conventional and digital impressions. A comparative in vitro study evaluating Three-dimensional (3D) analysis accuracy demonstrated that digital impressions of the full arch are a reliable alternative to conventional methods [11]. With advancements in digital dentistry, 3D analysis has also shown promise in assessing occlusal tooth wear especially for the clinical evaluation of posterior tooth wear, it has proven to be a reliable tool for comparison [12,13]. This advancement in dental 3D scan shed light to the application of detecting bruxism in both human and animal study.
The complex interplay between stress-induced depression and bruxism continues to be a topic of debate in the scientific community. Human studies face inherent limitations due to uncontrollable factors, making it challenging to draw definitive conclusions. To address these gaps in our understanding, a study using an animal model was conducted to investigate the relationship between depression and bruxism, examining the wear patterns of lower molars in these rats. This approach allows us to control variables that are difficult to manage in human studies, potentially offering new insights into the mechanisms linking mental health and oral health.
By exploring these connections in a controlled environment, we aim to determine the microstructural changes of lower molars in rats exposed to stress-induced depression by using a method of 3D analysis via dental scanner. Our findings potentially inform future strategies for diagnosis, prevention, monitoring, and treatment of depression and TMD in clinical settings.
2. Materials and Methods
2.1. Animals Model
The animal protocols employed in this study were approved by the Institutional Animal Care and Use Committees of Thammasat University and Khon Kaen University. All experimental procedures adhered to the guidelines set forth in the National Research Council's Guide for the Care and Use of Laboratory Animals and were conducted in full compliance with relevant ethical standards for animal research (IACUC-KKU-39/63). The experimental timeline is shown in Figure 1.
2.2. Body Weight, Food, and Water Measurements
Weight measurements were recorded daily using a digital weighing scale for each rat to monitor changes over the 14-day period. Weekly, each rat was placed in metabolic cages for 24 hours. At the end of this period, the remaining food and water were collected and weighed. The amount of food and water consumed was determined by subtracting the remaining quantities from the initial amounts provided.
2.3. Stress-Induced Depression
Sixteen male Wistar rats, 8 weeks old and weighing 180 to 200 g, were purchased from Nomura Siam International (Bangkok, Thailand) and used in the study. The rats were randomly divided into 2 groups (n = 8 in each group), comprised of a control group and restraint stress-induced depression group. Each rat was subjected to being immobilized in a 24 × 6 cm transparent plastic cylinder fixed with plastic tape for 2 h/day, 7 days/week for 2 weeks regarding to our previous study [8,14]. Briefly, a 1-cm hole was made at the end of the cylinder for breathing, and the restraint stress procedure was performed separately from the controls in a quiet room daily to avoid any confounding factors. On days 15 and 16, the behavioral test was performed to evaluate pre-training and examine depressive-like behaviors using the forced swimming test. All rats were fed standard chow rodent food and had free access to the diet and distilled water. At the end of the study, all rats were euthanized under deep anesthesia by 5% isoflurane. The adrenal glands were weighed, and skull samples were collected. The skulls, including the mandible with all lower molars, as well as the adrenal glands, were fixed in 4% paraformaldehyde. The lower jaw with molars were preserved in 4 ◦C for 3D scan and acquired data for cusps wear analysis.
2.4. Forced Swim Test (FST)
The FST is a hallmark of depressive-like behavior in rodents and consists of training and testing sessions on two consecutive days. The rats had an initial 15-min swimming session for training purposes with no data collection. After the first 15-min swim sessions on day 15, the rats were removed from the cylinders and dried with towels before being returned to their cages. On day 16, a 5-minute test was performed, and the rats' behavior was digitally recorded. The FST was conducted by placing rats in individual glass cylinders (45 cm tall and 20 cm in diameter) containing 25 ◦C tap water [8]. In experiments, infrared video cameras were recorded for post-recording measurements of the number and duration of swimming behavior, climbing, immobility behavior, and the number of fecal pellets. An increase in immobility duration and fecal pellet count indicated heightened depression-like behaviors and stress responses in rats [15,16].
2.5. Urinary Corticosterone Hormone Assay
After the final stress induction session on Day 14, the rats were placed in metabolic cages (model 3700M071-01CS; Tecniplast, Varese, Italy) for 12 hours (Day 15) to collect urine, prior to undergoing the FST on Day 16. The assessment of urine corticosterone (CORH) can be a valid and sensitive biomarker for both physiological and pharmacologically induced stress [16,17,18]. The urine samples were then centrifuged at 2500 rpm for 10 minutes. After centrifugation, the urine was isolated and stored at -20°C for subsequent CORH analysis using a commercially available enzyme immunoassay kit (Immunodiagnostic Systems Ltd, Tyne and Wear, UK). All serum samples were analyzed in duplicate, and mean values were calculated.
2.6. Adrenal Preparation and Histological Analysis
At the end of the study, the adrenal glands were cleaned, and fat adhesions were removed. After that, they were weighed (mg) relative to body weight (g), as per the previous study [19]. Adrenal glands were dissected, fixed in 4% paraformaldehyde, and processed for histological analysis. The tissue was embedded in paraffin, sectioned into 5 μm thickness, and stained with Hematoxylin and Eosin (H&E). H&E staining highlights the structural components of the adrenal gland, including the cortex and medulla [20]. The cortex is divided into three zones, with the zona fasciculata being responsible for corticosterone production. Histological analysis involved measuring the thickness of the cortex and medulla, as well as the zona fasciculata, by examining the distinctive cellular arrangement under the light microscope (Nikon eclipse Ts2-Fl, BX, Olympus, Japan. The thickness of the zona fasciculata can be an indicator of corticosterone production in stress responses, with hypertrophy suggesting increased hormone synthesis. Quantitative measurements of these zones were performed using NIS-Element BR version 4.0 (Nikon, Tokyo, Japan) image analysis software to assess structural changes, which may correlate with the physiological response to stress or other experimental conditions.
2.7. 3D Model Acquisition
The bilateral mandibles were collected and stabilized in the sample holder for 3D scan. The lower molars and surrounding mandibular bone were scanned at the end of stress-induced depression experiment using a laboratory 3D surface scanner by structured light/Blue LED Multiline (Dental laboratory 3D scanner E2, 3Shape, Copenhagen, Denmark) to obtain the highest quality of anatomical shape of all molars as the 3D Standard Tessellation Language (STL) models. The digitized 3D models were thereafter imported and analyzed as 3D volume analysis and each matched objects M1 cusp point measurement.
2.8 3D Cusps Morphologic Analysis
The scanning of each sample was performed with the mean accuracy of 10 μm. The scan projections were normalized and used in object reconstruction (Autodesk Meshmixer software, San Francisco, California, U.S.) to obtain the best matched size. The comparison between the 2 samples was matched together and the resulting objects of the samples were presented and visualized in 3D by using the 3D compare function in Geomagic Control X software (Australian National University, Canberra, Australia). Then, the volume of the cusp tips from each 3D model was assessed using the “Measure Volume” function. The volume measurements for each model were then exported as numerical data for further statistical evaluation. Therefore, the parameters such as the cusp tip landmarks were compared to analyze the position of cusp tips by using the “Local Average Tagging” function. The 3D difference of each point, as referenced from the cusp tip landmarks, was exported as numerical data for subsequent statistical analysis.
2.9. Scanning Electron Microscopic (SEM)
The molars with attached mandible were disinfected in 0.5% sodium hypochlorite. The microstructure was firstly visualize using Microscope. Then, these samples were processed by air dried, mounted on standard SEM stubs using a conductive adhesive, and gold coated (Emitech K-250 sputter coater). All the specimens were then observed on an FEI XL30 FEG (FEI, Eindhoven, The Netherlands) high-resolution SEM fitted with an Everhart-Thornley detector for secondary electrons and a coaxial detector for backscattered electrons. All micrographs were directly obtained in digital form as1424-by-968 pixel, 8bpp TIFF files. For each lesion the location and shape of the defect and the microwear features of the enamel and dentin were analyzed and photographed at a magnification ranging from 25x to 5000x. Data analysis involves comparing two main groups—the control and depression groups—separated by side (left and right), resulting in four sub-groups: Right Depression, Left Depression, Right Control, and Left Control (n=8 each).
2.10. Statistical Analysis
All cusp points difference data are presented as the mean ± standard deviation (S.D.), as indicated in the figure legends and tables. Statistical analyses were performed using the SPSS version 23 software (SPSS Inc., Chicago, IL, USA). The procedures for quantifying parameters from the 3D objects analysis were all performed triplicate in a blinded fashion with no knowledge of the groups. Differences in cusp volume among different rats were tested in a paired manner through t-test after the normal distribution was done by the Shapiro–Wilk test. Potential effects of cusp point differences were explored through visual inspection of relevant Box and Whisker plot and statistical analysis of the difference between two means divided by a standard deviation using Cohen’s d. The data were double-checked by another investigator (PP). All data acquisition and analysis were completed blindly, and each experiment was performed by different observers independently (PT, PJ, CL). Results with p < 0.05 were considered significant.
3. Results
3.1. Physical and Behavioral Responses in Stress-Induced Depression
At the start of the study, there were no differences in body weight between the groups. However, after 2 hours per day of stress exposure for 14 days, rats in the depression group exhibited a lower final body weight compared to the control group. In the depression group, restraint stress significantly decreased daily body weight gain (3.30 vs. 3.98 g, p < 0.01) and daily food intake accordingly (23.19 vs. 25.63 g, p < 0.05), as shown in Figure 2. These results indicate the impact of stress on feeding behaviors, suppressing eating behavior and affecting physical growth in stressed male rats. As expected, stress induction affected daily food intake, with reduced food consumption observed in the stressed group (p < 0.05), while no changes were noted in water intake, as presented in the daily intake data.
Furthermore, the wet adrenal gland weight relative to final body weight was significantly increased, possibly due to rich vascularization and well-functioning adrenal tissues supporting corticosterone synthesis and release. Urinary CORT levels in the depression group were elevated (209.75 ng/mL vs. 159.25 ng/mL, p < 0.01). However, adrenal gland thickness showed a tendency to increase, particularly in the zona fasciculata (p = 0.085), possibly due to an increase in adrenal cell volume, which may contribute to the overall thickening of the adrenal cortex (Figure 3).
Additionally, stressed rats showed increased FST immobility (50.20 ± 21.38 s, p < 0.05) and a significant reduction in FST swimming (88.91 s vs. 56.94 s, p < 0.01), suggesting that this group of rats exhibited depression-like behavior without any changes in climbing activity (Figure 4). Furthermore, the number of fecal pellets was higher in depressed rats, indicating a heightened stress response compared to the control group (p < 0.001). These results indicate that immobilization for 2 h/day over 14 days induced depression-like behaviors and exacerbated the consequences of stress-induced depression in male rats.
3.2. 3D Tooth Wear Analysis
The lower molars result after the best-fit merging of 2 objects showed that the non-difference area (green color, the difference < 0.2 mm) has more extensive covering almost all the tooth surface, suggesting that the control group has less variation of cusp change than the depression (Figure 5A and B). Nevertheless, the molar surface compared between the control group and depression group was changed especially on the cusp tip area (yellow color) (Figure 5C).
3D cusp volume analysis showed that there were significant differences in mean total cusp volume between groups (p < 0.001) on both left and right side (Figure 6). On the left side, the volume of molars was 1.03 ± 0.12 mm3 in the control group and 0.77 ± 0.11 mm3 in the depression group. The right side also showed the same trend of difference which was 1.03 ± 0.11 mm3 in control group and 0.82 ± 0.08 mm3 in the depression group.
The distance differences analysis of six landmark points merging between 2 groups one by one on every rat (Figure 7A) revealed that there were statistically significant differences among the distance differences in six landmarks (p <0.001) (Figure 7B). Specifically, the largest differences were observed between the cusp 3 and 6 on the left side, and cusp 3 and 5 on the right side with Cohen’s d values reflecting large effect sizes of 0.8 and 0.7, respectively.
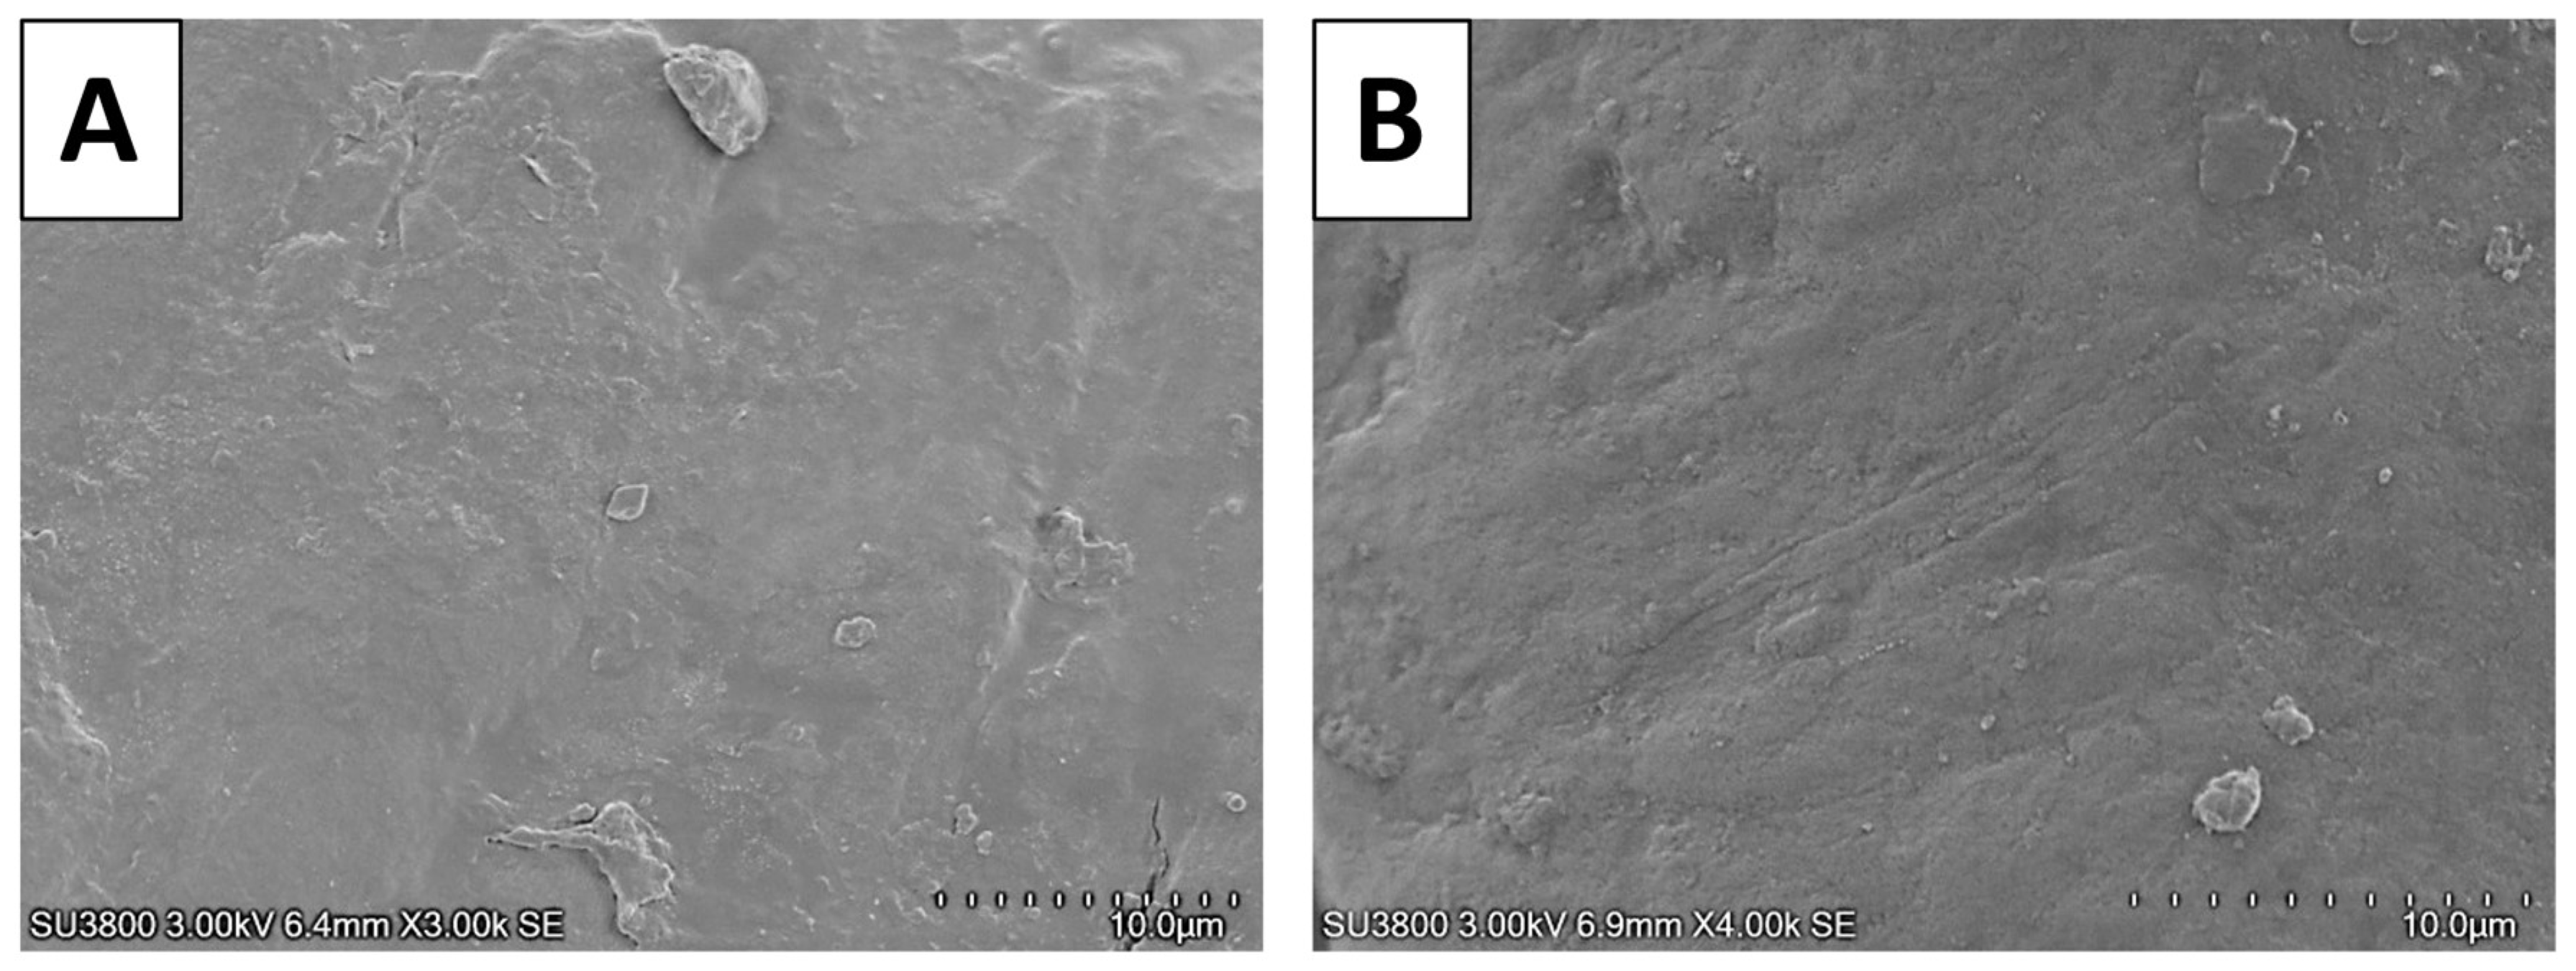
3.3. Microscopic Analysis
The cusp areas, suspected to be subjected to wearing forces, were further investigated using SEM. In the macroscopic view, the overall cusps appeared quite similar between the two groups. Some areas of the cusps in the depression group appeared slightly more polished than those in the control group (data not shown). Interestingly, in the depression group, scratch lines were particularly evident at cusps 5 and 6 (Figure 8).
4. Discussion
Depression is a multifaceted psychiatric disorder that affects millions of individuals worldwide. The complexity of depression, compounded by its heterogeneous nature, necessitates a robust modelling approach to accurately reflect human pathology. Understanding its underlying mechanisms is crucial for wholistic healthcare. Animal models, particularly rodent models, have been extensively used to study depression due to ethical and practical limitations in human research. The Wistar rat strain exhibits hypersensitivity to stress and displays depression-like behaviors, such as lower food consumption, elevated adrenal gland weight, increased levels of serum and urinary corticosterone, and reduced nocturnal activity, similar to those observed in humans, suggesting that it could serve as a valuable model [5,8,14], making it a useful model for translational studies and novel intervention development, paralleling findings in human depression. Hence, the utility of rat models in studying the neurobiological aspects of stress and depression is documented [18,21]. While ethical constraints limit direct investigations in humans, rodents offer a valuable framework for understanding the underlying mechanisms of these conditions.
Our study found that rats which received stress stimulated exhibited the sign of depression as indicated by the FST and HPA axis responses, including alterations in adrenal weight and urinary corticosterone levels. The previous study of this stress-induced depression model showed that this group has the condylar defects represented TMD sign, leading to the exploration of the path to figure how TMD occurred [8]. Based on the recent knowledge, psychological depression possibly leads to the coping of masticatory muscles and bruxism as a means of relieving psychological tension [21,22]. Chewing is an effective behavior for coping with anxiety via the existing pathway [23], plus the stress can be alter by the activity of the HPA axis and autonomic nervous system [24]. The mechano-electrochemical signals inspired our study to further conduct and investigate the remnant of mechanical mechanism extends to TMD cause [23]. For examples, the force of occlusion by anterior elevation and sustained joint loading possibly causing TMD [25]. Hence, investigating the tooth wear could explain the TMD lesion by the overuse of chewing respectively.
Recent clinical studies investigating the association between tooth wear and bruxism remain inconclusive [26]. Based on the findings from human and animal studies, the mechanism of sleep bruxism is still uncertain [27]. The higher prevalence and increased severity of tooth wear among male adolescents may be influenced by steroid hormones [28]. Animal models offer a more controlled environment for exploring the causes of TMD, allowing for the regulation of variables such as diet, environment, and corticosteroid hormone. Previous research has demonstrated that stress-induced bruxism can lead to physiological effects, including gastric ulcers [29]. Additionally, stress exposure in rats has been linked to heightened mechanical sensitivity of joint [30], and low occlusal loading in rats has been shown to impair neuromuscular behavioral development [31]. However, measuring masticatory muscle activity in rats may not fully represent the psychological aspects of depression in humans as the equipment invasively attached to animals. Indirect analysis of murine molars is a viable approach, as these teeth are more comparable to human molars than murine incisors, which are capable of continuous regeneration [32]. Our findings suggest that stress-induced depression, which could contribute to TMD, may serve as a novel model for studying bruxism through the observed tooth wear.
In our study, we applied this method to investigate differences between two groups of rats, focusing on total cusp volume and the cusp height, which showed higher variation on the right side. The observed molar cusp loss in the depression group suggests that tooth wear, potentially linked to bruxism-like behavior, occurred in these animals [11,12,13]. The preferred chewing side in rats has been explored through various studies, revealing a tendency towards right-side preference, with 72.7% of rats exhibiting a right-paw preference [33]. This preference for the right side may be linked to lateralization in brain function, similar to handedness in humans [34]. A significant majority of individuals exhibit a preferred chewing side, with studies showing that over 90% of subjects favor unilateral chewing [35]. This preference can lead to uneven wear on teeth, as the side used more frequently experiences greater stress and wear. Chewing side preference is associated with structural changes in the temporomandibular joint (TMJ), including altered condylar shape morphology and position [36,37]. Habitual unilateral chewing may influence dental health and facial symmetry, leading to asymmetries in the TMJ and facial structure [38]. Previous studies have found that TMD presents more severe defects on the left side [8], indicating that our findings of tooth wear may be a leading cause of TMD.
In the depression group, SEM observations revealed scratch lines at the cusp tips. Vertical scratches on tooth wear facets are significant indicators of the mechanical and functional aspects of dental wear. This phenomenon is influenced by various factors in humans, including masticatory patterns, dietary habits, and the interplay of different wear mechanisms. Tooth grinding contributes to the development of vertical scratches, indicating excessive wear [39]. In cases of tooth attrition in humans, the enamel surface appears smooth and polished with stripes and striations compatible with protrusion and lateral occlusal movements microscopically [40]. Identifying vertical scratches can aid in assessing the risk of further tooth wear and guide preventive measures.
Additionally, a narrative overview study suggested that sleep bruxism associated with tooth wear [41]. Currently, monitoring the progression of tooth wear clinically is possible through an intraoral scanner. The study by Diaz-Flores showed the promising tooth wear detection by full-arch dental scan after 1 year [42]. Monitoring tooth wear 24 and 36 months showed the buccal load-bearing cusps had loss value among participants [43,44]. Recent advancements have enabled the monitoring of tooth wear progression using artificial intelligence (AI) integrated with intraoral scanners [45]. This technological breakthrough translates bench side research into bedside applications, illuminating new avenues for assessing and managing tooth wear in clinical practice.
While our study identified distinct molar tooth wear in rats with stress-induced depression, certain limitations should be acknowledged. Differences in anatomical jaw movement and anatomical cusp between clinical and pre-clinical models [46], as well as the complexity of depression in real-life situations, pose challenges for direct comparisons. Our findings suggest that bruxism may play a role in the development of TMD; however, this interpretation should be approached with caution, as we did not investigate immune system involvement. Despite these limitations, the non-invasive, indirect method we employed effectively captured parafunctional behavior without impacting the rats during experimentation. Future studies could benefit from using continuous video monitoring incorporated with AI to track jaw movements over 24 hours, a technique applicable to both clinical and pre-clinical research. This advancement would enhance our understanding between sleep and awake bruxism associated with depression. While advancements in treatments for depression, such as transcranial magnetic stimulation [47], show promising results, our findings contribute to preventive strategies aimed at reducing the occurrence of TMD and highlight the way for monitoring depressive symptoms through a dental scanning perspective.
5. Conclusions
In conclusion, this study demonstrates that 2 hours per day of stress-induced depression over 14 days in male rats presents characteristics and symptoms of depression, with physical, biochemical, and behavioral changes. The deteriorative effects of depression are also associated with significant molar tooth wear, suggesting a potential link between bruxism-like behavior and the development of TMD. While the controlled pre-clinical environment provides a clearer understanding of stress-related tooth wear, further research is needed to investigate the effects of administering neurobioactive or antidepressant treatments on oral health. These results shed light on the future monitoring of depression levels and associated tooth wear patterns. These findings contribute to a better understanding of the impact of psychological stress on oral health and may offer new avenues for diagnosing and managing conditions like TMD through digital imaging in clinical settings.
Author Contributions
Conceptualization, S.M., P.P., and S.L.; methodology, S.M., P.P., P.T., P.J., C.L, P.C., T.N., and S.L.; software, P.T., P.J., and C.L; validation, P.P, C.L., S.L., and S.M.; formal analysis, P.P., P.T., P.J., C.L, P.C., T.N. and S.L.; investigation, P.T., P.J., C.L, and P.C.; resources, S.M., P.P., P.C., and S.L.; data curation, S.M., P.P. and P.C.; writing—original draft preparation, S.M. and S.L.; writing—review and editing, S.M., P.P., P.T., P.J., C.L, and S.L.; visualization, S.M., P.P., and S.L.; supervision, S.M., P.P., and S.L.; project administration, P.P.; funding acquisition, S.L. and S.M. All authors have read and agreed to the published version of the manuscript.
Funding
This research was funded by Young Researcher Development Project of Khon Kaen University Year 2020, and was supported by grants from RGJ Advanced Program, Thailand Science Research and Innovation (TSRI; RAP61K0020).
Institutional Review Board Statement
The study was conducted according to the guidelines of the Declaration of Helsinki and approved by the Institutional Review Board of the Institutional Animal Care and Use Committee of Thammasat University and Ethics Committee of Khon Kaen University (IACUC-KKU-39/63, 08.04.2020).
Informed Consent Statement
Not applicable.
Data Availability Statement
The original contributions presented in this study are included in the article. Further inquiries can be directed to the corresponding authors.
Conflicts of Interest
The authors declare no conflict of interest.
References
- Major Depression - National Institute of Mental Health (NIMH) Available online:. Available online: https://www.nimh.nih.gov/health/statistics/major-depression (accessed on 5 March 2025).
- Institute for Health Metrics and Evaluation. Global Health Data Exchange (GHDx). Available online: https://vizhub.healthdata.org/gbd-results (accessed on 5 March 2025).
- Evans-Lacko, S.; Aguilar-Gaxiola, S.; Al-Hamzawi, A.; Alonso, J.; Benjet, C.; Bruffaerts, R.; Chiu, W.T.; Florescu, S.; de Girolamo, G.; Gureje, O.; et al. Socio-Economic Variations in the Mental Health Treatment Gap for People with Anxiety, Mood, and Substance Use Disorders: Results from the WHO World Mental Health (WMH) Surveys. Psychol Med 2018, 48, 1560–1571. [Google Scholar] [CrossRef] [PubMed]
- Knezevic, E.; Nenic, K.; Milanovic, V.; Knezevic, N.N. The Role of Cortisol in Chronic Stress, Neurodegenerative Diseases, and Psychological Disorders. Cells 2023, 12, 2726. [Google Scholar] [CrossRef] [PubMed]
- Lapmanee, S.; Supkamonseni, N.; Bhubhanil, S.; Treesaksrisakul, N.; Sirithanakorn, C.; Khongkow, M.; Namdee, K.; Surinlert, P.; Tipbunjong, C.; Wongchitrat, P. Stress-Induced Changes in Cognitive Function and Intestinal Barrier Integrity Can Be Ameliorated by Venlafaxine and Synbiotic Supplementations. PeerJ 2024, 12, e17033. [Google Scholar] [CrossRef] [PubMed]
- Tiwari, T.; Kelly, A.; Randall, C.L.; Tranby, E.; Franstve-Hawley, J. Association Between Mental Health and Oral Health Status and Care Utilization. Front Oral Health 2021, 2, 732882. [Google Scholar] [CrossRef]
- Bafageeh, F.; Loux, T. Depression Symptoms Linked to Multiple Oral Health Outcomes in US Adults. JDR Clin Trans Res 2025, 10, 64–73. [Google Scholar] [CrossRef]
- Songphaeng, T.; Lapmanee, S.; Bhubhanil, S.; Momdee, K.; Rojviriya, C.; Kitsahawong, K.; Chailertvanitkul, P.; Welbat, J.U.; Morkmued, S. Atomoxetine and Escitalopram Migrate the Derangement of the Temporomandibular Joint Morphologic and Histologic Changes in Rats Exposed to Stress-Induced Depression. J Oral Sci 2023, 65, 219–225. [Google Scholar] [CrossRef]
- Storari, M.; Serri, M.; Aprile, M.; Denotti, G.; Viscuso, D. Bruxism in Children: What Do We Know? Narrative Review of the Current Evidence. Eur J Paediatr Dent 2023, 24, 207–210. [Google Scholar] [CrossRef]
- Sánchez Romero, E.A.; Martínez-Pozas, O.; García-González, M.; de-Pedro, M.; González-Álvarez, M.E.; Esteban-González, P.; Cid-Verdejo, R.; Villafañe, J.H. Association between Sleep Disorders and Sleep Quality in Patients with Temporomandibular Joint Osteoarthritis: A Systematic Review. Biomedicines 2022, 10, 2143. [Google Scholar] [CrossRef] [PubMed]
- Onbasi, Y.; Abu-Hossin, S.; Paulig, M.; Berger, L.; Wichmann, M.; Matta, R.-E. Trueness of Full-Arch Dental Models Obtained by Digital and Conventional Impression Techniques: An in Vivo Study. Sci Rep 2022, 12, 22509. [Google Scholar] [CrossRef]
- Gkantidis, N.; Dritsas, K.; Ren, Y.; Halazonetis, D.; Katsaros, C. An Accurate and Efficient Method for Occlusal Tooth Wear Assessment Using 3D Digital Dental Models. Sci Rep 2020, 10, 10103. [Google Scholar] [CrossRef]
- Al-Seelawi, Z.; Hermann, N.V.; Peutzfeldt, A.; Baram, S.; Bakke, M.; Sonnesen, L.; Tsakanikou, A.; Rahiotis, C.; Benetti, A.R. Clinical and Digital Assessment of Tooth Wear. Sci Rep 2024, 14, 592. [Google Scholar] [CrossRef] [PubMed]
- Lapmanee, S.; Bhubhanil, S.; Sriwong, S.; Khongkow, M.; Namdee, K.; Wongchitrat, P.; Pongkorpsakol, P. Venlafaxine and Synbiotic Attenuated Learned Fearlike Behavior and Recognition Memory Impairment in Immobilized-Stressed Rats. Physiology and Pharmacology (Iran) 2023, 27, 171–181. [Google Scholar] [CrossRef]
- Pan, S.-Y.; Gu, Y.-R.; Zhao, G.; Wang, Y.; Qin, Z.-H.; Tang, Q.-Y.; Qin, Y.-Y. ; Li Luo, null NADPH Mimics the Antidepressant Effects of Exercise in a Chronic Unpredictable Stress Rat Model. Biochem Biophys Res Commun 2024, 731, 150360. [Google Scholar] [CrossRef]
- Becker, L.; Mallien, A.S.; Pfeiffer, N.; Brandwein, C.; Talbot, S.R.; Bleich, A.; Palme, R.; Potschka, H.; Gass, P. Evidence-Based Severity Assessment of the Forced Swim Test in the Rat. PLoS One 2023, 18, e0292816. [Google Scholar] [CrossRef]
- Lapointe, J.-M.; Snyder, P.A.; Reagan, W.J. Evaluation of Urinary Corticosterone as a Biomarker of Stress in Rats Using Fenitrothion as a Chemical Stressor. J Immunotoxicol 2016, 13, 386–392. [Google Scholar] [CrossRef]
- Lapmanee, S.; Charoenphandhu, J.; Teerapornpuntakit, J.; Krishnamra, N.; Charoenphandhu, N. Agomelatine, Venlafaxine, and Running Exercise Effectively Prevent Anxiety- and Depression-like Behaviors and Memory Impairment in Restraint Stressed Rats. PLoS One 2017, 12, e0187671. [Google Scholar] [CrossRef]
- Shan, T.; Ma, J.; Ma, Q.; Guo, K.; Guo, J.; Li, X.; Li, W.; Liu, J.; Huang, C.; Wang, F.; et al. Β2-AR-HIF-1α: A Novel Regulatory Axis for Stress-Induced Pancreatic Tumor Growth and Angiogenesis. Curr Mol Med 2013, 13, 1023–1034. [Google Scholar]
- Tseilikman, V.; Komelkova, M.; Kondashevskaya, M.V.; Manukhina, E.; Downey, H.F.; Chereshnev, V.; Chereshneva, M.; Platkovskii, P.; Goryacheva, A.; Pashkov, A.; et al. A Rat Model of Post-Traumatic Stress Syndrome Causes Phenotype-Associated Morphological Changes and Hypofunction of the Adrenal Gland. Int J Mol Sci 2021, 22, 13235. [Google Scholar] [CrossRef]
- Soto-Goñi, X.A.; Alen, F.; Buiza-González, L.; Marcolino-Cruz, D.; Sánchez-Sánchez, T.; Ardizone-García, I.; Aneiros-López, F.; Jiménez-Ortega, L. Adaptive Stress Coping in Awake Bruxism. Front. Neurol. 2020, 11. [Google Scholar] [CrossRef]
- Chemelo, V.D.S.; Né, Y.G. de S.; Frazão, D.R.; de Souza-Rodrigues, R.D.; Fagundes, N.C.F.; Magno, M.B.; da Silva, C.M.T.; Maia, L.C.; Lima, R.R. Is There Association Between Stress and Bruxism? A Systematic Review and Meta-Analysis. Front Neurol 2020, 11, 590779. [Google Scholar] [CrossRef]
- Xiao, F.; Hu, A.; Meng, B.; Zhang, Y.; Han, W.; Su, J. PVH-Peri5 Pathway for Stress-Coping Oromotor and Anxious Behaviors in Mice. J Dent Res 2023, 102, 227–237. [Google Scholar] [CrossRef] [PubMed]
- Kubo, K.; Iinuma, M.; Chen, H. Mastication as a Stress-Coping Behavior. Biomed Res Int 2015, 2015, 876409. [Google Scholar] [CrossRef]
- Zhang, Y.; Liu, Q.; Xu, X.; Zhou, P.; Zhang, H.; Yang, H.; Zhang, M.; Zhang, J.; Lu, L.; Liu, J.; et al. Long-Term Effect of Bilateral Anterior Elevation of Occlusion on the Temporomandibular Joints. Oral Dis 2022, 28, 1911–1920. [Google Scholar] [CrossRef]
- Bronkhorst, H.; Kalaykova, S.; Huysmans, M.-C.; Loomans, B.; Pereira-Cenci, T. Tooth Wear and Bruxism: A Scoping Review. J Dent 2024, 145, 104983. [Google Scholar] [CrossRef]
- Kato, T.; Higashiyama, M.; Katagiri, A.; Toyoda, H.; Yamada, M.; Minota, N.; Katsura-Fuchihata, S.; Zhu, Y. Understanding the Pathophysiology of Sleep Bruxism Based on Human and Animal Studies: A Narrative Review. J Oral Biosci 2023, 65, 156–162. [Google Scholar] [CrossRef] [PubMed]
- Buchhardt, J.; Kiess, W.; Körner, A.; Biemann, R.; Hirsch, C.; Child Study Team, L. The Influence of Steroid Hormones on Tooth Wear in Children and in Adolescents. J Clin Med 2022, 11, 3603. [Google Scholar] [CrossRef]
- Sato, C.; Sato, S.; Takashina, H.; Ishii, H.; Onozuka, M.; Sasaguri, K. Bruxism Affects Stress Responses in Stressed Rats. Clin Oral Investig 2010, 14, 153–160. [Google Scholar] [CrossRef]
- Huang, F.; Zhang, M.; Chen, Y.-J.; Li, Q.; Wu, A.-Z. Psychological Stress Induces Temporary Masticatory Muscle Mechanical Sensitivity in Rats. J Biomed Biotechnol 2011, 2011, 720603. [Google Scholar] [CrossRef]
- Aung, P.T.; Kato, C.; Fujita, A.; Abe, Y.; Ogawa, T.; Ishidori, H.; Okihara, H.; Kokai, S.; Ono, T. Effects of Low Occlusal Loading on the Neuromuscular Behavioral Development of Cortically-Elicited Jaw Movements in Growing Rats. Sci Rep 2021, 11, 7175. [Google Scholar] [CrossRef]
- Krivanek, J.; Soldatov, R.A.; Kastriti, M.E.; Chontorotzea, T.; Herdina, A.N.; Petersen, J.; Szarowska, B.; Landova, M.; Matejova, V.K.; Holla, L.I.; et al. Dental Cell Type Atlas Reveals Stem and Differentiated Cell Types in Mouse and Human Teeth. Nat Commun 2020, 11, 4816. [Google Scholar] [CrossRef]
- Güven, M.; Elalmiş, D.D.; Binokay, S.; Tan, U. Population-Level Right-Paw Preference in Rats Assessed by a New Computerized Food-Reaching Test. Int J Neurosci 2003, 113, 1675–1689. [Google Scholar] [CrossRef]
- Nissan, J.; Gross, M.D.; Shifman, A.; Tzadok, L.; Assif, D. Chewing Side Preference as a Type of Hemispheric Laterality. Journal of Oral Rehabilitation 2004, 31, 412–416. [Google Scholar] [CrossRef] [PubMed]
- Martins, F.L.P. de S.P.; Inete, M.B.; Souza, Y.D. do E.S.; Costa, R.L.V.; Gabbay, R.D.; Moraes, T.M.; Costa, V.V.L.; Paracampo, C.C.P.; Albuquerque, L.C. de; Gomes, D.L. Association between Self-Perception of Chewing, Chewing Behavior, and the Presence of Gastrointestinal Symptoms in Candidates for Bariatric Surgery. Nutrients 2024, 16, 1096. [Google Scholar] [CrossRef]
- Ma, J.; Wang, J.; Huang, D.; Wang, Z.; Hu, M.; Liu, H.; Jiang, H. A Comparative Study of Condyle Position in Temporomandibular Disorder Patients with Chewing Side Preference Using Cone-Beam Computed Tomography. J Oral Rehabil 2022, 49, 265–271. [Google Scholar] [CrossRef]
- Sritara, S.; Matsumoto, Y.; Lou, Y.; Qi, J.; Aida, J.; Ono, T. Association between the Temporomandibular Joint Morphology and Chewing Pattern. Diagnostics 2023, 13, 2177. [Google Scholar] [CrossRef]
- Tiwari, S.; Nambiar, S.; Unnikrishnan, B. Chewing Side Preference - Impact on Facial Symmetry, Dentition and Temporomandibular Joint and Its Correlation with Handedness. Journal of Orofacial Sciences 2017, 9, 22. [Google Scholar] [CrossRef]
- Lewis, R.; Dwyer-Joyce, R.S. Wear of Human Teeth: A Tribological Perspective. Proceedings of the Institution of Mechanical Engineers, Part J: Journal of Engineering Tribology 2005, 219, 1–18. [Google Scholar] [CrossRef]
- Levrini, L.; Di Benedetto, G.; Raspanti, M. Dental Wear: A Scanning Electron Microscope Study. BioMed Research International 2014, 2014, 340425. [Google Scholar] [CrossRef]
- Wetselaar, P.; Manfredini, D.; Ahlberg, J.; Johansson, A.; Aarab, G.; Papagianni, C.E.; Reyes Sevilla, M.; Koutris, M.; Lobbezoo, F. Associations between Tooth Wear and Dental Sleep Disorders: A Narrative Overview. Journal of Oral Rehabilitation 2019, 46, 765–775. [Google Scholar] [CrossRef]
- Díaz-Flores García, V.; Freire, Y.; David Fernández, S.; Gómez Sánchez, M.; Tomás Murillo, B.; Suárez, A. Intraoral Scanning for Monitoring Dental Wear and Its Risk Factors: A Prospective Study. Healthcare (Basel) 2024, 12, 1069. [Google Scholar] [CrossRef]
- Schlenz, M.A.; Schlenz, M.B.; Wöstmann, B.; Glatt, A.S.; Ganss, C. Intraoral Scanner-Based Monitoring of Tooth Wear in Young Adults: 24-Month Results. Clin Oral Investig 2023, 27, 2775–2785. [Google Scholar] [CrossRef] [PubMed]
- Schlenz, M.A.; Schlenz, M.B.; Wöstmann, B.; Glatt, A.S.; Ganss, C. Intraoral Scanner-Based Monitoring of Tooth Wear in Young Adults: 36-Month Results. Clin Oral Invest 2024, 28, 350. [Google Scholar] [CrossRef] [PubMed]
- van Nistelrooij, N.; Maier, E.; Bronkhorst, H.; Crins, L.; Xi, T.; Loomans, B.A.C.; Vinayahalingam, S. Automated Monitoring of Tooth Wear Progression Using AI on Intraoral Scans. Journal of Dentistry 2024, 150, 105323. [Google Scholar] [CrossRef] [PubMed]
- Ungar, P.S. Mammalian Dental Function and Wear: A Review. Biosurface and Biotribology 2015, 1, 25–41. [Google Scholar] [CrossRef]
- Yen, C.; Valentine, E.P.; Chiang, M.-C. The Use of Transcranial Magnetic Stimulation in Attention Optimization Research: A Review from Basic Theory to Findings in Attention-Deficit/Hyperactivity Disorder and Depression. Life 2024, 14, 329. [Google Scholar] [CrossRef]
Figure 1.
Diagram of experimental design.
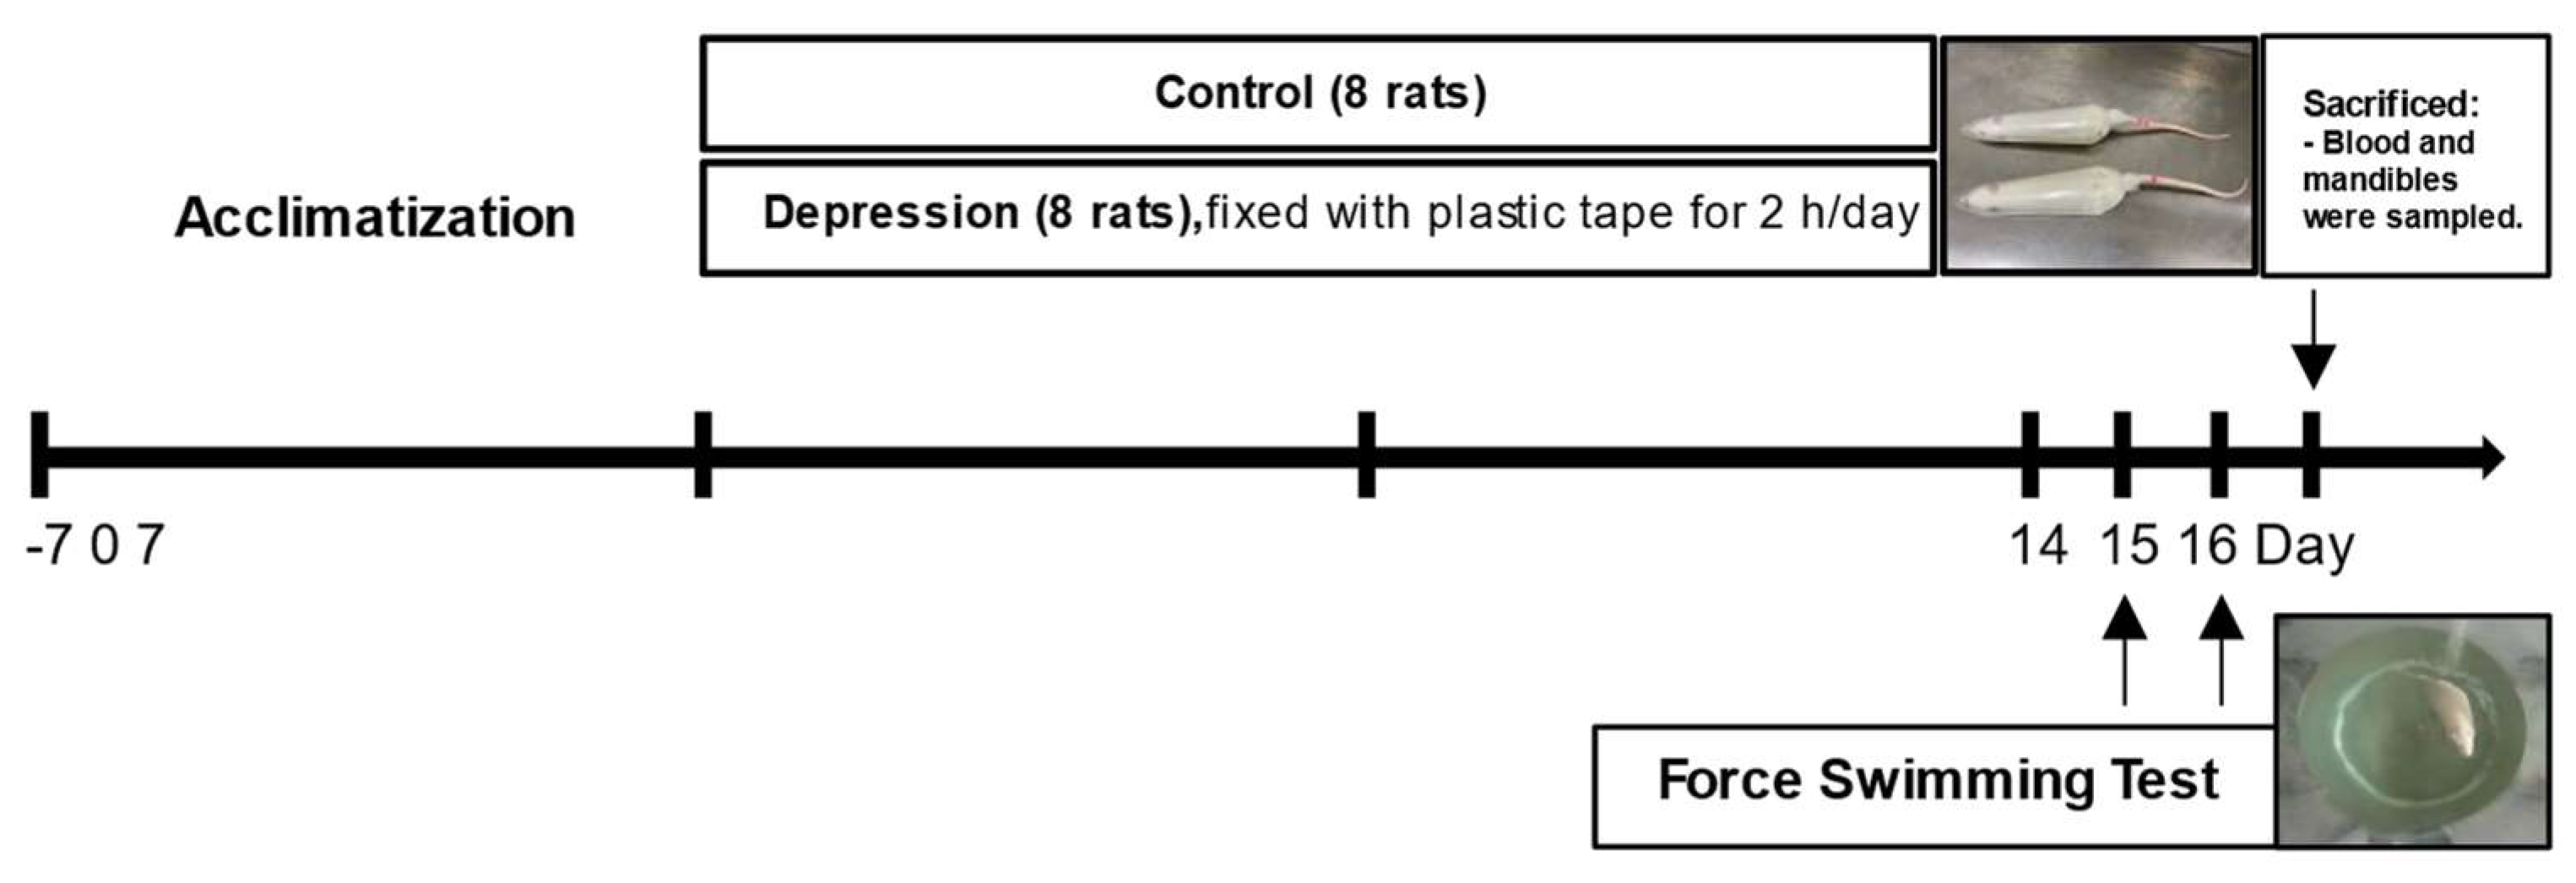
Figure 2.
Changes in the levels of body weight (BW), daily weigh gain (DWG), daily food intake (DFI), and daily water intake (DWI) were assessed in control and stress-induced depression rats. (*p < 0.05, **p < 0.01).
Figure 2.
Changes in the levels of body weight (BW), daily weigh gain (DWG), daily food intake (DFI), and daily water intake (DWI) were assessed in control and stress-induced depression rats. (*p < 0.05, **p < 0.01).
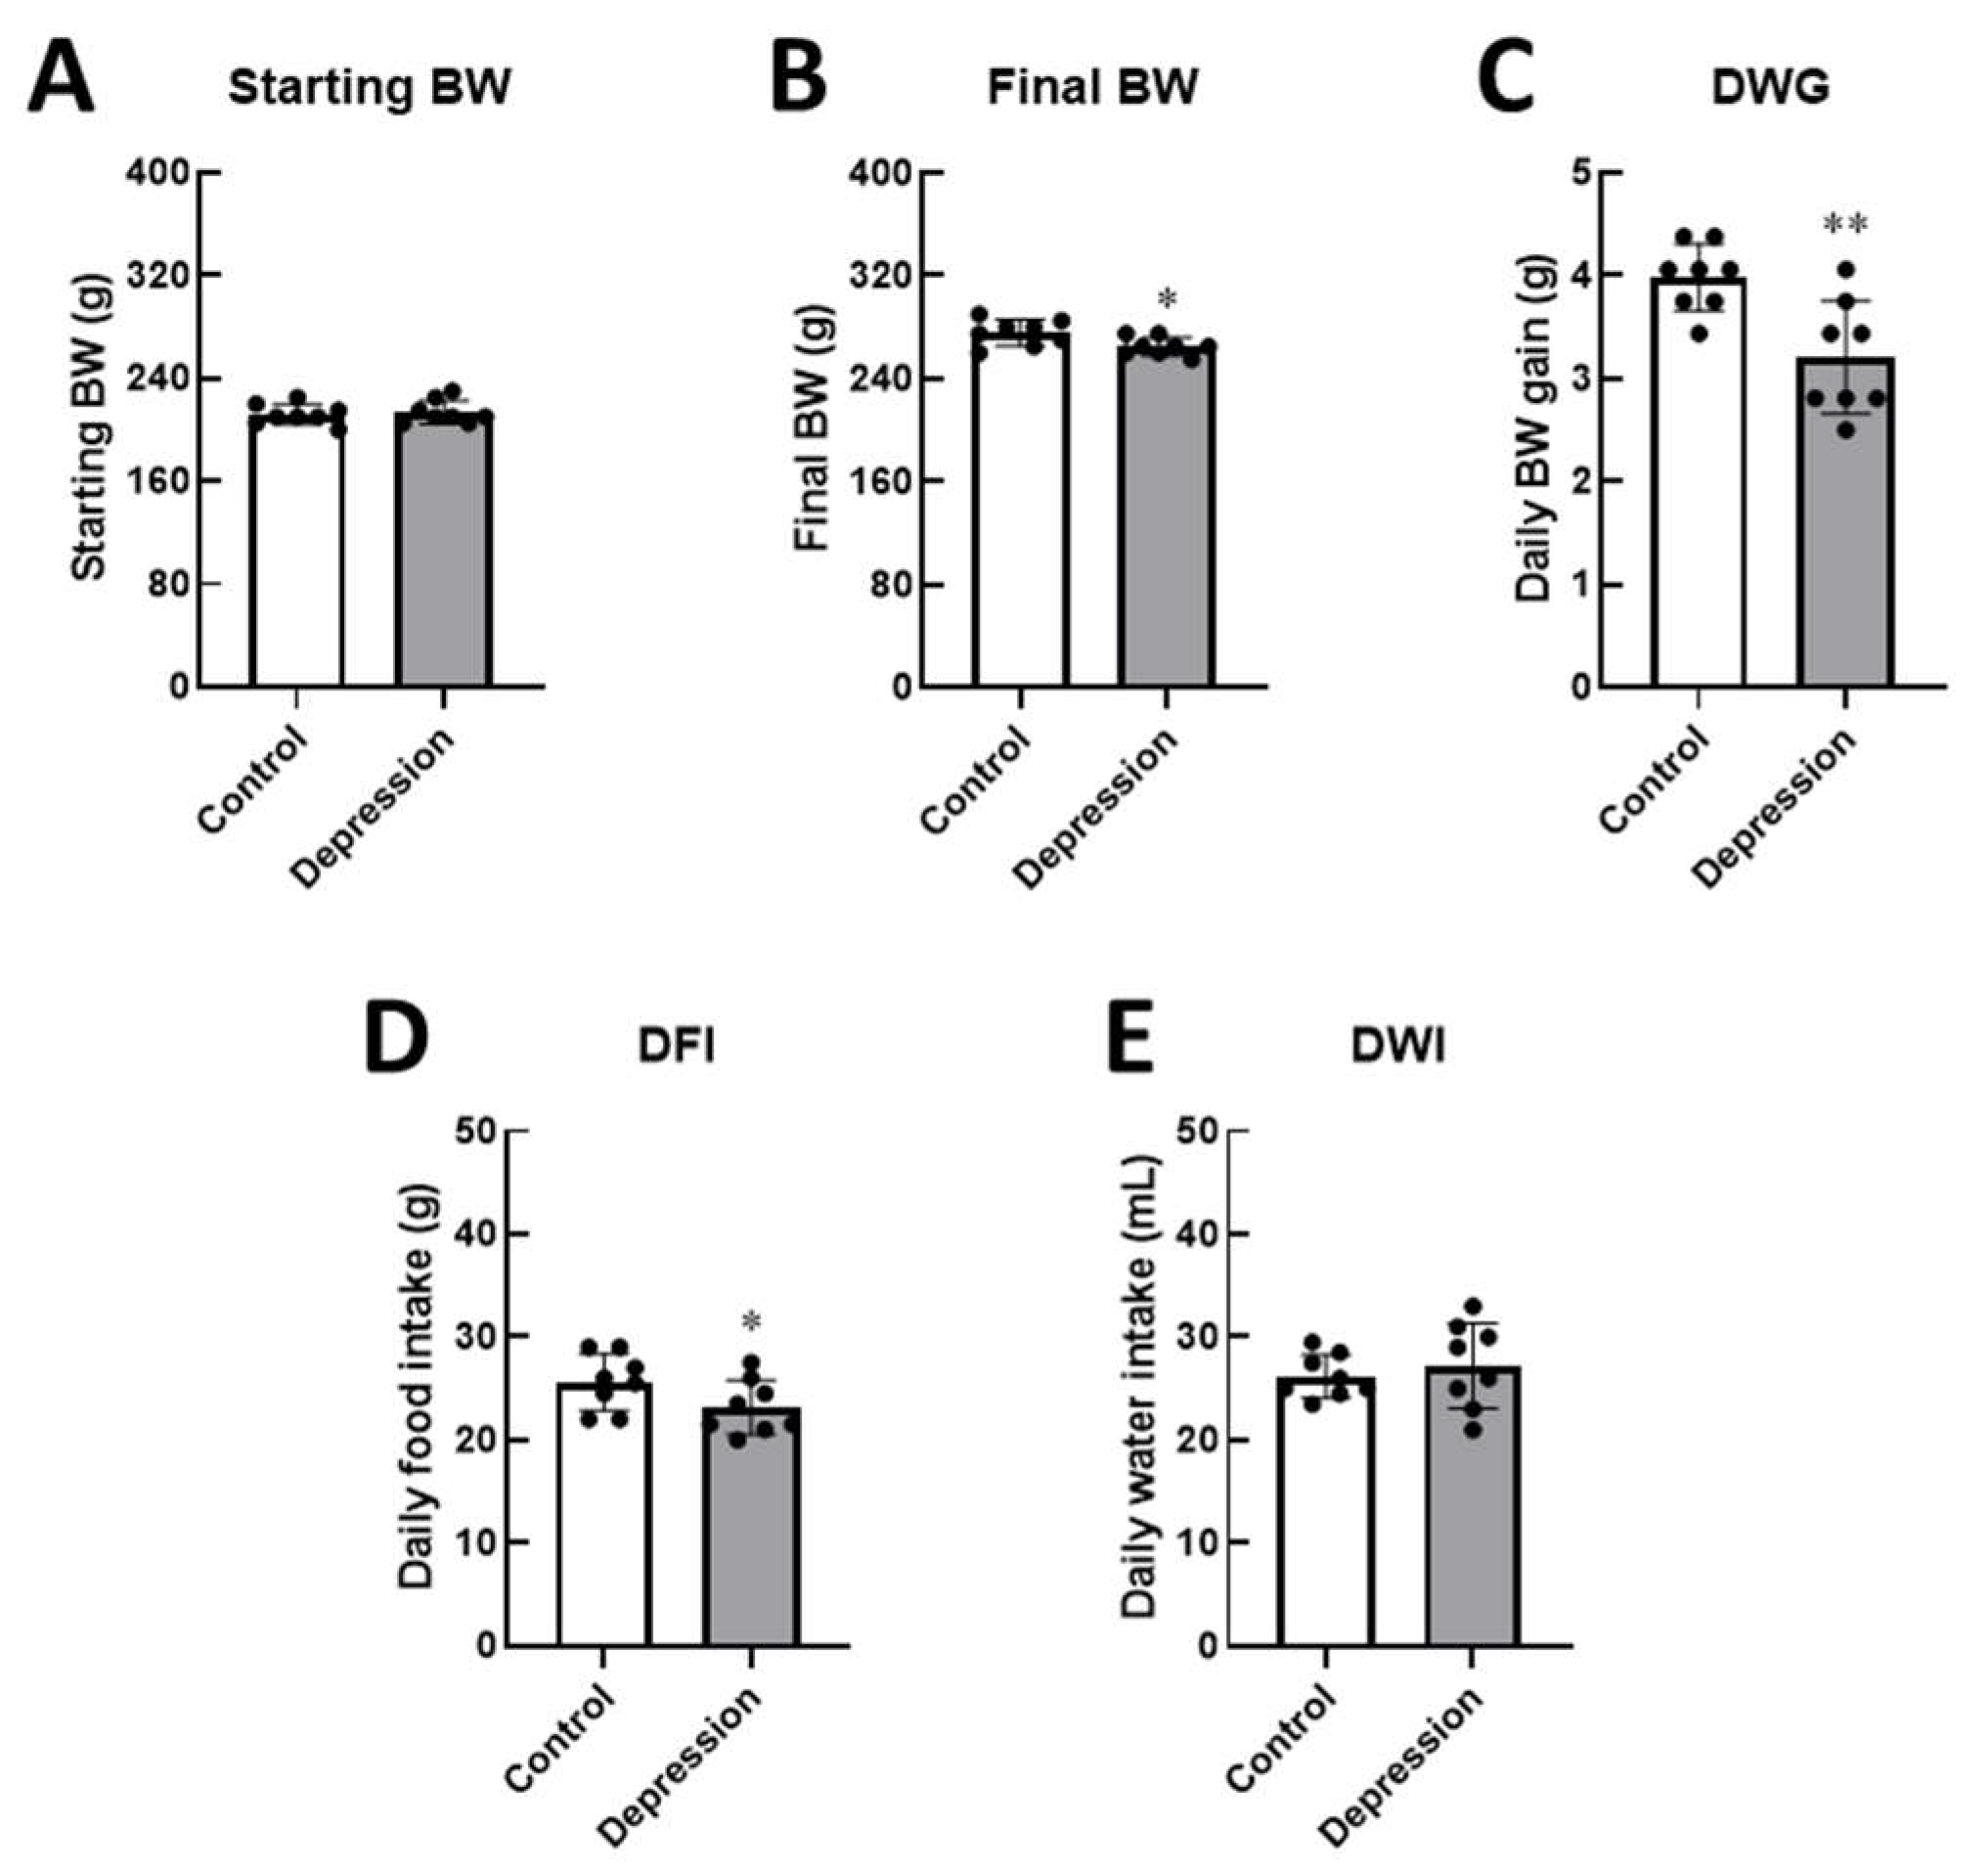
Figure 3.
Changes in the level of urinary corticosterone (Urine CORT), relative wet adrenal gland weight to body weight, and the thickness of the adrenal gland layers, including the adrenal cortex, zona glomerulosa, zona fasciculata, and zona reticularis, were assessed in control and stress-induced depression rats (*p < 0.05, **p < 0.01).
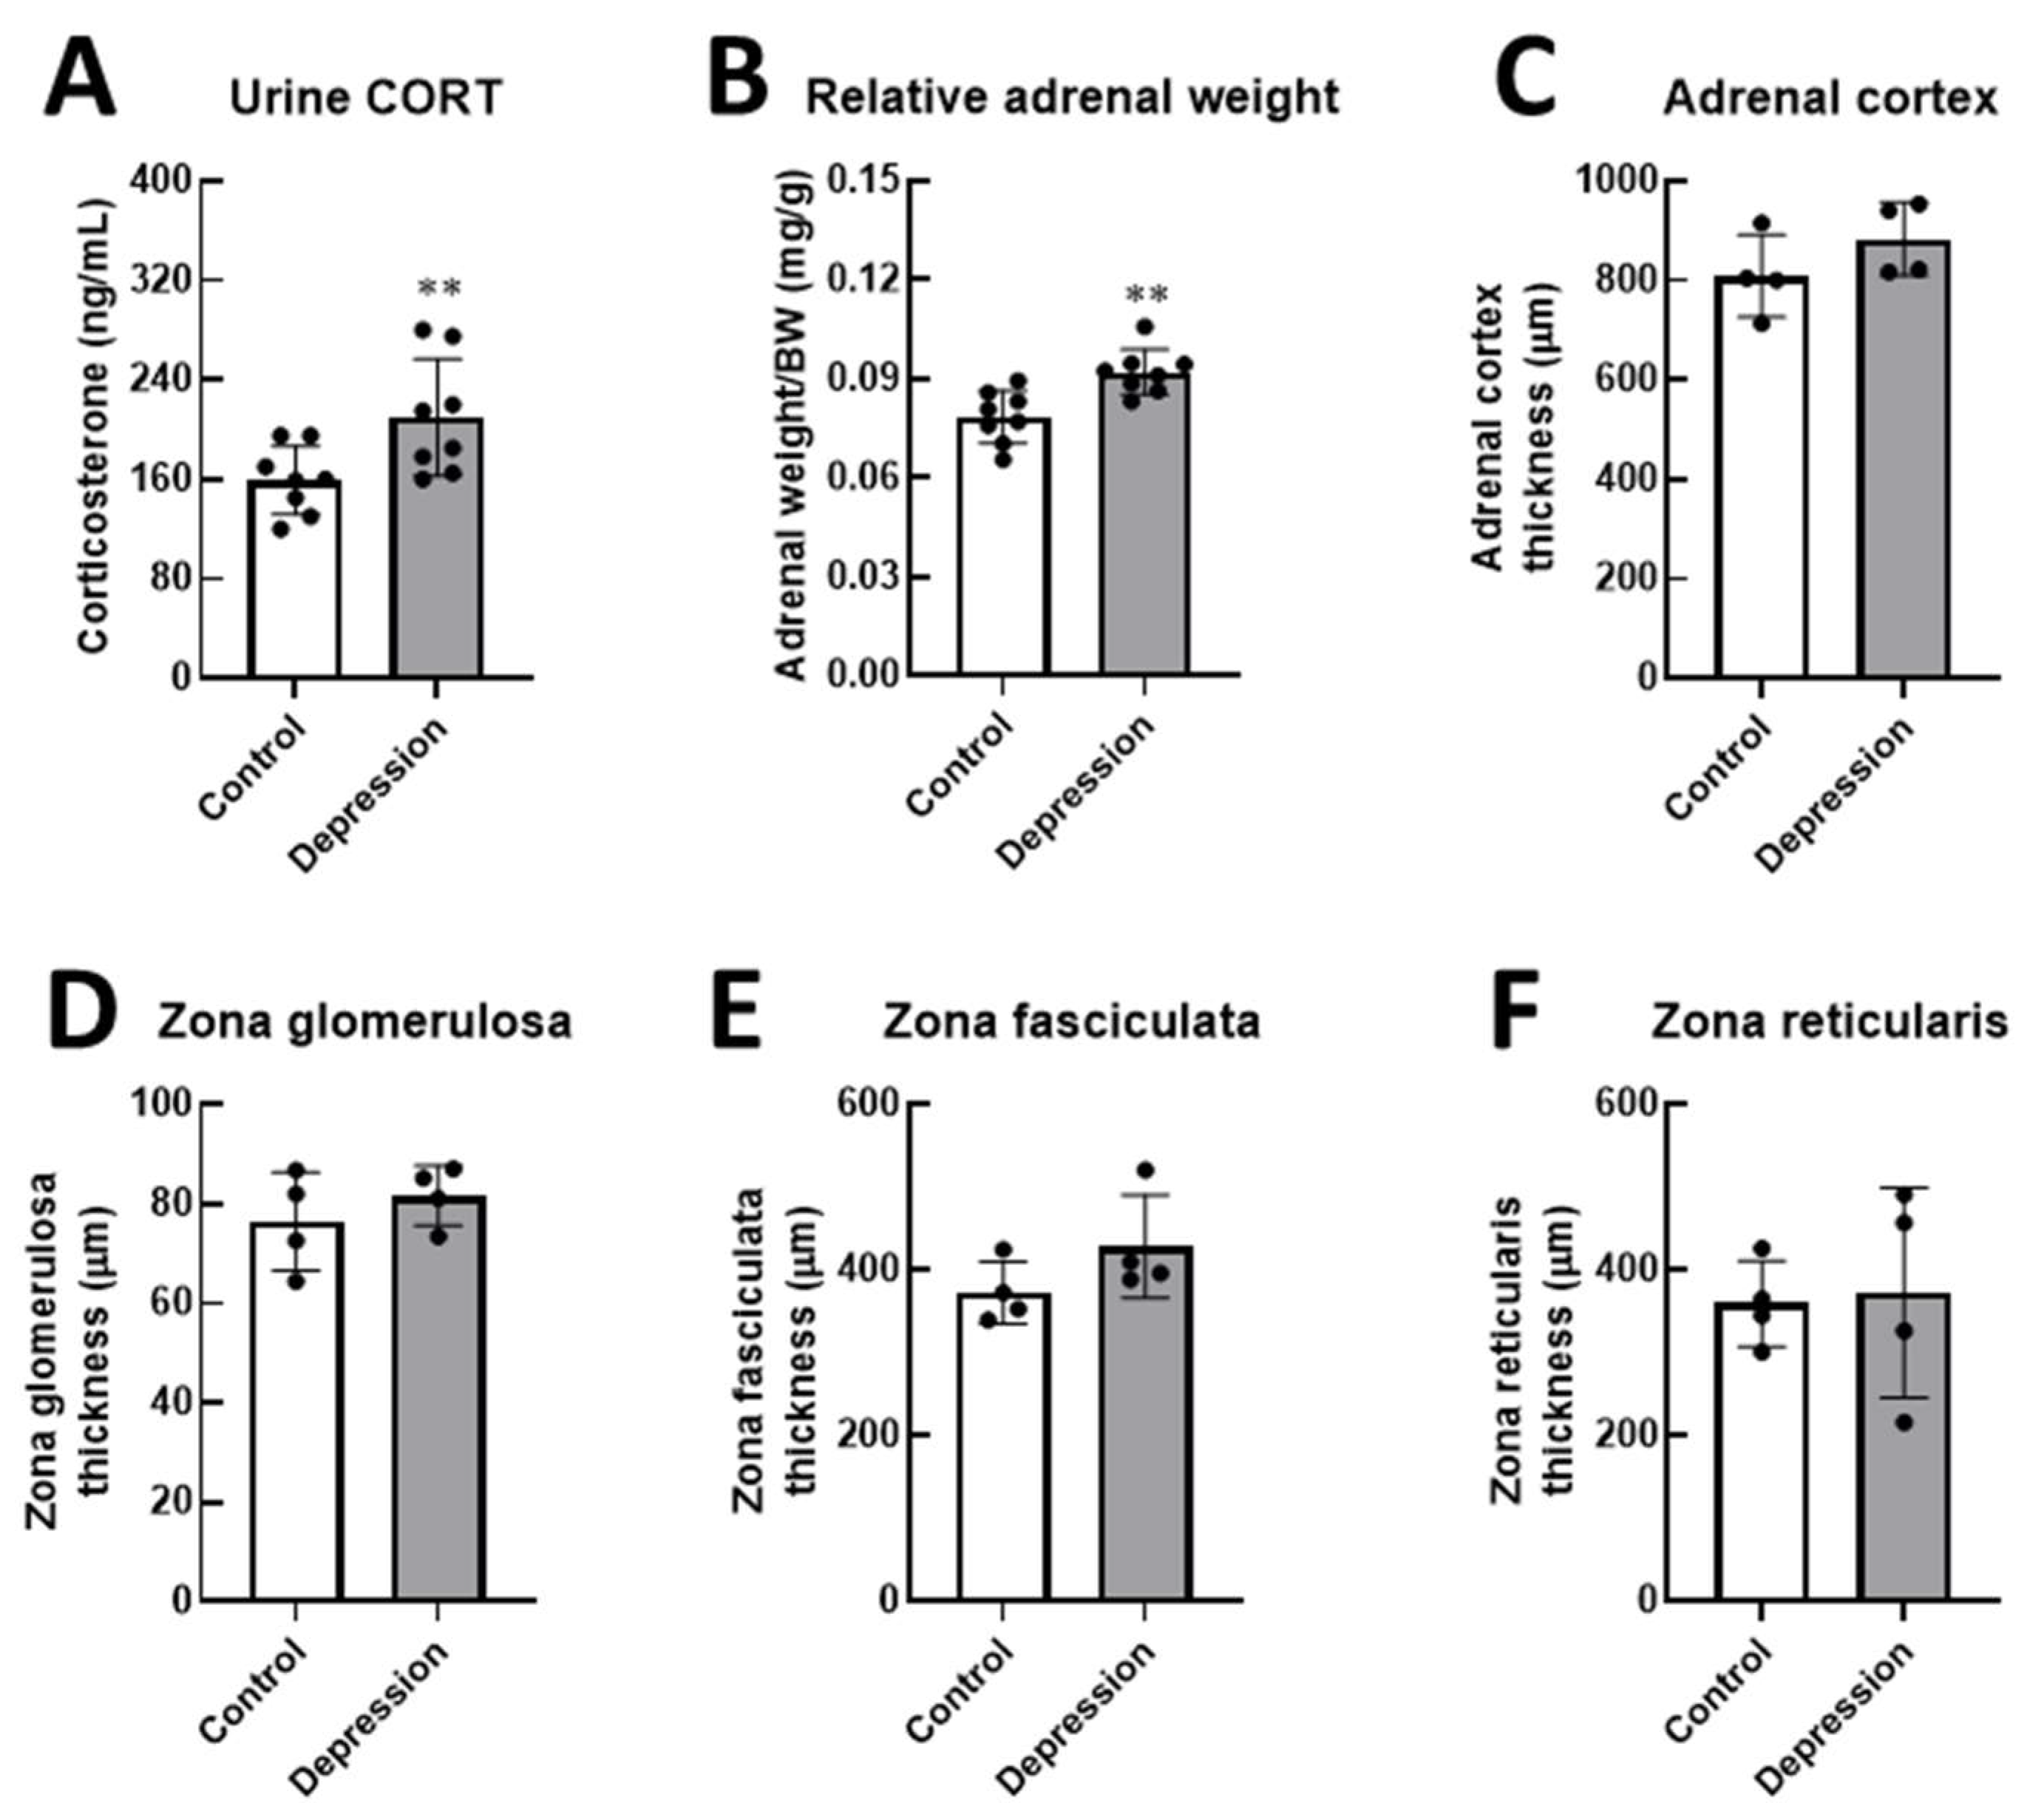
Figure 4.
Changes in the level of depression-like behaviors in stressed male rats were assessed using the forced swimming test (FST), recording time spent in immobility, climbing, and swimming, as well as the number of fecal pellets in control and stress-induced depression rats (*p < 0.05, **p < 0.01).
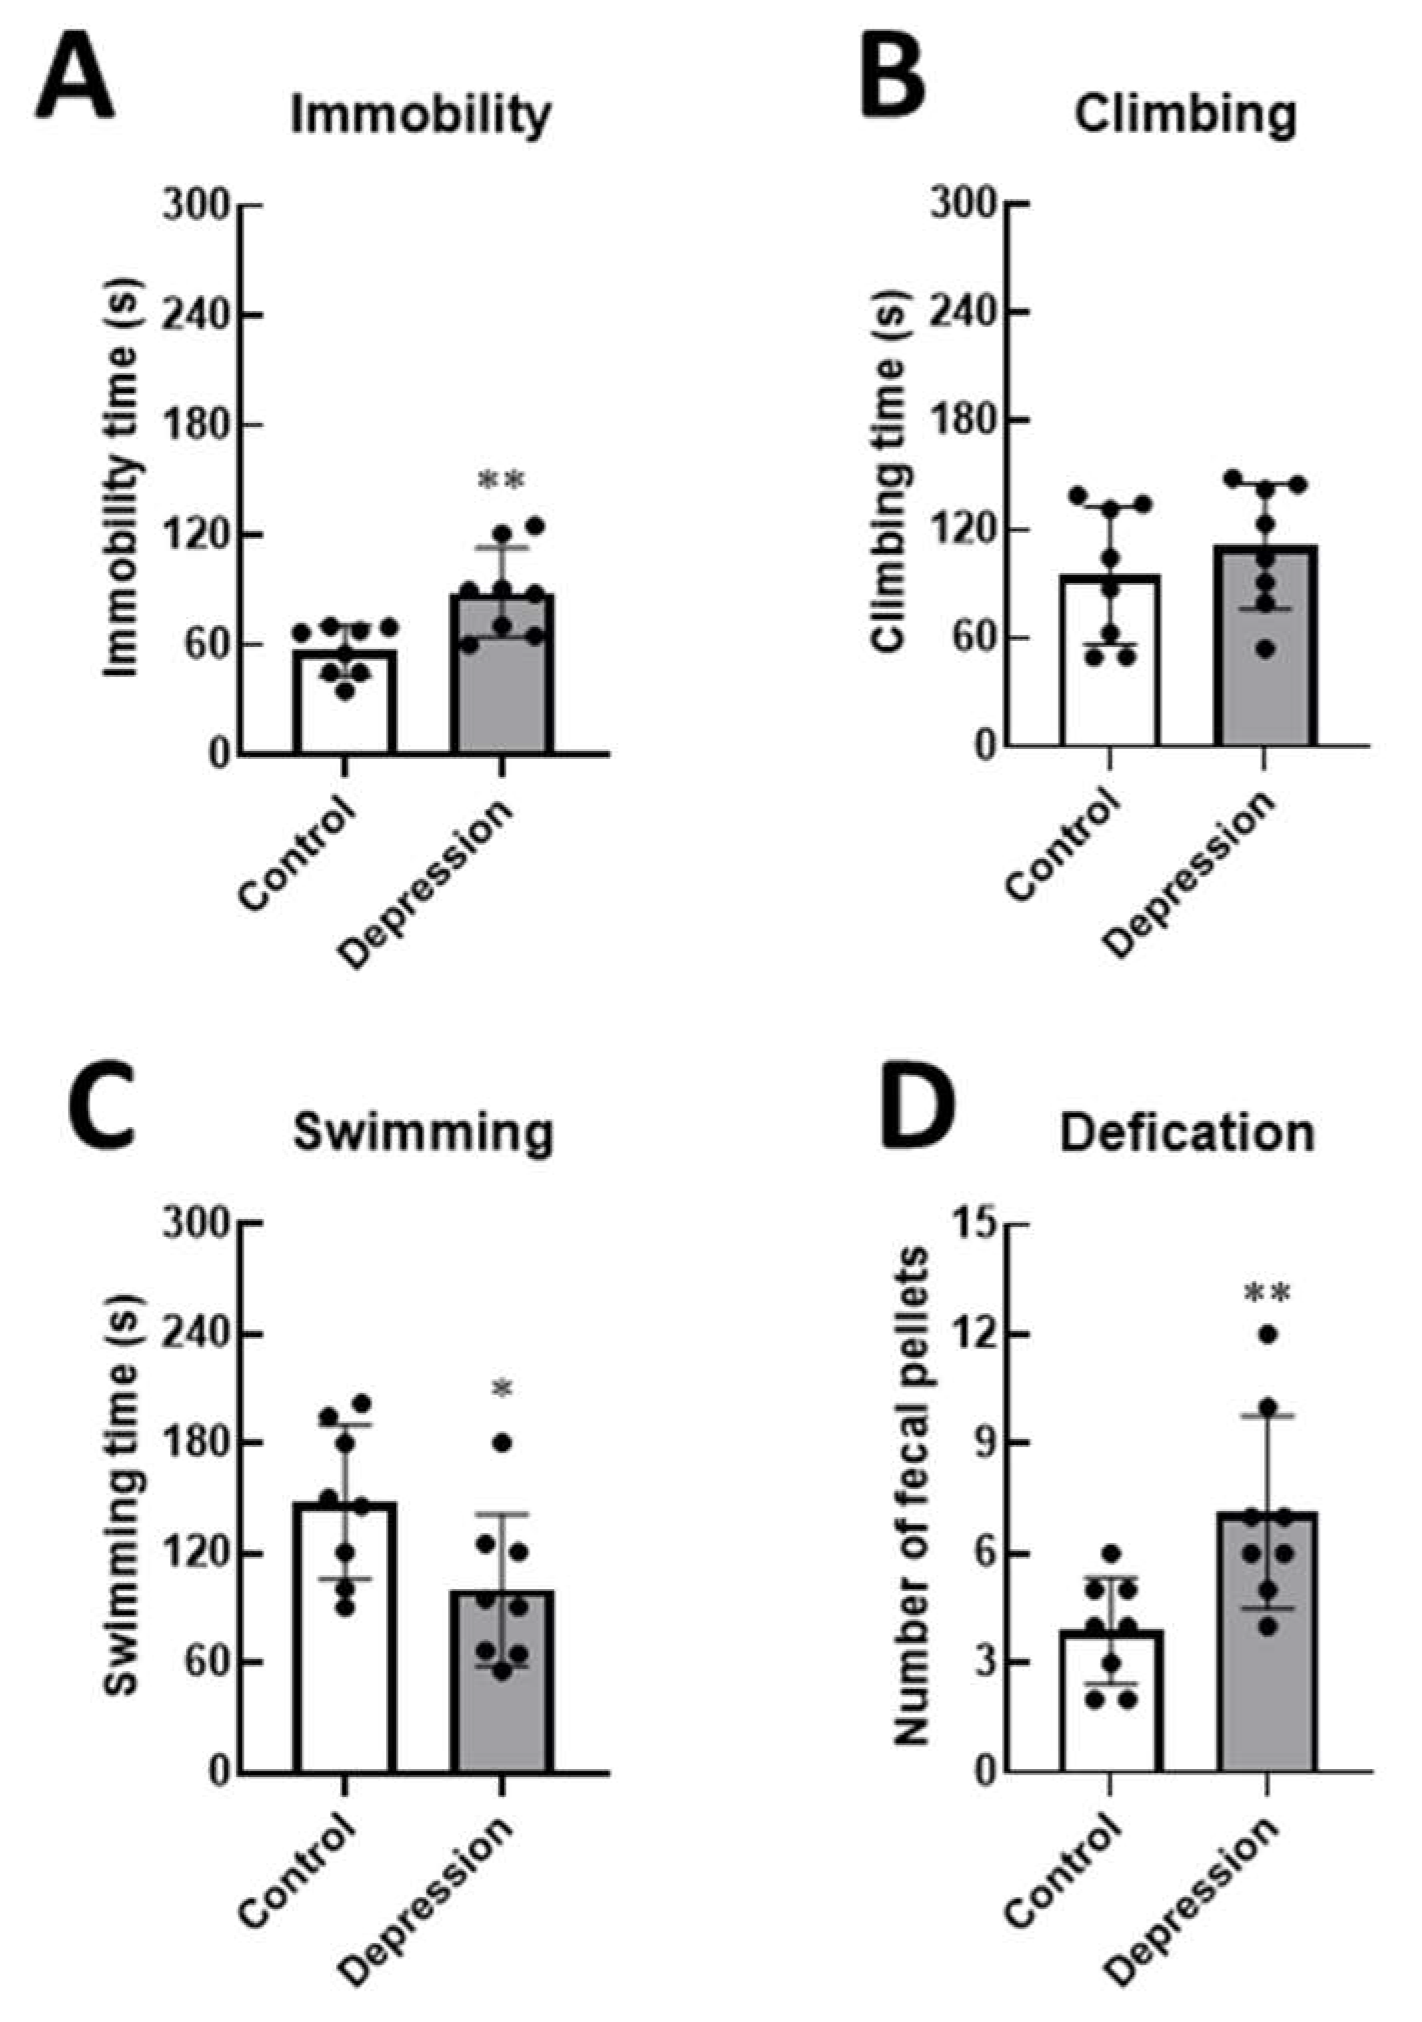
Figure 5.
Lower molars comparison of each sample, (A) control-control, (B) depression- depression, and (C) control- depression. Green indicates a slight to no difference between the two samples (<0.05 mm), while yellow and blue indicate a difference greater than 0.05 mm.
Figure 5.
Lower molars comparison of each sample, (A) control-control, (B) depression- depression, and (C) control- depression. Green indicates a slight to no difference between the two samples (<0.05 mm), while yellow and blue indicate a difference greater than 0.05 mm.
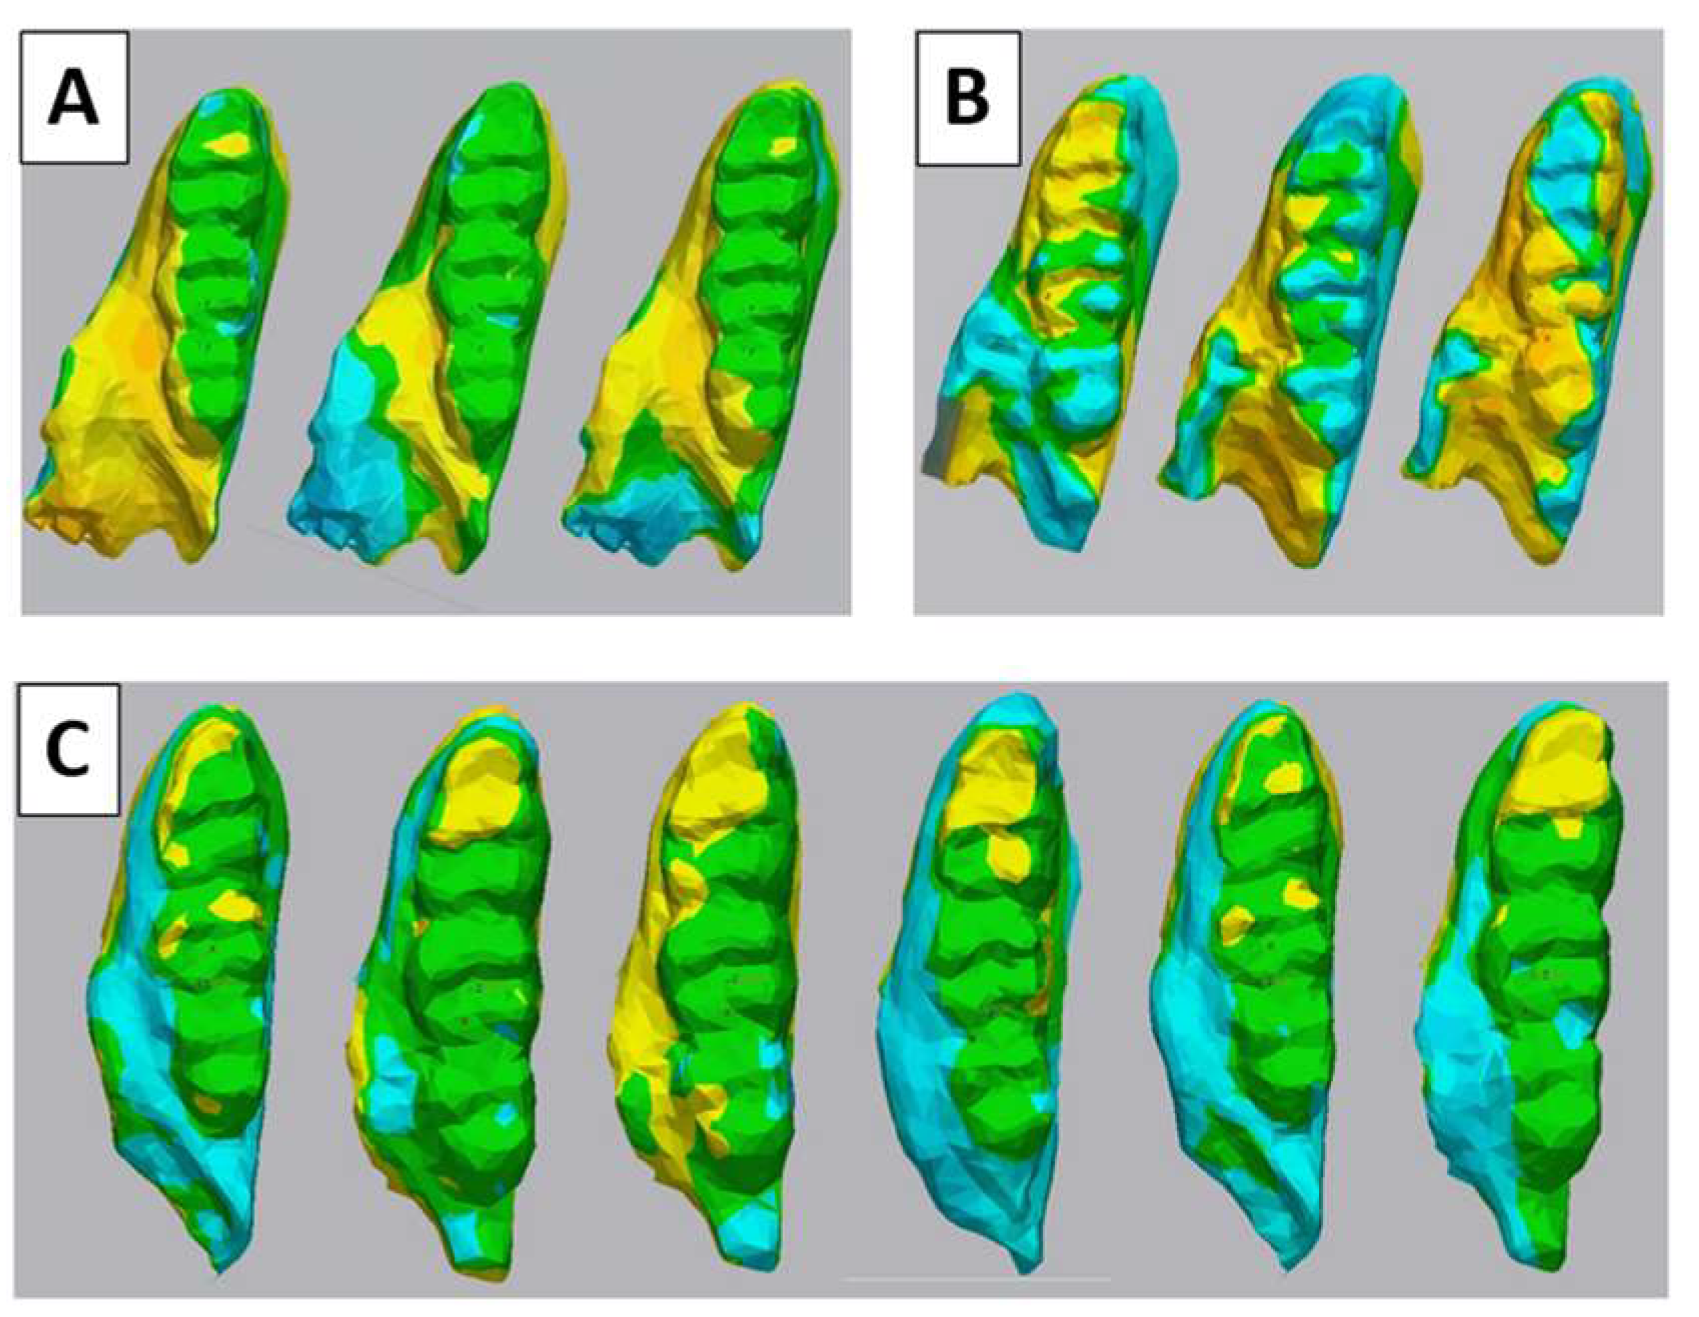
Figure 6.
Cusp volume segmentation of M1-M3 for comparison between (A) control group and (B) depression group. The mean cusp volume measurements between (C) left and (D) right side. (***p < 0.001).
Figure 6.
Cusp volume segmentation of M1-M3 for comparison between (A) control group and (B) depression group. The mean cusp volume measurements between (C) left and (D) right side. (***p < 0.001).
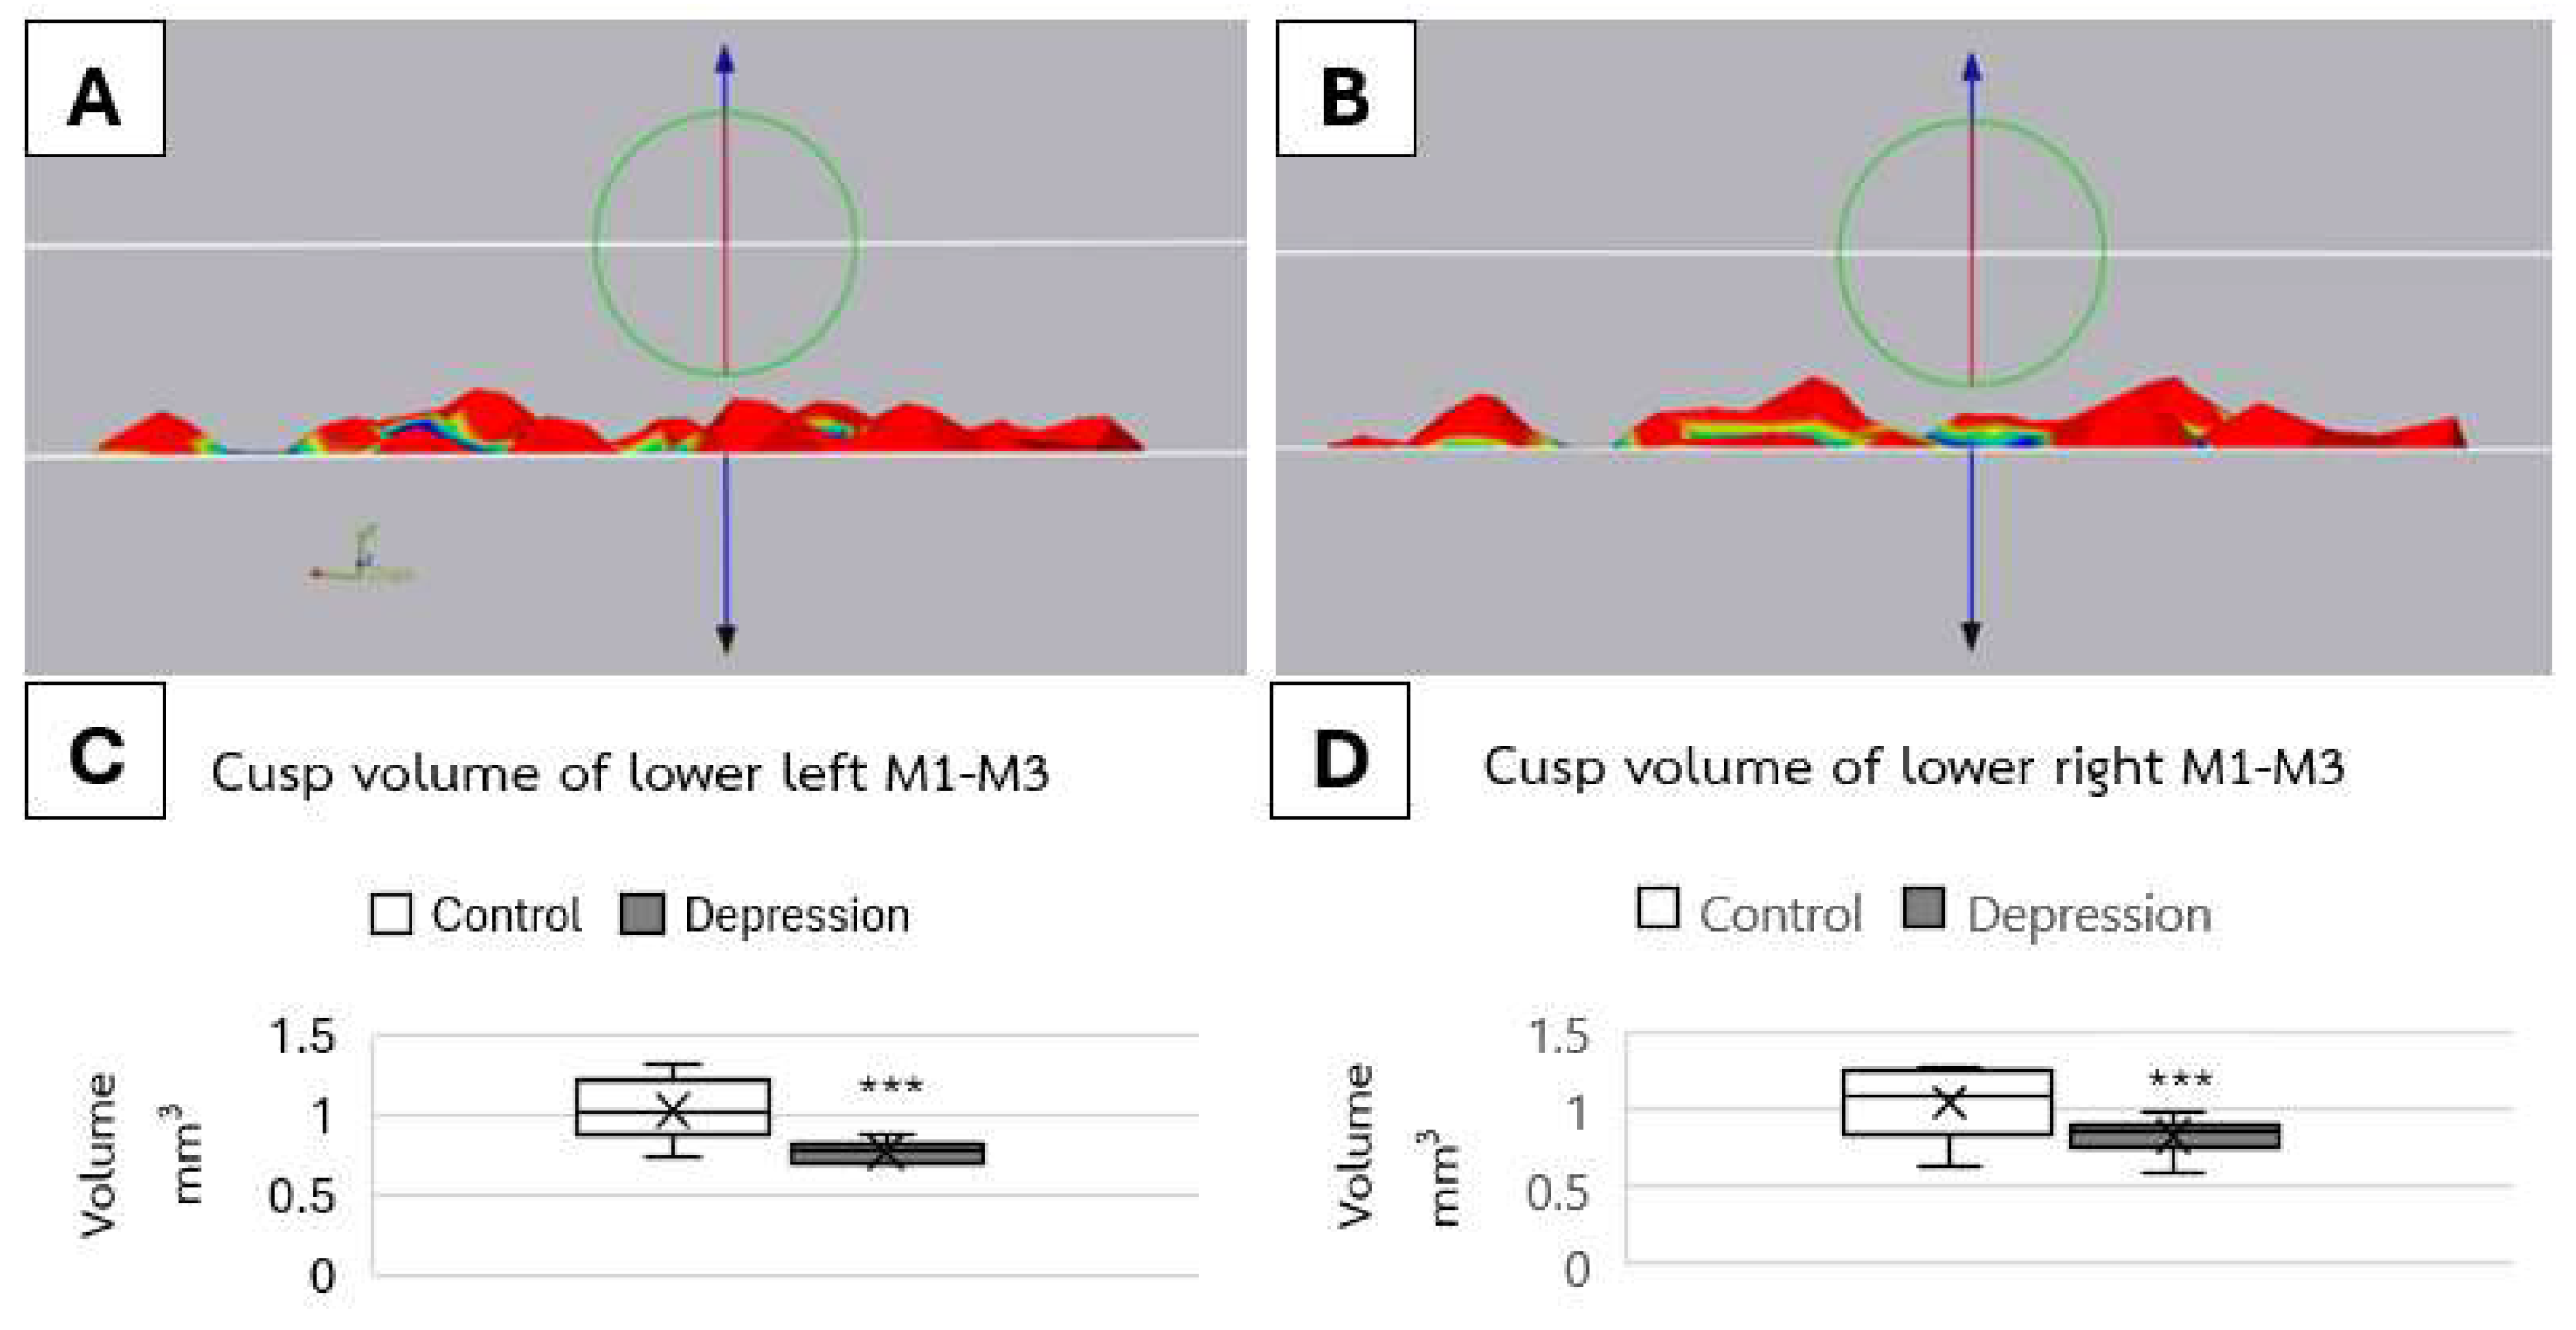
Figure 7.
shows the six landmark points of the left M1 (A), which were used to calculate the distance differences. The distance difference analysis of the cusp of the M1 shows the difference between 2 groups (B).
Figure 7.
shows the six landmark points of the left M1 (A), which were used to calculate the distance differences. The distance difference analysis of the cusp of the M1 shows the difference between 2 groups (B).
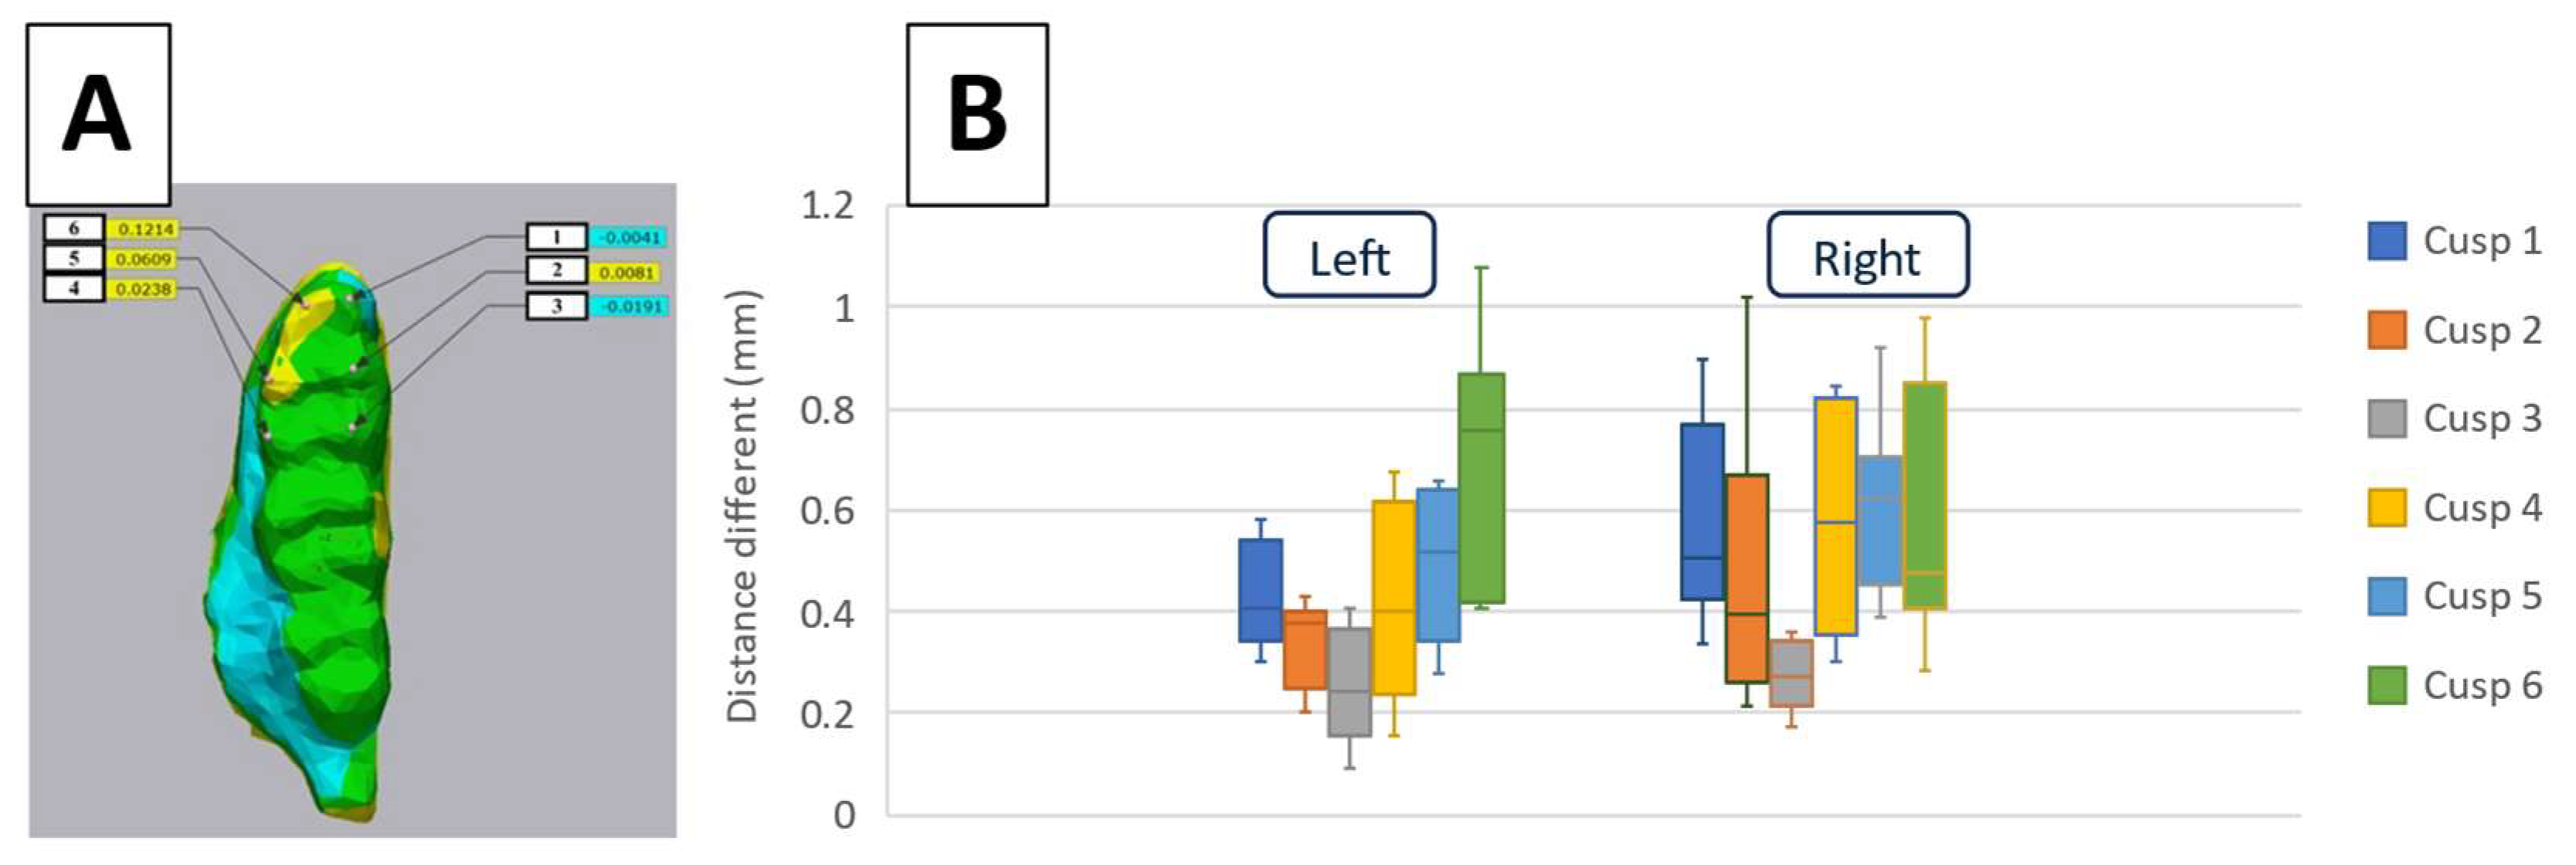
Figure 8.
The nanostructure of the cusp tip surface revealed scratch lines in depression group (B).
Disclaimer/Publisher’s Note: The statements, opinions and data contained in all publications are solely those of the individual author(s) and contributor(s) and not of MDPI and/or the editor(s). MDPI and/or the editor(s) disclaim responsibility for any injury to people or property resulting from any ideas, methods, instructions or products referred to in the content. |
© 2025 by the authors. Licensee MDPI, Basel, Switzerland. This article is an open access article distributed under the terms and conditions of the Creative Commons Attribution (CC BY) license (http://creativecommons.org/licenses/by/4.0/).
Copyright: This open access article is published under a Creative Commons CC BY 4.0 license, which permit the free download, distribution, and reuse, provided that the author and preprint are cited in any reuse.


