Submitted:
15 March 2025
Posted:
19 March 2025
Read the latest preprint version here
Abstract
Adipose tissue plays a complex role in cardiovascular health. Cardiac adipose tissue (CAT) has been shown to correlate with coronary artery disease (CAD). The amount of fat surrounding the heart can affect major heart vessels by contributing to plaque development. In conditions like cardiac steatosis or fatty heart disease, the infiltration or accumulation of fat within the heart’s muscle impairs its function. Both CAT and cardiac steatosis may play a role in heart failure (HF). This review explores the different types of fat deposits surrounding the heart, focusing on the potential contribution of CAT to cardiovascular disease (CVD). Three main imaging modalities for assessing cardiac fat are discussed, including magnetic resonance imaging (MRI), computed tomography (CT), and echocardiography. The segmentation and quantification of the fat for each imaging modality is also presented, correlating these measurements with CVD risk. Each imaging modality offers distinct advantages and limitations in segmenting and quantifying fat. While advancements have been made, challenges persist in accurately measuring and interpreting the fat distribution around the heart. Future research should focus on refining segmentation techniques, establishing standardized protocols, and elucidating the specific mechanisms linking adipose tissue to CVD risk. By overcoming these limitations, cardiac fat imaging can be a valuable tool for improved risk stratification, personalized treatment strategies, and ultimately, better cardiovascular health outcomes.
Keywords:
cardiac adipose tissue
; cardiovascular disease
; imaging modalities
; ultrasound
; MRI
; CMR
; CT scan
; echocardiography
; fat measurement
; fat assessment
; segmentation
; quantification
1. Introduction
The fat in the human body is a connective tissue, known as adipose tissue (AT), fat tissue, or fatty tissue. It is composed of adipocytes or “fat cells” and additional minor cell types such as fibroblasts, endothelial cells, macrophages, stromal cells, immune cells, and pre-adipocytes[1]. Inside the adipocytes, lipid droplets surrounded by a structural network of fibers perform the energy storage function of these cells as shown in Figure 1.[2] Adipose tissue can be classified according to the type of adipocytes that it contains. Brown adipose tissue comprises brown adipocytes, present during fetal life and in infants. The main function of brown adipose tissue is thermogenic control, or the generation of heat through its high concentration of mitochondrial organelles.[3] In adults, brown adipose tissue surrounds the vertebrae, is located above the clavicles, is in the upper back, and is in the central compartment of the thoracic cavity. White adipose tissue is composed of white and beige adipocytes and is the most abundant type of fat in humans, including the fat that surrounds the internal body organs called visceral adipose tissue (VAT).
The main function of white adipose tissue is to store the excess energy, either in the form of triglycerides or in fatty molecules.[4] This tissue has important endocrine and metabolic roles and secretes biologically active factors known as adipokines. Adipokines are molecules that contribute to several body functions such as the regulation of energy balance, food intake and satiety, inflammatory response, and the metabolism of steroid hormones. Finally, white adipose tissue comprises the subcutaneous fat that isolates the body from extreme temperatures, the visceral fat that cushions and protects body parts, and is also present in the bone marrow as a sponge-like tissue in the central cavity of bones.
2. Cardiac Tissue Layers and Adipose Depots
The tissue layers that enclose each heart’s chamber are shown in Figure 2, starting with the innermost tissue layer (the endocardium), and reaching the outermost tissue layer corresponding to the paracardial fat.[5] A basic classification of the adipose tissue around the heart consists of the epicardial adipose tissue (EAT) and the pericardial adipose tissue (PAT); together, these two layers form the cardiac adipose tissue (CAT), where the visceral pericardium is the layer between them as shown in Figure 3 (left).[6,7] A common and more detailed classification of fat tissue surrounding the heart is shown in Figure 3 (right).[8] This classification considers the EAT and PAT, but also includes the paracardial adipose tissue (PcAT), and perivascular adipose tissue (PvAT).
2.1. Epicardial Adipose Tissue
The epicardial adipose tissue (EAT) is located below the visceral pericardium and has anatomical, histological, embryonic, and genetic differences with other types of fat.[5,6] EAT does not have fascia separating it from the vessels and myocardium. This allows both paracrine and vasocrine effects via adipokines, cytokines, and chemokines.[5,9] The blood supply for the EAT is provided by the coronary circulation[10] and the cellular composition of the EAT is mainly comprised of white adipocytes but may include some beige and brown adipocyte concentrations.[11] On average, the EAT corresponds to 20% of the total heart weight, but its amount and distribution vary from 4% to 52% among individuals. EAT depots are found mainly over the base of the heart, the left ventricular apex, the atrioventricular and interventricular grooves, around the coronaries arteries and veins, and over the right ventricle, especially the free wall of the right ventricle.[12] Several mechanisms of the EAT are linked to its contribution to CVD, including its proinflammatory profile, the release of different reactive oxygen species, and fatty infiltration into the atria and ventricles.[13,14,15] Because there is not an easy method to measure these mechanisms and to directly determine the metabolic EAT activity and its relation with CVD, several studies have linked EAT thickness and volume (above 6.2 mm and 101.2 cm3 respectively[16,17]) to key cardiovascular disorders such as coronary artery disease (CAD), heart failure (HF), and atrial fibrillation (AT).[6,18,19] Other studies are focused on EAT and atherosclerotic plaque development and rupture.[20,21,22]
2.2. Pericardial Adipose Tissue
The pericardial adipose tissue (PAT) is located between the visceral and parietal pericardium layers. In some literature it also includes the fat depots on the external surface of the parietal pericardium.[5] PAT is separated physically from the myocardium by a layer of visceral pericardium as shown in Figure 2 and Figure 3. The blood supply for the PAT is provided by non-coronary arteries such as the pericardiophrenic artery, musculophrenic artery, and some branches of the bronchial and esophageal arteries.[23,24] According to some studies, PAT was found to be correlated with an individuals’ BMI, visceral fat, triglycerides, and CAD.[25,26]
2.3. Paracardial Adipose Tissue
The paracardial adipose tissue (PcAT) is located outside the parietal pericardium[5] on its external surface.[27] In some literature, this fat depot is called mediastinal fat or intrathoracic fat,[28] but it can also include the PAT.[29] The PcAT is not in direct contact with the coronary arteries, making it less likely to correlate with CVD. Measures of PcAT consider the subtraction of PAT volume from total thoracic fat by using multi-detector computed tomography[28] as shown in Figure 4.
2.4. Perivascular Adipose Tissue
Perivascular adipose tissue (PvAT) is located around the adventitia of blood vessels including the coronary arteries and the aorta (in this case, it is called periaortic adipose tissue),[5,30] as shown in Figure 5 (left). Another important type of PvAT is the tissue located around the coronary arteries – it is called peri-coronary AT (PCAT), as shown in Figure 5 (center). PvAT contributes to less than 0.3% of total human body adipose tissue.[31] PvAT cellular composition is characterized by adipocytes, and inflammatory cells, it also includes microvascular supply, and nerve fiber structures as illustrated in Figure 5 (right). The precise composition and properties of PvAT vary depending on its anatomical position. For example, periaortic AT above the thorax has a brown adipocyte composition, but periaortic AT around the abdominal level has white adipocyte composition.[32,33] PvAT dysfunction has been linked with hypertension related to obesity, atherosclerotic plaque formation, ischemic coronary artery disease development, pro-inflammatory substance production, atheromatous plaque formation, and vascular protective properties reduction [34,35].
3. Cardiac Fat and Cardiovascular Disease
Cardiovascular disease (CVD) is the group of conditions that affect the normal function of the heart tissues, including the muscle, arteries, and chamber’s valves. Some forms of CVD come from birth defects, physical heart malformations, viral and bacterial infections during pregnancy leading to congenital heart diseases, cardiomyopathies, heart valve diseases, and pericarditis.[36] Genetics also play a role in CVD risk, some individuals are born with a genetic predisposition to elevated cholesterol or triglyceride levels, leading to early cardiovascular disease.[37] For other forms of CVD, physical inactivity, a poor diet, alcohol use, or tobacco use contribute significantly to the development of the disease.[38]
3.1. Coronary Artery Disease
Coronary artery disease (CAD) causes a deficiency in the supply of oxygenated blood to the heart muscles. The deficiency in the supply is due to the development of plaques (cholesterol depots) inside the blood vessels (atherosclerosis) that narrow and block the arteries.[39,40] CAD is also referred to as coronary heart disease (CHD) or coronary stenosis.[41] As shown in Figure 6 (left) an obstructive plaque can produce blood clots increasing the reduction of blood flow through the arteries. In Figure 6 (right), the sequence of plaque development leading to rupture is shown, including the plaque’s growth, the artery lining damage, and the eventual plaque rupture. The lack of treatment for CAD could lead to angina (chest pain and shortness of breath), heart attack (complete artery block due to a blood clot), HF, and heart arrhythmias. Studies using measures of PAT with CT scans found that volumes larger than 300 cm3 are reliable predictors for CAD being comparable with the Framingham Risk Score.[28,42] In studies using CT scans and echocardiography, it was found the EAT thickness located at the left atrioventricular groove was the only parameter correlated with vessel stenosis and the best predictor for obstructive CAD.[43,44] In healthy/asymptomatic subjects a study demonstrated that an EAT thickness value larger than 2.4 mm is a predictor of coronary stenosis with more than 50% of occlusion by using multidetector computed tomography.[45]
3.2. Heart Failure (HF)
Heart failure (HF), also known as congestive heart failure (CHF), is a chronic condition that develops when the heart muscle is unable to pump blood effectively throughout the body. This impaired pumping function can be caused by various factors that weaken or stiffen the heart muscle, ultimately leading to a shortage of oxygen-rich blood reaching vital organs.[46] The proportion of blood ejected from the left ventricle with each heartbeat is called ejection fraction (EF). It is used to classify the presence and severity of HF as: HF with reduced EF (< 40%, HFrEF), with mildly reduced EF (41% - 49%), and HF with preserved EF (> 50%, HFpEF).[47] The relationship between EAT and HF continues to be investigated. Some studies demonstrated increased EAT volume could be beneficial for patients with HFrEF,[48] but for patients with HFpEF, the increased EAT is correlated with adverse cardiometabolic effects.[49]
3.3. Atrial Fibrillation
Atrial fibrillation (AF) is a prevalent cardiac arrhythmia that disrupts the heart’s natural electrical conduction pattern. In a healthy heart, the sinoatrial node (SA node) acts as the pacemaker, generating electrical impulses in a coordinated contraction sequence. These impulses propagate through the atria, causing their contraction and subsequent blood flow into the ventricles. The ventricles then depolarize and contract, pumping blood throughout the body.[50] However, in AF, the electrical activity within the atria becomes chaotic and disorganized. This disrupts the normal coordinated contraction, leading to a quivering or fibrillatory motion of the atria instead of a forceful contraction. Consequently, the ventricles may not receive these signals consistently, resulting in an irregular and often faster heart rate. Another effect of the AF is the enlargement of the left atrium and its pressure increment.[51,52] Several factors contribute to the development of AF, including hypertension (high blood pressure), coronary artery disease, valvular heart disease, sleep apnea, obesity, and excessive alcohol consumption.[5,52] Using CT scans, several studies have found that the EAT around the atria influences the recurrence of AF.[53,54,55]
3.4. Ischemic Heart Disease
Ischemic heart disease is a group of syndromes produced by myocardial ischemia and it arises as a result of restricted blood flow to the heart muscle or myocardium. This imbalance between blood supply and demand deprives the cardiac tissue of the vital oxygen and nutrients necessary for proper physiological function.[56] The most prevalent cause of myocardial ischemia is CAD followed by coronary artery spasm (CAS). CAS is a transient constriction or spasm of the coronary arteries that could reduce blood flow and trigger ischemic events.[57] Studies using non-contrast CT assessed PAT and EAT volumes and found that larger amounts, with concentrations above 96 ± 36 cm3 for EAT and above 99 ± 4 cm3 for PAT, are highly correlated with myocardial ischemia.[58,59]
3.5. Heart Valve Stenosis
In general, stenosis is related to the narrowing of the diameter of a passage, conduit, or tube in the body. In the heart, the aortic, mitral, tricuspid, or pulmonary valve openings could become smaller making it difficult for blood to flow.[60] The most common cause of valve stenosis is the accumulation over the leaflets of calcium or other mineral deposits, and fat residues released by plaques generated by excessive EAT. EAT thickness > 7 mm has been linked and correlated with mitral annular calcification and aortic valve stenosis.[61,62] This is a non-common condition in young people – studies suggest approximately 2% of people over 65 years old in the United States have some degree of aortic valve stenosis. Mitral and aortic valve stenosis can lead to HF, stroke, blood clots, irregular heart rhythms, and death.[63]
3.6. Cardiac Steatosis
Cardiac steatosis, also known as myocardial steatosis, lipomatosis cordis, or fatty heart disease, refers to the abnormal accumulation of fat within the heart muscle itself. The concentration of fat in the myocardium plays a role in diabetic cardiomyopathy, cleft ventricular dysfunction, and end-organ dysfunction.[64] The infiltrative-lipotoxic and pericardial restraint hypotheses have been postulated as the potential mechanisms that relate EAT with cardiac steatosis.[21] In the first hypothesis, the EAT infiltrates the underlying myocardial tissue releasing pro-inflammatory adipokines, and in the second hypothesis the EAT accumulates increasing its thickness and obstructing mechanically the myocardium dilation leading to diastolic dysfunction as shown in Figure 7. Myocardial steatosis is a common condition, with estimates suggesting it affects up to 30% of the population. In severe cases, it can lead to symptoms like fatigue, shortness of breath, chest pain, heart failure, or arrhythmias, and was highly correlated with left ventricular dysfunction.[65]
3.7. Cardiac Fibrosis
Cardiac fibrosis corresponds to a high deposition of stiff and inflexible scar tissue in the heart muscle that reduces the capabilities of the heart to pump blood.[66] The main cause of cardiac fibrosis is related to heart injuries from heart attacks, hypertension, or diabetes, but the amount of EAT has also been linked with myocardial fibrosis. EAT volume measured using cardiac magnetic resonance (CMR) was found to be highly correlated with myocardial fibrosis, also as an independent marker regarding age, hypertension, diabetes or other HF causes.[67]
3.8. Cardiac Lipoma
Cardiac lipoma is a non-common degenerative process in which heart cells are replaced with fat. It is also known as a benign tumor made up of mature fat cells.[68] This process usually affects the myocardial structures, the right atrium, and can arise from the papillary muscle.[69] Cardiac lipomas are correlated with heart arrhythmias, syncope, palpitations, and angina. Another form of cardiac lipoma is epicardial lipomatosis, sometimes called epicardial lipomatous hypertrophy (ELH). This lipoma involves an excess of non-encapsulated fatty tissue in the epicardium.[70] EAT thickness above 20 mm was found related to ELH, diastolic dysfunction, and tamponade in clinical case reports.[71,72] When affecting the interatrial septum, the infiltration of fatty tissue leads to the development of lipomatous hypertrophy of the interatrial septum, this uncommon disorder is associated with arrhythmias, syncope, and sudden death.[73]
4. Imaging Modalities to Assess CAT
Accurate assessment of fat accumulation around the heart, particularly pericardial adipose tissue (PAT) and epicardial adipose tissue (EAT), is crucial for evaluating cardiovascular risk. Assessment can be broken down into segmentation and quantification. Segmentation refers to manual, semi-automatic, and automatic EAT and PAT region identification in medical images. Quantification refers to the measurement of EAT and PAT volume and thickness. This section explores various imaging modalities employed for segmenting and quantifying cardiac fat. Magnetic resonance imaging (MRI) offers exceptional soft tissue contrast and the ability to differentiate fat types.[74] However, factors like cost, time, and patient suitability can necessitate alternative approaches.[7] Cardiac computed tomography (cardiac CT) provides a fast and readily available option for EAT measurement, though it exposes patients to ionizing radiation.[75] Echocardiography (Echo), a widely accessible and safe technique, offers estimates of EAT thickness, but with limitations in fat type distinction and visceral fat measurement.[76] This section investigates the advantages, disadvantages, and clinical considerations for each modality, aiding in the selection of the most appropriate method for specific patient needs.
4.1. Assessment Metrics
Evaluation metrics are needed to assess the accuracy of segmentation and quantification efforts compared to expert tracings. First, Dice Similarity Coefficient (DSC) is a popular and effective tool to gauge the similarity of two data sets. It compares the overlap between ground truth and the predicted segmentation. Values range between 0.0 and 1.0. A value of 0.0 indicates no overlap whereas a value of 1.0 indicates a perfect overlap. Next, accuracy is a measure used to evaluate the overall performance of a classification model. Accuracy is the proportion of correct predictions (both true positives and true negatives) out of the total number of predictions made. Similarly, precision, sensitivity, and specificity are comparison metrics used to measure classification performance. Precision is the proportion of true positive predictions among all positive predictions made. Sensitivity (also known as recall) is the true positive rate - the proportion of true positive predictions among all actual positives. Lastly, specificity is the true negative rate - the proportion of true negatives among all actual negatives. An additional useful metric called F1-score corresponds to the harmonic mean of precision and recall, it is useful when working with dataset that contains unbalanced labeled data. All four metrics, like DSC, range from 0.0 to 1.0 where values close to 1.0 are considered better segmentation results. These metrics are commonly used in medical applications to measure the performance of segmentation and quantification efforts. These are among the most common metrics in the given literature used for comparison of different segmentation and quantification methods in Table 1, Table 2, Table 3, Table 4, Table 5 and Table 6.
4.2. Cardiac Magnetic Resonance (CMR)
MRI uses powerful magnetic fields and radio waves to produce detailed images of anatomical structures. Cardiac magnetic resonance (CMR) imaging provides excellent contrast between soft tissues, allowing for detailed visualization of cardiac structures and adipose tissue. CMR can also evaluate other cardiac abnormalities such as myocardial fibrosis and myocardial perfusion, providing a comprehensive assessment of cardiac health.[77] This non-invasive and non-ionizing imaging modality creates images with ample spatial and temporal resolution. CMR can also provide excellent contrast of the visceral and parietal layers of the pericardium as shown in Figure 8.[78]
4.2.1. Imaging Techniques
Novel MRI acquisition strategies have enabled high-resolution, rapid imaging that enhances diagnostic accuracy and provides clearer insights into cardiac structures.[80]
Cine MRI is a real-time imaging technique that captures motion and creates a 3D video. Cine MRI uses steady-state free precession sequencing to acquire a series of slices of the heart in 2-chamber, 3-chamber, and 4-chamber views.[81] Images are then fused to form a cine movie, which visualizes the complete cardiac cycle. Cine imaging provides extensive anatomical information about the heart,[82] which helps assess CAT’s volume and distribution around the beating heart.
The Dixon technique is considered the benchmark for assessing visceral adipose tissue.[83] This specific pulse sequence helps separate water and fat signals and relies on the chemical shift difference between water and fat protons. Water and fat have different resonant frequencies in a magnetic field, and this shift enhances the ability to characterize and quantify the two tissues. The Dixon technique can generate water-only and fat-only images, improving the accuracy of EAT quantification.
Gradient echo sequencing provides high spatial resolution and is sensitive to changes. This imaging technique utilizes gradients to create images exploiting magnetic property differences in different tissue types. The relative high resolution is beneficial to visualize the thin layers of CAT and distinguish it from adjacent structures like the pericardium. Gradient echo scans can also be combined with other imaging strategies like the Dixon sequence to enhance the separation of structures, further highlighting CAT.
4.2.2. CAT Segmentation
The segmentation of CAT is particularly challenging compared to other cardiovascular segmentation tasks. CAT’s shape is unevenly distributed and irregular, making it hard to detect automatically. Additionally, the pericardium is also often blurred in MRI due to partial volume effects,[84] causing CAT to be mislabeled as epicardial or paracardial fat as the three tissues share similar intensities. Initially, trained physicians and researchers performed CAT segmentation in CMR manually. Experts visually identified and traced the outline of epicardial fat on each cross-sectional image of the heart.[85] However, this method was labor-intensive, time-consuming, and subject to inter and intra-observer variability.
Machine learning (ML) and deep learning (DL) algorithms have recently automated the segmentation process. ML models are statistical models that map input features into output classes. DL extends the concepts of ML. DL models themselves are learned from the training data. Convolutional neural networks (CNNs) are leveraged to perform tasks to recognize image features. These models produce high accuracy and consistency, can rapidly process large volumes of data, and improve with more training data. This approach, however, requires large, annotated datasets for training, high computational costs, and personnel with expertise in ML/DL. Figure 9 below shows the qualitative results of various DL models compared to manual tracings.
Manual tracings act as the ground truth to assess model prediction accuracy. Table 1 below compares the performance of several ML methods used for CAT segmentation from MRI.
4.2.3. CAT Quantification
Much research shows that increased EAT volume is heavily linked to CAD,[20] therefore, quantifying CAT is necessary for risk assessment and early identification of CAD and other CVDs. CAT volume is calculated by summing the segmented areas across all image slices and multiplying by the slice thickness and pixel dimensions. This method accurately measures the total CAT volume and accounts for the entire heart, calculating fat volume from the base to the apex of the heart. This approach, often referred to as the modified Simpson’s method, is considered the gold standard for CAT measurement.[91] Furthermore, to obtain CAT mass, the fat volume can be simply multiplied by the specific weight of fat (0.92 g/cm3). Typically, this approach is done semi-automatically. Experts trace the CAT contours, and a software package is leveraged to sum the areas across all images, taking into account slice thickness and intersection gaps.[92] However, these measurements are time-consuming and cannot be easily incorporated into clinical routine assessments. Recent DL efforts have been employed to automatically quantify CAT. For example, Guglielmo et al.[93] developed a DL network to automatically quantify EAT on short-axis cine CMR images. However, manual tracings are still required to validate the performance of such networks. Table 2 shows manual and automatic efforts to quantify CAT in CMR.
4.2.4. Limitations
CAT segmentation and quantification is not a trivial task. Even with DL methods, more progress is needed to reduce the complexity and increase efficiency. While these techniques and methods help mitigate challenges in CMR imaging and improve tissue and EAT visualization, MRI remains an expensive and exclusive imaging modality. For example, MRI is limited by a lengthy and cost-intensive procedure requiring specialized equipment and personnel, and Cardiac MRI procedures are not available at all medical centers. MRI also demands high patient compliance as individuals must remain still during the scan, which can be challenging for patients with claustrophobia and severe anxiety. Lastly, patients with pacemakers are ineligible for MRI, reducing its accessibility. MRI remains a desirable modality and, with a continued increase in research interest, can become the preferred modality to assess CAT.
4.3. Computed Tomography (CT scan)
CT is a powerful imaging modality that uses X-rays to create detailed cross-sectional images of the body. Advanced algorithms combine multiple X-ray measurements from different angles around the patient to reconstruct a 3D representation of the desired anatomy, providing a comprehensive view of the body’s internal structures. CT has proven its feasibility and reproducibility to segment and quantify EAT.[58] CT’s ability to generate 3D images aids in accurately assessing CAT distribution and allows for precise quantification of CAT volume by measuring attenuation values of fat in Hounsfield Units (HU). Moreover, specialized cardiac CT scans like Coronary CT Angiography (CCTA) and Coronary Artery Calcium (CAC) scoring allow for even more improved characterization of CAT as shown in Figure 10. Recently, photon-counting CT (PCCT) has emerged as a new CT technology, which has been proven to improve spatial and contrast resolution compared to conventional CT.[95] PCCT scanners convert X-ray photons into electrical signals that are counted and categorized by energy level, which allows for superior image quality and drastically reduced radiation exposure. Research has shown PCCT outperforming conventional CT for the quantification of CAC and significant visual reduction of artifacts on coronary calcified plaques.[96] Lastly, CT is considered superior when compared to other imaging modalities to segment CAT.[97] For example, unlike MRI, CT does not blur the pericardium, which is beneficial in distinguishing different adipose tissues. Consequently, CT is the most validated and reproducible technique for fat segmentation and quantification given the literature.[98]
4.3.1. Imaging Techniques
Contrast and non-contrast enhanced CT are the main two types of scans. Contrast-enhanced CT involves the use of contrast agents to enhance the visualization of cardiac structures and can provide better delineation of adipose tissue. CCTA is a contrast-enhanced scan that visualizes the coronary arteries, providing high-resolution images of the heart and surrounding structures. The enhanced detail allows for precise visualization of EAT. However, the use of contrast agents can pose risks to patients with allergies or other impairments. CAC scoring is a non-contrast scan that measures the amount of calcium in the walls of the coronary arteries. This imaging technique delineates cardiac structures, contrasting epicardial fat from other tissues. La Grutta et al.[99] compared quantification metrics of EAT of CCTA and CAC. In their study of 76 patients suspected of CAD, the researchers measured EAT volume and thickness with semi-automatic software. The EAT volume was measured to be 122±50 cm3 for CAC scoring and 101±47 cm3 for CCTA. They noted no significant difference in median values and concluded that both imaging techniques may be equally employed for EAT assessment.
4.3.2. CAT Segmentation
Even though manual tracing is burdensome, manual epicardial fat volume (EFV) segmentation procedures are currently widely used in clinical practice. Computer-aided tools have relieved some burdens by improving repeatability and processing time. However, this method remains costly. Semi-automated imaging methods have reduced the labor burden. For example, thresholding CT images has allowed experts to improve CAT tracing efficiency. Intensity pixel values are usually measured using the Hounsfield scale, and adipose tissue pixels have intensities between -250 HU and -30 HU[100]. With the rise of AI in recent years, DL approaches have obtained fast, automatic, and reliable segmentations unrivaled by previous efforts.[101,102,103] Automatic DL methods can be generalized in a two-stage process: the first stage is to localize the heart boundary in the 3D volume, and the second stage is to delineate the pericardium.[103] DL uses the training data itself to make CAT predictions. With the increase in more annotated databases and the strong research interest, DL methods continue to improve. Strong results in CAT prediction accuracy have been achieved as shown in Figure 11. However, DL efforts still rely on expert tracings as ground truth to compare the predictions. Table 3 shows automatic and semi-automatic studies to quantify CAT in CT.
4.3.3. CAT Quantification
Once segmented, quantification of the volume and thickness of CAT is necessary to assess CVD risk. CAT volume and CAT density are parameters often used to quantify EAT. CAT volume refers to the extent of CAT accumulation. An increase correlates with the prevalence and recurrence of AF and is associated with atherosclerosis, myocardial infarction, and coronary artery calcification.[52] CAT density is correlated with inflammation and is linked to plaque presence and progression.[109] CAT volume can be quantified from the number of fat voxels inside the pericardium border. The total volume can be estimated by summing the interslice volumes and multiplying by the number of slices. The mean CAT density can be obtained by computing the mean attenuation across all slices.[103] Automation of the quantification task significantly reduces the time burden, diminishes the variability of tracings by different observers, and results in high reproducibility.[17] Currently, DL methods are being extended from segmentation to include quantification. Recently, Abdulkareem et al.[17] proposed the first DL method to quantify both EAT volume and density, building on the Commandeur et al.[103] and Li et al.[104] approaches to segment and quantify CAT volume. Table 4 shows the quantitative results of manual and automatic efforts to measure CAT density and volume.
4.3.4. Limitations
While CT can be more accessible than MRI, CT remains a high-cost imaging modality with limited availability. CT also exposes patients to ionizing radiation. This can pose health risks, especially in repeated imaging protocols. Moreover, artifacts are common in CT images, reducing the quality of images and complicating accurate EAT and PAT assessments. For example, partial volume effects can blur tissue types together, resulting in a single voxel containing multiple tissues. This issue can cause over or underestimation of volume or density. Existing fully automatic methods show promising results to combat limitations and improve efficacy. However, segmentation and quantification results are still equal or inferior to inter-observer variability.[97] Labeled datasets are the biggest challenge to overcome in the segmentation and quantification of CAT. More publicly available datasets will help researchers improve promising results and continue addressing further CT limitations.
4.4. Echocardiography or Ultrasound (US)
Ultrasound (US) is a low-cost and non-invasive diagnostic and therapeutic imaging modality that offers real-time visualization of internal structures. This modality utilizes a transducer to transmit low-energy high-frequency sound wave pulses (in the megahertz range [3 to 30 MHz] – ultrasound signals) into the body and subsequently detects the reflected echoes (backscattered acoustic waves) generated by the tissue layers.[109,113] One specific application of US imaging is echocardiography, which focuses on the assessment of the heart. Echocardiograms typically employ grayscale or B-mode images as presented in Figure 13. These images are constructed based on the envelope of the received ultrasound wave signals acquired by the transducer.
4.4.1. Imaging Techniques
US waves are highly attenuated by bones and air. Consequently, imaging the heart necessitates avoiding the ribs and lungs, thereby restricting the available positions and angles for optimal image acquisition. Two principal approaches consist of taking US images from the patient’s chest (transthoracic) and esophagus (transesophageal) echocardiograms (TTE and TEE respectively).[114] When performing TTE, the transducer should be located at the following acoustic windows: 1) parasternal, 2) apical, or 3) subcostal, and 4) suprasternal as shown in Figure 12. On each window, by tilting, rotating, and translating the transducer, different views of the cardiac structures can be captured. Quantitative US (QUS) is an US imaging technique that involves signal processing methods used on the sound waves to provide estimates of the attenuation and backscattering properties of the interrogated tissue. Some clinical applications of QUS include the diagnosis of fatty liver disease, the detection of preterm birth risk, and the characterization and classification of nodules in the thyroids and kidneys.[109]
4.4.2. CAT Segmentation
The segmentation of AT using echocardiograms is a complex task that requires expertise, time investment, and good image quality. Image quality is affected by several factors such as low image contrast, shadows from body structures (ribs and dense muscles), varying speckle noise, and low signal-to-noise ratio.[117] Many studies have focused on the segmentation of the main cardiac structures, targeting the measurement of the LV area and volume, subsequently used to compute EF, one of the most relevant parameters for cardiac risk assessment.[117,118,119,120,121,122] Studies using QUS have employed predefined ROIs to classify them as containing AT or not containing AT,[123] or have used the contours of the epicardium to segment and classify AT around the heart.[122] A limited number of investigations identified on CAT segmentation via US were found, this underscores the critical need for further exploration in this domain leading to a more precise, comprehensive, fast, and reliable CAT quantification.
4.4.3. CAT Quantification
Transthoracic echocardiography (TTE) is used for quantification of EAT using ultrasound (US). Parasternal long axes (PLAX) and parasternal short axes (PSAX) echocardiographic views are used for EAT quantification because they allow the most accurate measurements.[124] The free wall of the right ventricle has been identified as having the highest absolute adipose tissue thickness, allowing measurements that are not affected by the hypertrophy of some cardiac structures.[125] In this area of the heart, the adipose tissue is most easily visible, and appears as an echo-free space between the visceral layer of the pericardium and the outer wall of the myocardium as shown in Figure 13.[5]
In the study performed by Iacobellis,[124] measurements of EAT thickness were correlated with anthropometric variables related to obesity. Their quantification of EAT varies between 1.9 to 15.7 mm with a mean and deviation of 7.3 ± 3.42 mm in men, and 6.84 ± 2.76 mm in women. To avoid oblique measurements of EAT using US, in Nesti et al.[126], measurements have been taken perpendicular to the aortic annulus, using it as an anatomic landmark as shown in Figure 14 (left). Some studies have shown their ability to differentiate and measure EAT and PAT thicknesses Figure 14 (right).[26] Table 5 summarizes the studies found in this literature review where the CAT thickness measured over the RV was identified as a marker for several types of CAD.
4.4.4. Limitations
Compared with MRI and CT, the main limitation of echocardiography is image resolution. In addition, fat quantification is limited to linear thickness measurements in particular locations without volumetric computations,[131] and the differentiation between EAT and PAT is not possible.[132] Finally, the accuracy and reproducibility of the adipose thickness measurements have a lower precision when compared to other imaging modalities.[20] US imaging is limited by anatomical constraints, making it impossible to image the heart from all the angles and positions. Certain crucial regions, such as those adjacent to the coronary arteries, where fat depositions are highly correlated with plaque development, are often challenging to image using echocardiography.
5. Conclusions
In conclusion, this review has explored medical imaging modalities to assess the multifaceted relationship between adipose tissue and cardiovascular health. We examined the various types of fat surrounding the heart, highlighting the potential role of CAT in promoting cardiovascular disease. MRI, CT, and echocardiography were identified as the primary imaging modalities for assessing cardiac fat, each offering unique advantages and limitations in segmentation and quantification. Table 6 Summarizes and compares the main features offered for each imaging modality for CAT segmentation and quantification. While significant advancements have been made, challenges remain in accurately measuring and interpreting fat distribution around the heart. Future research efforts should focus on refining segmentation techniques, establishing standardized protocols, and elucidating the specific mechanisms by which adipose tissue contributes to cardiovascular risk. By addressing these limitations, we can leverage the power of cardiac fat imaging to improve risk stratification, guide treatment strategies, and ultimately promote better cardiovascular health outcomes.
Funding
This work was supported by the American Heart Association – AHA (Predoctoral fellowship https://doi.org/10.58275/AHA.24PRE1188140.pc.gr.190654 to Julian R. Cuellar).
Conflicts of Interest
All authors declare to have no conflicts of interest.
References
- Kim, I.K.; Song, B.W.; Lim, S.; Kim, S.W.; Lee, S. The Role of Epicardial Adipose Tissue-Derived MicroRNAs in the Regulation of Cardiovascular Disease: A Narrative Review. Biology. 2023, 12, 498. [Google Scholar] [CrossRef]
- Adipose Tissue: What Is It, Location, Function, and More | Osmosis. Available online: https://www.osmosis.org/answers/adipose-tissue (accessed on 6 June 2024).
- Sacks, H.; Symonds, M.E. Anatomical Locations of Human Brown Adipose Tissue: Functional Relevance and Implications in Obesity and Type 2 Diabetes. Diabetes. 2013, 62, 1783–1790. [Google Scholar] [CrossRef]
- Farese, R.V.; Walther, T.C. Lipid Droplets Finally Get a Little R-E-S-P-E-C-T. Cell. 2009, 139, 855–860. [Google Scholar] [CrossRef]
- Gaborit, B.; Sengenes, C.; Ancel, P.; Jacquier, A.; Dutour, A. Role of Epicardial Adipose Tissue in Health and Disease: A Matter of Fat? Comprehensive Physiology. 2017, 7, 1051–1082. [Google Scholar] [CrossRef]
- Iacobellis, G. Local and systemic effects of the multifaceted epicardial adipose tissue depot. Nat Rev Endocrinol. 2015, 11, 363–371. [Google Scholar] [CrossRef] [PubMed]
- Cheładze, P.; Martuszewski, A.; Poręba, R.; Gać, P. The Importance of the Assessment of Epicardial Adipose Tissue in Scientific Research. J Clin Med. 2022, 11, 5621. [Google Scholar] [CrossRef]
- Konwerski, M.; Gąsecka, A.; Opolski, G.; Grabowski, M.; Mazurek, T. Role of Epicardial Adipose Tissue in Cardiovascular Diseases: A Review. Biology. 2022, 11, 355. [Google Scholar] [CrossRef] [PubMed]
- Mazurek, T.; Zhang, L.; Zalewski, A.; et al. Human Epicardial Adipose Tissue Is a Source of Inflammatory Mediators. Circulation. 2003, 108, 2460–2466. [Google Scholar] [CrossRef]
- Chhabra, L.; Gurukripa Kowlgi, N. Cardiac adipose tissue: Distinction between epicardial and pericardial fat remains important! International Journal of Cardiology. 2015, 201, 274–275. [Google Scholar] [CrossRef]
- Krauz, K.; Kempiński, M.; Jańczak, P.; et al. The Role of Epicardial Adipose Tissue in Acute Coronary Syndromes, Post-Infarct Remodeling and Cardiac Regeneration. International Journal of Molecular Sciences. 2024, 25, 3583. [Google Scholar] [CrossRef]
- Silaghi, A.; Piercecchi-Marti, M.D.; Grino, M.; et al. Epicardial adipose tissue extent: Relationship with age, body fat distribution, and coronaropathy. Obesity (Silver Spring). 2008, 16, 2424–2430. [Google Scholar] [CrossRef] [PubMed]
- Rhee, T.M.; Lee, J.H.; Choi, E.K.; et al. Increased Risk of Atrial Fibrillation and Thromboembolism in Patients with Severe Psoriasis: A Nationwide Population-based Study. Sci Rep. 2017, 7, 9973. [Google Scholar] [CrossRef]
- Gaeta, M.; Bandera, F.; Tassinari, F.; et al. Is epicardial fat depot associated with atrial fibrillation? A systematic review and meta-analysis. Europace. 2017, 19, 747–752. [Google Scholar] [CrossRef] [PubMed]
- Zhou, M.; Wang, H.; Chen, J.; Zhao, L. Epicardial adipose tissue and atrial fibrillation: Possible mechanisms, potential therapies, and future directions. Pacing Clin Electrophysiol. 2020, 43, 133–145. [Google Scholar] [CrossRef]
- Xiao, J.; Lu, Y.; Yang, X. Ultrasound Detection of Epicardial Adipose Tissue Combined With Ischemic Modified Albumin in the Diagnosis of Coronary Heart Disease. The Heart Surgery Forum. 2020, 23, E461–E464. [Google Scholar] [CrossRef] [PubMed]
- Abdulkareem, M.; Brahier, M.S.; Zou, F.; et al. Quantification of Epicardial Adipose Tissue Volume and Attenuation for Cardiac CT Scans Using Deep Learning in a Single Multi-Task Framework. Rev Cardiovasc Med. 2022, 23, 412. [Google Scholar] [CrossRef]
- Iacobellis, G. Epicardial adipose tissue in contemporary cardiology. Nat Rev Cardiol. 2022, 19, 593–606. [Google Scholar] [CrossRef]
- Mahmoud, I.; Dykun, I.; Kärner, L.; et al. Epicardial adipose tissue differentiates in patients with and without coronary microvascular dysfunction. Int J Obes. 2021, 45, 2058–2063. [Google Scholar] [CrossRef]
- Song, Y.; Tan, Y.; Deng, M.; et al. Epicardial adipose tissue, metabolic disorders, and cardiovascular diseases: Recent advances classified by research methodologies. MedComm. 2023, 4, e413. [Google Scholar] [CrossRef]
- van Woerden, G.; van Veldhuisen, D.J.; Westenbrink, B.D.; de Boer, R.A.; Rienstra, M.; Gorter, T.M. Connecting epicardial adipose tissue and heart failure with preserved ejection fraction: Mechanisms, management and modern perspectives. European Journal of Heart Failure. 2022, 24, 2238–2250. [Google Scholar] [CrossRef]
- Si, Y.; Feng, Z.; Liu, Y.; et al. Inflammatory biomarkers, angiogenesis and lymphangiogenesis in epicardial adipose tissue correlate with coronary artery disease. Sci Rep. 2023, 13, 2831. [Google Scholar] [CrossRef]
- Drake, R.; Vogl, A.W.; Mitchell, A.W.M. Gray’s Anatomy for Students E-Book. Elsevier Health Sciences; 2014.
- Stauffer, C.M.; Meshida, K.; Bernor, R.L.; Granite, G.E.; Boaz, N.T. Anatomy, Thorax, Pericardiacophrenic Vessels. In: StatPearls. StatPearls Publishing; 2024. Available online: http://www.ncbi.nlm.nih.gov/books/NBK559242/ (accessed on 20 June 2024).
- Ding, J.; Kritchevsky, S.B.; Harris, T.B.; et al. The Association of Pericardial Fat With Calcified Coronary Plaque. Obesity. 2008, 16, 1914–1919. [Google Scholar] [CrossRef] [PubMed]
- Pericardial Rather Than Epicardial Fat is a Cardiometabolic Risk Marker: An MRI vs Echo Study - ClinicalKey. Available online: https://www.clinicalkey.com/#!/content/playContent/1-s2.0-S0894731711004718?returnurl=https:%2F%2Flinkinghub.elsevier.com%2Fretrieve%2Fpii%2FS0894731711004718%3Fshowall%3Dtrue&referrer= (accessed on 19 June 2024).
- Yamaguchi, Y.; Cavallero, S.; Patterson, M.; et al. Adipogenesis and epicardial adipose tissue: A novel fate of the epicardium induced by mesenchymal transformation and PPARγ activation. Proceedings of the National Academy of Sciences. 2015, 112, 2070–2075. [Google Scholar] [CrossRef]
- Mahabadi, A.A.; Massaro, J.M.; Rosito, G.A.; et al. Association of pericardial fat, intrathoracic fat, and visceral abdominal fat with cardiovascular disease burden: The Framingham Heart Study. Eur Heart, J. 2009, 30, 850–856. [Google Scholar] [CrossRef]
- Rodrigues, É.O. On the Automated Segmentation of Epicardial and Mediastinal Cardiac Adipose Tissues Using Classification Algorithms.
- Zhang, P.; Konja, D.; Wang, Y. Adipose tissue secretory profile and cardiometabolic risk in obesity. Endocrine and Metabolic Science. 2020, 1, 100061. [Google Scholar] [CrossRef]
- Grigoras, A.; Amalinei, C.; Balan, R.A.; Giusca, S.E.; Caruntu, I.D. Perivascular adipose tissue in cardiovascular diseases-an update. Anatol J Cardiol. 2019, 22, 219–231. [Google Scholar] [CrossRef] [PubMed]
- Tran, K.V.; Fitzgibbons, T.; Min, S.Y.; DeSouza, T.; Corvera, S. Distinct adipocyte progenitor cells are associated with regional phenotypes of perivascular aortic fat in mice. Molecular Metabolism. 2018, 9, 199–206. [Google Scholar] [CrossRef]
- van Dam, A.D.; Boon, M.R.; Berbée, J.F.P.; Rensen, P.C.N.; van Harmelen, V. Targeting white, brown and perivascular adipose tissue in atherosclerosis development. European Journal of Pharmacology. 2017, 816, 82–92. [Google Scholar] [CrossRef]
- Virdis, A.; Duranti, E.; Rossi, C.; et al. Tumour necrosis factor-alpha participates on the endothelin-1/nitric oxide imbalance in small arteries from obese patients: Role of perivascular adipose tissue. Eur Heart J. 2015, 36, 784–794. [Google Scholar] [CrossRef]
- Withers, S.B.; Bussey, C.E.; Saxton, S.N.; Melrose, H.M.; Watkins, A.E.; Heagerty, A.M. Mechanisms of adiponectin-associated perivascular function in vascular disease. Arterioscler Thromb Vasc Biol. 2014, 34, 1637–1642. [Google Scholar] [CrossRef]
- Association, A.H.; American Stroke Association. Cardiovascular Disease: A Costly Burden for America Projections Through 2035. Available online: chrome-extension://efaidnbmnnnibpcajpcglclefindmkaj/https://www.heart.org/-/media/Files/About-Us/Policy-Research/Fact-Sheets/Public-Health-Advocacy-and-Research/CVD-A-Costly-Burden-for-America-Projections-Through-2035.pdf.
- Milewicz, D.M.; Seidman, C.E. Genetics of Cardiovascular Disease. Circulation. 2000, 102 (Suppl. S4), Iv-103. [Google Scholar] [CrossRef]
- Nerlekar, N.; Thakur, U.; Lin, A.; et al. The Natural history of Epicardial Adipose Tissue Volume and Attenuation: A long-term prospective cohort follow-up study. Sci Rep. 2020, 10, 7109. [Google Scholar] [CrossRef] [PubMed]
- What’s Draggin’ Your Heart Down? Cleveland Clinic. Available online: https://my.clevelandclinic.org/health/diseases/16898-coronary-artery-disease (accessed on 29 May 2024).
- Coronary artery disease - Symptoms and causes. Mayo Clinic. Available online: https://www.mayoclinic.org/diseases-conditions/coronary-artery-disease/symptoms-causes/syc-20350613 (accessed on 29 May 2024).
- Mancio, J.; Azevedo, D.; Saraiva, F.; et al. Epicardial adipose tissue volume assessed by computed tomography and coronary artery disease: A systematic review and meta-analysis. European Heart Journal - Cardiovascular Imaging. 2018, 19, 490–497. [Google Scholar] [CrossRef] [PubMed]
- Ding, J.; Hsu, F.C.; Harris, T.B.; et al. The association of pericardial fat with incident coronary heart disease: The Multi-Ethnic Study of Atherosclerosis (MESA). Am J Clin Nutr. 2009, 90, 499–504. [Google Scholar] [CrossRef] [PubMed]
- Wu, F.Z.; Huang, Y.L.; Wang, Y.C.; et al. Impact of location of epicardial adipose tissue, measured by coronary artery calcium-scoring computed tomography on obstructive coronary artery disease. Am J Cardiol. 2013, 112, 943–949. [Google Scholar] [CrossRef]
- Hirata, Y.; Yamada, H.; Kusunose, K.; et al. Clinical Utility of Measuring Epicardial Adipose Tissue Thickness with Echocardiography Using a High-Frequency Linear Probe in Patients with Coronary Artery Disease. J Am Soc Echocardiogr. 2015, 28, 1240–1246.e1. [Google Scholar] [CrossRef]
- Bachar, G.N.; Dicker, D.; Kornowski, R.; Atar, E. Epicardial adipose tissue as a predictor of coronary artery disease in asymptomatic subjects. Am J Cardiol. 2012, 110, 534–538. [Google Scholar] [CrossRef]
- Heart failure - Symptoms and causes. Mayo Clinic. Available online: https://www.mayoclinic.org/diseases-conditions/heart-failure/symptoms-causes/syc-20373142 (accessed on 19 June 2024).
- Malik, A.; Brito, D.; Vaqar, S.; Chhabra, L. Congestive Heart Failure. In StatPearls. StatPearls Publishing; 2024. Available online: http://www.ncbi.nlm.nih.gov/books/NBK430873/ (accessed on 19 June 2024).
- Pugliese, N.R.; Paneni, F.; Mazzola, M.; et al. Impact of epicardial adipose tissue on cardiovascular haemodynamics, metabolic profile, and prognosis in heart failure. Eur J Heart Fail. 2021, 23, 1858–1871. [Google Scholar] [CrossRef]
- Tromp, J.; Bryant, J.A.; Jin, X.; et al. Epicardial fat in heart failure with reduced versus preserved ejection fraction. Eur J Heart Fail. 2021, 23, 835–838. [Google Scholar] [CrossRef]
- Li, C.; Liu, X.; Adhikari, B.K.; et al. The role of epicardial adipose tissue dysfunction in cardiovascular diseases: An overview of pathophysiology, evaluation, and management. Front Endocrinol. 2023, 14. [Google Scholar] [CrossRef]
- Large, S.R.; Hosseinpour, A.R.; Wisbey, C.; Wells, F.C. Spontaneous cardioversion and mitral valve repair: A role for surgical cardioversion (Cox-maze)? Eur J Cardiothorac Surg. 1997, 11, 76–80. [Google Scholar] [CrossRef] [PubMed]
- Schneider, M.P.; Hua, T.A.; Böhm, M.; Wachtell, K.; Kjeldsen, S.E.; Schmieder, R.E. Prevention of atrial fibrillation by Renin-Angiotensin system inhibition a meta-analysis. J Am Coll Cardiol. 2010, 55, 2299–2307. [Google Scholar] [CrossRef] [PubMed]
- Tsao, H.M.; Hu, W.C.; Wu, M.H.; et al. Quantitative analysis of quantity and distribution of epicardial adipose tissue surrounding the left atrium in patients with atrial fibrillation and effect of recurrence after ablation. Am J Cardiol. 2011, 107, 1498–1503. [Google Scholar] [CrossRef]
- Nakanishi, K.; Fukuda, S.; Tanaka, A.; et al. Peri-atrial epicardial adipose tissue is associated with new-onset nonvalvular atrial fibrillation. Circ, J. 2012, 76, 2748–2754. [Google Scholar] [CrossRef]
- Nagashima, K.; Okumura, Y.; Watanabe, I.; et al. Association between epicardial adipose tissue volumes on 3-dimensional reconstructed CT images and recurrence of atrial fibrillation after catheter ablation. Circ, J. 2011, 75, 2559–2565. [Google Scholar] [CrossRef]
- Steenbergen, C.; Frangogiannis, N.G. Chapter 36—Ischemic Heart Disease. In: Hill, J.A.; Olson, E.N.; eds. Muscle. Academic Press; 2012; pp. 495–521. [CrossRef]
- Gul, Z.; Shams, P.; Makaryus, A.N. Silent Myocardial Ischemia. In: StatPearls. StatPearls Publishing; 2024. Available online: http://www.ncbi.nlm.nih.gov/books/NBK536915/ (accessed on 18 June 2024).
- Tamarappoo, B.; Dey, D.; Shmilovich, H.; et al. Increased pericardial fat volume measured from noncontrast CT predicts myocardial ischemia by SPECT. JACC Cardiovasc Imaging. 2010, 3, 1104–1112. [Google Scholar] [CrossRef] [PubMed]
- Hell, M.M.; Ding, X.; Rubeaux, M.; et al. Epicardial adipose tissue volume but not density is an independent predictor for myocardial ischemia. J Cardiovasc Comput Tomogr. 2016, 10, 141–149. [Google Scholar] [CrossRef]
- Mitral valve stenosis - Symptoms and causes. Mayo Clinic. Available online: https://www.mayoclinic.org/diseases-conditions/mitral-valve-stenosis/symptoms-causes/syc-20353159 (accessed on 29 May 2024).
- Mahabadi, A.A.; Kahlert, H.A.; Dykun, I.; Balcer, B.; Kahlert, P.; Rassaf, T. Epicardial Adipose Tissue Thickness Independently Predicts Severe Aortic Valve Stenosis. J Heart Valve Dis. 2017, 26, 262–267. [Google Scholar]
- Nabati, M.; Salehi, A.; Hatami, G.; Dabirian, M.; Yazdani, J.; Parsaee, H. Epicardial adipose tissue and its association with cardiovascular risk factors and mitral annular calcium deposits. Ultrasound. 2019, 27, 217–224. [Google Scholar] [CrossRef]
- Aortic valve stenosis - Symptoms and causes. Mayo Clinic. Available online: https://www.mayoclinic.org/diseases-conditions/aortic-stenosis/symptoms-causes/syc-20353139 (accessed on 29 May 2024).
- Liu, C.Y.; Redheuil, A.; Ouwerkerk, R.; Lima, J.A.C.; Bluemke, D.A. Myocardial Fat Quantification in Humans: Evaluation by Two-Point Water-Fat Imaging and Localized Proton Spectroscopy. Magn Reson Med. 2010, 63, 892–901. [Google Scholar] [CrossRef]
- Wu, C.K.; Lee, J.K.; Hsu, J.C.; et al. Myocardial adipose deposition and the development of heart failure with preserved ejection fraction. European Journal of Heart Failure. 2020, 22, 445–454. [Google Scholar] [CrossRef] [PubMed]
- Schimmel, K.; Ichimura, K.; Reddy, S.; Haddad, F.; Spiekerkoetter, E. Cardiac Fibrosis in the Pressure Overloaded Left and Right Ventricle as a Therapeutic Target. Frontiers in Cardiovascular Medicine. 2022, 9, 886553. [Google Scholar] [CrossRef]
- Wu, C.K.; Tsai, H.Y.; Su, M.Y.M.; et al. Evolutional change in epicardial fat and its correlation with myocardial diffuse fibrosis in heart failure patients. Journal of Clinical Lipidology. 2017, 11, 1421–1431. [Google Scholar] [CrossRef] [PubMed]
- Ismail, I.; Al-Khafaji, K.; Mutyala, M.; et al. Cardiac lipoma. J Community Hosp Intern Med Perspect. 2015, 5, 10.3402–jchimp.v5. [Google Scholar] [CrossRef]
- Radswiki, T. Cardiac lipoma | Radiology Reference Article | Radiopaedia.org. Radiopaedia. [CrossRef]
- Weerakkody, Y. Epicardial lipomatosis | Radiology Reference Article | Radiopaedia.org. Radiopaedia. [CrossRef]
- Myerson, S.G.; Roberts, R.; Moat, N.; Pennell, D.J. Tamponade caused by cardiac lipomatous hypertrophy. J Cardiovasc Magn Reson. 2004, 6, 565–568. [Google Scholar] [CrossRef]
- Miller, C.A.; Schmitt, M. Epicardial Lipomatous Hypertrophy Mimicking Pericardial Effusion. Circulation: Cardiovascular Imaging. 2011, 4, 77–78. [Google Scholar] [CrossRef]
- Gaillard, F. Lipomatous hypertrophy of the interatrial septum | Radiology Reference Article | Radiopaedia.org. Radiopaedia. [CrossRef]
- Antonopoulos, A.S.; Antoniades, C. Cardiac Magnetic Resonance Imaging of Epicardial and Intramyocardial Adiposity as an Early Sign of Myocardial Disease. Circulation: Cardiovascular Imaging. 2018, 11, e008083. [Google Scholar] [CrossRef]
- Marwan, M.; Koenig, S.; Schreiber, K.; et al. Quantification of epicardial adipose tissue by cardiac CT: Influence of acquisition parameters and contrast enhancement. European Journal of Radiology. 2019, 121, 108732. [Google Scholar] [CrossRef]
- Iacobellis, G.; Willens, H.J. Echocardiographic Epicardial Fat: A Review of Research and Clinical Applications. Journal of the American Society of Echocardiography. 2009, 22, 1311–1319. [Google Scholar] [CrossRef]
- Pohost, G.M. The History of Cardiovascular Magnetic Resonance. JACC: Cardiovascular Imaging. 2008, 1, 672–678. [Google Scholar] [CrossRef]
- Guglielmo, M.; Lin, A.; Dey, D.; et al. Epicardial fat and coronary artery disease: Role of cardiac imaging. Atherosclerosis. 2021, 321, 30–38. [Google Scholar] [CrossRef]
- Bertaso, A.G.; Bertol, D.; Duncan, B.B.; Foppa, M. Epicardial Fat: Definition, Measurements and Systematic Review of Main Outcomes. Arquivos Brasileiros de Cardiologia. Published online 2013. [CrossRef]
- Salerno, M.; Sharif, B.; Arheden, H.; et al. Recent Advances in Cardiovascular Magnetic Resonance: Techniques and Applications. Circ: Cardiovascular Imaging. 2017, 10, e003951. [Google Scholar] [CrossRef] [PubMed]
- Ahmed, N.; Carrick, D.; Layland, J.; Oldroyd, K.G.; Berry, C. The Role of Cardiac Magnetic Resonance Imaging (MRI) in Acute Myocardial Infarction (AMI). Heart, Lung and Circulation. 2013, 22, 243–255. [Google Scholar] [CrossRef]
- Curtis, A.D.; Cheng, H.M. Primer and Historical Review on Rapid Cardiac CINE MRI. Magnetic Resonance Imaging. 2022, 55, 373–388. [Google Scholar] [CrossRef]
- Homsi, R.; Meier-Schroers, M.; Gieseke, J.; et al. 3D-Dixon MRI based volumetry of peri- and epicardial fat. Int J Cardiovasc Imaging. 2016, 32, 291–299. [Google Scholar] [CrossRef] [PubMed]
- Militello, C.; Rundo, L.; Toia, P.; et al. A semi-automatic approach for epicardial adipose tissue segmentation and quantification on cardiac CT scans. Computers in Biology and Medicine. 2019, 114, 103424. [Google Scholar] [CrossRef]
- Malavazos, A.E.; Di Leo, G.; Secchi, F.; et al. Relation of Echocardiographic Epicardial Fat Thickness and Myocardial Fat. The American Journal of Cardiology. 2010, 105, 1831–1835. [Google Scholar] [CrossRef]
- Chen, S.; An, D.; Feng, C.; Bian, Z.; Wu, L.M. Segmentation of Pericardial Adipose Tissue in CMR Images: A Benchmark Dataset MRPEAT and a Triple-Stage Network 3SUnet. IEEE Trans Med Imaging. 2023, 42, 2386–2399. [Google Scholar] [CrossRef]
- Feng, F.; Carlhäll, C.J.; Tan, Y.; et al. FM-Net: A Fully Automatic Deep Learning Pipeline for Epicardial Adipose Tissue Segmentation. In Statistical Atlases and Computational Models of the Heart. Regular and CMRxRecon Challenge Papers; Notes in Computer Science; Camara, O., Puyol-Antón, E., Sermesant, M., et al., Eds.; Switzerland: Springer Nature, 2024; Volume 14507, pp. 88–97. [Google Scholar] [CrossRef]
- Daudé, P.; Ancel, P.; Confort Gouny, S.; et al. Deep-Learning Segmentation of Epicardial Adipose Tissue Using Four-Chamber Cardiac Magnetic Resonance Imaging. Diagnostics. 2022, 12, 126. [Google Scholar] [CrossRef]
- Kulasekara, M.; Dinh, V.Q.; Fernandez-del-Valle, M.; Klingensmith, J.D. Comparison of two-dimensional and three-dimensional U-Net architectures for segmentation of adipose tissue in cardiac magnetic resonance images. Med Biol Eng Comput. 2022, 60, 2291–2306. [Google Scholar] [CrossRef]
- Fulton, M.R.; Givan, A.H.; Fernandez-del-Valle, M.; Klingensmith, J.D. Segmentation of epicardial adipose tissue in cardiac MRI using deep learning. In: Gimi, B.S.; Krol, A.; eds. Medical Imaging 2020: Biomedical Applications in Molecular, Structural, and Functional Imaging. SPIE; 2020, 25. [CrossRef]
- Requena-Ibáñez, J.A.; Santos-Gallego, C.G.; Rodriguez Cordero, A.J.; et al. Not only how much, but also how to, when measuring epicardial adipose tissue. Magnetic Resonance Imaging. 2022, 86, 149–151. [Google Scholar] [CrossRef] [PubMed]
- Henningsson, M.; Brundin, M.; Scheffel, T.; Edin, C.; Viola, F.; Carlhäll, C.J. Quantification of epicardial fat using 3D cine Dixon, M.R.I. BMC Med Imaging. 2020, 20, 80. [Google Scholar] [CrossRef] [PubMed]
- Guglielmo, M.; Penso, M.; Carerj, M.L.; et al. DEep LearnIng-based QuaNtification of epicardial adipose tissue predicts MACE in patients undergoing stress, C.M.R. Atherosclerosis 2024, 117549. [Google Scholar] [CrossRef] [PubMed]
- Secchi, F.; Asteria, C.; Monti, C.B.; et al. Quantification of epicardial adipose tissue in obese patients using an open-bore MR scanner. Eur Radiol Exp. 2022, 6, 25. [Google Scholar] [CrossRef]
- Meloni, A.; Frijia, F.; Panetta, D.; et al. Photon-Counting Computed Tomography (PCCT): Technical Background and Cardio-Vascular Applications. Diagnostics. 2023, 13, 645. [Google Scholar] [CrossRef]
- Flohr, T.; Schmidt, B.; Ulzheimer, S.; Alkadhi, H. Cardiac imaging with photon counting, C.T. The British Journal of Radiology. 2023, 96, 20230407. [Google Scholar] [CrossRef]
- Benčević, M.; Galić, I.; Habijan, M.; Pižurica, A. Recent Progress in Epicardial and Pericardial Adipose Tissue Segmentation and Quantification Based on Deep Learning: A Systematic Review. Applied Sciences. 2022, 12, 5217. [Google Scholar] [CrossRef]
- Greco, F.; Salgado, R.; Van Hecke, W.; Del Buono, R.; Parizel, P.M.; Mallio, C.A. Epicardial and pericardial fat analysis on CT images and artificial intelligence: A literature review. Quant Imaging Med Surg. 2022, 12, 2075–2089. [Google Scholar] [CrossRef]
- La Grutta, L.; Toia, P.; Farruggia, A.; et al. Quantification of epicardial adipose tissue in coronary calcium score and CT coronary angiography image data sets: Comparison of attenuation values, thickness and volumes. BJR. 2016, 89, 20150773. [Google Scholar] [CrossRef]
- Marwan, M.; Achenbach, S. Quantification of epicardial fat by computed tomography: Why, when and how? Journal of Cardiovascular Computed Tomography. 2013, 7, 3–10. [Google Scholar] [CrossRef] [PubMed]
- He, X.; Guo, B.; Lei, Y.; et al. Automatic epicardial fat segmentation in cardiac CT imaging using 3D deep attention U-Net. In: Landman, B.A.; Išgum, I.; eds. Medical Imaging 2020: Image Processing. SPIE; 2020:84. [CrossRef]
- Bencevic, M.; Habijan, M.; Galic, I. Epicardial Adipose Tissue Segmentation from CT Images with A Semi-3D Neural Network. In: 2021 International Symposium ELMAR. IEEE; 2021:87-90. [CrossRef]
- Commandeur, F.; Goeller, M.; Razipour, A.; et al. Fully Automated CT Quantification of Epicardial Adipose Tissue by Deep Learning: A Multicenter Study. Radiology: Artificial Intelligence. 2019, 1, e190045. [Google Scholar] [CrossRef]
- Li, X.; Sun, Y.; Xu, L.; et al. Automatic quantification of epicardial adipose tissue volume. Medical Physics. 2021, 48, 4279–4290. [Google Scholar] [CrossRef]
- Zhang, Q.; Zhou, J.; Zhang, B.; Jia, W.; Wu, E. Automatic Epicardial Fat Segmentation and Quantification of CT Scans Using Dual U-Nets With a Morphological Processing Layer. IEEE Access. 2020, 8, 128032–128041. [Google Scholar] [CrossRef]
- Priya, C.; Sudha, S. Adaptive Fruitfly Based Modified Region Growing Algorithm for Cardiac Fat Segmentation Using Optimal Neural Network. J Med Syst. 2019, 43, 104. [Google Scholar] [CrossRef]
- Norlén, A.; Alvén, J.; Molnar, D.; et al. Automatic pericardium segmentation and quantification of epicardial fat from computed tomography angiography. J Med Imaging (Bellingham). 2016, 3, 034003. [Google Scholar] [CrossRef]
- Rodrigues, É.O.; Morais, F.F.C.; Morais, N.A.O.S.; Conci, L.S.; Neto, L.V.; Conci, A. A novel approach for the automated segmentation and volume quantification of cardiac fats on computed tomography. Computer Methods and Programs in Biomedicine. 2016, 123, 109–128. [Google Scholar] [CrossRef] [PubMed]
- Vajihi, Z.; Rosado-Mendez, I.; Hall, T.J.; Rivaz, H. L1 And L2 Norm Depth-Regularized Estimation Of The Acoustic Attenuation And Backscatter Coefficients Using Dynamic Programming. In Proceedings of the 2019 IEEE 16th International Symposium on Biomedical Imaging (ISBI 2019); 2019; pp. 1749–1752. [Google Scholar] [CrossRef]
- Hoori, A.; Hu, T.; Lee, J.; Al-Kindi, S.; Rajagopalan, S.; Wilson, D.L. Deep learning segmentation and quantification method for assessing epicardial adipose tissue in CT calcium score scans. Sci Rep. 2022, 12, 2276. [Google Scholar] [CrossRef] [PubMed]
- Commandeur, F.; Goeller, M.; Betancur, J.; et al. Deep Learning for Quantification of Epicardial and Thoracic Adipose Tissue From Non-Contrast, C.T. IEEE Trans Med Imaging. 2018, 37, 1835–1846. [Google Scholar] [CrossRef]
- D’Errico, L.; Salituri, F.; Ciardetti, M.; et al. Quantitative analysis of epicardial fat volume: Effects of scanning protocol and reproducibility of measurements in non-contrast cardiac CT vs. coronary CT angiography. Quant Imaging Med Surg. 2017, 7, 326–335. [Google Scholar] [CrossRef]
- Insana, M. Handbook of Physics in Medicine and Biology - Ultrasonic Imaging. 0 ed. (Splinter, R.; ed.). CRC Press; 2010. [CrossRef]
- Finel, V. 3D ultrafast echocardiography: Doctoral Thesis. Sorbonne; 2018.
- Standard Transthoracic Echocardiogram: Complete Imaging Protocol. Cardiovascular Education. Available online: https://ecgwaves.com/topic/the-standard-adult-transthoracic-echocardiogram-a-protocol-to-obtain-a-complete-study/ (accessed on 8 July 2024).
- My medical illustrations. Patrick Lynch. January 22, 2017. Available online: https://coastfieldguides.com/my-medical-illustrations/ (accessed on 8 July 2024).
- Chen, C.; Qin, C.; Qiu, H.; et al. Deep Learning for Cardiac Image Segmentation: A Review. Front Cardiovasc Med. 2020, 7. [Google Scholar] [CrossRef]
- Leclerc, S.; Smistad, E.; Pedrosa, J.; et al. Deep Learning for Segmentation Using an Open Large-Scale Dataset in 2D Echocardiography. IEEE Trans Med Imaging. 2019, 38, 2198–2210. [Google Scholar] [CrossRef]
- MoosaviTayebi, R. Echocardiography Image Segmentation: A Survey. IEEE. Available online: https://www.academia.edu/7479069/Echocardiography_Image_Segmentation_A_Survey (accessed on 18 April 2024).
- Painchaud, N.; Duchateau, N.; Bernard, O.; Jodoin, P.M. Echocardiography Segmentation With Enforced Temporal Consistency. IEEE Trans Med Imaging. 2022, 41, 2867–2878. [Google Scholar] [CrossRef] [PubMed]
- Zyuzin, V.; Mukhtarov, A.; Neustroev, D.; Chumarnaya, T. Segmentation of 2D Echocardiography Images using Residual Blocks in U-Net Architectures. In: 2020 Ural Symposium on Biomedical Engineering, Radioelectronics and Information Technology (USBEREIT). ; 2020:499-502. [CrossRef]
- Cuellar, J.R.; Gillette, L.; Dinh, V.; Woodard, P.; Burri, M.; Klingensmith, J.D. Echocardiogram image segmentation and cardiac adipose tissue estimation using spectral analysis and deep learning.
- Klingensmith, J.D.; Karlapalem, A.; Kulasekara, M.M.; Fernandez-del-Valle, M. Spectral analysis of ultrasound radiofrequency backscatter for the identification of epicardial adipose tissue. J Med Imag. [CrossRef]
- Iacobellis, G.; Assael, F.; Ribaudo, M.C.; et al. Epicardial Fat from Echocardiography: A New Method for Visceral Adipose Tissue Prediction. Obesity Research. 2003, 11, 304–310. [Google Scholar] [CrossRef] [PubMed]
- Schejbal, V. [Epicardial fatty tissue of the right ventricle--morphology, morphometry and functional significance]. Pneumologie. 1989, 43, 490–499. [Google Scholar] [PubMed]
- Nesti, L.; Pugliese, N.R.; Chiriacò, M.; Trico, D.; Baldi, S.; Natali, A. Epicardial adipose tissue thickness is associated with reduced peak oxygen consumption and systolic reserve in patients with type 2 diabetes and normal heart function. Diabetes Obes Metab. 2023, 25, 177–188. [Google Scholar] [CrossRef]
- Wang, Q.; Chi, J.; Wang, C.; Yang, Y.; Tian, R.; Chen, X. Epicardial Adipose Tissue in Patients with Coronary Artery Disease: A Meta-Analysis. J Cardiovasc Dev Dis. 2022, 9, 253. [Google Scholar] [CrossRef]
- Eren, H.; Omar, M.B.; Öcal, L. Epicardial fat tissue may predict new-onset atrial fibrillation in patients with non-ST-segment elevation myocardial infarction. Archives of the Turkish Society of Cardiology. 2021, 49, 430–438. [Google Scholar] [CrossRef]
- Parisi, V.; Petraglia, L.; Formisano, R.; et al. Validation of the echocardiographic assessment of epicardial adipose tissue thickness at the Rindfleisch fold for the prediction of coronary artery disease. Nutrition, Metabolism and Cardiovascular Diseases. 2020, 30, 99–105. [Google Scholar] [CrossRef]
- Meenakshi, K.; Rajendran, M.; Srikumar, S.; Chidambaram, S. Epicardial fat thickness: A surrogate marker of coronary artery disease – Assessment by echocardiography. Indian Heart, J. 2016, 68, 336–341. [Google Scholar] [CrossRef]
- Nerlekar, N.; Baey, Y.W.; Brown, A.J.; et al. Poor Correlation, Reproducibility, and Agreement Between Volumetric Versus Linear Epicardial Adipose Tissue Measurement: A 3D Computed Tomography Versus 2D Echocardiography Comparison. JACC: Cardiovascular Imaging. 2018, 11, 1035–1036. [Google Scholar] [CrossRef] [PubMed]
- Iacobellis, G.; Willens, H.J.; Barbaro, G.; Sharma, A.M. Threshold values of high-risk echocardiographic epicardial fat thickness. Obesity (Silver Spring). 2008, 16, 887–892. [Google Scholar] [CrossRef] [PubMed]
Figure 1.
Types of adipocytes[2].
Figure 1.
Types of adipocytes[2].
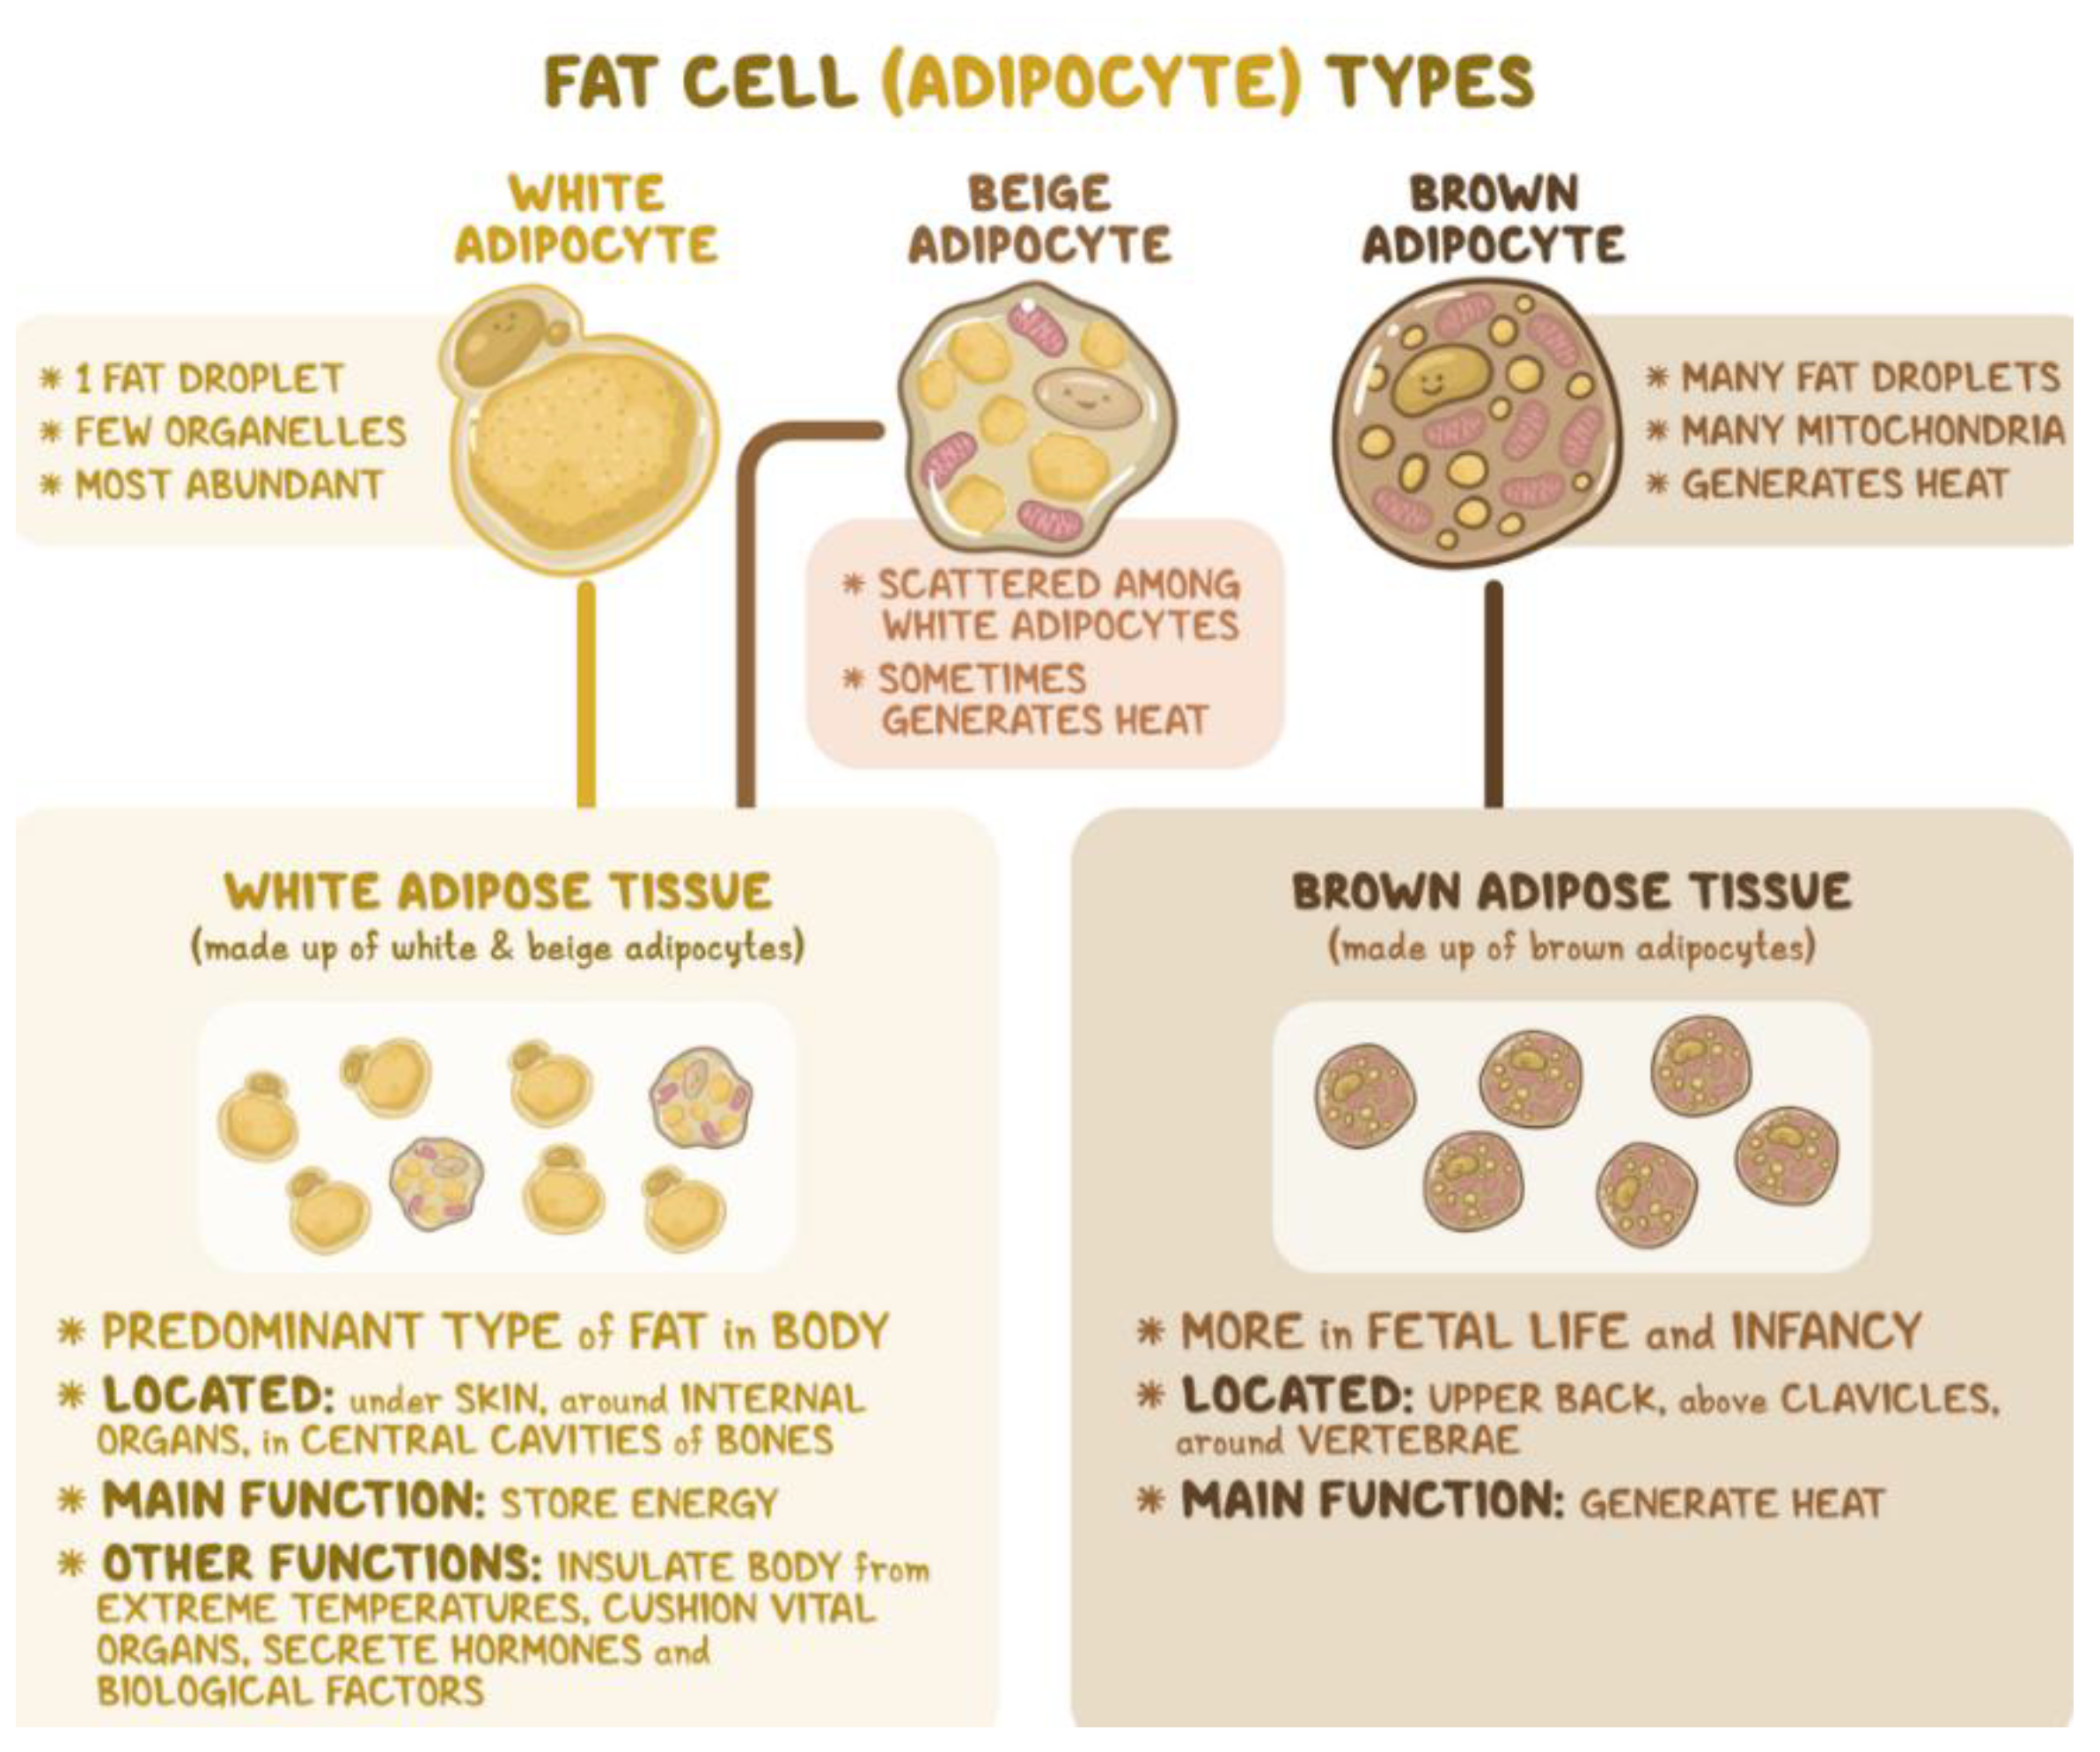
Figure 2.
Heart wall tissue layers[5].
Figure 2.
Heart wall tissue layers[5].
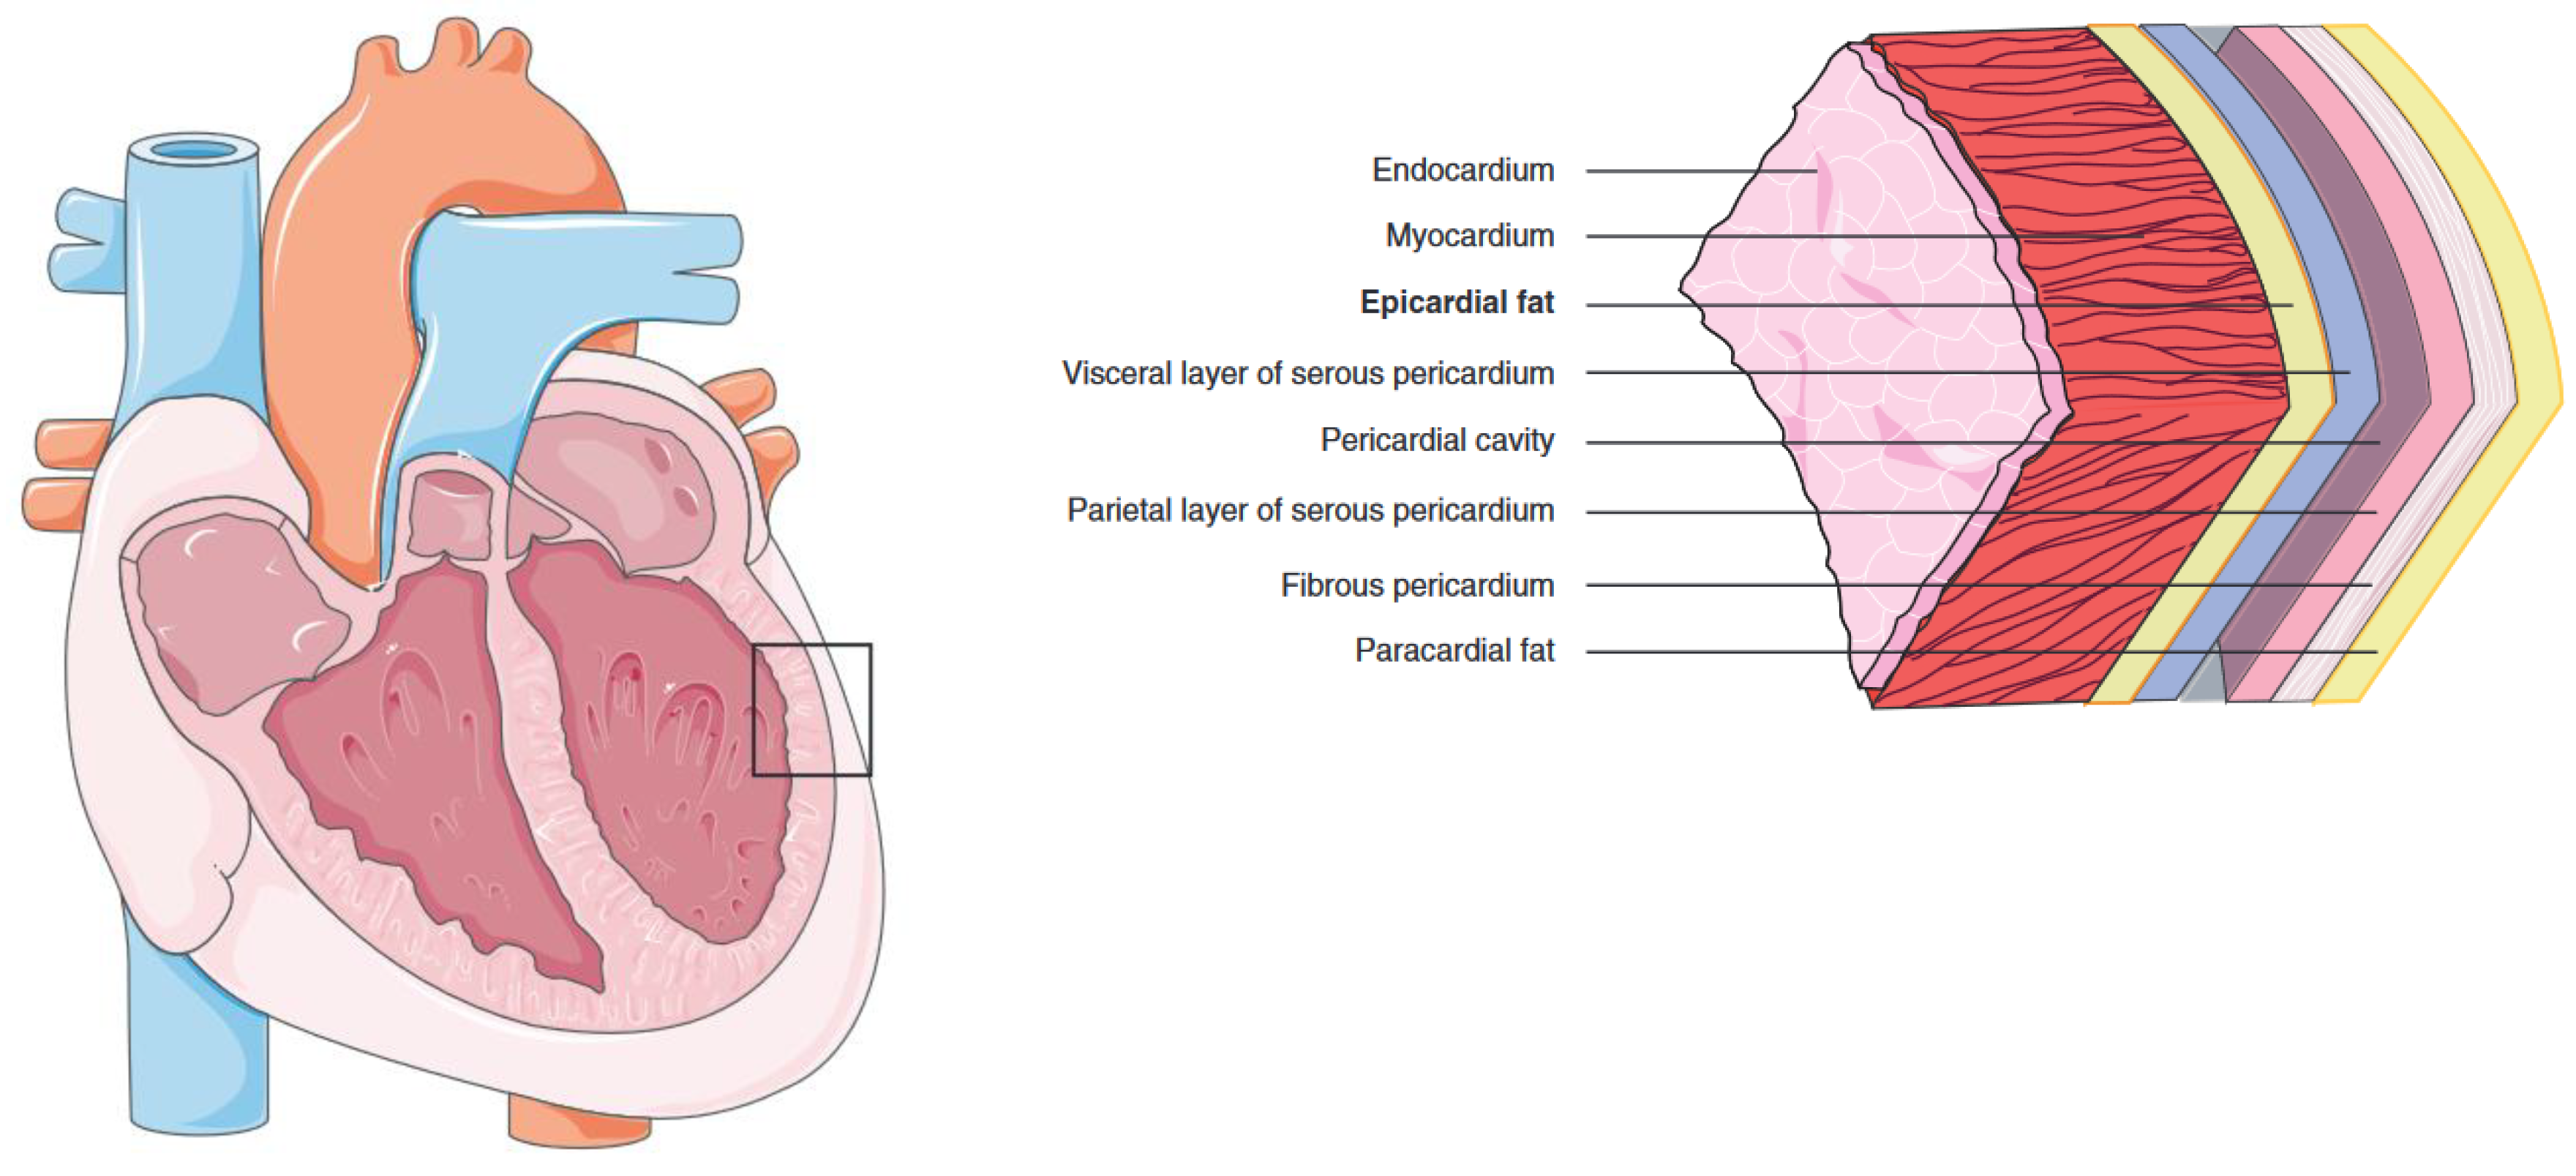
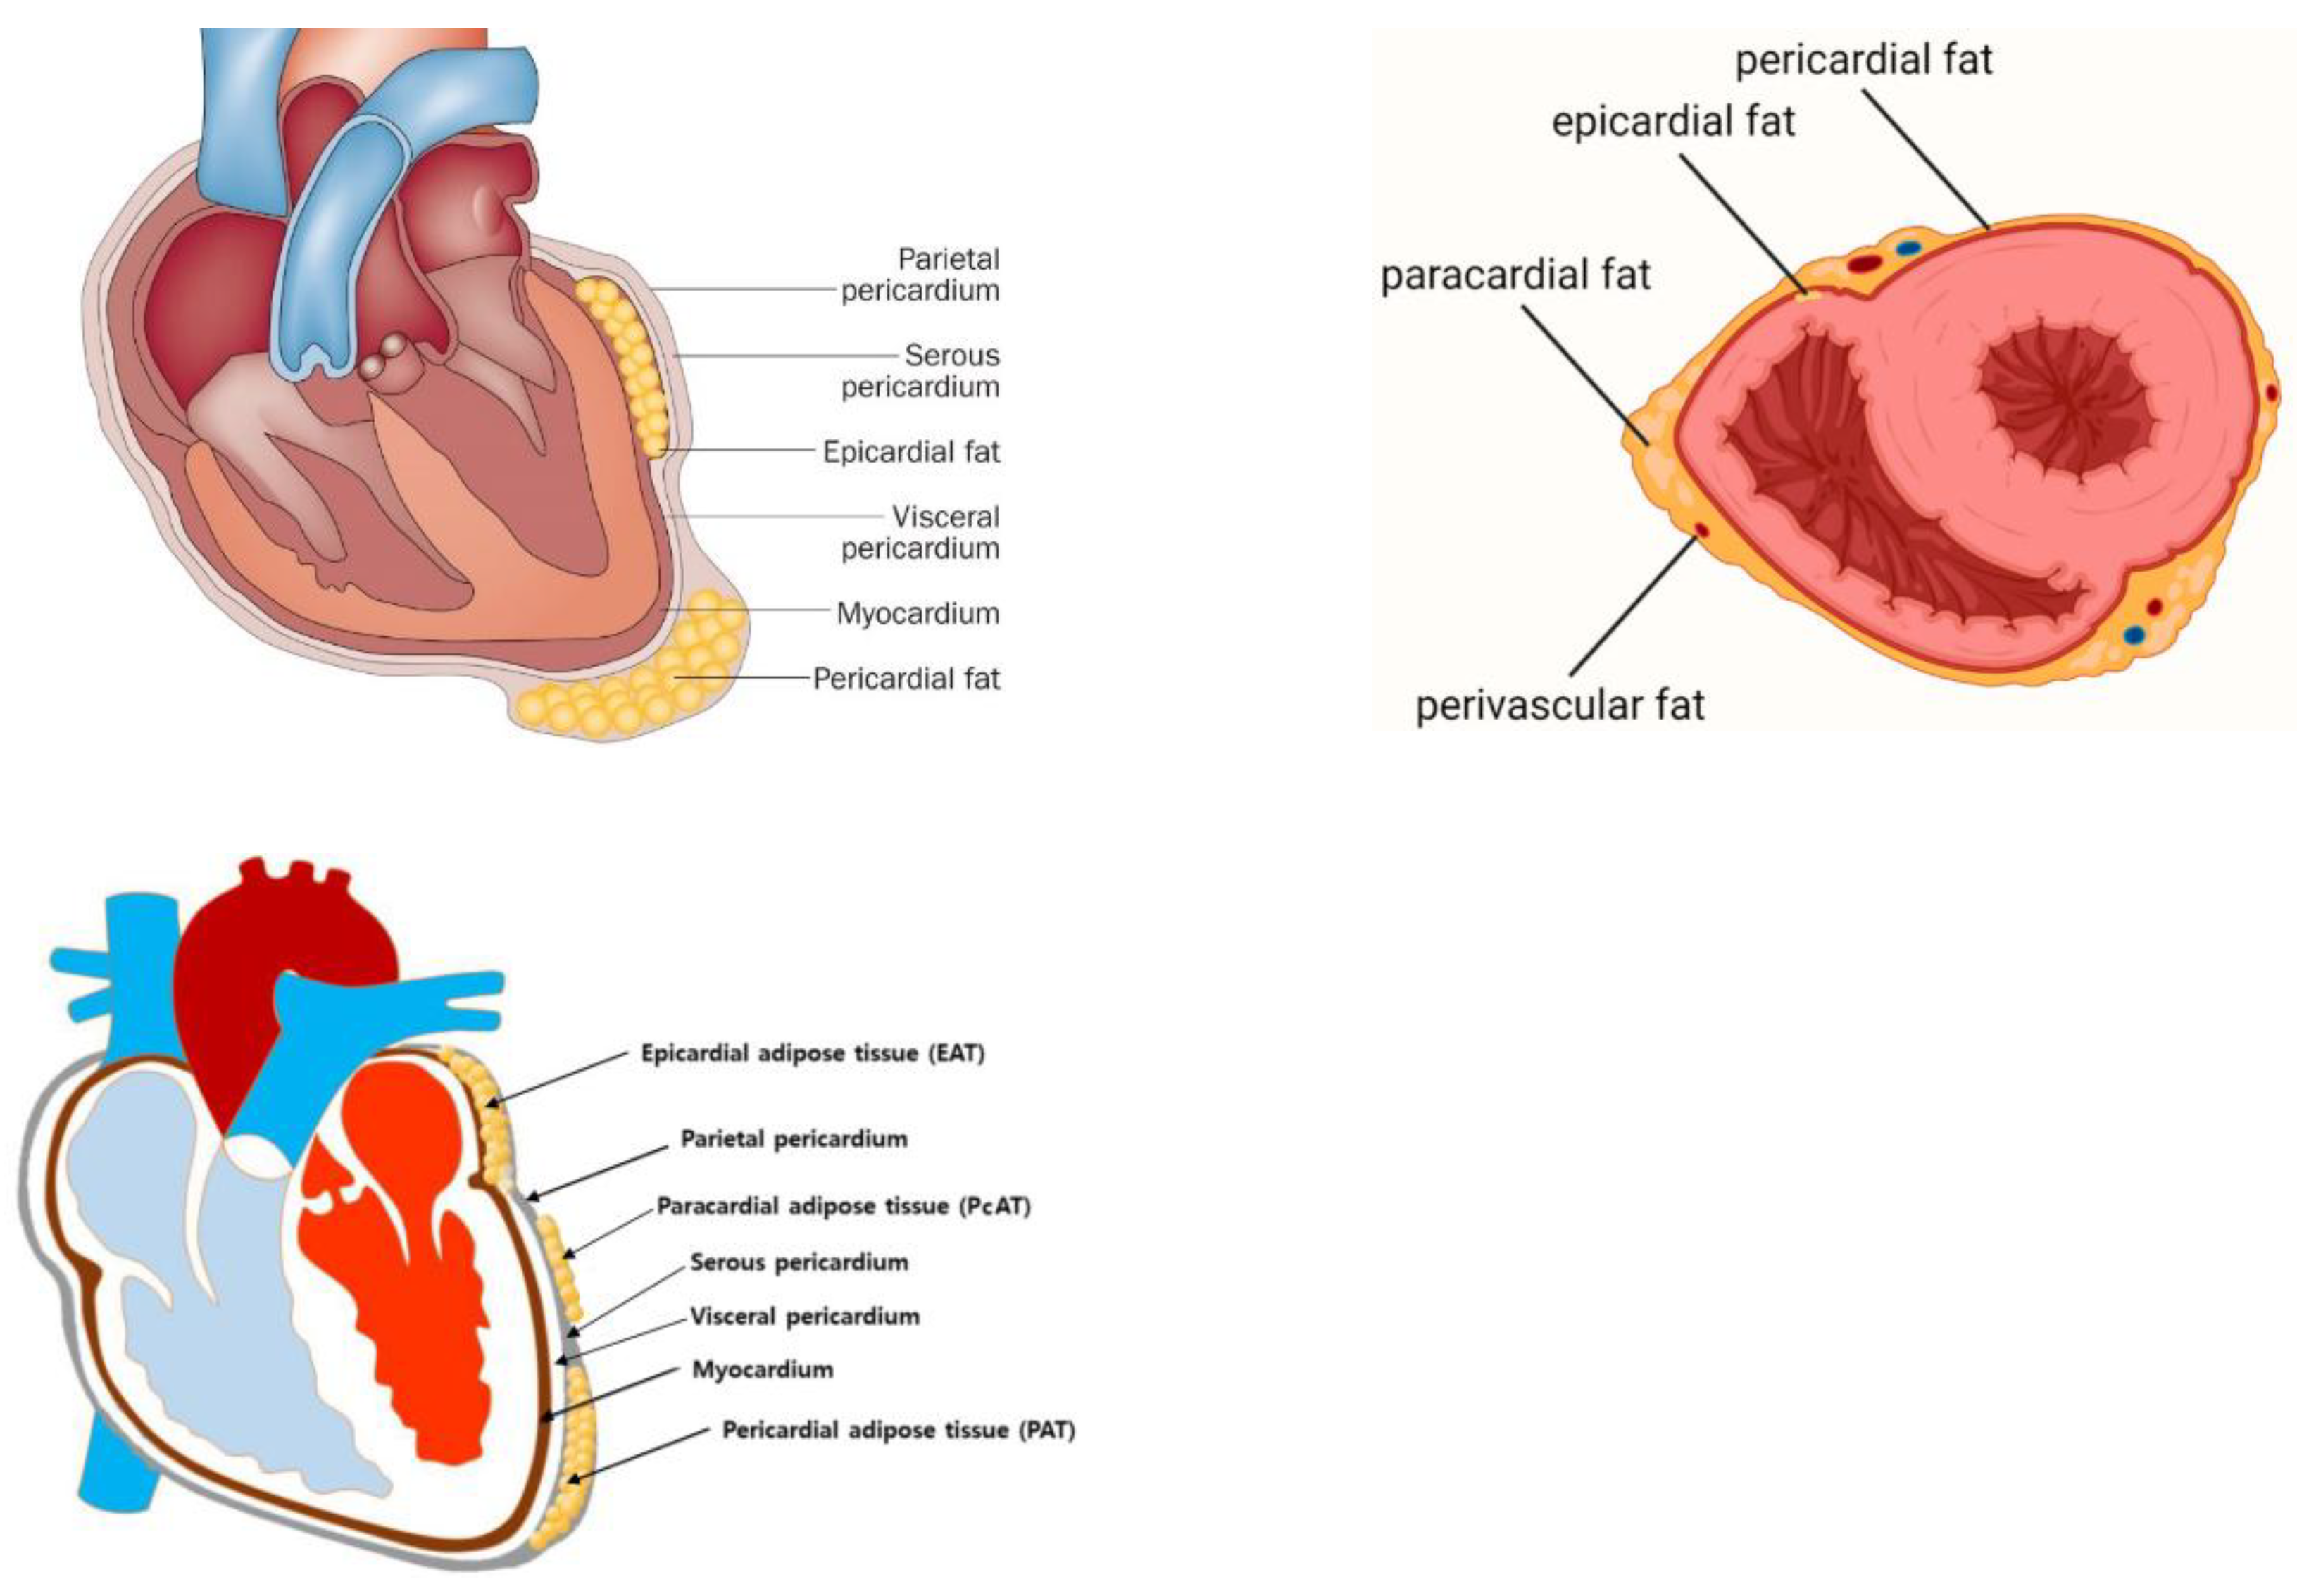
Figure 4.
PcAT identified as intrathoracic fat and 3D reconstructions of PAT and PcAT[28].
Figure 4.
PcAT identified as intrathoracic fat and 3D reconstructions of PAT and PcAT[28].
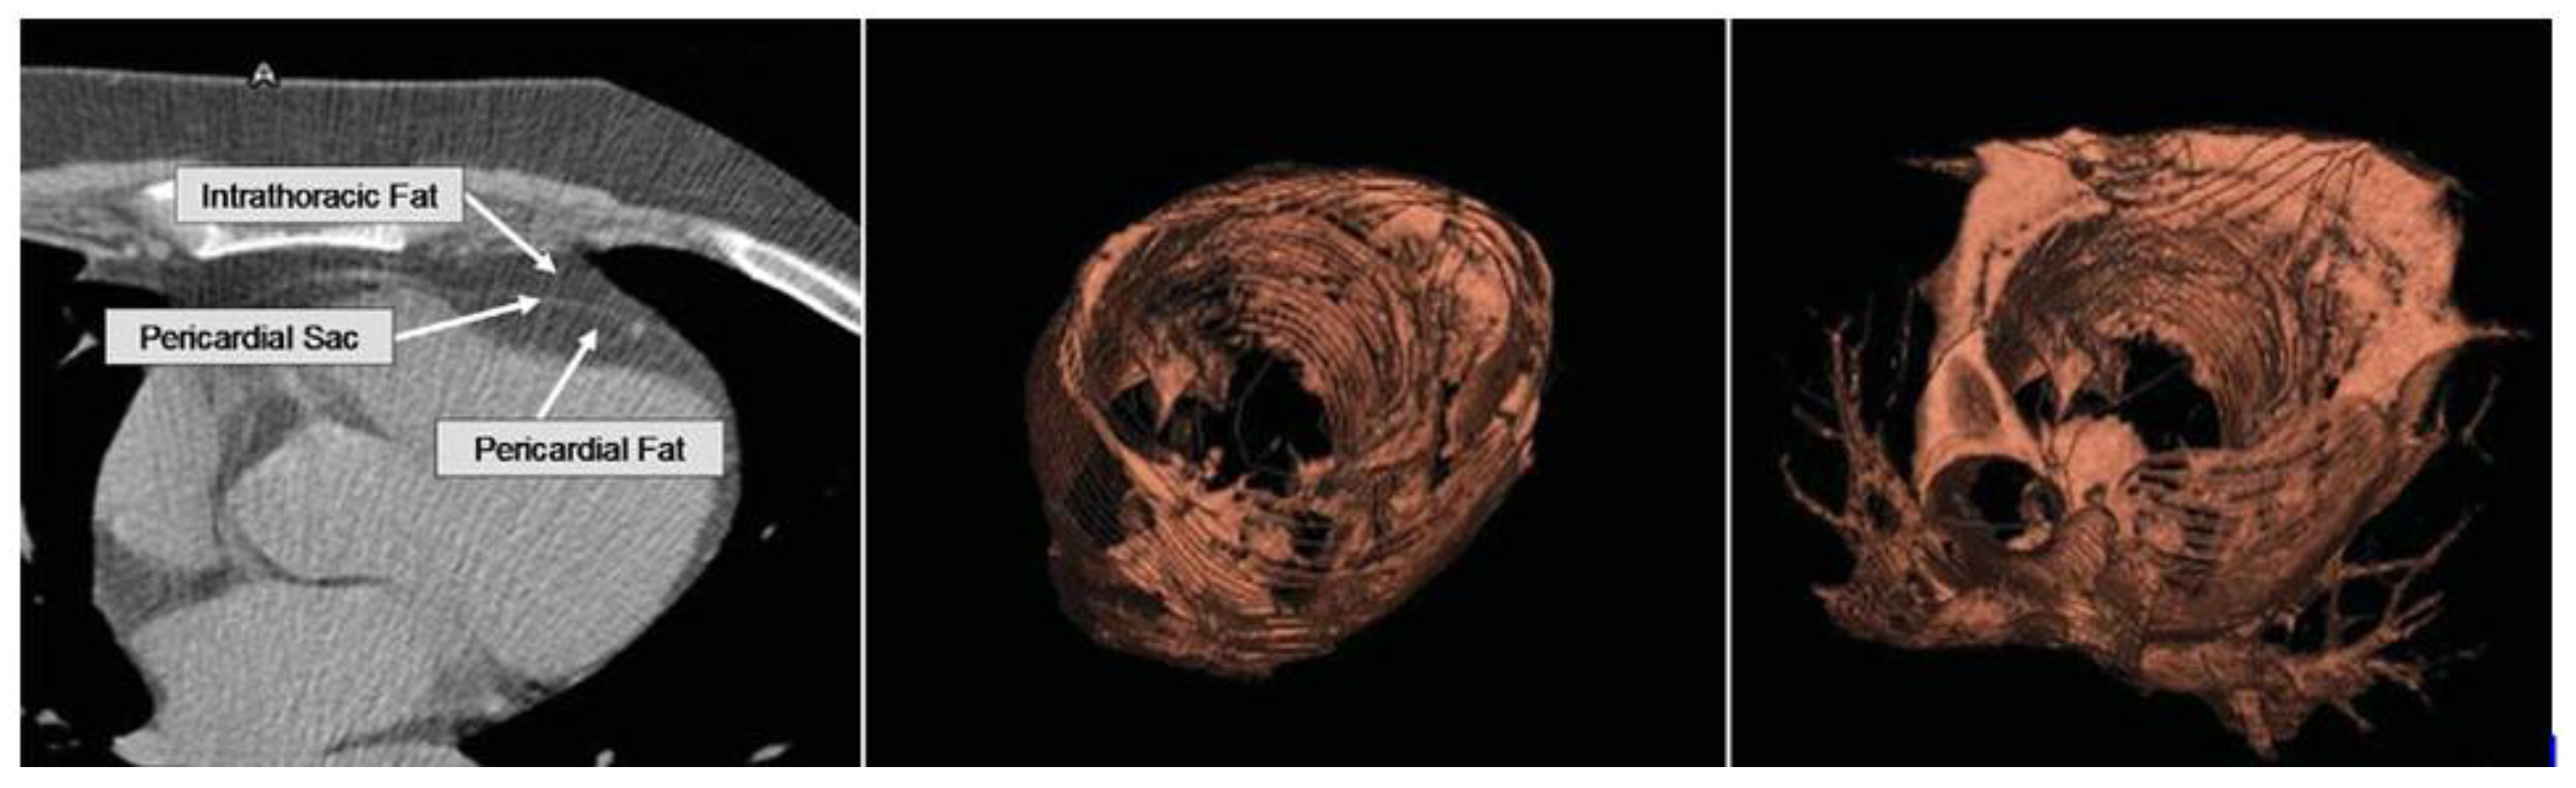
Figure 5.
Perivascular AT around the aorta – periaortic (left), pericoronary AT (center),[11] PvAT composition (right)[30].
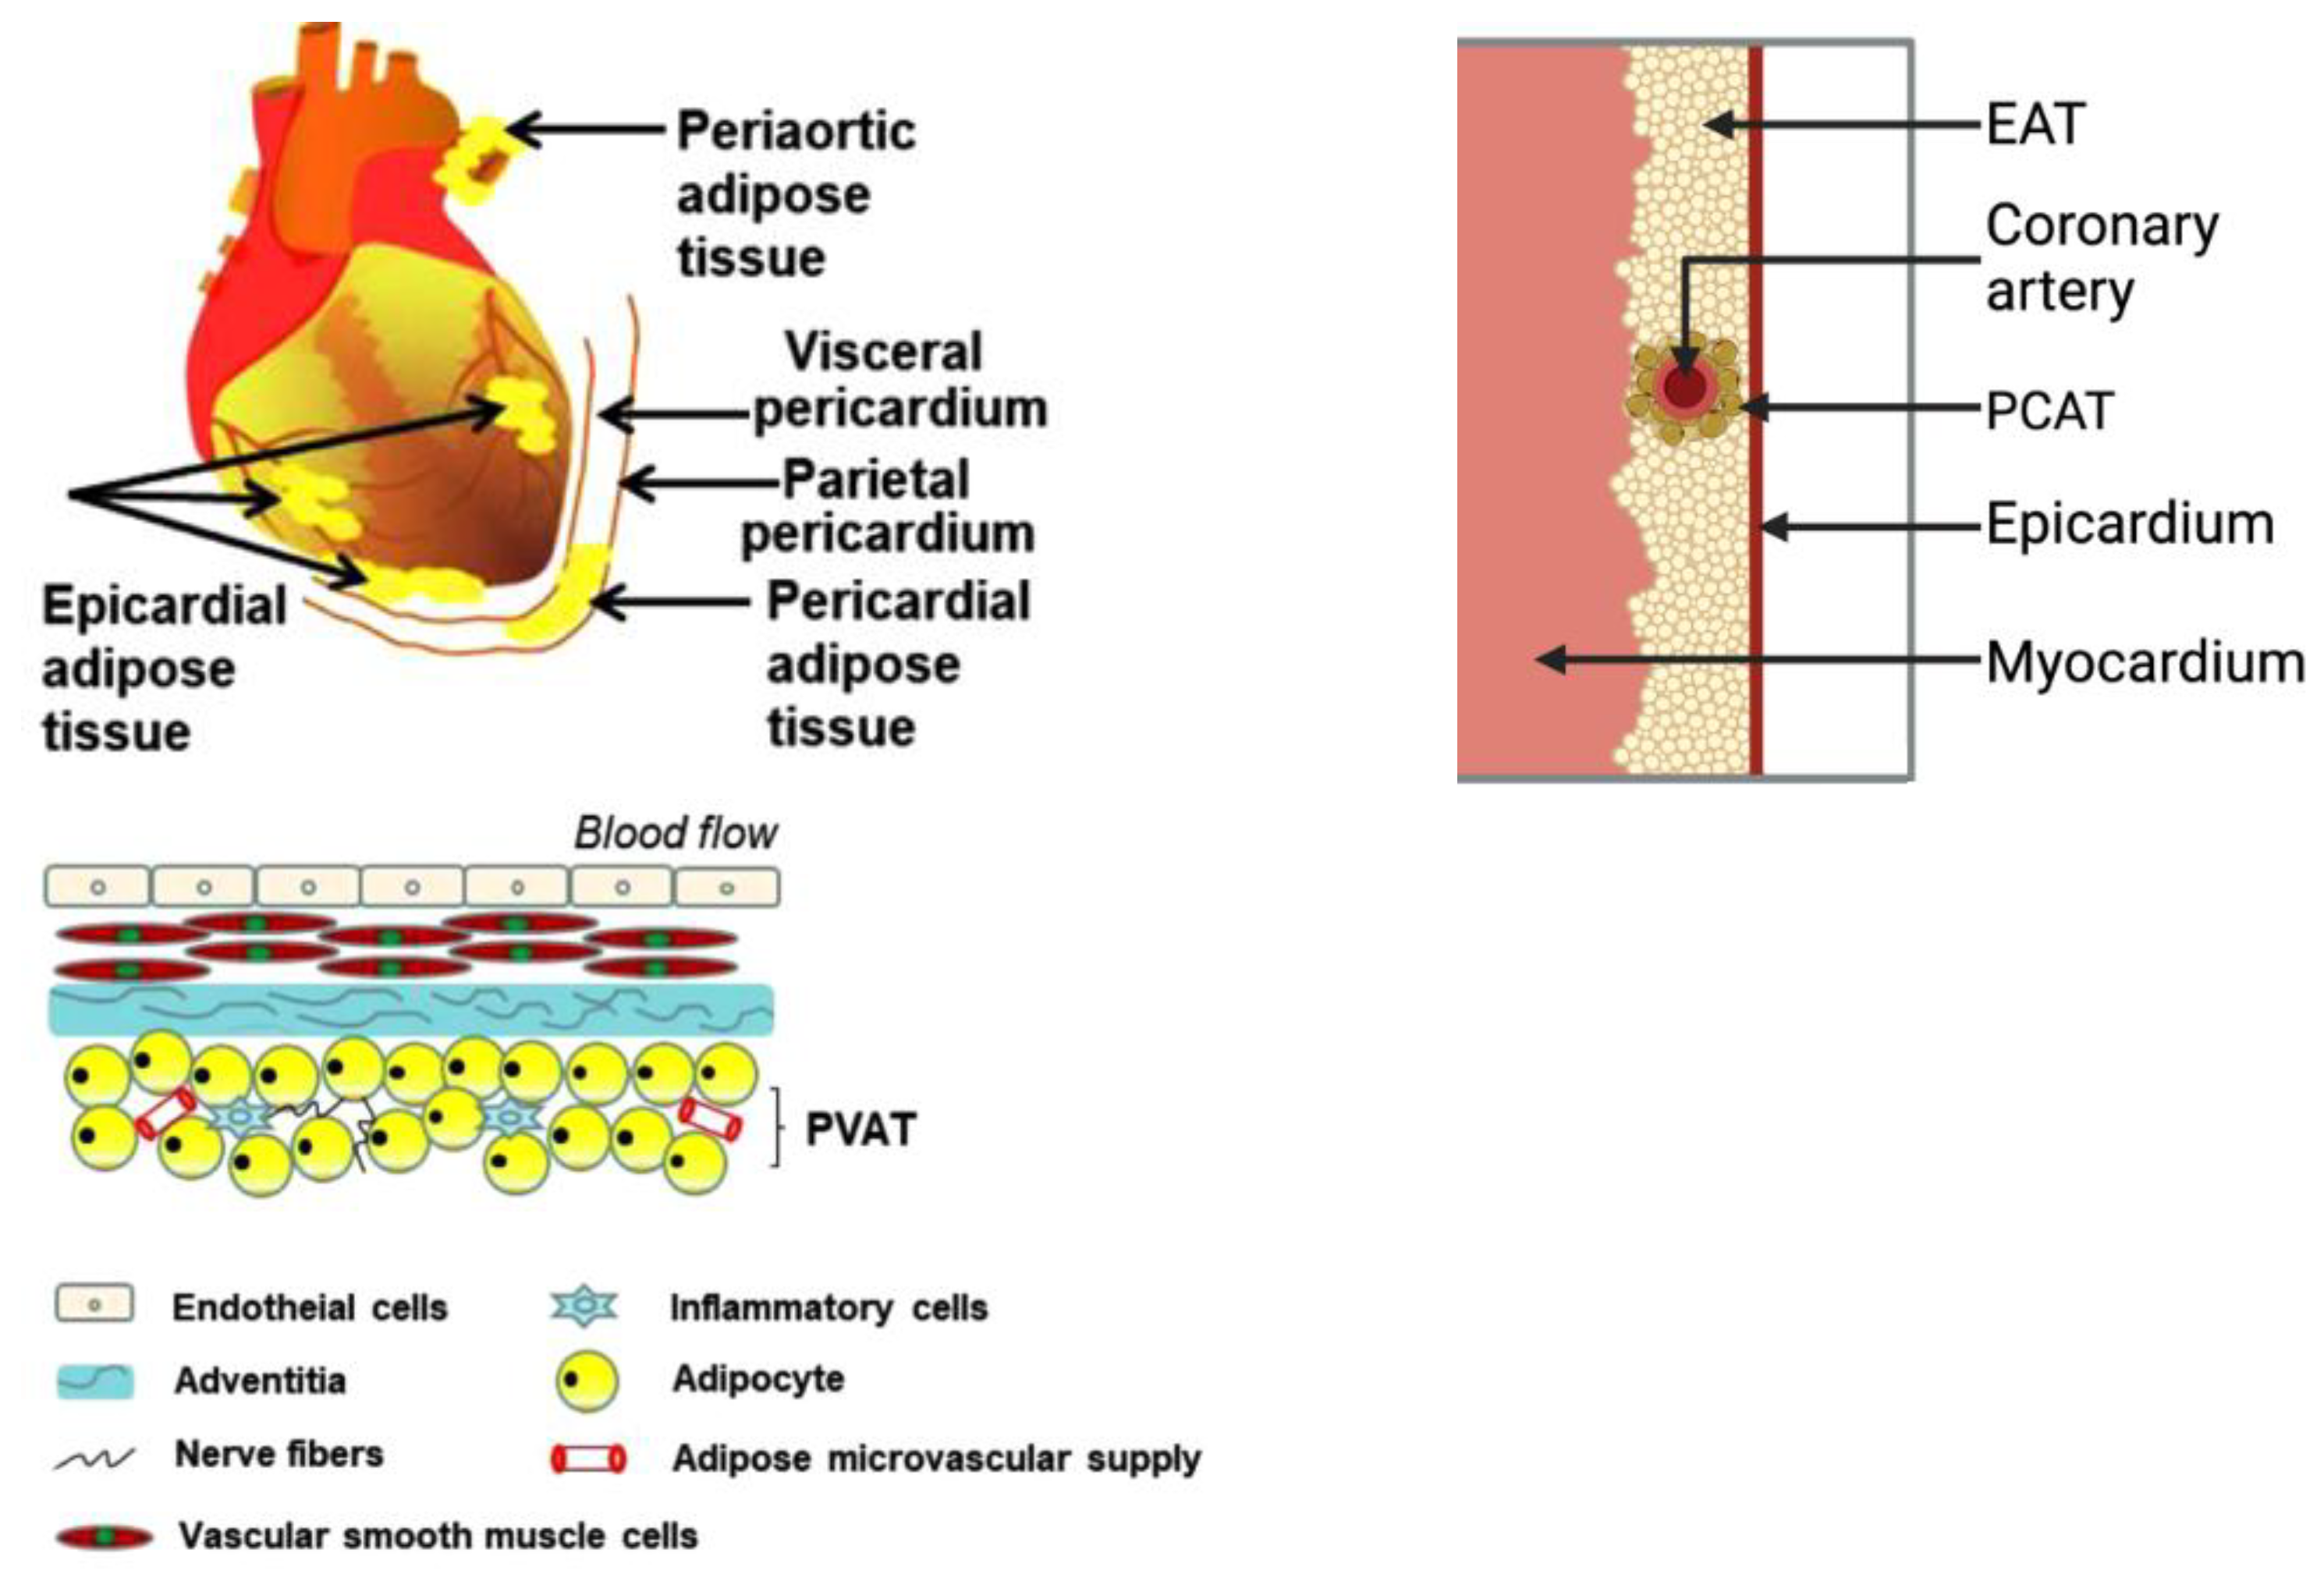
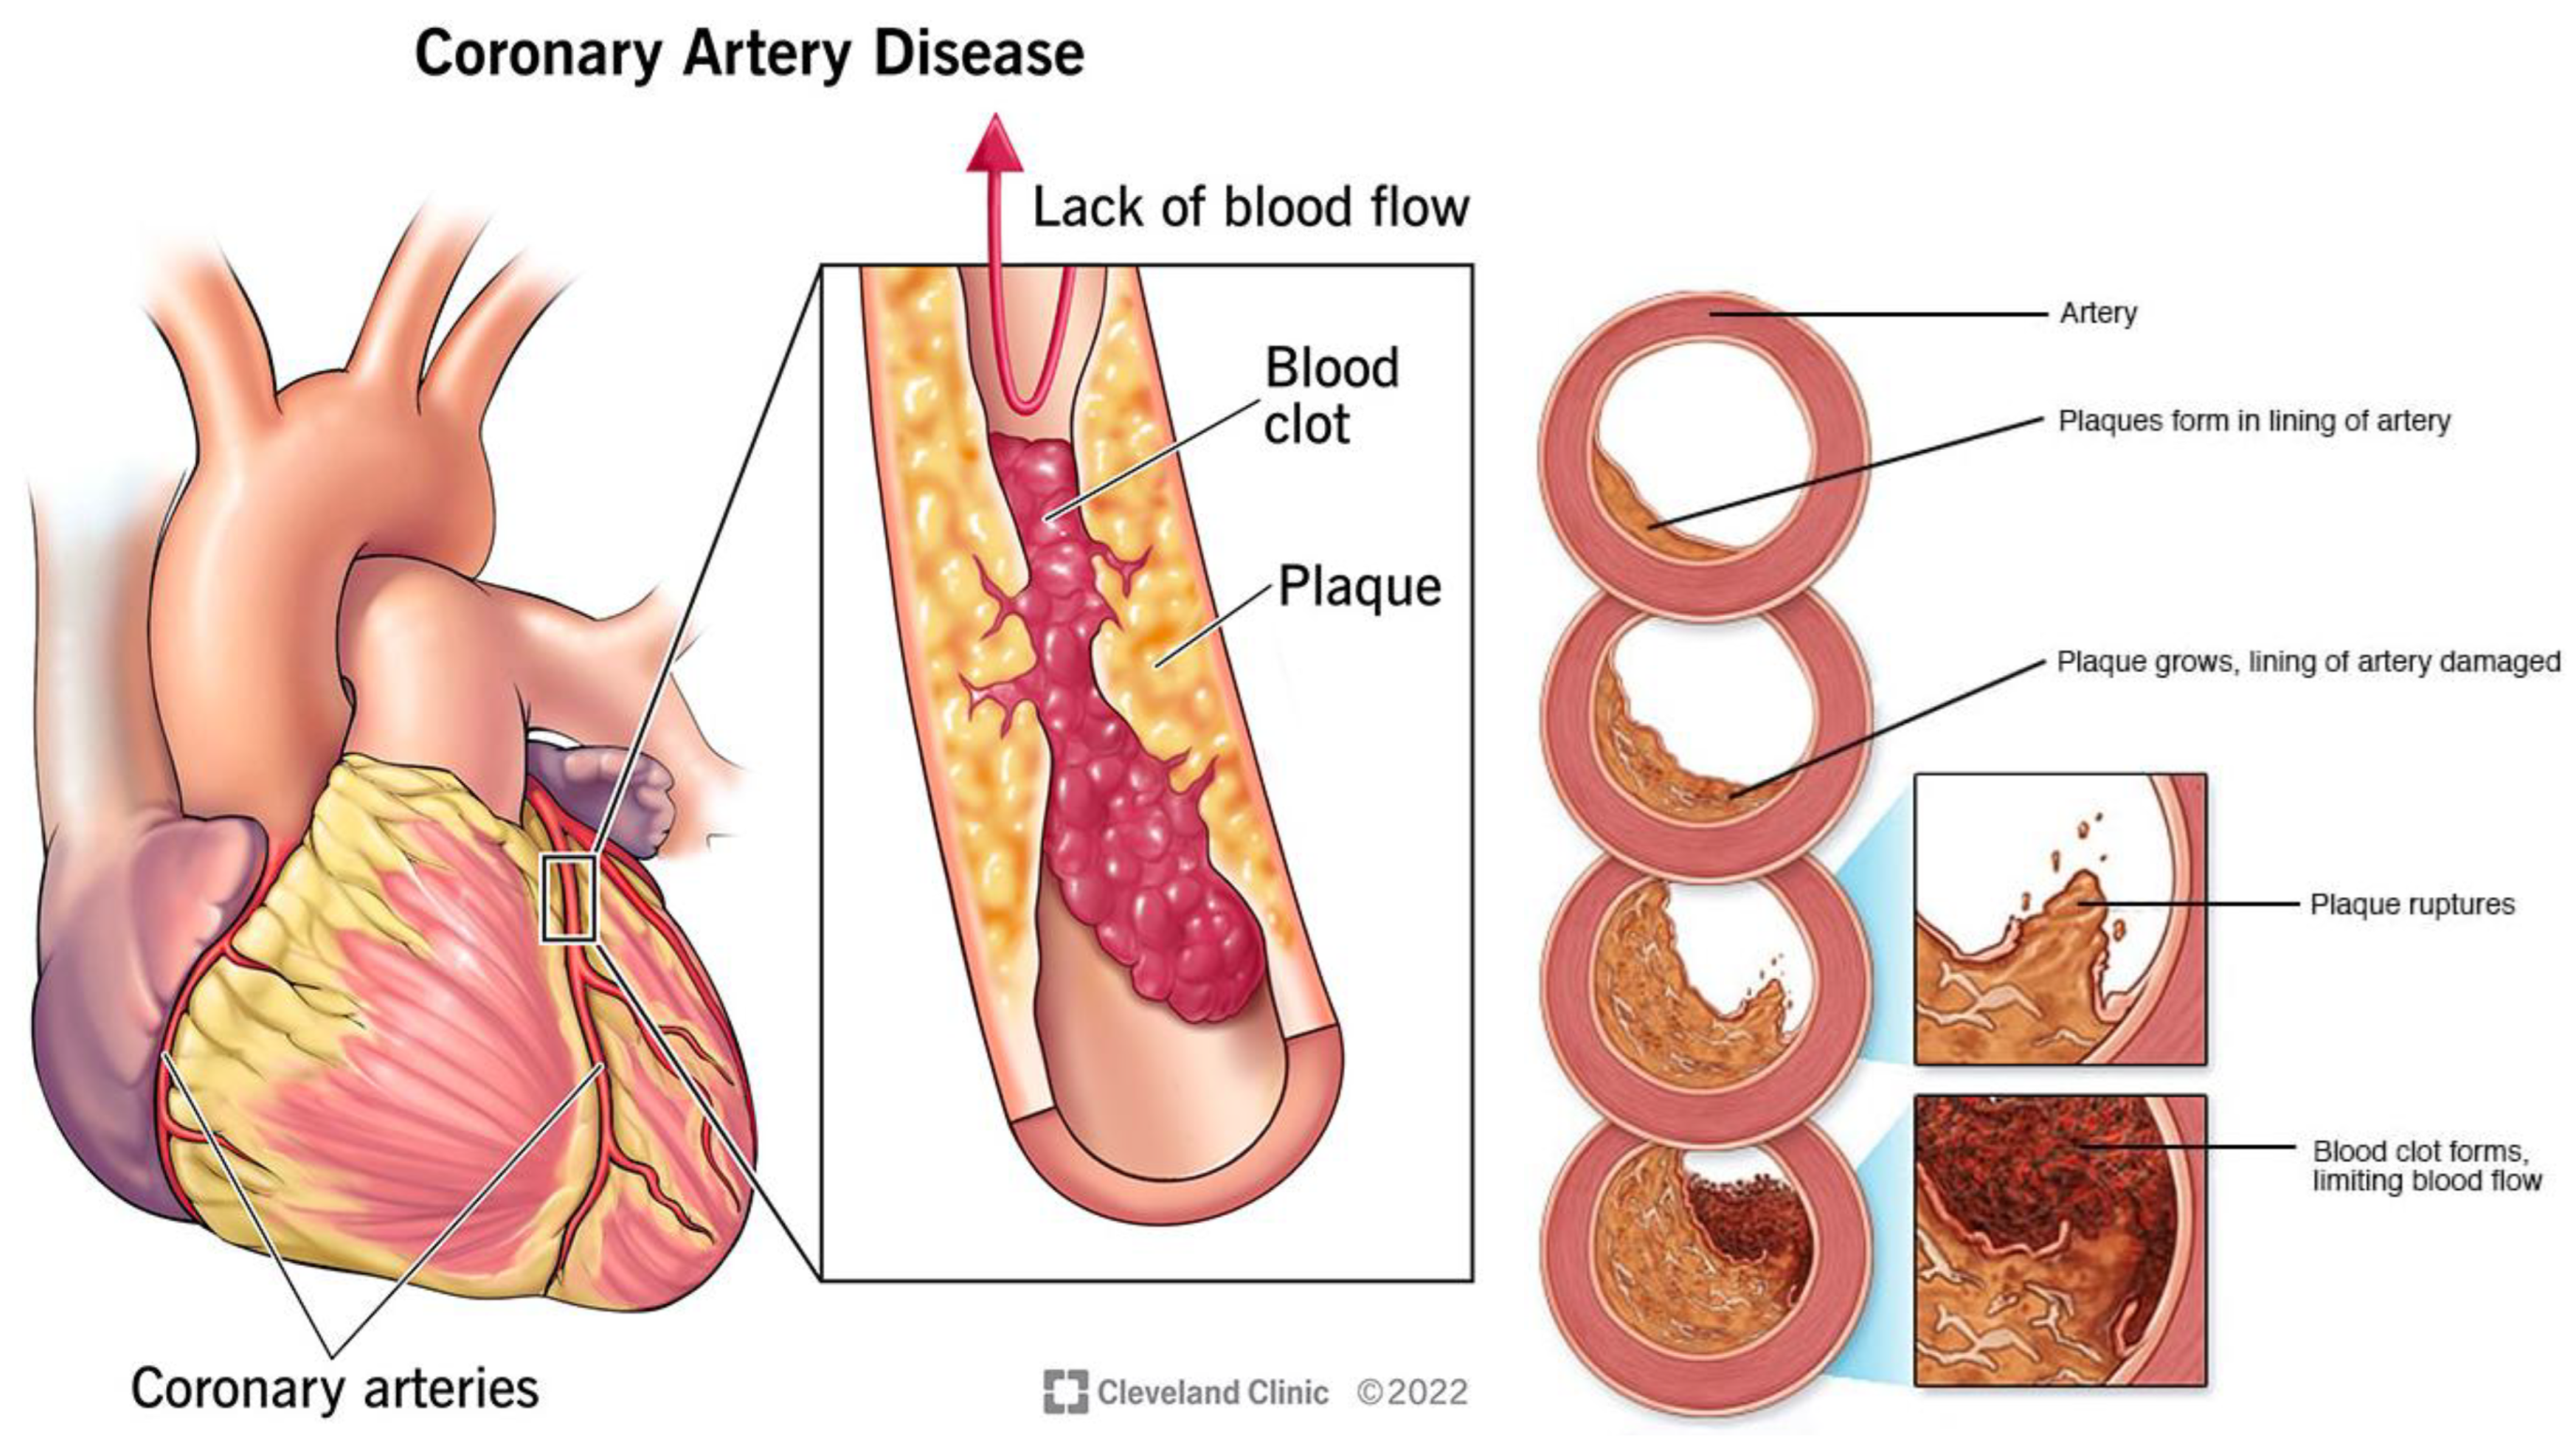
Figure 7.
Cardiac steatosis by infiltration (left), and by pericardial restraint (right) [21].
Figure 7.
Cardiac steatosis by infiltration (left), and by pericardial restraint (right) [21].
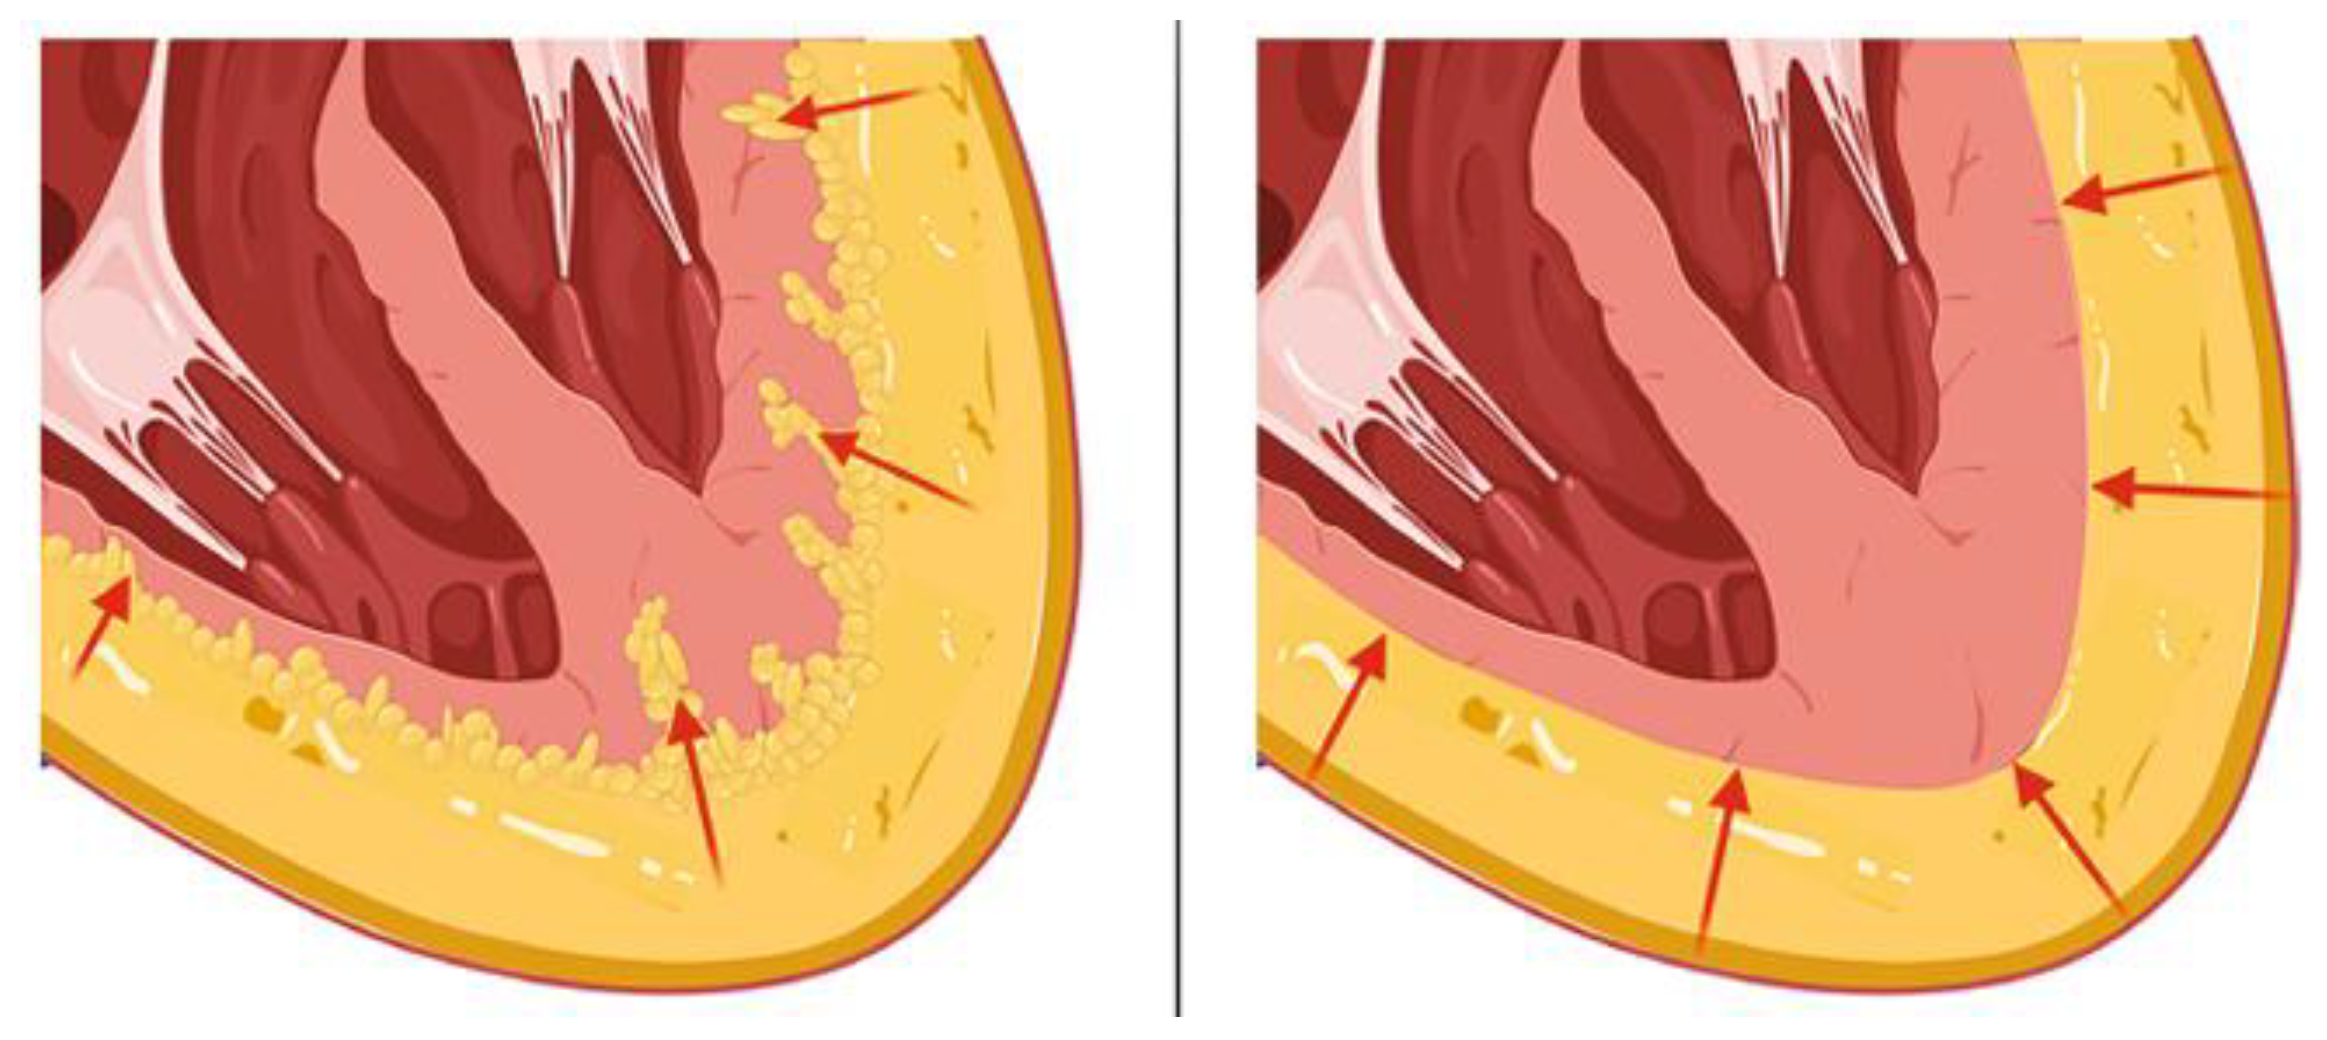
Figure 8.
Characterization of EAT (asterisk), PAT (star), and pericardium (arrow) for MRI on long-axis four-chamber view (left) and basal short-axis view (right) at end-diastole frame[79].
Figure 8.
Characterization of EAT (asterisk), PAT (star), and pericardium (arrow) for MRI on long-axis four-chamber view (left) and basal short-axis view (right) at end-diastole frame[79].
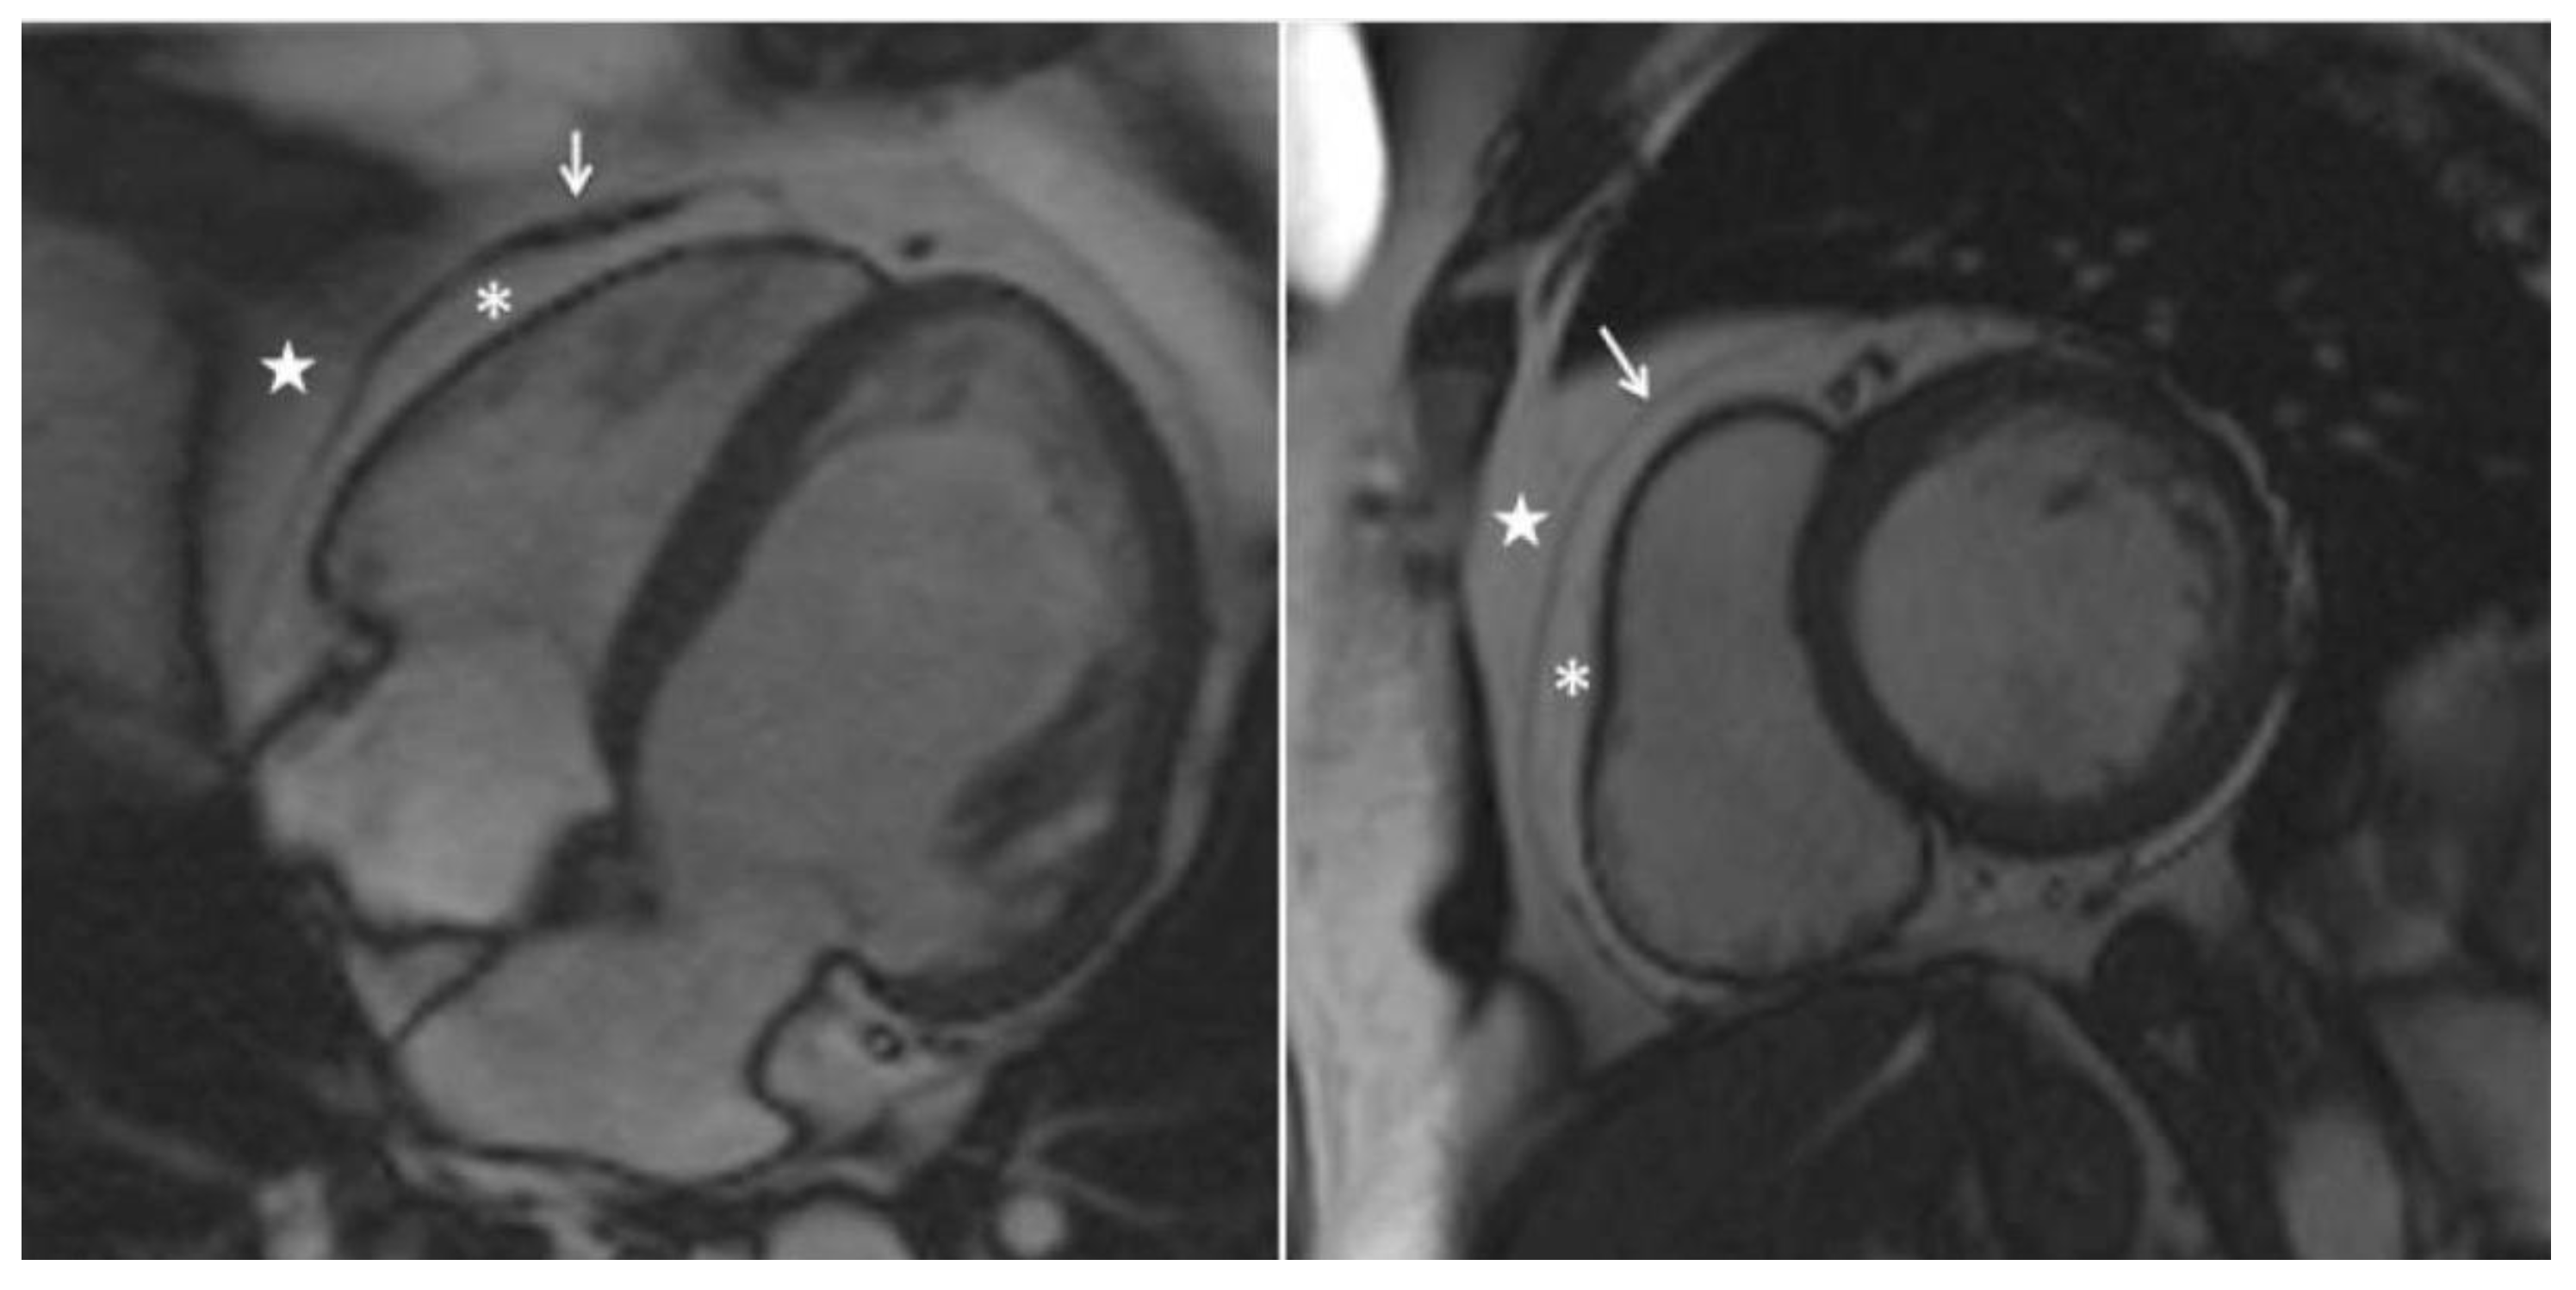
Figure 9.
Segmentation comparison of DL models with corresponding F1 in upper left corners [86].
Figure 9.
Segmentation comparison of DL models with corresponding F1 in upper left corners [86].
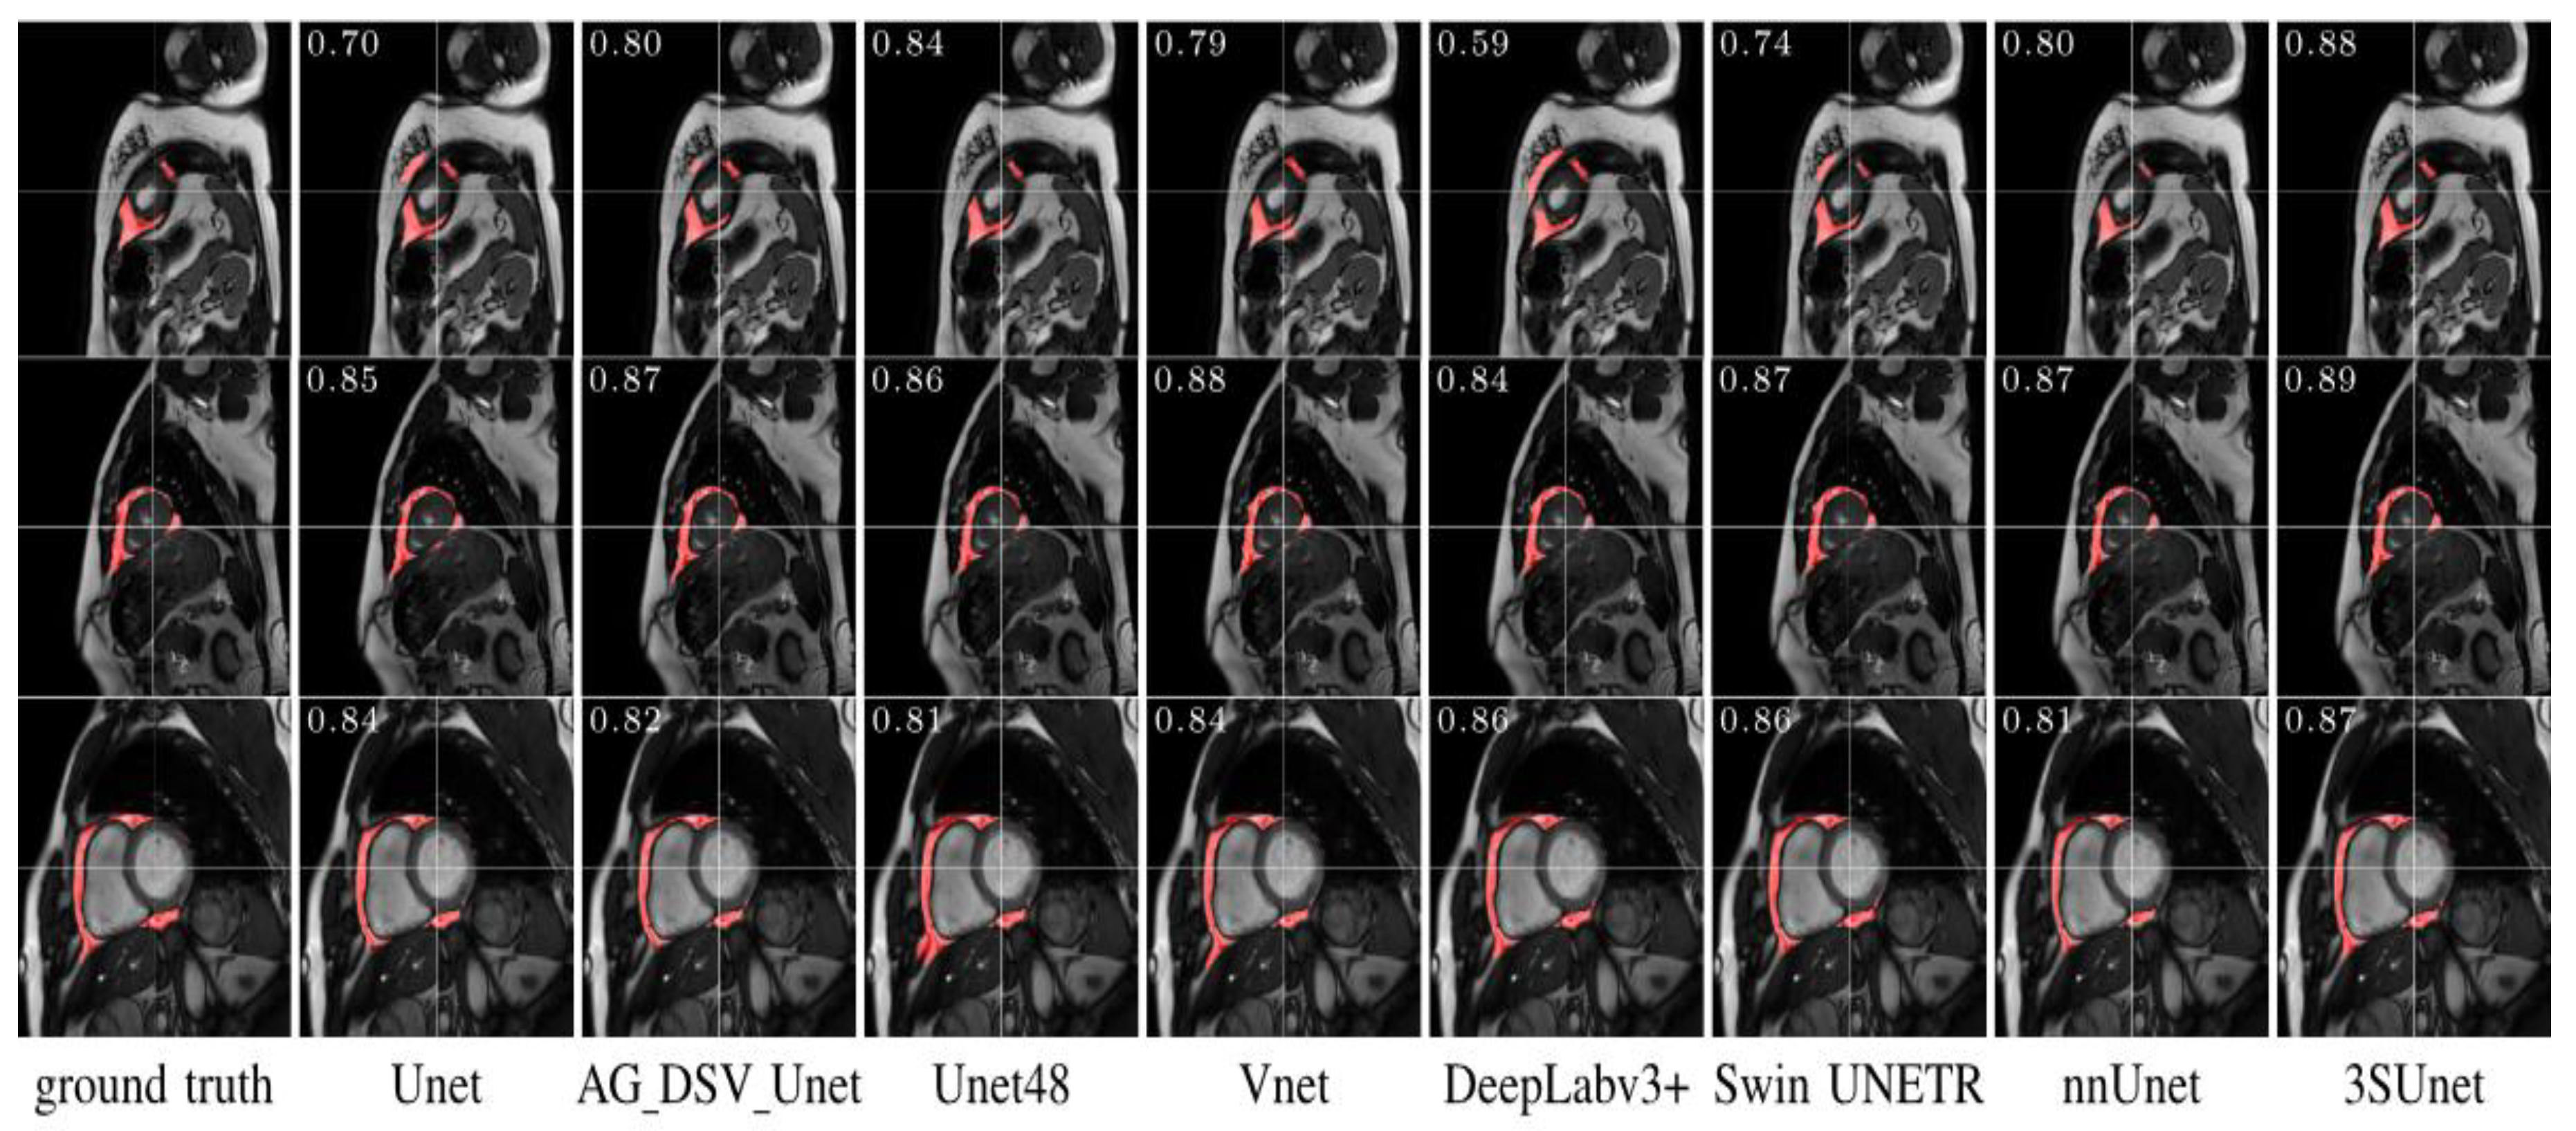
Figure 10.
Visualization of the pericardium, EAT, and PAT on CT[97].
Figure 10.
Visualization of the pericardium, EAT, and PAT on CT[97].
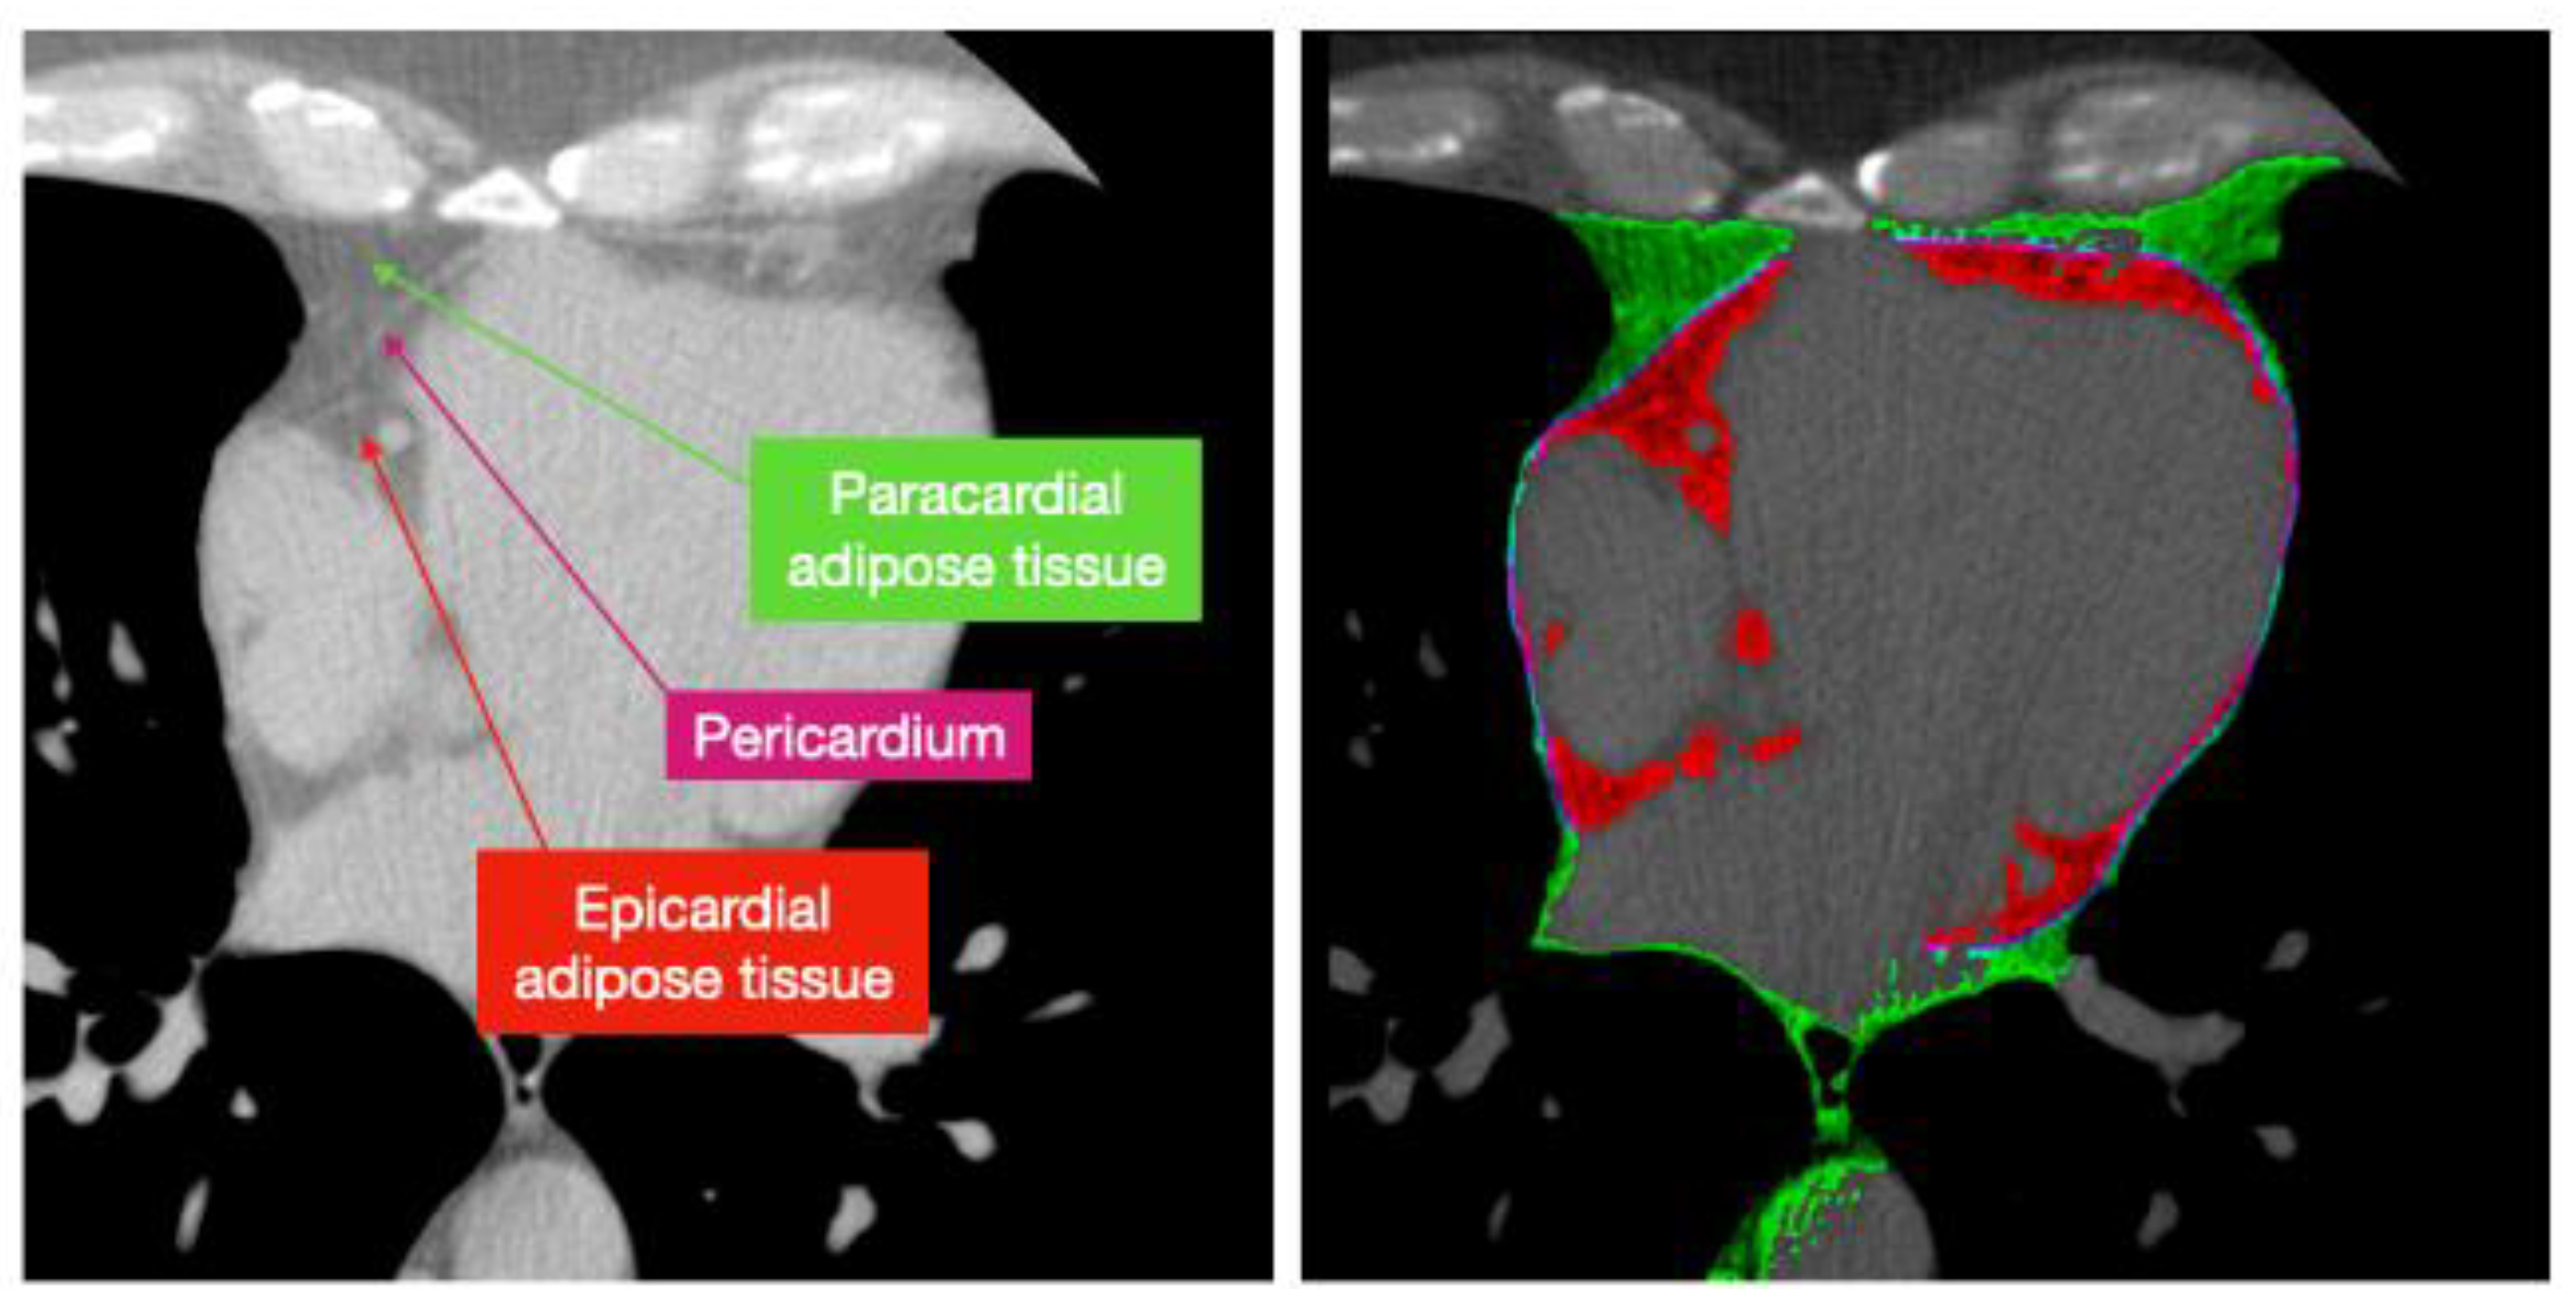
Figure 11.
Result comparison of expert tracings, Li’s model, and U-Net variations for EAT segmentation on CT.[104].
Figure 11.
Result comparison of expert tracings, Li’s model, and U-Net variations for EAT segmentation on CT.[104].
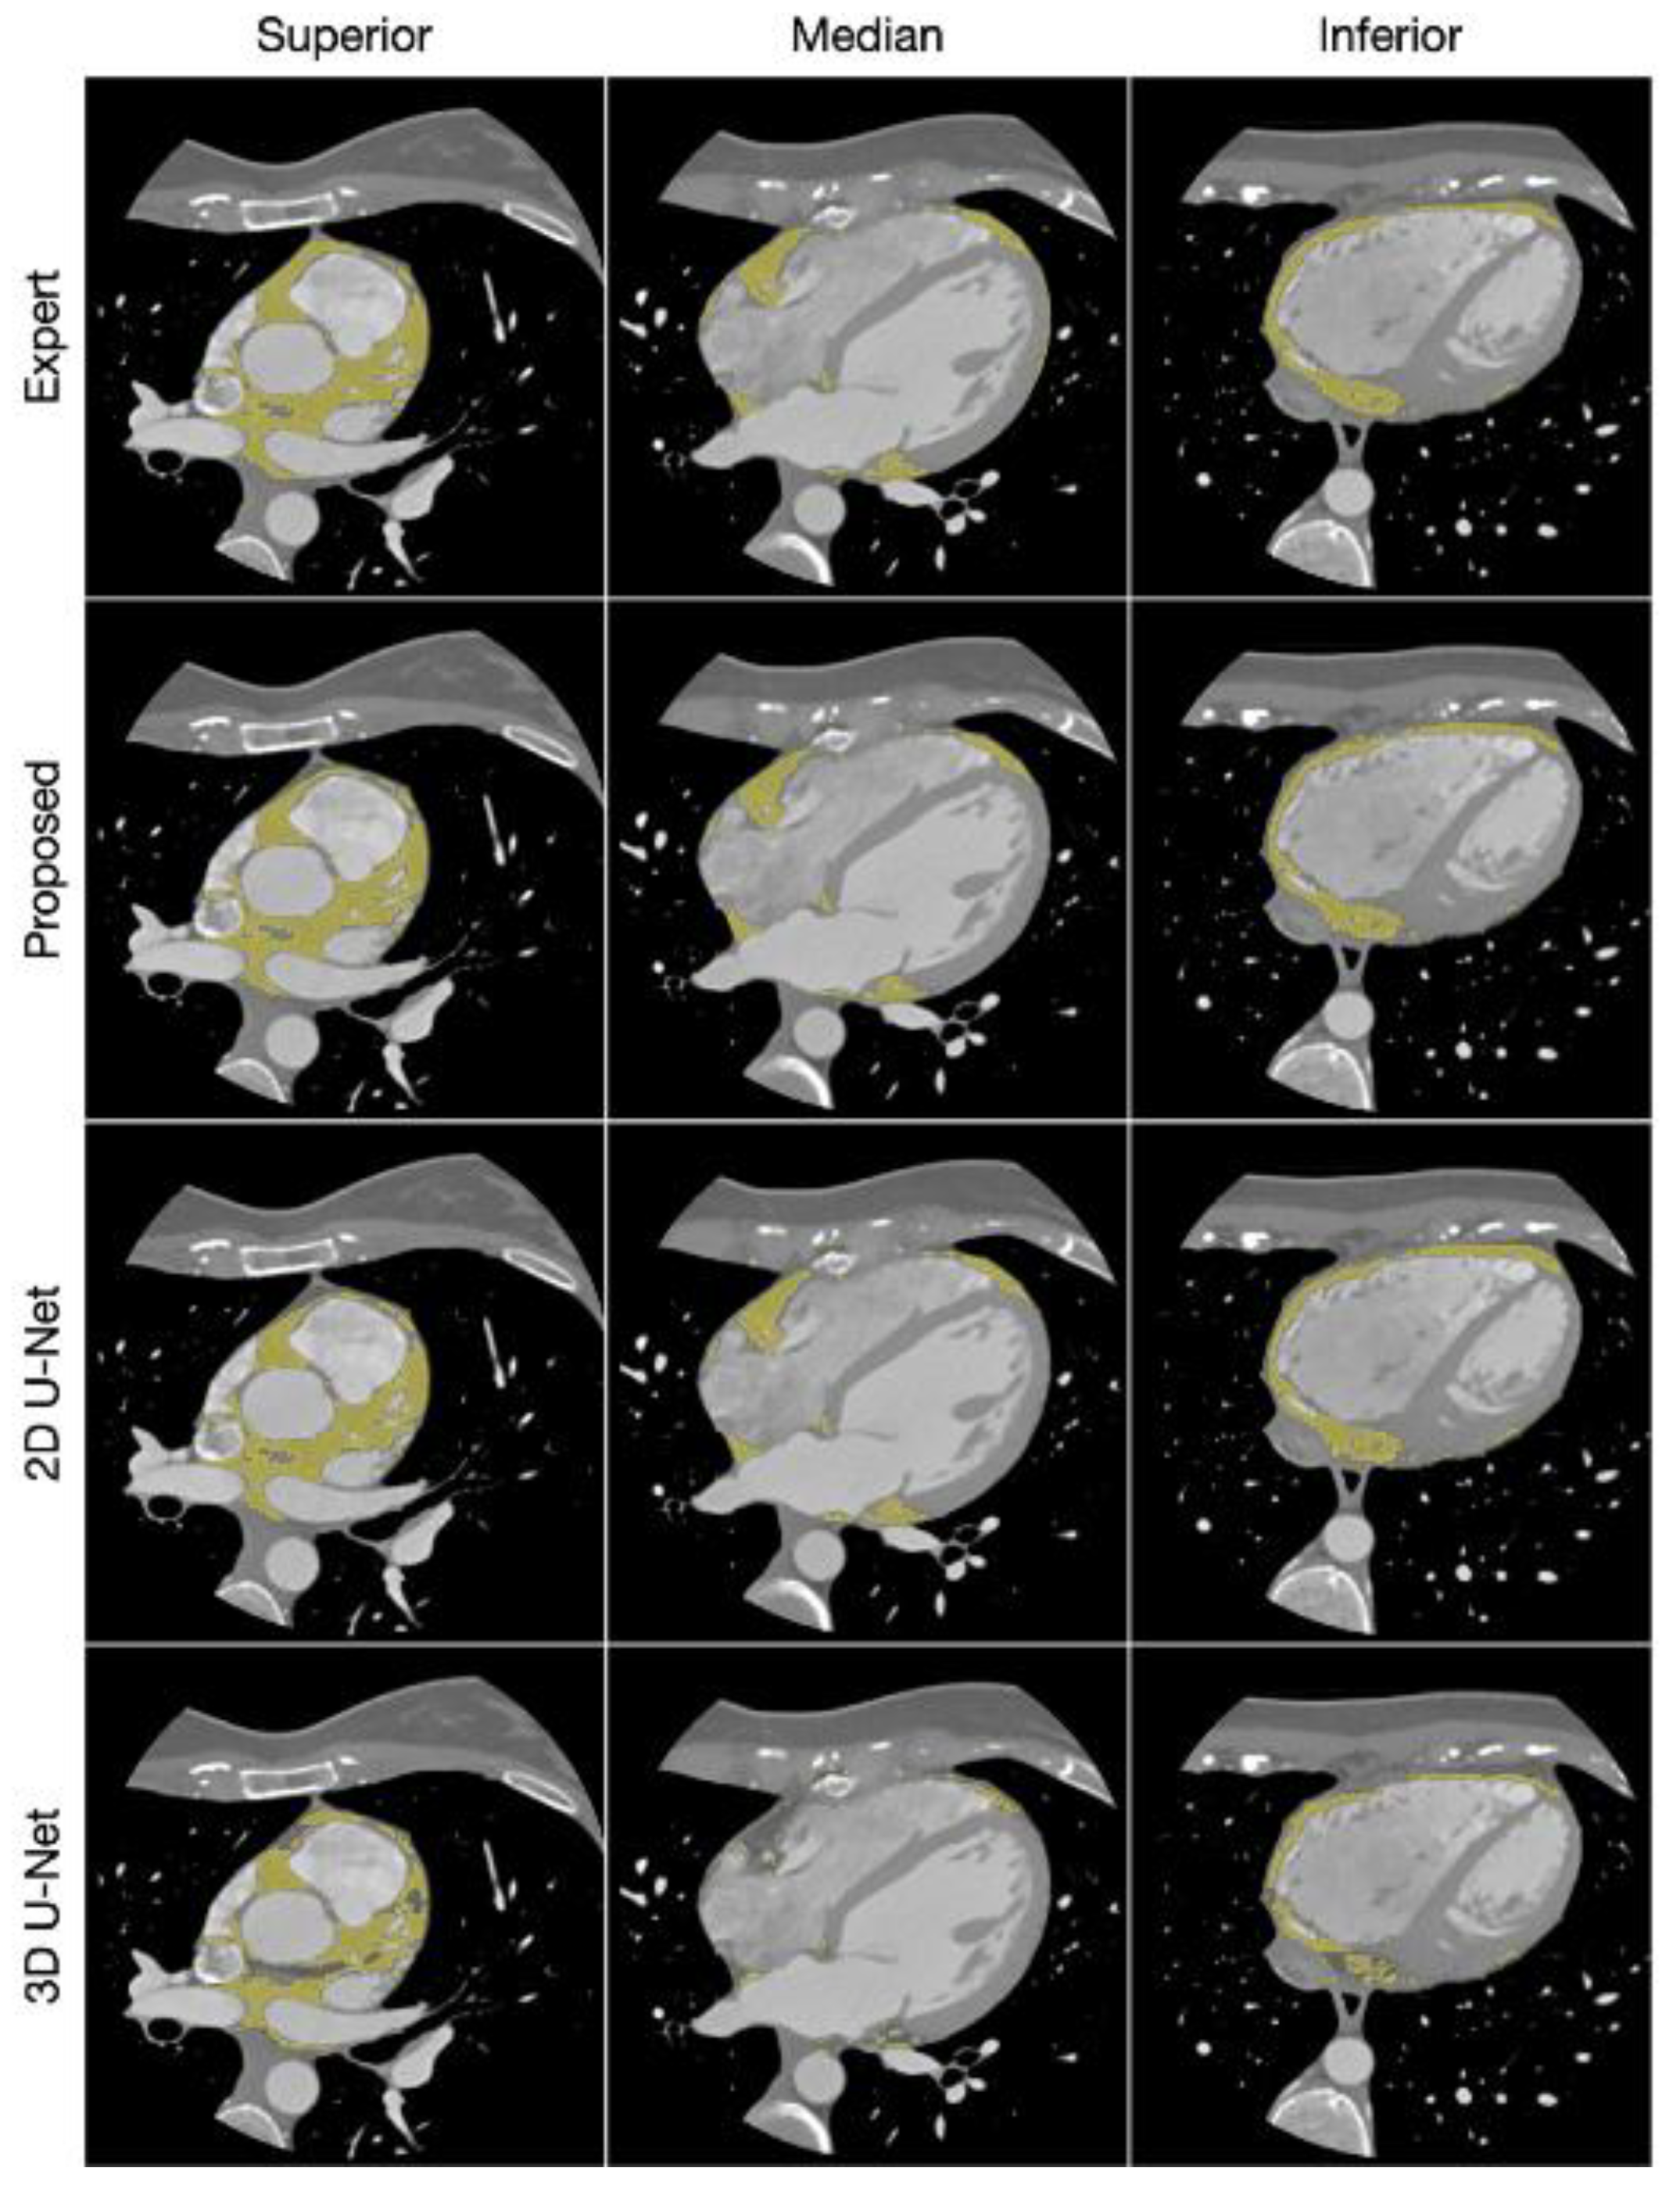
Figure 12.
TTE acoustic windows[115] (top left), parasternal long axis view – PLAX; RVOT = Right ventricular outflow tract; LVOT = Left Ventricular Outflow Tract; AV = Aortic Valve; MV = Mitral Valve, LA = Left Atrium, LV = Left Ventricle (top center), parasternal short axis view - PSAX (top right), subcostal view – SC; TV = Tricuspid Valve (bottom left), apical two-chamber view – A2C (bottom center), and apical four-chamber view - A4C (bottom right)[116].
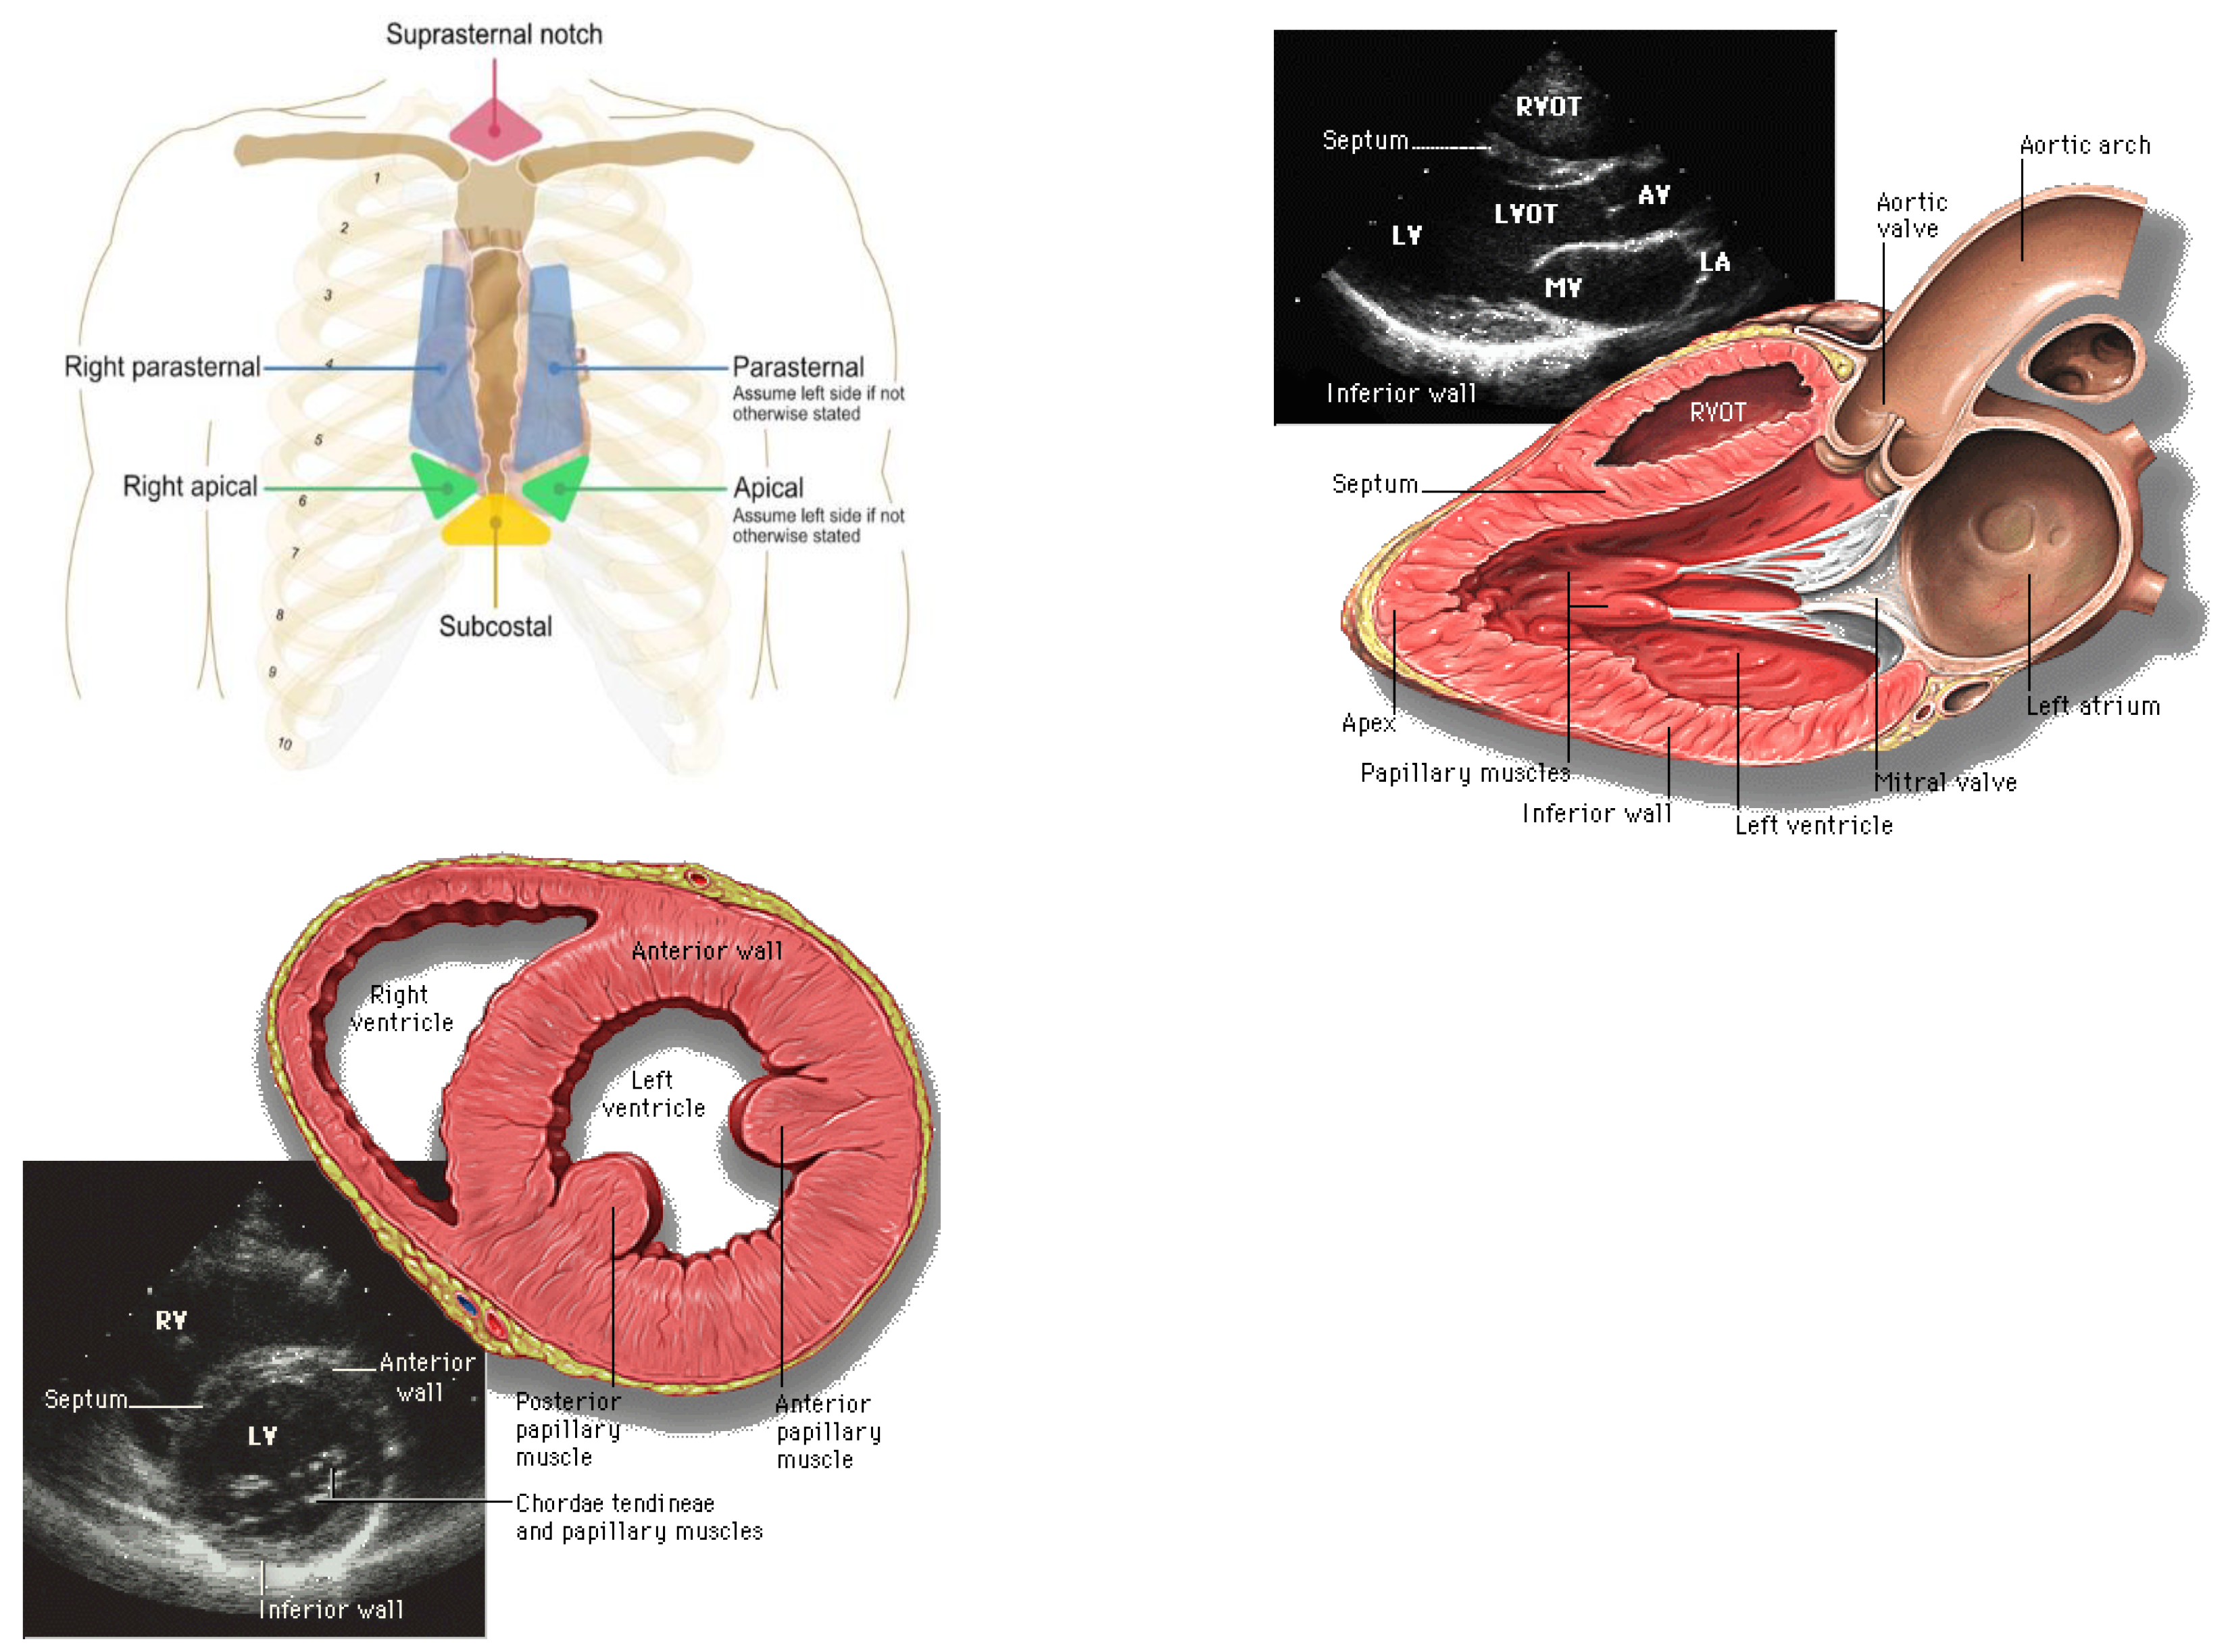
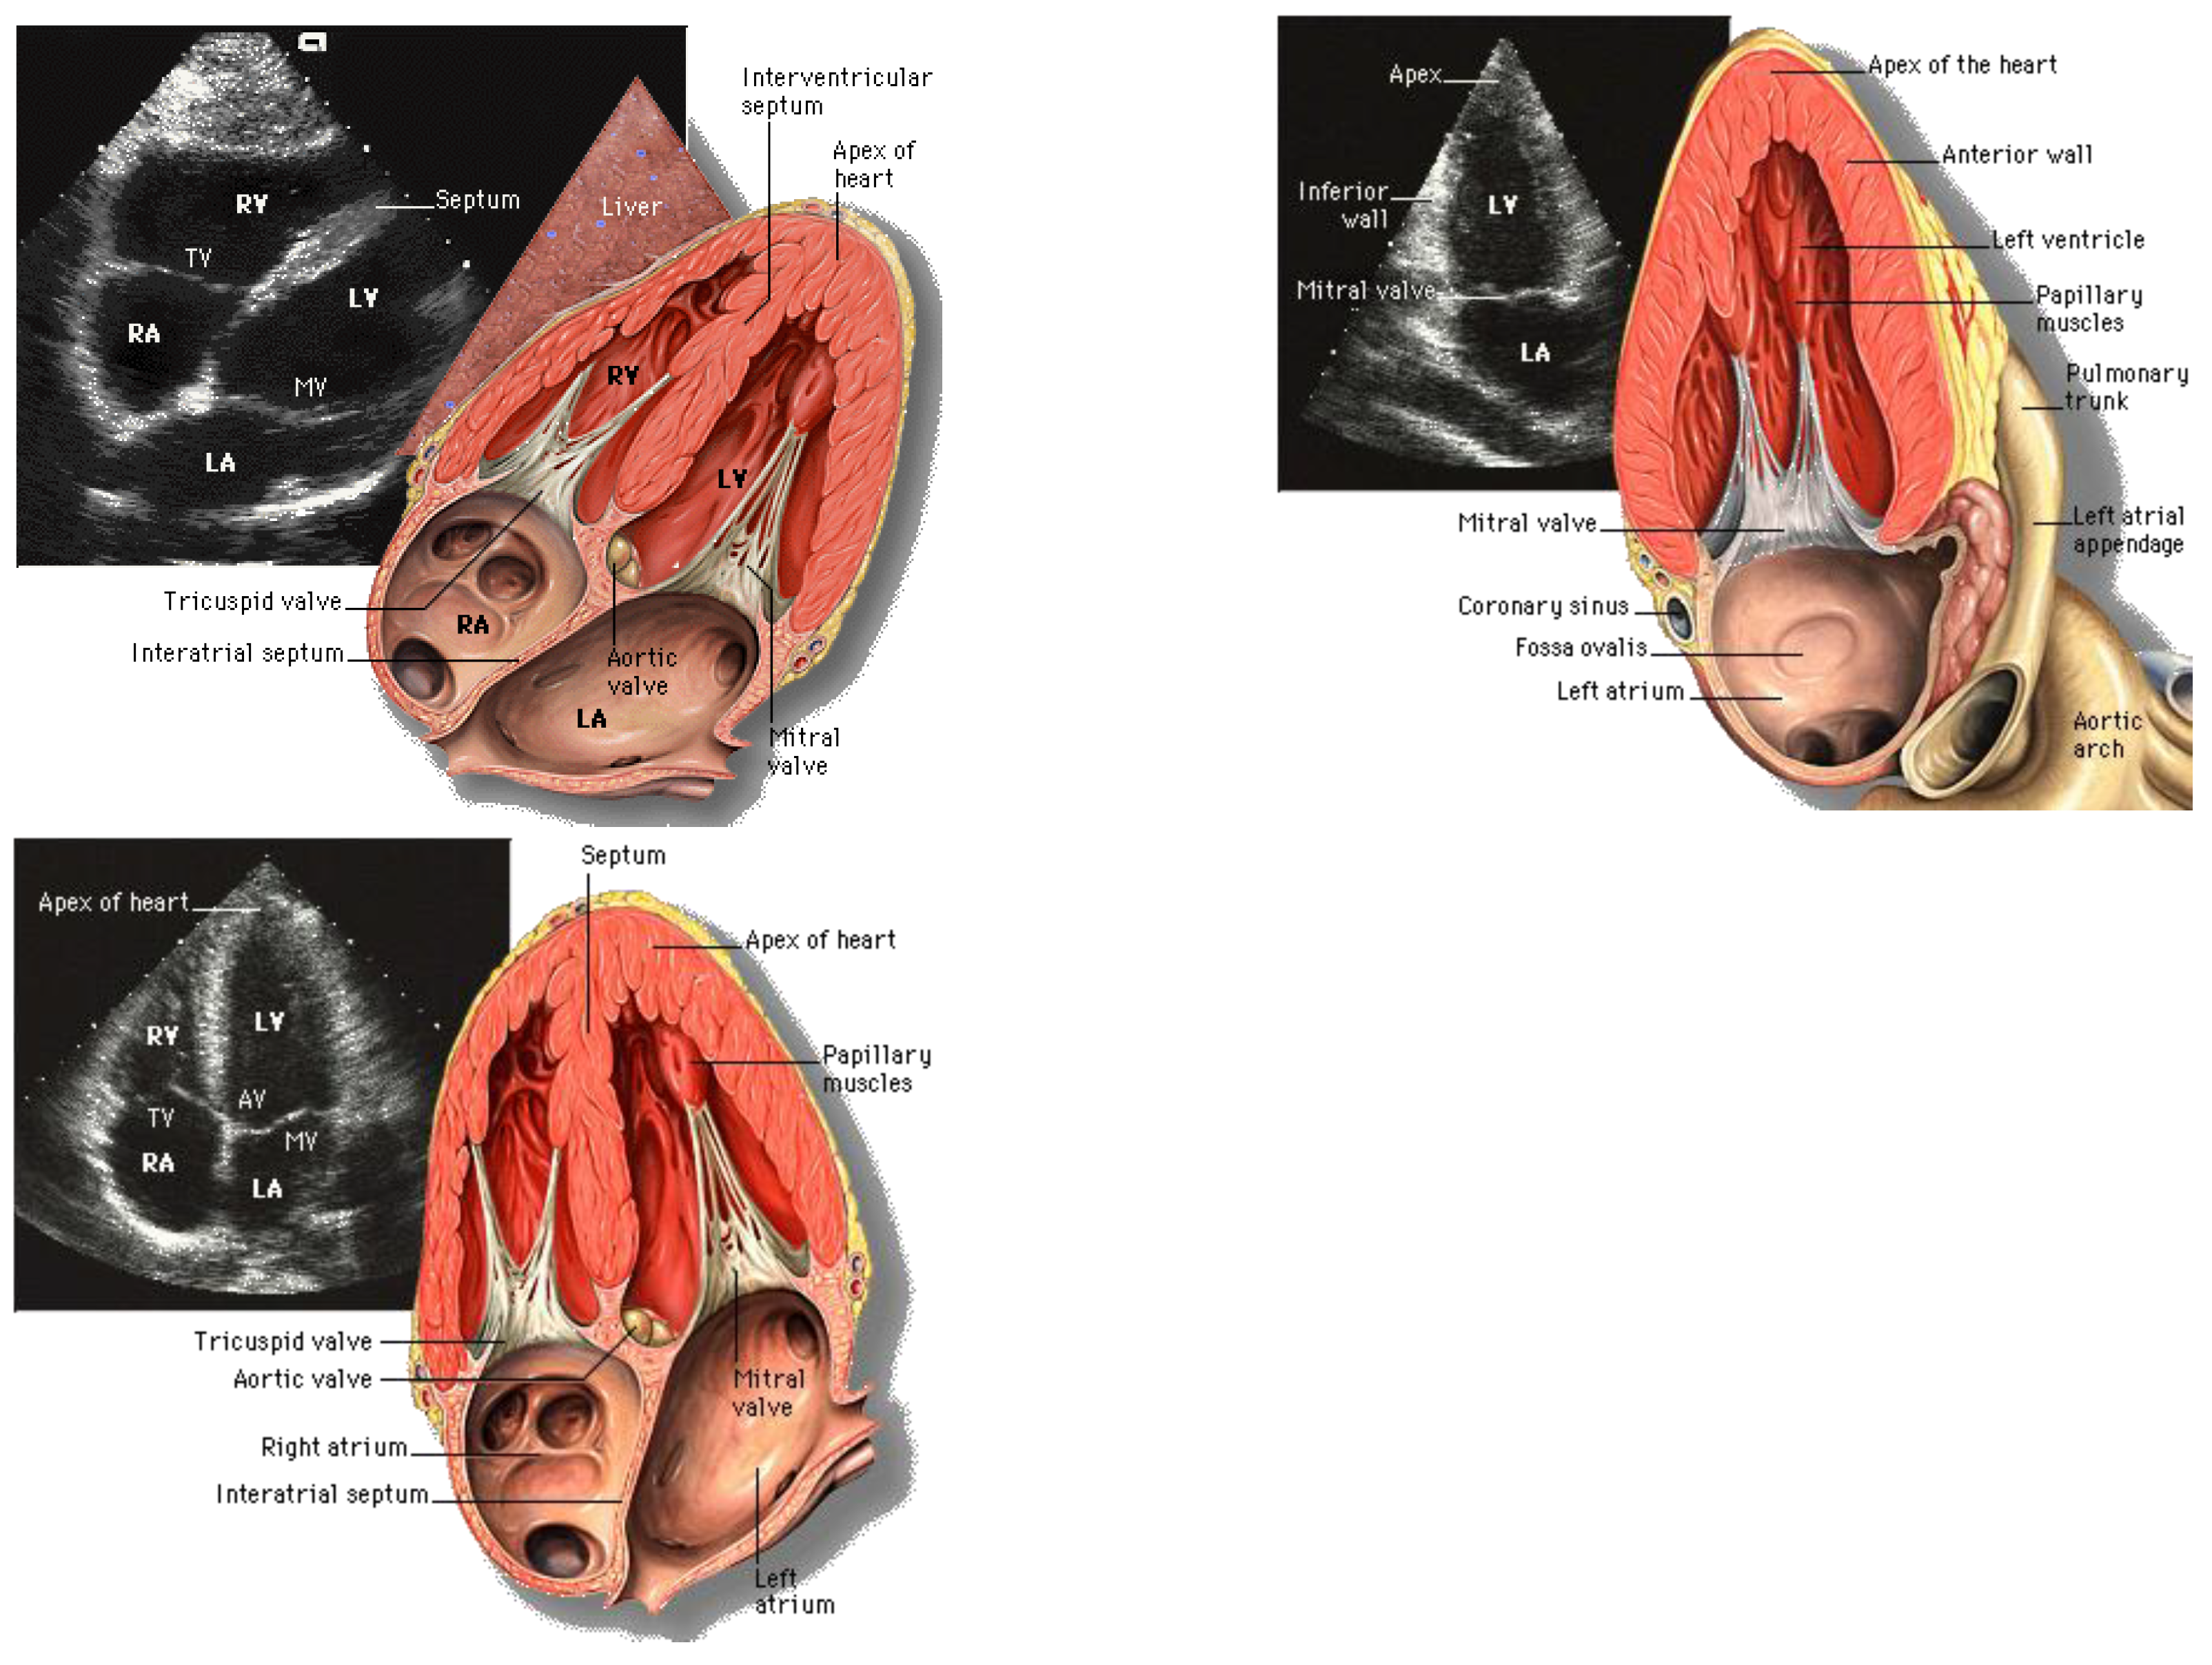
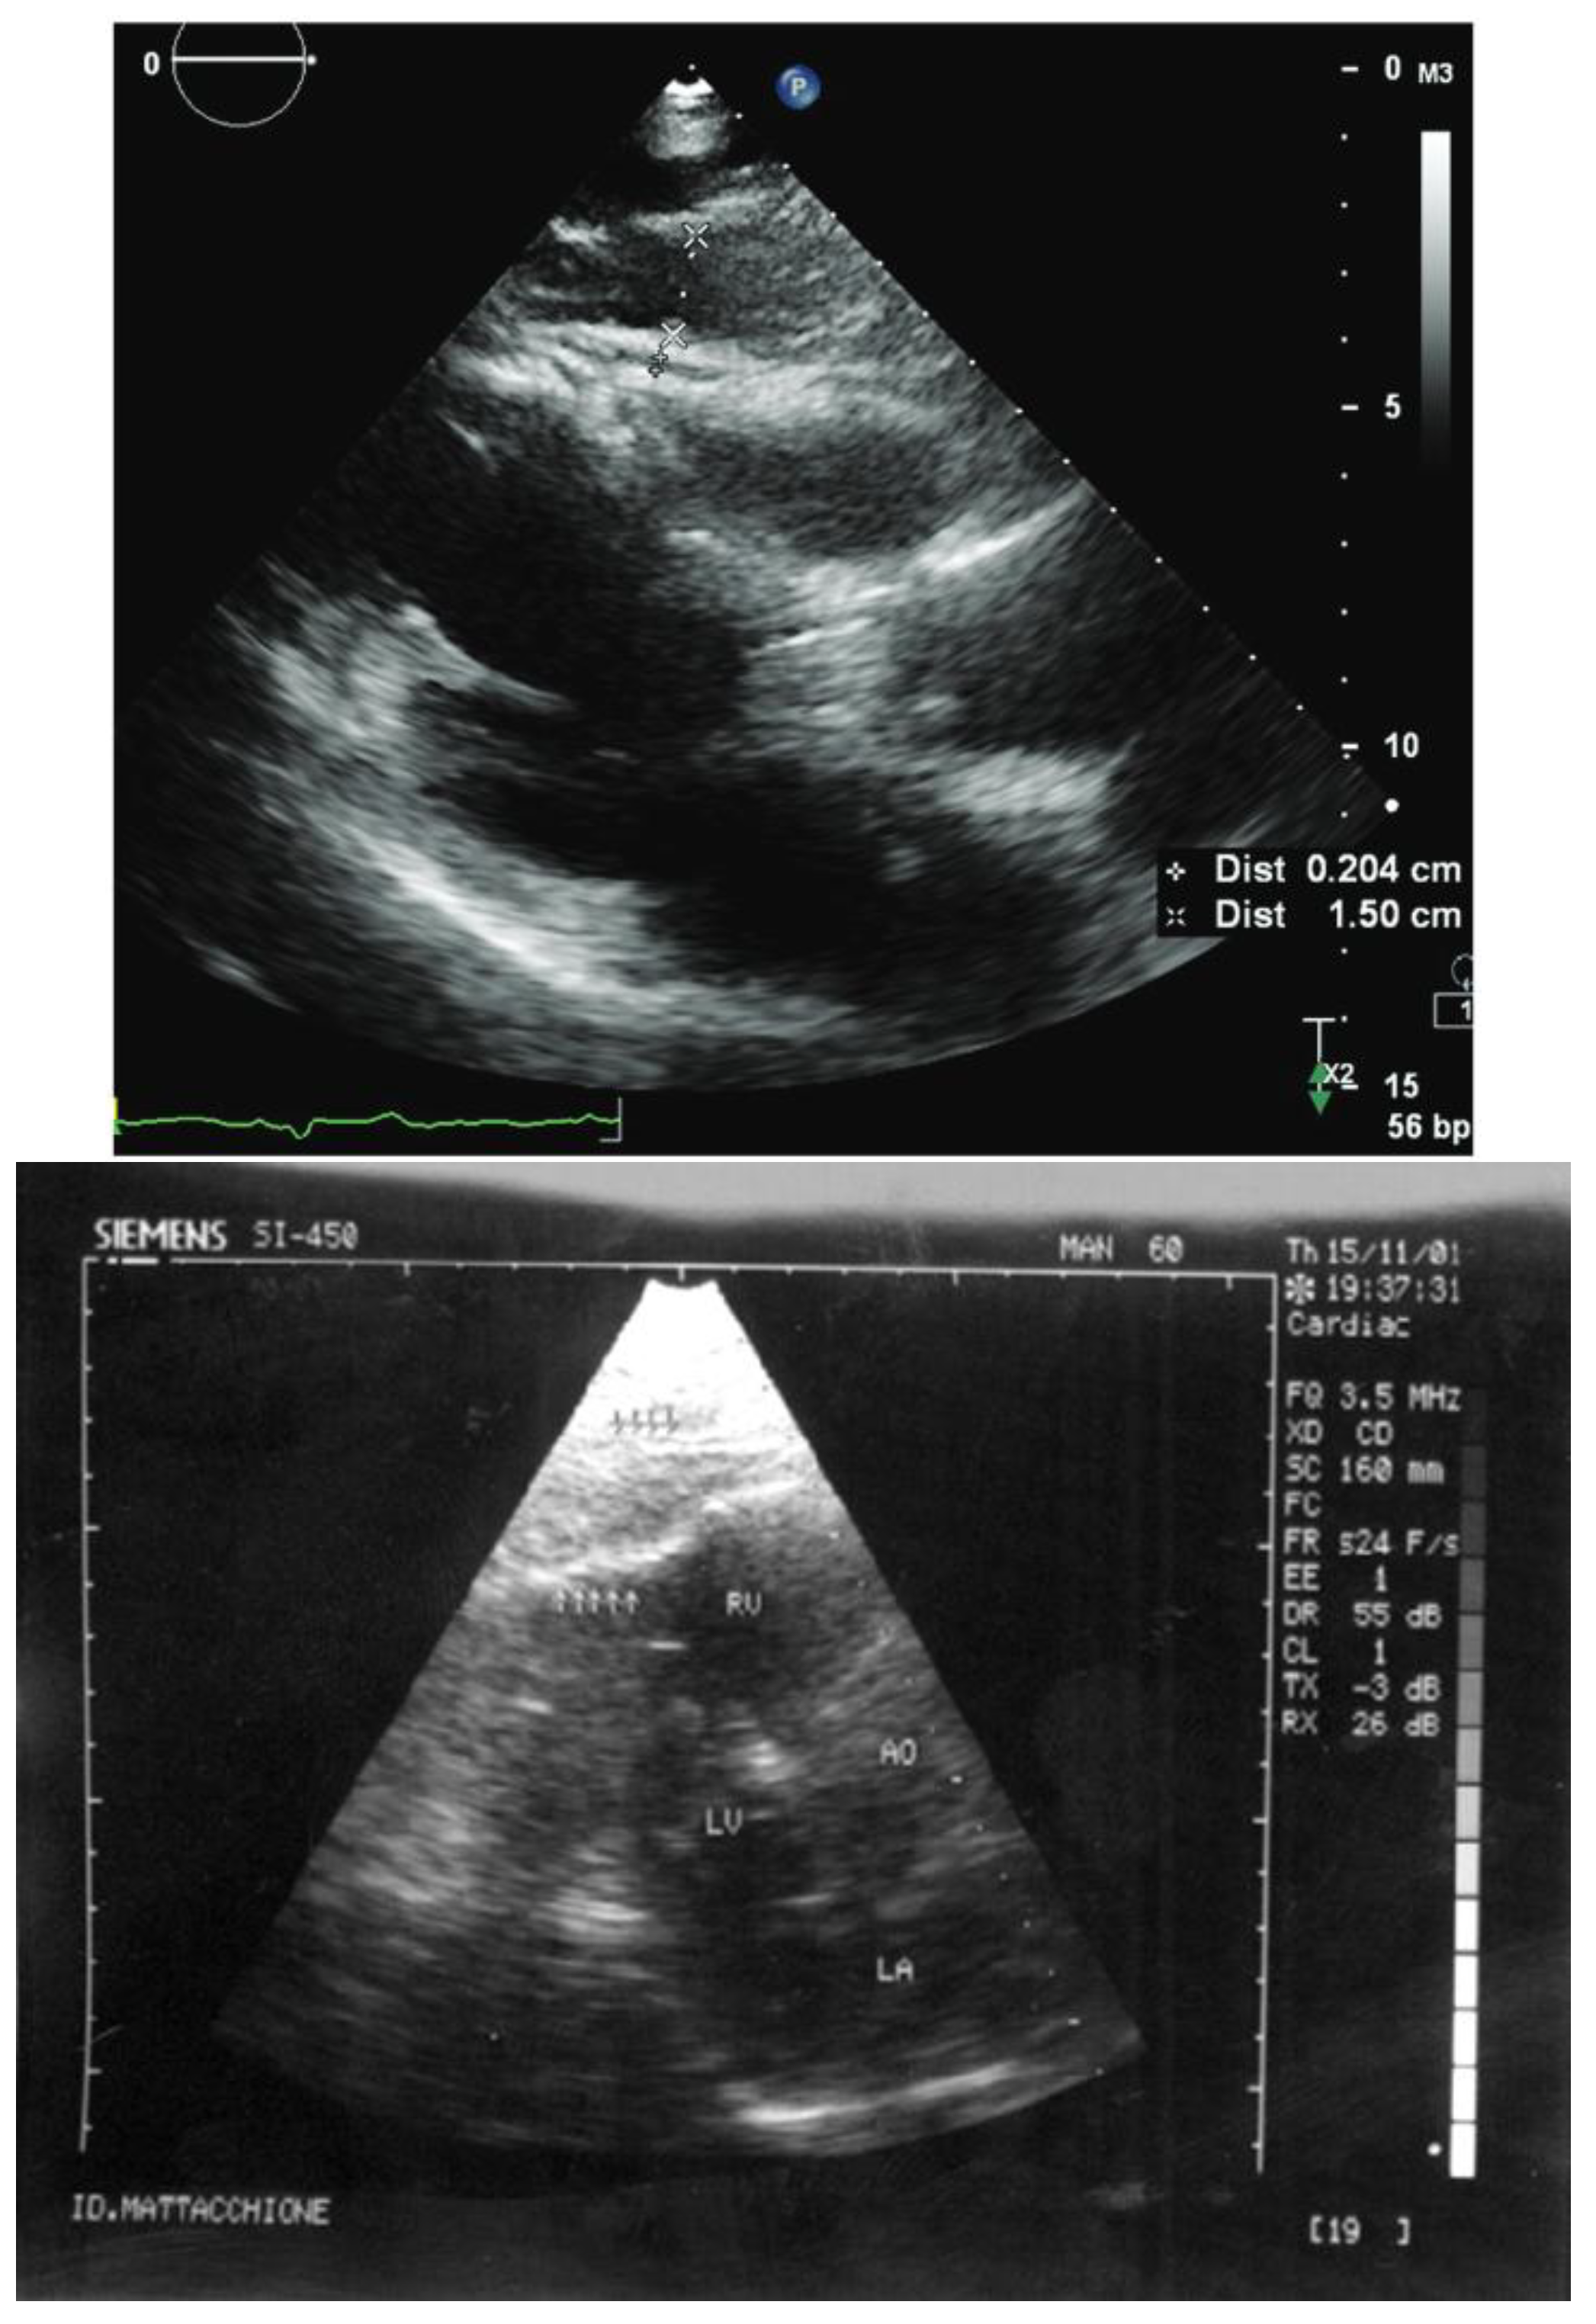
Figure 14.
EAT linear measurements perpendicular to aortic annulus below and above a 5 mm threshold,[126] differentiation between EAT and PAT in echocardiograms[26].
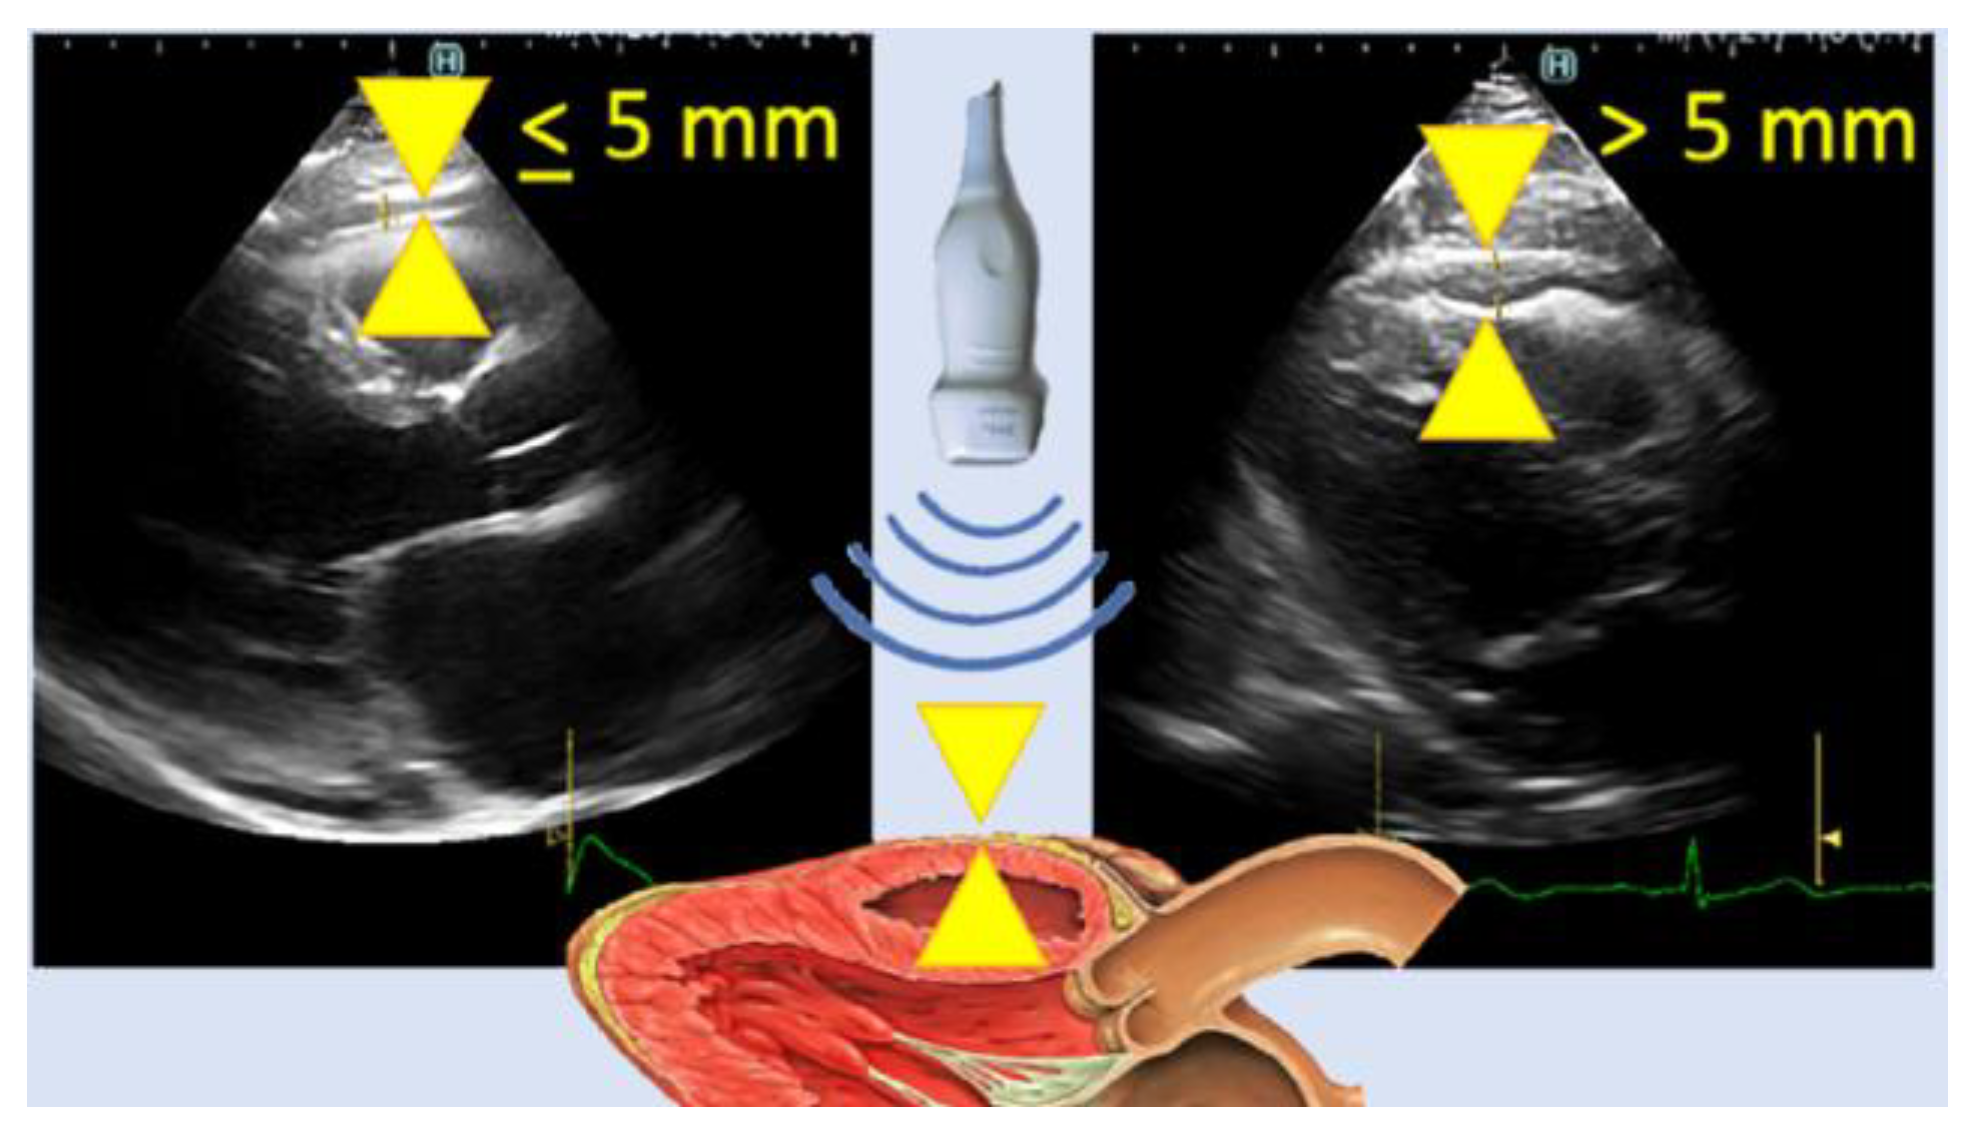
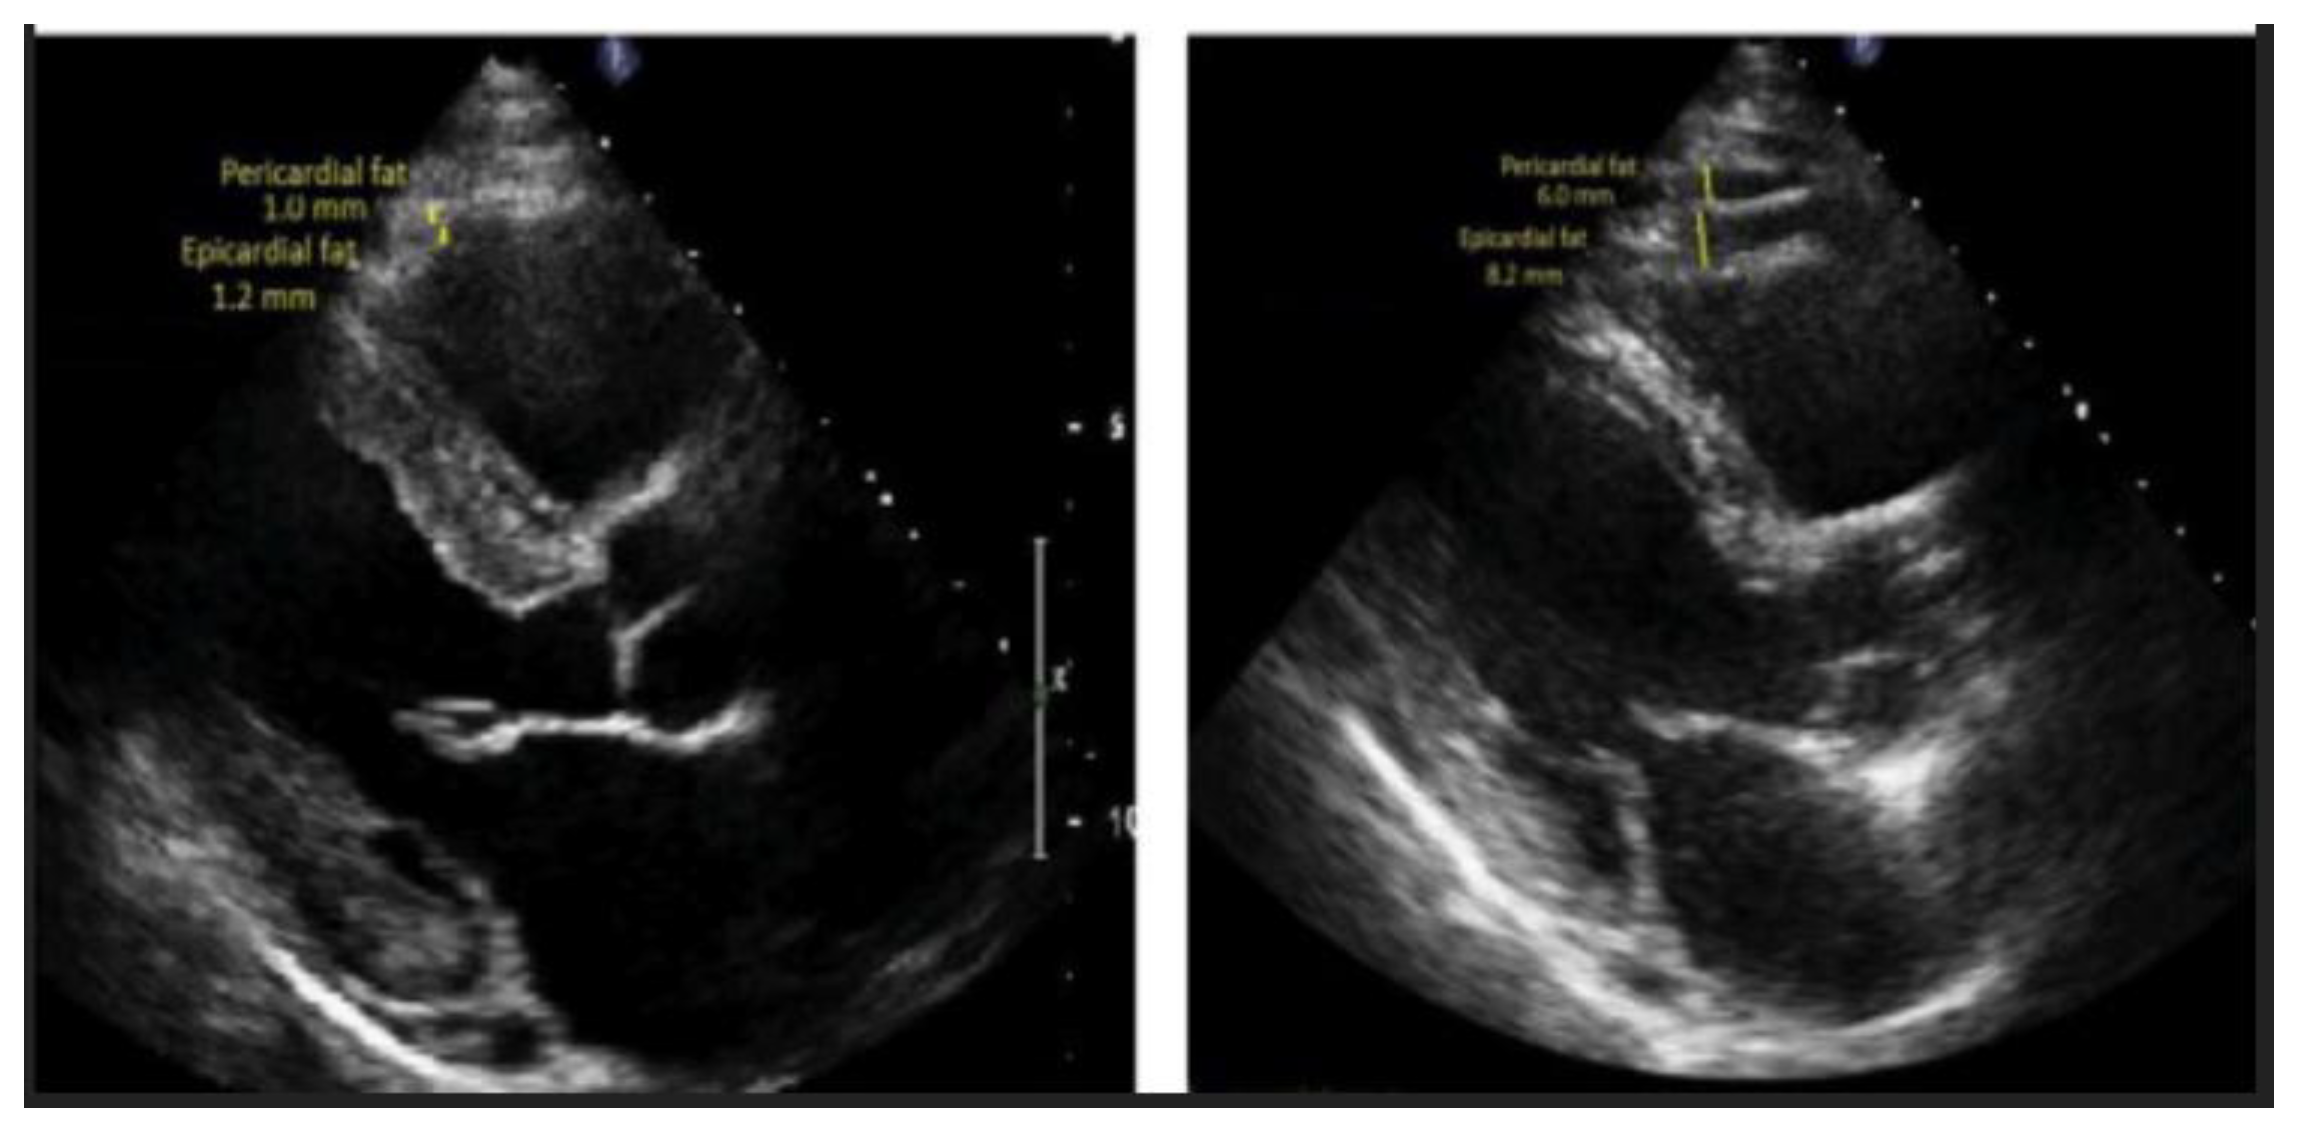

Table 1.
Summary of CAT segmentation studies using MRI, SA = short axis; MSD = mean surface distance, NN = neural network.
Table 1.
Summary of CAT segmentation studies using MRI, SA = short axis; MSD = mean surface distance, NN = neural network.
| Author | Tissue | Study | Metrics | Values |
|---|---|---|---|---|
| Feng et al.[87] - 2024 | EAT | Automatic double Res-Unet CNN based on fat maps, Dixon MRI | DSC | 0.8630 |
| Chen et al.[86] - 2023 | PAT | Automatic triple-stage 3SUnet, 2D SA MRI | Precision Recall |
0.766±0.152 0.831±0.126 |
| Daude et al.[88] - 2022 | PAT EAT |
Automatic four-chamber FCNs, cine MRI | DSC MSD (mm) DSC MSD (mm) |
0.7700 1.71 0.8000 2.38 |
| Kulasekara et al.[89] - 2022 | CAT | Automatic 3D U-Net, cine MRI | DSC | 0.7170 |
| Fulton et al.[90] - 2020 | EAT | Automatic double NN, cine MRI | DSC | 0.56±0.12 |
Table 2.
Summary of CAT quantification studies using cardiac MRI.
| Author | Tissue | Study | Units | Values | Correlation |
|---|---|---|---|---|---|
| Guglielmo et al.[93] - 2024 | EAT | Automated deep learning volume measurement | mL | 43.5±9.0 | p < 0.001 |
| Secchi et al.[94] - 2022 | EAT | Manual volume measurement using open-bore MR, cine MRI | Systole cm3 Diastole cm3 |
88.25 87.00 |
p < 0.124 p < 0.551 |
| Henningsson et al.[92] - 2020 | EAT | Manual volume measurement using cine Dixon technique, 3D Dixon MRI | mL | 145±90 | p < 0.01 |
Table 3.
Summary of CAT segmentation studies using CT, NC = non-contrast; CS = Calcium Score; CCTA = coronary CT angiography; MAD = Mean Absolute Distance.
Table 3.
Summary of CAT segmentation studies using CT, NC = non-contrast; CS = Calcium Score; CCTA = coronary CT angiography; MAD = Mean Absolute Distance.
| Author | Tissue | Study | Metrics | Values | Correlation |
|---|---|---|---|---|---|
| Zhang et al.[105] - 2020 | EAT | Automatic dual U-Nets, CT | DSC | 0.9119 | 0.9304 |
| He et al.[101] -2020 | EAT | Automatic 3D deep attention U-Net, CCTA | DSC Precision Recall |
0.8550 0.8640 0.8950 |
NA |
| Militello et al.[84] - 2019 | EAT | Semi-automatic image analysis, CS and CCTA | DSC MAD |
0.9374, 0.9248 2.18, 2.87 |
(Pearson) 0.9591 0.9513 |
| Priya et al.[106] - 2019 | EAT PAT |
Adaptive Region Growing Algorithm, NC CT | Accuracy DSC Accuracy DSC |
0.9850 0.9870 0.9640 0.9530 |
NA |
| Norlén et al.[107] - 2016 | Automatic supervised, CCTA | DSC | 0.9900 | 0.9900 | |
| Rodrigues et al.[108] - 2016 | EAT PAT |
Automatic supervised, CT | DSC Accuracy |
0.9810 0.9850 |
NA |
Table 4.
Summary of CAT quantification studies using CT, EATd = EAT density; EATv = EAT volume; T-EAT = Total EAT; TAT = thoracic adipose tissue; EATd = EAT density; EATv = EAT volume; NC = non-contrast; CCTA = coronary CT angiography; CS = Calcium Score; ICC = Intra Class Correlation.
Table 4.
Summary of CAT quantification studies using CT, EATd = EAT density; EATv = EAT volume; T-EAT = Total EAT; TAT = thoracic adipose tissue; EATd = EAT density; EATv = EAT volume; NC = non-contrast; CCTA = coronary CT angiography; CS = Calcium Score; ICC = Intra Class Correlation.
| Author | Tissue | Study | Units | Values | Correlation |
|---|---|---|---|---|---|
| Hoori et al.[110] -2022 | EATd | Automatic DeepFat, NC low-dose CS CT | cm3 | 100.2 138.6 |
R = 0.9833 R = 0.9852 |
| Abdulkareem et al.[17] - 2022 | EATv | Automatic Single Multi-task framework, ECG-gated CT | mL | 101.16 | R = 0.9300 |
| Commandeur et al.[103] - 2019 | EATd | Automatic CNN, NC CS CT |
cm3 | 86.75 | R = 0.9740, p < 0.001 |
| Commandeur et al.[111] - 2018 | EATd TATd |
Automatic dual ConvNet, NC CCTA |
cm3 | 130.35 130.94 |
R = 0.945 p < 0.001 |
| D’Errico et al.[112] - 2017 | T–EATd RV–EATd LV–EATd |
Manual volume analysis, NC CCTA |
cm3 | 103.62, 94.96 67.23, 57.41 38.01, 35.27 |
ICC = 0.9900 |
Table 5.
Summary of CAT quantification studies using US, ROC = Receiver Operating Curve; WC = Waist Circumference.
Table 5.
Summary of CAT quantification studies using US, ROC = Receiver Operating Curve; WC = Waist Circumference.
| Author | Tissue | Study | Units | Values | Correlation |
|---|---|---|---|---|---|
| Average from metanalysis in[127] - 2022 | EAT | Metanalysis of EAT in patients with CAD and Non-CAD groups |
mm | 5.68 avg 3.61 avg |
NA |
| Eren et al.[128] - 2021 | EAT | EAT for atrial fibrillation prediction univariate, multivariate regression ROC EAT > 6.5 mm |
mm mm Sensitivity Specificity |
8.300, 6.100 5.850, 3.521 0.720 0.770 |
p < 0.001 |
| Xiao et al.[16] - 2020 | EAT | EAT thickness and heart disease (control) Coronary heart disease Single vessel disease Double vessel disease Multi vessel disease |
mm | 4.88 6.51 5.66 6.24 6.86 |
p < 0.01 vs control group |
| Parisi et al.[129] - 2020 | EAT | Validation of EAT thickness assessment for predicting CAD | mm | 11.00 (median) 1.00 mm (min) 29.00 mm (max) |
p < 0.001 |
| Meenakshi et al.[130] - 2016 | EAT | EAT thickness as CAD marker | mm | 0.9 min 13.5 max 5.56 avg (men) 5.97 avg (women) |
p (CAD) = 0.0001 p (BMI) = 0.08 |
| Iacobellis et al.[124] - 2003 | RV – EAT |
Epicardial Fat from Echocardiography, thickness | mm | 1.90 min 15.70 max 7.30 avg (men) 6.84 avg (women) |
r (VAT) = 0.798 r (WC) = 0.74 |
Table 6.
Comparison of main medical imaging modalities for CAT segmentation and quantification.
| Feature | MRI | CT | Echocardiography |
|---|---|---|---|
| Radiation Exposure | None | High radiation dose | Minimal or no radiation |
| Examination time | Longer scan time | Fast acquisition time | Real-time imaging |
| Cost | High | Moderate | Low |
| Image Quality | High spatial and temporal resolution, Multiplanar imaging capabilities, High soft tissue contrast, excellent for fat quantification | Good spatial resolution, accurate fat attenuation, good for calcium scoring | Lower resolution, limited depth penetration |
| CAT Assessment | Accurate quantification, can differentiate fat types | Good for assessing fat distribution, but less accurate for quantification | Limited ability to quantify fat, primarily qualitative assessment, free wall of RV thickness |
| CAT quantification | Volume, thickness | Volume, thickness | Thickness |
| Contraindications | Contraindicated for patients with certain metal implants | Can be performed on patients with pacemakers/defibrillators | None |
| Constraints | Difficult for claustrophobic and robust patients, requires specialized cardiac MRI protocols | Motion artifacts can affect image quality, may require contrast agents | Difficulty in imaging obese patients, limited field of view, operator-dependent |
| Availability | Widely available | Widely available | Widely available |
| Infrastructure | Large, requires a shielded room | Moderate size room | Minimal, portable |
| Other Applications | Cardiac function, tissue characterization, perfusion imaging | Chest imaging, vascular imaging | Cardiac function, valve assessment, cardiac chamber dimensions |
Disclaimer/Publisher’s Note: The statements, opinions and data contained in all publications are solely those of the individual author(s) and contributor(s) and not of MDPI and/or the editor(s). MDPI and/or the editor(s) disclaim responsibility for any injury to people or property resulting from any ideas, methods, instructions or products referred to in the content. |
© 2025 by the authors. Licensee MDPI, Basel, Switzerland. This article is an open access article distributed under the terms and conditions of the Creative Commons Attribution (CC BY) license (http://creativecommons.org/licenses/by/4.0/).
Copyright: This open access article is published under a Creative Commons CC BY 4.0 license, which permit the free download, distribution, and reuse, provided that the author and preprint are cited in any reuse.


