
Submitted:
18 March 2025
Posted:
19 March 2025
You are already at the latest version
Abstract
Muscle fatigue impacts performance in sports, rehabilitation, and daily activities, with surface electromyography (sEMG) widely used for monitoring. In this study, we developed a wearable sEMG device and conducted experiments to create a dataset for fatigue analysis. We analyzed sEMG signals by evaluating time, frequency, and combined-domain metrics to identify reliable fatigue indicators. To ensure consistency across data sources, we applied a standardization process, calibrating signal-derived metrics to a common scale dynamically. Using these standardized metrics, we explored different methods to derive a fatigue index, through feature extraction and dimensionality reduction, assessing their effectiveness in capturing fatigue progression. We then trained and evaluated multiple machine learning models to predict fatigue levels, selecting the most effective approach for real-time monitoring. Integrated into a wireless BLE-enabled sensor platform, the system offers seamless body placement, mobility, and efficient data transmission. An initial calibration phase ensures adaptation to individual muscle profiles, enhancing accuracy. By balancing on-device processing with efficient wireless communication, this platform delivers scalable, real-time fatigue monitoring across diverse applications.
Keywords:
sEMG
; Muscle fatigue index
; Wireless IoT
; Digital Signal Processing
; Machine Learning Regression
; Features Standarization
; Real-time Fatigue Estimation
; BLE
; Feature Extraction
; Sports Science and Rehabilitation
1. Introduction
1.1. Background and Motivation
Muscle fatigue, characterized by a decline in muscle performance during sustained activity, significantly impacts athletic performance, rehabilitation outcomes, and daily functional tasks. Accurate monitoring and assessment of muscle fatigue are crucial for optimizing training regimens, preventing injuries, and enhancing recovery processes.
Surface electromyography (sEMG) has emerged as a non-invasive and effective method for evaluating muscle activity and fatigue [1]. By detecting electrical signals generated during muscle contractions, sEMG provides real-time insights into muscle function and fatigue levels. Changes in sEMG signal characteristics, such as shifts in frequency and amplitude, are indicative of muscle fatigue. The analysis of sEMG signals enables the identification of specific patterns associated with fatigue, facilitating timely interventions and personalized training adjustments.
The integration of Wireless Sensor Networks (WSNs) into sports and rehabilitation domains has further revolutionized the monitoring of physiological parameters. Wearable IoT devices equipped with sEMG sensors allow for continuous, real-time data collection and analysis, providing immediate feedback to users and practitioners. This advancement enhances the ability to track muscle performance, detect early signs of fatigue, and implement preventive measures effectively.
Despite these technological advancements, challenges persist in accurately quantifying muscle fatigue due to individual variability and the complex nature of muscle dynamics. The development of robust, personalized fatigue indices that adapt to individual differences and provide reliable assessments across various contexts would offer invaluable insights.
1.2. Related Work
Recent advancements in surface electromyography (sEMG) technology have led to significant progress in real-time muscle fatigue detection systems, with increasing emphasis on wearable, wireless, and low-power solutions. Early work in this field has focused on real-time monitoring using wearable sEMG systems, which are increasingly used to track muscle performance during exercise. Systems such as those developed by Liu et al. in 2019 [2] and Xu in 2020 [3] have laid the foundation for understanding how sEMG signal features -particularly in the frequency domain- can be linked to fatigue. Median Frequency (MDF) and Mean Power Spectrum Frequency (MNF) are widely recognized as key indicators of muscle fatigue, as these features tend to decrease with sustained muscle activity. Liu et al. [2] made a notable contribution with their EMG patch system by introducing an adaptive baseline method for fatigue quantification. Their approach leveraged Median Frequency (MF) values, calculating a baseline from the average of the first five MF readings, while subsequent readings were used to determine fatigue levels. Importantly, if newer MF values exceeded the baseline, the baseline was automatically updated, ensuring it represented the maximum capacity state of the muscle. This dynamic baseline approach allowed them to define a 10-level fatigue scale where the fatigue level was calculated as a percentage. This standardization technique provided a personalized, relative measure of fatigue that could account for individual differences, addressing a key challenge in fatigue quantification. However, the lack of wireless capabilities in earlier systems limited their practical applications, especially in dynamic or real-world settings. Wireless communication, particularly via Bluetooth Low Energy (BLE), has since been integrated into sEMG systems, enabling long-duration monitoring with minimal power consumption. The importance of low-power wireless communication has been underscored in recent studies, such as Wu et al. in 2021 [4], which proposed an ultra-low power sEMG sensor optimized for wearable biometric applications. Their system, using BLE, achieved significant improvements in energy efficiency, making it suitable for continuous, real-time monitoring of muscle fatigue. The Multiple Feedback Filter (MFB) used in their design further enhanced signal quality by effectively removing noise, thus improving the reliability of fatigue detection. Furthermore, machine learning (ML) techniques have begun to play a crucial role in enhancing the performance of sEMG-based fatigue monitoring systems. Traditional methods of fatigue detection relied heavily on signal processing techniques, but the advent of ML has allowed for more accurate and personalized predictions. Sun et al. in 2022 [5] and Yousif et al. in 2019 [6] provide comprehensive reviews of the role of ML in analyzing sEMG signals. ML methods, including support vector machines (SVM), random forests, and k-nearest neighbors (k-NN), have demonstrated superior accuracy in classifying muscle fatigue patterns compared to conventional methods. These techniques are particularly useful in handling the complex, non-linear relationships inherent in sEMG data, which are challenging for traditional signal processing alone. The combination of signal processing and ML approaches has also led to the development of more sophisticated fatigue indices, such as the two-step classification algorithm proposed by Qassim et al. in 2022 [7]. By combining time-domain features like Integrated EMG with frequency-domain analysis to distinguish between high-frequency components (HFC) and low-frequency components (LFC), their system was able to achieve a high level of accuracy (95 The integration of fatigue detection with movement classification has also been explored in recent research by Alexandru Guzu et al. in 2024 [8]. Notable work in this area examined combined fatigue detection and movement classification for forearm exercises using sEMG signals. Their approach first employed fatigue detection to calculate a fatigue index, which was then used to categorize data for each movement into fatigued and non-fatigued states. When comparing classification algorithms for this multi-class problem (three movements × two fatigue states), Support Vector Machine (SVM) achieved the highest overall accuracy at 74 The recent work by Kinugasa and Kubo in 2023 [9] further exemplifies the growing trend of affordable, consumer-friendly systems for muscle fatigue detection. Their low-cost wireless system, which uses commercially available components, shows that it is possible to design a system that is both economical and effective for real-time monitoring of muscle fatigue. The use of basic time-domain metrics such as Root Mean Square (RMS) and Mean Power Frequency (MPF) demonstrated that low-cost, wearable sEMG systems can provide insights into muscle fatigue comparable to more expensive commercial systems. This work highlights the potential for widespread adoption of wearable sEMG devices in both sports and rehabilitation settings, where cost and accessibility have traditionally been barriers to entry. Overall, the integration of wireless, low-power devices, coupled with advanced signal processing and machine learning algorithms, is revolutionizing the way we monitor muscle fatigue in real time. These systems, through improved accuracy, personalization, and affordability, are opening up new possibilities for applications in sports, healthcare, and rehabilitation. However, challenges remain in achieving robust and scalable solutions that can adapt to the diverse needs of users and exercise conditions. Continued innovation in both the hardware and algorithmic domains will be essential to overcoming these challenges and realizing the full potential of wearable fatigue detection systems.
1.3. Contribution of This Work
This study presents a wearable, IoT-enabled sEMG system designed for real-time muscle fatigue monitoring. By integrating Bluetooth Low Energy (BLE) technology, the system enables wireless data transmission, overcoming the mobility constraints of traditional wired sEMG setups. To support in-depth analysis, we constructed an sEMG dataset specifically focused on the Vastus Medialis muscle, collecting data from multiple individuals with diverse athletic backgrounds. This dataset allows for extensive evaluation of fatigue-related metrics across different levels of physical conditioning, enhancing the generalizability of our findings. A structured methodology for sEMG dataset creation ensures high-quality data collection, supporting future research in wearable muscle monitoring. A comprehensive signal processing pipeline was developed, focusing on time-domain, frequency-domain, and hybrid-domain feature extraction to enhance fatigue detection. The study systematically evaluated multiple fatigue-related metrics to determine the most reliable indicators of fatigue progression. Through rigorous testing, metrics such as RMS, Mean Frequency, Average Rectified Value, Instantaneous Mean Amplitude difference, and fluctuation-based features were selected, ensuring a balance between computational efficiency and predictive accuracy. Furthermore, an extensive window size analysis was conducted, exploring different combinations of window lengths and overlaps to evaluate their impact on signal representation and computational efficiency, ultimately selecting the most suitable parameters while maintaining computational feasibility for real-time applications. A key contribution of this work is the development of a novel muscle fatigue index, designed to track fatigue progression across different individuals and sessions. By standardizing selected metrics and applying dynamic global scaling, the system ensures inter-subject consistency and robustness in fatigue assessment. Additionally, multiple baseline establishment techniques were explored to define a stable reference, improving the reliability of fatigue estimation models. Various fatigue estimation algorithms, including weighted sum, convolution-based indices, and dimensionality reduction methods such as PCA and t-SNE, were evaluated to identify the most effective approach. Machine learning regression models were implemented to enhance fatigue estimation, comparing different models such as linear regression, Support Vector Regression, k-NN, and Random Forest techniques. The models were trained on calibrated and standardized feature sets, ensuring a systematic approach to fatigue quantification. Through extensive analysis, the study selected the most suitable machine learning model for real-time, personalized fatigue monitoring. By combining IoT technologies, advanced signal analysis, metric standardization and machine learning, this work provides a scalable, real-time solution for athletes, clinicians, and researchers, enabling improved performance monitoring, injury prevention, and rehabilitation strategies.
2. Materials and Methods
2.1. System Design
The proposed muscle fatigue monitoring system is designed as a wearable device, with wireless surface electromyography (sEMG) acquisition setup, ensuring real-time signal processing and data transmission. The system consists of sEMG sensors, a microcontroller unit (MCU), and a Bluetooth Low Energy (BLE) communication module, all working together to provide an efficient and mobile monitoring solution.
The core processing unit selected for this study is the Arduino UNO R4 WiFi, which integrates a dual-core microcontroller with BLE 5.0 capabilities. This platform was chosen due to its high-resolution ADC, low-latency data processing, and extended BLE range, making it well-suited for continuous physiological monitoring applications. The system captures sEMG signals using pre-gelled Ag/AgCl electrodes placed on the desired muscle, ensuring optimal signal acquisition. A fourth-order Butterworth IIR filter is applied to preprocess the signals before transmission, eliminating unwanted noise and improving the accuracy of fatigue detection. BLE 5.0 is employed for data transmission, offering an energy-efficient communication protocol that ensures stable connectivity during movement. This approach enables real-time fatigue monitoring without the constraints of wired systems, making it particularly suitable for sports and rehabilitation applications.
Two commercially available sEMG sensors, the BioAmp EXG Pill v1.0b and MyoWare 2.0 Muscle Sensor, were evaluated for their suitability in the system. The BioAmp EXG Pill offers superior configurability, allowing gain adjustments up to 1000x and modifications to its bandpass filter to optimize the frequency range for specific biopotential measurements, including EMG, EEG, ECG, and EOG. Its built-in noise rejection and wide input frequency band make it highly resistant to electrical interference, ensuring high signal fidelity even in challenging environments. Default values were used for gain and frequency band was the wide input one. In contrast, the MyoWare 2.0 Muscle Sensor is a self-contained module designed for ease of integration with microcontrollers, featuring a default gain of 200x and an onboard analog filtering pipeline comprising a high-pass filter (20.8 Hz) and a low-pass filter (498.4 Hz). While MyoWare 2.0 provides processed envelope signals suitable for basic applications and offers expandability through various shields, its susceptibility to motion artifacts and fixed filtering parameters limit its adaptability for precise fatigue analysis.
Given these observations, BioAmp EXG Pill was selected as the primary sensor for the study due to its enhanced signal quality and flexibility in gain adjustment. MyoWare 2.0 was initially used in pilot testing, providing valuable insights into signal acquisition but proving less effective in applications requiring high signal fidelity. The integration of the selected sensor into the Arduino-based system enables robust real-time muscle activity tracking, forming the foundation for subsequent signal processing and feature extraction analyses.
2.2. Data Collection
The experimental protocol was designed to assess muscle fatigue through surface electromyography (sEMG) signals recorded from the Vastus Medialis during an isometric leg-extension exercise. This exercise was selected due to its ability to maintain a controlled contraction while minimizing movement artifacts. A total of 11 participants, consisting of ten males and one female, with an average age of 29.73 ± 7.98 years, completed three sessions each. Participants performed the exercise on a leg-extension machine, holding a static contraction at a predetermined knee angle for a sustained duration ranging between 60 and 80 seconds. The relevant weight was chosen based on the athlete’s frequency of exercise and preferences, ranging between 11 kg, 18 kg, and 25 kg to simulate realistic training conditions. To establish a baseline for muscle activity, a 5-7 second resting phase was included at the beginning of each trial, ensuring accurate calibration before the onset of fatigue-related changes. Between trials, participants were given a 1 to 2-minute rest period to allow partial recovery while maintaining fatigue accumulation over multiple sessions. While most participants maintained a consistent exercise execution, minor variations in muscle activation effort were observed, which were taken into account during data analysis. A representative image of the experimental setup is shown in Figure 1.
Electrode placement followed the SENIAM guidelines, ensuring high-quality signal acquisition. Electrodes were positioned parallel to the muscle fibers to maximize signal amplitude and reduce phase cancellation effects. The primary electrodes were placed at 80% of the distance between the anterior superior iliac spine and the patella, while the reference electrode was positioned over a neutral bony site above the patella. A detailed illustration of the key points is presented in Figure 2. This configuration was chosen to align with the natural anatomical orientation of the muscle fibers, reducing variability in signal acquisition and improving reproducibility. Alternative electrode placements were briefly explored but exhibited higher vulnerability to cross-talk from adjacent muscles and inconsistent amplitude variations.
To mitigate cross-talk and external noise sources, several measures were implemented. The differential recording technique was employed, using closely spaced electrodes to enhance signal specificity while canceling out common noise. Additionally, proper skin preparation, including shaving, cleansing with alcohol, and drying, was performed to reduce impedance and improve electrode contact. Motion artifacts were minimized by ensuring a tight but non-restrictive electrode attachment, preventing displacement during contractions. Environmental noise, particularly 50 Hz powerline interference, was suppressed using a notch filter, and the system operated on a battery-powered supply to eliminate ground loops. sEMG signals were sampled at 800 Hz, a frequency sufficient to capture relevant muscle activation characteristics. The acquired signals underwent preprocessing with a 4th-order Infinite Impulse Response (IIR) Butterworth bandpass filter (25–380 Hz) to isolate the physiological sEMG frequency range while eliminating low-frequency motion artifacts and high-frequency electrical noise. The filter order was implemented as two cascaded second-order sections, reducing numerical errors and improving stability. These frequency values were selected to avoid interference near 20 Hz and 500 Hz, ensuring a clean and informative sEMG signal. The signal acquisition and processing pipeline is depicted in Figure 3.
For real-time data transmission, Bluetooth Low Energy (BLE) 5.0 was implemented, ensuring efficient wireless communication between the acquisition system and the processing unit. The BLE protocol was structured to maintain low latency while transmitting sEMG data continuously. The BLE central device, such as a computer or mobile application, requested data from the BLE peripheral device (Arduino-based system), ensuring synchronized data flow. The microcontroller unit acquired sEMG signals and buffered them locally before transmitting packets in 236-byte frames, each containing 59 floating-point values. The transmitted data were received by a computer as the BLE central device, where they were further processed, formatted and stored into JSON output files, allowing seamless integration with data analysis pipelines.
By integrating high-fidelity signal acquisition, optimized electrode placement, and wireless data transmission [4], this methodology enables real-time muscle fatigue monitoring with minimal artifacts, making it applicable for both sports performance and rehabilitation settings.
2.3. Signal Processing and Feature Extraction
2.3.1. Feature Evaluation
In this study, feature evaluation and selection was a critical step in developing a robust muscle fatigue assessment model. The objective was to identify metrics that exhibited consistent changes over time or across exercise sessions, as these variations could be correlated with muscle fatigue [10]. Upon examining the acquired data, we observed that during the rest phase, both the raw signal and extracted features showed minimal variance, indicating that muscle activity was stable and not influenced by fatigue-related factors. To ensure a structured analysis, we segmented the data into three distinct phases: (i) the rest phase, which corresponds to the initial seconds before activation, (ii) the activation phase, a brief transition period of approximately two seconds during which the leg extends to a stable position, and (iii) the active phase, which constitutes more than 70% of each session, capturing sustained muscle engagement under load. Since fatigue is more prominently observed when the muscle is subjected to continuous exertion, our evaluation of fatigue-related metrics was focused exclusively on data from the active phase, where progressive fatigue effects were expected to be most insightful. Given that the isometric contraction induced progressive fatigue in each participant, it was hypothesized that features displaying a systematic trend during prolonged exertion were most relevant for fatigue estimation.
A wide range of features from different signal processing domains were initially examined, including time-domain, frequency-domain, time-frequency domain and complexity-based features.
Time-domain features such as Root Mean Square (RMS), Zero Crossings (ZC), and Average Rectified Value (ARV) [11] were analyzed to assess their ability to reflect muscle activation levels. RMS provides a measure of the overall power of the signal and is computed as:
As fatigue progresses, RMS is expected to increase, reflecting greater muscle effort to maintain force production. Similarly, ARV, given by:
also increases, capturing the greater absolute signal amplitude associated with fatigue. Zero Crossings (ZC), which counts the number of times the signal crosses zero, is computed as:
where is an indicator function that returns 1 when the sign of consecutive signal values changes (crossing zero) and 0 otherwise. ZC typically decreases as fatigue sets in due to the reduction of higher-frequency components in the signal.
Frequency-domain features were explored to capture the spectral characteristics of the signal. Mean Frequency (MeanFreq) and Median Frequency (MedianFreq) [12] describe how power is distributed across different frequency components and are computed as:
where represents the frequency bins, is the corresponding power spectral density at each frequency, and is the median frequency that divides the total power into two equal halves. As fatigue progresses, both measures decrease due to the recruitment of slower motor units. Mean Power Frequency (MNF) follows a similar trend, shifting toward lower frequencies [13]. Spectral Moments Ratio, which characterizes the spectral shape of the signal, was also analyzed for its sensitivity to fatigue-induced frequency shifts.
Time-frequency domain features combine frequency and amplitude-based metrics to improve fatigue estimation. The MNF/ARV Ratio [11] normalizes spectral shift effects by accounting for both time and frequency domain variations. This ratio tends to decrease as fatigue progresses, providing a more holistic view of muscle endurance degradation. Instantaneous Mean Frequency represents the real-time spectral centroid of the signal and provides insight into momentary shifts in power distribution. Instantaneous Medium Frequency Band focuses on a predefined segment of the spectrum, allowing for finer tracking of fatigue-related frequency shifts. These features are particularly valuable in detecting rapid, localized changes in muscle activation.
Instantaneous Mean Amplitude Difference (IMA Difference) [7] quantifies the difference in amplitude between low and high-frequency components of the signal. Specifically, the frequency spectrum is divided at 80 Hz, with the Low-Frequency Component (LFC) spanning 25-80 Hz and the High-Frequency Component (HFC) covering 80-380 Hz. IMA Difference is calculated as the difference between IMA LFC and IMA HFC, effectively capturing how the frequency spectrum becomes more concentrated in the lower frequency range as fatigue progresses. Since muscle fatigue is associated with a spectral shift toward lower frequencies, IMA Difference increases, making it a strong indicator of fatigue development.
Fluctuation-based metrics [14] provide valuable insight into signal stability and variability. Fluctuation measures analyze changes in signal amplitude and spectral distribution over time. Fluctuation Variance quantifies the overall variability of the signal, Fluctuation Range Values measure the spread of fluctuations within a defined window, and Fluctuation Mean Difference examines the average deviation between successive fluctuations. An increase in these measures typically signifies greater instability in neuromuscular control as fatigue progresses.
Complexity-based features such as Empirical Ensemble Mode Decomposition (EEMD) and Empirical Mode Decomposition (EMD) [12] were incorporated. EEMD is an extension of Empirical Mode Decomposition (EMD) designed to mitigate mode mixing by introducing white noise during decomposition. While EEMD theoretically improves mode separation, our analysis revealed that its computational cost was prohibitively high, making it unsuitable for real-time applications. As a result, it was excluded from further evaluation. Conversely, EMD, despite requiring slightly more than 0.5 seconds per computation, remained feasible due to its ability to extract meaningful fatigue-related features. A thorough examination of the IMFs obtained through EMD indicated that only the first two components exhibited a consistent trend aligned with muscle fatigue progression. Therefore, we selected the median frequencies of these IMFs, denoted as MDF1 and MDF2, as key complexity-based features. These features are particularly relevant since median frequency typically decreases with fatigue, reflecting the shift of spectral power toward lower frequencies.
Entropy-based features such as Wavelet Entropy [12] and Band Spectral Entropy were used to assess the disorder and unpredictability of the signal. Wavelet Entropy evaluates the energy distribution across different frequency bands and is expected to decrease with fatigue as the signal becomes more uniform. Band Spectral Entropy measures spectral dispersion and also decreases as fatigue leads to spectral compression. Lempel-Ziv Complexity, which quantifies the repetitiveness of a signal, was examined as well. It typically decreases with fatigue due to the loss of variability in muscle activation patterns. Following an extensive evaluation process, a subset of features was selected based on a balance between interpretability, reliability and computational efficiency in detecting assumed fatigue progression. The final set of features included:
- RMS
- MNF/ARV ratio
- Instantaneous Mean Amplitude Difference (IMA Difference)
- EMD-based Median Frequencies (MDF1 and MDF2)
- Fluctuation Variance
- Fluctuation Range Values
- Fluctuation Mean Difference.
These metrics demonstrated a clear progression with fatigue as shown in Figure 4, aligning with established literature while maintaining feasibility for real-time processing. The refined feature set enables efficient muscle fatigue monitoring while ensuring computational constraints are met for potential embedded system deployment.
2.3.2. Window Size Analysis
A crucial aspect of signal processing in this study involved determining the optimal window size and step size for feature extraction. Various window sizes and overlaps were evaluated to understand their impact on different feature metrics, including variance, max-min range, maximum differential, computational time. The analysis revealed that different combinations of window and step sizes led to varying feature distributions over time, particularly in Empirical Mode Decomposition (EMD) features and fluctuation-based features, where the metric patterns exhibited significant changes as time progressed.
To identify the optimal windowing strategy, multiple configurations were systematically compared, as presented in Table 1. The performance of each configuration was assessed based on feature stability, signal representation and computational efficiency. Among the tested window sizes, the 800-sample window with a 75% overlap (step size of 200 samples) was selected as the most effective configuration.
Smaller window sizes, such as 200 window - 150 step or 400 window - 200 step (whereas window length - step length), exhibited higher variance in key metrics, leading to noisier feature representations. For instance, the MNF/ARV variance for the 200-150 configuration was 8.00, whereas for 800-200, it was reduced to 6.67, indicating smoother feature evolution over time. Similarly, EMD variance dropped from 767.65 in the 200-150 window to 384.56 in the 800-200 window, highlighting a more stable and reliable tracking of muscle activity. The fluctuation variance, which was particularly high in smaller windows (4482.82 × 10¹² for 200-150), also showed a significant reduction in the 800-200 setup (3458.47 × 10¹²), mitigating excessive fluctuations in extracted features.
At the same time, excessively large windows, such as 1600-800, introduced computational constraints while not necessarily improving signal stability. The max-min range for EMD, for example, was 201.56 for the 1600-800 window, only slightly higher than the 179.00 recorded for the 800-200 setup, indicating that the increased window size did not provide substantial advantages in feature separation. Additionally, the computational time for 1600-800 was 0.28 seconds, nearly double that of the 800-200 configuration (0.13 seconds), which could pose a challenge for real-time applications.
Apart from the window size, the step size played a critical role in determining the update frequency of the extracted features. A step size of 200 samples ensured that new features were computed at a frequency of 4 Hz (due to 800Hz sampling rate), providing frequent updates without excessive computational overhead. Reducing the step size further, such as to 100 or 50 samples, would have allowed even more frequent updates but at the cost of higher processing demands. On the other hand, increasing the step size beyond 200 would have reduced the feature update rate to below 4 Hz, potentially leading to delayed responses and a loss of important signal variations.
Given these observations, the 800-200 window configuration successfully balanced signal clarity, computational efficiency, and real-time feasibility. The structured evaluation provided a data-driven justification for this choice, ensuring the robustness of the feature extraction process in our system.
3. Metric Standardization and Fatigue Modeling
3.1. Baseline Establishment
The standardization of metrics derived from surface electromyography (sEMG) signals presents a significant challenge when analyzing muscle fatigue across diverse participants. Initial investigations focused on utilizing rest phase measurements as potential calibration references. While root mean square (RMS) values during rest phases demonstrated relatively consistent patterns across participants, the subsequent active phases exhibited substantial inter-subject variability, limiting the utility of rest-based normalization. This observation led to an exploration of alternative calibration approaches to address the inherent physiological differences among individuals.
We evaluated four distinct normalization strategies to identify the most effective method for standardizing fatigue metrics.
- Metric( Active / RMS(Rest))
- Metric(Active) / Metric( RMS(Rest))
- Metric( Active / RMS(1st Active))
- Metric(Active) / Metric(RMS(1st Active))
The first approach involved normalizing active phase RMS values by dividing them by the corresponding rest phase RMS values. This method produced widely varying ranges among participants, indicating insufficient standardization for cross-subject comparisons. Similarly, when applying this normalization technique to derived metrics, the results lacked meaningful insights, further confirming the inadequacy of rest-based normalization for complex sEMG analysis.
The second approach compared derived metrics directly between active and rest phases by dividing each metric of the active phase with the metric of rest phase. While this showed promise for certain parameters such as MNF/ARV ratio and IMA difference, the considerable variance in values limited its universal applicability.
Given these limitations, we explored dynamic reference points using the first active window as a calibration baseline. The third approach, which normalized various fatigue metrics from each active window by dividing them by the RMS value of the first active window, demonstrated superior performance, establishing more consistent ranges across participants for most metrics. This normalization technique effectively accounted for individual differences while maintaining sensitivity to fatigue-induced changes.
The fourth method directly compares metrics between subsequent active windows and the first active window by dividing each metric’s value by its corresponding value in the first active window. While this approach exhibited stability for most parameters, inconsistencies in EMD values and fluctuation metrics diminished its overall reliability.
Table 2 presents the standardized ranges for key fatigue metrics using the third normalization approach, where each metric from active windows is divided by the RMS of the first active window, across all participants.
Close examination of these results reveals several advantages of the third normalization method over alternatives. First, this approach establishes more consistent metric ranges across diverse participants, facilitating meaningful cross-subject comparisons. The MNF/ARV ratio typically ranged between 30 and 90 units, while IMA difference values consistently fell between 0.1 and 0.3, demonstrating a standardized response pattern despite individual physiological differences.
Additionally, the EMD values exhibited a predictable range (30-120) across participants, indicating effective normalization while preserving sensitivity to fatigue-induced changes. In contrast, the sixth method demonstrated excessive variability in fluctuation metrics (ranging from 0-6 in some participants to 0-230 in others), compromising its reliability for fatigue assessment. Furthermore, the fifth approach maintained clearer differentiation between EMD1 and EMD2 values, preserving important signal characteristics that might otherwise be obscured through alternative normalization techniques.
Based on these comprehensive evaluations, we selected the third normalization approach, which divides fatigue metrics from each active window by the RMS of the first active window, as the optimal method for establishing a consistent baseline while maintaining sensitivity to fatigue-related changes in sEMG signals. This standardization technique facilitates reliable cross-subject comparisons and provides a robust foundation for subsequent fatigue modeling and machine learning applications.
3.2. Fatigue Estimation Approaches
To quantify muscle fatigue reliably, it was necessary to evaluate multiple estimation techniques and assess their suitability based on sensitivity, robustness, and cross-population applicability. The process began by ensuring that all selected fatigue-related metrics exhibited a consistent trend over time. Since some features, such as the MNF/ARV ratio, EMD MDF1, and EMD MDF2, naturally decrease as fatigue progresses, they were inverted by multiplying them by -1 to align their behavior with the remaining metrics, which trend upward. This standardization step allowed for uniform interpretation of fatigue progression across all extracted features.
After the aforementioned feature standardization and the above transformation, we explored different approaches to construct a fatigue index, each with distinct advantages and limitations.
- Equal-weighted Sum
- Average
- PCA
- t-SNA
The first method considered was the equal-weighted sum, which assumes that all fatigue-related metrics contribute equally to fatigue estimation. This approach is simple and computationally efficient, as it aggregates all standardized metrics without requiring further transformation. However, a fundamental drawback is that it fails to account for the varying impact of different features on fatigue progression. Certain metrics, such as fluctuation-based values, exhibit higher sensitivity to muscle fatigue, whereas others, like the MNF/ARV ratio, may be less responsive or exhibit individual-specific trends. This unequal contribution across features led to inconsistencies in tracking fatigue across different participants, resulting in poor cross-population generalizability and thus deeming it not suitable for our case. A similar limitation was observed in the average-based approach, which computes a mean value of all selected metrics. While this method ensures equal representation of each feature and reduces extreme variations, it still assumes that all features hold the same weight, potentially diluting the significance of more fatigue-sensitive metrics. Furthermore, both methods assume linear relationships between metrics, which may not accurately capture the complex, multi-dimensional nature of muscle fatigue. Given these drawbacks, neither approach was proven suitable for constructing a robust fatigue index.
To overcome these limitations, we examined dimensionality reduction techniques, which offer a data-driven way to identify the most informative aspects of high-dimensional feature spaces. Principal Component Analysis (PCA) was applied to decompose the fatigue-related metrics into orthogonal components that maximize variance, enabling the identification of latent patterns that contribute most significantly to fatigue progression. PCA is particularly advantageous in physiological signal analysis as it reduces the influence of redundant or less relevant features while preserving the most meaningful trends in fatigue evolution. This method allowed us to transform multiple fatigue indicators into a lower-dimensional space, improving both interpretability and generalizability across different participants. Additionally, t-Distributed Stochastic Neighbor Embedding (t-SNE) was evaluated as a potential method for capturing non-linear relationships between fatigue-related features. While t-SNE is usually effective in clustering and visualization, its high sensitivity and lack of stability made it impractical for constructing a reproducible fatigue index. Small variations in input data could lead to drastically different outputs, making it unreliable for continuous fatigue tracking. Given these factors, PCA was ultimately selected as the most robust approach, providing an optimal balance between dimensionality reduction and fatigue trend preservation.
Figure 5.
Equal-Weighted Sum, Average, PCA and t-SNE Estimated Fatigue Indexes plotted in time along with their smoothed version through a LP filter. Each index on four subjects, side by side separated by red lines, each one consisting of 3 different active phases.
Figure 5.
Equal-Weighted Sum, Average, PCA and t-SNE Estimated Fatigue Indexes plotted in time along with their smoothed version through a LP filter. Each index on four subjects, side by side separated by red lines, each one consisting of 3 different active phases.
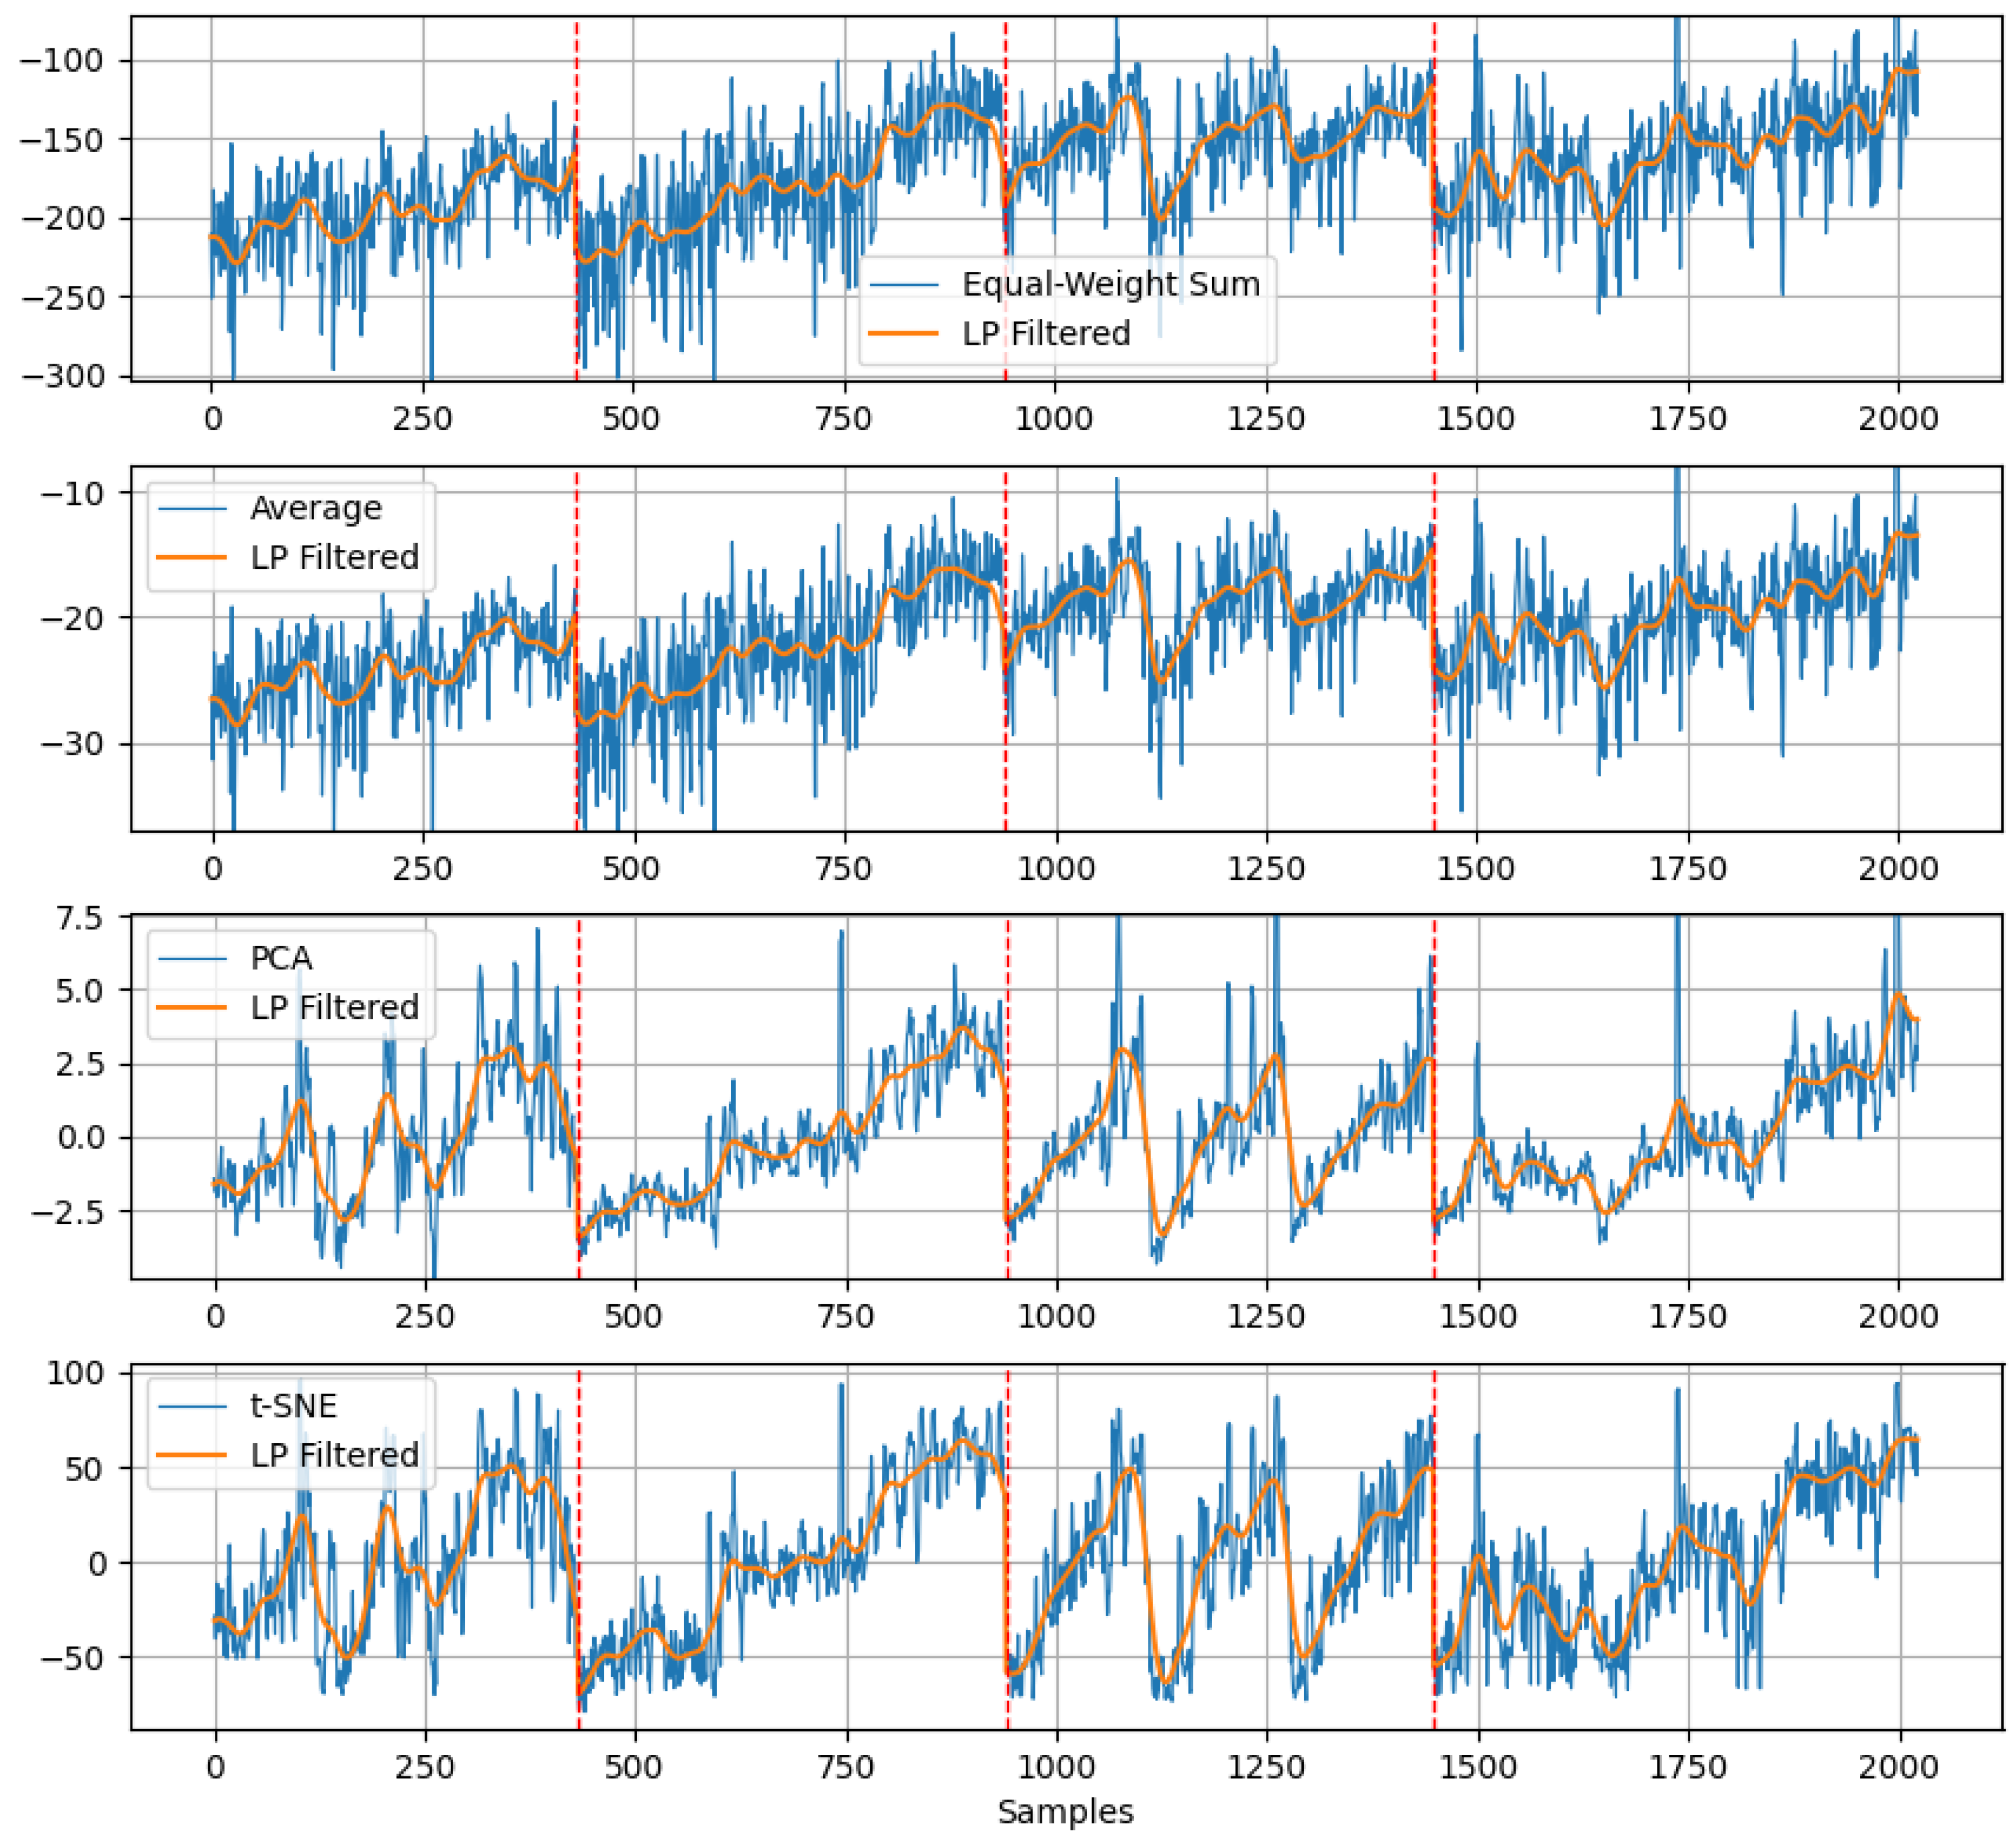
In our work, PCA was selected to transform the set of standardized fatigue-related metrics into principal components that best represented fatigue progression. We were able to derive a fatigue index that dynamically adapts to individual fatigue patterns while maintaining consistency across different participants. This approach ensured that fatigue estimation was both sensitive to muscle state changes and generalizable across persons, making it the most effective method for real-time muscle fatigue assessment.
Given that raw fatigue index values still exhibited fluctuations, a low-pass Butterworth filter was applied to smooth the extracted fatigue trends. This filtering process was implemented using a second-order low-pass filter with a cutoff frequency of 0.2 Hz, sampling frequency (fs) of 4 Hz. The low-pass filter helped suppress short-term fluctuations while preserving the overall fatigue progression, ensuring a more interpretable and user-friendly signal. The implementation was tested in different stages, and the best results were obtained by applying filtering for each individual person, before merging all participants data, as this approach preserved subject-specific fatigue trends more effectively. By systematically evaluating different fatigue estimation methods, PCA was identified as the most suitable approach, enhanced by empirical low-pass filtering to improve signal stability. This refined methodology provided a robust framework for tracking muscle fatigue in real-time applications.
3.3. Machine Learning Model Training & Evaluation
To develop a robust and generalizable fatigue estimation model, multiple machine learning algorithms were trained using the standardized fatigue-related metrics as input. The dataset consisted of eight input features, representing the most informative fatigue-sensitive metrics, while the output variable was the computed fatigue index derived through Principal Component Analysis (PCA) and low pass filtering. The selected models encompassed both traditional regression techniques and more advanced deep learning approaches to evaluate their effectiveness in tracking fatigue progression.
- Simple Linear Regression
- Support Vector Regression
- Random Forest Regression
- Gradient Boosting Machines Regression
- Long Short-Term Memory (LSTM) Neural Networks Regression
- Convolutional Neural Networks Regression
- k-Nearest Neighbors Regression
The first set of models included Linear Regression (LR) and Support Vector Regression (SVR), both of which serve as fundamental baselines for fatigue estimation. Linear Regression assumes a direct relationship between input features and fatigue, making it interpretable and computationally efficient. However, given the complex, non-linear nature of muscle fatigue progression, linear regression alone may not fully capture the intricate dependencies between features. SVR, on the other hand, extends linear regression by incorporating a kernel-based approach, allowing it to model non-linear relationships between fatigue-related metrics. The flexibility of SVR makes it a strong candidate for muscle fatigue modeling, especially when properly tuned to avoid overfitting or excessive regularization.
In addition to these baseline models, Random Forest (RF) and Gradient Boosting Machines(GBM) were employed due to their capacity to handle complex feature interactions. Random Forest, an ensemble learning technique, constructs multiple decision trees and aggregates their outputs, reducing variance and improving model stability. It is particularly beneficial for handling non-linear dependencies and noisy data, both of which are present in sEMG-based fatigue estimation. Similarly, Gradient Boosting Machines iteratively refine weak learners to improve prediction accuracy, offering a highly adaptive framework that balances bias and variance effectively. These tree-based models are advantageous for their robustness in handling diverse datasets, making them well-suited for real-world muscle fatigue monitoring.
To incorporate temporal dependencies in fatigue progression, we explored Long Short-Term Memory (LSTM) Neural Networks and Convolutional Neural Networks (CNNs). LSTMs are a specialized form of recurrent neural networks (RNNs) designed to capture long-term dependencies in sequential data, making them particularly useful for tracking fatigue trends over time. By leveraging memory gates, LSTMs can model gradual fatigue accumulation and short-term fluctuations effectively. CNNs, typically used in image processing, were adapted for sequential data by treating fatigue metrics as spatially related inputs. The convolutional layers extracted hierarchical patterns from the feature set, improving the model’s ability to detect fatigue-related trends. While computationally more demanding, these deep learning models were tested to assess their suitability for real-time fatigue estimation.
Additionally, k-Nearest Neighbors (k-NN) was evaluated as a non-parametric alternative that estimates fatigue based on similarity to past observations. Though k-NN is highly interpretable and adaptable to non-linear distributions, it can become computationally expensive for larger datasets and may struggle with generalization when fatigue progression varies significantly across subjects.
Figure 6.
Random Forest Model Evaluation on test data of a single subject. For this model, all subjects, except the one plotted above, were used as input with 0.99 train size and the results of a real scenario model performance are evidently sufficient, LOSO cross-validation strategy.
Figure 6.
Random Forest Model Evaluation on test data of a single subject. For this model, all subjects, except the one plotted above, were used as input with 0.99 train size and the results of a real scenario model performance are evidently sufficient, LOSO cross-validation strategy.
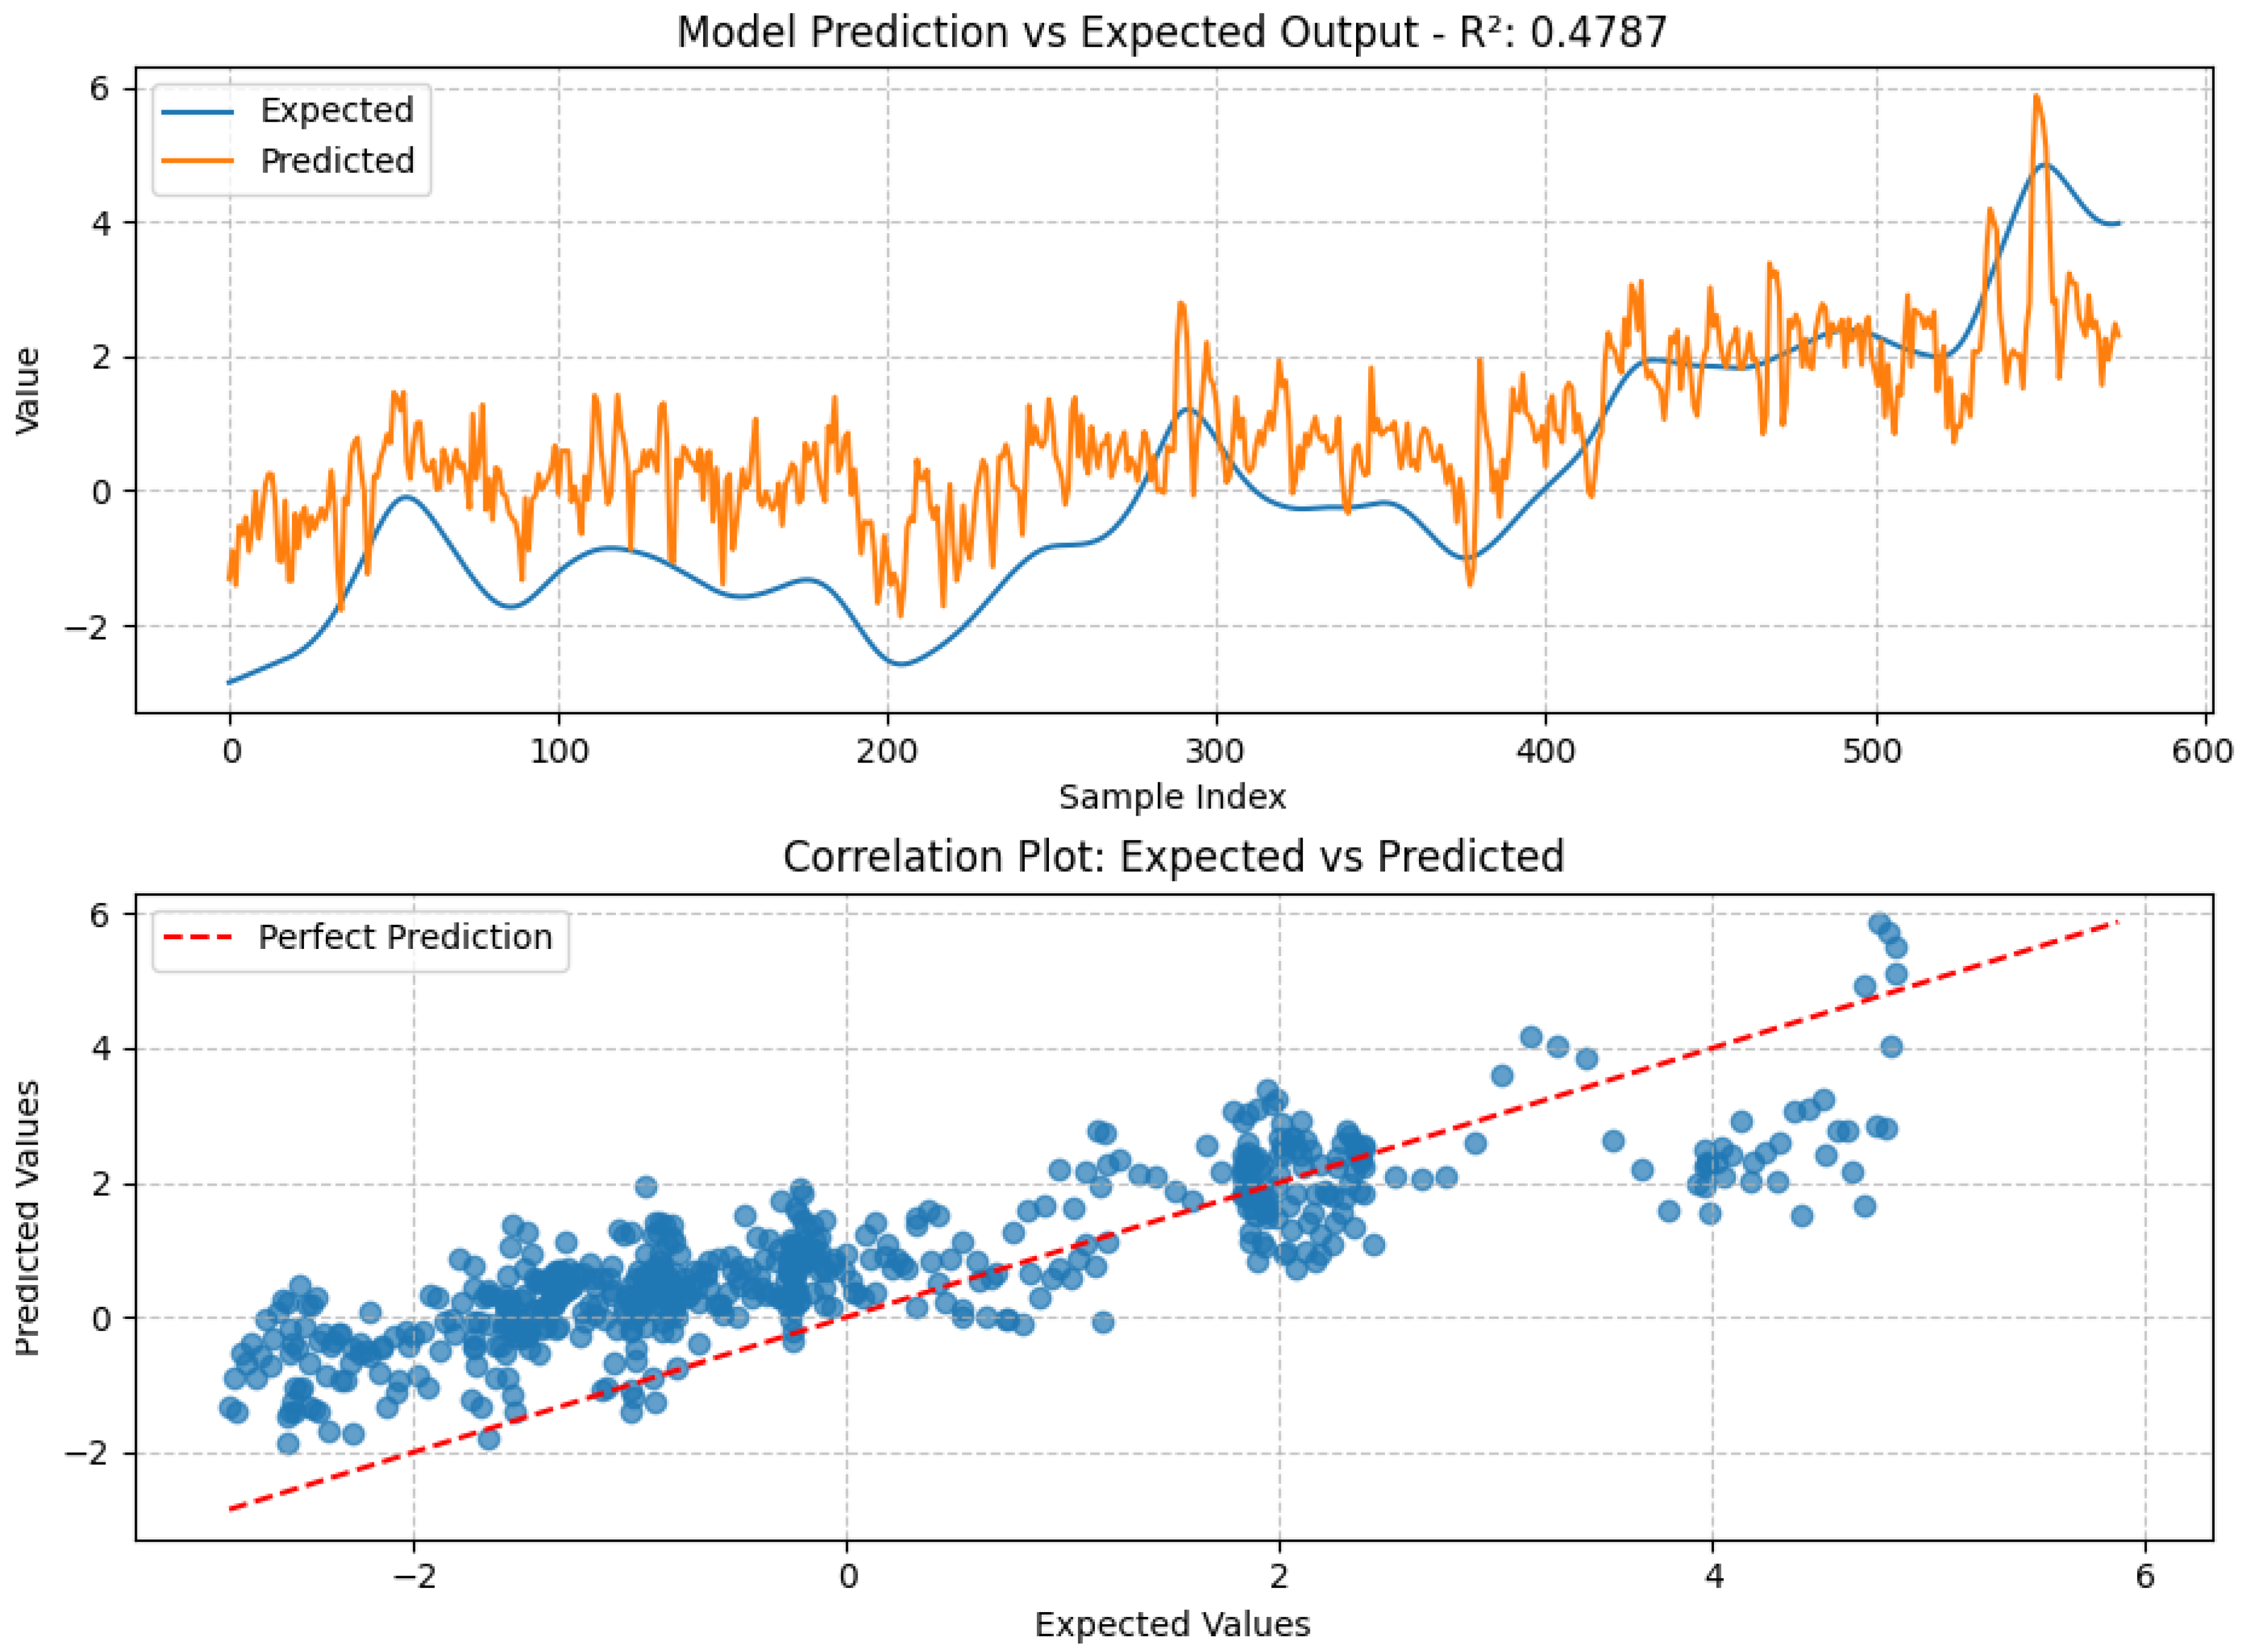
Model performance was assessed using Mean Squared Error (MSE) and the coefficient of determination (R²). The initial training phase employed a standard 80-20 train-test split, ensuring that models were exposed to a diverse set of fatigue patterns while preserving unseen data for evaluation. To further refine generalizability, a leave-one-subject-out (LOSO) cross-validation strategy was adopted, where models were trained on all participants except one and subsequently tested on the excluded participant. This approach simulated real-world conditions where the model must generalize to unseen individuals, providing a more rigorous test of predictive performance.
Through a structured comparison of model outputs and actual fatigue values, we evaluated the strengths and limitations of each technique. The results of this analysis, including comparative performance metrics, are presented in Chapter 4: Results and Discussion, where a matrix illustrates the effectiveness of different approaches in real-time fatigue monitoring.
4. Results and Discussion
4.1. Baseline and Metric Analysis
The selection of a suitable standardization method was a critical step in ensuring reliable fatigue quantification across participants. After evaluating six different normalization techniques, the method that provided the most stable and comparable metric ranges was the fifth approach, in which active-phase sEMG metrics were divided by the RMS of the first active-phase sEMG window. This approach minimized inter-subject variability, ensuring that fatigue-related trends were preserved while accounting for individual differences in baseline activation levels. Compared to other methods, this normalization strategy demonstrated higher consistency across subjects, particularly in key fatigue-sensitive metrics such as the MNF/ARV ratio, IMA Difference, and EMD-based features, which exhibited clear fatigue trends without excessive variability or loss of sensitivity. The final standardized dataset confirmed that the selected method facilitated cross-population comparability, allowing for a meaningful evaluation of fatigue patterns across all participants.
4.2. Fatigue Estimation Performance
Four different approaches were explored to define and quantify fatigue, including equal-weighted summation, averaging, PCA-based transformation, and t-SNE-based clustering. Among these, PCA emerged as the most effective method, as it efficiently captured fatigue trends while reducing noise and preserving inter-subject generalizability. Unlike simpler methods such as equal-weighted summation and averaging, PCA allowed for data-driven feature weighting, ensuring that the most informative components contributed the most to fatigue estimation. Moreover, while t-SNE effectively visualized non-linear relationships in fatigue progression, its high sensitivity to initialization parameters made it unsuitable for a reproducible fatigue index. The PCA-derived fatigue index aligned well with observed physiological trends, where participants exhibited progressive fatigue over multiple repetitions, validating the method’s applicability for real-time fatigue tracking.
4.3. Machine Learning Model Performance
A range of machine learning models were evaluated for fatigue prediction, including Linear Regression, Support Vector Regression (SVR), k-Nearest Neighbors (k-NN), Random Forest, Gradient Boosting, LSTM Neural Networks, and CNNs. The Random Forest model consistently outperformed other approaches, achieving higher predictive accuracy with lower error metrics while maintaining computational efficiency. The results, summarized in Table 3, demonstrate that Random Forest achieved the lowest Mean Squared Error (MSE) of 1.4059 and the highest R² score of 0.5209, confirming its suitability for fatigue estimation. Gradient Boosting followed closely, with an MSE of 1.4090 and R² of 0.5198, showing that ensemble-based methods effectively captured non-linear fatigue patterns.
Among the deep learning approaches, LSTM and CNN models provided reasonable performance, with LSTM achieving an updated MSE of 1.5037 and R² of 0.4876, slightly outperforming CNN (MSE 1.6717, R² 0.4303). The ability of LSTMs to model sequential dependencies in the data likely contributed to their improved performance. Simple Linear Regression and k-NN models performed similarly, with MSE values around 1.55–1.58 and R² scores just below 0.47, indicating that while these models captured some fatigue-related trends, they lacked the complexity to model fatigue progression effectively. SVR exhibited improved performance compared to other runs, reaching an MSE of 1.5542 and R² of 0.4704, but still struggled to generalize across different subjects.
These findings highlight the effectiveness of ensemble-based models such as Random Forest and Gradient Boosting in fatigue estimation, while deep learning models show potential but require further optimization for real-time applications. The slight improvements in SVR and LSTM models suggest that further hyperparameter tuning and feature engineering could enhance performance, particularly in handling inter-subject variability.
4.4. Comparative Discussion
The selected fatigue index and machine learning models offer a real-time solution for fatigue estimation, providing a practical framework for sports performance monitoring and rehabilitation applications. Compared to existing fatigue detection techniques, which rely on predefined thresholds or simple frequency-based indicators, our approach leverages multi-dimensional feature extraction and advanced regression models, improving accuracy and adaptability to different subjects.
A comparative evaluation with existing methods reveals both strengths and limitations of our approach relative to prior studies. Traditional methods have largely relied on time-domain and frequency-domain features such as Median Frequency (MF) and Mean Power Frequency (MPF) for fatigue detection, often utilizing simple thresholding or adaptive baselines. Studies such as Liu et al. in 2019 [2] successfully implemented a dynamic baseline approach using MF values, ensuring individualized fatigue quantification. In contrast, our work moves beyond fixed baselines by incorporating Principal Component Analysis (PCA) to construct a data-driven fatigue index, capturing multi-dimensional fatigue trends instead of relying on a single frequency-based indicator. However, while PCA enhances generalizability, the absence of a subject-specific adaptation mechanism like [2] approach may contribute to increased variability in our predictions.
From an ML-based fatigue classification perspective, prior research has demonstrated higher accuracy rates in detecting fatigue states, particularly in works like Qassim et al. in 2022 [7], which achieved 95% accuracy using a two-step classification algorithm based on integrated EMG and frequency-domain features. Similarly, Sun et al. in 2022[5] and Yousif et al. in 2019 [6] highlighted the effectiveness of traditional classification models, with SVM, Random Forest, and k-NN consistently outperforming basic signal processing techniques. However, in our case, while Random Forest exhibited the best performance, its predictive accuracy was moderate (R² = 0.5209, MSE = 1.4059), significantly lower than the classification models in prior work. One reason for this discrepancy is that previous studies often employed binary classification (fatigued vs. non-fatigued), whereas our approach aimed for continuous fatigue estimation, making direct comparisons difficult. Additionally, our dataset, though diverse, lacked extensive subject-specific adaptation, which may have contributed to lower overall accuracy.
Furthermore, the integration of deep learning models in our study, including LSTM and CNNs, provided insights into modeling temporal dependencies and spatial patterns in fatigue progression. While LSTM achieved an MSE of 1.5037 and R² of 0.4876, its computational requirements remain a challenge for real-time applications. Comparatively, Alexandru Guzu et al. in 2024[8] successfully implemented SVM-based multi-class classification for movement and fatigue detection, achieving 74% accuracy, though their method was designed for discrete movement states rather than continuous fatigue levels. This further reinforces the idea that classification-based models tend to perform better in structured labeling tasks, whereas our regression-based approach provides a more dynamic, real-time fatigue index, albeit with trade-offs in accuracy.
Despite these challenges, our approach offers a real-time black-box model, capable of processing eight input values and producing an estimated fatigue level, making it highly applicable for athletes and clinical rehabilitation settings. Unlike many prior studies that focus on post-processed data, our model is designed for live fatigue monitoring, ensuring practical usability for embedded systems and wearable technology. Future research could focus on optimizing computational efficiency and incorporating adaptive personalization techniques to enhance individual-specific fatigue tracking, further bridging the gap between traditional fatigue detection models and real-time, scalable solutions.
5. Conclusion and Future Work
This study presented a comprehensive approach to real-time muscle fatigue monitoring using a wearable, IoT-enabled surface electromyography system. The integration of advanced signal processing techniques with machine learning algorithms has yielded a robust framework for quantifying fatigue progression in the Vastus Medialis muscle during isometric contractions.
5.1. Key Findings
This research demonstrated that a multi-faceted approach to feature extraction provides more reliable fatigue detection than traditional single-metric methods. The combination of time-domain features (RMS, ARV), frequency-domain metrics (Mean Frequency), and hybrid features (MNF/ARV ratio, IMA Difference) effectively captured the complex physiological manifestations of fatigue. Notably, the Instantaneous Mean Amplitude Difference, which quantifies the spectral shift toward lower frequencies during sustained contractions, emerged as a particularly sensitive indicator of fatigue progression.
Window size analysis revealed that an 800-sample window with 75% overlap (200-sample step) offered an optimal balance between feature stability and computational efficiency, allowing for real-time signal processing at a 4 Hz update frequency while maintaining sufficient signal representation. Among multiple fatigue estimation approaches evaluated, Principal Component Analysis (PCA) demonstrated superior performance in dimensionality reduction while preserving fatigue-related trends across diverse participants. This enhanced the subsequent machine learning models by ensuring that only the most informative fatigue-sensitive components were used as inputs, contributing to improved predictive accuracy.
The machine learning comparative analysis identified Random Forest as the most effective algorithm for fatigue prediction, outperforming other models in terms of accuracy and generalizability while maintaining computational efficiency suitable for real-time applications. The effectiveness of ensemble learning methods suggests that fatigue-related features exhibit complex, non-linear dependencies that tree-based models can capture effectively. While deep learning approaches such as LSTM and CNNs showed potential for tracking temporal dependencies, their computational complexity remains a challenge for real-time deployment.
5.2. Contributions of This Work
This study makes several significant contributions to the field of muscle fatigue monitoring. First, the development of a standardized baseline establishment technique addresses a persistent challenge in sEMG analysis by enabling meaningful cross-subject comparisons despite physiological variations. The method of normalizing active-phase metrics by the RMS of the first active window proved effective in creating consistent metric ranges across participants while preserving sensitivity to fatigue-induced changes
Second, the systematic evaluation of fatigue-related metrics across multiple signal processing domains has advanced our understanding of which features most reliably track muscle fatigue progression. The identification of fluctuation-based metrics and EMD-derived features as strong fatigue indicators extends beyond conventional amplitude and frequency analyses, providing a more comprehensive fatigue assessment framework.
Third, the integration of Bluetooth Low Energy (BLE) communication within the sEMG monitoring system overcomes the mobility constraints of wired setups, enabling real-time, practical applications in sports training and rehabilitation. The ability to wirelessly transmit and process data in real time makes this system well-suited for dynamic, field-based applications, ensuring usability beyond controlled laboratory environments.
Finally, the development of a machine learning pipeline for personalized fatigue estimation represents a significant advancement over threshold-based approaches, offering adaptability to individual fatigue patterns while maintaining cross-population generalizability. This adaptability makes the system suitable for diverse user groups, from high-performance athletes to rehabilitation patients, where personalized fatigue monitoring can optimize performance and recovery strategies.
5.3. Limitations
Despite the promising results, several limitations should be acknowledged. The current study focused exclusively on the Vastus Medialis muscle during isometric contractions, which may not fully represent fatigue dynamics in other muscle groups or during dynamic movements. Additionally, the sample size of eleven participants, though sufficient for initial validation, limits the generalizability of the findings across broader demographic groups.
The reliance on controlled laboratory conditions for data collection, while necessary for establishing baseline measurements, may not accurately reflect real-world environmental factors that could influence sEMG signal quality. Furthermore, the present system requires manual electrode placement following SENIAM guidelines, introducing potential variability in signal acquisition between sessions. The development of self-calibrating or automated electrode placement techniques could help standardize signal acquisition across different sessions and users.
From a methodological perspective, PCA-based fatigue estimation, while effective, assumes linear relationships between features, potentially overlooking non-linear dependencies in fatigue progression. Future approaches could explore non-linear dimensionality reduction techniques such as autoencoders or t-SNE-based clustering to better model complex interactions between fatigue-related features. Similarly, the selected machine learning models may require individual recalibration for subjects whose fatigue patterns deviate significantly from the training population.
5.4. Future Work
Several directions for future research emerge from this work. Expanding the dataset to include a more diverse participant pool, encompassing various age groups, fitness levels, and muscle conditions, would enhance the robustness and generalizability of the fatigue estimation models. Incorporating additional muscle groups and exercise modalities, including dynamic contractions and functional movements, would extend the system’s applicability to more realistic training and rehabilitation scenarios.
Enhancing real-time processing efficiency represents another critical area for development. Optimization of the feature extraction pipeline and model inference for embedded implementations would facilitate integration into compact wearable devices with limited computational resources. This could involve algorithm simplification, feature selection refinement, or the exploration of edge computing architectures specifically designed for physiological signal processing. The implementation of the final product for embedded applications constitutes a logical progression toward practical deployment. This would entail hardware reduction, power optimization, and the development of user-friendly interfaces for real-time fatigue feedback. Creating a fully standalone wearable device capable of on-device signal processing and fatigue estimation would significantly enhance the system’s usability in real-world applications.
Investigating long-term adaptation and personalization strategies offers another promising avenue for future research. Developing algorithms that continuously adapt to individual fatigue patterns over extended periods could improve estimation accuracy and account for physiological adaptations resulting from training. Additionally, exploring the integration of complementary sensing modalities, such as inertial measurement units (IMUs) or force sensors, could provide a more comprehensive assessment of neuromuscular fatigue.Finally, longitudinal studies examining the relationship between real-time fatigue monitoring and performance outcomes or injury prevention could validate the practical utility of the system in athletic training and rehabilitation contexts. Such validation would bridge the gap between technical development and real-world application, ensuring that muscle fatigue monitoring systems can be effectively integrated into sports performance enhancement and clinical rehabilitation practices.
References
- Al-Ayyad, M.; Owida, H.A.; De Fazio, R.; Al-Naami, B.; Visconti, P. Electromyography Monitoring Systems in Rehabilitation: A Review of Clinical Applications, Wearable Devices and Signal Acquisition Methodologies. Electronics 2023, 12, 1520. [Google Scholar] [CrossRef]
- Liu, S.H.; Lin, C.B.; Chen, Y.; Chen, W.; Huang, T.S.; Hsu, C.Y. An EMG Patch for the Real-Time Monitoring of Muscle-Fatigue Conditions During Exercise. Sensors 2019, 19, 3108. [Google Scholar] [CrossRef] [PubMed]
- Wencong, X. A Surface EMG System: Local Muscle Fatigue Detection. Master’s thesis, Delft University of Technology, Delft, Netherlands, 2020. [Google Scholar]
- Wu, Y.D.; Ruan, S.J.; Lee, Y.H. An Ultra-Low Power Surface EMG Sensor for Wearable Biometric and Medical Applications. Biosensors 2021, 11, 411. [Google Scholar] [CrossRef] [PubMed]
- Sun, J.; Liu, G.; Sun, Y.; Lin, K.; Zhou, Z.; Cai, J. Application of Surface Electromyography in Exercise Fatigue: A Review. Front. Syst. Neurosci. 2022, 16, 893275. [Google Scholar] [CrossRef] [PubMed]
- Yousif, H.; Zakaria, A.; Abdul Rahim, N.; Salleh, A.; Sabry, M.; Alfarhan, K.; Kamarudin, L.; Syed Zakaria, S.M.M.; Hasan, A.; K Hussain, M. Assessment of Muscles Fatigue Based on Surface EMG Signals Using Machine Learning and Statistical Approaches: A Review. IOP Conf. Ser. Mater. Sci. Eng. 2019, 705, 012010. [Google Scholar] [CrossRef]
- Qassim, H.; Hasan, W.; Ramli, H.; Harith, H.; Mat, L.; Ismail, L. Proposed Fatigue Index for the Objective Detection of Muscle Fatigue Using Surface Electromyography and a Double-Step Binary Classifier. Sensors 2022, 22, 1900. [Google Scholar] [CrossRef] [PubMed]
- Guzu, A.; Neacşu, A.; Georgian, N. Automatic Muscle Fatigue and Movement Recognition Based on sEMG Signals; International Symposium ELMAR: Zadar, Croatia, 2024; pp. 259–262. [Google Scholar] [CrossRef]
- Kinugasa, R.; Kubo, S. Development of Consumer-Friendly Surface Electromyography System for Muscle Fatigue Detection. IEEE Access 2023, 11, 6394–6403. [Google Scholar] [CrossRef]
- Palumbo, A.; Vizza, P.; Calabrese, B.; Ielpo, N. Biopotential Signal Monitoring Systems in Rehabilitation: A Review. Sensors 2021, 21, 7172. [Google Scholar] [CrossRef] [PubMed]
- Fernando, J.B.; Yoshioka, M.; Ozawa, J. Estimation of muscle fatigue by ratio of mean frequency to average rectified value from surface electromyography. In Proceedings of the 2016 38th Annual International Conference of the IEEE Engineering in Medicine and Biology Society (EMBC); 2016; pp. 5303–5306. [Google Scholar] [CrossRef]
- Liu, S.H.; Chang, K.M.; Cheng, D.C. The Progression of Muscle Fatigue During Exercise Estimation With the Aid of High-Frequency Component Parameters Derived From Ensemble Empirical Mode Decomposition. IEEE J. Biomed. Health Inform. 2014, 18, 1647–1658. [Google Scholar] [CrossRef] [PubMed]
- Wang, C. Analyzing the influencing factors of sports fatigue based on algorithm. Rev. Bras. Med. Esporte 2021. [Google Scholar] [CrossRef]
- Xia Zhang, Z.G. High accuracy recognition of muscle fatigue based on sEMG multifractal and LSTM. J. Theor. Appl. Mech. 2024, 117–128. [Google Scholar] [CrossRef] [PubMed]
Figure 1.
A participant preparing to perform the isometric leg-extension exercise. Experimental setup: our device inside a white box attached on the clothes of the subject, from which electrodes come out and are placed on surface of the muscle.
Figure 1.
A participant preparing to perform the isometric leg-extension exercise. Experimental setup: our device inside a white box attached on the clothes of the subject, from which electrodes come out and are placed on surface of the muscle.

Figure 2.
Identification of anterior spina iliaca superior and the joint space in front of the anterior border of the medial ligament. (illustrating placement on Vastus Medialis, following SENIAM guidelines).
Figure 2.
Identification of anterior spina iliaca superior and the joint space in front of the anterior border of the medial ligament. (illustrating placement on Vastus Medialis, following SENIAM guidelines).
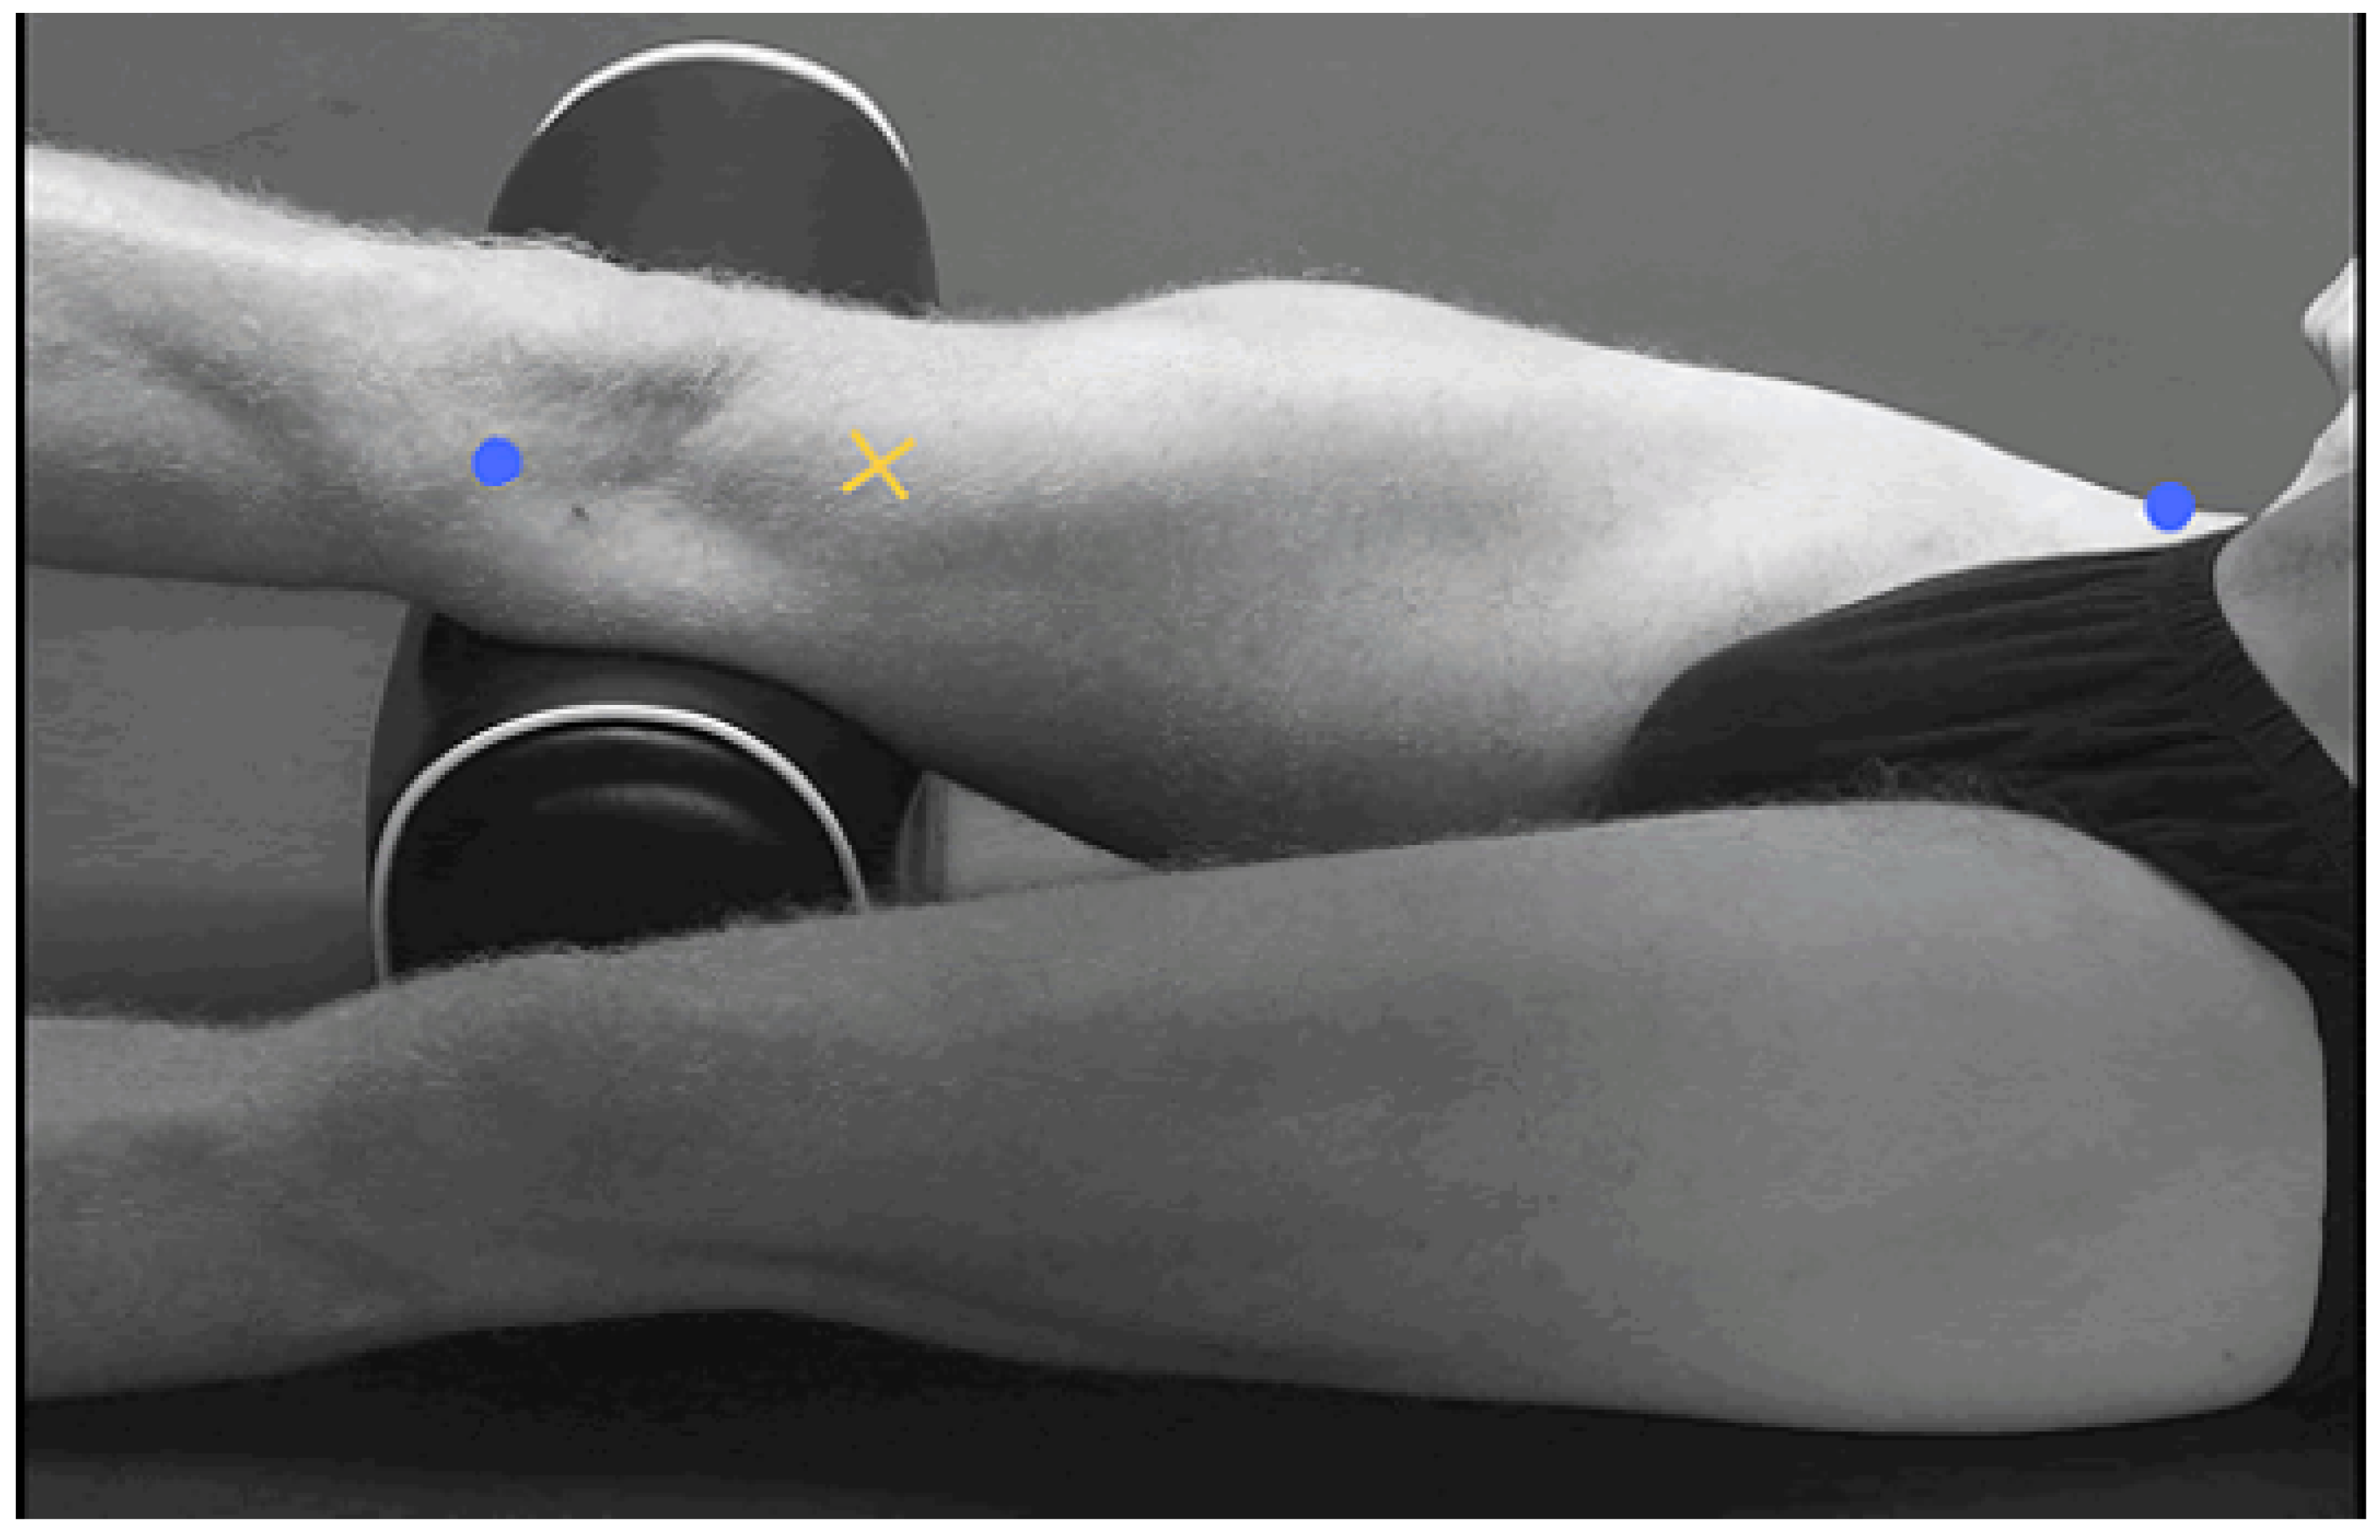
Figure 3.
Hardware setup for wireless sEMG monitoring device.The system powered by a power bank, enables wireless signal transmission to multiple computing devices for real-time muscle fatigue analysis.
Figure 3.
Hardware setup for wireless sEMG monitoring device.The system powered by a power bank, enables wireless signal transmission to multiple computing devices for real-time muscle fatigue analysis.
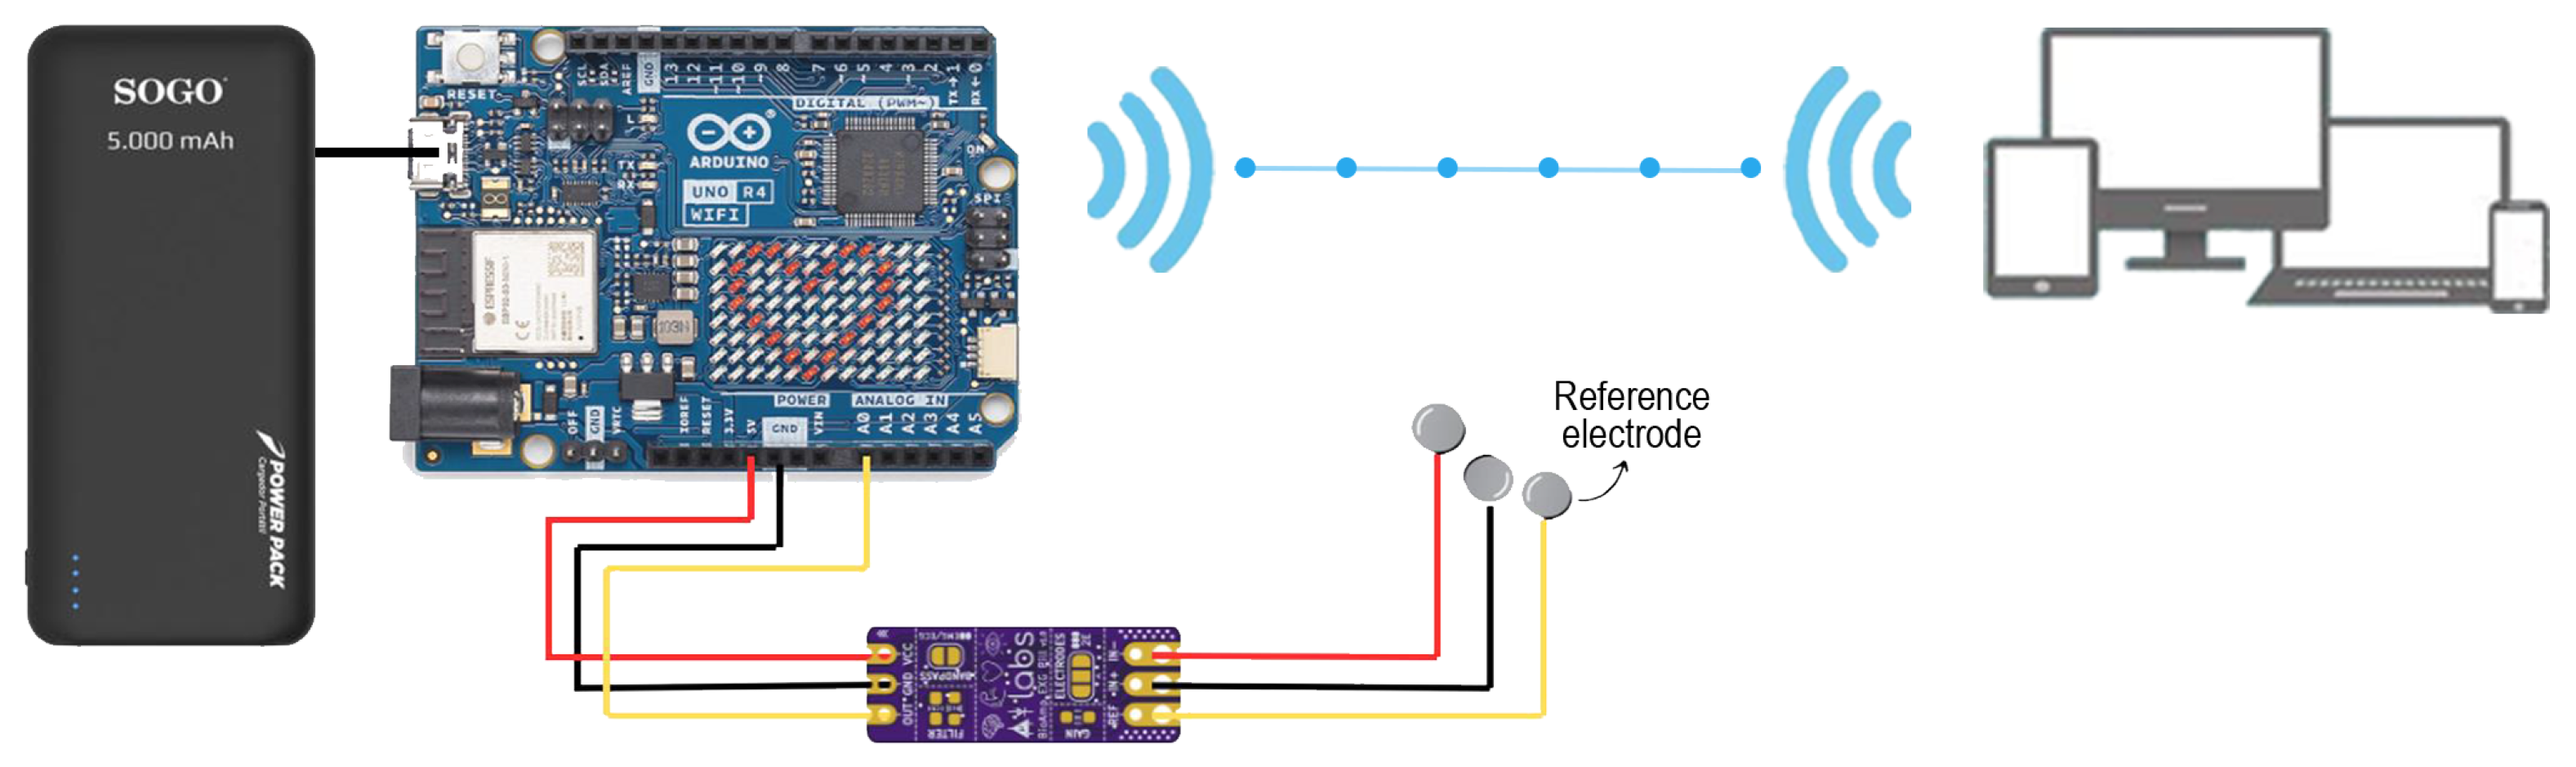
Figure 4.
Selected Metrics indicating Muscle Fatigue. Above are the normalized metrics for one subject, consisting of 3 active phases.
Figure 4.
Selected Metrics indicating Muscle Fatigue. Above are the normalized metrics for one subject, consisting of 3 active phases.
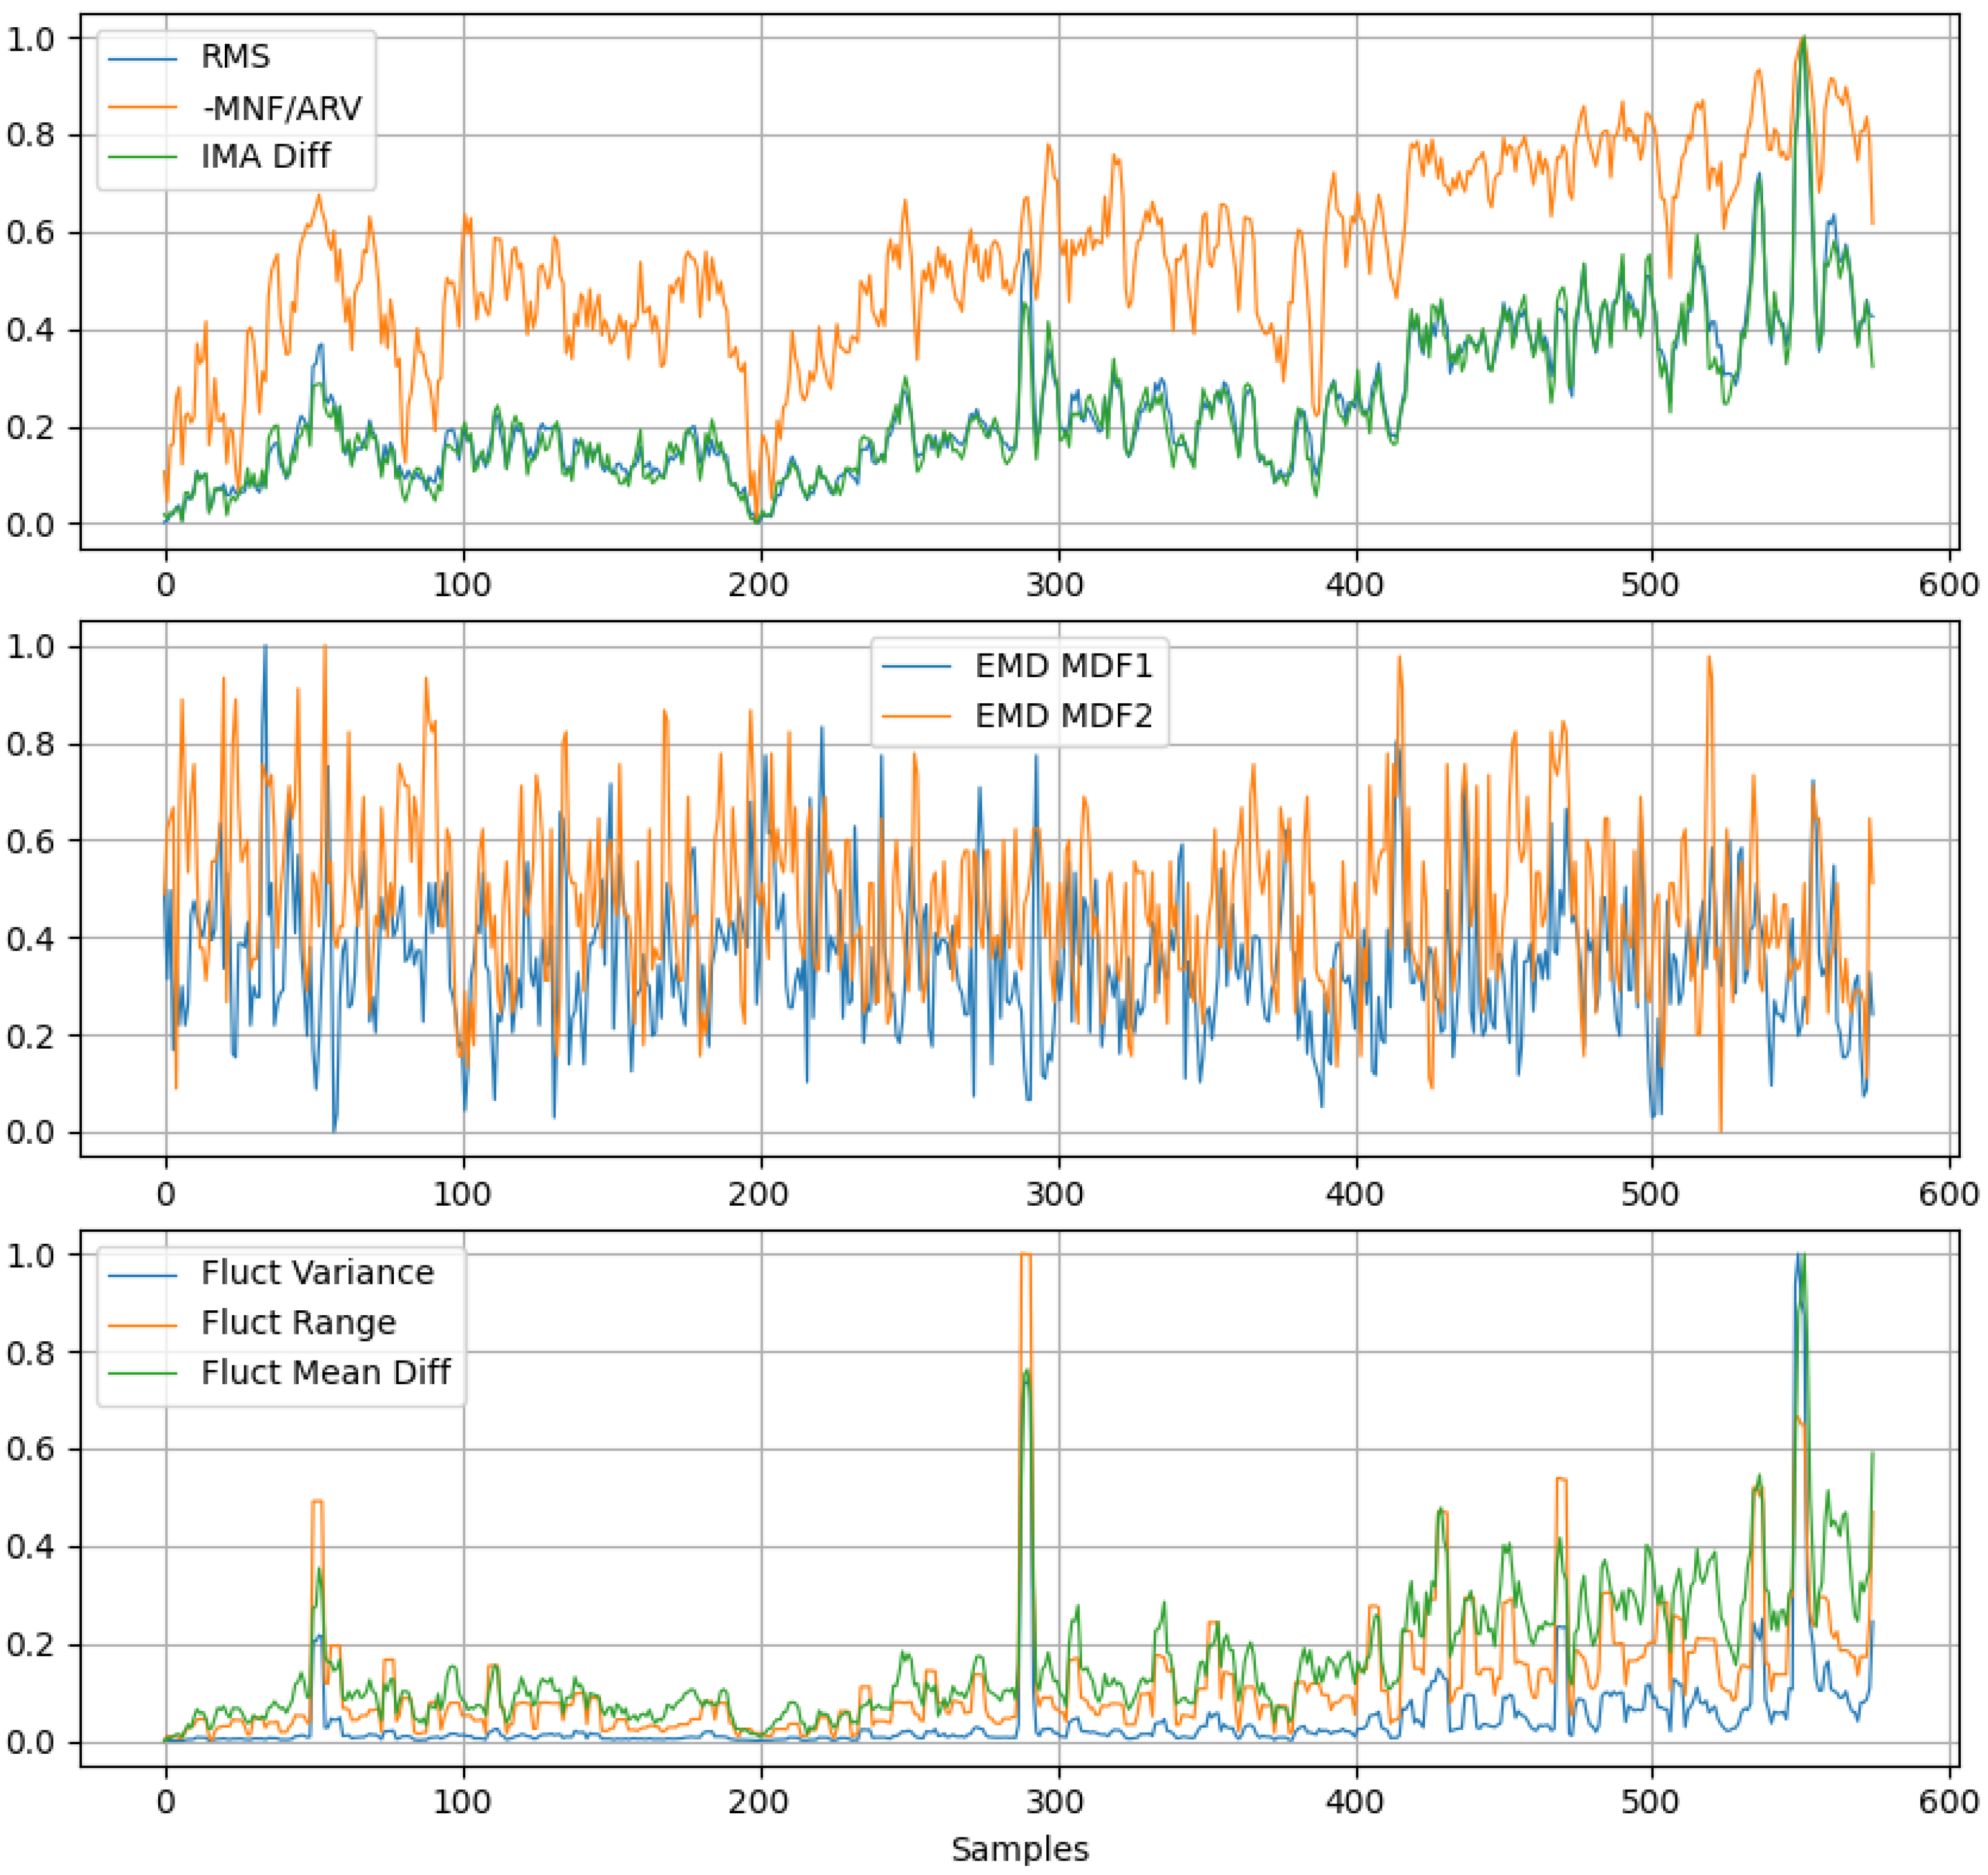

Table 1.
Parameter Analysis Results for Various Window and Step Size Combinations. Each metric of interest evaluated by variance, max-min, max differential and computation time for various window and step sizes.
Table 1.
Parameter Analysis Results for Various Window and Step Size Combinations. Each metric of interest evaluated by variance, max-min, max differential and computation time for various window and step sizes.
| Metric Category | Window Size 200 samples (0.250 s) | Window Size 400 samples (0.500 s) | Window Size 800 samples (1.000 s) | Window Size 1600 samples (2.000 s) | |||||||||||||
|---|---|---|---|---|---|---|---|---|---|---|---|---|---|---|---|---|---|
| Step Size (samples) | Step Size (samples) | Step Size (samples) | Step Size (samples) | ||||||||||||||
| 150 | 100 | 50 | 25 | 300 | 200 | 100 | 50 | 600 | 400 | 200 | 100 | 1200 | 800 | 400 | 200 | ||
| Variance | MNF/ARV | 8.00 | 8.05 | 8.08 | 8.08 | 7.23 | 7.15 | 7.15 | 7.15 | 6.67 | 6.66 | 6.67 | 6.68 | 6.45 | 6.39 | 6.36 | 6.38 |
| IMA | 28.77 | 28.99 | 29.01 | 28.99 | 13.61 | 13.61 | 13.62 | 13.62 | 6.50 | 6.54 | 6.54 | 6.54 | 3.17 | 3.16 | 3.17 | 3.17 | |
| EMD | 767.65 | 755.85 | 755.00 | 758.81 | 506.94 | 520.80 | 519.62 | 517.02 | 391.65 | 388.95 | 384.56 | 386.74 | 315.48 | 298.99 | 298.54 | 297.91 | |
| Fluct () | 4.48 | 5.21 | 4.88 | 4.70 | 4.28 | 4.19 | 4.36 | 4.10 | 3.35 | 3.44 | 3.46 | 3.56 | 2.81 | 2.98 | 2.97 | 2.95 | |
| Max-Min | MNF/ARV | 25.13 | 25.27 | 33.10 | 36.39 | 19.01 | 19.04 | 19.09 | 19.41 | 16.35 | 16.56 | 18.65 | 18.65 | 16.06 | 16.44 | 16.45 | 16.57 |
| IMA | 30.57 | 30.57 | 34.86 | 34.86 | 19.56 | 18.81 | 19.56 | 19.61 | 12.28 | 12.29 | 12.30 | 12.33 | 7.94 | 7.79 | 7.94 | 7.96 | |
| EMD | 260.00 | 280.00 | 280.00 | 280.00 | 244.00 | 246.00 | 246.00 | 246.00 | 175.00 | 167.00 | 179.00 | 187.00 | 201.56 | 182.81 | 201.56 | 201.56 | |
| Fluct () | 62.57 | 70.08 | 70.08 | 71.25 | 47.05 | 37.76 | 47.51 | 47.51 | 22.26 | 23.20 | 23.31 | 28.36 | 19.14 | 19.93 | 19.93 | 19.93 | |
| Max Differential | MNF/ARV | 10.67 | 13.82 | 12.79 | 11.10 | 7.70 | 7.34 | 5.89 | 4.73 | 9.48 | 8.94 | 6.85 | 4.11 | 8.64 | 9.02 | 6.62 | 5.60 |
| IMA | 17.02 | 14.97 | 13.01 | 11.97 | 8.18 | 7.30 | 6.48 | 6.22 | 5.19 | 4.56 | 2.97 | 2.25 | 2.96 | 2.39 | 1.91 | 1.24 | |
| EMD | 216.00 | 196.00 | 236.00 | 240.00 | 202.00 | 204.00 | 204.00 | 188.00 | 118.00 | 129.00 | 118.00 | 150.00 | 134.38 | 139.06 | 101.56 | 113.28 | |
| Fluct () | 60.85 | 61.71 | 60.77 | 55.37 | 43.09 | 33.80 | 39.23 | 39.30 | 19.51 | 19.26 | 17.73 | 22.35 | 15.04 | 11.16 | 11.01 | 9.60 | |
| Computation time (s) | 0.057 | 0.057 | 0.036 | 0.035 | 0.053 | 0.061 | 0.051 | 0.094 | 0.147 | 0.153 | 0.132 | 0.153 | 0.306 | 0.282 | 0.16209 | 0.159 | |
Table 2.
Standardized Metric value ranges. Each metric standardized as Metric( Active / RMS(1st Active) ).
Table 2.
Standardized Metric value ranges. Each metric standardized as Metric( Active / RMS(1st Active) ).
| Participant | MNF/ARV Ratio | IMA Difference | EMD | Fluctuation |
|---|---|---|---|---|
| Subject 1 | 20 - 70 | 0.1 - 0.35 | 30 - 120 | 0 - 17 |
| Subject 2 | 30 - 80 | 0.1 - 0.3 | 30 - 125 | 0 - 12 |
| Subject 3 | 30 - 80 | 0.12 - 0.325 | 30 - 110 | 0 - 13 |
| Subject 4 | 40 - 100 | 0.1 - 0.22 | 35 - 120 | 0 - 7 |
| Subject 5 | 30 - 70 | 0.125 - 0.3 | 35 - 110 | 0 - 10 |
| Subject 6 | 50 - 95 | 0.1 - 0.19 | 35 - 140 | 0 - 7 |
| Subject 7 | 35 - 90 | 0.1 - 0.25 | 35 - 140 | 0 - 6 |
| Subject 8 | 50 - 110 | 0.08 - 0.16 | 25 - 100 | 0 - 5 |
| Subject 9 | 35 - 85 | 0.1 - 0.22 | 35 - 125 | 0 - 6 |
| Subject 10 | 30 - 80 | 0.1 - 0.275 | 30 - 95 | 0 - 12 |
| Subject 11 | 40 - 90 | 0.1 - 0.27 | 30 - 115 | 0 - 9 |
Table 3.
Machine Learning Regression Models Evaluation (train size = 0.8).
| Model | R² | MSE |
|---|---|---|
| Random Forest | 0.5209 | 1.4059 |
| Gradient Boosting | 0.5198 | 1.4090 |
| LSTM | 0.4876 | 1.5037 |
| Simple Linear | 0.4718 | 1.5499 |
| SVR | 0.4704 | 1.5542 |
| KNN | 0.4598 | 1.5853 |
| CNN | 0.4303 | 1.6717 |
Disclaimer/Publisher’s Note: The statements, opinions and data contained in all publications are solely those of the individual author(s) and contributor(s) and not of MDPI and/or the editor(s). MDPI and/or the editor(s) disclaim responsibility for any injury to people or property resulting from any ideas, methods, instructions or products referred to in the content. |
© 2025 by the authors. Licensee MDPI, Basel, Switzerland. This article is an open access article distributed under the terms and conditions of the Creative Commons Attribution (CC BY) license (http://creativecommons.org/licenses/by/4.0/).
Copyright: This open access article is published under a Creative Commons CC BY 4.0 license, which permit the free download, distribution, and reuse, provided that the author and preprint are cited in any reuse.


