
Submitted:
18 March 2025
Posted:
19 March 2025
You are already at the latest version
Abstract
The study examines the geographic distribution of Erasmus+ incoming student mobility across European Higher Education Institutions (HEIs) from 2014 to 2020, highlighting significant regional disparities. It addresses the crucial questions of how regional and institutional factors influence student attractiveness and the emerging hotspots of mobility, which are vital for understanding the dynamics of educational internationalisation and regional development. The primary goal of this work is to identify the regional and institutional determinants of Erasmus student mobility and to propose strategies for enhancing the attractiveness of less favoured regions. Employing hotspot analysis and a two-level random intercept model, this research analyses spatial patterns and the influences of regional characteristics and institutional variables on Erasmus mobility rates. The findings reveal that while Spain, Germany, and the UK are leading recipients of Erasmus students, significant mobility hotspots exist primarily in Spain, Portugal, and southern France, with unexpected clusters emerging in Ireland and Sweden, indicating evolving dynamics in student mobility patterns. The conclusions underscore the importance of targeted regional policies to enhance HEI attractiveness and promote balanced internationalisation across Europe, particularly in underserved areas. These findings call for strategic interventions that align with broader regional economic goals, ensuring that the benefits of the Erasmus+ program are distributed more equitably. Ultimately, this work contributes to the existing body of knowledge by providing empirical insights into the factors shaping Erasmus+ mobility, informing policymakers and educational institutions about the potential for fostering regional development through enhanced internationalisation.
Keywords:
Erasmus+
; student attractiveness
; Erasmus flow
; hotspot analysis
; multilevel analysis
; regional random effects
; internationalisation
1. Introduction
How can European regions benefit from the tremendous movement of over 280,000 Erasmus students annually, involving more than 2,000 Higher Education Institutions (HEIs)? This paper investigates the regional distribution of Erasmus+ incoming student mobility from 2014 to 2020 and explores how regional and institutional factors influence the attractiveness of HEIs to these students. Using hotspot analysis and multilevel modelling, it identifies spatial patterns, such as the emergence of unexpected hotspots in Ireland and southern Sweden. It examines the roles of regional characteristics like education attainment, research capacity, and employment prospects. The research reveals significant spatial disparities, with hotspots concentrated in Spain, Portugal, and parts of France, despite large overall numbers in countries like Germany and the UK. This work is vital for understanding how Erasmus+ fosters regional development and internationalisation, offering insights for policymakers and academic institutions to balance mobility flows, address regional inequalities, and harness the program's potential for sustainable regional growth.
Despite its importance, research on the geography and regional dimensions of Erasmus+ mobility remains sparse and fragmented [1]. Existing studies have identified several factors influencing student mobility, such as urbanisation levels, the regional economy and employment opportunities in host regions. Urban areas with abundant cultural and social amenities tend to attract more students, but factors like high living costs may deter some [2]. Research has also shown that regions with higher concentrations of tertiary-educated graduates and strong research outputs appeal more to Erasmus students. However, less attractive areas often face challenges like poor governance or economic stagnation, making it harder to draw international students. Some studies argue that country-level characteristics, such as national policies and institutional quality, can outweigh regional factors in driving mobility [3]. Much research has focused on national trends, leaving regional dynamics underexplored.
The research identifies several unsolved issues, including the fragmented understanding of what spatial clusters ("hotspots") of Erasmus mobility emerge and evolve and their spatio-temporal dynamics. While statistical analyses reveal where clusters form, they do not explain why certain regions outperform others. The formulated clusters are significant for proactive regional development strategies considering geopolitical changes like Brexit or COVID-19, which can reshape mobility trends. This lack of clarity is substantial because it hinders the ability of policymakers and institutions to design targeted interventions that could address regional disparities and promote balanced internationalisation. If these issues remain unresolved, the consequences could include perpetuating inequalities in access to the benefits of Erasmus+ mobility, such as economic growth, cultural integration, and innovation, particularly in "left-behind" regions [4]. Thus, the ineffective allocation of resources and missed opportunities to strengthen cohesion and competitiveness across Europe are possible, with detrimental effects that can exacerbate socioeconomic divides and undermine the broader goals of the Erasmus+ program and EU cohesion policies.
This paper seeks to address the issue of uneven geographic distribution and regional disparities in Erasmus+ student mobility by exploring the geography of mobility and the factors influencing student mobility patterns and their implications for regional development and HEI internationalisation. The work develops and tests three hypotheses: (1) Erasmus+ student mobility creates spatial clusters of HEIs which attract large amounts of incoming students and spatial clusters of HEIs which accept large numbers of incoming students relative to their student population. These two types of clusters do not necessarily coincide; (2) The performance of HEIs as concerns incoming Erasmus+ students is affected by their location; (3) HEIs academic characteristics and regional socioeconomic and educational variables determine Erasmus+ mobility rates. Using data from the ETERO database, Eurostat, and other sources, the study employs hotspot analysis to identify spatial clusters and a multilevel random intercept model to measure the effect of regional and institutional predictors. The analysis reveals traditional mobility hubs like Spain and Portugal, unexpected hotspots in Ireland and Sweden, and significant cold spots in countries like Poland and Germany. The study highlights the importance of HEI teaching loads, research intensity, regional educational attainment, and employment opportunities in driving mobility. Ultimately, this work contributes by identifying actionable insights for HEIs and policymakers to promote balanced mobility flows and enhance the internationalisation efforts of underserved regions. The following section, “Literature, Data, Methods and Hypotheses”, briefly reviews the literature, presents the data used in this work and the methods, especially multilevel analysis and concludes by introducing the hypotheses to be tested. Section 3 presents the results, starting from the 2014-2020 geography of Erasmus incoming mobility, continuing to the results of the various multilevel models and concluding on the tested hypotheses. Section 4 discusses the results and concludes policy recommendations relevant to academic research.
2. Literature, Data, Methods and Hypotheses
2.1. Literature Review
International student mobility drives education, global collaboration, and labour market needs while supporting cultural and economic goals. Geopolitical factors like nationalism, immigration policies, Brexit, and economic shifts have altered student flows, boosting destinations like Canada, Australia, and Europe [5]. Research spans movers' characteristics, institutional policies, and regional impacts, highlighting how mobility shapes and is shaped by regional development [6].
The Erasmus+ program is the flagship EU initiative to enhance human resources and promote sustainable development through education, training, and youth activities. It focuses on inclusivity, digital skills, and environmental sustainability while addressing socioeconomic challenges across Europe and internationally. Erasmus+ addresses three key actions: Mobility of individuals, Cooperation among organisations and institutions, and Support for Policy Development and Cooperation [7]. The program emphasises creating equitable opportunities, addressing systemic barriers, and integrating sustainability into education and training, making it a cornerstone for advancing EU priorities in education, innovation, and climate action [8]. Erasmus+ fosters regional development by addressing educational, social, economic, and environmental challenges, empowering underserved areas through education, innovation, and collaboration. It promotes inclusion and diversity, expanding access to education, training, and mobility for individuals in rural, remote, and economically disadvantaged regions. The program supports strategic projects in sustainable growth, including rural development, to build competencies for long-term progress [4]. Through Cooperation among Organisations and Institutions, Erasmus+ strengthens networks between local, regional, and international entities, modernising education systems, enhancing management capacities, and fostering innovative approaches [9,10,11]. Skills development improves employability [12,13] and wages [14], contributing to economic stability and reducing regional disparities. Additionally, student mobility strengthens regional and national [15] and European identity, fostering intercultural dialogue and reinforcing the ‘Erasmus effect’ on cohesion and community integration [16].
Many researchers recognised the potential effects of Erasmus+ on regional development in terms of positive human capital flows and cultural integration. Thus, they examined the effect of places in attracting Erasmus students to improve local territories' civic engagement, hence widening the program's impact. [1] identified a series of regional determinants of Erasmus mobility in European regions, including urbanisation levels, the presence of capital cities, the quality of governance, regional tourism activity, and the development trap status of regions, especially those in a development trap or at high risk of falling into one. Thus, urban, competitive, well-governed destinations receive more students, while less attractive regions struggle due to poor growth trajectories and governance issues. Researchers examined country characteristics and found them more significant than HEI characteristics in driving the internationalisation of academic staff [3]. Research-oriented HEIs in more attractive countries tend to have a higher share of international staff, while similar HEIs in less attractive countries experience limited internationalisation. Thus, less attractive countries should focus on internal factors such as training and career opportunities for national researchers rather than trying to replicate the strategies of more attractive countries.
Significant research carried out by the Joint Research Centre (JRC) of the European Union [2] examined the effect of characteristics at the HEI and regional levels on the mobility of Erasmus students in the period 2017-2013. They provided a comprehensive account of variables that can reflect “regional attractiveness” across 142 NUTS2 regions and 26 EU Member States. The authors considered the effects of “Urbanisation”, “Employment Opportunities” and the “Quality of the Education System”. The degree of urbanisation was captured by population density and thought of influencing student mobility either negatively, as a proxy for higher living costs impacting degree mobile students more, or positively, as an indicator of urban lifestyle and local amenities with urban areas with abundant cultural, social, and recreational opportunities to be more likely to attract more mobile students. Employability abroad and employment opportunities are reflected in the employment rate of recent tertiary graduates and expected earnings, which positively influence student mobility by signalling better job prospects and economic opportunities at the destination. The quality of the regional educational system is reflected in the percentage of universities in a region included in quality rankings such as the Times Higher Education (THE) rankings or a higher share of the population aged 30–34 with tertiary education. The latter also serves as a proxy for an educated population, fostering a peer effect that enhances the region's appeal to students. The study found that only two regional-level variables exerted statistically significant effects: the employment rate of recent tertiary graduates and the regional tertiary educational attainment.
2.2. Data
The data used in this work comes from a variety of databases. The European Tertiary Education Register (ETER) Consortium, a cooperative effort that makes data about higher education institutions (HEIs) throughout Europe publicly available, maintains the ETER, the central database. ETER database provides all the HEI-specific data, including Erasmus mobility data at different study levels of the International Standard Classification of Education (ISCED). ISCED levels 5 to 8 represent higher education and participate in HEI Erasmus+ mobility activities. Level 5 covers short-cycle tertiary education (e.g., associate degrees), Level 6 corresponds to bachelor's or equivalent, Level 7 to master's or equivalent, and Level 8 to doctoral or advanced research qualifications. ETER also includes data and information on research and research programmes carried out by the HEIs. Data on publications are from the Centre for Science and Technology Studies (CWTS) Leiden Ranking 2024 based on bibliographic data from the Web of Science database produced by Clarivate. Regional data are drawn from Eurostat, especially the “Regional statistics by NUTS classification (reg)” section. Georeferencing of HEIs was derived by [10] and European Union administrative boundaries from the “Geographic Information System of the Commission”.
We define two variables of interest. First, the average annual number of Erasmus incoming students to a HEI as the average of all reported incoming students by the HEI to ETER in the period. Second, the average rate of incoming Erasmus students is the ratio of the average number of incoming Erasmus students to the average number of the HEI’s registered students in the period under consideration. The first indicator shows the scale of the incoming flow of Erasmus students and, inevitably, is related to the size of the HEI. The incoming rate indicator is related to the HEI’s capacity to receive students and shows the intensity by which the Erasmus “spirit” is developed, irrespective of the HEI’s size. At the HEI level, research [2] outlined several factors that define three dimensions of the institutional attractiveness of HEIs, namely, Teaching Quality, Research Capacity and Institutional Reputation. Teaching quality includes measuring the student-teacher ratio to reflect the teaching load and the fees paid per student at the host institution as a quality signal. Research Capacity refers (a) to Research Intensity and compares the number of PhD graduates to graduates at lower ISCED levels and (b) to Research Excellence captured by the number of publications and their citations in the top 10% of most frequently cited articles. The JRC study captured Institutional Reputation using the Times Higher Education (THE) World University Rankings, with institutions included in this ranking expected to attract more mobile students due to their perceived prestige [2]. We do not use the THE rankings in this work because many participating institutions are not included. Thus, such a zero-inflated variable can cause significant problems, including biased estimates, inefficient inference, and model misspecification. Instead, we capture reputation among the academic community with the number of EU projects per 100 members of the HEI staff. The heterogeneity among HEIs can be partly controlled by variables capturing the HEIs’ size measured by the total number of students enrolled in all ISCED levels, their legal status and primarily if they are classified as public, private, or government-dependent and their spatial location in one place or developing satellite campuses in different areas.
As it was outlined [2], geographical factors contributing to regional attractiveness for student mobility include urbanisation, regional employment opportunities, the region’s capacity to support graduates and the quality of the regional educational system. Urbanisation, in the sense of high population density, can play a double role in deterring or attracting students. The former may be due to higher living costs, including rent and food, and the latter to the urban lifestyle and amenities. Higher regional employment rates for recent tertiary graduates and higher expected earnings can be more attractive to Erasmus students who may seek to remain or return to the host country after graduation to pursue employment. Regions with a higher proportion of tertiary-educated graduates are seen as more attractive due to the potential for peer effects and a more skilled population that attracts businesses. Finally, the quality of the regional tertiary education system is reflected in the regional academic publication record of the hosting institutions of the region. These factors can collectively shape Erasmus students' decisions based on investment motives (e.g., improving future income and employability) and consumption (e.g., better quality of life and local amenities). Table 1 shows all the variables used in the analyses, their definitions and descriptive statistics.
Incoming mobility 2014-2020 shows significant yearly fluctuation (Figure 1). Initially 2014, there was a relatively small number of moving students (136,832), which more than doubled (283,376) in 2019. The number of reporting institutions decreased, reaching approximately 1,500 by 2019. The significant fluctuation in the number of moving students and participating institutions indicates that it is better to process the data as a cross-section of averages of the 2014-2019 period than a panel with considerable fluctuation and white noise. Thus, all variables recorded are averages of the 2014-2019 values unless otherwise stated. Figure 2 illustrates the average yearly incoming mobility across various educational levels from 2014 to 2019, highlighting that ISCED 6 is the driving force of Erasmus+ incoming mobility, accounting for almost 66.5% or 149,131 of all average yearly incoming students.
ISCED 7 follows with 30.4%. The significant shares of ISCED 6 and 7 and the clear differentiation between under and postgraduate studies show that these two levels should be studied separately and in addition to the study of the overall Erasmus student movements. Figure 3 illustrates the yearly incoming students at ISCED levels 6 and 7 from 2014 to 2019, re-confirms the data fluctuations observed in Figure 1 and highlights that both series fluctuate and thus it is better to use yearly averages of the 2014-2019 period and process the data as a cross section.
2.3. Methods
Hot spot analysis
Hot spot analysis is a widely used spatial statistical technique that identifies geographic areas where the observed values of a variable significantly deviate from expected values, either through clusters of unusually high (hot spots) or low (cold spots) values. In this work, hot spot analysis will reveal spatial trends and clusters that might not be visible in non-spatial analyses between the average yearly number of incoming Erasmus students at the HEI level and the ratio of Erasmus incoming students to the total number of registered students. By examining the spatial distribution of a variable across a study area, hot spot analysis reveals areas where patterns are not random but exhibit statistically significant clustering. This method employs tools like the Getis-Ord Gi statistic, which evaluates the degree of spatial clustering by comparing local values to a broader spatial context. For example, the Getis-Ord Gi method shows that when one HEI stands out, it has a high ratio of Erasmus incoming students to total registered students, and the surrounding HEIs do, too. This cluster is a hot spot for high incoming student rate HEIs or highly attractive HEIs which actively internationalise.
On the other hand, a cold spot is an area where HEIs don’t have high ratios of Erasmus incoming student rates, and neither do their neighbouring HEIs. Thus, a statistically significant hot spot indicates a localised concentration of high values, while a statistically significant cold spot signifies a spatial concentration of low values. These clusters are assessed based on statistical confidence levels, ensuring the observed patterns are unlikely to be due to random chance. Hot spot analysis identifies areas of interest by highlighting clusters with unusually high or low values of the variable measuring incoming Erasmus students or the rate of Erasmus to total students. These clusters can guide policy and decision-making at the HEI and regional levels by providing evidence-based insights for targeted interventions.
Hotspot Comparison compares two different hotspot analyses to examine how they relate. In practice, the comparison examines each location and categorises it based on its significance in both analyses. This results in the similarity index in hotspot comparison, which ranges from -1 to 1 and indicates how similar the spatial patterns are between two hotspot analyses. Values closer to 1 suggest the phenomena under comparison tend to cluster in the same areas, values closer to -1 indicate they cluster in opposite areas, and values near 0 suggest no meaningful relationship between the spatial patterns. Usually, a similarity index between 0.4 and 0.6 implies medium similarity, 0.6-0.8 substantial similarity and above 0.8 very strong, near-perfect similarity. This results in a new map showing the similarity of each hotspot of one hotspot analysis to the corresponding location of the other analysis. The maps of the hotspot comparison analysis in this work present only hotspots with similarity above 0.6.
Multilevel analysis
The Erasmus incoming data refer to each HEI. HEIs are clustered into NUTS 2 groups and operate under the same regional socioeconomic and political environment. Multilevel models can take account of this hierarchical nesting in data, recognise that observations of HEIs within regions are not independent and respect the real-world structure of how data is organised. By understanding the variation at the two different levels, HEI and regional, the model can measure how much variation exists between regions and within regions and identify if the regional level contributes significantly to the overall variation. This work uses the two-level random intercept specification, which is presented below.
For the HEI i in region j, the ratio of Erasmus incoming students to total registered students :
where is the random intercept for region , and is the individual level (HEI) predictor, is a coefficient to be estimated with fixed slopes across regions and is the individual-level (HEI) residual error following a normal distribution with mean zero and variance . The random intercept is modelled as:
where is the overall intercept, i.e. the grand mean of the Erasmus incoming student rate, is a regional-level predictor , is the coefficient for the regional-level predictor, and is the regional-level random effect, and is the regional-level random effect following a normal distribution with mean zero and variance . By substituting the regional level equation (2) into the HEI level equation (1), this is:
The Intraclass Correlation Coefficient (ICC) measures how similar observations are within the same region by quantifying how much of the total variation in the outcome is due to differences between regions. The ICC is:
or, in other words, the ratio of the variance between regions to the total variance between and within regions. The ICC ranges from 0 to 1 (or 0% to 100%), with a higher ICC meaning HEIs within the same region are more similar to each other, and a lower ICC means HEIs within regions are more different from each other. In general, higher ICC values, typically greater than 0.05, are another reason to justify the use of multilevel modelling besides the theoretical reasons and the natural hierarchical clustering of the data [17,18].
Hypotheses
The three research aims of this work are the three following hypotheses:
Hypothesis 1:
a. Erasmus+ student mobility generates "hot" and "cold" spots of HEIs based on two dimensions: (i) absolute numbers of incoming students ("scale") and (ii) the ratio of incoming Erasmus students to total registered students ("reception capacity").
b. Hot and cold spots of HEIs of "scale" coincide with hot and cold spots of "reception capacity."
Hypothesis 2:
The regional location of HEIs significantly influences their capacity to attract and host incoming Erasmus students.
Hypothesis 3:
Specific socioeconomic and educational characteristics of the NUTS2 regions in which the HEIs are located critically shape the rate of incoming Erasmus students and, consequently, the success of these institutions in internationalisation.
3. Results
3.1. The Geography of Erasmus Incoming Students
This section may be divided by subheadings. It should provide a concise and precise description of the experimental results, their interpretation, as well as the experimental conclusions that can be drawn.
In their analysis, Barrioluengo and Flisi (2017) showed that Spain was the leading destination, attracting more than 16.3% of all Erasmus students in 2013, followed by Germany (12.2%) and France (9.6%). The UK and Italy also ranked high, receiving 9.4% and 9.1% respectively. The order remains almost the same in the 2014-2019 period, with Spain accepting an average of 36,220 or nearly 16.5% of all Erasmus students, followed by Germany (11.3%), the UK (9.2%), Italy (7.7%), France (7.2%), Poland (7.0%) and Portugal (5.5%). Allocations between ISCED 6 and 7 incoming students also do not differ much from 2013. These distributions are, of course, influenced by the Erasmus+ program's centralised management of scholarships and their allocation across countries. So, what matters more is whether Erasmus incoming students create hot or cold spots. A hotspot is not just a single HEI with a high value for the number or the ratio of incoming Erasmus students but a group of HEIs with statistically verified high values different from what one would expect by chance, considering the overall pattern of Erasmus incoming movements. Correspondingly, a cold spot is a group of HEIs defined by a spatial relationship with statistically verified low values.
The top line of Figure 4 (Figure 4a) shows hot and cold spots for the yearly average number of incoming Erasmus students for all educational levels (left) and ISCED 6 (middle) and 7 (right) separately. The figure shows only hot and cold spots of 99% confidence intervals because the more significant the z-score (positive or negative), the more intense the clustering. Figure 4a reveals four trends. First, although Spain, Germany, the UK, Italy, Poland, France and Portugal received the most significant number of Erasmus students in 2014-2019, hotspots are only formulated in Spain, France and Portugal. Second, countries that did not receive many Erasmus students, like Ireland, show the formation of significantly strong hotspots, revealing a spatial targeting for incoming Erasmus students. The South of Sweden is a surprisingly significant hotspot with HEIs in Gothenburg, Jönköping, Linköping, Skövde and other southern areas, all in a circle with a radius of less than 150 Km. Third, cold spots emerge not only in countries that receive low numbers of Erasmus students, such as Bulgaria, Romania, or Croatia, but also in Poland, the sixth largest receiver among all EU Member States. Fourth, the patterns for ISCED 6 and 7 are different. North England, Scotland and Northern Ireland are UK regions with hotspots for ISCED 6, while Sweden emerges as a country with highly populated ISCED 7 hotspots. This may indicate HEI specialisation in Erasmus ISCED 6 or 7, a sign of strategic internationalisation worth further research. Germany has numerous cold spots for ISCED 6 and Poland for ISCED 7 students.
The middle line of Figure 4 (Figure 4b) shows the hotspot analysis for the average ratio of incoming Erasmus students to total registered students as defined above (Table 1). This ratio reflects the capacity and willingness of HEIs to attract and accommodate incoming Erasmus students based on the size of their student population. In this case, hotspots are statistically significant groups of HEIs, defined by a spatial relationship, with high numbers of incoming Erasmus students per 1,000 of their total student population. For ISCED 6 and 7, this ratio is defined by the ISCED 6 or 7 incoming Erasmus students per 1,000 of the total number of registered ISCED 6 or 7 students. Hot and cold spots in the ratio of incoming Erasmus students are due to the coexistence of ISCED6 and 7 Erasmus students. HEIs usually receive both ISCED 6 and 7 students; thus, examining hot and cold spots for the total number of Erasmus students is reasonable. The Spanish, Portuguese, and French hotspots dominate, but new hotspots emerge in Finland, the Baltic countries, and central Europe, including the South of Germany, Austria, and the Czech Republic. Concurrently, cold spots appear in the UK, central and south England, the Benelux, northwest Germany, Greece and the very south of Italy.
The bottom row of Figure 4 (Figure 4c) examines whether hot (or cold) spots for the number of incoming Erasmus students co-locate with corresponding hot (or cold) spots for the ratio of Erasmus students to registered students, i.e., the HEI’s capacity and willingness to internationalise. The possible coexistence of hotspots from these two variables cannot be deduced directly by observing the corresponding maps of the top and middle row because these maps show only hot and cold spots with 99% confidence intervals, whilst the statistical comparison presented in the bottom row is based on hot and cold spots of all confidence intervals (99%, 95% and 90%) as well as on spots of no-significance. For the map on the left of the bottom line of Figure 4.c, showing all educational levels, the global similarity value is 0.42, indicating a medium similarity. In other words, hot or cold spots of the number of Erasmus students have a medium correspondence to hot or cold spots of the rate of Erasmus students to total students. The map shows the spots with high similarity between the two features. For example, the hotspots of the number of incoming Erasmus students in Portugal correspond to the hotspots of the ratios of Erasmus incoming rates to registered students in Portugal; thus, the similarity is very high. Likewise, the presence of hotspots in Italy is insignificant in terms of the number or ratio of Erasmus students; thus, the similarity is high again. For ISCED 6, the overall similarity index is 0.36, not even medium, while for ISCED 7, it is 0.46. The hotspot analysis comparison reveals that hotspots regarding the number of Erasmus students do not usually coexist with hotspots regarding the ratio of Erasmus to registered students. In addition, the differences in hotspots between educational levels again indicate that many HEIs may pursue selective strategies for attracting one or the other educational level but not both.
The preceding hotspot analyses and hotspot analyses comparisons indicate that Hypothesis 1a is partly accepted and partly rejected. Top countries in Erasmus+ student mobility, such as the UK, Germany, Italy and Poland, failed to show the formation of any hotspots of HEIs. Spain, Portugal, and partly France show substantial and statistically significant clusters of HEIs concerning both the absolute number of incoming Erasmus students and the ratio of incoming students to total registered students. Hypothesis 1b is rejected because the evidence supporting it is very weak. Clusters of HEIs with substantial Erasmus students do not co-locate with clusters of HEIs with a high ratio of Erasmus to total registered students.
3.2. A Model of the HEI and Regional Factors Affecting Student Mobility
Table 2 presents the results of fitting various specifications of the basic two-level random intercept model in equations (1) to (4). All HEI-specific variables are group-centred, i.e., the regional mean is subtracted from each HEI’s score. For example, the first HEI on the ETERO database has an average teaching load in the period 2014-2019 of 7.61 ISCED 5 and 6 students per member of academic personnel. The regional average of the 20 HEIs in this region is 3.80; thus, its group-centred score is 3.81=7.61-3.80. This transformation is usual because it helps separate within-group variation from between-group variation in multilevel analyses. Of course, regional variables are not group-centered. The goodness of fit measures include the conditional pseudo R-squared (), an extension of traditional to multilevel models, which have both fixed effects and random effects. It reflects the proportion of the total variance in the outcome variable explained by the model's fixed effects predictors and the random effects, which consist of the region-level variation. SPSS v.29 estimates the conditional following the Nakagawa and Schielzeth approach [19]:
where is the variance explained by the fixed effects and and are the residual and random variances defined in the ICC of equation (4). The smaller the part of the variance explained by fixed effects , the closer is the to the ICC.
The simplest multilevel model allows for regional effects on the rate of Erasmus incoming students but without explanatory variables. This ‘null’ model, given equation (3) above, may be written as:
with the notation as above and results shown in Table 2 (“Model 1’). The ICC is 0.087, indicating that 8.7% of the variance in the ratio of Erasmus incoming students to registered students can be attributed to regional differences, i.e., location, without the contribution of any other explanatory variable. A likelihood ratio test comparing Model 1 “null model” with a single-level model without explanatory variables can formally test the statistical significance of regional effects since the two models are directly nested, and their only difference is the additional term introduced by the second level (regional) effect. The likelihood ratio statistics is LR = -2*(19,203.98 – 19,110.11) = 187.74 on 1 d.f. Thus, the 2-level complex model fits the data significantly better than the single-level model, providing overwhelming evidence of regional effects on the ratio of incoming Erasmus students.
The overall average (grand mean) ratio of Erasmus incoming students across regions is estimated to be 15.76 per 1,000 students receiving HEI. For a region j, this is estimated as 15.763+u_0j where u_0j is the regional residual. For regional residuals, confidence intervals are obtained to determine whether differences from the overall mean can be considered ‘real’ or due to chance. If a region’s j regional residual (u_0j) is positive, the region has a mean ratio of Erasmus incoming students to registered students higher than the grand mean. If it is negative, it has a ratio below the grand mean. From the 277 NUTS 2 regions in the analysis, 184 have negative, but not statistically different from zero regional residuals u_0j, and 93 have positive. Figure 5 shows the regional champions in Erasmus internationalisation, i.e. the regions with the highest positive and statistically significant regional residual. For example, the expected incoming Erasmus students per 1,000 students in the 28 participating HEIs of the Budapest area (HU11) is 15.76+24.3=40.06 with confidence intervals from 32.43 to 47.76. Similar performance is shown by the Portuguese regions of Norte (PT11) and Lisbon (PT17), the French Midi-Pyrénées (FRJ2) and Rhône-Alps (FRK2) and the Austrian regions of Vienna (AT13) and Innsbruck (AT33).
The study of residuals reveals how much of the total variance is due to between-group differences, which is crucial for isolating possible good practice examples for further analysis and consideration. For example, the rise of Hungary in general, and of the Budapest area in particular, as an ISCED 6 and 7 student Erasmus students destination is a well-documented fact. The hotspot and multilevel analysis results confirm these trends and highlight the importance of regional factors and the presence of strong statistically significant educational clusters. Thus, hypothesis 2 is accepted.
The columns titled “Model 2” and “Model 3” of Table 2 show the results of fitting the two-level model with all fixed effects, HEI and region-specific, for all ISCED levels. Their only difference is that “Model 2” includes the “fees per student” variable, which is also used by [2]. This variable is recorded by only 866 out of the 2,066 participating HEIs in 123 out of the 277 regions, which reduces the sample and, thus, the power of the analysis. It is included here to facilitate an immediate comparison with the Barrioluengo and Flisi (2017) study. Model 3 excludes this variable to increase the sample of HEIs to 1,355 and attain more robust results. Models 4 and 5 use the same variables as Model 3 but are estimated only for ISCED 6 or ISCED 7 Erasmus incoming students. Before interpreting the results, the reader should be aware that Erasmus mobility grants in the 2014-2019 period were constrained. First, the agreements among the sending and hosting universities limit students' choices. The flow of students was determined by the existing agreements, which are always numerous to cover many types of HEIs and destinations and, thus, do not constitute a major obstacle to free movement. Second, Erasmus agreements are capped. Students' choice of destination is constrained by the imposition of "quotas". Thus, it is plausible that availability and preferences jointly determine the final destinations. Students’ second or third choices may also justify the rise of destinations next to popular first-choice destinations such as Lisbon, Vienna or Budapest. The multilevel model assumes that the HEI-specific fixed effects capture and explain the heterogeneity of incoming Erasmus students, including the order of placement preferences. The results reported here should be interpreted with caution, considering these limitations.
With a few exceptions, the fixed effects factors results in Table 2 generally support the analysis done by Barrioluengo and Flisi (2017) and show some very intriguing trends. Universities with lower teaching loads tend to attract or be preferred by more Erasmus students, as a higher teaching load is negatively correlated with Erasmus mobility. Although there is still a negative sign for this variable for the ISCED 6 and ISCED 7 models (4 and 5), the factor is no longer statistically significant. The student fees variable in Model 2 has a statistically significant positive sign, suggesting a positive correlation between the ratio of Erasmus mobility rates and higher student fees. Given that Erasmus participants do not pay fees to the host university, it is possible that higher tuition could serve as a stand-in for perceived institution quality and draw in more students. Both variables confirm the results derived by Barrioluengo and Flisi [2].
The two variables reflecting research activities, i.e., the number of EU grants per staff member and the proportion of HEIs' publications in the top 10 per cent of most cited publications (excellence), both show significant associations with the ratio of Erasmus students, suggesting that a university's research profile is a highly relevant factor. In many previous studies, University quality was an essential determinant of students’ choice [11,20]. Research has shown that the connections are among faculties of institutions rather than the institutions themselves [11]. This finding supports the argument that Erasmus networks are built upon active or pre-existing research partnerships. For postgraduate Erasmus students only, research intensity matters (ISCED 7). Despite using the exact definition of variables and sources as the current study, Barrioluengo and Flisi [2] did not find the research excellence or the intensity variables statistically significant. During the 2014–2019 timeframe, research quality was one of the key determinants influencing the selection of Erasmus agreements and, in turn, Erasmus mobility. For research reputation, the variables between this work and [2] are not comparable since this work did not use the Times Higher Education (THE) university rankings.
The size of an HEI, measured by the yearly average number of students across all ISCED levels, was the only statistically significant of the control variables. Its negative sign suggests that the ratio of Erasmus per 1000 registered students decreases with increasing size. For instance, in Model 2, the ratio of Erasmus incoming students per 1,000 registered students falls by 0.255 as a HEI grows by 1,000 students above the average HEI size in the region. Erasmus mobility is unaffected by the operation of satellite campuses outside the HEI's main campus or by the institution's legal classification as public or private.
Urbanisation, measured as population density, is not statistically significant. The same holds for regional employment opportunities, as reflected in the regional employment rate of recent tertiary graduates. Both results agree with the JRC study [2]. Also, in that study, regions with higher levels of tertiary educational attainment showed a weak but statistically significant and positive association with Erasmus mobility [2]. In the current study, regional educational attainment, measured by the proportion of higher education graduates in the regional population, is consistently statistically significant, positive, and with a considerable effect size.
The concentration of higher education graduates in a region is a factor that may mask various regional aspects and manifests through enhanced innovation and entrepreneurship [21], economic growth [22,23], community engagement, lifelong learning opportunities, increased attractiveness for investments, and contributions to research and development to support a high level of regional competitiveness [24,25,26]. The higher proportion of individuals with higher education in a region positively impacts the quality of life through economic benefits, social cohesion, improved health outcomes, access to educational resources, and innovation, collectively contributing to a more vibrant and sustainable community. Reserachers name the regional factors as "offerings of the city", encompassing factors such as the city's atmosphere, cultural offerings, amenities, and overall environment that contribute to the students' satisfaction and experience during their time abroad [27]. Quality of life and the development and enhancement of amenities are driven by increased investment in infrastructure, business development that spurs local services, enhanced cultural opportunities, improved access to health services, and the presence of educational institutions that contribute positively to community life, creating a more attractive living environment that benefits all residents. Shapiro’s seminal work showed that a 10% increase in a metropolitan area's concentration of college-educated residents is associated with a 0.8% increase in subsequent employment growth, with 60% due to enhanced productivity and 40% due to growth in quality of life [28].
In general, evidence favours the acceptance of Hypothesis 3, which states that the specific socioeconomic and educational characteristics of the NUTS2 regions in which HEIs are located influence the rate of incoming Erasmus students and the internationalisation efforts of these institutions.
4. Discussion and Regional Policy Implications
International mobility of tertiary education students profoundly affects the regions that host them, influencing social, economic, and cultural dynamics. This is why attracting international students through the Erasmus+ program has become a strategic objective for many universities. However, the impact varies widely based on the region's socioeconomic characteristics and conditions, shaping how these benefits are realised and integrated into broader regional development strategies. Undoubtedly, HEIs with high rankings and prestige are more likely to be chosen by Erasmus+ students seeking quality education abroad, with regional factors being equally important.
There are significant spatial disparities in the distribution of incoming students among HEIs. While Spain, Germany, the UK, Italy, Poland, and France host considerable numbers of Erasmus students, statistically significant hotspots emerge only in Spain, Portugal, and parts of southern France, as well as individual locations in Ireland and Sweden. The rise of unexpected hot spots also highlights the dynamics and the changing character of Erasmus movements after Brexit, COVID-19 and significant geopolitical changes in Europe and internationally. A comparison of hotspots for absolute numbers of students and the ratio of Erasmus students to total registered students shows limited overlap, suggesting that HEIs excelling in one metric do not necessarily perform well in the other. This work does not provide explanations of how such clusters emerged and does not study their spatio-temporal dynamics. However, it points out where in space to look for interesting case studies, hot or cold spots, that will further the knowledge of the factors determining HEI internationalisation.
The high concentration of university graduates, higher earnings, and a regional environment supporting research excellence characterise regions exhibiting higher attractiveness for Erasmus participants. These results suggest that enhancing such factors can make less attractive regions more appealing destinations for Erasmus students. Findings indicate that regional and local authorities can play an essential role by adopting policies favouring the internationalisation of HEIs. Regional and academic authorities should examine and understand the impact of Erasmus mobility flows on specific localities, economies and societies. Based on this, regional and educational authorities should adopt goals concerning the desired quantitative and qualitative characteristics of the students to be attracted, such as the number of students concerning local capacity, the targeted educational levels and disciplines, and others.
Researchers suggest a re-orientation of the Erasmus Program based on a re-evaluation of the program along the broader Cohesion policy, with a particular focus on "left-behind" places and recommend that solutions should be designed carefully and implemented with attention to local contexts [1]. Findings from the current work and especially evidence from hotspot analyses support this perspective. However, it may be necessary to improve the condition of local governments to ensure that they can effectively utilise the resources available to them and take advantage of a possible re-alignment of the Erasmus programme with cohesion targets. The latter may include introducing almost subtle conditionalities and gentle policy interventions to improve the current allocation of Erasmus flows, aiming to create a more balanced distribution among regions. At the same time, HEIs should be utilised as tools for regional policy, engaging more actively in local development and supporting the local innovation system, serving the need for HEIs to strengthen their connection to regional needs.
5. Conclusions
The paper highlights the significant role of the Erasmus+ program in shaping the internationalisation of (HEIs) across Europe, particularly emphasising the spatial disparities in student mobility. It reveals that while countries like Spain, Germany, and the UK receive the largest numbers of Erasmus students, statistically significant hotspots of incoming mobility are predominantly found in Spain, Portugal, and parts of southern France, with unexpected hot spots emerging in countries like Ireland and Sweden. The analysis indicates limited overlap exists between the absolute numbers of incoming students and the ratio of Erasmus students to total registered students, suggesting that HEIs excelling in one metric may not necessarily perform well in the other. This complexity points to further investigation into the spatio-temporal dynamics of these mobility patterns, particularly in recent geopolitical changes such as Brexit, the COVID-19 pandemic and the emergence of new student destinations globally.
Furthermore, the findings underscore the importance of regional socioeconomic characteristics in attracting Erasmus students. Regions with a high concentration of university graduates, better employment opportunities, and intense research environments are more appealing to Erasmus participants. The study concludes that to enhance the attractiveness of less popular regions, local and regional authorities should adopt targeted policies that improve regional conditions, such as investing in higher education and fostering local innovation systems. Moreover, evidence suggests that regional authorities should challenge the current spatial allocation of Erasmus flows to better align with broader cohesion policies, mainly focusing on "left-behind" areas, thereby ensuring a more balanced distribution of benefits from HEIs’ internationalisation.
Author Contributions
Conceptualisation, E.G. and SS.; methodology, E.G., S.S, and D.S; econometric and statistics software, E.G. and SS; GIS analysis DS; validation, E.A., D.K., S.K. and G.K.; formal analysis, E.G. and SS; data curation, E.G; writing—original draft preparation, E.G., S.S, and D.S; visualisation, E.G., S.S, and D.S; supervision, S.S., D.S. All authors have read and agreed to the published version of the manuscript.
Funding
The research has been funded under “WISER – Well-being in a Sustainable Economy Revisited”, a European Union HORIZON-CL2-2022-TRANSFORMATIONS-01 project.
Institutional Review Board Statement
Not applicable.
Data Availability Statement
The data used in this study are freely available on official websites. The processed data are available upon request.
Conflicts of Interest
The authors declare no conflict of interest.
References
- Cattaruzzo, S. and Corò, G., 2023. Understanding Erasmus mobility in European regions: a quantile-based approach. Working Papers No. 25/WP/2023. Department of Economics, Ca' Foscari University of Venice. https://ssrn.com/abstract=4619859.
- Barrioluengo, S, M. and Flisi, S. (2017). Student mobility in tertiary education: institutional factors and regional attractiveness. Luxembourg: Publications Office of the European Union. [CrossRef]
- Lepori, B., Seeber, M. and Bonaccorsi, A. (2015) 'Competition for talent. Country and organisational-level effects in the internationalisation of European higher education institutions', Research Policy, 44(4), pp. 789-802. [CrossRef]
- Nogueiro, T., Saraiva, M., Jorge, F., Chaleta, E. (2022) The Erasmus+ Programme and Sustainable Development Goals - Contribution of Mobility Actions in Higher Education. Sustainability, 14, 1628. [CrossRef]
- Kirloskar, P., and Inamdar, N. (2021). Shifting international student mobility directions and factors influencing students’ higher education destination choices. Journal of Higher Education Policy and Leadership Studies, 2(3), pp. 160–178. [CrossRef]
- Gutema, D.M., Pant, S., and Nikou, S. (2023) Exploring key themes and trends in international student mobility research: A systematic literature review, Journal of Applied Research in Higher Education, 15(5), pp. 1-19. [CrossRef]
- European Commission (2021) Erasmus+ 2021-2027: enriching lives, opening minds through the EU programme for education, training, youth and sport. European Commission, Directorate-General for Education, Youth, Sport and Culture. Luxembourg: Publications Office of the European Union. https://op.europa.eu/en/publication-detail/-/publication/ff1edfdf-8bca-11eb-b85c-01aa75ed71a1/language-en.
- Brunazzo, M., 2023. Human Resources and Sustainable Development in the EU: The Case of the Erasmus+ Program. In: ICPT.HUST 2023 - International Conference on Human Resources for Sustainable Development. pp.134-146. [CrossRef]
- Kosztyán, Z.T., Kiss, D. and Obermayer, N. (2023) Investigating Erasmus mobility exchange networks with gravity models, Cogent Social Sciences, 9(1), 2253612. [CrossRef]
- Gadár, L., Kosztyán, Z.T., Telcs, A. and Abonyi, J. (2020) A multilayer and spatial description of the Erasmus mobility network, Scientific Data, 7:41. [CrossRef]
- Gadár, L., Kosztyán, Z.T., Telcs, A. and Abonyi, J. (2022) 'Cooperation patterns in the ERASMUS student exchange network: an empirical study', Applied Network Science, 7(1), pp. 74. [CrossRef]
- Lukas, B., Uwe, B., Sonja, B., Obdulia, T., Joanna, G., and Anna, G. (2014). The ERASMUS Impact Study. Effects of mobility on the skills and employability of students and the internationalisation of higher education institutions. European Commission, Directorate-General for Education, Youth, Sport and Culture. Luxembourg: Publications Office of the European Union. https://op.europa.eu/en/publication-detail/-/publication/13031399-9fd4-11e5-8781-01aa75ed71a1.
- Álamo-Vera, F.R., Hernández-López, L., Ballesteros-Rodríguez, J.L. and De Saá-Pérez, P. (2020) Competence Development and Employability Expectations: A Gender Perspective of Mobility Programmes in Higher Education' Administrative Sciences, 10(3), p. 74. [CrossRef]
- Iriondo, I. (2020) Evaluation of the impact of Erasmus study mobility on salaries and employment of recent graduates in Spain, Studies in Higher Education, 45(4), pp. 925-943. [CrossRef]
- Goksu, F. (2020) Intercultural Mobility and European Identity: Impact of the Erasmus Exchange Programme in Terms of Cultural Differences, Central European Journal of Communication, 1, pp. 77-92. [CrossRef]
- Mitchell, K., 2015. Rethinking the ‘Erasmus Effect’ on European Identity. JCMS: Journal of Common Market Studies, 53(2), pp.330–348. [CrossRef]
- Bliese, P. D. (1998). Group Size, ICC Values, and Group-Level Correlations: A Simulation. Organisational Research Methods, 1(4), 355-373. [CrossRef]
- Musca S. C., Kamiejski R., Nugier A., Méot A., Er-rafiy A., Brauer, M. 2011. Data with Hierarchical Structure: Impact of Intraclass Correlation and Sample Size on Type-I Error. Frontiers in Psychology, Vol 2, Article 74. [CrossRef]
- Nakagawa, S. and Schielzeth, H. (2013) A general and simple method for obtaining R² from generalised linear mixed-effects models. Methods in Ecology and Evolution, 4(2), pp. 133-142. [CrossRef]
- Rodríguez González, C., Bustillo Mesanza, R. & Mariel, P. (2011). The determinants of international student mobility flows: an empirical study on the Erasmus programme. *High Education*, 62(4), pp. 413-430. [CrossRef]
- Birch, C., Lichy, J., Mulholland, G. and Kachour, M. (2017) An enquiry into potential graduate entrepreneurship: Is higher education turning off the pipeline of graduate entrepreneurs?', Journal of Management Development, 36(6), pp. 743-760. [CrossRef]
- Čajka, P., Rybakova, A., Alieva, L. and Shcheglova, A. (2021) Regional concentration of higher education. E3S Web of Conferences, 301, 03009. [CrossRef]
- Brekke, T. (2021) What Do We Know about the University Contribution to Regional Economic Development? A Conceptual Framework, International Regional Science Review, 44(2), pp. 229-261. [CrossRef]
- Anastasiou, E.; Karkanis, D.; Kalogiannidis, S.; Konteos, G. Building European Cities, Shaping Economies: The Roles of Infrastructure and Demographics in Urban Economic Performance (2017–2022). Urban Sci. 2024, 8, 263. [CrossRef]
- Agasisti, T. and Bertoletti, A. (2022) Higher education and economic growth: A longitudinal study of European regions 2000–2017, Socioeconomic Planning Sciences, 81, p. 100940. [CrossRef]
- Eliasson, K., Haapanen, M. and Westerlund, O. (2020) Regional concentration of university graduates: The role of high school grades and parental background, European Urban and Regional Studies, 27(4), pp. 398–414. [CrossRef]
- Perez-Encinas, A., Rodriguez-Pomeda, J. & de Wit, H. (2021) 'Factors influencing student mobility: a comparative European study', Studies in Higher Education, 46(12), pp. 2528-2541. [CrossRef]
- Shapiro, J.M. (2005) 'Smart Cities: Quality of Life, Productivity, and the Growth Effects of Human Capital', NBER Working Paper No. 11615. Available at: http://www.nber.org/papers/w11615.
Figure 1.
Incoming Erasmus students of all educational levels (ISCED 5-8) and reporting institutions. Source: ETER database at: https://eter-project.com/data/data-for-download-and-visualisations/database/.
Figure 1.
Incoming Erasmus students of all educational levels (ISCED 5-8) and reporting institutions. Source: ETER database at: https://eter-project.com/data/data-for-download-and-visualisations/database/.
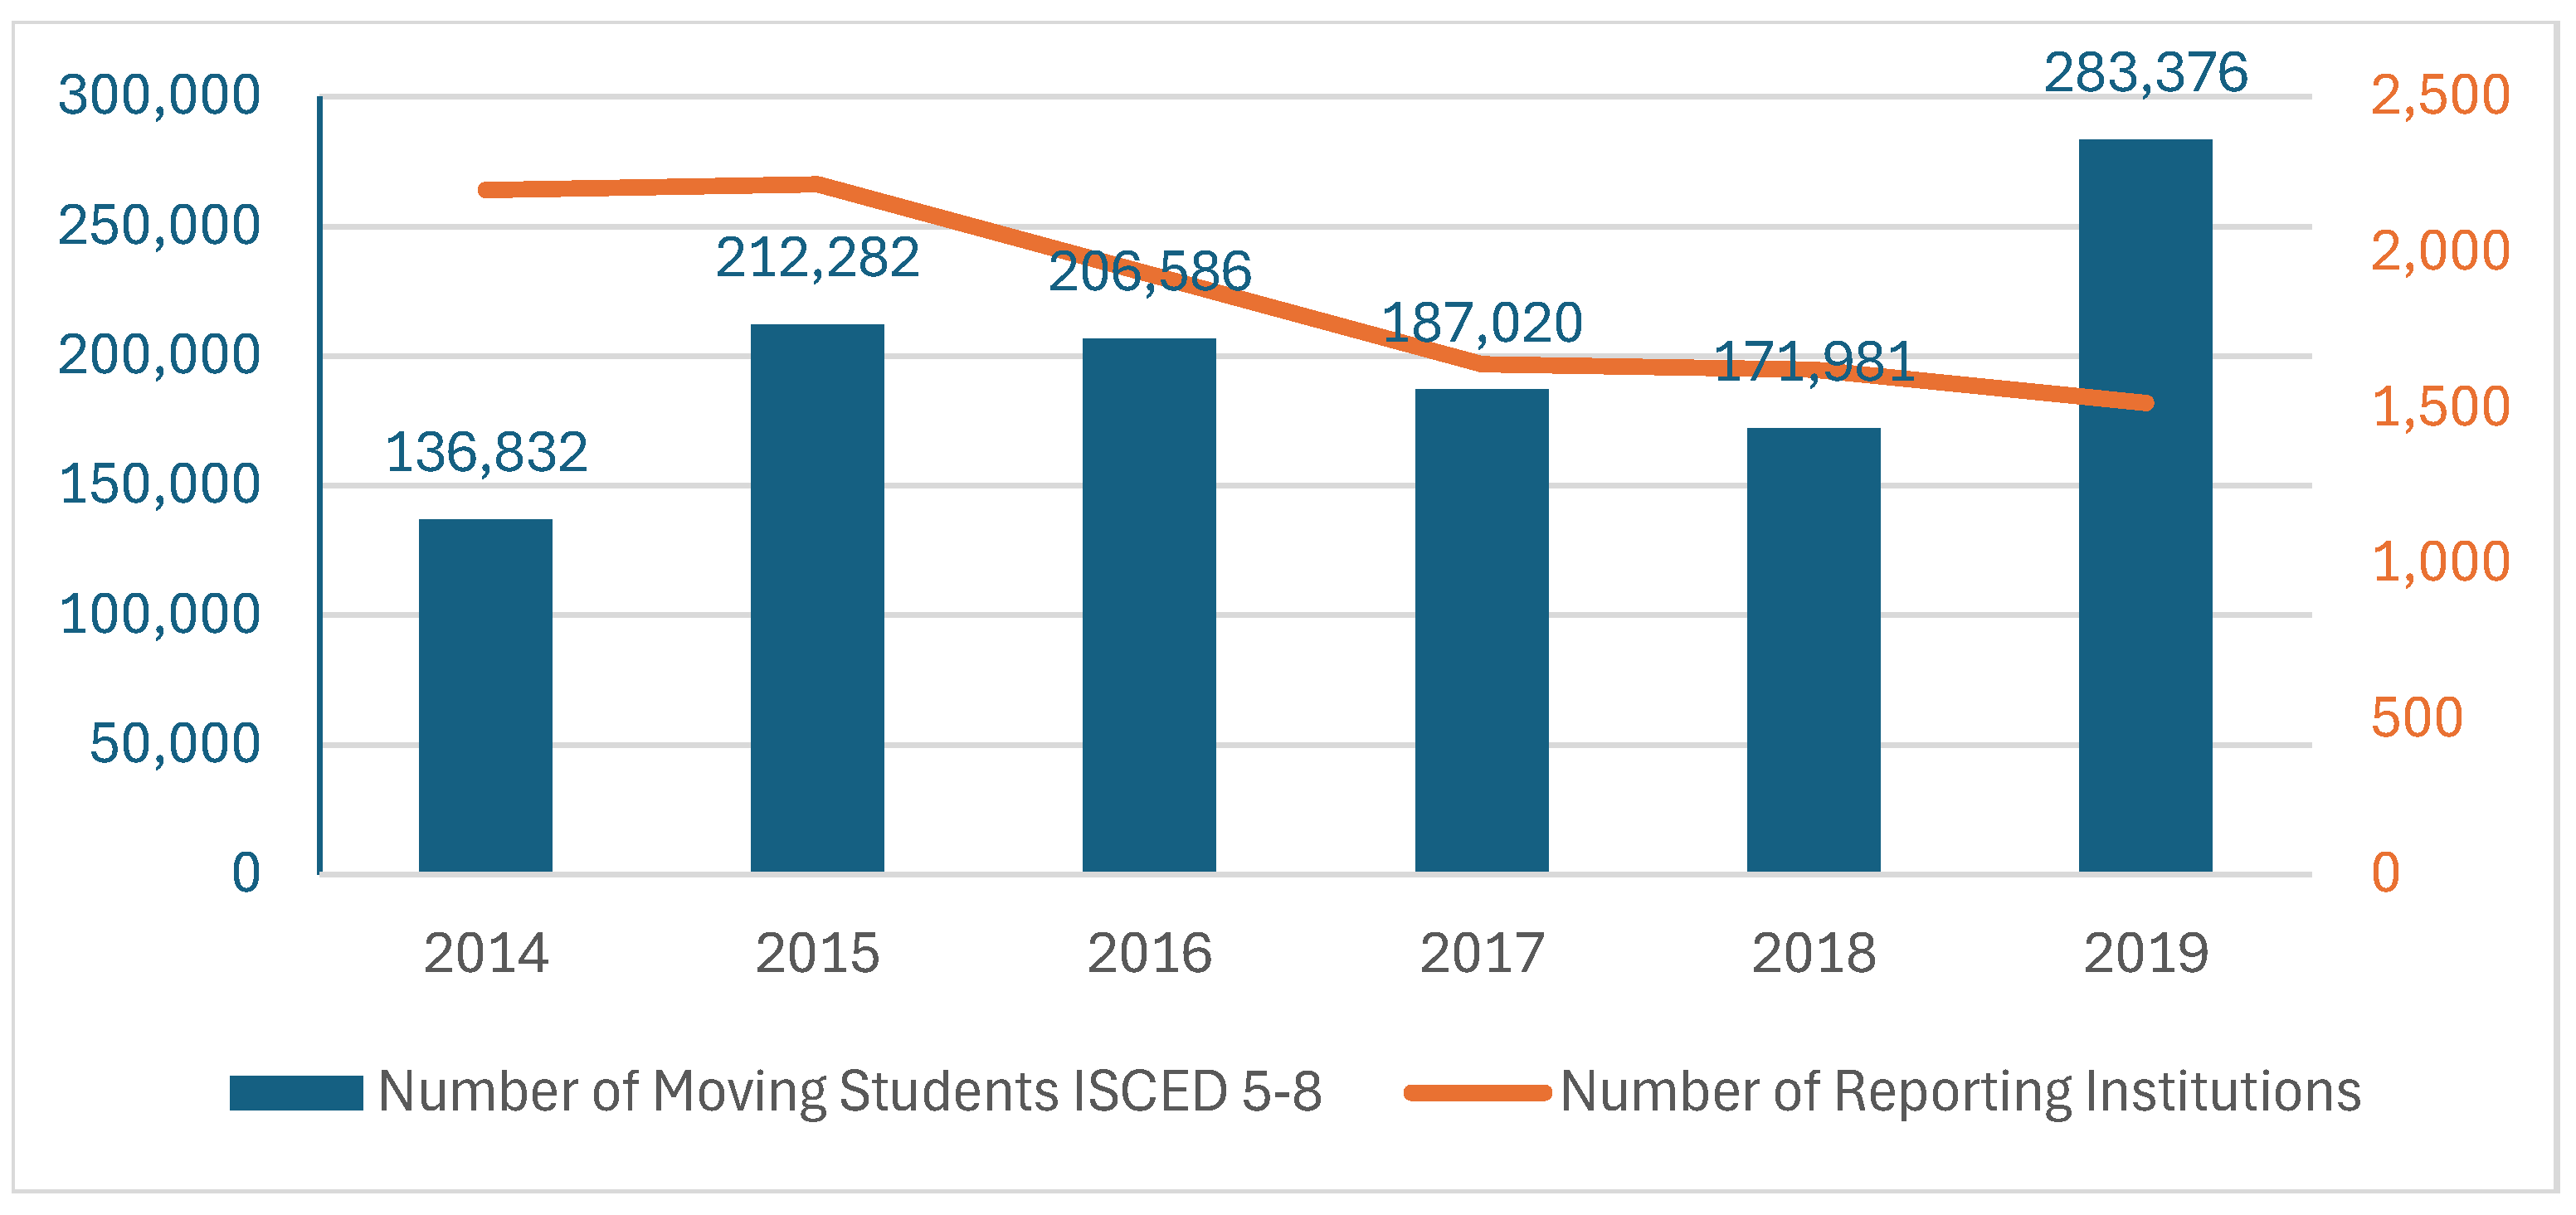
Figure 2.
Average yearly incoming mobility at various educational levels, 2014-2019. Source: ETER database at: https://eter-project.com/data/data-for-download-and-visualisations/database/ and own treatment of data.
Figure 2.
Average yearly incoming mobility at various educational levels, 2014-2019. Source: ETER database at: https://eter-project.com/data/data-for-download-and-visualisations/database/ and own treatment of data.
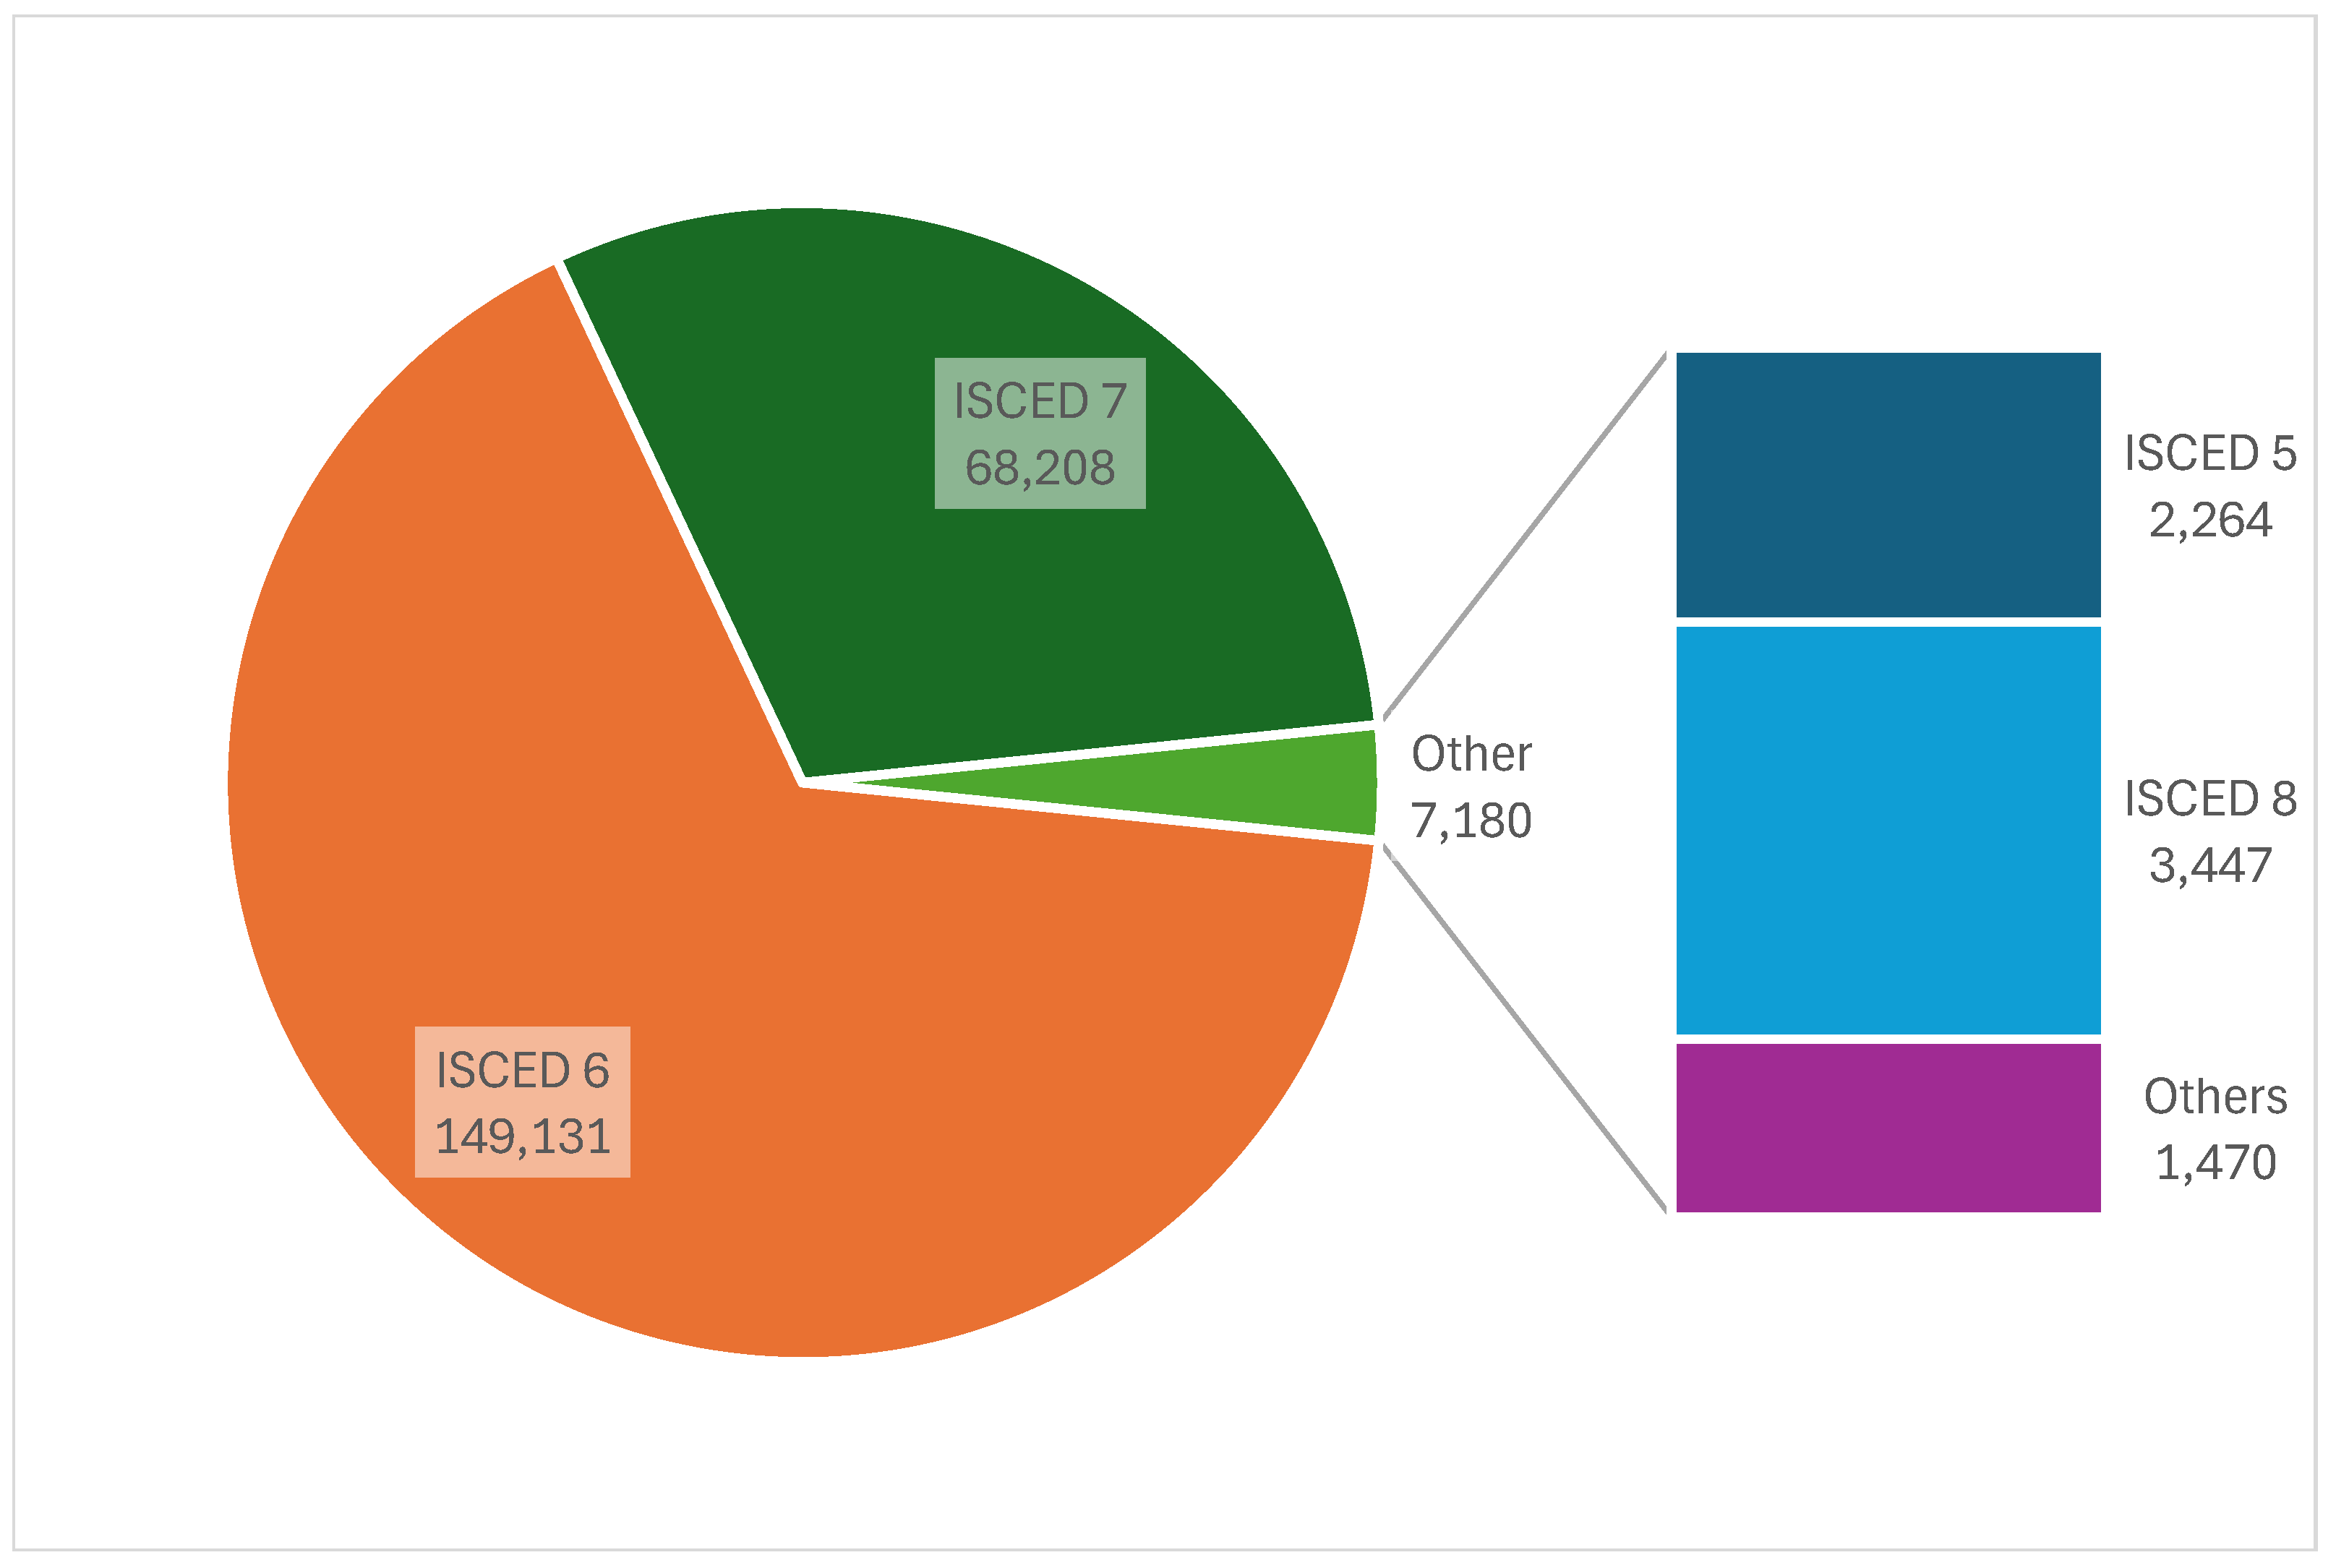
Figure 3.
Yearly incoming students at ISCED levels 6 and 7. Source: ETER database at: https://eter-project.com/data/data-for-download-and-visualisations/database/.
Figure 3.
Yearly incoming students at ISCED levels 6 and 7. Source: ETER database at: https://eter-project.com/data/data-for-download-and-visualisations/database/.
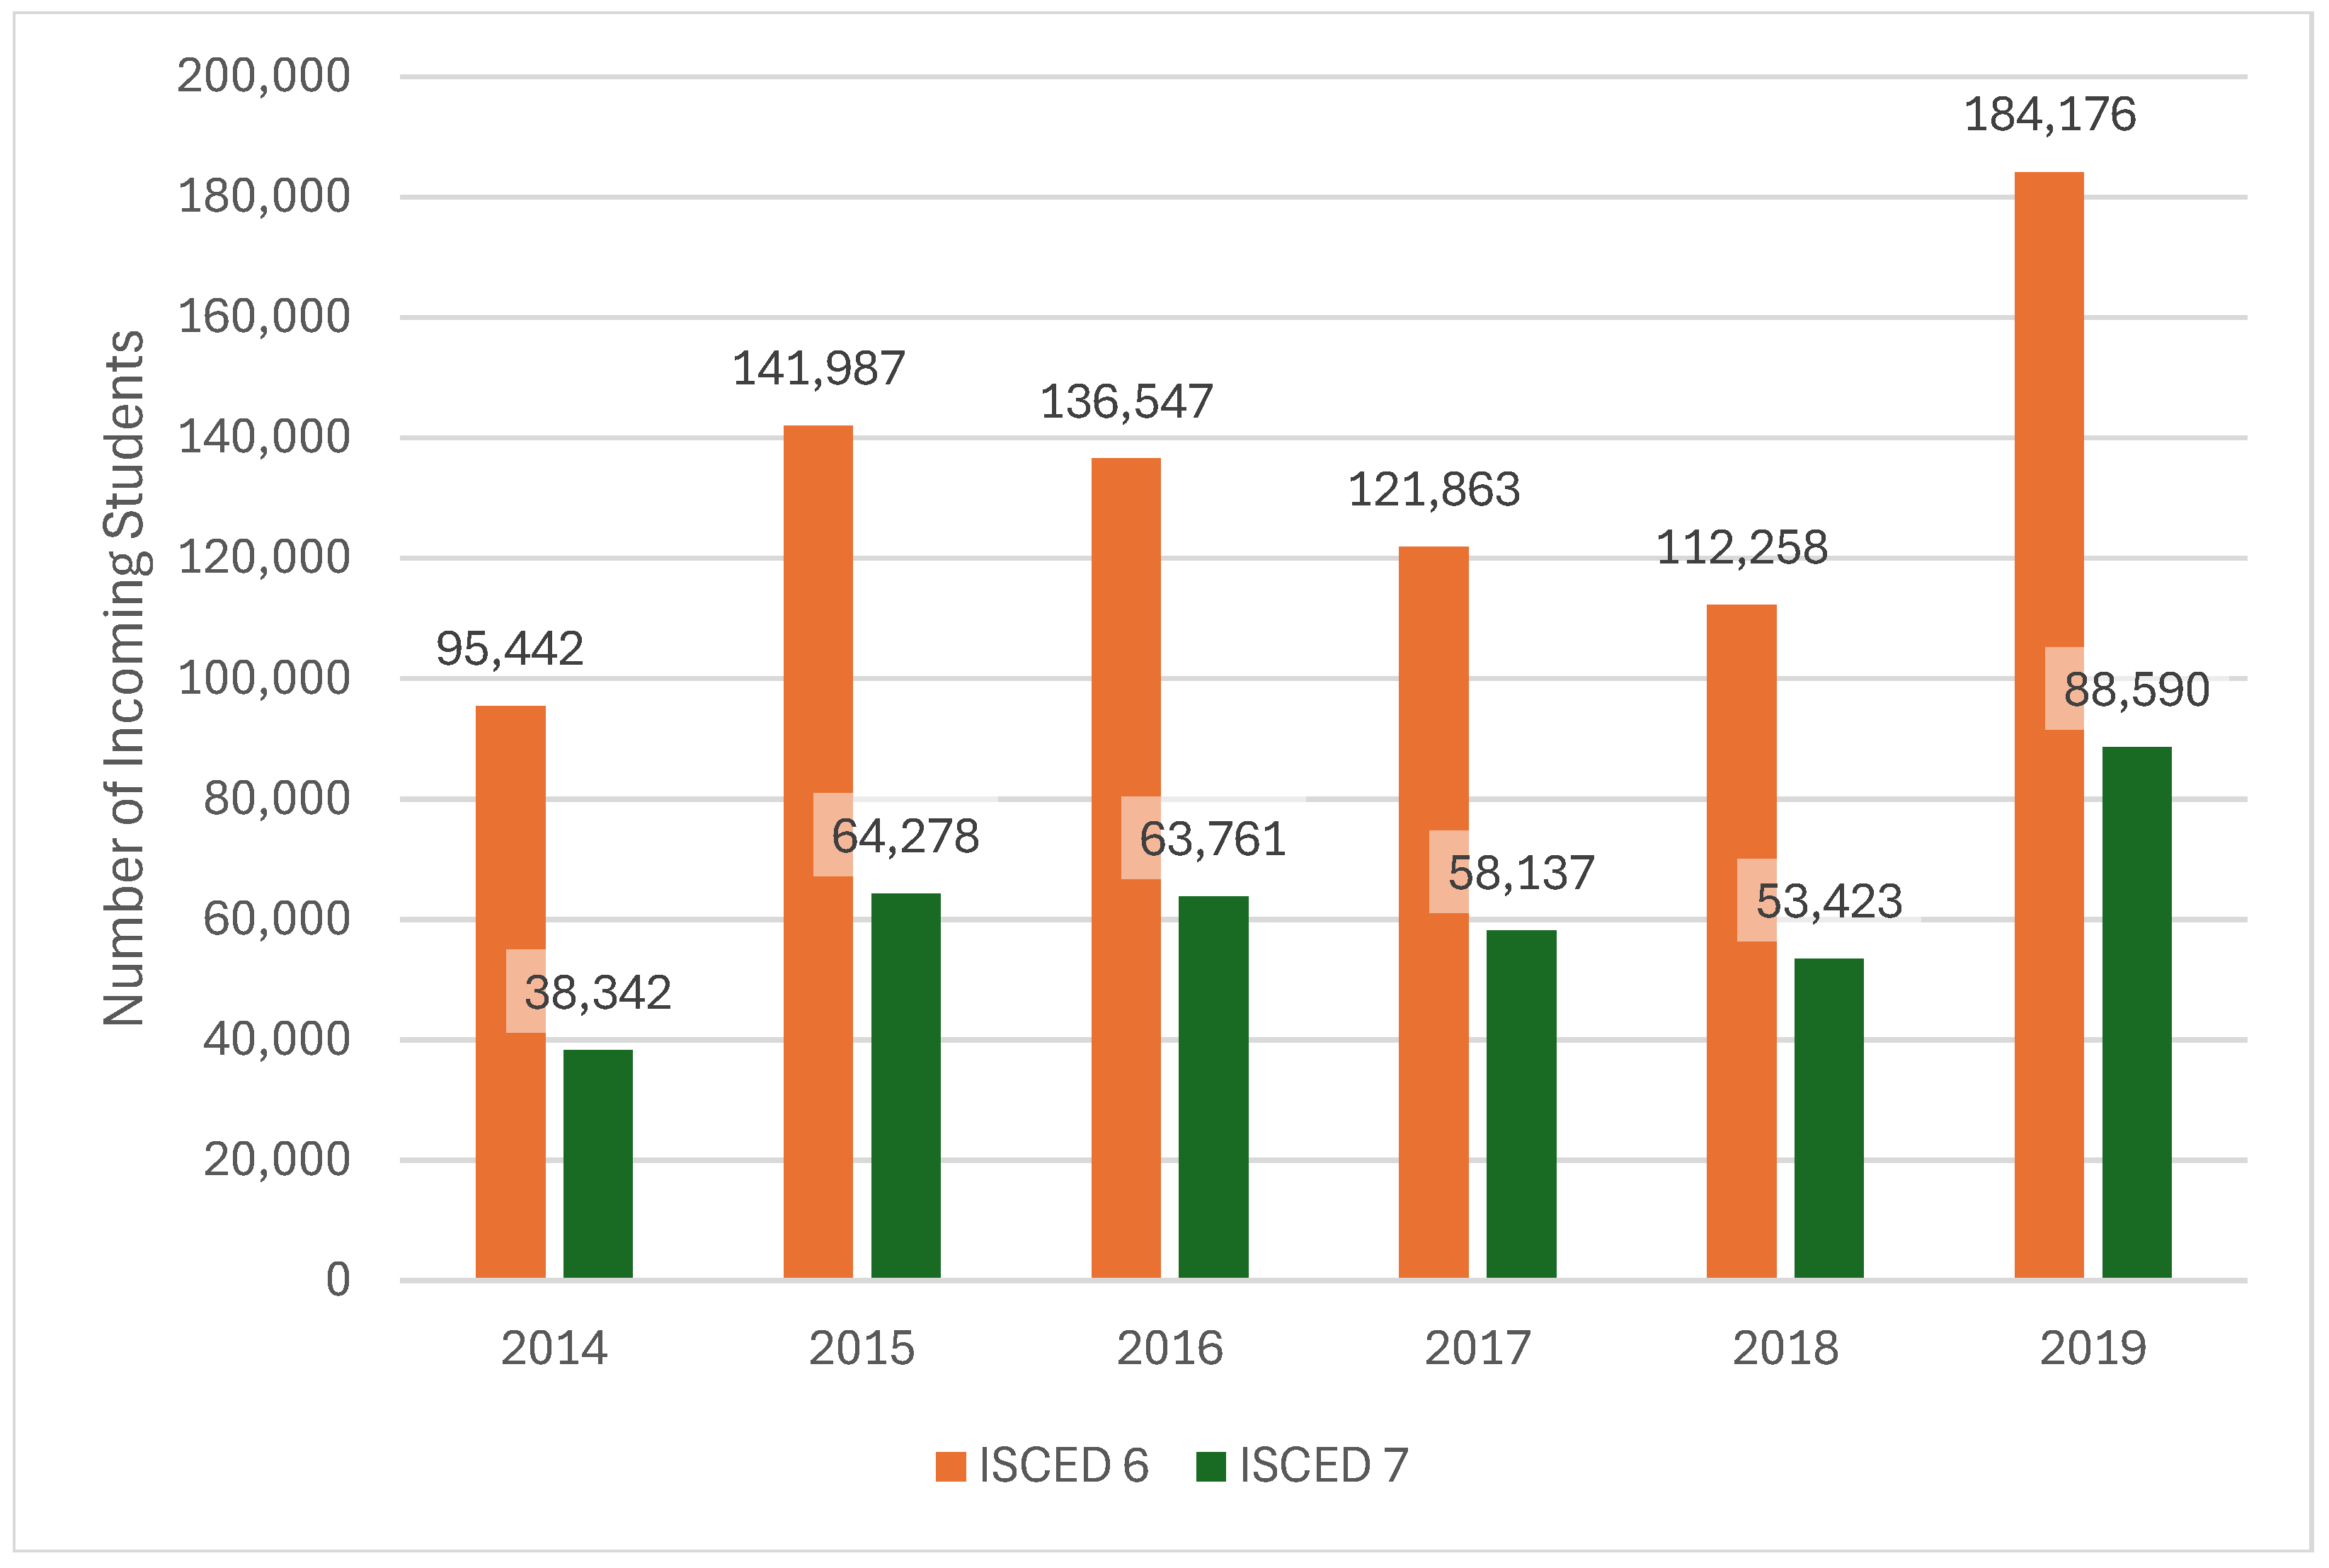
Figure 4.
Hotspot analysis of the average per year number and rate of incoming Erasmus students for all educational levels, ISCED 6 and 7, separately for 2014-2019.
Figure 4.
Hotspot analysis of the average per year number and rate of incoming Erasmus students for all educational levels, ISCED 6 and 7, separately for 2014-2019.
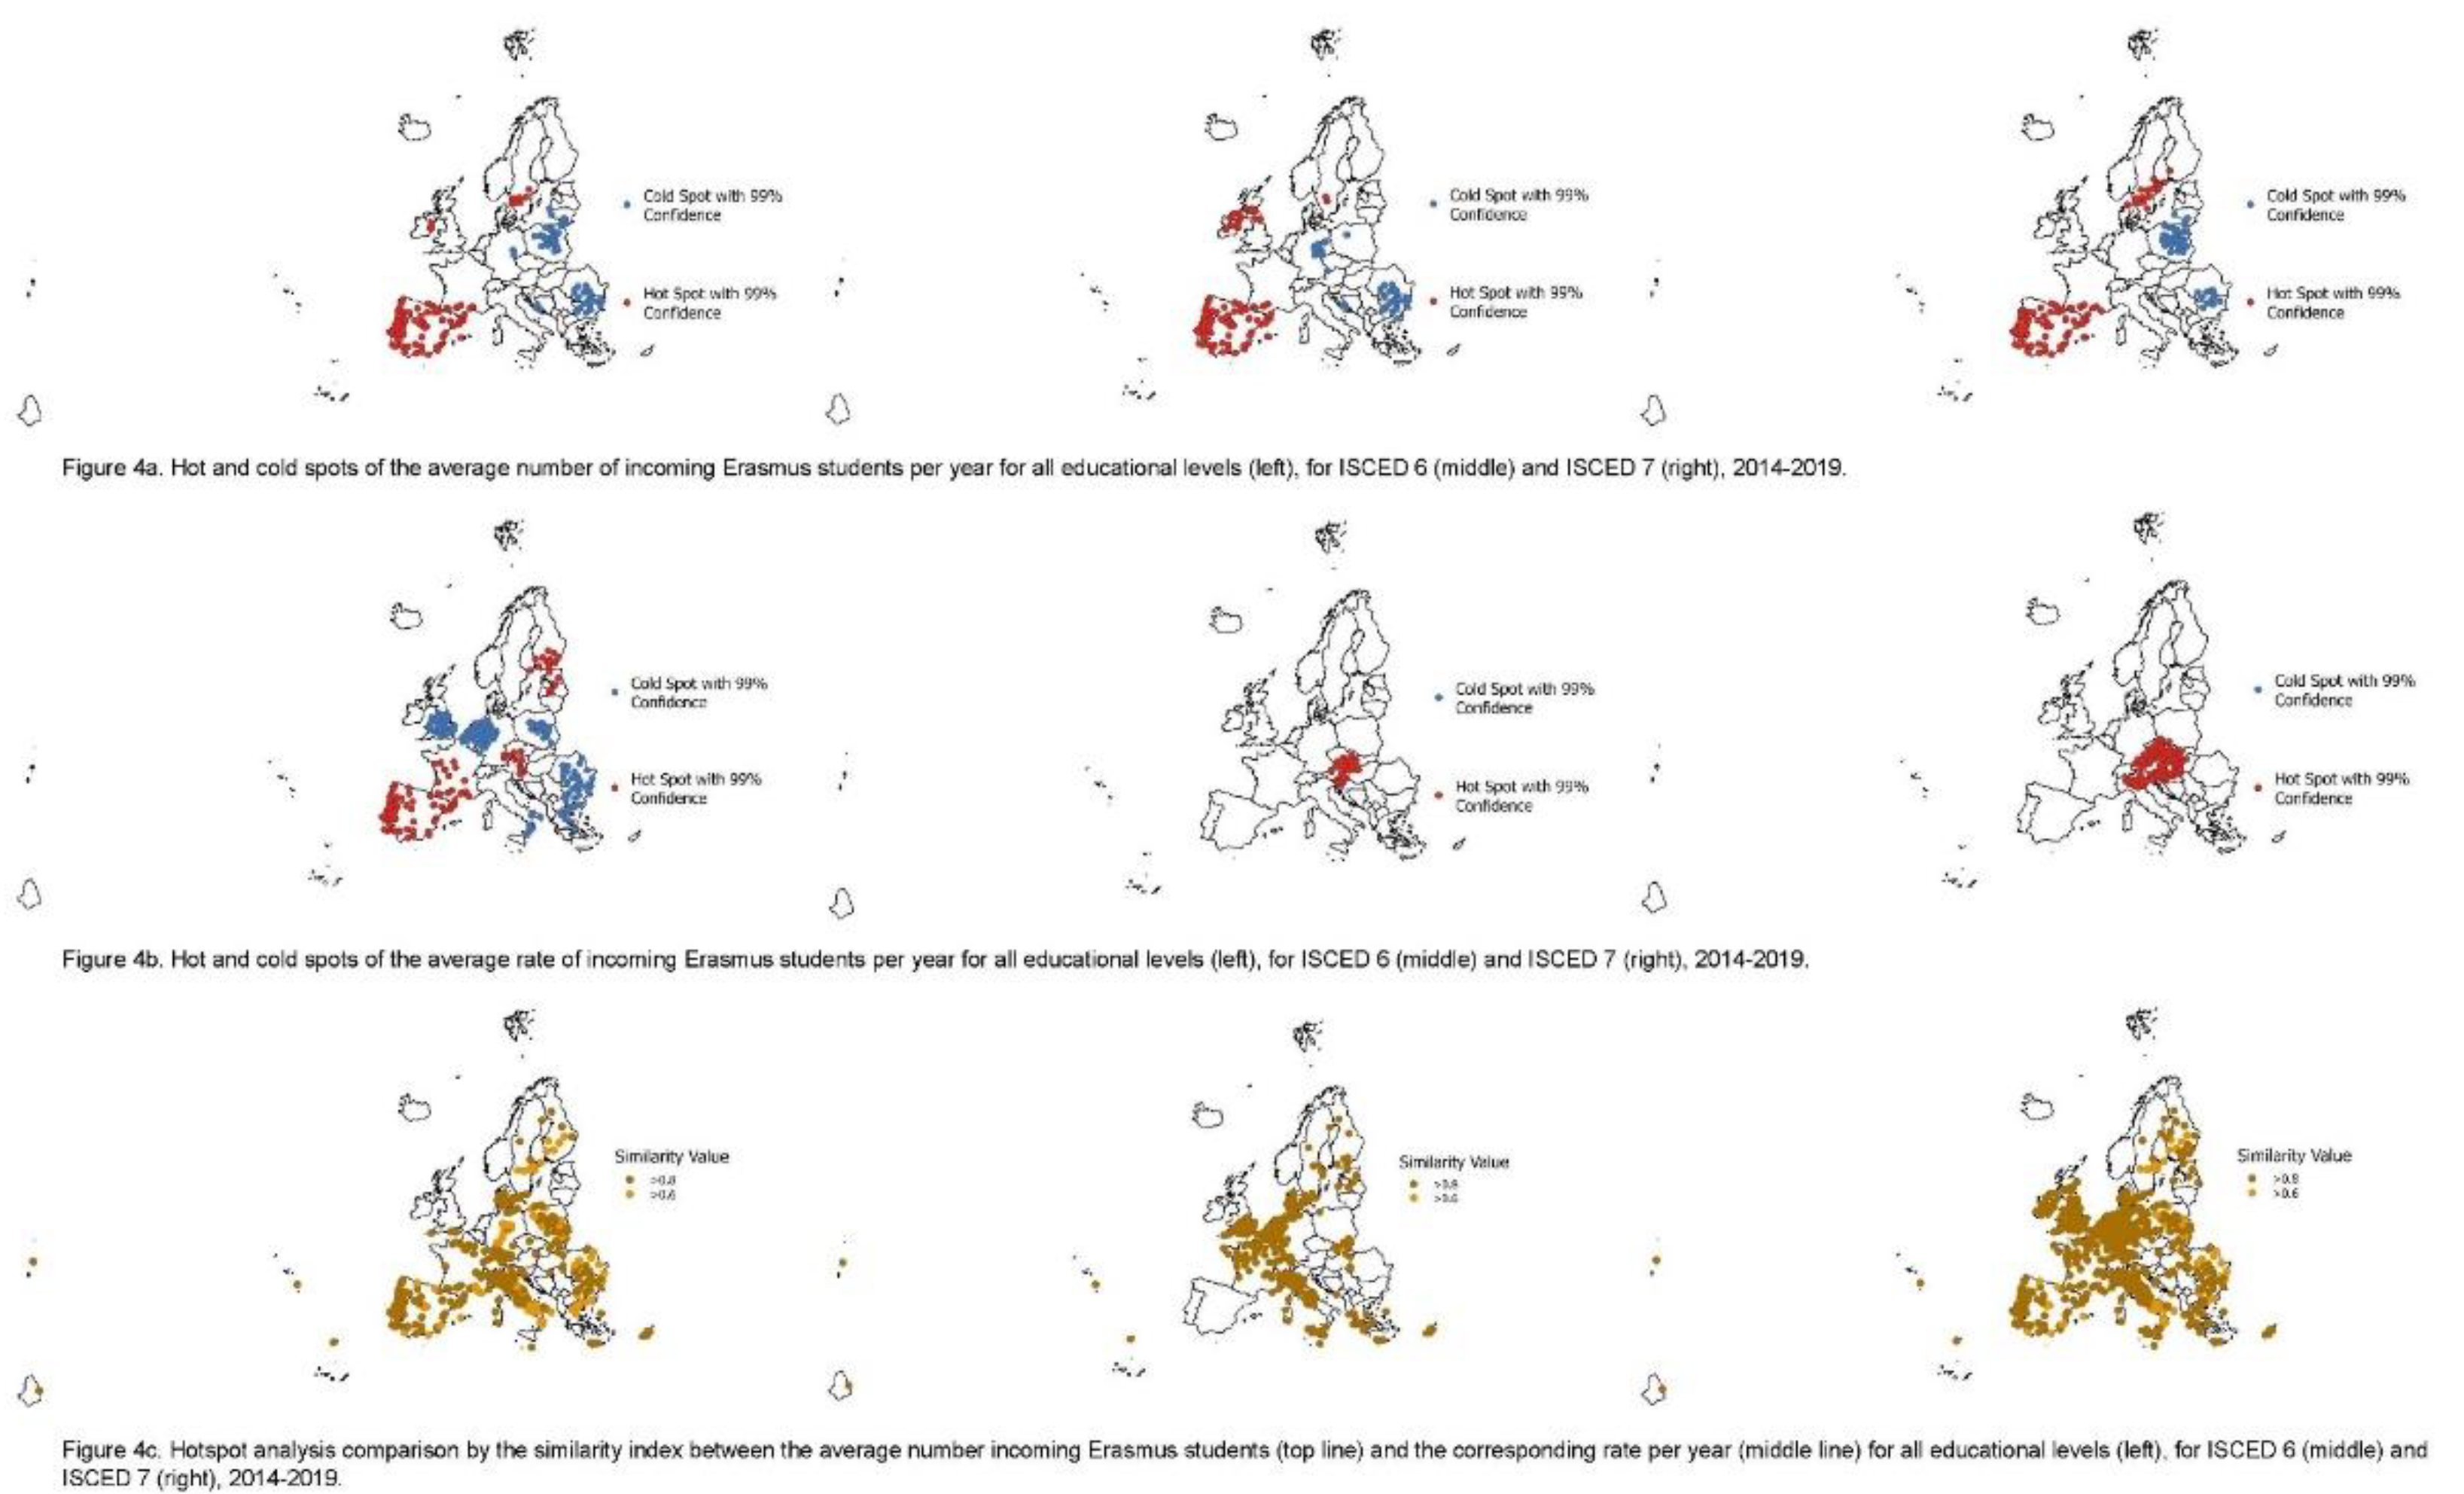
Figure 5.
The regional champions of internationalisation: Regional residual u_0j and confidence intervals on incoming Erasmus students per 1,000 students.
Figure 5.
The regional champions of internationalisation: Regional residual u_0j and confidence intervals on incoming Erasmus students per 1,000 students.
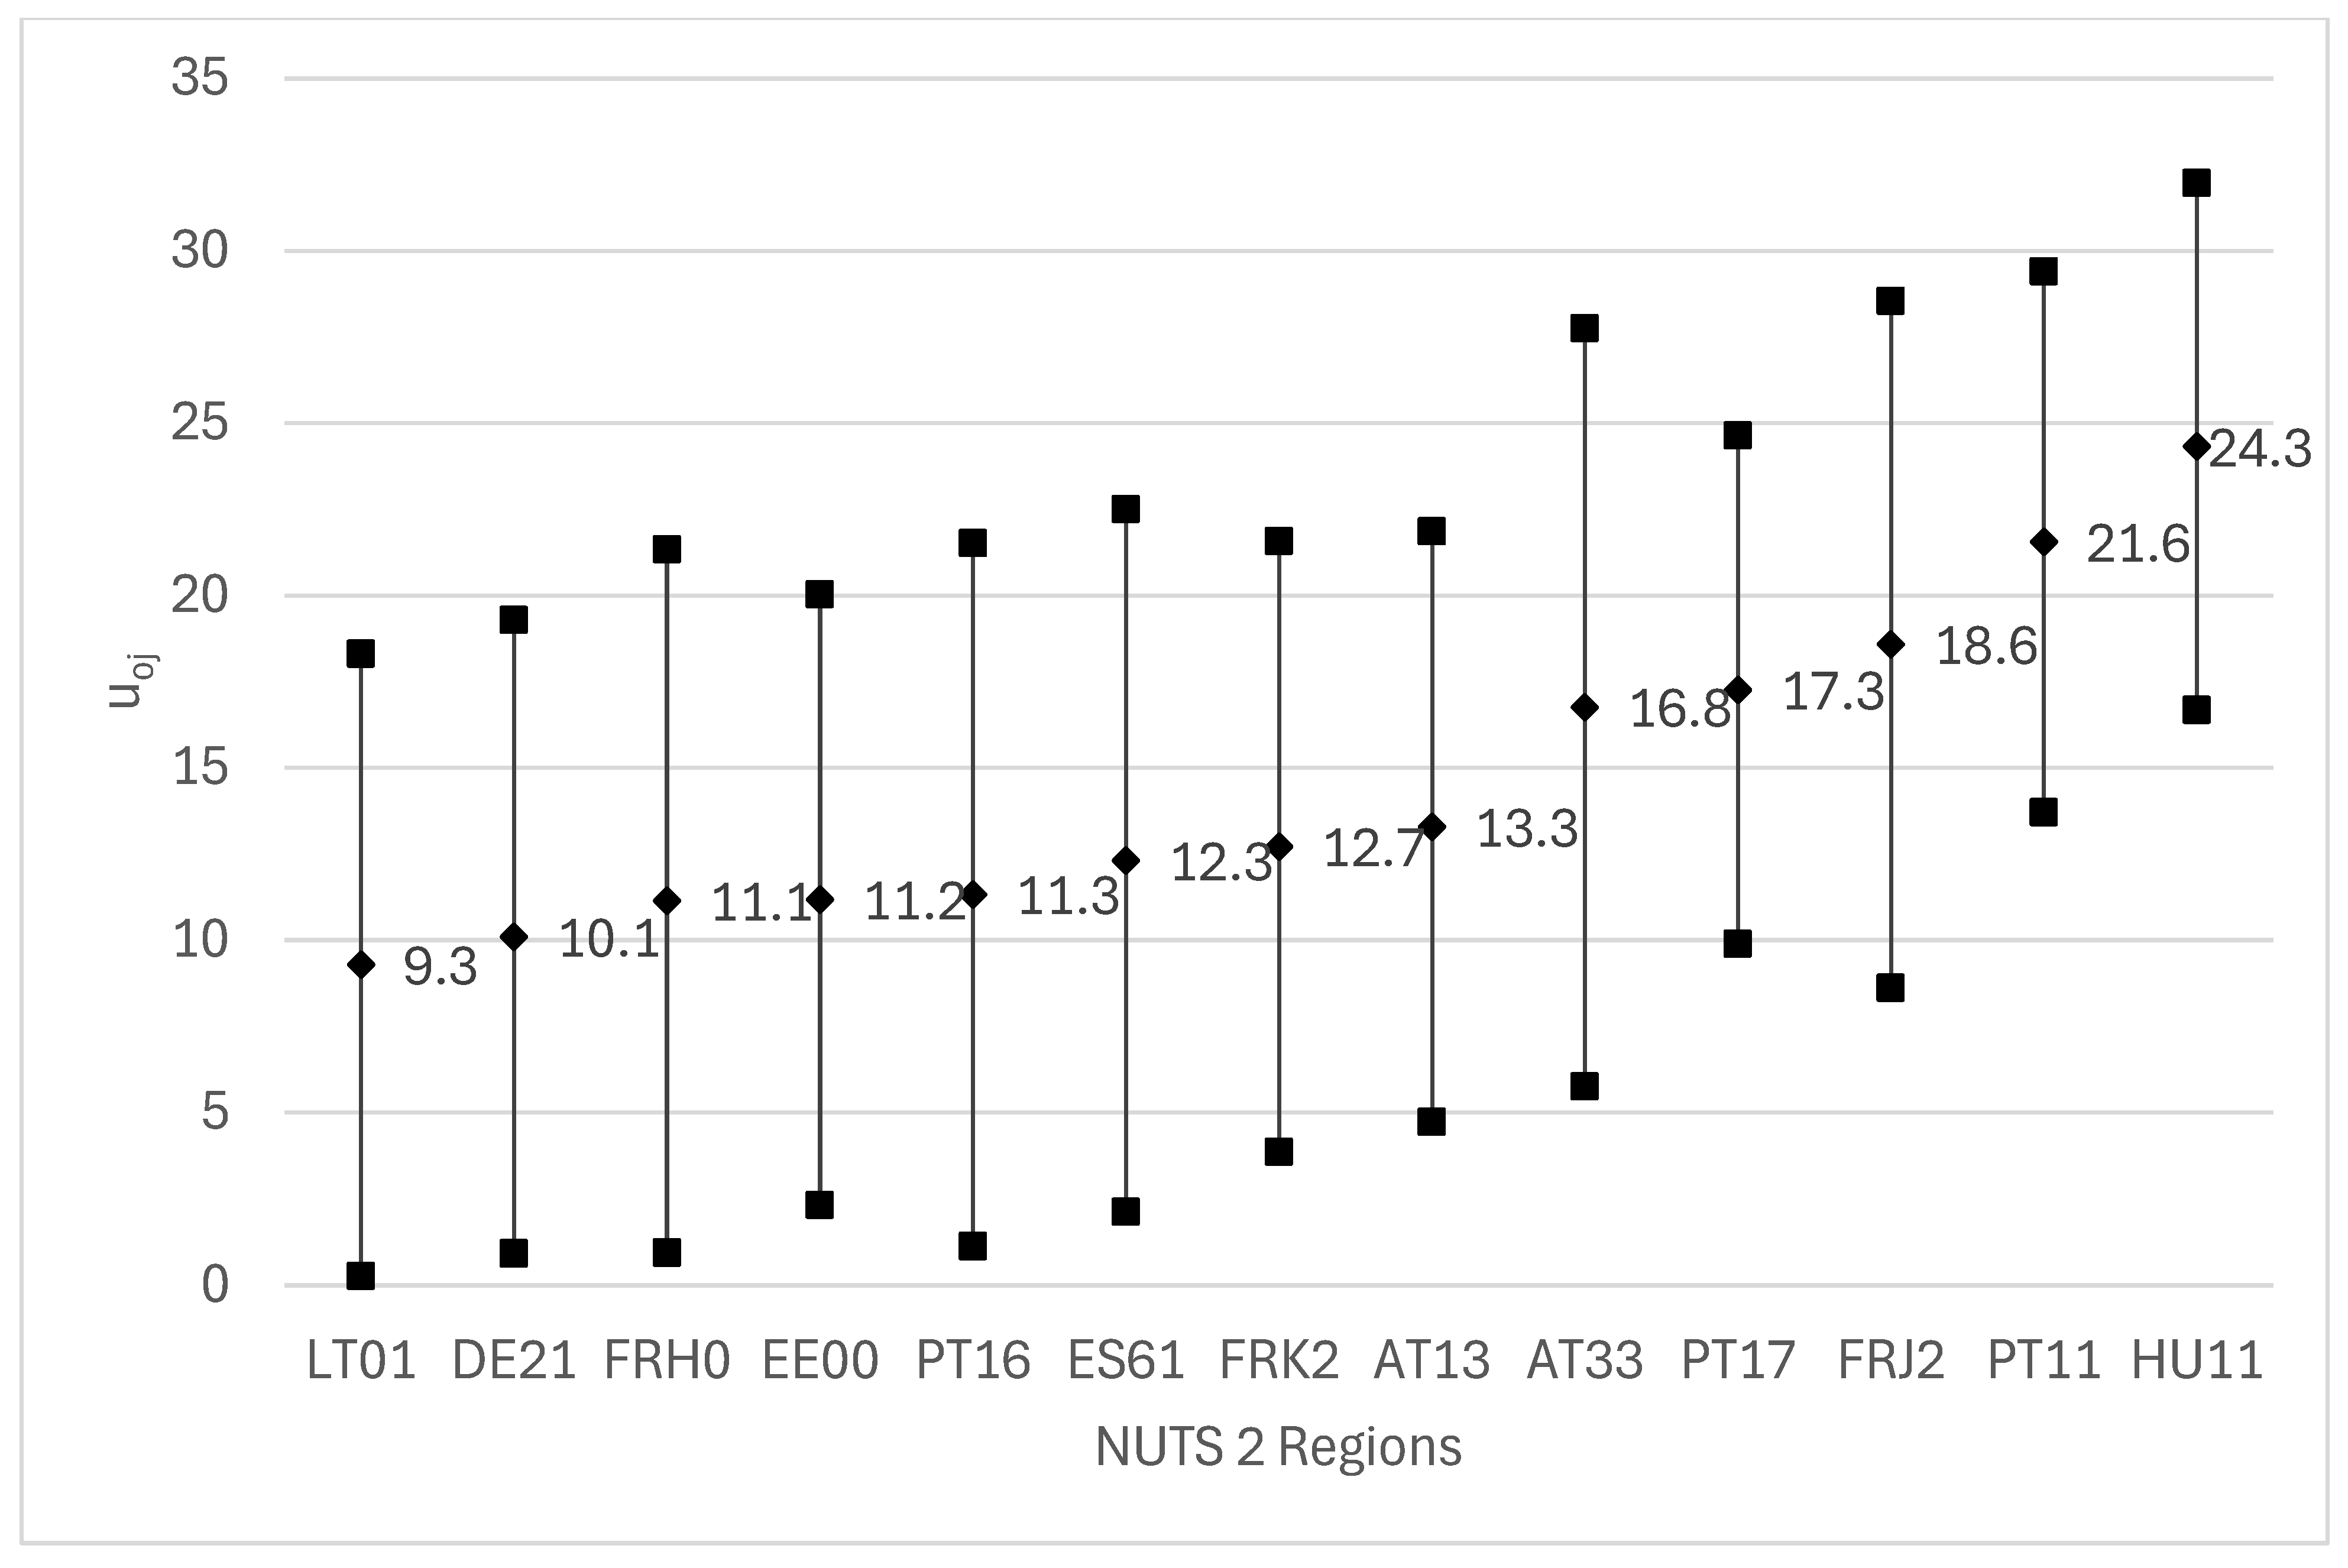

Table 1.
The variables used in the analyses, their definitions and descriptive statistics.
| Variable name | Definition | Data source | Mean | Standard deviation | Number of valid cases |
| Dependent variables | |||||
| D_Erasmus_rate_all | ETER | 16.885 | 25.2537 | 2,066 | |
| D_Erasmus_rate_6 | ETER | 63.746 | 813.342 | 1970 | |
| D_Erasmus_rate_7 | ETER | 28.441 | 81.727 | 1902 | |
| Independent HEI level variables | |||||
| I1_Teaching_Load | ETER | 10.846 | 12.316 | 1,816 | |
| I2_Fees | ETER | 2,128.6 | 3,542.7 | 1,237.0 | |
| I3_Research_intensity | ETER | 0.041 | 0.731 | 1,983 | |
| I4_Research_excellence |
|
CWTS | 0.025 | 0.054 | 2,066 |
| I5_Research_reputation | ETER | 1.246 | 13.696 | 1,970 | |
| Control HEI level variables | |||||
| C1_Size | Total number of 1,000 students ISCED 5-8 | ETER | 7.605 | 1.107 | 2,041 |
| C2_Decentralisation | Dummy variable, 1=multi campus HEI, 0=single campus | ETER | 0.277 | 0.448 | 2,065 |
| C3_Legal | Dummy variable, 1=Public or government supported HEI, 0=All other legal forms | ETER | 0.262 | 0.440 | 2,054 |
| Regional context variables | |||||
| R1_Urban | Population density of the NUTS2 region in which the HEI is established (inhabitants per km2) | Eurostat demo_r_d3dens |
711.931 | 1,608.062 | 2,038 |
| R2_Employment_rate | Employment rate of the NUTS2 population aged 20–34 that has successfully completed tertiary education one to three years before the reference year and who are no longer in education or training. | Eurostat edat_lfse_33 |
83.687 | 11.686 | 2,025 |
| R3_Regional_earnings | The compensation received by the employees is recorded in the allocation of the primary income account of households divided by the number of employees, in thousand euros | Eurostatnama_10r_2hhinc and nama_10r_2emhrw |
20.729 | 11.396 | 1,910 |
| R4_Educat_Attainments | The proportion of higher education graduates in the population | edat_lfse_04 | 43.389 | 12.444 | 2,058 |
| R5_Research_excellence | % of the academic publications of the HEIs in the region that are in the top 1% of most cited publications | CWTS | 1.688 | 0.614 | 1,794 |
Table 2.
Results of the different estimated multilevel models.
| Model 1 (the null model) |
Model 2 | Model 3 | Model 4 | Model 5 | |
| Dependent variable | Erasmus_rate_all | Erasmus_rate_all | Erasmus_rate_all | Erasmus_rate_6 | Erasmus_rate_7 |
| Fixed effects – HEI specific | |||||
| I1_Teaching_Load | -0.308*** | -0.354*** | -4.647 | -0.209 | |
| I2_Fees | 0.688** | --- | --- | ||
| I3_Research_intensity | 0.264 | 0.015 | 2.767 | 0.715** | |
| I4_Research_excellence | 41.436** | 37.126** | -13.683* | 0.897 | |
| I5_Research_reputation | 0.817** | 0.625** | 55.691*** | -1.706 | |
| C1_Size | -0.255** | -0.157** | -3.901 | -0.586* | |
| C2_Decentralisation | -1.072 | -1.091 | 19.578 | 5.467 | |
| C3_Legal | -3.364 | 1.054 | -39.263 | -0.513 | |
| Fixed effects – region specific | |||||
| R1_Urban | 3.797E-5 | 0.001 | -0.033 | -0.003 | |
| R2_Employment_rate | .062 | 0.045 | -4.726 | 0.022 | |
| R3_Regional_earnings | -0.360** | -0.206 | 13.803** | -0.649 | |
| R4_Educat_Attainments | 0.178** | 0.252** | 9.899** | 0.808** | |
| R5_Research_excellence | 6.184** | 3.345 | -104.704 | 19.075* | |
| Constant | 15.763*** | 2.977 | 2.176 | -32.031 | -16.929 |
| Statistics | |||||
| -2 Log-likelihood | 19,110.109 | 7,588.362 | 12,357.132 | 20,091.618 | 13,659.942 |
| ) | 0.087 | 0.195 | 0.162 | 0.158 | 0.111 |
| HEIs (level 1 observations) | 2,066 | 860 | 1,355 | 1,312 | 1,271 |
| Regions (level 2 observations) | 277 | 123 | 154 | 154 | 154 |
Disclaimer/Publisher’s Note: The statements, opinions and data contained in all publications are solely those of the individual author(s) and contributor(s) and not of MDPI and/or the editor(s). MDPI and/or the editor(s) disclaim responsibility for any injury to people or property resulting from any ideas, methods, instructions or products referred to in the content. |
© 2025 by the authors. Licensee MDPI, Basel, Switzerland. This article is an open access article distributed under the terms and conditions of the Creative Commons Attribution (CC BY) license (http://creativecommons.org/licenses/by/4.0/).
Copyright: This open access article is published under a Creative Commons CC BY 4.0 license, which permit the free download, distribution, and reuse, provided that the author and preprint are cited in any reuse.


