Submitted:
18 March 2025
Posted:
18 March 2025
You are already at the latest version
Abstract
Dam and Reservoir (D&R) systems during their long history suffered from hundreds of failures, whose mechanisms are accelerated by climate change. To assess the vulnerability of D&R systems to climate change a methodology is presented based on literature that is consistent with the EC technical guidelines. This methodology includes (i) the typologization of the groups of the potential climate hazards, the components of the D&R systems, and the impacts of the groups of hazards on D&R systems, and (ii) the presentation of climate indicators that are usually employed in D&R systems. The typologization of the methodology facilitates its fast application and its comparison with other methodologies. The methodology is applied to the Almopeos D&R system in Greece. Three General Circulation Model and Regional Climate Model combinations from the EURO-CORDEX ensemble are selected, bias-corrected against ERA5Land and used to estimate the values of the selected indicators and thus to quantify the potential climate impacts. The vulnerability analysis identified three groups of climate hazards that are (i) temperature increase and extreme heat, (ii) precipitation decrease, aridity and droughts and (iii) extreme precipitation and flooding, as potential significant hazards, for which a detailed risk assessment is required to propose the required adaptation strategies.
Keywords:
Climate Change Adaptation
; Dams and Reservoirs
; Climate Proofing
; Climate risk and vulnerability assessment
1. Introduction
Dams and Reservoirs (D&R) are fundamental water infrastructure systems that serve multiple purposes/functions simultaneously, including water supply for domestic, agricultural, industrial, and community use; flood control; recreation; and clean, renewable energy through hydropower [2]. During their long history, D&R systems suffered from hundreds of dam failures that caused immense property and environmental damage and have taken thousands of lives. The typical dam failure modes are (i) overtopping, (ii) foundation defects, (iii) piping, (iv) cracking and (v) inadequate maintenance and upkeep; in U.S. the first tree modes account for approximately 34%, 30% and 20% of all U.S. dam failures [3]. The main failure modes for earthfill dams can be categorized as follows: (i) overtopping, (ii) seepage, (iii) structural and (iv) combined [4,5,6], and for gravity dams as: (i) sliding, (ii) overturning and (iii) structural failures [7]. In the UK the Environment Agency performed a project entitled “Modes of dam failure and monitoring and measuring techniques”, in which 48 hazards (hazard: “situation with a potential for human injury, property damage or other undesirable outcome”) were identified and correlated with more detailed failure modes (failure mode: “the mechanism by which a hazard leads to failure of a dam” and failure: ‘’a major uncontrolled and unintended release of retained water, or an event whereby a dam is rendered unfit to safely retain water because of a total loss of structural integrity”) as follows: (i) catastrophic overtopping, (ii) dam breach, (iii) foundation failure of concrete and embankment dam, (iv) instability of concrete or embankment dam, (v) overflow failure, (vi) structural failure of concrete dam and embankment dam (deterioration of core or load exceedance), uncontrolled flow due to appurtenant works failure and (vii) uncontrolled seepage [8].
Climate change and climate hazards affect dam failure modes often via accelerating their failure mechanisms; for example, increased droughts and increased extreme precipitation increase the risk for piping and overtopping failure, respectively [9]. Moreover, new failure modes may arise due to climate change, or current ones may become obsolete [10]; for instance, in the context of geological hazards, studies have confirmed the influence of climate change on slope stability [11]. A slope failure event near a dam site could eventually entail a part of the terrain falling into the reservoir or impacting the dam, which could trigger overtopping and eventually a dam failure. Atkins [9] focused on climate hazards, clarified that the failure mode “describes the way in which problems caused by climate can cause significant operation problems or perhaps physical failure of a particular structure (of a D&R system)” and provided the following list of problems/failure that are practically the “failure modes” [12]: (i) for earthfill dams: erosion of upstream face or shoulders, erosion of crest and downstream face, piping, slumping or settlement of embankment, desiccation of clay core and blankets and failure of (or damage to) liners, (ii) for concrete dams: cracking, spalling and joint failure on dam face/structure, overturning, sliding and foundation failure, (iii) for overflow structures: overwhelming/blocking of structure and damage or scour of spillway/stilling basin and (iv) for ancillaries: damage to tunnels, valves or draw off facilities, expansion/seizure of metal components or electronic failure and other including expansion/seizure of metal components and electronic failures. To clarify the relationship “hazard-impact-failure or damage” the following example is considered: “Increased precipitation results in increased flowrates into the reservoir that can cause dam overtopping”. The “climate hazard” is the increased precipitation, the “direct impact” is the increased flow leading to increased water level that eventually overpasses the capacity of the spillway (the mechanism) and leads to dam overtopping (the failure). Climate hazards can also combine; for example, the climate hazard “increased temperature – heat waves” can cause the effect “heat stress/disease on certain tree species” that results in their uprooting during storm events (the storm is the second climate hazard), which may lead to spillway blockage (the damage) and further to dam overtopping (the failure). The sequence of these combined effects can be best described using impact chains that are conceptual models capturing hazard, vulnerability, and exposure factors that lead to a specific risk [13]; impact chains are often employed in Climate Risk and Vulnerability Assessment (CRVA).
Table 1 shows the general categories and types of climate hazards for water infrastructure, which include D&R systems, following the Intergovernmental Panel on Climate Change (IPCC) categorization [14] and the typology proposed by Stamou [15,16,17].
Table 1 depicts that there are five main categories of hazards: Heat and Cold (HC), Wet and Dry (WD), Wind and Air (WA), Coastal (C) and Snow and Ice (SI) that are further grouped into 24 types of hazards. Climate change effects are expected to intensify in the Mediterranean region during the 21st century [18]. Mean air and sea temperature (HC1) and their extremes (HC2 and HC3) will continue to increase more than the global average and heat waves (HC2) to intensify in duration and peak temperatures [19]; mean precipitation (WD1) will decrease by 4–22% [19], droughts (WD6) will become more severe, more frequent and longer and conditions will be drier [20]; heavy precipitation (WD2) and rainfall extremes will likely increase in the northern part of the Mediterranean region, potentially accompanied by an increase of flash floods (WD3) [19]; large wildfires (WD9) will increase [21]; extreme winds (WA2) intensity will increase [19]; erosivity will increase [22]; sea level rise will increase enhancing the risk of coastal flooding (C2), erosion (C3) and saline intrusion (C4) [19].
There are important research works in the literature dealing with climate change effects on D&R systems. Atkins [9] carried out a UK Government research project aiming at providing a comprehensive, up to date review of the impacts of climate change on dams and reservoirs in England and Wales, which takes advantage of the projections and tools that are available from UK Climate Projections 2009 (UKCP09), and other available research. The report of this project entitled “FD2628 Impact of Climate Change on Dams & Reservoirs - Final Guidance Report” contains both an evidence-based identification of the potential impacts of climate change on D&R systems, and guidance that practitioners (operators, owners and policy makers) can make use of easily and quickly to provide a robust and auditable assessment of the risks of climate change and the implications it has for their strategic asset management processes. Hughes and Hunt [12] presented earlier “A Guide to the Effects of Climate Change in Dams” that summarizes the findings of Atkins’ project. ICOLD [23] assessed the role of D&R systems in adapting to the effects of global climate change, determined the threats, and potential opportunities, posed by global climate change to existing D&R systems, and then recommended the following measures to mitigate against or adapt to the effects of global climate change: (1) Adopt a whole-of-system approach, (2) apply an adaptive management process, and (3) collaborate with a wide range of disciplines, interest and stakeholders (including engineers alongside decision makers, politicians, natural resource scientists, social scientists, economists and the greater community) in the assessment of enduring and effective adaptation options. Fluixá-Sanmartín et al. [10] presented a comprehensive and multidisciplinary review of the impacts of climate change on dam safety following the risk analysis approach in which all variables concerning dam safety, from the hydrological loads to the consequences of failure, and their interdependencies are included in a comprehensive way. The purpose of this review was to serve as a dam safety management supporting tool to assess the vulnerability of the dam to climate change, i.e. the additional risk imposed by climate change effects, and to define adaptation strategies for new climate scenarios under an evolutive dam risk management framework. Mallakpour et al. [24] examined possible changes in flood hazard under the projected climate change using the 100-year flood concept for major dams over California focusing on hydrologic failure probability that relies on the hazard component of the overall risk (i.e. changes in the flood frequency and magnitude); their results showed that hydrological failure probability is likely to increase for most dams in California by 2100. Rocha et al. [25] assessed the impacts of future climate changes on (1) water resources availability (that was analyzed using Water Exploitation Index), (2) quality (focusing on phosphorus loads as this is the limiting nutrient for eutrophication) and (3) irrigation needs for the multipurpose reservoirs Monte Novo and Vigia in southern Portugal. Their results indicated that climate change will negatively impact water availability in both reservoirs, especially under RCP8.5; in Monte Novo reservoir, future domestic water supply could be constrained by water quality problems related to phosphorus loads and in Vigia reservoir the extensive water exploitation will lead to water scarcity problems, mainly as Vigia reservoir on present-day conditions is restrictive on irrigation requirements. Moreover, they suggested climate change adaptation strategies, especially for the agricultural sector. Ghimire et al. [26] examined how the level of auxiliary spillway erosion varies depending on its material and structural properties; they performed a sensitivity analysis to distinguish the variability in the auxiliary spillway erosion for the Willow Creek Dam in Montana considering the geologic materials, geometric design parameters, and hydrologic data and concluded that the inflow hydrograph had the largest impact on erosion, while the representative diameter, spillway width, and side slope ratio had intermediate levels of impact on erosion. Ghimire and Schulenberg [27] evaluated the impacts of climate change on earthen dams and spillways by conducting a post-failure analysis of the two cascading dams, Edenville Dam and Sanford Dam, in Michigan, USA, that failed in series in May 2020; their overall results showed that (1) extreme storms and flooding are associated with the increase in temperature and precipitation rates, impacting overall dam safety, and (2) careful precautions should be undertaken before any of these catastrophic dam events occur. Moreover, they noted that their analysis is useful for the dam agencies as they reconsider their guidelines and policies for future updates. Jusko et al. [28] studied the enhanced siltation rate and the constant relative contribution of unpaved roads to the siltation of a small water reservoir in the period 1990–2014, with pronounced climate change, compared to the reference period 1970–1989. Despite expectations, the rates of siltation were almost unchanged in both periods, because the positive changes in vegetation cover (the forest expansion and changes in forest management practices) offset the enlarged rain erosivity. Wilk et al. [29] used mathematical modeling to examine the spatial and temporal distribution of sediment particles from the Carpathian Mts. catchment of Raba River to the drinking water reservoir Dobczyce in Poland; their calculations showed 1i) a large variability of the sediment load between months and (2) the predicted climate changes will cause a significant increase of mineral fraction loads (silt and clay) during months with high flows. Sant Anna et al. [30] presented a hydrologically-driven approach to climate change adaptation aiming at supporting the reoperation of D&R systems that is organized around (1) the use of a large ensemble of GCM hydro-climate projections to drive a climate stress test, (2) the bottom-up clustering of those hydrologic projections based on hydrologic attributes that are both relevant to the region of interest and interpretable by the operators, and (3) the identification of adaptation measures for each cluster after developing a one-way coupling of an optimization model with a simulation model. The climate impact assessment was illustrated with the multipurpose multi-reservoir system of the Lievre River basin in Quebec in Canada and their results showed that cluster-specific, adapted, operating rules can improve the performance of the system and reveal its operational flexibility with respect to the different operating objectives. MackTavish et al. [31] investigated the climate risks impacting dams in Canada through a literature review, stakeholder interviews and a workshop, and validated by an advisory panel of industry experts; their literature review showed that climate risks to dams include (1) changes to the hydrologic cycle potentially impacting design loads and Inflow Design Floods (IDFs), (2) changes to operations and maintenance to respond to different operating needs, frequencies and conditions, (3) changes to foundations due to melting permafrost, (4) issues with site access due to storms and extreme weather events, (5) additional stress on water supply impacting dam operations and functionality, and (6) impacts to hydropower generation due to a less predictable hydrologic cycle. The National Research Council Canada (NRC), recognizing the need to adapt the new and existing infrastructure and operation procedures to withstand increased climatic loads and degradation mechanisms, performed a research project (1) to identify knowledge gaps in the adaptation of Canadian dams to climate change, and (2) to develop future research directions for the NRC’s Construction Research Centre in the areas of climatic data requirements, operations, water quality, monitoring, geotechnical/structural aspects and material durability [32]. This project that combined a literature review, interviews, discussions and consultations with dam experts and professionals, as well as a review of the current regulations, identified the following eleven groups of gaps as potential research directions: (1) quantification of climate change uncertainty, (2) tools to forecast inflows and outflows, (3) operations optimization, (4) guideline for managing ice and break-up events, (5) development of an integrated water quality model, (6) structural stability and integrity of concrete dams, (7) evaluation of potential acceleration in deterioration of concrete dams and preventative measures, (8) satellite-based dam monitoring, (9) risk assessment, (10) corrosion of penstocks and steel gates, and (11) structural stability and integrity of earthfill dams. Krztoń et al. [33] analysed three projections of representative concentration pathway (RCP 4.5, 6.0 and 8.5) for the period 2061–2080 and found that the mean annual temperature at dam reservoir locations will increase by 3.06 °C to 4.74 °C from present; the highest projected increase of temperature was identified for dam reservoirs located in high latitudes of Northern Hemisphere, and therefore dam reservoirs located there will be most significantly affected. Brandesen [34] performed an analysis of climate change that may lead to risks to dam safety in Sweden using the results of a literature review considering the following driving climate parameters: (1) temperature, (2) precipitation, (3) wind with their combinations, and (4) sea level, which will generally increase except for the wind where the picture is so far unclear. About seventy impact chains were used to identify risks that can affect dam safety, and it was concluded that the results do not show any new risks, but primarily they are already known risks that may be exacerbated by climate change that is relevant to dam safety. Moreover, recommendations were made, mainly to authorities, industry organizations and dam owners, that include (1) the continuation of the efforts for the monitoring of climate change and the developing of climate indicators, (2) the consideration of climate change impacts in guidance and guidelines so that that it is integrated into the dam owners' regular dam safety work, the (3) analysis of risks due to climate change within the framework of the routines established for the regular dam safety work, and (4) the development of methods to establish climate indicators for extreme flows. Zhang and Shang [35] based on existing studies and environmental and climate data examined how environmental and climatic changes impact dam safety and proposed targeted measures to promote research on the role of D&R systems in local and regional climates and to ensure the sustainability of global dams. Lombi et al. [36] presented a methodology that considers the impact of climate change on both inflow hydrographs and initial reservoir water levels, and applied it to the Eugui Dam in the River Arga catchment in Spain using an ensemble of 12 climate models; their results showed an increase in (1) the maximum reservoir water level during flood events and (2) the overtopping probability in the RCP 8.5 scenario, especially in the period 2071–2100. Savino et al. [37] combined hydrological modelling (HEC-HMS) and regional climate projections (downscaled to the watershed scale and bias corrected to eliminate systematic errors) to assess the potential impact of climate change on the water availability at Brugneto Lake in northern Italy. Their analysis was based on climate projections derived from an ensemble of thirteen combinations of General Circulation Models and Regional Climate Models under the scenarios RCP4.5 and RCP8.5. Future water availability was predicted for short (2010–2039), medium (2040–2069), and long-term (2070–2099) periods and their results showed that (1) the uncertainty in reservoir inflow is primarily due to the uncertainty in future rainfall, and (2) a moderate reduction in water availability is expected for Brugneto Lake by the end of the current century, accompanied by modifications in the flow regime; these changes should be considered when planning future adaptation measures and adjusting reservoir management rules.
The design, construction and operation of D&R systems in most of the countries worldwide is carried out assuming stationary climatic and non-climatic conditions; moreover, current dam safety regulations aim at ensuring that D&R systems are designed, constructed, maintained, operated and decommissioned with the best available technology and best practices, without taking into consideration and sometimes without even mentioning climate change in the relevant technical reports. However, in today's changing climate, the assumptions of stationary climatic baselines may no longer be appropriate for the long-term design and operations of D&R systems [32]; moreover, the research works that were summarized previously demonstrated that climate change should be considered in the design and operation of D&R systems. In Europe, this consideration became evident by the European Commission [38] which released in 2021 “The Technical Guidance on the Climate Proofing of Infrastructure in the Period 2021-2027” aiming at fostering the development of resilient infrastructure. This guidance is principally designed for project developers and experts involved in the preparation of infrastructure and additionally, it serves as a valuable resource for public agencies, implementation partners, investors, stakeholders, and others. Now, infrastructure must be developed by incorporating a methodology for climate proofing (which is virtually a CRVA) that is divided into two pillars that are (1) mitigation and (2) adaptation, and for each pillar it is applied in two phases that are (1) screening and (2) detailed analysis. In the first phase of the adaptation methodology a vulnerability assessment is carried out to decide whether the vulnerability of the infrastructure under investigation is high enough to justify proceeding to the detailed analysis that includes the risk assessment and the assessment of adaptation measures. Stamou et al. [39] developed a CRVA methodology for water infrastructure in the frame of the emblematic national project CLIMPACT (https://climpact.gr/main/) that is based on a literature survey and the technical guidelines by the European Commission, which was applied indicatively to a wastewater system in Greece. The methodology consists of the following steps: (1) description of the infrastructure, (2) climate change assessment, (3) vulnerability assessment, (4) risk assessment, and (5) assessment of adaptation measures; the vulnerability assessment includes the first three steps (screening phase). In this work the procedure of the vulnerability assessment for D&R systems is presented based on [39] and it is applied to a specific D&R system in Greece. This paper is structured into four main sections. Section 1 provides the introduction, section 2 discusses the materials and methods that include the description of the procedure for D&R systems and the case study, section 3 deals with the application of the vulnerability assessment to a D&R system in Greece with preliminary estimations, results, and discussion and Section 4 offers a summary of the key conclusions drawn from this research.
2. Materials and Methods
2.1. Methodology
The methodology for the assessment of the vulnerability of D&R systems to climate change consists of the following three steps: (1) Description of the D&R system, (2) climate change assessment, and (3i) vulnerability assessment.
The description of the D&R system includes the identification of its main components and the selection of their time scale, the identification of the potential hazards for the individual components of the D&R system and the selection of the corresponding indicators for each hazard and component. To perform this description, we need to know well the D&R system and the potential impacts of each potential hazard on every component of the D&R system; this knowledge can be initially acquired via a literature survey that is combined with the experience of specialized engineers working in the sector of D&R infrastructure.
2.2. Climate Hazards for Dam & Reservoir Systems
Based on literature [9,31,32,34,35,36,40,41,42,43] there are eight climate hazards that are most commonly examined for D&R systems from the twenty four that are shown in Table 1. These hazards can be categorized into the following four groups: mean air temperature increase (HC1) and extreme heat - heat waves (HC2), mean precipitation decrease (WD1), aridity (WD4) and droughts (WD5), extreme precipitation (WD2) and flooding (WD3), and extreme winds (WA2).
2.3. Components of Dam & Reservoir Systems and their Typologization
To determine the impacts of a climate hazard on a D&R system, we need to break it into components, determine the impacts on each component and identify the vulnerable components of the D&R system, whose risk is high, so that we can propose proper adaptation measures to reduce this risk. The determination of the components of D&R system is a practical and technological task that should be systematic and typological; it is usually performed by professional engineers and experts, who design, construct and operate D&R systems together with researchers specialized in these projects. Currently, there is no standard procedure to determine the components of D&R systems; however, there are only a few works in the form of roadmaps [40] , guidelines [38], and guides [44,45,46,47].
Generally, the components of a D&R system should cover all its aspects that can be affected by climate change; however, their number should not be that high to complicate the assessment. Moreover, the components should be consistent with their use in the subsequent analyses of the CRVA, such as the key areas of sensitivity and exposure analyses (in step 3 of the vulnerability assessment) and the risk areas of the impacts analysis (in the detailed analysis). Regarding the time scale of D&R systems, it is usually assumed equal to their Design Working Life (DWL) that is defined according to Eurocodes as “the period for which the structure shall be used with anticipated maintenance but without major repair” [48]. The lifespan of D&R systems is usually of the order of 100 years and determines the scenarios that need to be considered in the climate change assessment (see section 3.2).
Based on the literature [49,50,51], the components of D&R systems can be categorized into five groups that are shown in Table 2 and are briefly described in the following text.
The D&R systems input are their inflows, which include mainly incoming rivers, but also watershed runoff, direct precipitation, and groundwater inflows and outflows.
The fundamental functions of D&R systems are storage for drinking and/or irrigation water supply (P1), flood prevention and control (P2), hydropower generation (P3), and recreation (P4), e.g. water-based sports and activities, and aesthetics, including habitats for wildlife and birds and wildlife sanctuaries and parks, as well as other functions like navigation. These functions depend on the processes taking place in the D&R systems that include precipitation, evapotranspiration, runoff, infiltration, erosion, groundwater exchange (seepage), sedimentation, resuspension, stratification, hydrodynamics, mixing, resuspension, and water pollution, which are affected by climate hazards.
Assets include the embankment that is an earthfill or concrete (gravity) dam (A1), the spillway (A2), the auxiliaries (A3) and the buildings (A4). The main parts of an earthfill dam are (1) the upstream face, including erosion protection, such as the liners (HDPE, concrete or asphaltic concrete) and the shoulders, (2) the crest, including the parapet walls and the roads, (3) the downstream face, (4) the clay core or homogenous clay construction, and (5) the filers. The main parts of a concrete dam are (1) the concrete structure, including joints and (2) the foundation. The spillway consists of (1) the approach channel, (2) the control structure, (3) the discharge carrier, (4) the discharge channel and (5) the energy dissipators.
Auxiliaries entail various structures, including draw-off facilities, energy dissipation structures downstream of the spillway (e.g. downstream pool, stilling basin and outflow into the downstream river), gates and valves (mainly of steel), penstocks (closed pipes) and other channels and pipes used for sediment removal, flow and fish bypassing, etc. Buildings are usually the administration and power buildings including their equipment.
The outflow of D&R systems refers to the interaction of D&R systems with its environment that are mainly the downstream uses and services; these include water for drinking and irrigation supply (O1; see also P1), hydropower generation (O2; see also P2), releases to downstream watercourses, e.g. rivers, such as environmental flow, spillway release, flushing, and flooding (O3; see also P3), and the corresponding downstream impacts to users and water bodies.
Supporting infrastructure include the electric power supply (S1), communications, operation, data collection, monitor and control (S2), transportation and access (S3), and personnel (S4). Electric power supply refers to the required power at the pumping stations, flow monitors, control gates and SCADA locations. Communications, operation, data collection, monitor and control includes modes of communication, such as telephone, radio, e-mail, internet, and telemetry, SCADA and method of transmission of SCADA signals from control points (e.g. a weir) to a control device (e.g. a gate) and to the Operations Center and records with data collected concerning daily infrastructure operations, as well as weather conditions and events. Transportation and access refer to (access) road conditions and driving conditions that can affect operations and staff response time. Personnel deal mainly with working conditions (indoor and outdoor) and maintenance operations.
2.4. Potential Climate Change Impacts of Dam & Reservoir Systems and their Typologization
In the present section the potential climate change impacts on D&R systems are typologized and presented for each of the four groups of climate hazards (see section 2.2) based on the literature [9,31,32,34,35,36,40,41,42,43]. For the typologization, the notation X-YY is used, where X is the symbol for the group of climate hazards (T, D, F, S and W; see section 2.2) and YY the symbol of the component (see Table 2).
2.4.1. Potential impacts Due to Mean Air Temperature Increase and Extreme Heat
Mean air temperature increase and extreme heat may lead to (1) increased water temperature of rivers that degrades their water quality due mainly to decreased dissolved oxygen (DO) concentrations, and (2) to earlier spring melting and thus earlier spring river floods (Τ-Ι) [52].
Water temperature in reservoirs increase due to air temperature increase, vegetation growth on and around dams increase due to longer growing seasons, evaporation rates and transpiration from vegetation and soils increase, water storage volumes decrease, and thermal stratification increases, i.e. steeper gradients are observed in the metalimnion due to increased heating of water surface (T-P1). Water quality is deteriorated due to increased water temperatures, that may lead to eutrophic conditions, increased duration and frequency of algal and cyanobacterial blooms, decreased concentrations of DO, and presence of emerging pollutants. Water quality degradation may result in adverse impacts on fish populations in the reservoirs, increased pest populations (e.g. midges that can be harmful to human health) and reduction of the recreation and aesthetics value and biodiversity. Also, navigation problems for some crafts can be created due to increased vegetation (T-P4). Furthermore, reservoir volumes decrease due to increased evapotranspiration and the presence of plants, resulting in the decrease of the potential for hydropower production (T-P3) and the reduction of the aesthetic value of the reservoirs (T-P4). Also, there are positive impacts of air temperature increase on the functions of D&R systems, such as the improved flood control due to decreased water volumes (T-P2), the increased visitor numbers in shoulder season (extended recreation and tourism season) due to increased air temperatures and the increased aesthetic value and recreation potential due to increased vegetation (T-P4).
Mean air temperature increase and extreme heat may also have a series of effects on the assets of D&R systems [9,31,53,54]. These effects in earthfill dams include: (i) increased growth in ground covering shrubs on dam face and crest (due to increased growing season), especially when increased temperatures are combined with increased rainfall that may cause erosion, (ii) grass kill during dry (and hot) periods (frequency and duration) or during increased winter rainfall leading to saturation, (iii) heat stress/disease on certain tree species causing tree fall and uprooting during storm events (see S-A1), and (iv) desiccation and shrinking of clay due to increased evapotranspiration (T-A1). In concrete dams, alkali-aggregate reactions may increase with temperature inducing thermal expansion, cracking and spalling in concrete that may have severe impacts on the safety and functioning of gravity dams and particularly spillway sections [54] (T-A2); furthermore, persistent drought and high temperatures cause internal water loss resulting in drying and shrinking; when such shrinkage is restricted cracks can appear and expand because of surface water loss. Moreover, UV can damage concrete, masonry and jointing material (T-A1). Spillways may be blocked due to increased vegetation, while concrete spillways may be cracked (expansion cracking) during high summer temperatures/diurnal variation and heat waves (T-A2). Also, concrete channels and wave walls may crack at high temperatures and metal elements, e.g. steel lining of tunnels, bottom outlet valves, can be damaged due to expansion that is greater than design tolerances (T-A3). In buildings, the demand for cooling power during hotter summers and increased heat waves increases; moreover, the lifespan of building components decreases due to increased thermal oxidation (T-A4).
Mean air temperature increase and extreme heat may have various impacts on the outflows of D&R systems [9,31,35,36,53]. Water may not be suitable for use due to degraded water quality and treatment may be required; furthermore, the demand for drinking and irrigation water supply during hotter summers increases (T-O1). Power demand during hotter summers and increased heat waves increase and this affects long-term energy contracts (T-O2). The capacity of receiving watercourses to accept discharge decrease due to their high temperatures, their pollution also increases due to the reservoir’s increased water temperature and degraded water quality, while adverse impacts on fish populations of receiving watercourses can be observed. Management conflicts may be created for multi-purpose reservoirs, when draw down is required for primary function, e.g. environmental flows (T-O3).
Mean air temperature increase and extreme heat may have the following impacts on supporting infrastructure: [9,31,35,53]: The risk of outages of power systems increases due to increased energy demand for cooling in summers thus increasing the pressure on the grid; furthermore, the thermal stress and damage/failure of electrical and electronic components, such as batteries and transformers, increase (T-S1). Increased vegetation obscures monitoring sites and gauge boards and creates fouling on water level measurement equipment; also, monitoring devices can be damaged due to temperature increase (T-S2). Increased temperatures may result in cracking and rutting parking lot asphalt binders; furthermore, the access roads can be damaged due to reduced frost during high winter temperatures and thus accessibility becomes poorer (T-S3). The maintenance access is reduced due to the increased growth of shrubs. Also, indoor and outdoor thermal comfort are reduced thus making working conditions more difficult. The spread of vector-borne diseases or pests in the region of the reservoir increases due to increased air temperatures and its control becomes more difficult due to the presence of shrubs. These impacts result in reduced occupational health and safety, increased number of workplace accidents, increased absenteeism and strain on personnel on duty and therefore increased maintenance requirements and more difficult maintenance (T-S4).
2.4.2. Potential Impacts Due to mean Precipitation Decrease, Aridity and Droughts
Mean precipitation decrease, aridity and droughts lead to reduced flowrates of rivers resulting in the deterioration of river water quality due to increased concentrations of incoming pollutants, i.e. due to decreased dilution (D-I); this impact is more pronounced when it coincides with temperature increase and heat waves.
Moreover, mean precipitation decrease, aridity and droughts may result in reduced reservoir volumes and lower water levels due to lower water inflows (rainfall and river flows), degraded water quality due to increased concentrations of pollutants (reduced dilution), reduced water supply (D-P1) and hydropower generation potential (D-P3), reduced recreation of aesthetic value and biodiversity, due to exposure of littoral habitat, prevention of certain types of recreation, such as sailing and /or causing access difficulties, and creation of health issues due to pollution (D-P4), and improved flood control and increased flood routing capacity of the dam to reduce outflow peaks (D-P2) [9,31,53].
One of the most important climate change impacts on D&R systems are the prolonged low/fluctuating reservoir water levels (D-P1) that is a key driver for further potential impacts due mainly to the exposure of various parts of the dam to the environment and thus to climate hazards. High air temperature and UV sunlight may cause damages to liners, joint materials and binding mixes, such as degradation of HDPE liners, thermal cracking and spalling of concrete liners, block cracking of asphaltic concrete liners (if asphalt dries out that may result in slumping and mass instability), reduced performance of asphaltic binding mixes, and longitudinal cracking due to diurnal temperature variations (T-A1) [9]. Wind can cause waves on the water surface of reservoirs and subsequently erosion of exposed parts, such as the soil through holes between large pieces of riprap, the bottom of pitching and the shoulders; this erosion is more intense when the fetch is longer, which is the case of long reservoirs in the direction of the prevailing wind (S-A1). Heavy rainfall can also cause drainage and erosion of joint materials, that can be exacerbated by trees and shrubs growing in joints; moreover, increased frequency and duration of heavy rainfall can result in poor drainage and erosion of exposed areas (F-A1).
Mean precipitation decrease, aridity and droughts may also have the following impacts on earthfill dams: desiccation and shrinkage of clay core and dam shoulders, seepage and possible piping failure, loss of vegetation cover, soil erosion or subsidence (due to drought), increased erosion of dam face (when drought is combined with intense rainfall), slumping of the upstream dam face due to more regular cycles of dam wetting and drying due to reduced summer rainfall (D-A1). In concrete dams, drought can deteriorate certain properties of concrete, especially when it is combined with high temperatures, such as the compressive strength, elastic modulus, creep deformation, and shrinkage deformation; this deterioration can cause concrete to dry and shrink owing to internal water loss and when such shrinkage is restricted, cracks can appear and expand because of surface water loss (D-A1) [9,31,53].
Mean precipitation decrease, aridity and droughts may affect the outflows of D&R systems. Water in the reservoirs may not be suitable for use due to its degraded water quality (higher concentrations of pollutants) and thus treatment may be required; furthermore, the demand for drinking and irrigation water supply during hotter summers increases due to lower rainfall (D-O1). The hydropower generation potential decreases due to reduced water volumes in the reservoirs (D-O2). The demand for environmental flow to downstream watercourses increases due to their reduced flow rates, the water availability for flushing during summer decreases; moreover, increased competition and management conflicts can be observed in multi-purpose reservoirs, when draw-down is required for primary function, e.g. environmental flows (D-O3).
Moreover, mean precipitation decrease, aridity and droughts may lead to more difficult working conditions (D-S4).
2.4.3. Potential Impacts Due to Extreme Precipitation and Flooding
Extreme precipitation and flooding results in increased flow rates due to increased peak flows of extreme rainfall and increased sediment load, debris, mobilized vegetation and turbidity (during flood events) that result in water quality deterioration (F-I1).
Extreme precipitation and flooding leads to increased water levels due to increased inflows, increased quantities of transported debris and mobilized vegetation and increased concentrations of sediments and turbidity that deteriorate water quality and reduce the water storage volume (F-P1). Furthermore, the risks for reservoir flooding, overtopping and downstream flooding increase (F-P2), more rapid fluctuations in operating water levels occur, including rapid filling or emptying as an operational response in advance of heavy rain, and reduced operating levels to face flood risk (F-P2) and thus reduced availability or flexibility for hydropower generation (F-P3). However, during winter the water availability for hydropower generation increases due to high precipitation (F-P3). Moreover, the recreational safety and the aesthetic value are reduced due to the degraded water quality and negative impacts on navigation and sports, e.g. canoeists are observed [9,31,53].
There are various effects of extreme precipitation and flooding on earthfill dams that include the following: 1i) increased pore pressure due to the rapid fluctuations in operating water levels that may result in piping or mass instability, (2) increased risk of overtopping due to increased water levels (above design levels) and subsequent erosion of the downstream face of the dam, (3) increased seepage (flow paths may exit higher up on downstream face) due to increased water levels, and (4) increased erosion and damage to reservoir toes for reservoirs sited in floodplains (long-term repeated, seasonal exposure to flooding could reduce reservoir toe integrity) (F-A1). The main effects on concrete dams are (1) increased risk of overtopping, sliding and overturning due to increased water levels, (2) increased risk of dam cracking and failure when sudden heavy rainfall follows persistent drought (WD5), and (3) increased drainage and erosion of joint materials due to fluctuating water levels or heavy rainfall (F-A1). Also, mobilized vegetation in flood flows may block the spillway; moreover, increased flow rates, flow velocities and water levels in spillways may exceed design values and result in spillway failure (F-A2). Flaws in the spillway and out of channel flow scouring banks/reinforced bunds around spillway channels may deteriorate more rapidly due to the more often operation of spillway (F-A3). The impacts on auxiliaries include (1) increased damage of dam components due to transported debris caused by intense precipitation, (2) increased pipe failure rates of newly installed cast iron pipes, because these are more susceptible to ground movement associated with large precipitation (3) increased erosion and/or sediment build-up around ancillary structures, (4) landslides during storm events due to increased rainfall intensity or drying out of catchment, (5) increased failure rate of rigid water pipes during long period of a wetting period followed by a long warm and dry period that cause high volume changes of expansive soils, (6) increased silt buildup or blocking of inlets to valve structures due to increased catchment sedimentation, (7) increased rusting of dam components increased in winter rainfall that leads to wet conditions and (8) increased risk of electrical failure (F-A3). Moreover, high precipitation increases the probability of damp and mould in buildings, while flooding of powerhouses and other buildings may result in electricity supply outage (F-A4).
Transported sediments, debris, mobilized vegetation and turbidity caused by the extreme precipitation and flooding lead to the deterioration of the water quality of the reservoirs, which may not be suitable for use and thus treatment may be required (F-O1). Also, the water availability or flexibility for hydropower generation decrease due to reduced operating water levels to face flood risk and increased water availability during winter for hydropower generation due to high precipitation (F-O2). Furthermore, potential flooding, overtopping, piping and reservoir pollution (due to increased quantities of sediments and debris) may have significant negative impacts on downstream watercourses (F-O3).
Extreme precipitation and flooding increase the risk of electrical failure (F-S1), can damage access roads (F-S3), and hamper communications (F-S2), working conditions (mainly outdoors) and maintenance (F-S4).
2.4.4. Potential Impacts Due to Strong Winds
Strong winds and their increased occurrence may increase evaporation in the reservoir, reduce the stratification and thus its stability (destabilization), deepen the surface layer (epilimnion) and reduce its temperature, cause upwelling and (wind-induced) mixing. Subsequently, the resuspension of (particulate) sediments increases resulting in an increase in turbidity and the internal nutrient loading that leads to the degradation of water quality (S-P1).
Moreover, strong winds may increase the erosion of exposed parts of the dam (S-A1) and the subsequent settling of eroded particulate matter sediment reduces the effective reservoir storage capacity, decreases the effective lifespan of dams and lessens various reservoir functionalities (S-P1) [55]. These effects are more pronounced for shallow (stratified) reservoirs (i.e. high surface area to volume ratio) and for long reservoirs with long fetch (in the direction of the prevailing winds) and become less pronounced when there exist both aquatic and terrestrial vegetation along the shoreline.
Waves from strong winds may cause damage to dam erosion protection, especially when they coincide with intense rainfall (see also F-A1). Strong winds may damage the slopes of the reservoirs, lead to wind lifting and damage to (HPDE) liners, when there is no overburden in place and cause slumping and mass instability, and damage to buildings, masts and poles (S-A1).
High production of wind power locally can lead to rapid downregulation of hydropower generation locally because of grid constraints (S-O2). Extreme winds and storms, like Medicanes (Mediterranean hurricanes) may damage monitoring equipment, operating controls, interrupt power supply to critical equipment (S-S1), and damage concrete poles (S-S2), buildings (S-A4) and other permanent structures.
Regarding combined effects, high winds and storms may cause fall and uprooting of certain tree species (S-A1) that were affected by heat stress/disease (see T-A1).
2.5. Climate Indicators for Dam & Reservoir Systems
Various indicators have been proposed by researchers in R&D systems; the most commonly used indicators are described in this section together with their symbols employed by specialized organizations, such as ETCCDI [56]; IPCC [57]; WMO [58]; Climate –Adapt [59,60] and others [34].
The following indicators are used for mean air temperature increase (HC1) and extreme heat (HC2):
- average (TMm), maximum (TXm) and minimum (TNm) values of temperature (oC) for years, seasons (summer and winter) and months,
- longest heat wave in days, e.g. heatwave duration (HWD) and tropical days per year, e.g. the number of summer days (SU) with TX>25oC,
- year-on-year cooling and heating degree days, e.g. heating degree days (HDD) and cooling degree days (CD),
- beginning, end and duration of the growing season and vegetation growth rates, e.g. growing season length (GSL) and growing degree days (GDD),
- diurnal and seasonal amplitudes, e.g. daily temperature range (DTR) that is the monthly mean difference between TX and TN,
- number of days with frost, cold, zero pass-through, high summer heat and tropical heat, e.g. number of icing days (ID) that is the annual count of days when TX (daily maximum temperature) <0°C, the number of frost days (FD) that is the annual count of days when TN (daily minimum temperature) <0°C, the hot days that is the number of days with TX > 35oC, and the tropical nights (TR) that is the number of days with TN>20oC,
- evaporation and effective precipitation,
- if precipitation falls as rain or snow,
- extent, duration, strength and water content of snow cover,
- the start of the spring flood, the length and depth of the frost period,
- the start of icing, ice thickness and duration of ice cover, and
- the water temperature in streams and reservoirs (WTLS).
The following indicators are used for mean precipitation decrease (WD1) and droughts (WD5):
- standard precipitation index in 3, 6 and 12 months (SPI-3, SPI-6 and SPI-12),
- standardized streamflow index (SSI),
- longest dry spell in days, e.g. consecutive dry days (CDD),
- average, maximum and minimum values for years, seasons, 14 days, and weeks, e.g. annual total precipitation on wet days (PRCPTOT),
- annual and seasonal precipitation change relative to the baseline period,
- average, minimum and maximum values of river flows for years, seasons, months, 14 days and weeks e.g. river discharge index (RID) that is defined as the annual mean daily river discharge, and
- drought with return period T=100 y.
The following indicators are used for extreme precipitation (WD2) and river flooding (WD3):
- number of days with heavy and extreme precipitation, e.g. number of days with precipitation >10 mm (R10mm) and with precipitation > 20 mm (R20mm),
- extreme precipitation, e.g. extreme precipitation total index (R95pTOT), which is the total sum in a year of daily precipitation values exceeding the 95th percentile of the reference period (mm),
- maximum daily rainfall, e.g. maximum 1 day precipitation (Rx1day),
- number of 24-hour extreme precipitation events that occur once in 20 or 50 years, e.g. one in 20year return value of maximum one day precipitation (20Rx1day),
- number of days with one-hour total rainfall greater than 10 mm, with 24-hour total rainfall greater than 25 mm (e.g. R25mm), or with 48-hour total rainfall greater than 50 mm,
- frequency Haldo-rain, e.g. 1 day precipitation>120 mm,
- mean winter wettest day precipitation,
- downpours and extreme rainfall volumes,
- rainfall – storm return period,
- average effective rainfall, e.g. effective precipitation (EP),
- average, minimum and maximum values of river flows for years, seasons, months, 14 days and weeks e.g. river discharge index (RID) that is defined as the annual mean daily river discharge,
- frequency 1, 2, 4, 7, 14, 30 days of discharge for T = 50 - 10000 years recurrence interval,
- high water events today and in the future,
- average and annual high snow water content (measured or calculated),
- percentage of filling of reservoirs,
- soil moisture, surface runoff,
- start of spring flood,
- river runoff, e.g. river flood index is the 50-year flood recurrence value based on maximum river discharge,
- probable maximum flow (PMF) and regionalized change factors (including upper and lower end estimates) for the 1 in 50-year return period flow,
- change of periods of recurrence of Inflow Design Flood (IDF) from T=100 years to PMF, and
- flood with return period T=100 years e.g. river flood index using runoff accounts for extreme water discharge as it reports the value of daily river flow corresponding to a return period of 100 years.
The following indicators are used for winds (WA):
- mean wind speed, and
- extreme wind speed
2.6. Typologization of Climate Change Impacts on Dam & Reservoir Systems
2.7. The Case Study
The area of study extends along Almopeos River; it consists of a narrow valley, through which Almopeos River flows, fed by the runoff from the upstream hydrological basin of lowland and mountainous Almopia. The Almopeos Dam will be constructed approximately 4 km north of the settlement of Kali, in front of the exit of the river from the gorge on the Giannitsa plain. Figure 1 and Figure 2 show a plan view of Almopeos dam and a cross-section of the embankment, respectively. The reservoir has a volume of about 1.03 Mm3 and retains 35.5 Mm3 of water with a freeboard of 4.0 m at its maximum water level. In its main cross-section the dam is 61.0 m high above the foundation level and its base width is about 350.0 m; its crest is 245.0 m long and 12.0 m wide. The slopes of the upstream and downstream shell of the embankment are equal to about 44.4%. The dam core is made of clayey silts, while the shells consist of coarse-grained soils. A 4.0 m thick coating, made of 3.0 m of rockfill and 1.0 m coarse grain soil, protects the upstream shell from erosion due to changes in water level and wave action. Two 6 m filters separate the clayey core from the shells. The foundation soils consist of a layer of alluvial soils, with an average thickness of about 9 m under the dam center line and it will be processed with 40.0 m deep low-pressure concrete injections along the center line of the dam to prevent seepage through the alluvial layer underlying the embankment.
3. Application of the Methodology
3.1. Description of the Almopeos Dam & Reservoir System
3.1.1. Components of the Almopeos Dam & Reservoir System
The main components of the Almopeos D&R system are described below.
- Inflow (I). The inflow to the system is the water from Almopeos River; according to the River Basin Management Plan of Western Macedonia [61], its ecological status immediately upstream of the dam is good, but its chemical status is lower than good.
- Processes (P). The water of the reservoir will be used for irrigation (P1). For safety reasons and to reduce the pollution of the water of the reservoir, deforestation and clearing, cutting of bushes and trees and their removal will be performed prior to the construction of the reservoir.
- Earthfill dam (A1). The dam will be constructed with an impervious clay core and nearby soil will be used for its layers. Rockfall (riprap) is employed on dam’s faces for its protection against wave action and erosion. Therefore, there is no vegetation on dam faces and only unwanted vegetation can grow between the riprap voids. Moreover, there are no liners and joint materials on the dam.
- Spillway (A2). The components of the spillway system are the following: (1) the inflow channel, (2) the spillway with 21 fusegates to increase reservoir storage capacity and/or to increase spillway discharge capacity, (3) the collector channel, (4) the drop channel, (5) the stilling basin, and (6) the escape channel that ends in the downstream river. All channels are made by reinforced concrete except for the escape channel that is made by excavated natural soil partly protected with stones. The fusegates are made of steel and are sealed with EDPM; each fusegate is 6.75 m long and 2.0 m high.
- Auxiliary structures (A3). The main auxiliary structures of the Almopeos D&R system are the following: (1) vertical concrete well for discharge and irrigation supply, (2) pipelines for (i) discharge (steel pipe Ø1500, contraction to Ø1200, 2 butterfly control valves Ø1200, and Howell – Bunger valve Ø800 for flow regulation), (ii) irrigation (steel pipe Ø1500, Ø1200 control valve and a flow meter), (iii) environmental flow (steel pipe Ø500, Ø500 control valve and a flow meter), and (iv) sediment flushing (metal pipe Ø2500 encased in concrete, high-pressure gate for downstream control). Sediment flushing is performed after the end of the irrigation season and in the first rain of the winter.
- Buildings (A4). The administration building is an underground structure by reinforced concrete with internal dimensions 19.0m X 8.40 m. In this building the automation and remote-control system will be installed together with (1) the majority of the control devices and parts of the pipelines (see A3), (2) the required supporting infrastructure (see S) for the permanent work of the personnel, such as water supply, drainage, HVAC, telephone, data, internet, other electrical installations, and (3) a bridge crane.
- Outflow (O). The environmental flow ranges from 0.04 to 1.1 m3/s (O3).
- Supporting infrastructure (S). Power supply is used for the operation of the bridge crane, the lights, and the auxiliary equipment in the administration building and the monitoring (S1). Flow is controlled by four control valves, a Howell – Bunger valve, two electromagnetic flow meters and a high-pressure gate. Monitoring is performed (i) for leakage, seepage and pore water pressure via hydraulic, electrical and pneumatic piezometers, (ii) settlement and deformation in the interior of the dam via vertical tube extensometers and inclinometers, and (iii) force feedback digital accelerometers. The project site is assessed via two existing rural roads. The first road starts from the settlement of Kali and runs along the left (eastern) bank of Almopeos River, along which the water supply pipe to the irrigation networks, while the second road starts from the settlement of Profitis Ilias and runs along the right (west) bank of the river (see Fig.1). There are no permanent staff on the site of the project, but there will be regular visits from personnel for operation and maintenance purposes.
The timescale of all components was set equal to 100 years.
3.1.2. Potential Climate Hazards and Impacts on the Components of the Almopeos Dam & Reservoir System
Based on the available data and information the following groups of climate hazards are considered in the Almopeos D&R system: (1) mean air temperature increase (HC1) and extreme heat - heat waves (HC2), mean precipitation decrease (WD1) and droughts (WD5), and extreme precipitation (WD2) and river flooding (WD3). Using the typology of section 2.4 and the description of the case study of section 3.1.1, the main impacts of these groups are presented in the following text and are summarized in Table 6.
- Impacts due to mean air temperature increase and extreme heat - heat waves.
T-I. River temperatures will increase due to increased air temperature; generally, a 1-degree increase in air temperature results to about 0.6 to 0.8 degrees increase of river temperature [62]. According to the Water Management Plan of West Macedonia [61] the chemical status of the Almopeos River upstream of the dam is lower than good; this is mainly due to the runoff of the nutrients from the agricultural area of Aridea that originate from chemical fertilizers, manures, and wastewaters. River water temperature increase can further deteriorate its water quality.
T-P. Water temperature in the reservoir will increase, resulting in increased water temperature, increased vegetation growth, increased evapotranspiration, reduced water storage volume, increased stratification, degraded water quality and increased adverse impacts on fish. The effect of increased vegetation growth and the subsequent effects, such as the increased evapotranspiration and reduced water storage volume, are not expected to be significant due to the removal of bushes and trees from the project site prior to the construction of the reservoir. However, possible tree fall in the high elevations of the water basin can occur and their uprooting during storm events. The degradation of water quality is due mainly to eutrophication (T-P1).
T-A. Due to the presence of riprap only unwanted vegetation can grow in their voids. Shrinkage of clay core can occur, but the remaining water below the abstraction well will prevent the core from drying completely (T-A1). Expansion cracking of the concrete spillway during high summer temperatures and heat waves can occur. Spillway blockage due to vegetation carried by the river flow can also occur; however, this risk is low due to the removal of vegetation prior to the construction of the reservoir and the fusegates’ system that cannot be blocked (T-A2). Cracking concrete structures, such as spillway channels or expansion of metal elements may occur; however, this is not likely since most concrete structures and metal parts are protected against high temperatures (T-A3). Moreover, most of the auxiliaries are located inside the administration building. Increased power demand for cooling during summer months may result in reduced lifespan of building components (T-A4).
T-O. The irrigation demand is expected to increase during hotter summers (T-O1). Also, the capacity of the downstream Almopeos River to accept discharge can be reduced due to its high temperature and the degraded discharged water quality that may have negative impacts on fish populations and create conflicts in water withdrawals for environmental flow maintenance (T-O3).
T-S. Power supply is used for the bridge crane, lights and monitoring and it is not expected to increase noticeably. Therefore, an increased risk of outages due to temperature increase will not affect the system, except for the maintenance of the auxiliary components in the administration building (T-S1). Damage to the electrical and electronic components of the crane is not likely to occur. Obscuring monitoring sites and gauge boards and damage of monitoring devices can hardly occur (T-S2), because most of the monitoring devices are not sensitive to temperature (below 50oC). Asphalt binders and access roads can be damaged by temperature increase (T-S3); this effect may be significant when it is combined with excessive loading [31] and may increase maintenance difficulty and requirements (T-S4).
- 2.
- Impacts due to mean precipitation decrease, aridity and droughts.
D-I. Reduced flow rates due to low rainfall and drought can decrease the dilution of pollutants in the incoming river water from the agricultural area of Aridea and can result in degraded river water quality (D-I), especially when low flow rates are combined with temperature increase and heat waves (T-I).
D-P. Reduced reservoir volumes and water levels during the irrigation period (April to September) resulting in prolonged low/fluctuating reservoir water levels and exposure of parts of the dam, degraded water quality and reduced irrigation water potential (D-P1).
D-A. Desiccation and shrinkage of clay core can occur; however, the remaining water below the abstraction well will prevent the core from drying completely. Erosion of the exposed parts of the dam due to waves caused by strong winds on the water surface of reservoirs can hardly occur due to the presence of riprap (D-A1). There are no auxiliaries exposed to environmental hazards, except for the upper part of the abstraction well (D-A3). The spillway (D-A2) and the administration building (D-A5) are not expected to be affected by precipitation decrease, aridity and droughts.
D-O. Increased demand for drinking and irrigation water during hotter summers (D-O1); increased demand for environmental flow; reduced availability for flushing during summer; management conflicts for multi-purpose reservoirs (D-O3).
D-S. More difficult working conditions and maintenance (D-S4).
- 3.
- Impacts due to extreme precipitation and river flooding.
F-I. Increased flow rates can result in higher sediment loads and debris, mobilized vegetation and degraded water quality due to pollutants from the agricultural area of Aridea, that will deteriorate river water quality (F-I).
F-P. Increased reservoir water levels; increased sediments, debris, mobilized vegetation and turbidity; degraded water quality due to polluted river water; reduced water storage volume due to sediment (F-P1). Increased risk of flooding, overtopping and downstream flooding (F-P2). Increased sedimentation can cause problems in the area of water abstraction and flushing may be required.
F-A. Increased pore pressure; increased risks for piping, overtopping, seepage and erosion (F-A1). Blockage of the spillway due to mobilized vegetation can hardly occur due to the removal of vegetation and the fusegate system; however, the risk of failure due to increased flow rates, flow velocities and water levels and rapid deterioration of flaws cannot be ignored (F-A2). Damage of dam components due to debris; failure of pipes; erosion and sediment build-up around structures; landslides; silt buildup and blocking of inlets; rusting of dam components; rapid deterioration of flaws (F-A3). Damp and mold due to high precipitation, inundation and electricity supply outage in the administration building (F-A4).
F-O. Potential flooding, overtopping, piping and reservoir pollution (due to increased quantities of sediments and debris) may have significant negative impacts on downstream watercourses (F-O3).
F-S. Extreme precipitation and flooding increase the risk of electrical failure (F-S1), can damage access roads (F-S3), hamper communications (F-S2), and make working conditions (mainly outdoors) and maintenance more difficult (F-S4).

Table 6.
Overview of the main potential impacts of Almopeos Dam and Reservoir system.
| Groups of components | Temperature increase and extreme heat (HC1 &HC2) |
Precipitation decrease, aridity and droughts (WD1, WD4 & WD5) |
Extreme precipitation and flooding (WD2 & WD3) |
|---|---|---|---|
| I Inflows |
Increased river water temperature; degraded water quality (Τ-Ι). |
Reduced flow rates; degraded water quality (D-Ι). | Increased flow rates, sediment loads and debris; mobilized vegetation; degraded water quality (F-I). |
| P Storage |
Increased water temperature; increased stratification; degraded water quality; impacts on fish (T-P1). | Reduced reservoir volumes; reduced water levels; exposure of parts of the dam; degraded water quality; reduced irrigation water potential (D-P1). | Increased water levels; increased sediments, debris, mobilized vegetation and turbidity; degraded water quality; reduced water storage volume due to increased volumes of sediments (F-P1). Increased risk of flooding, overtopping and downstream flooding (F-P2). |
| A Assets |
Desiccation and shrinking of clay core (T-A1); expansion cracking of concrete spillway (T-A2); cracking of concrete spillway channels (T-A3); increased power demand for cooling and reduced lifespan of building components (T-A4). |
Desiccation and shrinking of clay core (D-A1). | Increased pore pressure; increased risks for piping, overtopping, seepage and erosion (F-A1); increased risk of spillway failure due to increased flow rates, flow velocities and water levels (F-A2); damage of dam components due to debris (F-A3); damp and mold, inundation and electricity supply outage in the administration building (F-A4). |
| Outflows (O) | Increased water irrigation demand during hotter summers (T-O1); degraded water quality downstream of the reservoir and impacts on fish; conflicts in water withdrawals for environmental flow (T-O3). | Increased demand for irrigation water during hotter summers (D-O1); demand for increased environmental flow, reduced availability for flushing during summer, and management conflicts (D-O3). | Impacts to downstream watercourses due to flooding, overtopping, piping and pollution (F-O3). |
| Supporting infrastructure (S) | Increased risk of damage of access roads (T-S3); increased maintenance difficulty and requirements (T-S4). |
More difficult working conditions and maintenance (D-S4). | Increased risk of electrical failure (F-S1); increased damaged access roads (F-S3); more hampered communications (F-S2); more difficult working conditions and maintenance (F-S4). |
3.1.3. Climate Indicators for the Almopeos Dam & Reservoir System
The assessment of climate exposure for the Almopeos dam and reservoir system relies on a set of climate indicators that capture key variables influencing dam performance under changing climatic conditions. The selection of these indicators is guided by their relevance to the dam’s vulnerability, their measurability, and their alignment with established methodologies, such as those outlined in section 2.5 and Table 7.
The selection process considered several factors. First, indicators were chosen based on their ability to represent the major climate hazards identified in section 2.4, including temperature increases, precipitation variability, and extreme weather events. Second, each indicator reflects potential effects on key dam functions, such as water storage, structural integrity, and operational efficiency. Finally, the selection was constrained by available research studies, hydrological models, and engineering assessments for the Almopeos region.
Building on this framework we utilize nine key indicators as presented in Table 7 alongside the criteria for defining “medium” scale exposure, which are further explained in section 3.3. This selection was mainly based on the classification outlined in Table 5, Table 6 and Table 7; however, the process was limited by the scarcity of research papers and engineering reports providing specific scaling of these indicators (used in the vulnerability analysis in section 3.3).
Table 7.
Climate indicators and medium exposure thresholds relative to the 1981-2000 baseline period.
Table 7.
Climate indicators and medium exposure thresholds relative to the 1981-2000 baseline period.
| Climate hazard | Indicator | Symbol | Medium Exposure Thresholds (Δ from 1981-2000 Baseline) |
|---|---|---|---|
| HC1 & HC2 | Annual mean daily minimum temperature (oC) | TNm | 1≤Δ<2 [63] |
| Annual mean daily maximum temperature (oC) | TXm | 1≤Δ<2 [63] | |
| Hot days: annual count of days with daily maximum temperature >30oC |
HD | 10≤Δ<20 [63] | |
| Annual count of days with daily maximum temperature >35oC | TX35 | 10≤Δ<20 [63] | |
| Tropical nights: annual count of days with daily minimum temperature >20oC | TR | 20≤Δ<30 [63] | |
| WD1, WD4 & WD5 | Annual total precipitation on wet days (mm) | PRCPTOT | -10≤Δ<-5 [63] -25%≤P<-10% [44,46] 566-835 [64] |
| Consecutive Dry Days: maximum number of consecutive days with daily precipitation less than 1 mm in a year | CDD | 10≤Δ<20 [63] 11-20 [65]; 31-50 [66]; 40-60 [44,46] |
|
| WD2 & WD3 | Annual count of days when precipitation is ≥ 20 mm | R20mm | 1≤Δ<3 [63] |
| Annual maximum one-day precipitation (mm) | Rx1day | 5≤Δ<10 [63] 10.1-25.0 [66]; 7.6-35.5[67]; 10-35.5[68]; 20-50 [69] |
3.2. Climate Change Impact Assessment
The climate change impact assessment for the Almopeos Dam and Reservoir system relies on high-resolution bias corrected climate and hydrologic projections. Three General Circulation Model (GCM) and Regional Climate Model (RCM) combinations were selected from the EURO-CORDEX ensemble: EC-EARTH (r12i1p1) – RCA4, HadGEM2-ES (r1i1p1) – RCA4, and MPI-ESM-LR (r1i1p1) – RCA4. These GCM-RCM combinations were specifically chosen for their demonstrated accuracy in simulating atmospheric circulation, temperature gradients, and precipitation extremes, which are critical for understanding the vulnerabilities of the Almopeos D&R system [70,71]. Together, they provide a robust framework for capturing model uncertainties and regional climate characteristics. The assessment was conducted across several temporal and concentration scenarios, including the historical reference period from 1981 to 2000 and future scenarios for 2041–2060 and 2081–2100 under both medium-concentration (RCP4.5) and high-concentration (RCP8.5) pathways, to account for both short-term and long-term climate risks and for the potential variability in global greenhouse gas emissions [72].
Key climate indicators from the EURO-CORDEX models, bias-corrected against ERA5 Land [1] were used to quantify potential climate impacts on the Almopeos D&R system. For temperature, metrics such as the annual mean daily minimum and maximum temperature (TNm and TXm, respectively), the number of hot days exceeding 30°C and the number of days exceeding 35°C (HD and TX35, respectively), and the number of tropical nights (TR) were analyzed. These indicators help capture the effects of heat stress and increased evaporation on reservoir dynamics. Precipitation-related indicators included total annual precipitation (PRCPTOT), the frequency of heavy precipitation days exceeding 20 mm (R20mm), annual maximum one-day precipitation (Rx1day), and the consecutive dry days (CDD) to account for risks related to droughts, extreme rainfall, and changes in hydrological flow patterns. The indicators were selected for their relevance to the Almopeos D&R system and their ability to capture critical aspects of climate-induced vulnerabilities.
For the selected scenarios and time periods, the values of the indicators were calculated using EURO-CORDEX models and are shown in Table 8.
3.3. Vulnerability Assessment
3.3.1. Sensitivity Analysis
The sensitivity of a D&R system to a climate hazard can be defined as the degree to which the D&R system and its components are affected by this climate hazard [73]. Typically, the sensitivity assessment is performed using evaluation criteria that are encountered under various names in literature, such as themes or dimensions. In the present work the five groups of components shown in Table 2 that are input (I), functions and processes (P), assets (A), outflow (O) and supporting infrastructure (S) are used as criteria; these are virtually the same with the themes proposed by EC [38].The sensitivity analysis of Almopeos D&R system was based on expert discussions with engineers from consulting companies specializing in the design of dams, including the company that performed the design of the project. To simplify the analysis three scales “Low (L)”, “Medium (M)” and “High (H)” were used, as shown in Table 9 that depicts the sensitivity scores for (i) each component of Almopeos D&R system, (ii) each group of components (the highest of each group), and (iii) the Almopeos D&R system (the highest of all groups), for the three examined groups of hazards. From Table 9, the following are depicted:
- The components that show the highest sensitivity, ranging from medium to high, are the input (i.e. the river water, I1), the storage (P2), the assets, i.e. the dam (A1) and the spillway (A2), and the outflow (i.e. water for irrigation, O1). These components show medium to high sensitivity to WD2 & WD3 and WD1, WD4 & WD5 and medium sensitivity to HC1 & HC2.
- The components that show low to medium sensitivity are the building (A4) and the water release (O3), while all components of the group of supporting infrastructure (S1 to S4) are practically insensitive to WD1, WD4 & WD5.
- The highest score of all groups of components for each group of hazards are medium for HC1 & HC2, and high for WD2 & WD3 and WD1, WD4 & WD5.
3.3.2. Exposure Analysis
The exposure of a D&R system to a climate hazard can be defined as the degree to which the D&R system is exposed to this climate hazard due to its location [73]. In the exposure analysis of the Almopeos D&R system the groups of climate-related hazards to which the system may be subject at its location, both under current climate conditions and those projected for the future within the expected lifespan are assessed. The exposure analysis was performed for the three groups of components based on the values of the selected indicators that are shown in Table 7 and proper scales of exposure. In the literature there are only a relevant few works that either provide ranges of values for the scales of exposure indicators as (i) actual values [64,65,66,67,68,69] or (ii) differences from values in reference conditions [44,46] expressed as actual values (Δ) or percentages (P,%); in Table 7 the ranges of values of these works for the medium scale of exposure are shown.
In the present work, the differences in actual values (Δ) are used for medium exposure that are shown in Table 7 based on [63]. Moreover, the three scales “Low (L)”, “Medium (M)”, and “High (H)” were employed to simplify the analysis and to ensure consistency with the scales of sensitivity analysis; exposure is characterized as “low” or “high” when values are lower or higher than these of “medium” exposure, respectively. Figure 3 shows a graphical representation of the comparison of the values of the exposure indicators for the three groups of climate hazards examined; the left column refers to the first period (2041-2060) and the right column to the second period (2081-2100).
The exposure analysis was performed using the same indicators for all components of the Almopeos D&R system that are (i) the annual mean daily maximum temperature (TXm) for the temperature increase and extreme heat (HC1 &HC2), (ii) the consecutive dry days (CDD) for the precipitation decrease, aridity and droughts (WD1, WD4 & WD5), and (iii) the annual maximum one-day precipitation (Rx1day) for extreme precipitation and flooding (WD2 & WD3); the results for the Almopeos D&R system are summarized in Table 10, while the detailed analysis for all the components of the Almopeos D&R system and their groups are shown in Table 11 that is discussed in section 3.3.3 Vulnerability Analysis.
- For group hazards HC1 & HC2 the scenario RCP8.5 shows high exposure in both periods, while the scenario RCP4.5 shows a medium exposure in the first period (2041-2060) that becomes high in the second period (2081-2100).
- For group hazards WD1, WD4 & WD5 the exposure for the scenario RCP8.5 is medium in the first period and high in the second period, while the exposure is low in both periods of scenario RCP4.5.
- For group hazards WD2 & WD3 both scenarios RCP8.5 and RCP4.5 show high exposure in the first period, while in the second period exposure is reduced to medium.
3.3.3. Vulnerability Analysis
The vulnerability of a D&R system to a climate hazard can be defined as the predisposition of the D&R system to be adversely affected by this climate hazard considering its capacity to adapt [74]. In the vulnerability analysis of the Almopeos D&R system the results from the sensitivity analysis of Table 9 and exposure analysis of Table 11 are combined to formulate Table 11 shows the outcome of the vulnerability assessment. In Table 11 the following notation is used V(S/E) where V, S and E are the scores of vulnerability, sensitivity and exposure, respectively; high vulnerability (H) indicates a scenario where both sensitivity and exposure are high or one of them is high and the other is medium, low vulnerability (L) indicates a scenario where both sensitivity and exposure are low or one of them is high and the other is medium, and medium vulnerability (V) indicates a scenario where both sensitivity and exposure are medium or one of them is high and the other is low. For example, the notation M(H/L) denotes a scenario where high sensitivity (H) is combined with low exposure (L) to produce medium vulnerability (M). Table 11 reveals the following:
- For group hazards HC1 & HC2 the scenario RCP8.5 shows the same scores in both periods; all groups are highly vulnerable to HC1 & HC2. However, in the scenario RCP4.5 all groups show a medium vulnerability in the first period (2041-2060) that becomes high in the second period (2081-2100).
- For group hazards WD1, WD4 & WD5, the vulnerability of the scenario RCP8.5 ranges from medium to low in the first period (2041-2060); however, these scores increase in the second period (2081-2100) and range from medium to high. In both periods of RCP4.5 all groups show low to medium vulnerability. The components that show the minimum vulnerability are auxiliaries (A3) and buildings (A4) from the group of assets and practically all the components of the group supplementary infrastructure (S).
- For group hazards WD2 & WD3 both scenarios RCP8.5 and RCP4.5 show high vulnerability in both periods for all groups, except for the group of the supplementary infrastructure (S), whose vulnerability is reduced to medium in the second period (2081-2100).
Based on Table 11 and the above-mentioned findings and considering high (H) or medium (M) vulnerability as significant, all three groups of hazards emerge as potential significant hazards for all conditions and periods. Consequently, progression to a detailed risk assessment for each of the three groups of hazards is required; if the vulnerability assessment had justified that the vulnerability of a group of climate hazards was ranked as low (L), then no further risk assessment for this group hazard was needed.
4. Discussion
4.1. The Sensitivity Analysis as a Preliminary Impact Analysis
The vulnerability assessment identified the potential significant groups of hazards for the Almopeos D&R system ranked as ‘medium’ or ‘high’ that are (i) temperature increase and extreme heat (HC1 & HC2), (ii) precipitation decrease, aridity and droughts (WD1, WD4 & WD5) and (iii) extreme precipitation and flooding (WD2 & WD3) that will be examined in the detailed risk assessment.
The European Commission states that “risk means the potential for loss or disruption caused by an incident and is to be expressed as a combination of the magnitude of such loss or disruption and the likelihood of occurrence of the incident” [75]. The IPCC [76] defines risk as “the potential for adverse consequences for human or ecological systems” and notes that risk is not always consistent across different works, and it is continuing to evolve. Typically, risk assessment combines the analyses of likelihood and impact that are often summarized in the “risk matrix” to identify the significant climate hazards for the D&R system, whose risk must be managed and reduced to an acceptable level. In the likelihood analysis of a D&R system to a climate hazard, the probability of this hazard to occur within the lifespan of the D&R system is estimated, while in the impact analysis, the consequences of this hazard on the D&R system are determined.
Typically, the impact analysis is performed based on evaluation criteria that (like in the sensitivity analysis) can be encountered under various names, such as impact criteria, risk areas, impact areas, impacts and consequences. In the impact analysis of the Almopeos D&R system the risk areas proposed by the EC [38] will be used, which are (IM1) asset damage—engineering and operational, (IM2) safety and health, (IM3) environmental, (IM4) social, (IM5) financial, and (IM6) reputation. The use of the groups of components as sensitivity themes permits the use of the results of the sensitivity analysis in the impact assessment, for example the risk area asset damage (IM1) of the impact analysis can be based on the themes assets (A) and supporting infrastructure (S) of the sensitivity analysis, while the risk area environmental (IM3) is closely linked to the themes processes (P) and outflows (O). Moreover, the use of Tables 3 to 5 is directly applicable to the impact analysis. In other words, the sensitivity analysis can be considered practically as a preliminary impact analysis of climate change impacts on the components of the Almopeos D&R system.
4.2. Effect of the Use of Other Climate Indicators
The vulnerability assessment was performed using the indicators TXm, CDD and Rx1day. To investigate the effect of the use of other indicators, the vulnerability assessment was repeated using all the rest of the indicators TNm, HD, TX35, TR, PRCPTOT, R20mm of Table 7, the results are summarized in Table 12 and Table 13, and the findings are discussed in the next paragraphs. In Table 12 and Table 13 the effect of the value of indicator is shown with arrows ↑ and ↓ that denote an increase or decrease, respectively, of the score of exposure or vulnerability. It is noted that the score of sensitivity was assumed to be independent of the climate change scenarios.
For group hazards HC1 & HC2, the use of the annual mean daily minimum temperature (TNm) and the number of days with daily minimum temperature >20 OC (TR) shows the same behaviour and thus produce the same outcome of the exposure analysis. In comparison with TXm, TNm and TR show the same behavior as TXm except for the second period of scenario RCP4.5, which produces medium vulnerability that is lower than the high vulnerability when TXm is used. Τhe use of HD produces high vulnerability for all scenarios. In comparison with TXm, HD shows the same behavior as TXm except for the first period of scenario RCP4.5, which produces high vulnerability that is higher than the medium vulnerability when TXm is used. Generally, the use of TNm, TR and TX35 show lower scores than TXm, while the use of HD show higher scores than TXm. This behaviour can be explained with the help of Figure 4 that shows graphically the values of the indicators for the group HC1 & HC2 in the two periods of the two scenarios.
For group hazards WD1, WD4 & WD5 the use of PRCPTOT shows the same behavior as CDD except for the second period of scenario RCP4.5. In this scenario the vulnerability of all groups increases from medium (M) to high (H) or low (L) to medium (M) except for the group supporting infrastructure (S) in which the vulnerability remains low (L); however, the vulnerability of the Almopeos D&R system increases from medium to high.
For group hazards WD2 & WD3 the use of R20mm shows the same behavior with RX1day only in the first period of the RCP8.5 except for the group of supporting infrastructure (S). In the rest of the scenarios, the vulnerability for all groups of components is reduced from high to medium or from medium to low except for the group supporting infrastructure (S) whose vulnerability score changes significantly from high to low.
Table 11, Table 12 and Table 13 show that the vulnerability of the Almopeos D&R system for all scenarios examined and all indicators is either medium or high and thus the risk assessment of the Almopeos D&R system should be performed for all three groups of hazards (i) temperature increase and extreme heat, (ii) precipitation decrease, aridity and droughts and (iii) extreme precipitation and flooding. In other words, practically the outcome of the vulnerability analysis for the Almopeos D&R system is independent of the indicators used. However, this is not the case with the individual components of the Almopeos D&R system or their groups; for example, in both periods of the scenario RCP4.5, when the indicator Rx1day is used the vulnerability of group S to the group hazards WD1, WD4 & WD5 ranges from medium to high suggesting that a risk analysis should be performed, but the use of the indicator R20 results in low vulnerability and suggests the opposite. Therefore, it is important to select the proper indicators in the exposure analysis.
4.3. Research Needs
In the present work, the same indicators were used for all components of the Almopeos D&R system to simplify the analysis; however, the analysis would have been more accurate when different indicators were used for the various components of the system (see Table 3, Table 4 and Table 5).
Generally, in most of the infrastructure including D&R systems, climate indicators are selected among these proposed by recognized organizations, such as ETCCDI [56], IPCC [57], WMO [58] and Climate –Adapt [59,60], which are not always the proper ones for the specific type of infrastructure under investigation. There is urgent need to develop new indicators for infrastructure systems that represent the basic physical mechanisms of a specific climate hazard and to determine well-defined correlations with the specific components of infrastructure systems (see Table 2). This research on indicators’ analysis requires the cooperation of climate scientists and hydrologists, with experienced researchers and engineers specialized in D&R systems; furthermore, it requires a large amount of data and extensive research and experience [16]. Research is also needed for the development of efficient methods for the determination of the scales and thresholds of the indicators (see Table 7), such as statistical approaches, for example, cluster analysis and non-linear least-squares regression. Moreover, the values and scales of climate indicators need to be adjusted to local conditions; this can be achieved via a more detailed downscaling and subsequent development of high-resolution maps with values of indicators at the local scale, because their current values cannot always be applied in all countries and locations; see also [16].
Research is also required on the sensitivity analysis of D&R systems that necessitates again the cooperation of experienced researchers and engineers specialized in D&R systems. This cooperation aims at acquiring an in-depth knowledge in the analysis of climate change impacts and specifically on the establishment of the relationships “climate hazard— D&R component” for all potential hazards and components that are shown in Tables 3,4 and 5. Ideally, these relationships can be quantitative; however, this requires a large amount of data and extensive mathematical modeling, for example, using CFD models [16]. This procedure can be facilitated by typologizing (i) the climate hazards (see Table 1) and their grouping (see Section 1) and (b) the typologization of the potential impacts of the groups of climate hazards for each group of the D&R components that are shown in Table 3, Table 4 and Table 5.
5. Conclusions
A typologized methodology for the assessment of vulnerability of D&R systems to climate change based on literature was presented that is consistent with EC technical guidelines. This procedure, which was applied indicatively to Almopeos D&R system in Greece, can be applied to any D&R system consisting of specific components to identify fast the potentially important climate risks, thus preparing the ground of the detailed risk analysis and the proposal of adaptation options that will follow. The assessment methodology is structured around a stepwise approach that integrates climate hazard identification, system component analysis, and vulnerability assessment, ensuring a systematic evaluation of climate risks. The application of this approach to the Almopeos Dam highlights the diverse and complex impacts of climate change on D&R systems. Climate hazards such as temperature increase and extreme heat, precipitation decrease, aridity and droughts, and extreme precipitation and flooding were identified as key factors influencing structural integrity, operational efficiency, and overall resilience of dam infrastructure. These hazards not only exacerbate existing failure mechanisms, such as overtopping, piping, and structural instability, but may also introduce new risks that require further investigation and mitigation measures. The results of this study highlight the need to incorporate climate change considerations into dam safety assessments, moving beyond traditional stationary assumptions and adopting a dynamic, risk-based approach.
Author Contributions
Conceptualization, A.I.S. and G.M.; methodology, A.I.S. and G.M.; formal analysis, A.I.S., G.M. and A.T.S.; investigation, A.I.S., G.M., A.S., A.T.S., K.V.V. and C.G.; data curation, A.I.S., G.M., A.T.S. and S.S.; writing—original draft preparation, A.I.S., G.M., A.S., A.T.S., K.V.V., C.G. and A.K.; writing—review and editing, A.I.S., G.M., A.S., A.T.S., K.V.V., C.G., S.S. and A.K.; visualization, G.M.; supervision, A.I.S.; project administration A.I.S. All authors have read and agreed to the published version of the manuscript.
Data Availability Statement
The data and materials of the current work are available from the corresponding author upon reasonable request.
Acknowledgments
The present work was performed within the project “Support the upgrading of the operation of the National Network on Climate Change (Climpact)” of the General Secretariat of Research and Technology under Grant “2023ΝA11900001”. The authors would also like to thank the company HYDRODOMIKI CONSULTING ENGINEERS Ltd that performed the design of the Almopeos Dam and Reservoir system for providing the required data.
Conflicts of Interest
The authors declare no conflicts of interest.
References
- Muñoz-Sabater, J.; Dutra, E.; Agustí-Panareda, A.; Albergel, C.; Arduini, G.; Balsamo, G.; Boussetta, S.; Choulga, M.; Harrigan, S.; Hersbach, H.; et al. ERA5-Land: A State-of-the-Art Global Reanalysis Dataset for Land Applications. Earth Syst. Sci. Data 2021, 13, 4349–4383. [Google Scholar] [CrossRef]
- Association of state - Dam Safety Officials (ASDSO) Dams 101 Available online:. Available online: https://damsafety.org/dams101 (accessed on 8 January 2025).
- Association of state - Dam Safety Officials (ASDSO) Dam Failures and Incidents Available online:. Available online: https://damsafety.org/dam-failures (accessed on 8 January 2025).
- Brunner, G.W. HEC-RAS, River Analysis System Hydraulic Reference Manual,Causes and Types of Dam Failures; Hydrologic Engineering Center (HEC), 2016;
- Association of state - Dam Safety Officials (ASDSO) Earth Dam Failures Available online:. Available online: https://damsafety.org/dam-owners/earth-dam-failures (accessed on 8 January 2025).
- New Hampshire Department of Environmental Services (NHDES) Environmental Fact Sheet - Typical Failure Modes of Embankment Dams; NHDES Dam Bureau, 2020;
- Association of state - Dam Safety Officials (ASDSO) Concrete Gravity Dam Failures Available online:. Available online: https://damsafety.org/dam-owners/concrete-gravity-dam-failures (accessed on 8 January 2025).
- Almog, E.; Kelham, P.; King, R. Modes of Dam Failure and Monitoring and Measuring Techniques; UK, 2011;
- Atkins Impact of Climate Change on Dams & Reservoirs; Atkins: London, UK, 2013.
- Fluixá-Sanmartín, J.; Morales-Torres, A.; Escuder-Bueno, I.; Paredes-Arquiola, J. Quantification of Climate Change Impact on Dam Failure Risk under Hydrological Scenarios: A Case Study from a Spanish Dam. Nat. Hazards Earth Syst. Sci. 2019, 19, 2117–2139. [Google Scholar] [CrossRef]
- Margottini, C.; Canuti, P.; Sassa, K. Landslide Science and Practice: Volume 4: Global Environmental Change; Springer Berlin Heidelberg: Berlin, Heidelberg, 2013; ISBN 978-3-642-31336-3. [Google Scholar]
- Hughes, A.K.; Hunt, D. A Guide to the Effects of Climate Change in Dams; The British Dam Society, 2012.
- Menk, L.; Terzi, S.; Zebisch, M.; Rome, E.; Lückerath, D.; Milde, K.; Kienberger, S. Climate Change Impact Chains: A Review of Applications, Challenges, and Opportunities for Climate Risk and Vulnerability Assessments. Weather, Climate, and Society 2022, 14, 619–636. [Google Scholar] [CrossRef]
- Clarke, L.; Wei, Y.-M.; De La Vega Navarro, A.; Garg, A.; Hahmann, A.N.; Khennas, S.; Azevedo, I.M.L.; Löschel, A.; Singh, A.K.; Steg, L.; et al. Energy Systems. In Climate Change 2022 - Mitigation of Climate Change: Working Group III Contribution to the Sixth Assessment Report of the Intergovernmental Panel on Climate Change; Shukla, P.R., Skea, J., Slade, R., Al Khourdajie, A., van Diemen, R., McCollum, D., Pathak, M., Some, S., Vyas, P., Fradera, R., et al.,; Cambridge University Press: UK, 2023; pp. 613–746.
- Stamou, A. Hydro-Environment Research on Climate Change Adaptation of Water Infrastructure (WI). In Proceedings of the 8th IAHR Europe Congress; IAHR: Lisbon, Portugal, June 4 2024. [Google Scholar]
- Stamou, A.I. The Typologization of Water Research as a Possible Means to Improve the Technical Guidelines on the Adaptation of Water Infrastructure to Climate Change. Hydrolink 2024, 3, 04–08. [Google Scholar]
- Stamou, A.I.; Mitsopoulos, G.; Sfetsos, A.; Stamou, A.T.; Varotsos, K.V.; Giannakopoulos, C.; Koutroulis, A. Typologizing the Hydro-Environmental Research on Climate Change Adaptation of Water Infrastructure in the Mediterranean Region. Atmosphere 2024, 15, 1526. [Google Scholar] [CrossRef]
- Cramer, W.; Guiot, J.; Marini, K.; Azzopardi, B.; Balzan, M.V.; Semia Cherif; Doblas-Miranda, E.; Santos, M.D.; Drobinski, P.; Fader, M.; et al. MedECC 2020 Summary for Policymakers. Climate and Environmental Change in the Mediterranean Basin – Current Situation and Risks for the Future. First Mediterranean Assessment Report; Zenodo: Geneva, Switzerland, 2020;
- Ali, E.; Cramer, j.; Georgopoulou, E.; Hilmi, N.J.M.; Le Cozannet, G.; Lionello, P. Cross-Chapter Paper 4: Mediterranean Region. In In: Climate Change 2022: Impacts, Adaptation and Vulnerability. Contribution of Working Group II to the Sixth Assessment Report of the Intergovernmental Panel on Climate Change ; Pörtner, H.O., Roberts, D.C., Tignor, M., Poloczanska, E.S., Mintenbeck, K., Alegría, A., Craig, M., Langsdorf, S., Löschke, S., Möller, V., et al., Eds; Cambridge University Press: Cambridge, UK and New York, New York, USA; pp. 2233–2272.
- Douvis, K.; Kapsomenakis, J.; Solomos, S.; Poupkou, A.; Stavraka, T.; Nastos, P.; Zerefos, C. Change in Aridity Index in the Mediterranean Region under Different Emission Scenarios. In Proceedings of the 16th International Conference on Meteorology, Climatology and Atmospheric Physics—COMECAP 2023; MDPI, September 5 2023; p. 171.
- Ruffault, J.; Curt, T.; Moron, V.; Trigo, R.M.; Mouillot, F.; Koutsias, N.; Pimont, F.; Martin-StPaul, N.; Barbero, R.; Dupuy, J.-L.; et al. Increased Likelihood of Heat-Induced Large Wildfires in the Mediterranean Basin. Sci Rep 2020, 10, 13790. [Google Scholar] [CrossRef]
- Capolongo, D.; Diodato, N.; Mannaerts, C.M.; Piccarreta, M.; Strobl, R.O. Analyzing Temporal Changes in Climate Erosivity Using a Simplified Rainfall Erosivity Model in Basilicata (Southern Italy). Journal of Hydrology 2008, 356, 119–130. [Google Scholar] [CrossRef]
- International Commission on Large Dams - ICOLD Global Climate Change, Dams, Reservoirs and Related Water Resources”; 2016;
- Mallakpour, I.; AghaKouchak, A.; Sadegh, M. Climate-Induced Changes in the Risk of Hydrological Failure of Major Dams in California. Geophysical Research Letters 2019, 46, 2130–2139. [Google Scholar] [CrossRef]
- Rocha, J.; Carvalho-Santos, C.; Diogo, P.; Beça, P.; Keizer, J.J.; Nunes, J.P. Impacts of Climate Change on Reservoir Water Availability, Quality and Irrigation Needs in a Water Scarce Mediterranean Region (Southern Portugal). Science of The Total Environment 2020, 736, 139477. [Google Scholar] [CrossRef]
- Ghimire, S.N.; Schulenberg, J.W.; Neilsen, M.L. Sensitivity Analysis of the Auxiliary Spillway Erosion Based on the Material and Structural Properties. In Geo-Extreme 2021; pp. 111–126.
- Ghimire, S.N.; Schulenberg, J.W. Impacts of Climate Change on the Environment, Increase in Reservoir Levels, and Safety Threats to Earthen Dams: Post Failure Case Study of Two Cascading Dams in Michigan. Civil and Environmental Engineering 2022, 18, 551–564. [Google Scholar] [CrossRef]
- Juško, V.; Sedmák, R.; Kúdela, P. Siltation of Small Water Reservoir under Climate Change: A Case Study from Forested Mountain Landscape of Western Carpathians, Slovakia. Water 2022, 14, 2606. [Google Scholar] [CrossRef]
- Wilk, P.; Szlapa, M.; Hachaj, P.S.; Orlińska-Woźniak, P.; Jakusik, E.; Szalińska, E. From the Source to the Reservoir and beyond—Tracking Sediment Particles with Modeling Tools under Climate Change Predictions (Carpathian Mts.). J Soils Sediments 2022, 22, 2929–2947. [Google Scholar] [CrossRef]
- Sant’Anna, C.; Tilmant, A.; Pulido-Velazquez, M. A Hydrologically-Driven Approach to Climate Change Adaptation for Multipurpose Multireservoir Systems. Climate Risk Management 2022, 36, 100427. [Google Scholar] [CrossRef]
- MacTavish, L.; Bourgeois, G.; Lafleur, C.; Ristic, E. Climate Change Adaptation for Dams. A Review of Climate Vulnerabilities, Adaptation Measures, and Opportunities for Growth in the Canadian Dams Context; Canadian Standards Association: Toronto, ON, 2022; p. 52. [Google Scholar]
- Ozkan, I.; Kadhom, B.; Roshani, E.; Shirkhani, H.; Hiedra-Cobo, J.; Cusson, D.; Nkinamubanzi, P.-C. Adaptation of Dams to Climate Change: Gap Analysis; National Research Council of Canada. Construction Research Centre, 2023; Vol. A1-020144-R01;
- Krztoń, W.; Walusiak, E.; Wilk-Woźniak, E. Possible Consequences of Climate Change on Global Water Resources Stored in Dam Reservoirs. Science of The Total Environment 2022, 830, 154646. [Google Scholar] [CrossRef] [PubMed]
- Brandesten, C.-O. Impact of Climate Change on Dam Safety; Energiforsk AB: Sweden, 2023. [Google Scholar]
- Zhang, J.; Shang, Y. Nexus of Dams, Reservoirs, Climate, and the Environment: A Systematic Perspective. Int. J. Environ. Sci. Technol. 2023, 20, 12707–12716. [Google Scholar] [CrossRef]
- Lompi, M.; Mediero, L.; Soriano, E.; Caporali, E. Climate Change and Hydrological Dam Safety: A Stochastic Methodology Based on Climate Projections. Hydrological Sciences Journal 2023, 68, 745–763. [Google Scholar] [CrossRef]
- Savino, M.; Todaro, V.; Maranzoni, A.; D’Oria, M. Combining Hydrological Modeling and Regional Climate Projections to Assess the Climate Change Impact on the Water Resources of Dam Reservoirs. Water 2023, 15, 4243. [Google Scholar] [CrossRef]
- European Commission (EC) Commission Notice — Technical Guidance on the Climate Proofing of Infrastructure in the Period 2021-2027 2021.
- Stamou, A.; Mitsopoulos, G.; Koutroulis, A. Proposed Methodology for Climate Change Adaptation of Water Infrastructures in the Mediterranean Region. Environ. Process. 2024, 11, 12. [Google Scholar] [CrossRef]
- The world bank Trust Fund for Environmentally & Socially Sustainable Development, Water & Climate Adaptation Plan for the Sava River Basin, ANNEX 3 - Guidance Note on Adaptation to Climate Change for– Hydropower; 2015;
- Helman, J.M. It’s Hot and Getting Hotter: Implications of Extreme Heat on Water Utility Staff and Infrastructure, and Ideas for Adapting; WUCA & AMWA, 2020.
- European Commission. Directorate General for Climate Action. EU-Level Technical Guidance on Adapting Buildings to Climate Change.; Publications Office: LU, 2023. [Google Scholar]
- Wang, W.; Shi, K.; Wang, X.; Zhang, Y.; Qin, B.; Zhang, Y.; Woolway, R.I. The Impact of Extreme Heat on Lake Warming in China. Nat Commun 2024, 15, 70. [Google Scholar] [CrossRef]
- European Investment Bank, JASPERS Publications Office Approach to Climate Proofing for Water and Wastewater Projects Available online:. Available online: https://jaspers.eib.org/knowledge/publications/climate-proofing-of-water-and-wastewater-projects (accessed on 28 February 2025).
- European Investment Bank, JASPERS Publications Office Case Study:Climate Proofing of Water and Wastewater Projects Available online:. Available online: https://jaspers.eib.org/knowledge/publications/climate-proofing-of-water-and-wastewater-projects (accessed on 28 February 2025).
- European Investment Bank, JASPERS Publications Office Approach to Climate Proofing for Flood and Disaster Risk Management Projects Available online:. Available online: https://jaspers.eib.org/knowledge/publications/climate-proofing-of-flood-and-disaster-risk -management-projects (accessed on 28 February 2025).
- European Investment Bank, JASPERS Publications Office Case Study: Climate Proofing of a Flood Protection Project Available online:. Available online: https://jaspers.eib.org/knowledge/publications/climate-proofing-of-flood-and-disaster-risk -management-projects (accessed on 28 February 2025).
- BS EN 1990:2002 EN 1990 Eurocode - Basis of Structural Design; British Standards Institution: London, UK, 1990.
- Haseeb, J. Components of Dams | Functions of Components of Dams Available online:. Available online: https://www.aboutcivil.org/components-of-dams-and-their-functions.html (accessed on 8 January 2025).
- Gopinath, V. Components of Dam – 12 Dam Components Explained Available online:. Available online: https://vincivilworld.com/2022/10/17/components-of-dam-functions/ (accessed on 8 January 2025).
- FEMA Dam Safety Federal Guidelines Available online:. Available online: https://www.fema.gov/emergency-managers/risk-management/dam-safety/federal-guidelines (accessed on 8 January 2025).
- Johnson, M.F.; Albertson, L.K.; Algar, A.C.; Dugdale, S.J.; Edwards, P.; England, J.; Gibbins, C.; Kazama, S.; Komori, D.; MacColl, A.D.C.; et al. Rising Water Temperature in Rivers: Ecological Impacts and Future Resilience. WIREs Water 2024, 11, e1724. [Google Scholar] [CrossRef]
- Malm, R.; Hellgren, R.; Enzell, J. Lessons Learned Regarding Cracking of a Concrete Arch Dam Due to Seasonal Temperature Variations. Infrastructures 2020, 5, 19. [Google Scholar] [CrossRef]
- Colombo, M.; Comi, C. Hydro-Thermo-Mechanical Analysis of an Existing Gravity Dam Undergoing Alkali–Silica Reaction. Infrastructures 2019, 4, 55. [Google Scholar] [CrossRef]
- Vilhena, R.M.; Mascarenha, M.M.D.A.; Sales, M.M.; Romão, P.D.A.; Luz, M.P.D. Estimating the Wind-Generated Wave Erosivity Potential: The Case of the Itumbiara Dam Reservoir. Water 2019, 11, 342. [Google Scholar] [CrossRef]
- Expert Team on Climate Change Detection and Indices (ETCCDI) Indices of CLIMPACT and CLIMDEX Available online: https://www.climdex.org/learn/indices/.
- Intergovernmental Panel On Climate Change (Ipcc) Annex VI: Climatic Impact-Driver and Extreme Indices [Gutiérrez J.M., R. Ranasinghe, A.C. Ruane, R. Vautard (Eds.)]. In Climate Change 2021 – The Physical Science Basis: Working Group I Contribution to the Sixth Assessment Report of the Intergovernmental Panel on Climate Change[Masson-Delmotte, V., P. Zhai, A. Pirani, S.L. Connors, C. Péan, S. Berger, N. Caud, Y. Chen, L. Goldfarb, M.I. Gomis, M. Huang, K. Leitzell, E. Lonnoy, J.B.R. Matthews, T.K. Maycock, T. Waterfield, O. Yelekçi, R. Yu, and B. Zhou (eds.)].; Cambridge University Press, 2021 ISBN 978-1-00-915789-6.
- Svoboda, M.D.; Fuchs, B.A. Handbook of Drought Indicators and Indices; World Meteorological Organization: Geneva, 2016; ISBN 978-92-63-11173-9. [Google Scholar]
- Climate -Adapt Overview List of All Indices Available online:. Available online: https://climate-adapt.eea.europa.eu/en/knowledge/european-climate-data-explorer/overview-list (accessed on 19 December 2024).
- Crespi, A.; Terzi, S.; Cocuccioni, S.; Zebisch, M.; Berckmans, J.; Füssel, H.-M. Climate-Related Hazard Indices for Europe. 2020. [CrossRef]
- Kougianos and Partners; LDK Consultants; Geosynolo LTD; Afrateos I. River Basin Management Plan of Western Macedonia River Basin District - 2nd revision; Ministry of the Environment and Energy, 2024.
- Morrill, J.C.; Bales, R.C.; Conklin, M.H. Estimating Stream Temperature from Air Temperature: Implications for Future Water Quality. J. Environ. Eng. 2005, 131, 139–146. [Google Scholar] [CrossRef]
- Environplan, S.A. ; Aristotle University of Thessaloniki Prefecture Plan for Climate Change Adaptation (PESPKA) - Prefecture of Central Macedonia; Prefecture of Central Macedonia: Thessaloniki, 2023. [Google Scholar]
- Berhanu, B.; Melesse, A.M.; Seleshi, Y. GIS-Based Hydrological Zones and Soil Geo-Database of Ethiopia. CATENA 2013, 104, 21–31. [Google Scholar] [CrossRef]
- Dwi Purwanti, S.; Putu Okta Veanti, D.; Sucahyono Sosaidi, D.; Adhitiansyah, D.; Abil Nurjani, M.; Yuwan Purnama, F.; Fatahilah Raymon, M. Probability of Hotspots Emergence Using Consecutive Dry Days (CDD) in West Kalimantan. E3S Web Conf. 2023, 464, 01001. [Google Scholar] [CrossRef]
- Liu, B.; Yan, Z.; Sha, J.; Li, S. Drought Evolution Due to Climate Change and Links to Precipitation Intensity in the Haihe River Basin. Water 2017, 9, 878. [Google Scholar] [CrossRef]
- Sonar, R.B. Observed Trends and Variations in Rainfall Events over Ratnagiri (Maharashtra) during Southwest Monsoon seasonSonar. MAUSAM 2014, 171–178. [Google Scholar] [CrossRef]
- Mukherjee, S.; Ballav, S.; Soni, S.; Kumar, K.; Kumar De, U. Investigation of Dominant Modes of Monsoon ISO in the Northwest and Eastern Himalayan Region. Theor Appl Climatol 2016, 125, 489–498. [Google Scholar] [CrossRef]
- Faradiba Analysis of Intensity, Duration, and Frequency Rain Daily of Java Island Using Mononobe MethodFaradiba_2021_J._Phys.__Conf._Ser._1783_012107(1).Pdf. Journal of Physics: Conference Series 012107. [CrossRef]
- Jacob, D.; Petersen, J.; Eggert, B.; Alias, A.; Christensen, O.B.; Bouwer, L.M.; Braun, A.; Colette, A.; Déqué, M.; Georgievski, G.; et al. EURO-CORDEX: New High-Resolution Climate Change Projections for European Impact Research. Reg Environ Change 2014, 14, 563–578. [Google Scholar] [CrossRef]
- Kjellström, E.; Nikulin, G.; Strandberg, G.; Christensen, O.B.; Jacob, D.; Keuler, K.; Lenderink, G.; Van Meijgaard, E.; Schär, C.; Somot, S.; et al. European Climate Change at Global Mean Temperature Increases of 1.5 and 2 °C above Pre-Industrial Conditions as Simulated by the EURO-CORDEX Regional Climate Models. Earth Syst. Dynam. 2018, 9, 459–478. [Google Scholar] [CrossRef]
- Van Vuuren, D.P.; Edmonds, J.; Kainuma, M.; Riahi, K.; Thomson, A.; Hibbard, K.; Hurtt, G.C.; Kram, T.; Krey, V.; Lamarque, J.-F.; et al. The Representative Concentration Pathways: An Overview. Climatic Change 2011, 109, 5–31. [Google Scholar] [CrossRef]
- Intergovernmental Panel On Climate Change (Ipcc) Climate Change 2022: Impacts, Adaptation and Vulnerability 2022.
- Intergovernmental Panel On Climate Change (IPCC) Summary for Policymakers. In In: Climate Change 2014: Impacts, Adaptation, and Vulnerability. Part A: Global and Sectoral Aspects. Contribution of Working Group II to the Fifth Assessment Report of the Intergovernmental Panel on Climate Change. Field CB, Barros VR, Dokken DJ, Mach KJ, Mastrandrea MD, Bilir TE, Chatterjee M, Ebi KL, Estrada YO, Genova RC, Girma B, Kissel ES, Levy AN, MacCracken S, Mastrandrea PR, White LL (eds); Cambridge University Press: Cambridge, United Kingdom and New York NY USA, 2014; pp. 1–32.
- European Commission (EC) Directive (EU) 2022/2557 of the European Parliament and of the Council of 14 December 2022 on the Resilience of Critical Entities and Repealing Council Directive 2008/114/EC 2022.
- Intergovernmental Panel on Climate Change (IPCC) Climate Change 2022 – Impacts, Adaptation and Vulnerability: Working Group II Contribution to the Sixth Assessment Report of the Intergovernmental Panel on Climate Change; Cambridge University Press: Cambridge, 2023.
Figure 1.
Plan view of Almopeos dam: ( 1) Dam, (2) spillway, (3) collector channel, (4) fall channel, (5) stilling basin, (6) escape channel, (7) water abstraction well, (8) outlet water channel, (9) flushing pipe, (10) flushing sluice gate, (11) administration building, (12) irrigation pipe, (13) access road to administration building, (14) access road to spillway and (15) Almopeos River axis.
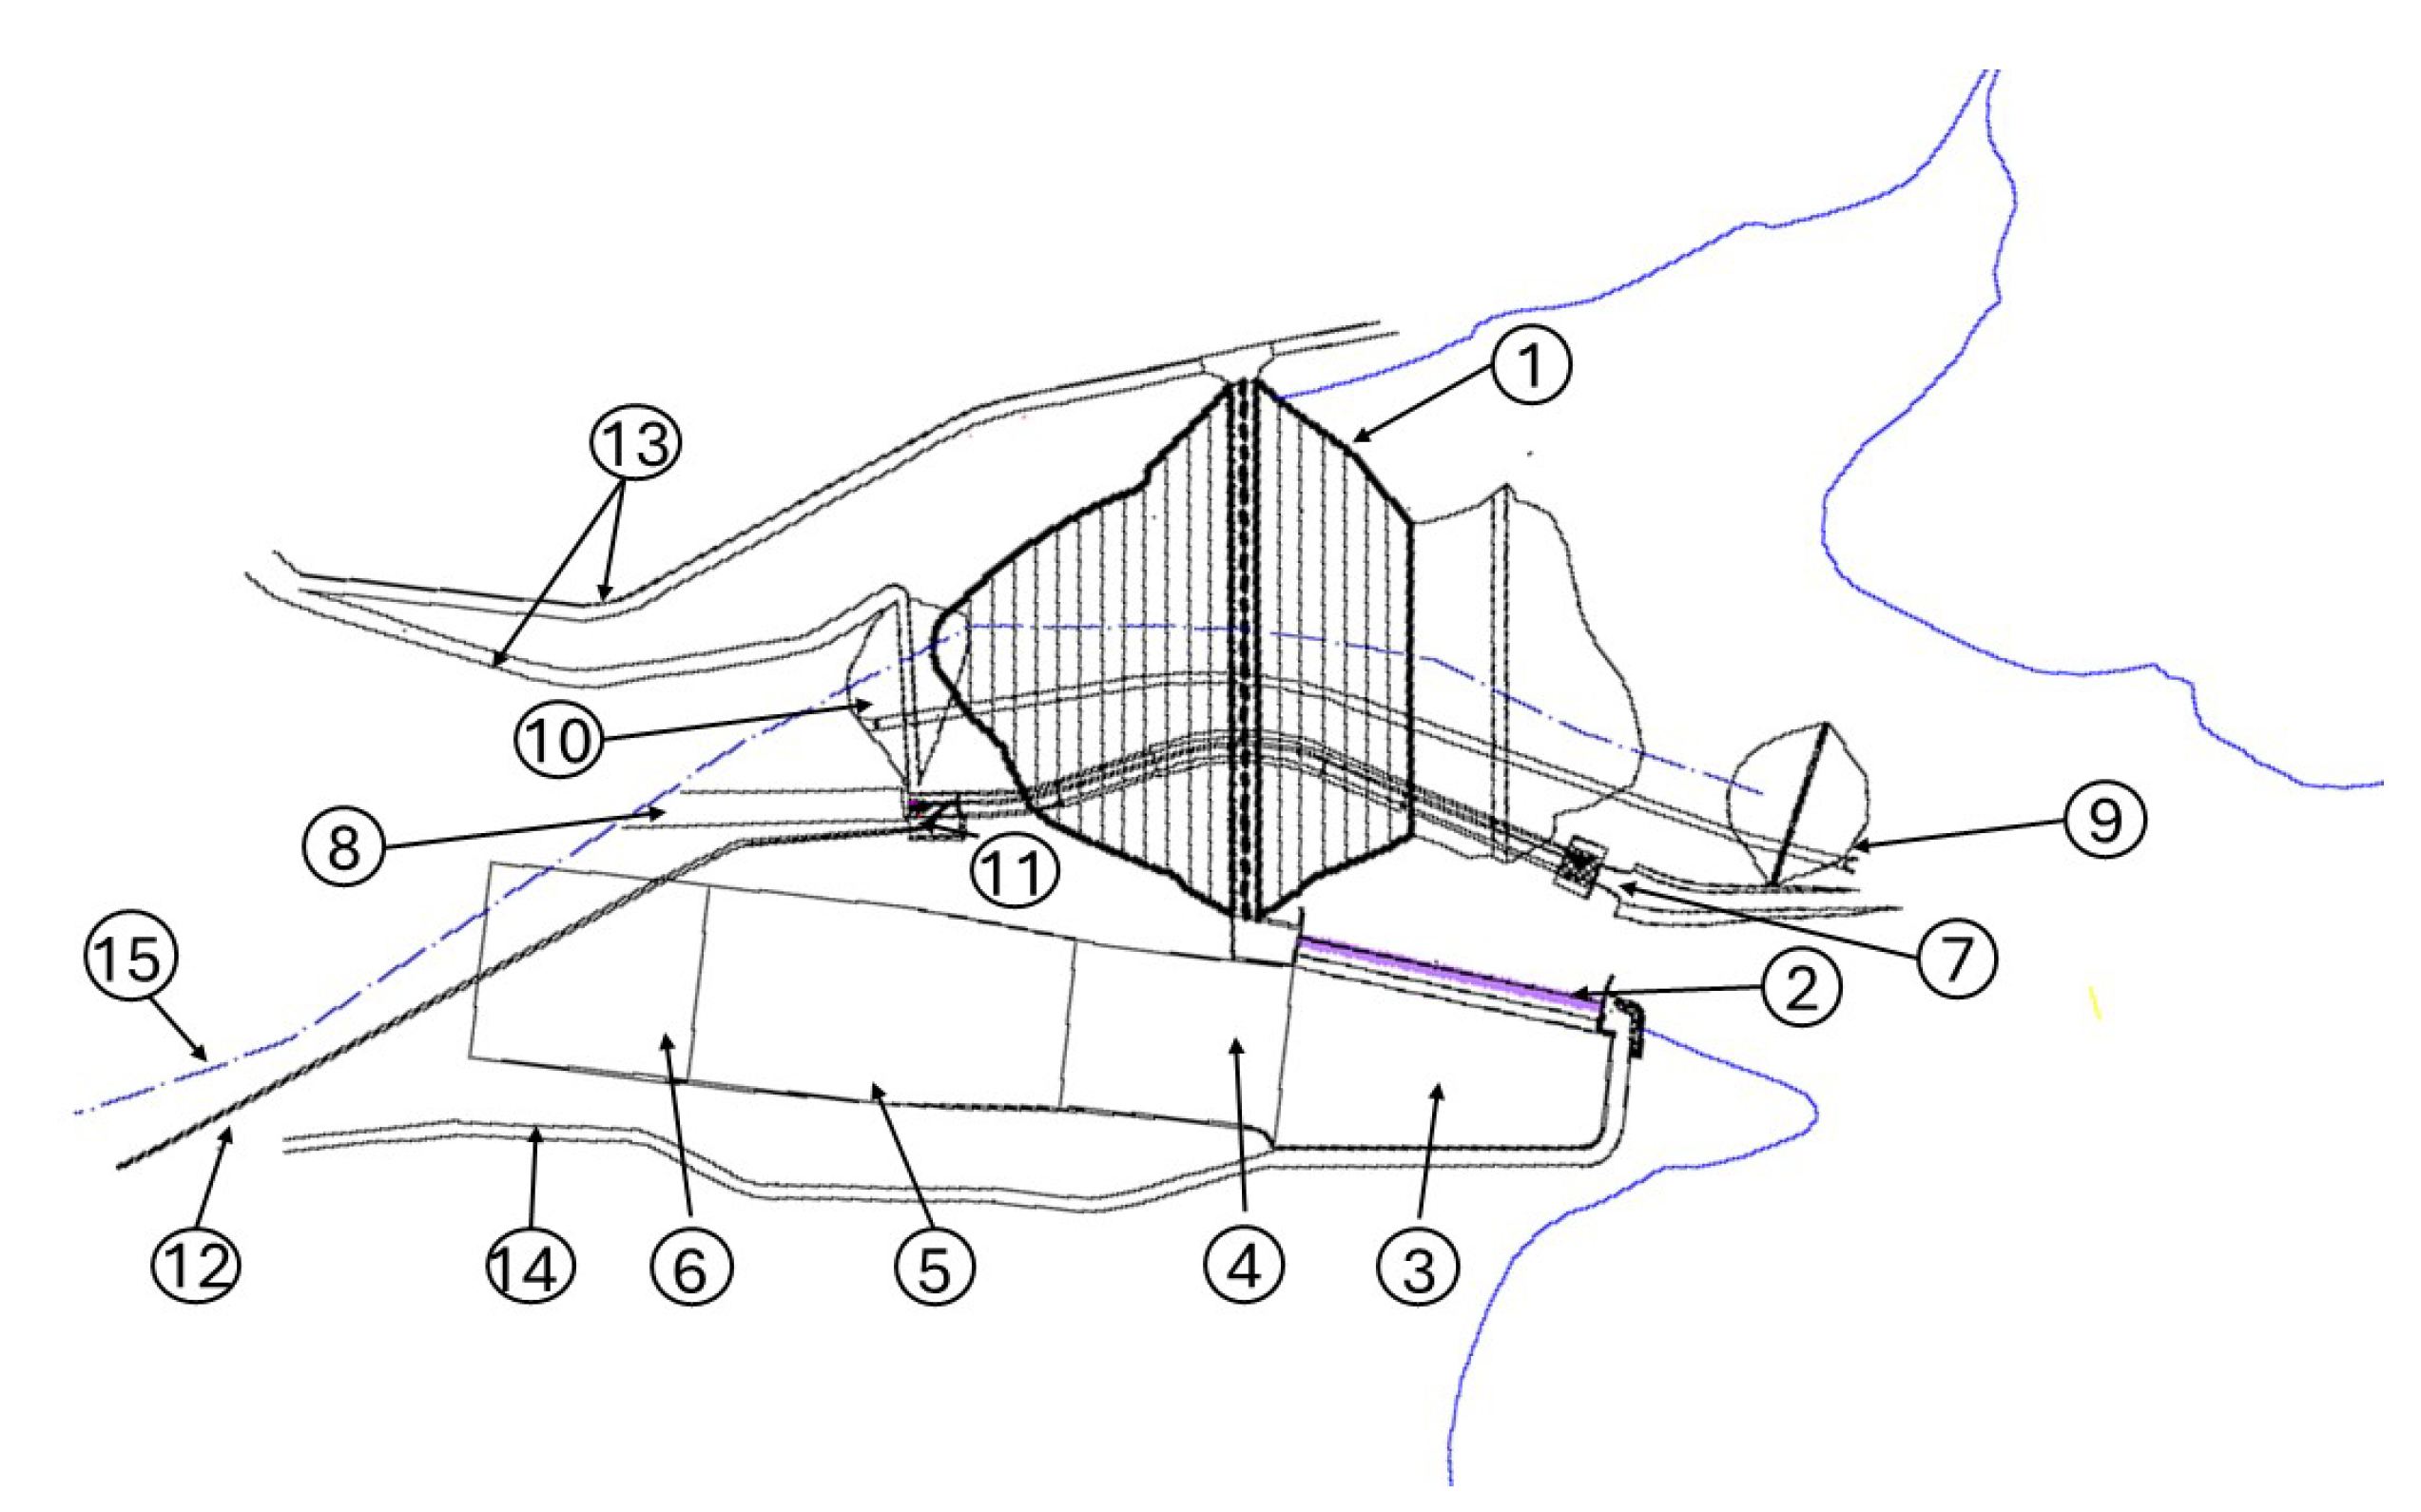
Figure 2.
Cross section of Almopeos dam. (1) Core, (2) fine-grained filter layer, (3) coarse grain filter layer-drain, (4) inner transition shell, (5) outer shell, (6) erosion protection riprap, (7) wave protection riprap, (8) road pavement layer, and (9) concrete diaphragm.
Figure 2.
Cross section of Almopeos dam. (1) Core, (2) fine-grained filter layer, (3) coarse grain filter layer-drain, (4) inner transition shell, (5) outer shell, (6) erosion protection riprap, (7) wave protection riprap, (8) road pavement layer, and (9) concrete diaphragm.
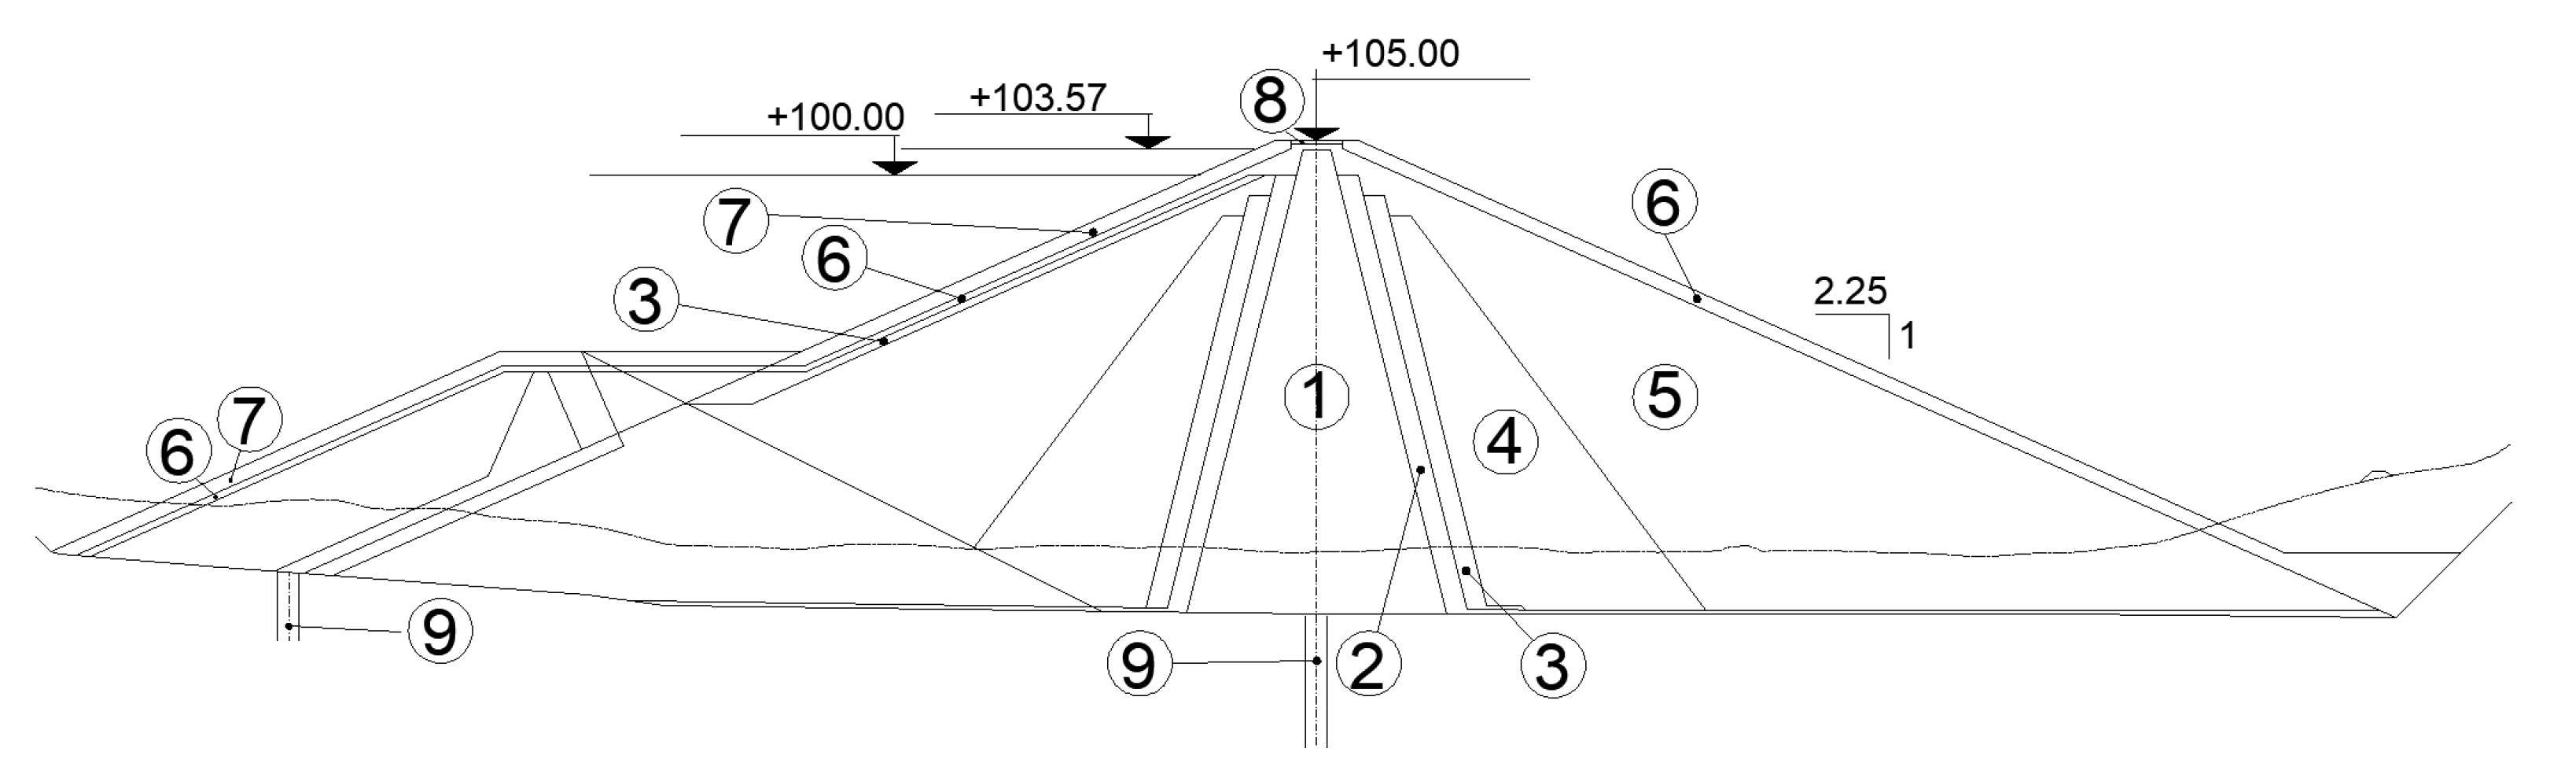
Figure 3.
Overview of the values of the exposure indicators; the left column refers to the period 2041-2060 and the right column to the period 2081-2100 (Color code: green=Low, orange=Medium, red=High).
Figure 3.
Overview of the values of the exposure indicators; the left column refers to the period 2041-2060 and the right column to the period 2081-2100 (Color code: green=Low, orange=Medium, red=High).
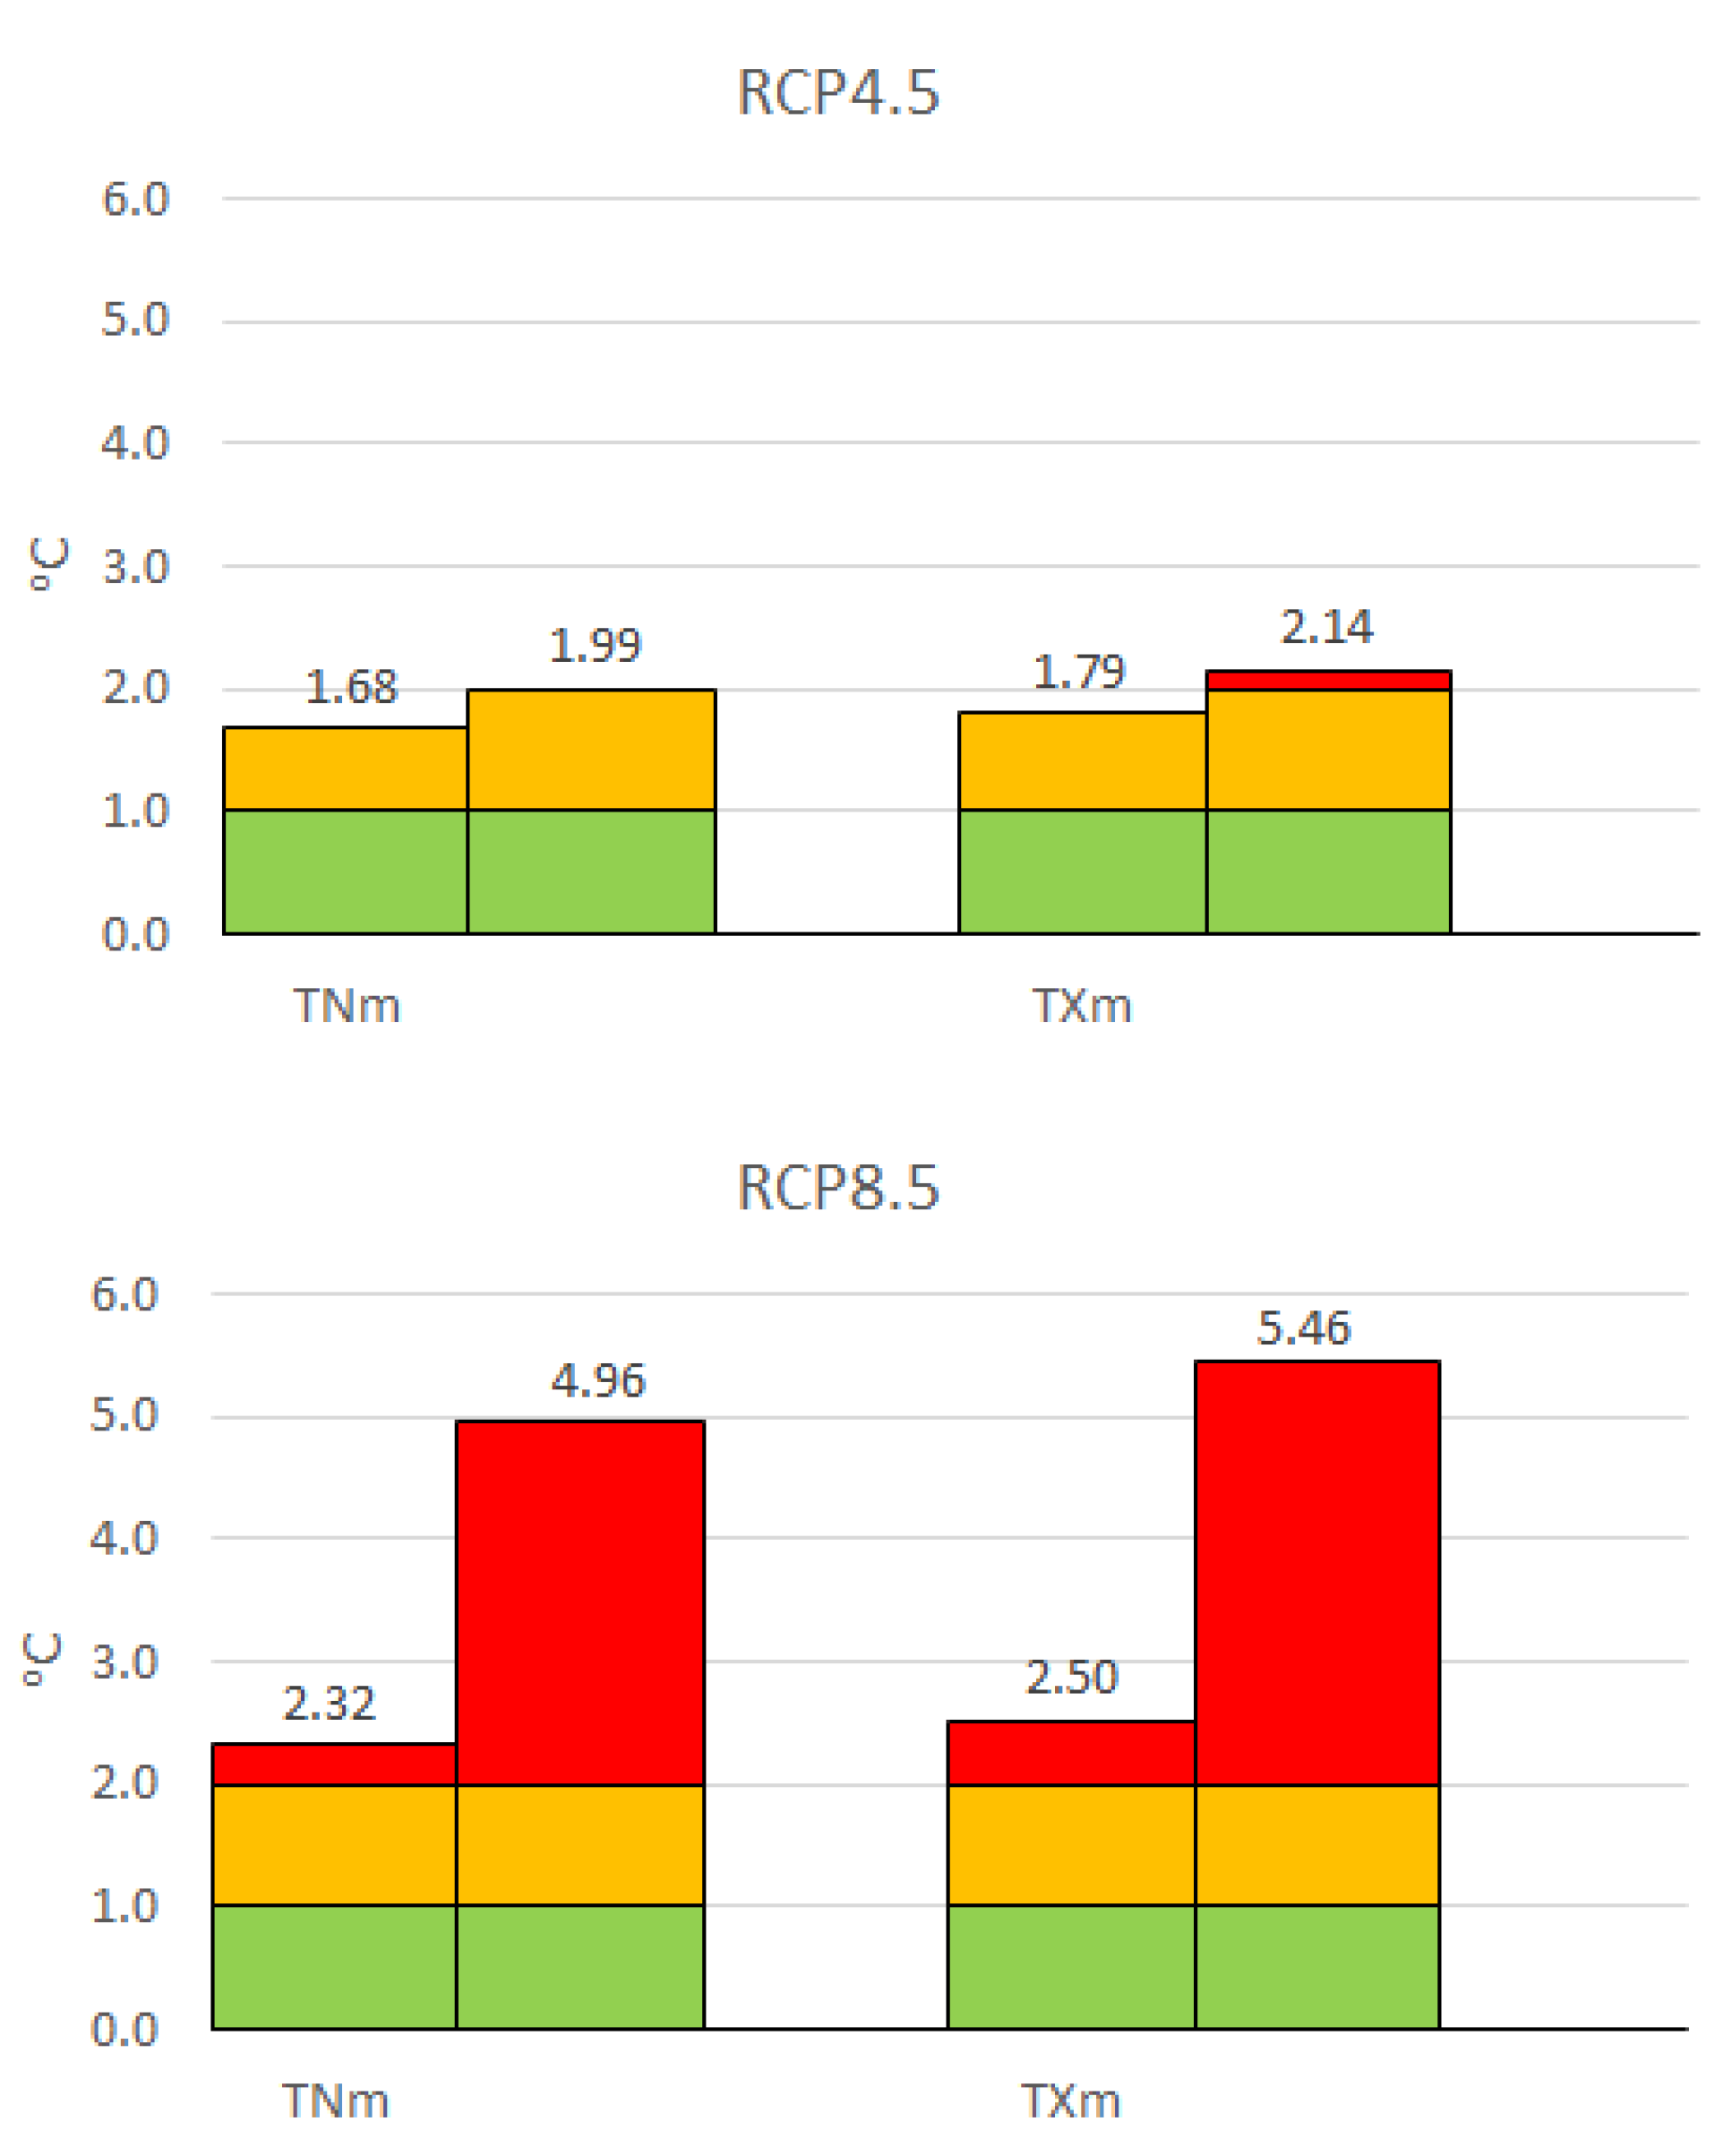
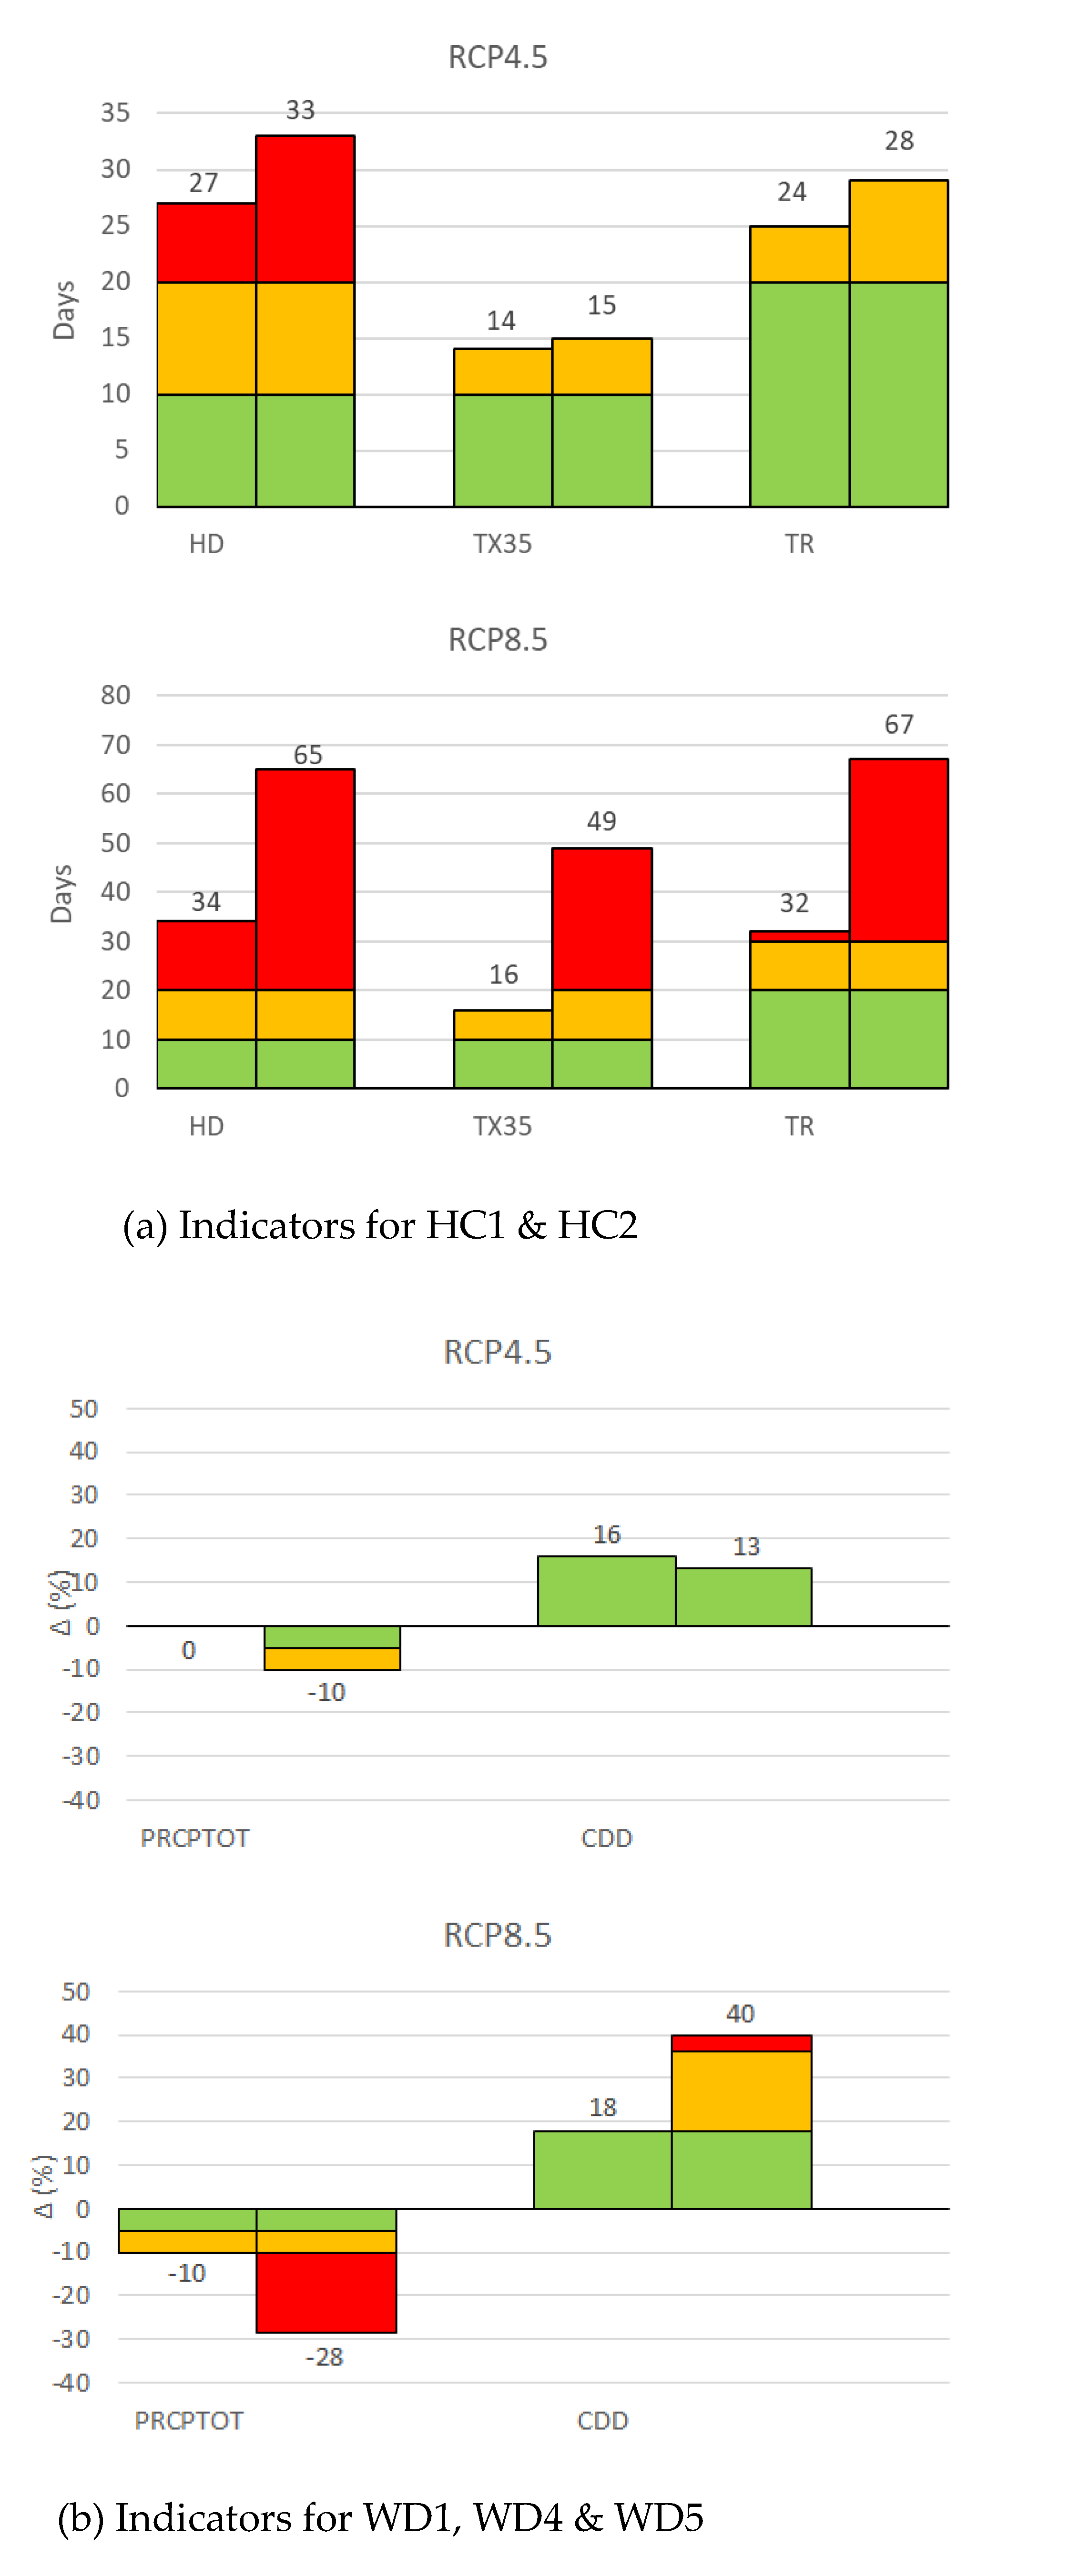

Figure 4.
Graphical representation of the values of indicators for the group HC1 & HC2.
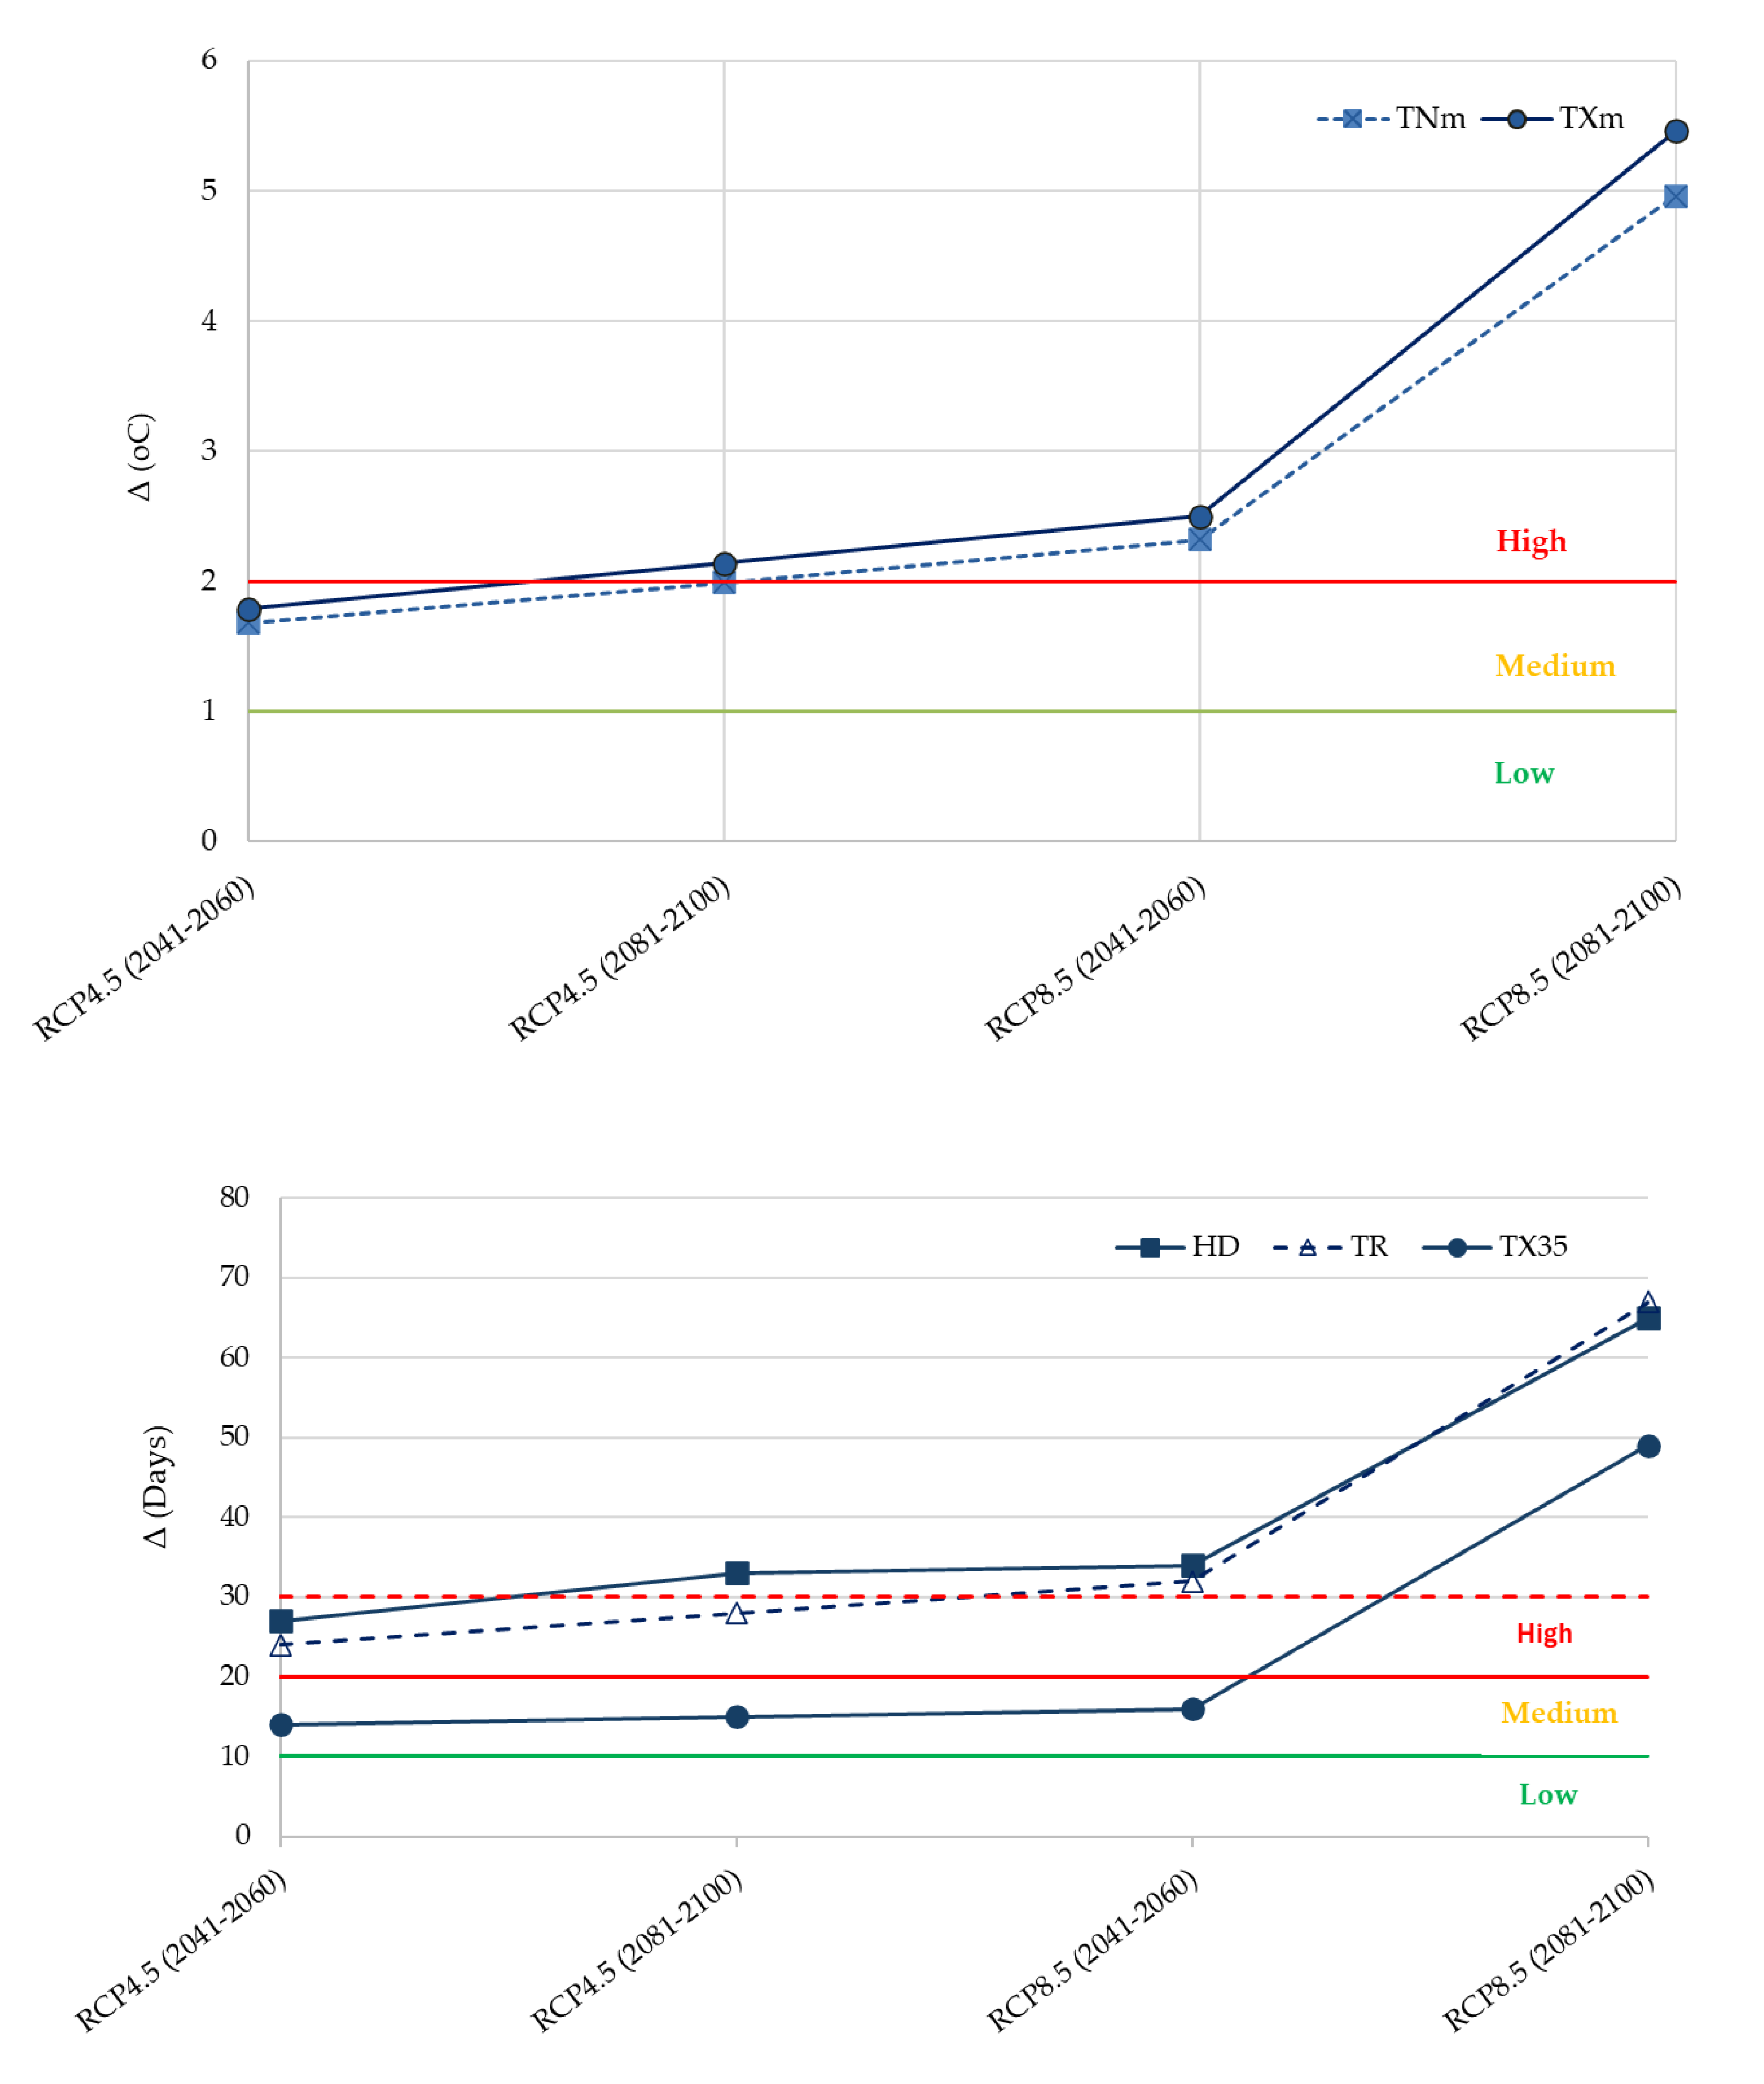
Table 1.
Categories and types of climate hazards for water infrastructure.
| Category of Hazard Based on IPCC [14] | Symbol | Type of Hazard |
|---|---|---|
| Heat and Cold (HC) | HC1 | Mean air temperature (increase) |
| HC2 | Extreme heat—Heat waves | |
| HC3 | Cold spells and frost | |
| Wet and Dry (WD) | WD1 | Mean precipitation (decrease) |
| WD2 | Extreme precipitation | |
| WD3 | Flooding (fluvial and pluvial) | |
| WD4 | Aridity | |
| WD5 | Drought | |
| WD6 | Wildfires | |
| WD7 | Soil erosion | |
| WD8 | Landslide (incl. mudflows) | |
| WD9 | Land subsidence | |
| WD10 | Water temperature | |
| Wind and Air (WA) | WA1 | Mean wind speed (increase) |
| WA2 | Extreme winds | |
| WA3 | Air quality (change) | |
| Coastal (C) | C1 | Relative (mean) sea level (rise) |
| C2 | Coastal flooding | |
| C3 | Coastal erosion | |
| C4 | Saline intrusion | |
| C5 | Sea water temperature (and marine heat waves) | |
| C6 | Sea water quality (incl. salinity and acidity) | |
| Snow and Ice (SI) | SI1 | Snow and land ice |
| SI2 | Avalanche |
Table 2.
Main components of D&R systems .
| Groups of components | Symbol | Component |
|---|---|---|
| Input (I) | I | Inflows |
| Functions (P) | P1 P2 P3 P4 |
Storage Flood control Hydropower Recreation |
| Assets (A) | A1 A2 A3 A4 |
Embankment Spillway Auxiliaries Buildings |
| Outflow (O) | O1 O2 O3 |
Water supply Hydropower production Water releases |
| Supporting infrastructure (S) |
S1 S2 S3 S4 |
Power supply. Communications. Transportation. Personnel. |
Table 3.
Overview of potential impacts of mean air temperature increase and extreme heat and corresponding indicators.
Table 3.
Overview of potential impacts of mean air temperature increase and extreme heat and corresponding indicators.
| Component | Potential impacts | TNm | TMm | TXm | WTLS | GSL | GDD | HD | TX35 | TR | HWD | DTR | CD | ID | FD |
|---|---|---|---|---|---|---|---|---|---|---|---|---|---|---|---|
| T-I Inflows | Increased river water temperature and degraded water quality (Τ-Ι). | √ | √ | √ | |||||||||||
| T-P1 Storage | Increased water temperature; increased vegetation growth; increased evapotranspiration; reduced water storage volume; increased stratification; degraded water quality; increased adverse impacts on fish. | √ | √ | √ | √ | √ | √ | √ | √ | √ | |||||
| T-P2 Flood control |
Improved flood control. | √ | √ | √ | √ | √ | √ | ||||||||
| T-P3 Hydropower | Reduced potential for hydropower production. | √ | √ | ||||||||||||
| T-P4 Recreation | Reduced recreation, aesthetic value and biodiversity; navigation problems. | √ | √ | √ | √ | ||||||||||
| T-A1 Earthfill dams |
Increased growth of shrubs, trees and vegetation; grass kill; tree fall and uprooting during storm events; desiccation and shrinking of clay; erosion of crest and faces of the dam; damages to exposed parts of the dam, such as liners, joint materials and binding mixes (especially during prolonged low/fluctuating reservoir water levels; see D-P1). | √ | √ | √ | √ | √ | √ | √ | √ | ||||||
| T-A1 Concrete dams |
Expansion, cracking and spalling of concrete; damage to concrete and masonry/jointing materials; drying and shrinking of concrete (when combined with persistent drought). | √ | √ | √ | √ | √ | √ | √ | √ | √ | |||||
| T-A2 Spillway | Blockage due to vegetation; thermal expansion and cracking. | √ | √ | √ | √ | √ | √ | √ | √ | √ | |||||
| T-A3 Auxiliaries | Cracking of concrete structures; expansion of metal elements. | √ | √ | √ | √ | √ | √ | √ | √ | √ | |||||
| T-A4 Buildings | Increased power demand for cooling; reduced lifespan of building components. | √ | √ | √ | √ | √ | √ | √ | √ | √ | √ | √ | |||
| T-O1 Water supply |
Water may not be suitable for use due to its degraded quality; increased demand for drinking and irrigation water during hotter summers increases. | √ | √ | √ | |||||||||||
| T-O2 Hydropower | Increased power demand during summers and heat waves. | √ | √ | √ | √ | √ | √ | √ | √ | ||||||
| T-O3 Water releases | Pollution of downstream watercourses with adverse impacts on fish populations; management conflicts for multi-purpose reservoirs. | √ | √ | √ | |||||||||||
| T-S1 Power supply | Increased risk of outages; damage of electrical and electronic components. | √ | √ | √ | √ | √ | √ | √ | √ | √ | √ | √ | √ | ||
| T-S2 Communications | Obscuring monitoring sites and gauge boards; damage of monitoring devices. | √ | √ | √ | √ | √ | √ | √ | √ | √ | √ | √ | √ | ||
| T-S3 Transportation | Damage of parking lot asphalt binders and access roads; poor accessibility. | √ | √ | √ | √ | √ | √ | √ | √ | √ | √ | √ | √ | ||
| T-S4 Personnel | Reduced thermal comfort, occupational health and safety; increased maintenance requirements. | √ | √ | √ | √ | √ | √ | √ | √ | √ | √ | √ | √ |
Table 4.
Overview of potential impacts of decreased mean precipitation, aridity and droughts and corresponding indicators.
Table 4.
Overview of potential impacts of decreased mean precipitation, aridity and droughts and corresponding indicators.
| Component | Potential impacts | PRCPTOT | CDD | CWD | NPD | RDI | SSI | HD | TX35 | TR | HWD |
|---|---|---|---|---|---|---|---|---|---|---|---|
| D-I Inflows | Reduced flowrates and degraded water quality; this impact is more pronounced when it coincides with temperature increase and heat waves. | √ | √ | √ | √ | √ | √ | √ | √ | √ | |
| D-P1 Storage | Reduced reservoir volumes and water levels; prolonged low/fluctuating reservoir water levels resulting in the exposure of parts of the dam; degraded water quality; reduced water supply potential. | √ | √ | √ | √ | √ | √ | √ | √ | ||
| D-P2 flood control | Improved flood control. | √ | √ | √ | √ | √ | √ | √ | |||
| D-P3 Hydropower | Reduced potential for hydropower production. | √ | √ | √ | |||||||
| D-P4 Recreation | Reduced recreation, aesthetic value and biodiversity; prevention of certain types of recreation; health issues. | √ | √ | √ | √ | √ | √ | √ | |||
| D-A1 Earthfill Dams | Desiccation and shrinkage of clay core and dam shoulders; seepage and piping; loss of vegetation cover; soil erosion; subsidence; slumping; dam erosion (when draught is combined with intense rainfall (D-A1); erosion or damage of the exposed parts of the dam due to waves (caused by strong winds on the water surface of reservoirs; see S-A1), and due to high air temperature (see T-A1) and UV sunlight. | ||||||||||
| D-A1 Concrete Dams | Drying and shrinking of concrete (when combined with high temperatures). | ||||||||||
| D-A2 Spillway | - | ||||||||||
| D-A3 Auxiliaries | Increased exposure and wave/sun damage to joint materials. | ||||||||||
| D-A4 Buildings | - | ||||||||||
| D-O1 Water supply | Treatment of water may be required prior to use; increased demand for drinking and irrigation water supply during hotter summers (D-O1). | √ | √ | √ | |||||||
| D-O2 Hydropower | Reduced potential for hydropower production. | √ | √ | √ | |||||||
| D-O3 Water releases | Demand for increased environmental flow; reduced availability for flushing during summer; management conflicts for multi-purpose reservoirs (D-O3). | √ | √ |
√ |
|||||||
| D-S1 Power supply | - | √ | √ | √ | |||||||
| D-S2 Communications | - | ||||||||||
| D-S3 Transportation | - | ||||||||||
| D-S4 Personnel | More difficult working conditions for personnel. | √ | √ | √ | √ | √ |
Table 5.
Overview of potential impacts of extreme precipitation and flooding and corresponding indicators.
Table 5.
Overview of potential impacts of extreme precipitation and flooding and corresponding indicators.
| Component | Potential impacts | PRCPTOT | HR | R20mm | R95pTOT | Rx1day | EP |
|---|---|---|---|---|---|---|---|
| F-I Inflows | Increased flow rates, sediment loads and debris; mobilized vegetation; degraded water quality. | √ | √ | √ | √ | √ | √ |
| F-P1 Storage | Increased water levels: increased sediments, debris, mobilized vegetation and turbidity; rapid fluctuations in operating water levels; degraded water quality; reduced water storage volume due to sediments. | √ | √ | √ | √ | √ | √ |
| F-P2 Flood control | Increased risk for flooding, overtopping and downstream flooding; reduced operating levels to face flood risk. | √ | √ | √ | √ | √ | √ |
| F-P3 Hydropower | Reduced operating levels; reduced availability or flexibility for hydropower generation; increased potential for hydropower production during winter. | √ | √ | √ | √ | √ | |
| F-P4 Recreation | Reduced recreational safety; reduced aesthetic value; negative impacts on navigation and sports. | √ | √ | √ | √ | ||
| F-A1 Earthfill dams | Increased pore pressure; increased risks for piping, overtopping, seepage and erosion. | √ | √ | √ | √ | √ | |
| F-A1 Concrete dams | Increased risks of overtopping, sliding and overturning; increased risk of dam cracking and failure (when sudden heavy rainfall follows persistent drought); increased drainage and erosion of joint materials due to fluctuating water levels or heavy rainfall. | √ | √ | √ | √ | ||
| F-A2 Spillway | Blockage due to mobilized vegetation; failure due to increased flow rates, flow velocities and water levels; rapid deterioration of flaws. | √ | √ | √ | |||
| F-A3 Auxiliaries | Damage of dam components due to debris; failure of pipes; erosion and sediment build-up around structures; landslides; silt buildup and blocking of inlets; rusting of dam components; rapid deterioration of flaws. | √ | √ | √ | √ | ||
| F-A4 Buildings | Damp and mold due to high precipitation; inundation; electricity supply outage. | √ | √ | ||||
| F-O1 Water supply | Treatment of water may be required prior to use. | ||||||
| F-O2 Hydropower | Reduced availability or flexibility for hydropower generation during high precipitation; increased water availability during winter. | ||||||
| F-O3 Water releases | Impacts to downstream watercourses due to flooding, overtopping, piping and pollution. | √ | |||||
| F-S1 Power supply | Outages of power systems. | √ | √ | ||||
| F-S2 Communications | Hampered communications. | ||||||
| F-S3 Transportation | Damaged access roads. | √ | √ | ||||
| F-S4 Personnel | Hampered outdoor working conditions and maintenance. | √ | √ |
Table 8.
Values of the CC indicators for reference and future periods and scenarios.
| Hazard | Indicator | 1981-2000 | 2041- 2060 RCP8.5 |
2081- 2100 RCP8.5 |
2041- 2060 RCP4.5 |
2081- 2100 RCP4.5 |
2041- 2060 RCP8.5 |
2081- 2100 RCP8.5 |
2041- 2060 RCP4.5 |
2081- 2100 RCP4.5 |
|---|---|---|---|---|---|---|---|---|---|---|
| HC1 & HC2 | TNm | 8 | 10.32 | 12.96 | 9.68 | 9.99 | 2.32 | 4.96 | 1.68 | 1.99 |
| TXm | 17.97 | 20.47 | 23.43 | 19.76 | 20.11 | 2.5 | 5.46 | 1.79 | 2.14 | |
| HD | 41 | 75 | 106 | 68 | 74 | 34 | 65 | 27 | 33 | |
| TX35 | 5 | 21 | 54 | 19 | 20 | 16 | 49 | 14 | 15 | |
| TR | 21 | 53 | 88 | 45 | 49 | 32 | 67 | 24 | 28 | |
| WD1, WD4 & WD5 | PRCPTOT | 613 | 549 | 439 | 615 | 550 | -64 | -174 | 2 | -63 |
| CDD | 55 | 65 | 77 | 64 | 62 | 10 | 22 | 9 | 7 | |
| WD2 & WD3 | R20mm | 4 | 5 | 4 | 4 | 4 | 1 | 0 | 0 | 0 |
| Rx1day | 38.85 | 43.12 | 41.31 | 51.06 | 41.58 | 4.27 | 2.46 | 12.21 | 2.73 |
Table 9.
Sensitivity scores for each component of Almopeos D&R system and each group of components.
| Groups of components |
Components | Temperature increase and extreme heat (HC1 &HC2) |
Precipitation decrease, aridity and droughts (WD1, WD4 & WD5) |
Extreme precipitation and flooding (WD2 & WD3) |
|---|---|---|---|---|
| Input (I) | I1 River water | M | H | H |
| Functions (P) | P2 Storage | M | H | H |
| Assets (A) |
A1 Dam | M | M | H |
| A2 Spillway | M | M | H | |
| A3 Auxiliary | L | L | L | |
| A4 Buildings | L | L | M | |
| Outflow (O) |
O1 Water for irrigation | M | H | H |
| O3 Water release | L | M | L | |
| Supporting Infrastructure (S) |
S1 Electric power | M | L | M |
| S2 Communications | L | L | M | |
| S3 Transportation | L | L | M | |
| S4 Personnel | M | L | M | |
| Group I | Highest score of each group |
M | H | H |
| Group P | M | H | H | |
| Group A | M | M | H | |
| Group O | M | H | H | |
| Group S | M | L | M | |
| Almopeos D&R system | Highest score of all groups |
M | H | H |
Table 10.
Overview of the results of the exposure analysis for the Almopeos D&R system (L=Low, M=Medium, H=High).
Table 10.
Overview of the results of the exposure analysis for the Almopeos D&R system (L=Low, M=Medium, H=High).
| Hazard | Indicator | Scenario | |||
|---|---|---|---|---|---|
| RCP8.5 | RCP4.5 | ||||
| 2041- 2060 | 2081- 2100 | 2041- 2060 | 2081- 2100 | ||
| HC1 & HC2 | TXm | H | H | M | H |
| WD1, WD4 & WD5 | CDD | M | H | L | L |
| WD2 & WD3 | Rx1day | H | M | H | M |
Table 11.
Summary of the results of the vulnerability analysis for the Almopeos D&R system (L=Low, M=Medium, H=High).
Table 11.
Summary of the results of the vulnerability analysis for the Almopeos D&R system (L=Low, M=Medium, H=High).
| Exposure | |||||||||||||||
|---|---|---|---|---|---|---|---|---|---|---|---|---|---|---|---|
| Sensitivity | Scenario | RCP8.5 | RCP4.5 | RCP8.5 | RCP4.5 | RCP8.5 | RCP4.5 | ||||||||
| Period | 2041- | 2081- | 2041- | 2081- | 2041- | 2081- | 2041- | 2081- | 2041- | 2081- | 2041- | 2081- | |||
| 2060 | 2100 | 2060 | 2100 | 2060 | 2100 | 2060 | 2100 | 2060 | 2100 | 2060 | 2100 | ||||
| Groups of climate risks (indicator) | HC1 & HC2 (TXm) | WD1, WD4 & WD5 (CDD) | WD2 & WD3 (Rx1day) | ||||||||||||
| Components | I | Ι1 River water | H(M/H) | H(M/H) | M(M/M) | H(M/H) | H(H/M) | H(H/H) | M(H/L) | M(H/L) | H(H/H) | H(H/M) | H(H/H) | H(H/M) | |
| P | P2 Storage | H(M/H) | H(M/H) | M(M/M) | H(M/H) | H(H/M) | H(H/H) | M(H/L) | M(H/L) | H(H/H) | H(H/M) | H(H/H) | H(H/M) | ||
| A | A1 Dam | H(Μ/H) | H(Μ/H) | M(Μ/M) | H(Μ/H) | M(M/M) | H(M/H) | L(M/L) | L(M/L) | H(H/H) | H(H/M) | H(H/H) | H(H/M) | ||
| A2 Spillway | H(M/H) | H(M/H) | M(M/M) | H(M/H) | M(M/M) | H(M/H) | L(M/L) | L(M/L) | H(H/H) | H(H/M) | H(H/H) | H(H/M) | |||
| A3 Auxiliary | M(L/H) | M(L/H) | L(L/M) | M(L/H) | L(L/M) | M(L/H) | L(L/L) | L(L/L) | M(L/H) | L(L/M) | M(L/H) | L(L/M) | |||
| A4 Buildings | M(L/H) | M(L/H) | L(L/M) | M(L/H) | L(L/M) | M(L/H) | L(L/L) | L(L/L) | H(M/H) | M(M/M) | H(M/H) | M(M/M) | |||
| O | O1 Water for irrigation | H(M/H) | H(M/H) | M(M/M) | H(M/H) | H(H/M) | H(H/H) | M(H/L) | M(H/L) | H(H/H) | H(H/M) | H(H/H) | H(H/M) | ||
| O3 Water release | M(L/H) | M(L/H) | L(L/M) | M(L/H) | M(M/M) | H(M/H) | L(M/L) | L(M/L) | M(L/H) | L(L/M) | M(L/H) | L(L/M) | |||
| S | S1 Electric Power | H(M/H) | H(M/H) | M(M/M) | H(M/H) | L(L/M) | M(L/H) | L(L/L) | L(L/L) | H(M/H) | M(M/M) | H(M/H) | M(M/M) | ||
| S2 Communications | M(L/H) | M(L/H) | L(L/M) | M(L/H) | L(L/M) | M(L/H) | L(L/L) | L(L/L) | H(M/H) | M(M/M) | H(M/H) | M(M/M) | |||
| S3 Transportation | M(L/H) | M(L/H) | L(L/M) | M(L/H) | L(L/M) | M(L/H) | L(L/L) | L(L/L) | H(M/H) | M(M/M) | H(M/H) | M(M/M) | |||
| S4 Personnel | H(M/H) | H(M/H) | M(M/M) | H(M/H) | L(L/M) | M(L/H) | L(L/L) | L(L/L) | H(M/H) | M(M/M) | H(M/H) | M(M/M) | |||
| Groups | Group I | H | H | M | H | H | H | M | M | H | H | H | H | ||
| Group P | H | H | M | H | H | H | M | M | H | H | H | H | |||
| Group A | H | H | M | H | M | H | L | L | H | H | H | H | |||
| Group O | H | H | M | H | H | H | M | M | H | H | H | H | |||
| Group S | H | H | M | H | L | M | L | L | H | M | H | M | |||
| D&R Almopeos system | H | H | M | H | H | H | M | M | H | H | H | H | |||
Table 12.
Effect of the coefficients of HC1 and HC2 on the results of the vulnerability analysis for the Almopeos D&R system (L=Low, M=Medium, H=High).
Table 12.
Effect of the coefficients of HC1 and HC2 on the results of the vulnerability analysis for the Almopeos D&R system (L=Low, M=Medium, H=High).
| Exposure | |||||||||||||||
|---|---|---|---|---|---|---|---|---|---|---|---|---|---|---|---|
| Sensitivity | Scenario | RCP8.5 | RCP4.5 | RCP8.5 | RCP4.5 | RCP8.5 | RCP4.5 | ||||||||
| Period | 2041- | 2081- | 2041- | 2081- | 2041- | 2081- | 2041- | 2081- | 2041- | 2081- | 2041- | 2081- | |||
| 2060 | 2100 | 2060 | 2100 | 2060 | 2100 | 2060 | 2100 | 2060 | 2100 | 2060 | 2100 | ||||
| Groups of climate risks | TNm and TR | HD | TX35 | ||||||||||||
| Components | I | Ι1 River water | H(M/H) | H(M/H) | M(M/M) | M↓(M/M↓) | H(M/H) | H(M/H) | H↑(M/H↑) | H(M/H) | M↓(M/M↓) | H(M/H) | M(M/M) | M↓(M/M↓) | |
| P | P2 Storage | H(M/H) | H(M/H) | M(M/M) | M↓(M/M↓) | H(M/H) | H(M/H) | H↑(M/H↑) | H(M/H) | M↓(M/M↓) | H(M/H) | M(M/M) | M↓(M/M↓) | ||
| A | A1 Dam | H(Μ/H) | H(Μ/H) | M(Μ/M) | M↓(M/M↓) | H(Μ/H) | H(Μ/H) | H↑(M/H↑) | H(Μ/H) | M↓(M/M↓) | H(Μ/H) | M(Μ/M) | M↓(M/M↓) | ||
| A2 Spillway | H(M/H) | H(M/H) | M(M/M) | M↓(M/M↓) | H(M/H) | H(M/H) | H↑(M/H↑) | H(M/H) | M↓(M/M↓) | H(M/H) | M(M/M) | M↓(M/M↓) | |||
| A3 Auxiliary | M(L/H) | M(L/H) | L(L/M) | L↓ (L/M↓) | M(L/H) | M(L/H) | M↑(L/H↑) | M(L/H) | L↓ (L/M↓) | M(L/H) | L(L/M) | L↓ (L/M↓) | |||
| A4 Buildings | M(L/H) | M(L/H) | L(L/M) | L↓ (L/M↓) | M(L/H) | M(L/H) | M↑(L/H↑) | M(L/H) | L↓ (L/M↓) | M(L/H) | L(L/M) | L↓ (L/M↓) | |||
| O | O1 Water for irrigation | H(M/H) | H(M/H) | M(M/M) | M↓(M/M↓) | H(M/H) | H(M/H) | H↑(M/H↑) | H(M/H) | M↓(M/M↓) | H(M/H) | M(M/M) | M↓(M/M↓) | ||
| O3 Water release | M(L/H) | M(L/H) | L(L/M) | L↓ (L/M↓) | M(L/H) | M(L/H) | M↑(L/H↑) | M(L/H) | L↓ (L/M↓) | M(L/H) | L(L/M) | L↓ (L/M↓) | |||
| S | S1 Electric Power | H(M/H) | H(M/H) | M(M/M) | M↓(M/M↓) | H(M/H) | H(M/H) | H↑(M/H↑) | H(M/H) | M↓(M/M↓) | H(M/H) | M(M/M) | M↓(M/M↓) | ||
| S2 Communications | M(L/H) | M(L/H) | L(L/M) | L↓ (L/M↓) | M(L/H) | M(L/H) | M↑(L/H↑) | M(L/H) | L↓ (L/M↓) | M(L/H) | L(L/M) | L↓ (L/M↓) | |||
| S3 Transportation | M(L/H) | M(L/H) | L(L/M) | L↓ (L/M↓) | M(L/H) | M(L/H) | M↑(L/H↑) | M(L/H) | L↓ (L/M↓) | M(L/H) | L(L/M) | L↓ (L/M↓) | |||
| S4 Personnel | H(M/H) | H(M/H) | M(M/M) | M↓(M/M↓) | H(M/H) | H(M/H) | H↑(M/H↑) | H(M/H) | M↓(M/M↓) | H(M/H) | M(M/M) | M↓(M/M↓) | |||
| Groups | Group I | H | H | M | M↓ | H | H | H↑ | H | M↓ | H | M | M↓ | ||
| Group P | H | H | M | M↓ | H | H | H↑ | H | M↓ | H | M | M↓ | |||
| Group A | H | H | M | M↓ | H | H | H↑ | H | M↓ | H | M | M↓ | |||
| Group O | H | H | M | M↓ | H | H | H↑ | H | M↓ | H | M | M↓ | |||
| Group S | H | H | M | M↓ | H | H | H↑ | H | M↓ | H | M | M↓ | |||
| D&R Almopeos system | H | H | M | M↓ | H | H | H↑ | H | M↓ | H | M | M↓ | |||
Table 13.
Effect of the coefficients PRCTOT and R20 on the results of the vulnerability analysis for the Almopeos D&R system (L=Low, M=Medium, H=High).
Table 13.
Effect of the coefficients PRCTOT and R20 on the results of the vulnerability analysis for the Almopeos D&R system (L=Low, M=Medium, H=High).
| Exposure | |||||||||||
|---|---|---|---|---|---|---|---|---|---|---|---|
| Sensitivity | Scenario | RCP8.5 | RCP4.5 | RCP8.5 | RCP4.5 | ||||||
| Period | 2041- | 2081- | 2041- | 2081- | 2041- | 2081- | 2041- | 2081- | |||
| 2060 | 2100 | 2060 | 2100 | 2060 | 2100 | 2060 | 2100 | ||||
| Groups of climate risks | PRCTOT | R20 | |||||||||
| Components | I | Ι1 River water | H(H/M) | H(H/H) | M(H/L) | H↑(H/M↑) | H(H/M↓) | M↓(H/L↓) | M↓(H/L↓) | M↓(H/L↓) | |
| P | P2 Storage | H(H/M) | H(H/H) | M(H/L) | H↑(H/M↑) | H(H/M↓) | M↓(H/L↓) | M↓(H/L↓) | M↓(H/L↓) | ||
| A | A1 Dam | M(M/M) | H(M/H) | L(M/L) | M↑(M/M↑) | H(H/M↓) | M↓(H/L↓) | M↓(H/L↓) | M↓(H/L↓) | ||
| A2 Spillway | M(M/M) | H(M/H) | L(M/L) | M↑(M/M↑) | H(H/M↓) | M↓(H/L↓) | M↓(H/L↓) | M↓(H/L↓) | |||
| A3 Auxiliary | L(L/M) | M(L/H) | L(L/L) | L(L/M↑) | L↓(L/M↓) | L(L/L↓) | L(L/L↓) | L(L/L↓) | |||
| A4 Buildings | L(L/M) | M(L/H) | L(L/L) | L(L/M↑) | M↓(M/M↓) | L↓(M/L↓) | L↓(M/L↓) | L↓(M/L↓) | |||
| O | O1 Water for irrigation | H(H/M) | H(H/H) | M(H/L) | H↑(H/M↑) | H(H/M↓) | M↓(H/L↓) | M↓(H/L↓) | M↓(H/L↓) | ||
| O3 Water release | M(M/M) | H(M/H) | L(M/L) | M↑(M/M↑) | L↓(L/M↓) | L(L/L↓) | L(L/L↓) | L(L/L↓) | |||
| S | S1 Electric Power | L(L/M) | M(L/H) | L(L/L) | L(L/M↑) | M↓(M/M↓) | L↓(M/L↓) | L↓(M/L↓) | L↓(M/L↓) | ||
| S2 Communications | L(L/M) | M(L/H) | L(L/L) | L(L/M↑) | M↓(M/M↓) | L↓(M/L↓) | L↓(M/L↓) | L↓(M/L↓) | |||
| S3 Transportation | L(L/M) | M(L/H) | L(L/L) | L(L/M↑) | M↓(M/M↓) | L↓(M/L↓) | L↓(M/L↓) | L↓(M/L↓) | |||
| S4 Personnel | L(L/M) | M(L/H) | L(L/L) | L(L/M↑) | M↓(M/M↓) | L↓(M/L↓) | L↓(M/L↓) | L↓(M/L↓) | |||
| Groups | Group I | H | H | M | H↑ | H | M↓ | M↓ | M↓ | ||
| Group P | H | H | M | H↑ | H | M↓ | M↓ | M↓ | |||
| Group A | M | H | L | M↑ | H | M↓ | M↓ | M↓ | |||
| Group O | H | H | M | H↑ | H | M↓ | M↓ | M↓ | |||
| Group S | L | M | L | L | M↓ | L↓ | L↓ | L↓ | |||
| D&R Almopeos system | H | H | M | H↑ | H | M↓ | M↓ | M↓ | |||
Disclaimer/Publisher’s Note: The statements, opinions and data contained in all publications are solely those of the individual author(s) and contributor(s) and not of MDPI and/or the editor(s). MDPI and/or the editor(s) disclaim responsibility for any injury to people or property resulting from any ideas, methods, instructions or products referred to in the content. |
© 2025 by the authors. Licensee MDPI, Basel, Switzerland. This article is an open access article distributed under the terms and conditions of the Creative Commons Attribution (CC BY) license (http://creativecommons.org/licenses/by/4.0/).
Copyright: This open access article is published under a Creative Commons CC BY 4.0 license, which permit the free download, distribution, and reuse, provided that the author and preprint are cited in any reuse.


