
Submitted:
17 March 2025
Posted:
18 March 2025
You are already at the latest version
Abstract
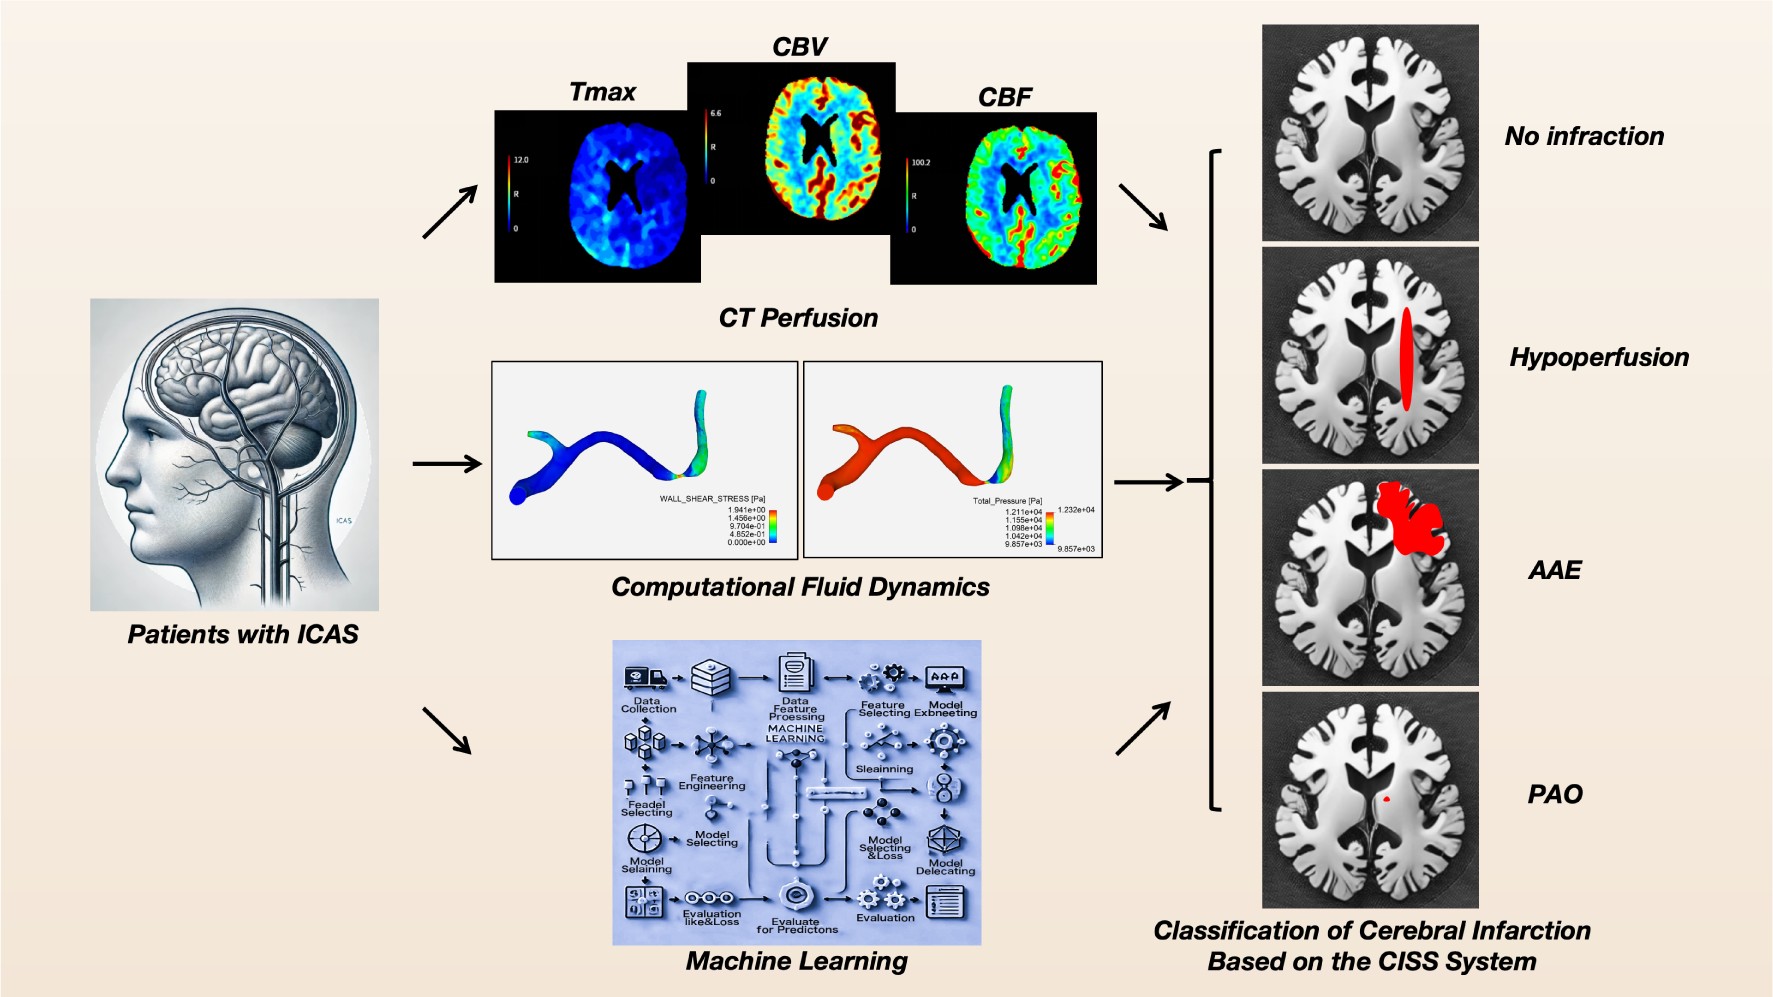
Background: Intracranial atherosclerotic stenosis (ICAS) is a primary cause of ischemic stroke and understanding its pathogenesis aids in therapeutic decision-making. This study integrates computational fluid dynamics (CFD), CT perfusion (CTP) metrics, anatomical indexes, and machine learning to classify anterior circulation ICAS within the Chinese Ischemic Stroke Subclassification (CISS) framework and identify characteristics of different stroke mechanisms. Methods: A total of 118 ICAS patients were classified based on CISS criteria. Key indicators were identified through one-way ANOVA, correlation, and effect size analysis. A decision tree model established thresholds for stroke mechanisms, and six machine learning models were evaluated for classification performance using confusion matrices, ROC curves, and PR curves. Results: Time to Maximum (Tmax)> 4.0s, Area stenosis rate (AS%), wall shear stress ratio (WSSR), and pressure ratio (PR) were key indicators for classification, while cerebral blood flow (CBF) and cerebral blood volume (CBV) showed no significant differences across infarction types. Thresholds identified included Tmax > 4.0s = 49.85 ml, WSSR = 52.79/86.51, PR = 0.69, and AS% = 0.73. Logistic regression outperformed other models (AUC = 0.923, AP = 0.872), followed by the ensemble model. Conclusion: Combining CFD and CTP metrics with machine learning effectively classifies anterior circulation ICAS-related stroke mechanisms within CISS typing, offering a reliable approach for precise diagnosis and individualized treatment of ischemic stroke.
Keywords:
computational fluid dynamics
; hemodynamics
; intracranial atherosclerotic stenosis
; machine learning
; CT Perfusion
1. Introduction
In cerebrovascular diseases, the incidence of ischemic stroke reaches as high as 87%, with a disability rate exceeding 50% [1,2]. Intracranial atherosclerotic stenosis (ICAS) is one of the most common causes of ischemic stroke or transient ischemic attack (TIA) worldwide [3]. The report indicates that the annual mortality rate for intracranial internal carotid artery stenosis in the anterior circulation is 12.4%, whereas the annual mortality rate for middle cerebral artery (MCA) stenosis is 6.8% [4]. Thus, investigation of the underlying mechanism of ICAS progression, prevention, and treatment may greatly decrease the incidence and mortality of ischemic stroke [5].
The classification of ischemic stroke is essential to optimize treatment. At present, the Trial of Org 10172 in Acute Stroke Treatment (TOAST) classification system is widely used, but it has limitations in mechanism-oriented stroke classification [6,7,8]. The Chinese Ischemic Stroke Subclassification (CISS) system further categorizes the potential mechanisms of ischemic stroke caused by intracranial and extracranial LAA into four types based on modern imaging techniques: parent artery (plaque or thrombus) occlusion penetrating artery, artery-to-artery embolism, hypoperfusion/embolus clearance impairment, and multiple mechanisms [9]. The CISS classification plays a more positive role in distinguishing stroke mechanisms in ICAS. Due to differing mechanisms, ischemic strokes caused by ICAS may require distinct treatment strategies. Additionally, the stroke mechanism is associated with different recurrence risks of stroke in patients with ICAS undergoing medical treatment [10].
In recent years, computational fluid dynamics (CFD) has been employed to simulate blood flow in ICAS and to explore the clinical implications of its hemodynamic characteristics [11]. Feng et al. identified high wall shear stress ratio (WSSR) as an independent predictor of arterial-to-arterial embolism as a stroke mechanism in patients with anterior circulation ICAS, with this association being more pronounced in patients with low pressure ratio (PR) (large translesional pressure gradients) [12]. Additionally, Li et al. found that patients with medial and cortical border zone infarctions, where hypoperfusion is commonly deemed the stroke mechanism, had a low forward flow (PR ≤ median) independently associated with medial border zone infarction, and a higher incidence of small cortical infarctions in patients with cortical border zone infarctions [13]. These studies indicate that hemodynamics play a crucial role in determining the stroke mechanism of ICAS. The studies between computed tomography perfusion (CTP) and ICAS further underscore its significance in hemodynamic analysis [14,15]. The exploration of the combination of computational fluid dynamics modeling and CT perfusion to predict the etiology of cerebral infarction is still in its infancy.
Machine learning methods have increasingly been integrated into medical research. By extracting relevant information from datasets and uncovering hidden correlations among parameters, machine learning has successfully been employed for diagnosis and prediction of various diseases related to ICAS [16,17]. This study integrates computational fluid dynamics (CFD) indicators and CTP parameters of patients with atherosclerotic stenosis in the anterior intracranial arteries, using the CISS classification as the basis, to construct various machine learning models for determining the causes of cerebral infarction, thereby providing new insights for precise diagnosis and personalized treatment of patients.
2. Materials and Methods
2.1. Study Design and Subjects
This study included patients with ICAS stroke from October 2021 to June 2024. It has been approved by the local Institutional Review Board and informed consent has been obtained from all patients. Inclusion criteria were as follows: (1) adult inpatients with atherosclerotic narrowing of the intracranial internal carotid artery or middle cerebral artery; (2) All patients performed diffusion-weighted MRI; (3) successful construction of a computed tomography angiography (CTA)-based computational fluid dynamics (CFD) model; (4) all underwent digital subtraction angiography (DSA) with an angiographic projection angle recorded ≥25°. Patients were excluded if they had ischemic stroke due to non-atherosclerotic intracranial stenosis (e.g., Moyamoya disease, vasculitis, or dissection), intracranial artery ischemia, or complete occlusion; those with underlying cardiac conditions (e.g., atrial fibrillation); and those who had undergone angioplasty (including intracranial artery surgery, direct or indirect bypass surgery, or carotid endarterectomy) within one month prior to the stroke. The collected baseline data encompass demographic information, admission blood pressure, Modified Rankin Scale (mRS) before onset, admission National Institutes of Health Stroke Scale (NIHSS) score, smoking history, history of hyperlipidemia, hypertension, diabetes, ischemic heart disease, history of ischemic stroke or transient ischemic attack (TIA), and blood tests including glucose, triglycerides, Hemoglobin A1c (HbA1c), High-Density Lipoprotein (HDL), and Low-Density Lipoprotein (LDL) cholesterol.
2.2. Classification of Stroke Mechanisms in Patients Based on CISS
We classified the possible stroke mechanisms in symptomatic ICAS patients based on the location and severity of infarcts in Diffusion-Weighted Imaging (DWI) and the presence of ICAS lesions in MR angiography (MRA) or CTA. According to the CISS criteria [9], stroke mechanisms can be categorized into (1) hypoperfusion, (2) artery-to-artery embolism (AAE), (3) penetrating artery occlusion due to atherosclerotic parent artery occlusion (PAO), and (4) mixed mechanisms (To enhance diagnostic specificity, we have ruled out the mixed mechanism). Two investigators independently classified the possible stroke mechanisms, with discrepancies resolved through consultation with a third researcher. Inter-rater reliability for classification was good (kappa 0.841; 95% CI 0.743-0.939) and intra-rater reliability was also good (kappa 0.875; 95% CI 0.788-0.962).
2.3. Acquisition of CTP Data
The patient underwent a standard multimodal CT protocol upon admission, which included Non-Contrast Computed Tomography (NCCT), single-phase CTA, and whole-brain CTP. The scans were performed using a 256-slice GE Revolution CT scanner (GE Healthcare, Milwaukee, USA) with z-axis coverage of 16 centimeters. All CTP data were automatically generated using the RAPID software (iSchemaView, Menlo Park, CA). Post-processing involved the use of delay and dispersion-corrected singular value decomposition to generate Time to Maximum (Tmax) of the Residue Function, Cerebral Blood Flow (CBF) and Cerebral Blood Volume (CBV).
2.4. CTA-Based Cerebral Hemodynamic Modeling and Quantitative Analysis
A Computational Fluid Dynamics (CFD) model was constructed using ANSYS software to simulate cerebral blood flow in the vicinity of symptomatic intracranial arterial stenosis (ICAS) lesions and to quantify hemodynamic indices such as pressure and shear stress. The key steps encompass: (1) reconstructing the 3D arterial geometry from CTA images, with a focus on the intracranial segments of the internal carotid artery [18], middle cerebral artery (MCA), and anterior cerebral artery (ACA); (2) meshing the vascular surface and lumen, involving 0.5 to 1 million elements, The maximum size of the mesh was 0.1 mm at the inlet and outlet surface, and 0.25 mm in the remaining parts; (3) setting boundary conditions and blood properties—the inlet pressure derived from previous pressure wire measurements, and the outlet pressure obtained from the FDA-approved AccuFFicas software [19]. The arterial wall was considered rigid, with a no-slip flow condition, and blood was modeled as an incompressible Newtonian fluid (viscosity: 0.0035 kg·m⁻¹·s⁻¹; density: 1,050 kg·m⁻³); (4) solving the Navier-Stokes equations [20,21] to simulate blood flow. Detailed methodologies are documented in prior literature.
2.5. Machine Learning and Modeling
The dataset was partitioned into training and testing sets with an 80:20 ratio, employing a fixed random seed (random state = 42) to ensure reproducibility. Six machine learning classifiers were utilized: Decision Tree (DT), Random Forest (RF), Support Vector Machine (SVM), K-Nearest Neighbors (KNN), Logistic Regression [22], and Naive Bayes (NB). A soft voting classifier was employed to ensemble these models. All models were implemented using Scikit-learn with default hyperparameter settings, and feature standardization was performed via the Standard Scaler to optimize the performance of models such as SVM and KNN. Performance evaluation on the test set was conducted using metrics including accuracy, precision, recall, F1 score, and Cohen’s Kappa. Comparative analysis encompassed ROC curves, PR curves, confusion matrices, and cross-validation.
2.6. Statistical Analyses
For baseline data, continuous variables are presented in the form of mean ± standard deviation (Mean ± SD), maximum (Max), minimum (Min), and interquartile range (IQR), while categorical variables are presented as counts (Count) and percentages. Univariate analysis of variance (ANOVA) and effect size analysis were conducted for hemodynamic and CTP indicators to assess significant differences across different CISS groups. All statistical analyses were performed using Python 3.13, with a significance level set at P<0.05.
3. Results
3.1. Patient Characteristics
A total of 118 patients were included in the group, including 45 (38.1%), 39 (33.1%), 21 (17.8%), and 13 (11.0%) patients with no infarction, hypoperfusion, AAE, and PAO, respectively, with mean ages of 59 years IQR (49.0 - 69.0), 59 years IQR (50.0 - 69.0 ), 57 years IQR (47.0 - 68.0), and 59 years IQR (57.0 - 66.0), and males accounted for 55.6%, 79.5%, 66.7%, and 69.2%, respectively. There were no significant differences in admission blood pressure, smoking, hyperlipidemia, hypertension, diabetes, ischemic heart disease, ischemic stroke or TIA, and related blood tests including blood glucose, triglycerides, HbA1c, HDL, and LDL-C. However, the mRS score before the onset of the disease was higher in the AAE group, and the NIHSS score in the admission group was the lowest in the non-infarct group, and the statistical results were significantly different, and the specific results are shown in Table 1.
3.2. CT Perfusion, Anatomy and Computational Fluid Dynamics Index Analysis
3.2.1. Differences in Indicators in the CISS Classification
We found statistically significant differences in the metrics of Tmax>4.0s, Tmax>6.0s, Tmax>8.0s, and Tmax>10.0s in the CT perfusion results. The group with Hypoperfusion had the largest volume, followed by the AAE group, and the group with no infarction had the smallest volume. There is no statistically significant difference among CBF<40%, CBF<30%, CBF<20% in CBF, and CBV<45%, CBV<40%, CBV<35% in CBV. For anatomical indices, the diameter stenosis rate and area stenosis rate showed statistically significant differences, and we found that the diameter stenosis rate and area stenosis rate were highest in the hypoperfusion group, followed by the AAE group. In the analysis of computational fluid dynamics metrics, we observed statistically significant differences in both PR and WSSR values, with the hypoperfusion group having the lowest PR and the AAE group exhibiting the highest WSSR. Table 2 presents the results of the specific analysis. The results of the one-way ANOVA for CT perfusion, anatomical, and computational fluid dynamics indices across different CISS classifications are shown in Figure 1a. Results for CBF<40%, CBF<30%, CBF<20%, CBV<45%, CBV < 40%, and CBV < 35% are not presented due to the lack of statistical significance.
3.2.2. Correlation Analysis and Screening Among Different Types of Indicators
We conducted a correlation analysis among Tmax group, anatomical indices, PR, and WSSR, and found strong correlations between Tmax>4.0s, Tmax>6.0s, Tmax>8.0s, and Tmax>10.0s. Additionally, there was a strong correlation between diameter stenosis rate and area stenosis rate. Relevant content is shown in Figure 1b. To evaluate the capability of different types of indicators in distinguishing the subtypes of cerebral infarction, we compared the effect sizes between Tmax>4.0s, Tmax>6.0s, Tmax>8.0s, Tmax>10.0s, and among anatomical indicators. We found that Tmax>4.0s and the area stenosis rate had the highest effect sizes. Specific statistical graphs can be seen in Figure 1c.
3.3. Threshold Values for Critical Indicators in CISS Typing
Based on the CISS classification of cerebral infarction, we present MRI Diffusion-Weighted Imaging (DWI) sequence images, Tmax>4.0s images, PR maps from computational fluid dynamics, and WSSR maps for representative patients with the anterior circulation LAA type across different classifications. Please refer to Figure 2a for specific images. See Figure 2A for specific images. To identify the thresholds for distinguishing different CISS subtypes of cerebral infarction, we employed the decision tree method, with specific results shown in Figure 2b. The special branch of the decision tree hints at the thresholds for different indicators of CISS classification, when Tmax>4.0s ≤ 49.85ml and WSSR≤52.79 suggests No Infarction; When Tmax>4.0s > 49.85ml and WSSR ≤ 86.51, AS%>0.74 suggests hypoperfusion; When Tmax>4.0s > 49.85 mL and WSSR > 86.51, the cause may be AAE; When 6.95ml ≤ Tmax>4.0s ≤ 49.85ml, WSSR > 52.79, PR > 0.61, classification may indicate PAO.
3.4. Machine Learning Model Construction and Comparison
3.4.1. Quantitative Assessment of Model Performance
We evaluated models using five metrics: accuracy, precision, recall, F1 score, and Cohen's Kappa (Figure 3a). Logistic regression performed best, achieving 0.875 accuracy, 0.847 precision, 0.875 recall, 0.858 F1 score, and the highest Kappa (0.786), demonstrating strong consistency. The random forest model also performed well (accuracy 0.833, Kappa 0.723), handling complex interactions effectively. The support vector machine matched this accuracy but had lower precision (0.798) and F1 score (0.815). K-nearest neighbors had the lowest accuracy (0.792) and Kappa (0.626), struggling with noisy data. Naive Bayes showed decent precision (0.826) but weaker recall (0.792) and Kappa (0.660), indicating feature dependency issues. The ensemble model balanced all metrics, proving effective for complex classification tasks.
3.4.2. Comparison of Machine Learning Models Based on Cross-Validation Results
We evaluated six classification models (Figure 3b) using 10-fold cross-validation. Logistic regression outperformed others, achieving the highest accuracy (0.761±0.098), F1 score (0.716±0.114), and Kappa value (0.644±0.151), indicating strong consistency. Naive Bayes followed closely with 0.754±0.110 accuracy and a stable F1 score (0.726±0.121), demonstrating robustness. KNN performed the worst (accuracy 0.712±0.097, F1 score 0.663±0.107), reflecting its sensitivity to parameter tuning. Logistic regression and Naive Bayes had the lowest accuracy variance, highlighting stability. The ensemble model, using soft voting, performed competitively (accuracy 0.758±0.107, F1 score 0.722±0.121). Overall, logistic regression remained the most reliable, followed by the ensemble model and Naive Bayes.
3.4.3. Comparative Analysis of Model Performance Using ROC Curves
We evaluated the six models using ROC curves and AUC values (Figure 3c). Logistic regression had the highest AUC (0.923, 95% CI: 0.891−0.950), indicating strong discrimination and stability. The ensemble model followed closely (AUC 0.914, 95% CI: 0.879−0.941), demonstrating the benefits of combining classifiers. Naive Bayes performed well (AUC 0.905, 95% CI: 0.870−0.931), particularly with high-dimensional data. Random forests showed moderate performance (AUC 0.892, 95% CI: 0.861−0.918), effectively capturing complex relationships. SVM (AUC 0.871) and KNN (AUC 0.851) had lower performance with wider confidence intervals, indicating greater variability. Logistic regression and Naive Bayes had narrower confidence intervals, reflecting more consistent results. Overall, logistic regression remains the most reliable, while ensemble models offer a strong alternative. Despite lower AUC values, random forests and Naive Bayes remain valuable depending on data characteristics.
3.4.4. Precision-Recall Analysis and Model Performance Comparison
We used precision-recall (PR) curves and average precision (AP) values to evaluate the classification performance of the six models (Figure 3d). Logistic regression achieved the highest AP value of 0.872 (95% CI: 0.845-0.899), demonstrating an excellent balance between precision and recall, especially in the high recall region. The Ensemble model followed closely with an AP value of 0.861 (95% CI: 0.830−0.889), highlighting its ability to effectively integrate multiple classifiers. Naive Bayes showed competitive performance with an AP value of 0.854 (95% CI: 0.823−0.881), showing robust results despite the assumption of feature independence. The median AP value of Random Forest was 0.843 (95% CI: 0.811−0.872), while SVM (AP=0.811, 95% CI: 0.778−0.840) and KNN (AP=0.788, 95% CI: 0.751−0.821) showed relatively lower performance. The confidence intervals of Logistic Regression and Naive Bayes were narrower than those of other models, indicating higher stability in data splitting. In contrast, SVM and KNN showed wider intervals, indicating higher variability and sensitivity to parameter tuning. These results highlight the superior reliability and overall performance of Logistic Regression and Ensemble models in handling imbalanced datasets.
4. Discussion
The Chinese Ischemic Stroke Subclassification (CISS) offers more detailed insights into the pathophysiology of stroke and introduces the mechanism of ischemic stroke caused by large artery atherosclerosis (LAA) [9]. The study demonstrates that the CISS classification system is both effective and reliable, exhibiting a high degree of consistency with the TOAST classification system overall [23]. We focus on the three subtypes of LAA in the CISS classification for cerebral infarction, namely hypoperfusion, AAE, and PAO, and analyze the potential hemodynamic mechanisms by combining CT perfusion indices with computational fluid dynamics metrics, thereby providing guidance for the selection of treatment regimens for cerebral infarction. Patients with hypoperfusion may benefit more from interventions that improve distal blood flow. AAE patients require antiplatelet therapy aimed at stabilizing plaques to reduce the risk of embolism. For PAO patients, the emphasis is on protecting the perforating artery perfusion area to avoid further damage caused by treatment. Therefore, it is necessary to classify the etiology of cerebral infarction in patients with symptomatic intracranial atherosclerotic stenosis.
The application value of CT perfusion indices in intracranial atherosclerotic stenosis (ICAS) has gradually been recognized. Yu's research suggests that patients with a volume exceeding 83 ml of tissue exhibiting a Tmax>4.0s seconds may face a higher risk of recurrent stroke within one year [15]. Additionally, Tmax>4.0s can serve as a predictive factor for Hyperperfusion syndrome (HPS) following stent implantation in ICAS patients [24]. Yan's research also corroborates, through CT perfusion, that perioperative perfusion in ICAS surgery is associated with improvement and recurrence of stroke [25]. Among the CT perfusion indices Tmax, CBF, and CBV included in our study, the significance of Tmax as a critical diagnostic parameter was identified. Comparative analysis of CTP indices across different CISS stroke subtypes revealed that the Tmax volume in the low-perfusion group was the highest and exhibited significant differences, indicating the most severe ischemia in the low-perfusion group, with no significant differences observed in the CBF and CBV indices. Moreover, Tmax>4.0s played a pivotal role in distinguishing various CISS infarcts, which underscores the potential of Tmax>4.0s as a sensitive marker for hypoperfusion-related stroke mechanisms. Future research could explore the combination of CTP and CFD parameters to further enhance diagnostic accuracy.
Computational fluid dynamics metrics play a pivotal role in the mechanistic investigation of ICAS. Our study integrates computational fluid dynamics with CISS classification, revealing that the PR in the low perfusion group is lower, indicative of reduced blood flow. The AAE group exhibits elevated WSSR, associated with shear stress-induced plaque rupture. These findings align with prior studies by Feng et al.[12] and Li et al.[13], underscoring the interplay between hemodynamics and stroke etiology. The integration of CFD modeling to quantify these parameters offers a deeper understanding of stroke mechanisms, potentially paving the way for targeted therapeutic strategies.
In this study, a decision tree model was used to analyze the role of key cerebral perfusion indices in lesion classification, and the relevant thresholds of Tmax>4.0s, WSSR, PR, and AS% were explored. The threshold of Tmax>4.0s ≤ 49.85ml was associated with no infarction, while Tmax>4.0s > 49.85 was significantly associated with arterial ischemic events and partial arterial occlusion. The thresholds of WSSR (such as 52.79 and 86.51) further differentiated the severity of the lesions, and higher values may indicate vascular instability factors such as plaque rupture leading to AAE. PR ≤ 0.69 reflects a low perfusion state, while PR > 0.69 may indicate compensatory blood flow. For anatomical indicators, AS% > 0.73 tends to indicate low perfusion lesions. The model performed well in classifying no infarction and low perfusion (accuracy of 86% and 80%, respectively), but had limited ability in identifying partial arterial occlusion. This model can quickly assist in identifying cerebral blood flow abnormalities and assessing the severity of lesions.
The machine learning models included in this study exhibited different abilities in classifying stroke subtypes. Logistic regression was the most effective model, achieving the highest accuracy and stability in evaluating metrics, including AUC (0.923) and AP (0.872). Ensemble models that utilize multiple classifiers also perform well, demonstrating the benefits of integrating different algorithmic approaches. In contrast, models such as KNN and SVM are less accurate and more variable, likely because they are sensitive to noisy data and class imbalances. These results highlight the potential of machine learning to support accurate diagnosis in complex clinical scenarios. ROC and PR curve analysis provides valuable insights into the discriminant power of different models. Logistic regression and ensemble models consistently achieve higher AUC and AP values with narrower confidence intervals, indicating greater stability and reliability. Notably, Naive Bayes performed well in processing high-dimensional data but faced challenges with recall and interclass variability. The results highlight the importance of selecting a model that is appropriate for the characteristics of the dataset and the requirements of clinical applications.
This study demonstrates the feasibility of integrating CFD and CTP indices with machine learning for mechanism-based classification of ischemic stroke within the CISS framework. By amalgamating imaging and computational techniques, this approach offers a pathway to more precise and personalized stroke management. Nonetheless, the research is subject to limitations, including a relatively small sample size and the exclusion of mixed mechanisms within the CISS classification, which may constrain the generalizability of the findings. Future endeavors necessitate larger-scale, multicenter cohorts and more comprehensive classification studies to validate these findings and further refine the methodology.
5. Conclusions
This study underscores the integration of computational fluid dynamics metrics (PR and WSSR), CTP indices, and machine learning for the mechanistic classification of ischemic stroke in ICAS patients. The proposed approach demonstrates the potential for precise diagnosis and personalized treatment of ischemic stroke by combining hemodynamic parameters with perfusion parameters and machine learning techniques.
Author Contributions
Conceptualization, Qi Fang; methodology, Qi Fang; software, Xulong Yin; formal analysis, Xulong Yin; resources, Yusheng Zhao; data curation, Fuping Huang; writing—original draft preparation, Xulong Yin; writing—review and editing, Hui Wang; supervision, Hui Wang; funding acquisition, Hui Wang and Qi Fang. All authors have read and agreed to the published version of the manuscript.”
Funding
This research was funded by Suzhou Science and Technology, grant number SSD2024090” and National Natural Science Foundation of China, grant number 82071300.
Institutional Review Board Statement
The study was conducted in accordance with the Declaration of Helsinki and approved by the Ethics Committee of the First Affiliated Hospital of Soochow University (protocol code 2021422 and date of approval).
Informed Consent Statement
Informed consent was obtained from all subjects involved in the study.
Data Availability Statement
The raw data supporting the conclusions of this article will be made available by the authors on request.
Acknowledgments
None.
Conflicts of Interest
The authors declare no conflicts of interest
Abbreviations
| ICAS | Intracranial atherosclerotic stenosis |
| TIA | transient ischemic attack |
| MCA | middle cerebral artery |
| CISS | The Chinese Ischemic Stroke Subclassification |
| TOAST | Trial of Organ 10172 in Acute Stroke Treatment |
| CFD | computational fluid dynamics |
| WSSR | wall shear stress ratio |
| PR | pressure ratio |
| CTP | computed tomography perfusion |
| CTA | computed tomography angiography |
| DSA | digital subtraction angiography |
| mRS | Modified Rankin Scale |
| NIHSS | National Institutes of Health Stroke Scale |
| DWI | Diffusion-Weighted Imaging |
| AAE | artery-to-artery embolism |
| PAO | parent artery occlusion |
| CBF | Cerebral Blood Flow |
| CBV | Cerebral Blood Volume |
| DT | Decision Tree |
| RF | Random Forest |
| NB | Naive Bayes |
| LAA | large artery atherosclerosis |
References
- Ding, Q.; Liu, S.; Yao, Y.; Liu, H.; Cai, T.; Han, L. , "Global, Regional, and National Burden of Ischemic Stroke, 1990-2019. Neurology 2022, 98, e279–e290. [Google Scholar] [CrossRef]
- Saini, V.; Guada, L.; Yavagal, D.R. , "Global Epidemiology of Stroke and Access to Acute Ischemic Stroke Interventions. Neurology 2021, 97 (Suppl 2), S6–s16. [Google Scholar] [CrossRef] [PubMed]
- Gutierrez, J.; Turan, T.N.; Hoh, B.L.; Chimowitz, M.I. , "Intracranial atherosclerotic stenosis: Risk factors, diagnosis, and treatment. Lancet Neurol 2022, 21, 355–368. [Google Scholar] [CrossRef]
- Komotar, R.J.; et al. , "Natural history of intracranial atherosclerosis: A critical review. Neurosurgery 2006, 58, 595–601. [Google Scholar] [CrossRef] [PubMed]
- Wang, Y.; et al. , "Intracranial atherosclerotic disease. Neurobiol Dis 2019, 124, 118–132. [Google Scholar] [CrossRef]
- Adams, H.P., Jr.; et al. , "Classification of subtype of acute ischemic stroke. Definitions for use in a multicenter clinical trial. TOAST. Trial of Org 10172 in Acute Stroke Treatment. Stroke 1993, 24, 35–41. [Google Scholar] [CrossRef]
- Gomyo, M.; Tsuchiya, K.; Yokoyama, K. , "Vessel Wall Imaging of Intracranial Arteries: Fundamentals and Clinical Applications. Magn Reson Med Sci 2023, 22, 447–458. [Google Scholar] [CrossRef]
- Chen, P.H.; Gao, S.; Wang, Y.J.; Xu, A.D.; Li, Y.S.; Wang, D. Classifying Ischemic Stroke, from TOAST to CISS. CNS Neurosci Ther 2012, 18, 452–456. [Google Scholar] [CrossRef] [PubMed]
- Gao, S.; Wang, Y.J.; Xu, A.D.; Li, Y.S.; Wang, D.Z. Chinese ischemic stroke subclassification. Front Neurol 2011, 2, 6. [Google Scholar] [CrossRef]
- Feng, X.; et al. Stroke Mechanisms in Symptomatic Intracranial Atherosclerotic Disease: Classification and Clinical Implications. Stroke 2019, 50, 2692–2699. [Google Scholar] [CrossRef]
- Liu, Y.; et al. , "Clinical implications of haemodynamics in symptomatic intracranial atherosclerotic stenosis by computational fluid dynamics modelling: A systematic review. Stroke Vasc Neurol 2024. [Google Scholar] [CrossRef]
- Feng, X.; et al. , "Cerebral Hemodynamics Underlying Artery-to-Artery Embolism in Symptomatic Intracranial Atherosclerotic Disease. Transl Stroke Res 2024, 15, 572–579. [Google Scholar] [CrossRef]
- Li, S.; et al. , "Cerebral hemodynamics and stroke risks in symptomatic intracranial atherosclerotic stenosis with internal versus cortical borderzone infarcts: A computational fluid dynamics study. J Cereb Blood Flow Metab 2024, 44, 516–526. [Google Scholar] [CrossRef] [PubMed]
- Suo, S.; et al. Cerebral hemodynamics in symptomatic anterior circulation intracranial stenosis measured by angiography-based quantitative flow ratio: Association with CT perfusion. Eur Radiol 2023, 33, 5687–5697. [Google Scholar] [CrossRef] [PubMed]
- Yu, Y.; et al. Tmax >4 s volume predicts stroke recurrence in symptomatic intracranial atherosclerotic stenosis with optimal medical treatment. J Neurointerv Surg 2024. [Google Scholar] [CrossRef]
- Gao, Y.; et al. An interpretable machine learning model for stroke recurrence in patients with symptomatic intracranial atherosclerotic arterial stenosis. Front Neurosci 2023, 17, 1323270. [Google Scholar] [CrossRef]
- Qiu, J.; et al. Automated detection of intracranial artery stenosis and occlusion in magnetic resonance angiography: A preliminary study based on deep learning. Magn Reson Imaging 2022, 94, 105–111. [Google Scholar] [CrossRef]
- Timmis, A.; et al. European Society of Cardiology: Cardiovascular Disease Statistics 2019 (Executive Summary). Eur Heart J Qual Care Clin Outcomes 2020, 6, 7–9. [Google Scholar] [CrossRef]
- Yang, P.; et al. Hemodynamic assessment for intracranial atherosclerosis from angiographic images: A clinical validation study. J Neurointerv Surg 2024, 16, 204–208. [Google Scholar] [CrossRef]
- Leng, X.; et al. Hemodynamics and stroke risk in intracranial atherosclerotic disease. Ann Neurol 2019, 85, 752–764. [Google Scholar] [CrossRef]
- Lan, L.; et al. Regional High Wall Shear Stress Associated With Stenosis Regression in Symptomatic Intracranial Atherosclerotic Disease. Stroke 2020, 51, 3064–3073. [Google Scholar] [CrossRef] [PubMed]
- Luongo, T.S.; et al. The mitochondrial Na(+)/Ca(2+) exchanger is essential for Ca(2+) homeostasis and viability. Nature 2017, 545, 93–97. [Google Scholar] [CrossRef] [PubMed]
- Zhang, H.; Li, Z.; Dai, Y.; Guo, E.; Zhang, C.; Wang, Y. Ischaemic stroke etiological classification system: The agreement analysis of CISS, SPARKLE and TOAST. Stroke Vasc Neurol 2019, 4, 123–128. [Google Scholar] [CrossRef] [PubMed]
- Yan, L.; et al. Predictors of hyperperfusion syndrome after stent implantation in symptomatic intracranial atherosclerotic stenosis. Quant Imaging Med Surg 2023, 13, 1048–1057. [Google Scholar] [CrossRef]
- Yan, L.; et al. Association of periprocedural perfusion non-improvement with recurrent stroke after endovascular treatment for Intracranial Atherosclerotic Stenosis. Ther Adv Neurol Disord 2022, 15, 17562864221143178. [Google Scholar] [CrossRef]
Figure 1.
Analysis and Screening of CT Perfusion, Anatomical and Computational Fluid Dynamics Indices. (A) The results of one-way analysis of variance for distinguishing CISS classification of cerebral infarction were different indicators. (B) Correlation analysis results between different indicators. (C) Tmax and anatomical stenosis rate effect size analysis. AAE, arterial-arterial embolism; PAO, penetrating artery occlusion due to atherosclerotic parent artery occlusion; Tmax, Time to Maximum; DS%, Degree of Stenosis Percentage; AS%, Area Stenosis Percentage; PR, Pressure Ratio; WSSR, Wall Shear Stress Ratio.
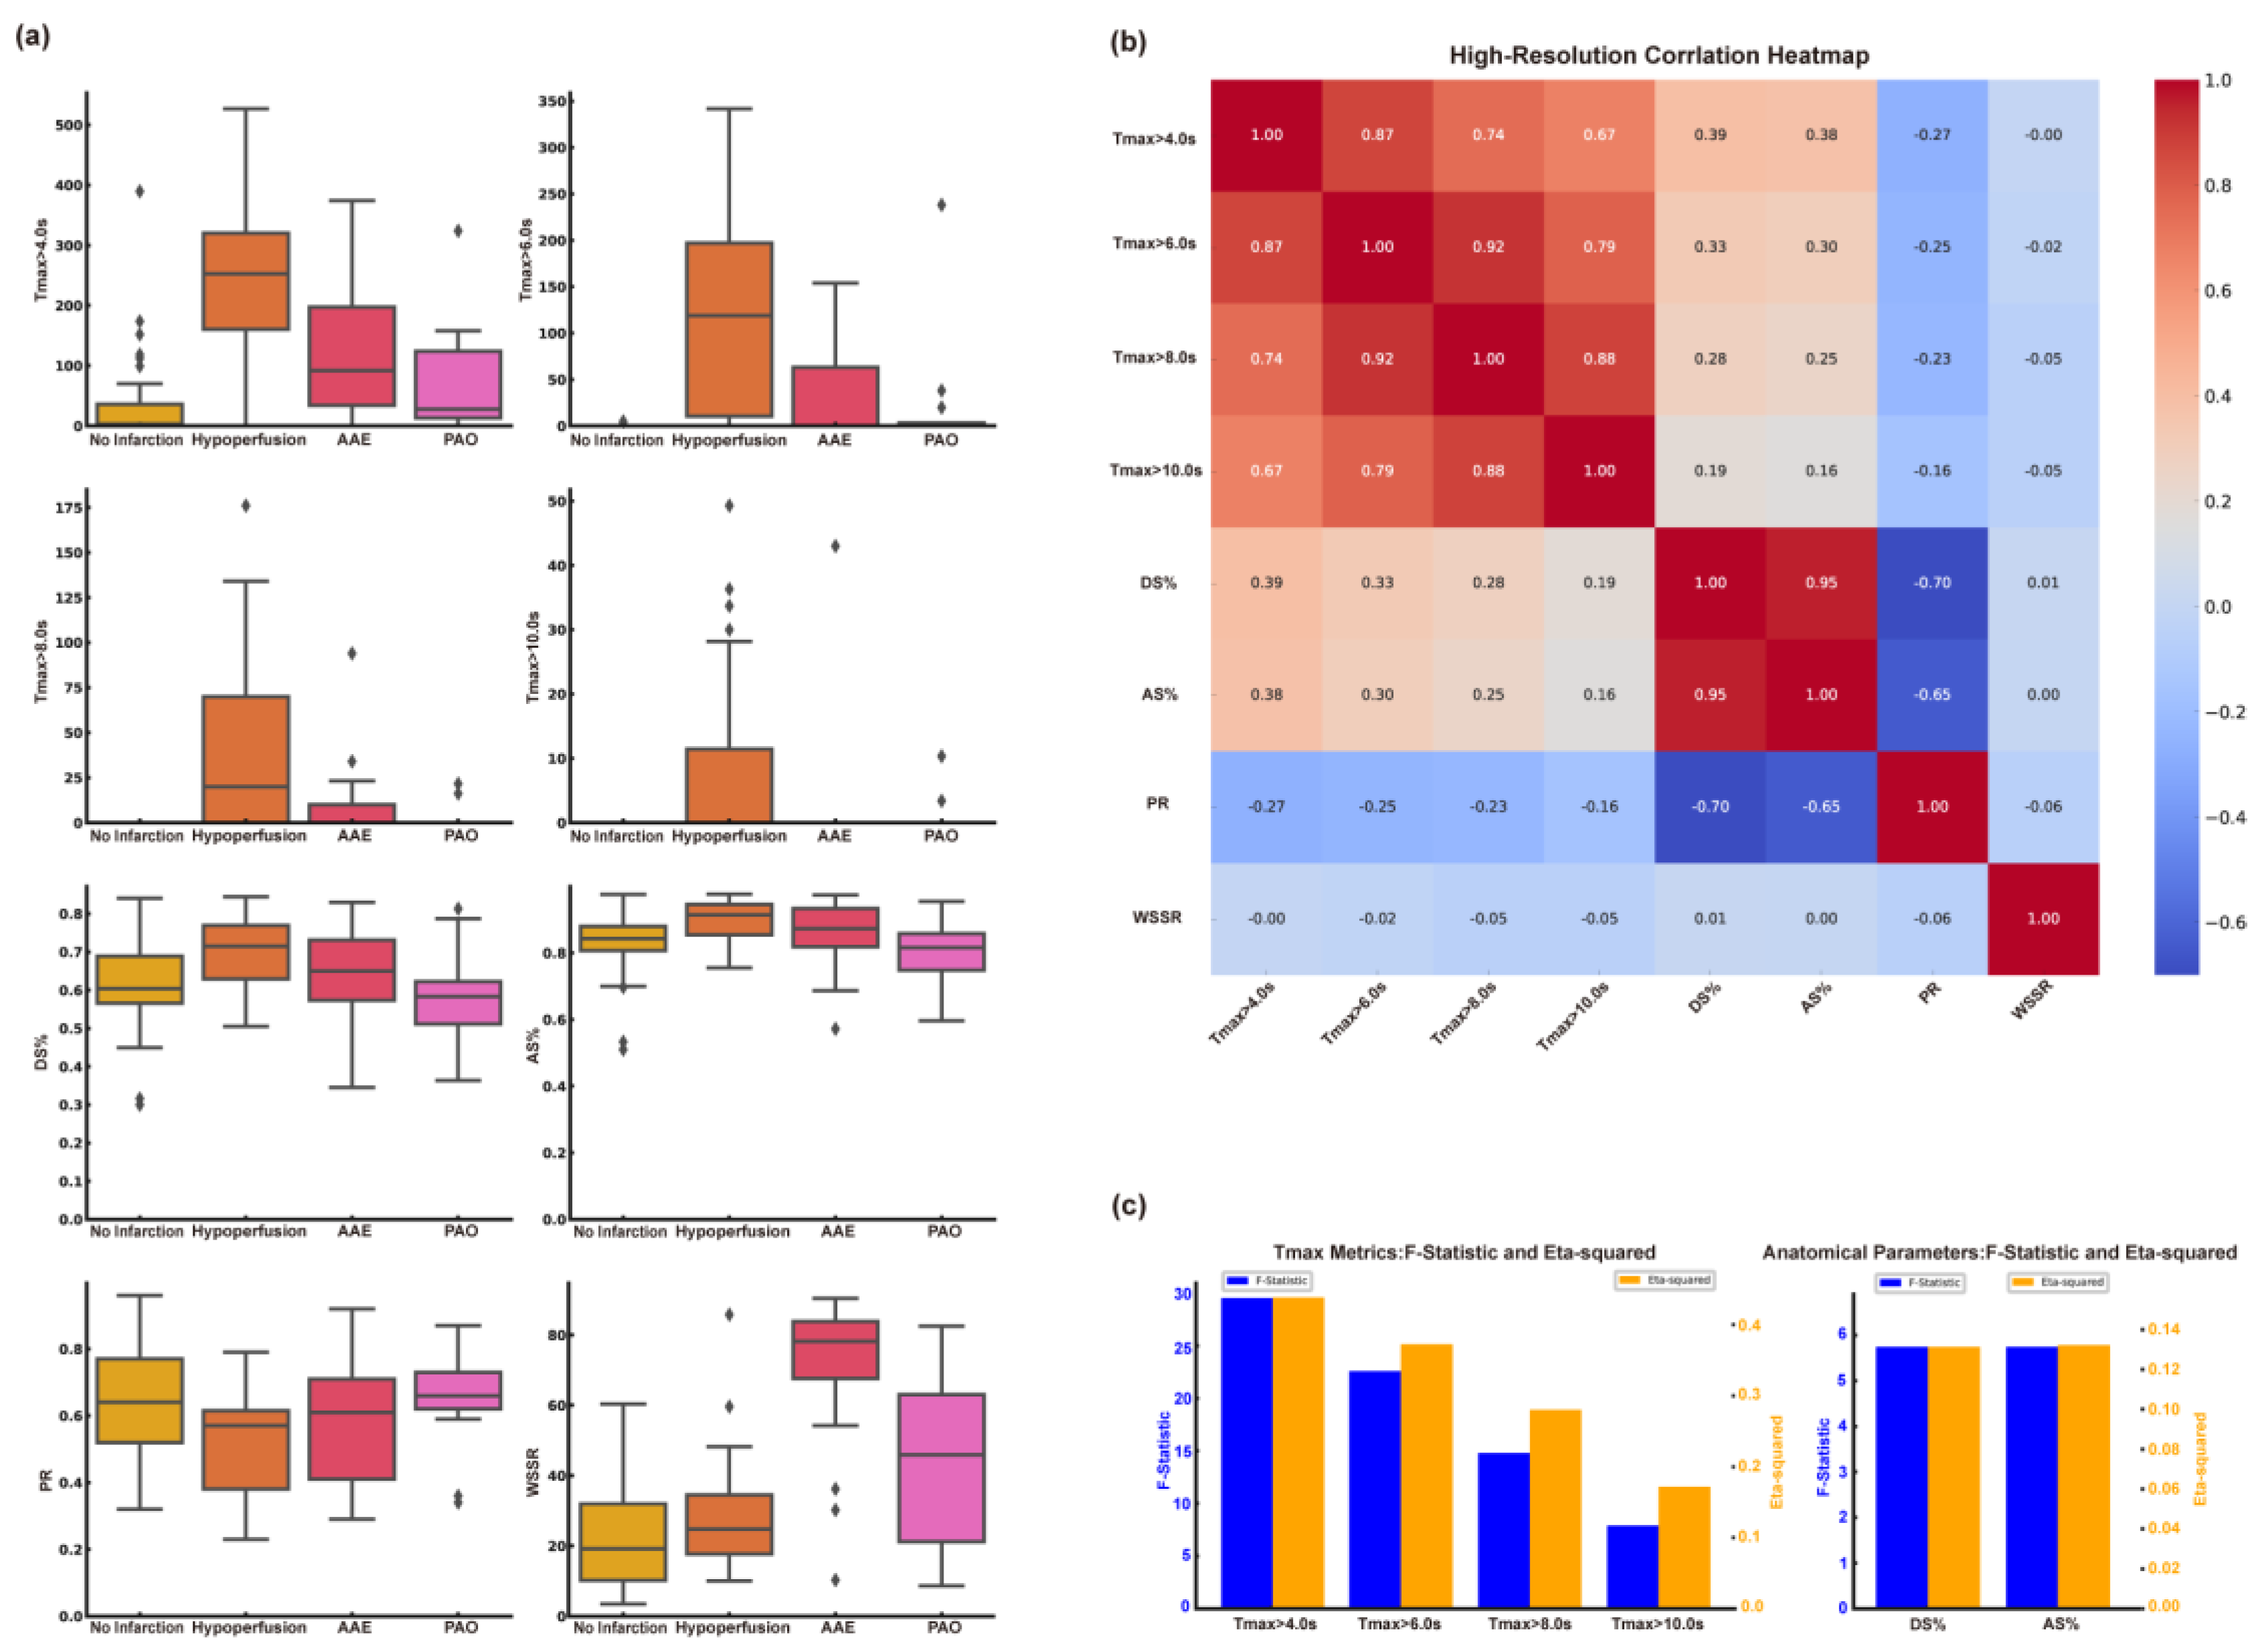
Figure 2.
Visualization of CISS Classification for Cerebral Infarction and Threshold Determination for Various Indicators. (A) Magnetic resonance DWI sequences, Tmax images, and CFD modeling-derived pressure and WSS maps are presented for the Non-Infarction Group, Low Perfusion Group, AAE Group, and PAO Group. (B) Decision tree model based on the criteria of Tmax > 4.0s, AS%, PR, and WSSR to determine the classification thresholds for CISS. AAE, arterial-arterial embolism; PAO, penetrating artery occlusion due to atherosclerotic parent artery occlusion; Tmax, Time to Maximum; AS%, Area Stenosis Percentage; PR, Pressure Ratio; WSSR, Wall Shear Stress Ratio.
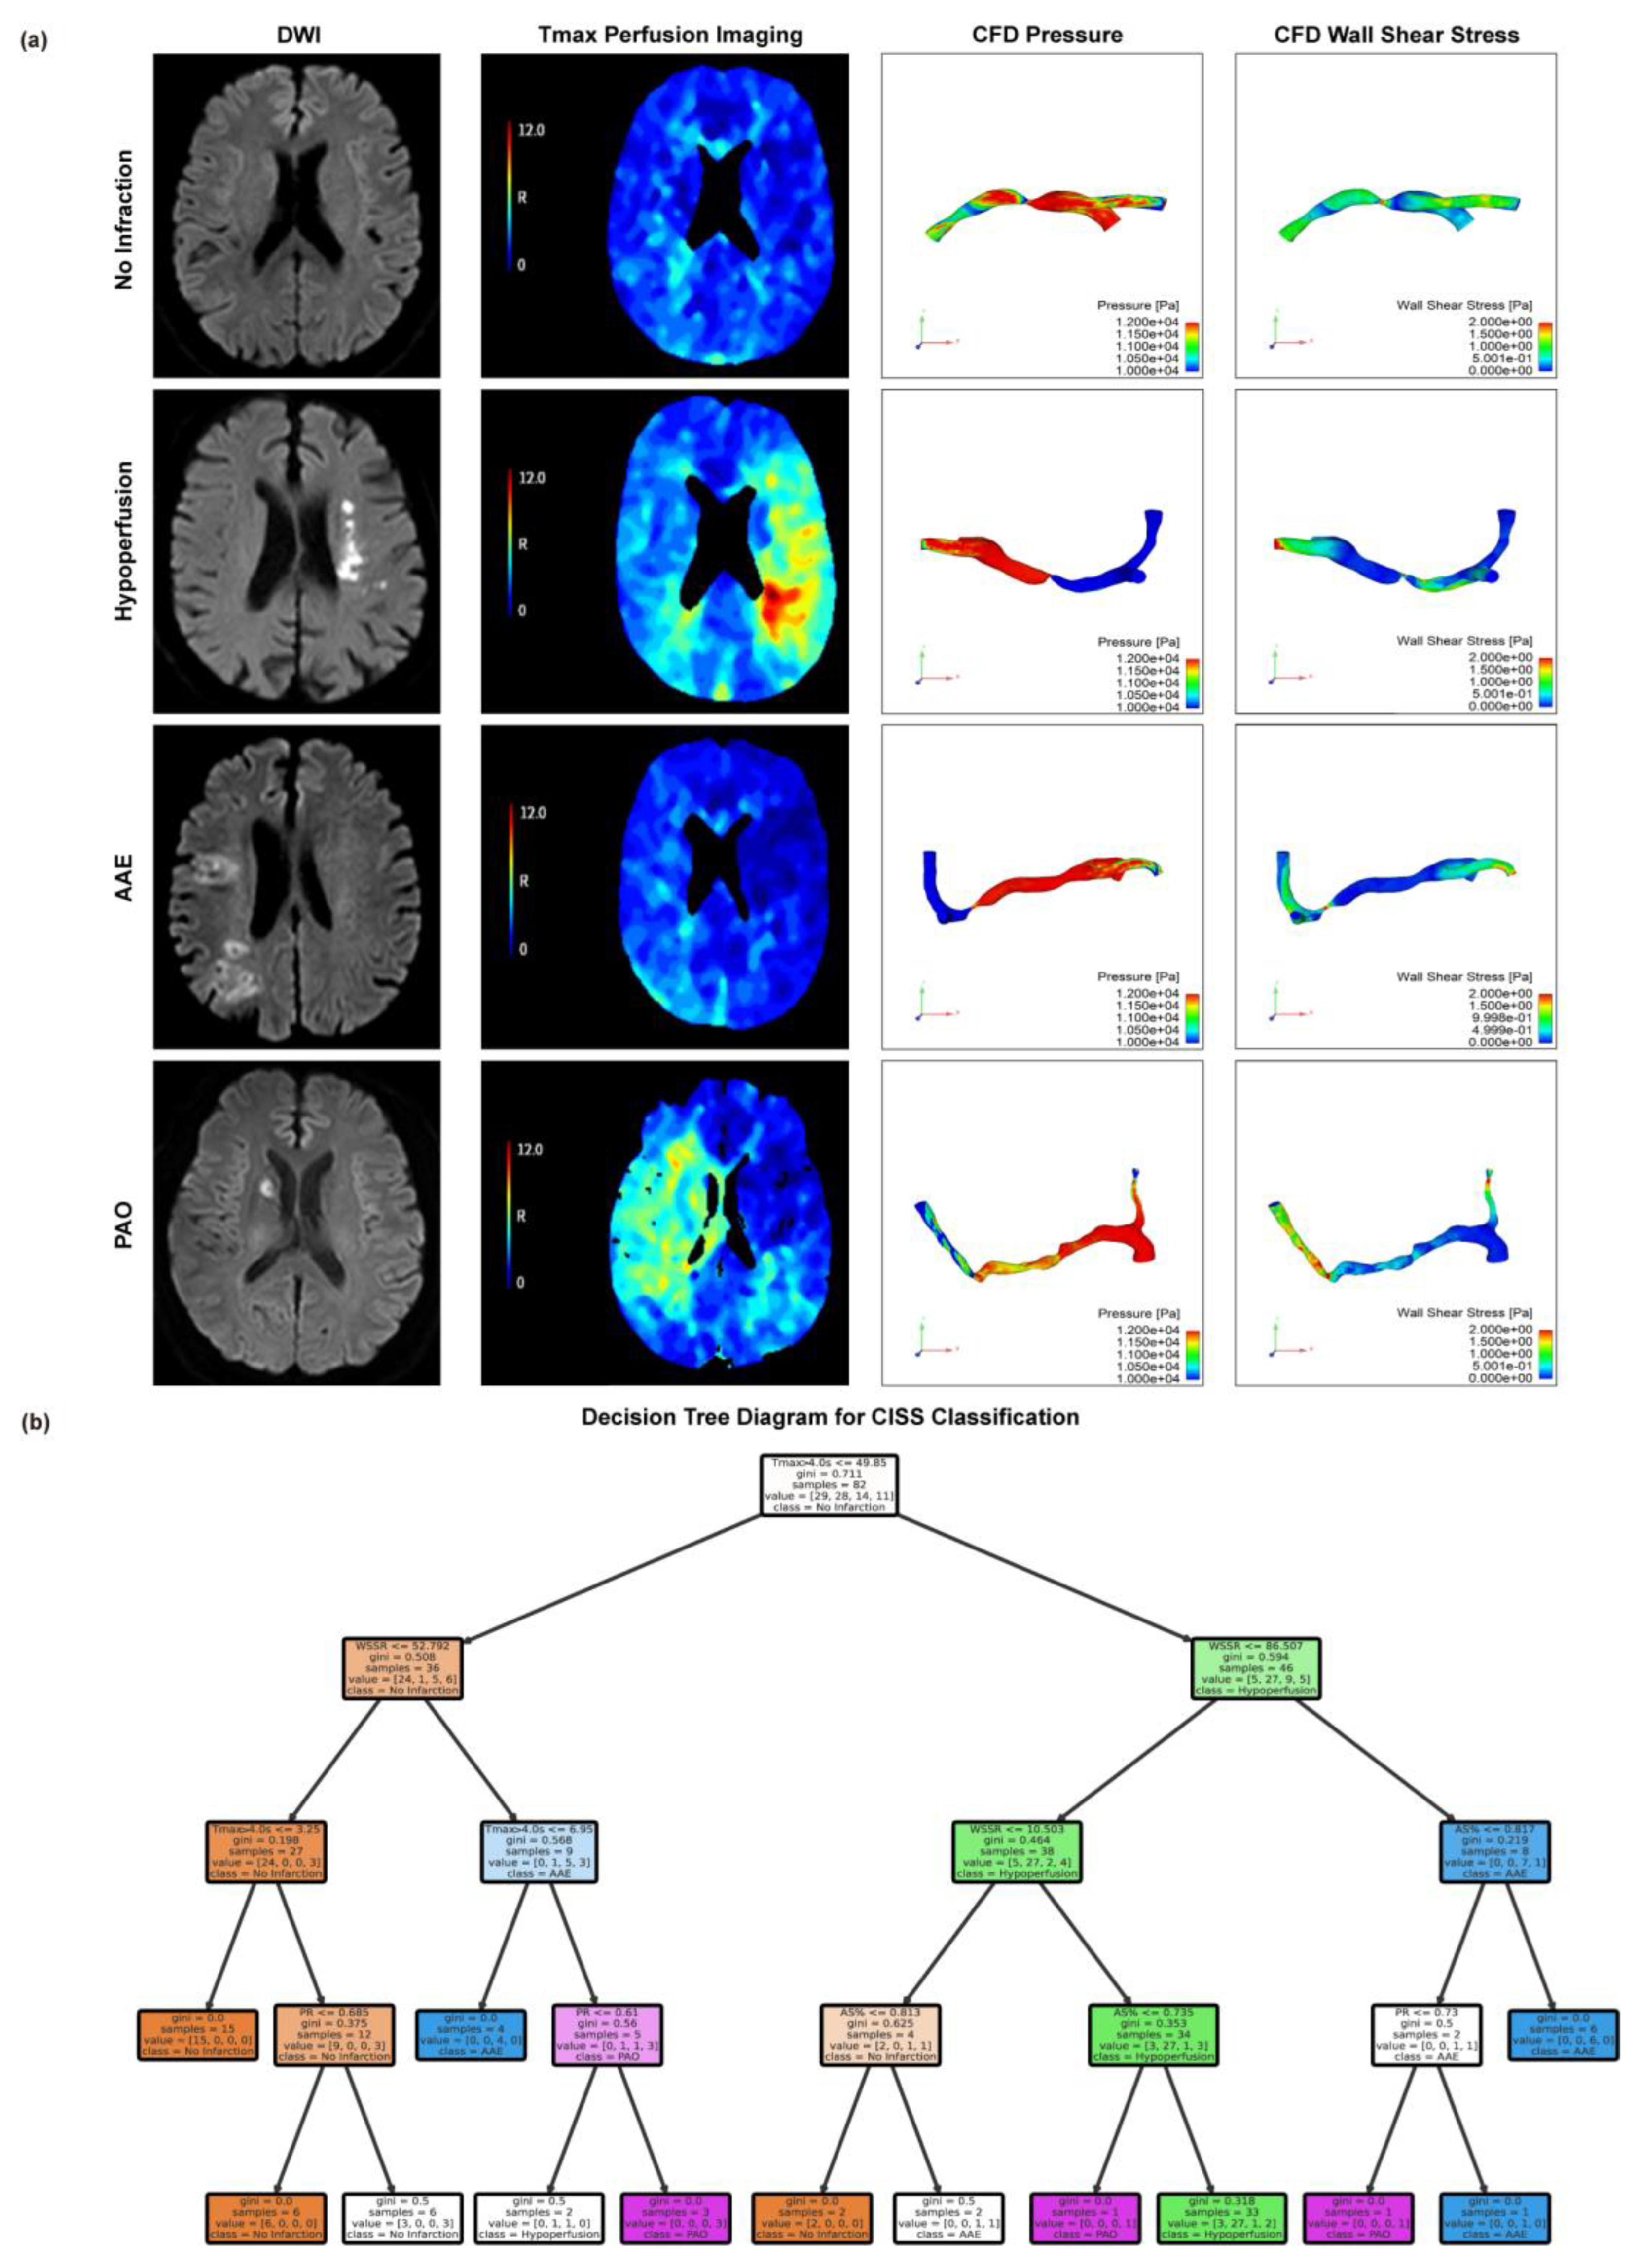
Figure 3.
Construction and evaluation of machine learning model for CISS classification of cerebral infarction. (A) Comparison Chart of Accuracy, Precision, Recall, F1-Score, and Kappa Values Across Various Models. (B) Cross-Validation Results of Various Machine Learning Models. (C) Comparison of ROC Curves Across Various Models. (D) Comparison of Precision-Recall Curves Across Various Models. AAE, arterial-arterial embolism; PAO, penetrating artery occlusion due to atherosclerotic parent artery occlusion; SVM, Support Vector Machine; KNN, K-Nearest Neighbors; ROC, Receiver Operating Characteristic; 95% CI, 95% Confidence Interval.
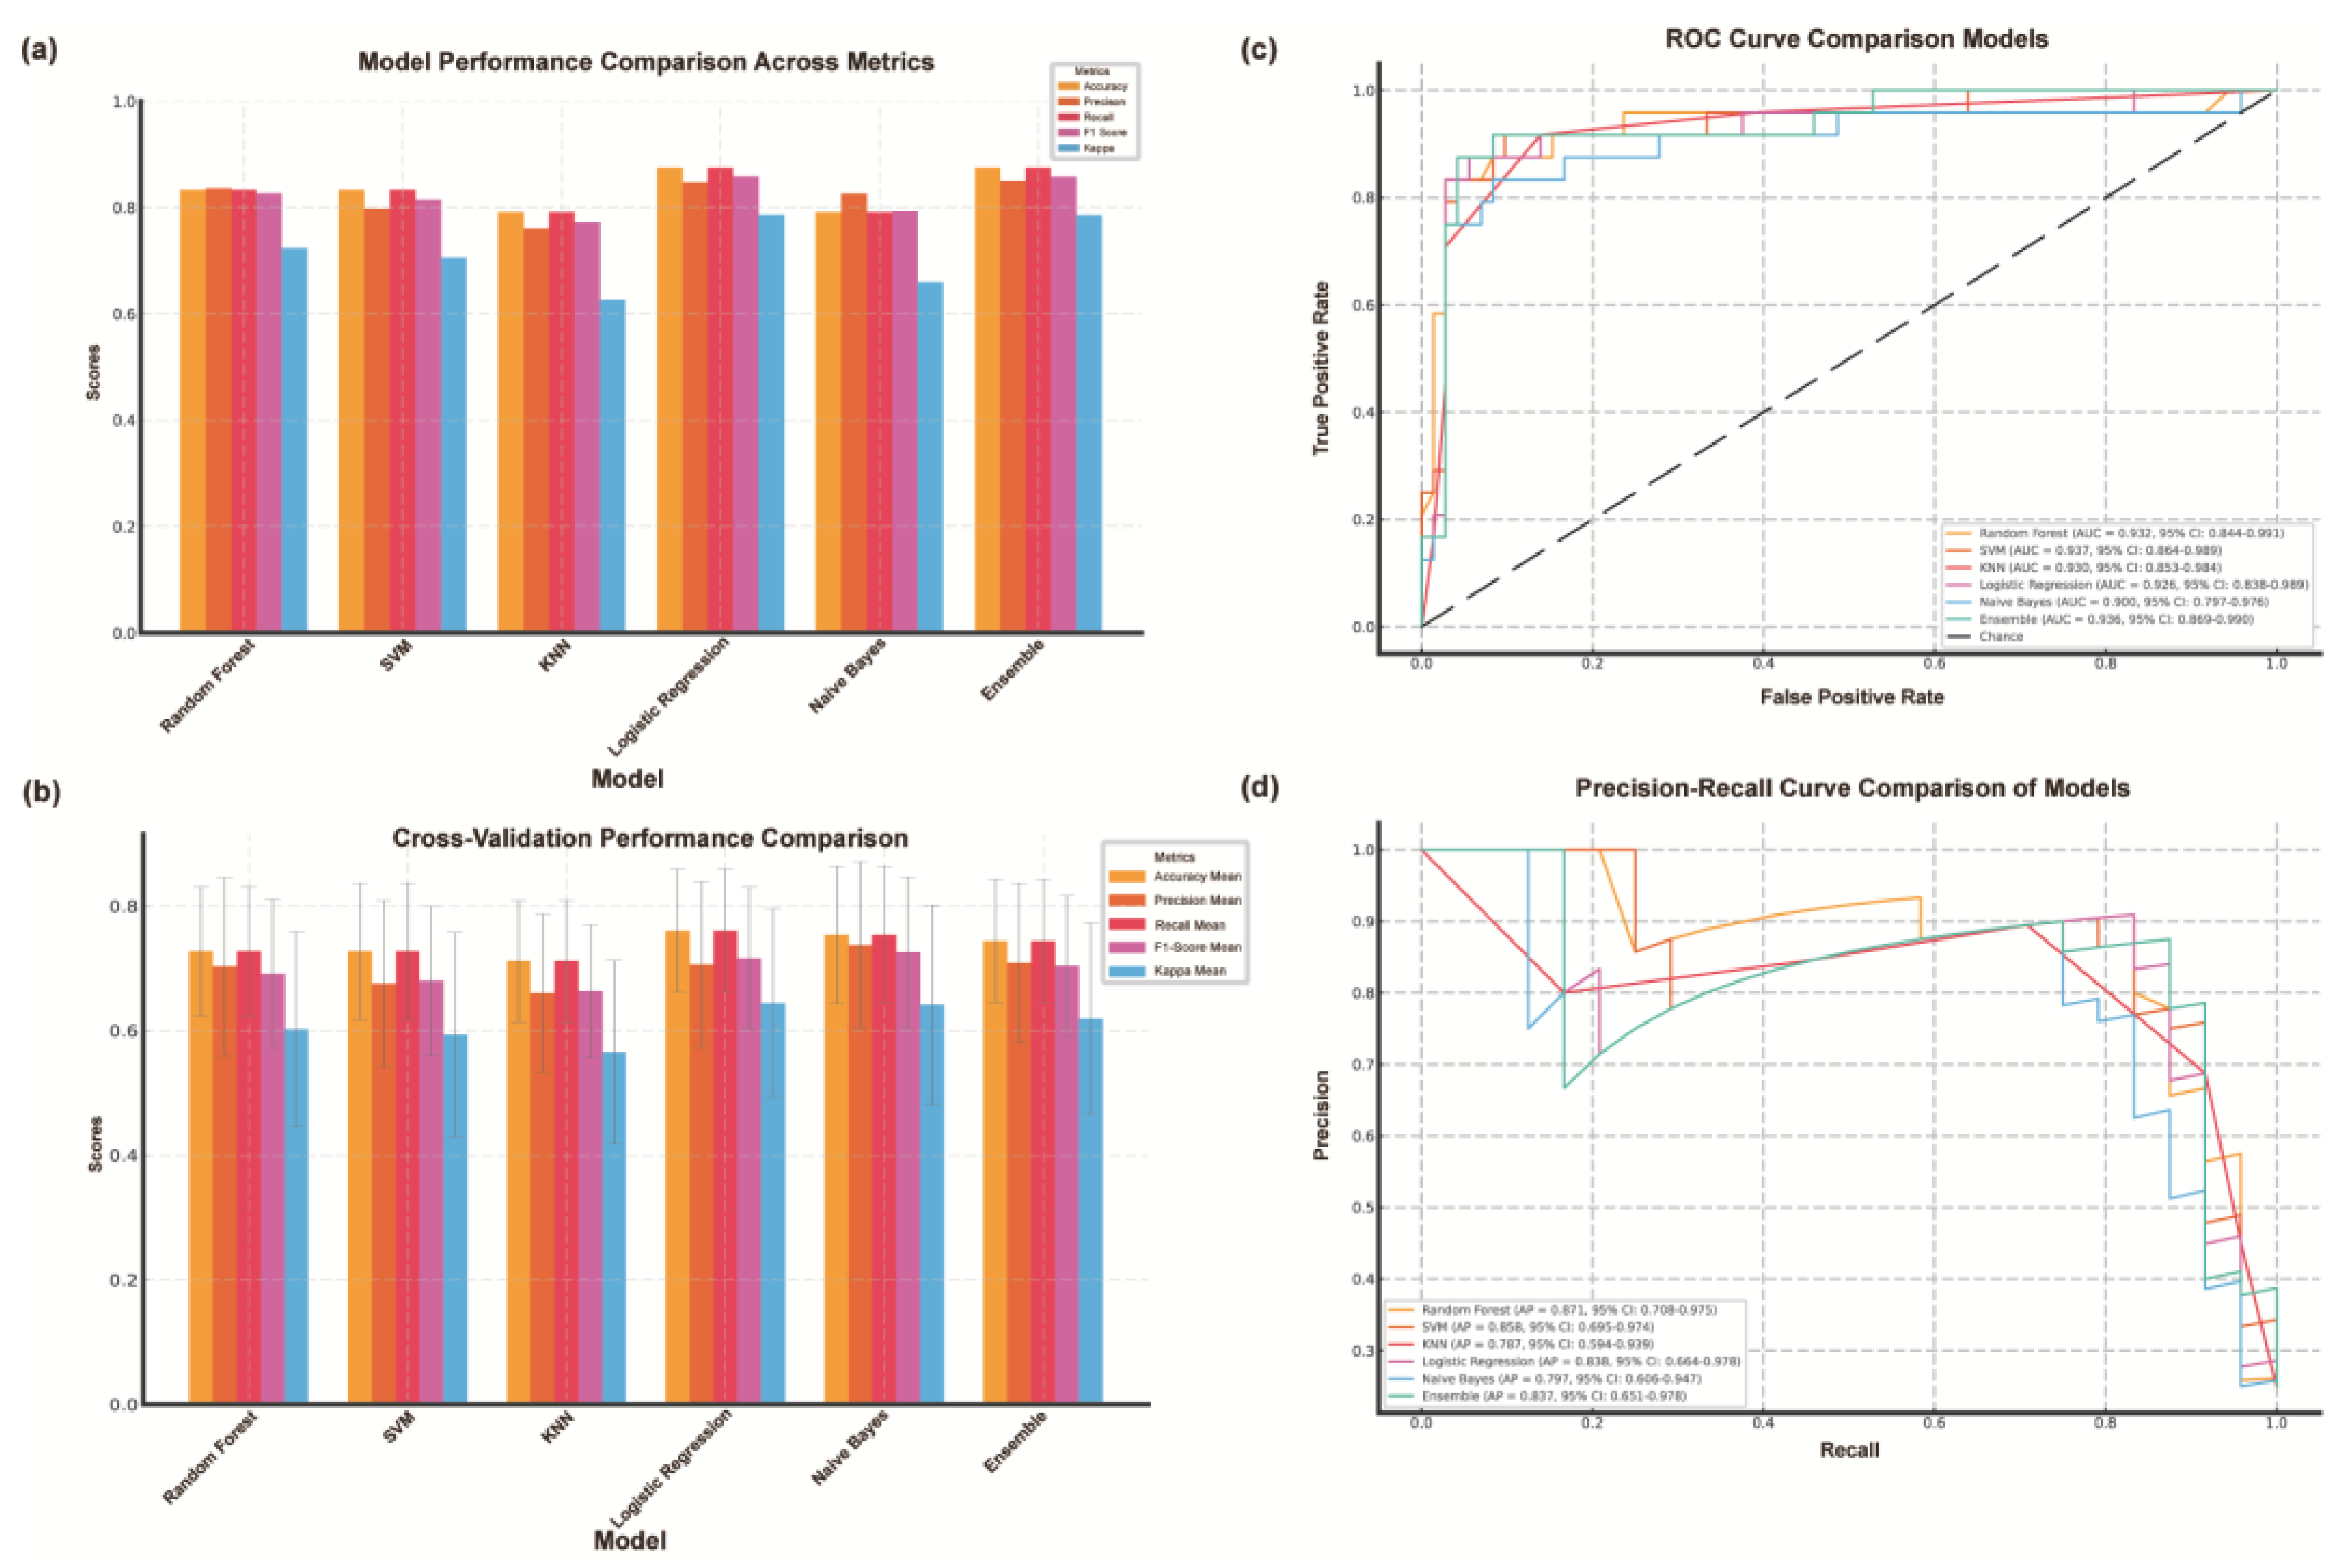

Table 1.
Baseline data statistics for patients.
| Classification | No Infarction | Hypoperfusion | AAE | PAO | P-value |
| (n=45) | (n=39) | (n=21) | (n=13) | ||
| Age | 64.0 (49.0 - 69.0) | 62.0 (50.0 - 69.0) | 63.0 (47.0 - 68.0) | 63.0 (57.0 - 66.0) | 0.915 |
| Male | 25 (55.6) | 31 (79.5) | 14 (66.7) | 9 (69.2) | 0.144 |
| SBP | 138.0 (130.0 - 154.0) | 135.0 (129.0 - 155.5) | 135.0 (127.0 - 151.0) | 140.0 (130.0 - 148.0) | 0.876 |
| DBP | 79.0 (71.0 - 85.0) | 82.0 (73.0 - 88.0) | 80.0 (71.0 - 86.0) | 83.0 (72.0 - 87.0) | 0.888 |
| mRs | 2 (0.0 - 2.0) | 2 (1.5 - 3.0) | 3 (1.0 - 4.0) | 1 (1.0 - 2.0) | <0.001 |
| NIHSS | 1 (0.0 - 1.0) | 3 (1.0 - 4.0) | 3 (0.0 - 3.0) | 3 (0.0 - 3.0) | 0.001 |
| Relevant past medical history | |||||
| Smoke | 8 (17.8) | 13 (33.3) | 6 (28.6) | 2 (15.4) | 0.326 |
| Hyperlipidemia | 21 (46.7) | 23 (59.0) | 12 (57.1) | 7 (53.8) | 0.707 |
| Hypertension | 33 (73.3) | 32 (82.1) | 13 (61.9) | 9 (69.2) | 0.392 |
| Diabetes | 16 (35.6) | 14 (35.9) | 5 (23.8) | 7 (53.8) | 0.375 |
| Ischemic heart disease | 4 (8.9) | 5 (12.8) | 1 (4.8) | 0 (0.0) | 0.477 |
| Ischemic Stroke/TIA | 21 (46.7) | 24 (61.5) | 12 (57.1) | 7 (53.8) | 0.592 |
| Laboratory test results | |||||
| Blood glucose | 5.28 (4.9 - 5.77) | 5.29 (4.68 - 6.59) | 5.24 (4.82 - 5.58) | 5.64 (5.12 - 6.5) | 0.128 |
| Triglyceride | 1.22 (0.91 - 1.86) | 1.60 (0.98 - 1.9) | 1.44 (1.3 - 1.67) | 1.19 (1.02 - 1.4) | 0.571 |
| HbA1c | 6.10 (5.7 - 6.4) | 6.30 (5.75 - 7.0) | 5.80 (5.7 - 6.2) | 6.30 (5.6 - 8.1) | 0.587 |
| HDL | 1.03 (0.24) | 0.95 (0.28) | 0.97 (0.19) | 0.95 (0.26) | 0.494 |
| LDL-C | 1.88 (1.47-2.39) | 1.84 (1.40-2.46) | 1.79 (1.64-2.42) | 1.69 (1.45-2.24) | 0.831 |
The normality test value is expressed in terms of mean (standard deviation), interquartile range (1st quartile-3rd quartile), or count (percentage). AAE, arterial-arterial embolism; PAO, penetrating artery occlusion due to atherosclerotic parent artery occlusion; TIA, transient ischemic attack; SBP, systolic blood pressure; DBP, diastolic blood pressure; HbA1c, glycated hemoglobin; HDL, high-density lipoprotein cholesterol; LDL-C, Low-Density Lipoprotein Cholesterol.
Table 2.
CTP, Anatomical, and Hemodynamic Parameters.
| Classification | No Infarction | Hypoperfusion | AAE | PAO | P-value |
| (n=45) | (n=39) | (n=21) | (n=13) | ||
| CT Perfusion Indices (ml) | |||||
| Tmax>4.0s | 2.9 (0.0-35.9) | 252.6 (160.5-320.4) | 92 (34.0-197.3) | 27.8 (13.0-123.9) | <0.001 |
| Tmax>6.0s | 0.0 (0.0-0.0) | 119.0 (10.6-197.0) | 0.0 (0.0-63.0) | 0.0 (0.0-3.1) | <0.001 |
| Tmax>8.0s | 0.0 (0.0-0.0) | 20.0 (0.0-69.9) | 0.0 (0.0-10.0) | 0.0 (0.0-0.0) | <0.001 |
| Tmax>10.0s | 0.0 (0.0-0.0) | 0.0 (0.0-11.45) | 0.0 (0.0-0.0) | 0.0 (0.0-0.0) | <0.001 |
| CBF<40% | 0.0 (0.0-5.4) | 0.0 (0.0-19.9) | 9.0 (0.0-47.4) | 9.4 (0.0-37.7) | 0.683 |
| CBF<30% | 0.0 (0.0-0.0) | 0.0 (0.0-0.0) | 0.0 (0.0-0.004) | 0.0 (0.0-0.0) | 0.089 |
| CBF<20% | 0.0 (0.0-0.0) | 0.0 (0.0-0.0) | 0.0 (0.0-0.0) | 0.0 (0.0-0.0) | 0.065 |
| CBV<45% | 4.0 (0.0-27.6) | 28.6 (0.0-48.3) | 9.0 (0.0-35.7) | 17.3 (0.1-31.7) | 0.242 |
| CBV<40% | 0.0 (0.0-2.5) | 4.0 (0.0-8.8) | 0.4 (0.0-9.0) | 3.3 (0.0-10.3) | 0.105 |
| CBV<35% | 0.0 (0.0-0.0) | 0.0 (0.0-0.0) | 0.0 (0.0-1.6) | 0.0 (0.0-2.6) | 0.067 |
| Anatomical Indicators | |||||
| DS% | 0.60 (0.11) | 0.70 (0.10) | 0.64 (0.12) | 0.58 (0.13) | 0.001 |
| AS% | 0.84 (0.81-0.88) | 0.91 (0.85-0.95) | 0.87 (0.82-0.93) | 0.82 (0.75-0.86) | 0.001 |
| Computational Fluid Dynamics Indicators | |||||
| PR | 0.63 (0.16) | 0.52 (0.14) | 0.59 (0.18) | 0.66 (0.17) | 0.004 |
| WSSR | 19.2 (10.2-32.0) | 24.7 (17.7-34.5) | 78.3 (67.6-83.9) | 45.9 (21.2-63.1) | <0.001 |
Table 2. CTP, Anatomical, and Hemodynamic Parameters. Normality tests are presented as mean (standard deviation), interquartile range (first quartile-third quartile), or count (percentage). AAE, artery-artery embolism; PAO, perforating artery occlusion due to atherosclerotic parent artery occlusion; Tmax, Time to Maximum; CBF, Cerebral Blood Flow; CBV, Cerebral Blood Volume; DS%, Percentage of Diameter Stenosis; AS%, Percentage of Area Stenosis; PR, Pressure Ratio; WSSR, Wall Shear Stress Ratio.
Disclaimer/Publisher’s Note: The statements, opinions and data contained in all publications are solely those of the individual author(s) and contributor(s) and not of MDPI and/or the editor(s). MDPI and/or the editor(s) disclaim responsibility for any injury to people or property resulting from any ideas, methods, instructions or products referred to in the content. |
© 2025 by the authors. Licensee MDPI, Basel, Switzerland. This article is an open access article distributed under the terms and conditions of the Creative Commons Attribution (CC BY) license (http://creativecommons.org/licenses/by/4.0/).
Copyright: This open access article is published under a Creative Commons CC BY 4.0 license, which permit the free download, distribution, and reuse, provided that the author and preprint are cited in any reuse.


