
Submitted:
14 March 2025
Posted:
18 March 2025
You are already at the latest version
Abstract
This study presents a comprehensive numerical analysis of the interaction between a metal bridge superstructure and rolling stock, focusing on the dynamic stability of empty freight gondola cars with worn wheel profiles. Using finite element modeling and validated experimental data, the research identifies critical speed thresholds at which transverse oscillations of the superstructure become hazardous. Results indicate that for speeds up to 80 km/h, safe operation is maintained under normal conditions. However, at 90 km/h, resonance occurs due to the alignment of the bridge’s natural horizontal bending frequency with the frequency of transverse wheel-rail impacts caused by bogie wobbling, leading to oscillation amplitudes of 11 mm, which exceed permissible limits. Furthermore, the study establishes that the elastic and inertial properties of the 55 m-span bridge structure influence rolling stock stability by approximately 15%. It is recommended that speed restrictions be imposed on freight wagons equipped with non-modernized 18-100 bogies, limiting their operation to a maximum of 90 km/h on both track beds and bridge spans to prevent derailment risks. The findings highlight the necessity for continuous track monitoring, bogie design improvements, and potential damping solutions for bridge structures to enhance railway safety. Future studies should incorporate wind and seismic effects to further refine operational guidelines. These results provide essential insights for railway engineers and infrastructure planners, contributing to the optimization of rolling stock movement and bridge design for modern freight transportation systems.
Keywords:
railway bridge dynamics
; rolling stock stability
; freight gondola cars
; transverse oscillations
; bogie wobbling
; finite element modeling
; derailment risk
1. Introduction
The dynamic interaction between railway rolling stock and bridge structures plays a crucial role in ensuring the safety and stability of train operations [1]. The movement of freight trains, particularly empty gondola cars with worn wheel profiles, introduces complex oscillatory phenomena that can influence both the rolling stock and the bridge superstructure [2]. In modern railway engineering, increasing train speeds and evolving track infrastructure necessitate a detailed understanding of these interactions to prevent derailments and structural damage [3]. One of the key challenges in railway dynamics is bogie wobbling, an instability that arises at certain critical speeds, leading to periodic transverse impacts between train wheels and rails [4]. This phenomenon, combined with the elastic and inertial properties of bridge superstructures, can induce resonant transverse oscillations, amplifying structural vibrations and increasing derailment risks [5]. In previous research, steam locomotives in the early 20th century exhibited strong forced oscillations due to eccentric wheel drive mechanisms [6], but in modern railway operations, empty freight wagons present new instability concerns at high speeds [7]. This study aims to analyze the dynamic interaction between freight gondola cars and a metal bridge superstructure (55 m span with through trusses) under various speed conditions. Using finite element modeling and numerical simulations, the research evaluates the influence of track conditions, wheel wear [8], and bridge flexibility on rolling stock stability. The primary objectives of this study are:
To determine safe operational speed limits for empty freight gondola cars on a railway bridge;
To identify critical speed thresholds where resonant transverse oscillations, occur due to wheel-rail impact forces;
To assess the influence of bridge superstructure properties on rolling stock stability under real operating conditions;
To compare modern structural responses with early 20th-century experimental data to assess the evolution of train-bridge interactions.
The findings indicate that for speeds up to 80 km/h, safe operation is maintained [9], but at 90 km/h, resonant transverse oscillations reach amplitudes of 11 mm, exceeding permissible limits. Furthermore, the elastic and inertial properties of the bridge influence rolling stock stability by approximately 15%, necessitating speed restrictions and further structural modifications to mitigate excessive oscillations [10]. This research contributes to railway safety and infrastructure optimization, offering practical recommendations for train speed regulations, bogie design improvements, and bridge structural enhancements. The study’s results serve as a foundation for future investigations, which should incorporate wind and seismic effects to ensure a more comprehensive understanding of train-bridge interactions in high-speed freight operations [11].
During the development of any structure, the designer solves the problem of assessing its stress-strain state [12]. To do this, it is necessary to know the stress distribution pattern in all elements of the designed structure and the magnitude of the displacements of characteristic points both under static external loading and under time-varying loads. Today, the design and calculation of bridge structures is impossible without the use of modern computer technologies [13]. These are FEM software packages focused on calculating bridge structures, which allow you to build finite element models of structures with minimal labor costs. They provide the special capabilities necessary for calculating bridges (for example, constructing influence lines for calculating moving loads, for calculating nodal connections, for checking local stability, for calculating the thermal stress state of supports, etc. [14]. With the traditional approach, to solve such a problem in the general case, it is necessary to solve a system of equations that ensure the fulfillment of the conditions of equilibrium and compatibility of deformations. The problem that arises in this regard is that in the case of a complex two-dimensional or three-dimensional structure, the behavior of the system is described by high-order equations with a large number of unknowns. One way to eliminate this difficulty is to use approximate solution methods. Currently, the most effective approximate method for solving applied problems of mechanics is the finite element method (FEM) [15]. This method essentially boils down to approximating a continuous medium with an infinite number of degrees of freedom by a set of subdomains (or elements) with a finite number of degrees of freedom. For each element, some form functions are specified that allow one to determine the displacement field inside the element based on the displacements at the nodes, i.e. at the junctions of the finite elements [16]. FE interact with each other only through nodes. External loads acting on FE, such as concentrated and distributed forces and moments, are reduced to its nodes and are called nodal loads. In calculations using the FE method, the displacements of the model nodes are first determined. The values of internal forces in an element are proportional to the displacements in its nodes. The proportionality coefficient is a square stiffness matrix, the number of rows of which is equal to the number of degrees of freedom of the element [17]. All other FE parameters, such as stresses, displacement field, etc., are calculated based on its 2 nodal displacements. The main types of finite elements used in practice are: rod; shell/plate; volumetric. The entire variety of models of structures and parts can be described using FE of different types or their combinations [18]. At the same time, this approach is not applicable to calculations of geometrically variable structures that turn into mechanisms.
2. Materials and Methods
2.1. Analysis of Existing CAD Systems Used in the Design of Metal Structures
Currently, the design and calculation of bridge structures is impossible without the use of modern computer technologies [19]. These are FEM software packages focused on the calculation of bridge structures, such as: LUSAS (Great Britain), GTSTRUDL (USA), MIDAS / CIVIL (Korea) and RM BRIDGE (Austria), SOFISTIK, MICROFE (Germany), SCAD Soft (Russia), LIRA (Ukraine), ANSYS, NASTRAN, Cosmos-M, SolidWorks, (USA) and others, which allow you to build finite element models of structures with minimal labor costs. They provide special capabilities necessary for calculating bridges (for example, constructing influence lines for calculating moving loads, for calculating nodal junctions, for checking local stability, for calculating the stress-strain state of supports, etc. [24].
Experience using MIDAS / CIVIL in bridge structure calculations has repeatedly shown that gross errors often occur in the calculations and design of complex bridge structures and, therefore, the results obtained require careful analysis and verification.
The RM BRIDGE software package specializes in calculating the dynamic performance of bridge structures [20]. The developments in the field of aerodynamics of cable-stayed bridges, implemented in the program as separate science-intensive modules, turned out to be especially valuable. It turned out that RM BRIDGE allows for the end-to-end parameterization of finite element models and the reconstruction of models in short terms, as well as taking into account the rod and pre-stressed reinforcement of reinforced concrete structures. It implements regulatory documents, which allows for testing for strength, stability [21], crack resistance and endurance. The largest share of the engineer-calculator's labor costs falls on the creation of finite element models of structures. If we plan to perform calculations of the same structure in different software packages, then the model will have to be created many times, and this share will increase several times. In such a situation, special programs designed for automatic conversion of source data from one software system to another should come to the rescue. However, in programs focused on calculating bridge structures, built-in conversion modules are usually absent. Therefore, bridge engineers are faced with the task of independently developing such 3 software tools, for example, from GTSTRUDL to MIDAS / CIVIL or from MIDAS / CIVIL to SCAD, which allows avoiding unnecessary errors when creating calculation models. Thus, converter programs are a necessary link in the arsenal of software tools for calculating elements of bridge structures [22].
In this work, the use of the listed software packages is aimed mainly at studying transverse vibrations, the reasons for their occurrence, and the factors influencing the interaction of the rolling stock and the superstructure are investigated. The loss of stability of motion (wobbling) [3,4,5] of empty freight cars on model 18-100 bogies was investigated using mathematical modeling methods. The effect of wheel profile wear on the critical speed, after which the car bogies begin to "wobble", was determined. The sinuous motion of cars leads to periodic transverse impacts of the wheels on the rail [6], which is the main factor exciting transverse oscillations of the superstructure when interacting with the rolling stock [23]. As a result of numerical modeling, a resonant mode of transverse horizontal oscillations of the superstructure was obtained at the maximum speed of 90 km/h established for freight trains, caused by the coincidence of the frequency of transverse oscillations of the superstructure and the sinuous motion of the cars.
To assess the influence of elastic and inertial (dynamic) properties of the superstructure on the safety of wagon movement, calculations were performed in which the superstructure was not modeled and the train moved only on the roadbed. Based on the comparison of wagon dynamics, conclusions were made about the influence of the superstructure under the given conditions of movement: the parameters of deviations of rail threads from ideal geometry, wear of wheel profiles and movement speeds adopted in this particular case. An analysis of the forces arising in the wheel-rail contact made it possible to determine safe speed modes for the movement of empty freight rolling stock under given track conditions, wagon wheels and in the absence of wind. In addition to the above, having data from tests of the interaction of rolling stock and beam split spans of railway bridges from the beginning of the 20th century [7], it became possible to compare the values of transverse vibrations of the spans of those times with modern spans, taking into account all the changes that have occurred in the track facilities. This made it possible to note the key factors influencing the transverse vibrations of spans when interacting with a train at the beginning of the 20th century and today.
2.2. Mathematical Modeling
At present, for the greatest accuracy and the most complete picture of the phenomena occurring during the interaction of the train load and the bridge superstructure, it is advisable to use specialized software packages, for example, the RM BRIDGE software package, which allows modeling the dynamics of the "span structure - track - rolling stock" system [24]. Traffic safety analysis becomes possible in an explicit form based on the results of solving the wheel-rail contact problem for each of the rolling stock wheels at each integration step. Let us consider the process of mathematical modeling of the interaction of the metal bridge superstructure with the rolling stock. For the span structure, a three-dimensional finite element model was created, in which the transverse and longitudinal beams of the upper chord were modeled using plates, and the remaining elements of the structure were modeled using rod elements (Figure 1).
The elastic displacements of the span structure were determined using the Craig-Bampton method. This method allows one to represent the displacement of nodes of the finite element model of the span structure using elastic vibration modes of the structure:
where u – is the vector of nodal displacements of dimension N×1; N – is the number of degrees of freedom of a finite element model; H – is the modal matrix of dimension N×k, in whose columns the transformed eigenforms and static forms are arranged; k – is the total number of forms used; q – is the vector of modal coordinates of dimension N×1.
The advantage of representing the displacement of structures in a certain basis of elastic forms over direct integration of the finite element model is the reduction in the number of unknowns from N to k. For example, this model uses 8585 nodes, i.e. a total of 8585×6 = 51510 degrees of freedom (unknowns). After taking into account the kinematic boundary conditions, 51510 - 7 = 51503 unknowns remain. To construct a dynamic model of the span, 168 transformed vibration modes and 24 static ones were used. The unknowns are 192 modal coordinates determined as a result of integrating the equations of motion of the “span - track - rolling stock” system. The number of unknowns decreased by two orders of magnitude. To take into account the structural friction of the structure [25], the damping coefficient ζ = 0.5% was specified for each modal coordinate. This value corresponds to the logarithmic decrement of oscillations δ = 0.03, specified in the standards [8] for bridges with connections on high-strength bolts.
2.3. Superstructure of the Track
The track superstructure on the bridge is adopted in the form of a ballastless bridge deck (BBD) [26]. For modeling the reinforced concrete slabs of the BBD, rod elements were used, for the rail and rail fastenings - a Timoshenko spatial beam (unlike the Bernoulli beam model, it takes into account not only bending deformations but also shear deformations, which can be of significant importance in this case) and a set of springs and dampers, respectively. The finite element model of the rail in the “Universal Mechanism” is an approximation of a system of 6 partial differential equations [9]. To give an idea of the concept of modeling the track structure, Figure 2 shows a track model on a roadbed.
2.4. Rolling Stock
In this work, the rolling stock is modeled by 23 empty gondola cars (Figure 3).
The twin locomotive was not modeled in this problem because its influence on the transverse vibrations of the superstructure can be neglected according to the results of the previously completed work [10] - the motion of locomotives and loaded freight gondola cars is significantly more stable. Each of the carriages is a set of rigid bodies connected to each other by elastic and dissipative elements. Figure 4 shows the first two natural modes and frequencies of an empty gondola car.

Table 1.
Natural frequencies of oscillations of an empty gondola car.
| № | From | Frequency, Hz |
| 1 | Upper lateral roll | 2.42 |
| 2 | Bouncing | 4.89 |
2.5. Solution of the Equations of Motion
In general, the system of equations of motion of the system “span structure - track - rolling stock” is presented in the form (2):
To integrate this system of equations, the implicit Park method is used, which allows, among other things, to obtain a solution for stiff differential equations [11]. The implicit integration scheme leads to a solution at each step of the system of nonlinear algebraic equations, for which the iterative Newton method is used [12].
2.6. Factors Influencing the Operation of the System
The study took into account the following factors:
- Travel speed;
- Wear of wheel profiles;
- Track faults;
- Deformation and inertial characteristics of the superstructure.
The calculations were performed in the speed range of 40 - 120 km/h with a step of 10 km/h. To take into account the fact that in reality, during the operation of wagons, the wheel profiles wear out over time, all calculations were performed using worn wheel profiles. The worn wheel profile was obtained as a result of numerical experiments using the problem-oriented software module UM Wheel/Rail Wear. The term “average worn” means that the profile condition corresponds to 100 thousand kilometers of mileage, which is half the mileage before the scheduled wheel turning. The calculation methodology used takes into account the statistical indicators of wagon operation that affect wheel wear: track macrogeometry (shares of traffic in straight and curved sections), speed, loading, etc. The worn profiles used for modeling in this study were obtained using the Archard model [13], built on the hypothesis of a linear relationship between volumetric wear and the work of friction forces. Figure 5 shows the new and worn profiles used in the calculations.
At the same time, the track superstructure has both vertical and horizontal deviations from the standard geometric parameters. To take this factor into account, track imperfections were taken into account in numerical experiments (Figure 6).
2.7. Evaluated Indicators
To analyze the dynamics of the span structure, vertical and horizontal vibrations of the upper sheet of the longitudinal beam in the middle of the span were recorded (Figure 8).
The following criteria are used to analyze traffic safety:
- Wheel-rail dynamic coefficient (unloading coefficient);
- Nadal criterion.
The wheel-rail dynamic coefficient allows us to estimate how much the dynamic vertical force in the wheel-rail contact differs from the static force. It is defined as follows:
where – is the total vertical force in wheel-rail contact, N; – is the static vertical force at wheel-rail contact, N.
In European standards [17] this criterion is called “wheel unloading”, according to which 90% unloading is permissible, i.e. the inequality must be met:
It should be noted that the Russian criterion implemented in Universal Mechanism differs from the European one in sign, i.e. the wheel unloading corresponds to negative values of the coefficient . To assess the possibility of rolling the wheel onto the rail [27], the ratio between the transverse Fy and vertical contact forces is determined (Figure 9).
This criterion was developed by Nadal [18] and is now widely used for traffic safety analysis.
The following expression is used as the limiting value of the ratio of lateral to vertical force in the Nadal criterion:
where μ – is the coefficient of friction in contact between the ridge and the rail; δ – is the angle of inclination of the wheel flange to the horizon.
The limiting ratios according to the Nadal criterion depending on the ridge inclination angle and the friction coefficient are shown in Figure 10.
In European [19] standards, the permissible value of this ratio is 0.8:
For a new wagon wheel with an angle δ = 60^∘, this value corresponds to a friction coefficient of 0.4. For a worn wheel profile (Figure 5), the angle δ = 75^∘, and the limiting value of the Nadal criterion according to the graph in Figure 10 for a friction coefficient of 0.4 is 1.34. In this study, taking into account wear for all wheels of the rolling stock [28], this value was taken as permissible:
2.8. Stability of Motion and Critical Speed
The motion of an individual wheel pair is always unstable, i.e. any disturbance (any unevenness in the path of the wheel) will result in an undamped tortuous motion of the wheel pair [29]. This is a consequence of the conical shape of the wheel rims and their blind fitting on the axles [20]. As a result, the motion of an individual wheel pair acquires a tortuous character (Figure 11).
Wobbling motion is also observed in wagons. Upon reaching a certain speed, called critical, the wagon wheel pairs experience undamped transverse oscillations (Figure 11), at which periodic impacts of the wheel flange on the rail head occur and the possibility of derailment arises. The magnitude of the critical speed at which the carriage starts to wobble depends on its design, as well as the condition of the track and wheels [30]. These values are different for a locomotive and loaded and empty gondola cars. Previously completed work on calculating a continuous span structure of 2x176 m allows us to state that wobbling with intense transverse impacts is observed for empty wagons. Loaded wagons and locomotives are more stable. The frequency and magnitude of the transverse force when a wheel hits a rail is affected by the wear of the wheel profiles, which increases the gap between the wheel flange and the rail head [31]. Wear of the wagon wheel profiles also leads to a decrease in the critical speed.
In support of this, numerical experiments were performed to determine the critical speed for an empty car with new and worn wheels. Figure 13 shows the graphs of the transverse displacements of the center of gravity of the 1st wheel pair of a gondola car (Figure 12).
For an empty gondola car with new wheels, the critical speed is in the range of 94 - 97 km/h
Calculations with a given wear of the wheel profiles showed that the critical speed decreases to 40 km/h. Since the calculations use a worn wheel profile that can be used in reality, it can be argued that the tortuous motion of empty cars can be observed in practice, and in the established speed modes. The tortuous motion of empty worn cars causes large amplitudes of oscillations of the superstructure compared to loaded ones. To obtain the largest transverse amplitudes of oscillations caused by the tortuous motion of the vehicles, the rolling stock [32] model included 23 empty gondola cars, for each of which worn wheel profiles were specified.
3. Results and Discussion
The study included 8 numerical experiments that simulated the movement of rolling stock along the superstructure [33]. To determine the effect of elastic and inertial properties of the superstructure on the safety of train movement, a series of calculations were performed for movement along the roadbed, the profile and track plan of which were taken to be straight, but the unevenness of the rails and the wear of the wheel profiles were taken into account, as in the calculations for movement along the superstructure. Figure 14 shows the dependence of the amplitudes of transverse oscillations of the superstructure on the speed of the train.
Table 2 shows the maximum absolute and standard deviations of the vertical and horizontal transverse accelerations of the span structure.
It is interesting to note the increase in the amplitude of transverse vibrations to 11 mm at a speed of 90 km/h. The displacements are shown in Figure 16.
Figure 17 shows the spectral composition of the oscillations, from which it follows that the fundamental frequency is f = 1.76 Hz.
Considering that the period of oscillation of the span increases when a train moves along it due to the increase in the total mass of the system, we determine the period of the loaded structure:
where – is the period of oscillation of an unloaded span structure, s; p – is the linear weight of rolling stock, tf/m; m – is the linear weight of the span structure, tf/m.
This value corresponds to the frequency f = 1.76 Hz. Consequently, at the speed V = 90 km/h, resonance occurs, caused by the coincidence of the natural transverse bending frequency of the loaded span structure oscillations and the frequency [34] of transverse impacts of the vehicle wheels on the rail (the wobble frequency). Figure 18 shows the graphs of the transverse forces in the wheel-rail contact of the first wheelset of car 23, obtained at 90 km/h.
The jumps in the graph correspond to the transverse impact of the wheel flange on the rail. Figure 19 shows the graphs of the spectra, in which the fundamental frequency is f = 1.8 Hz.
At a speed of V = 90 km/h, at which resonant vibrations of the superstructure are observed, movement both on it and on the roadbed is characterized by the danger of derailment. Figure 20 shows the graphs of the Nadal criterion of the 3rd wheel pair of the 6th car.
The maximum value of the Nadal criterion is recorded on the span structure and is equal to 1.61, which is 20% higher than the permissible value. Figure 21 shows the graphs of the wheel-rail dynamic coefficients.
There is no vertical separation of the wheels from the rails. Figure 22 shows the graphs of the wheel-rail dynamic coefficient for the 1st wheel pair of the 2nd car.
80 m after leaving the superstructure, alternating vertical separation of the wheels from the rails occurs due to significant transverse impacts. To determine the influence of the superstructure on the safety of the rolling stock [35], we compare the results of numerical experiments when moving along the superstructure and the roadbed (Figure 23).
Figure 24 shows the graph of the Nadal criterion for the left wheel of the 1st wheelset of the 5th car, obtained in the calculation without a superstructure when moving along the roadbed at a speed of 90 km/h.
The maximum value of the Nadal criterion for movement along the roadbed exceeded the permissible value and amounted to 1.4, while for movement along the superstructure at the same speed of 90 km/h, the value of 1.61 was recorded (see Figure 20). The ratio of these values (1.61/1.4 = 1.15 or 15%) can be characterized as the influence of the elastic and inertial properties of the superstructure on the stability of the movement of rolling stock or, more simply, the "influence of the bridge" on the dynamics of the rolling stock.
It should be noted that not all calculation cases have been considered, and it is too early to draw final conclusions. For example, the current calculations do not take into account the transverse wind effect on both the rolling stock and the bridge superstructure [36]. The latter causes general transverse deformations of the superstructure and corresponding deformations of the rails in the plan, especially in the above-support zones. The passage of bogies in these zones is accompanied by additional negative dynamics. In this case, the "influence of the bridge" was maximally manifested at the "bogie wobble" speed exceeding the critical value, which in turn caused resonant transverse vibrations of the superstructure. Recall that in the previous article [2], vertical vibrations were similarly investigated and resonant vertical vibrations were detected at a speed of 60 km/h. In that case, the "influence of the bridge", although recorded under other conditions, also amounted to a comparable value (10%).
When empty cars are moving on bogies of the 18-100 model without elastic constant contact sliders at a speed of 90 km/h, intense wobbling will occur, which is also noted in scientific articles [4,5]. The danger of derailment appears both when moving along the superstructure and the roadbed, as calculations show. An increase in the transverse rigidity of the superstructure, which would lead to a decrease in the amplitude of oscillations, would not lead to stabilization of the movement of cars. Figure 25 shows a graph of the maximum value of the Nadal criterion depending on the speed, constructed based on the results of calculations taking into account the superstructure.
All maximum values were recorded either on the superstructure or when moving along the roadbed after the exit. It follows from the graph that safe movement modes are in the speed range of 40 - 80 km / h. Let us consider the oscillations of the superstructure and rolling stock at 60 km / h. As will be shown below, the maximum amplitudes of transverse oscillations of the superstructure in tests conducted 100 years ago were obtained at 64 km / h. Figure 26 shows a graph of horizontal transverse oscillations of the superstructure, obtained in the calculation at a speed of 60 km / h.
The picture qualitatively differs from the results at a speed of 90 km/h – resonance is not observed. The largest amplitudes of oscillations are observed in the time interval of 21 – 23 s. Of the cars passing along the span in this time interval, the worst safety indicators were recorded for car No. 9. Figure 27 and Figure 28 show the safety criteria for the left wheel of the 1st wheelset of the 9th car from calculations with and without taking into account the span.
The oscillations of the superstructure have a negative impact on the dynamics of the crew, but at the same time the criteria for traffic safety are far from the limit values. Of interest is the comparison of the obtained oscillations of the superstructure during interaction with the rolling stock under modern operating conditions with the results of experimental studies from the beginning of the last century. Table 3 shows the calculated span lengths, the type of test train, the speed of movement and the amplitudes of forced oscillations of the superstructures [7].
A comparison of the experimental data in Table 3 on the vibrations of span structures from the early 20th century with the results of calculations for a modern structure allows us to draw the following conclusions:
Under modern operating conditions and speed modes similar to the data in Table 3, the impact of the rolling stock [35] on the superstructure is found to be many times smaller. For example, in the calculation at a speed of 60 km/h, the amplitude of transverse vibrations was 1 mm, whereas the vibrations of the superstructure during interaction with steam locomotives obtained experimentally at the beginning of the 20th century correspond to an amplitude of 9 mm. The significantly larger amplitudes of transverse vibrations of superstructures obtained during tests in the 20th century can be explained by the influence of the design features of steam locomotives (beating from the eccentric wheel drive) [20]. An analysis of the critical speed of modern locomotives and an earlier study of an off-grade superstructure of 2x176 m [10] also confirm their significantly smaller dynamic impact on the superstructure compared to steam locomotives;
With the increase in speeds, a new problem arose - instability of the movement of empty wagon bogies - wobbling. As the calculations show, it is this factor in modern realities that determines the critical speeds of movement and the maximum dynamics of the interaction of the rolling stock and the superstructure (the greatest transverse accelerations and oscillation amplitudes), which in the resonant mode are 11 mm, which exceeds the "dynamics of steam locomotives".
4. Conclusions
At a speed of movement of empty freight gondola cars with moderately worn wheel profiles without taking into account wind and seismic effects of up to 80 km/h, safe operation of the metal superstructure is ensured. If the speed of movement is more than 80 km/h, then the permissible values of the amplitude of transverse vibrations of superstructures both when moving along the roadbed and along the superstructure may exceed the permissible ones, which may cause the rolling stock to derail.
At the maximum speed of 90 km/h established for freight rolling stock, resonant transverse horizontal vibrations of the superstructure with an amplitude of 11 mm were recorded, caused by the coincidence of the natural frequency of horizontal bending vibrations of the loaded structure and the frequency of transverse impacts of the car wheels on the rails, which are a consequence of the instability of movement (wobbling of the cars).
It has been established that the speed of movement of freight rolling stock on bogies of model 18-100 without modernization of the bogies, or of a completely empty train, should be limited to 90 km/h, both on the track bed and on the superstructure, to ensure traffic safety conditions.
The influence of the elastic and inertial properties of the studied span structure with through trusses L = 55 m on the safety of rolling stock under conditions of movement with a given track condition, wheel wear and speed range can be estimated at 15%.
Author Contributions
Conceptualization, A.S.; methodology, A.B.; software, N.S.; validation, S.S.; formal analysis, A.Z. and N.S.; investigation, A.S.; resources, A.B. and S.S.; data curation, A.S.; writing—original draft preparation, S.S. and N.S.; writing—review and editing, A.Z., A.S., and A.B.; visualization, A.Z. and S.S.; supervision, A.S.; project administration, A.Z. and A.S.; funding acquisition, A.B., N.S., and S.S. All authors have read and agreed to the published version of the manuscript.
Funding
Not applicable.
Institutional Review Board Statement
The study did not require ethical approval.
Informed Consent Statement
Not applicable.
Data Availability Statement
Data are contained within the article.
Acknowledgments
The authors thank Professor Bondarenko Alexey for the valuable advice and the reviewers for their patient and meticulous work.
Conflicts of Interest
The authors declare no conflicts of interest.
References
- He, Q.L.; Li, S.H.; Yang, Y.; Zhu, S.Y.; Wang, K.Y.; Zhai, W.M. A novel modelling method for heavy-haul train-track-long-span bridge interaction considering an improved track-bridge relationship. Mech. Sys. Sign. Proc. 2024, 220, 111691. [Google Scholar] [CrossRef]
- Erduran, E.; Gonen, S.; Alkanany, A. Parametric analysis of the dynamic response of railway bridges due to vibrations induced by heavy-haul trains. Struct. Infrastruct. E 2024, 20, 326–339. [Google Scholar] [CrossRef]
- Ma, M.; Liu, J.; Zhang, Z. Evaluating vertical conditions of bridge substructures of heavy-haul railway lines based on dynamic stiffness and pier vibration response. Eng. Struct. 2021, 235, 112037. [Google Scholar] [CrossRef]
- Cantero, D.; Arvidsson, T.; Brien, E.; Karoumi, R. Train-track-bridge modelling and review of parameters. Struct. Infrastruct. E 2016, 12, 1051–1064. [Google Scholar] [CrossRef]
- Zhu, Z.; Gong, W.; Wang, L.; Li, Q.; Bai, Y.; Yu, Z.; Harik, I.E. An efficient multi-time-step method for train-track-bridge interaction. Comput. Struct. 2018, 196, 36–48. [Google Scholar] [CrossRef]
- Ticona Melo, L.R.; Bittencourt, T.N.; Ribeiro, D.; Calçada, R. Dynamic response of a railway bridge to heavy axle-load trains considering vehicle–bridge interaction. Int. J. Str. Stab. Dyn. 2018, 18, 1850010. [Google Scholar] [CrossRef]
- Silva, R.; Ribeiro, D.; Costa, C.; Arêde, A.; Calçada, R. Experimental validation of a non-linear train-track-bridge dynamic model of a stone arch railway bridge under freight traffic. Int. J. Rail Transp. 2024, 12, 102–133. [Google Scholar] [CrossRef]
- Zhai, W.; Sun, X. A detailed model for investigating vertical interaction between railway vehicle and track. Veh. Syst. Dyn. 1994, 23, 603–615. [Google Scholar] [CrossRef]
- Zhai, W.; Han, Z.; Chen, Z.; Ling, L.; Zhu, S. Train-track-bridge dynamic interaction: a state-of-the-art review. Veh. Syst. Dyn. 2019, 57, 984–1027. [Google Scholar] [CrossRef]
- Zhai, W.; Xia, H.; Cai, C.; Gao, M.; Li, X.; Guo, X.; Zhang, N.; Wang, K. High-speed train-track-bridge dynamic interactions - Part I: theoretical model and numerical simulation. Int. J. Rail Transp. 2013, 1, 3–24. [Google Scholar] [CrossRef]
- Matsuoka, K. Kaito, K.; Sogabe, M. Bayesian time-frequency analysis of the vehicle-bridge dynamic interaction effect on simple-supported resonant railway bridges. Mech. Syst. Signal Process. 2020, 135, 106373. [Google Scholar] [CrossRef]
- Xin, L.; Mu, D.; Choi, D.; Li, X.; Wang, F. General conditions for the resonance and cancellation of railway bridges under moving train loads. Mech. Syst. Signal Process. 2023, 183, 109589. [Google Scholar] [CrossRef]
- Zhou, S.; Song, G.; Wang, R.; Ren, R.; Wen, B. Nonlinear dynamic analysis for coupled vehicle-bridge vibration system on nonlinear foundation. Mech. Syst. Signal Process. 2017, 87, 259–278. [Google Scholar] [CrossRef]
- Wu, N.; Yang, H. Afsar, H.; Wang, B.; Fan, J. Analysis of train-track-bridge coupling vibration characteristics for heavy-haul railway based on virtual work principle. Sensors-Basel 2023, 23, 8550. [Google Scholar] [CrossRef]
- Xiao, Y.; Luo, X.; Liu, J.; Wang, K. Dynamic response of railway bridges under heavy-haul freight trains. Adv. Civ. Eng. 2020, 2020, 1–13. [Google Scholar] [CrossRef]
- Yang, Y.; He, Q.; Cai, C.; Zhu, S.; Zhai, W. A novel 3D train-bridge interaction model for monorail system considering nonlinear wheel-track slipping behavior. Nonlinear Dyn. 2024, 112, 3265–3301. [Google Scholar] [CrossRef]
- Zhang, Y.; Zhao, H.; Lie, S.T. A nonlinear multi-spring tire model for dynamic analysis of vehicle-bridge interaction system considering separation and road roughness. J. Sound Vib. 2018, 436, 112–137. [Google Scholar] [CrossRef]
- Au, F.; Wang, J.; Cheung, Y. Impact study of cable-stayed railway bridges with random rail irregularities. Eng. Struct. 2002, 24, 529–541. [Google Scholar] [CrossRef]
- Dong, Y.; Zhang, W.; Shamsabadi, A.; Shi, L.; Taciroglu, E. A Vehicle–bridge interaction element: implementation in ABAQUS and verification. Appl. Sci. 2023, 13, 8812. [Google Scholar] [CrossRef]
- Craig, R.R., Jr.; Kurdila, A.J. Fundamentals of Structural Dynamics; John Wiley & Sons: Hoboken, NJ, USA, 2006. [Google Scholar]
- Yang, Y.B.; Wu, Y.S. A versatile element for analyzing vehicle-bridge interaction response. Eng. Struct. 2001, 23, 452–469. [Google Scholar] [CrossRef]
- Lei, X. High Speed Railway Track Dynamics; Springer: Berlin/Heidelberg, Germany, 2017. [Google Scholar]
- Antolín, P.; Zhang, N.; Goicolea, J.M.; Xia, H.; Astiz, M.Á.; Oliva, J. Consideration of nonlinear wheel–rail contact forces for dynamic vehicle–bridge interaction in high-speed railways. J. Sound Vib. 2013, 332, 1231–1251. [Google Scholar]
- Zhang, N.; Xia, H.; Guo, W. Vehicle–bridge interaction analysis under high-speed trains. J. Sound Vib. 2008, 309, 407–425. [Google Scholar] [CrossRef]
- Grassie, S.; Gregory, R.; Johnson, K. The dynamic response of railway track to high frequency lateral excitation. J. Mech. Eng. Sci. 1982, 24, 91–95. [Google Scholar]
- Knothe, K.; Grassie, S. Modelling of railway track and vehicle/track interaction at high frequencies. Veh. Syst. Dyn. 1993, 22, 209–262. [Google Scholar]
- Dahlberg, T. Vehicle-bridge interaction. Veh. Syst. Dyn. 1984, 13, 187–206. [Google Scholar] [CrossRef]
- Lombaert, G.; Conte, J.P. Random vibration analysis of dynamic vehicle-bridge interaction due to road unevenness. J. Eng. Mech. 2012, 138, 816–825. [Google Scholar]
- Kwasniewski, L.; Li, H.; Wekezer, J.; Malachowski, J. Finite element analysis of vehicle–bridge interaction. Finite Elem. Anal. Des. 2006, 42, 950–959. [Google Scholar]
- Thambiratnam, D.P.; Zhuge, Y. Finite element analysis of track structures. Comput.-Aided Civ. Infrastruct. Eng. 1993, 8, 467–476. [Google Scholar] [CrossRef]
- Doménech, A.; Museros, P.; Martínez-Rodrigo, M.D. Influence of the vehicle model on the prediction of the maximum bending response of simply-supported bridges under high-speed railway traffic. Eng. Structures. 2014, 72, 123–139. [Google Scholar] [CrossRef]
- Zhang, N.; Xia, H.; Guo, W. Vehicle–bridge interaction analysis under high-speed trains. J. Sound Vibra. 2008, 309, 407–425. [Google Scholar] [CrossRef]
- M. F. Green, M.F.; Cebon, D. Dynamic response of highway bridges to heavy vehicle loads: theory and experimental validation. J. Sound Vibra. 1994, 170, 51–78. [Google Scholar] [CrossRef]
- https://railtec.illinois.edu/wp/wp-content/uploads/pdf-archive/Hay-Seminar-28092018_final.
- Musayev, J.; Zhauyt, A.; Ismagulova, S.; Yussupova, S. Theory and practice of determining the dynamic performance of traction rolling stock. Appl. Sci. 2023, 13, 12455. [Google Scholar] [CrossRef]
- Musayev, J.; Zhauyt, A.; Buzauova, T.; Mamatova, G.; Yessenkluova, Zh.; Abdugaliyeva, G.; Alimbetov, A. The experimental determination of the stress calculation and relative strains in the span elements of railway bridges under the influence of the rolling equipment. J. Measure. Eng. 2017, 5, 125–133. [Google Scholar]
Figure 1.
Finite element model of the span structure.
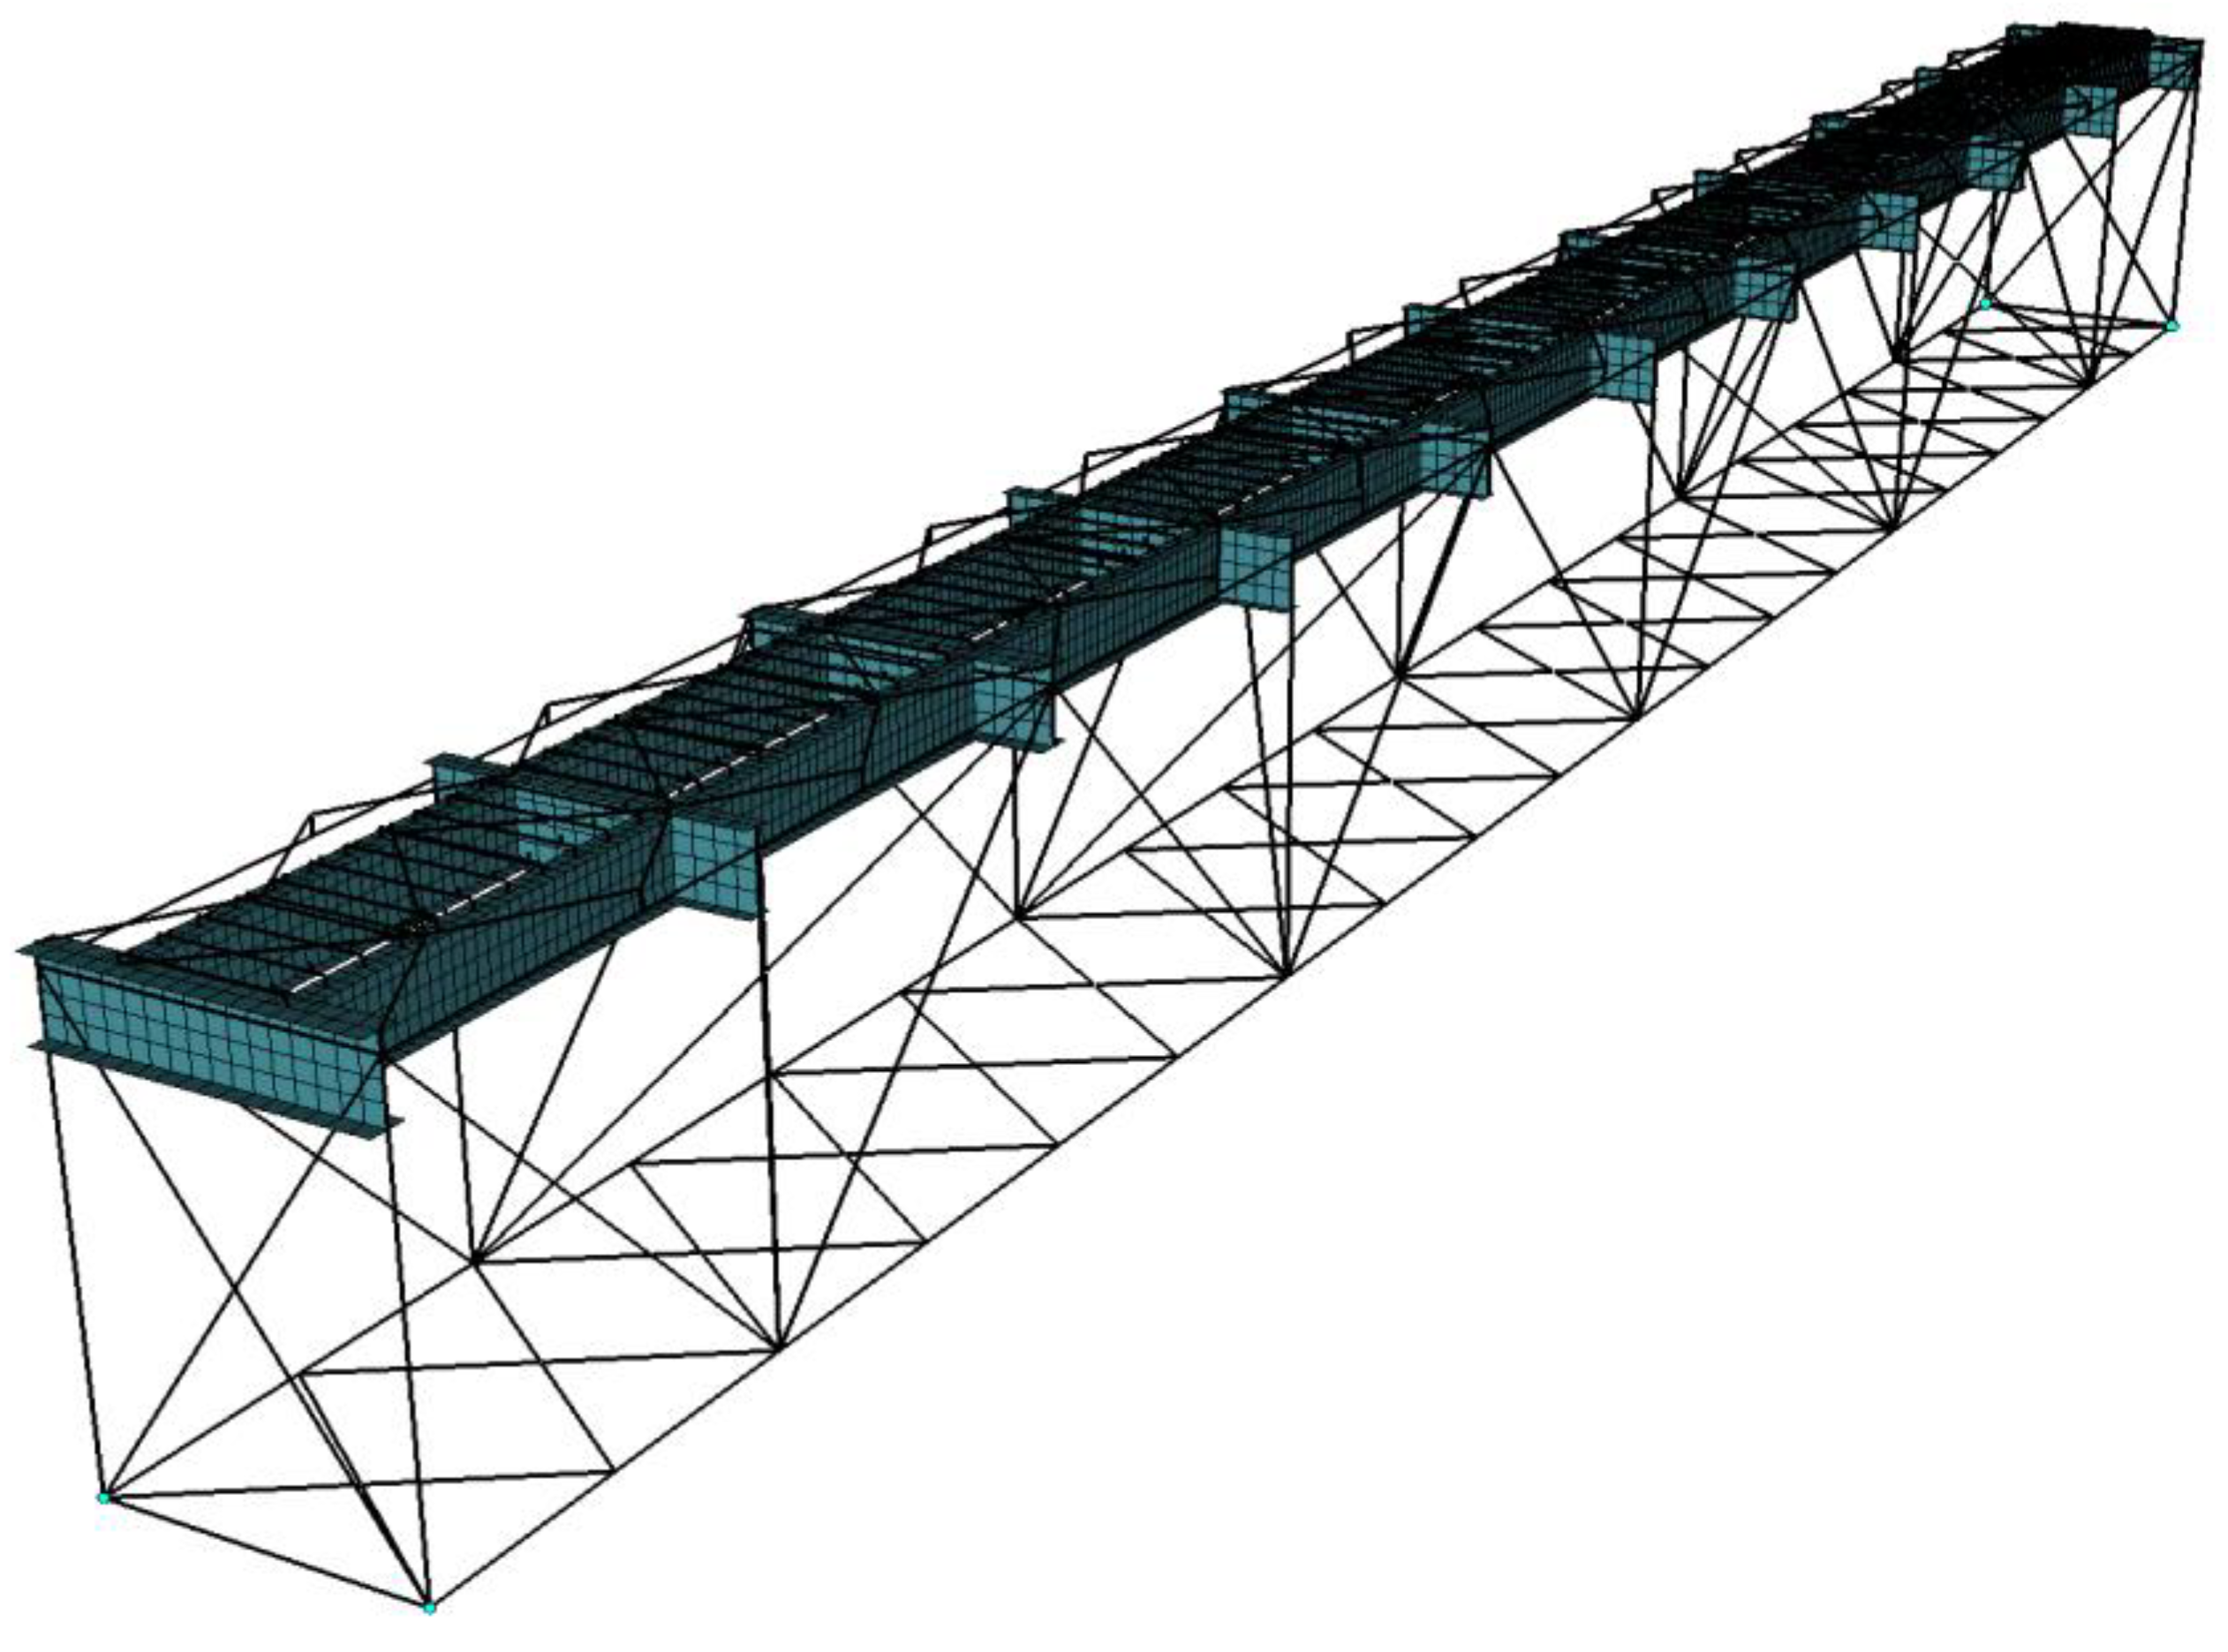
Figure 2.
Diagram of mechanical interaction between the wheelset and the track.
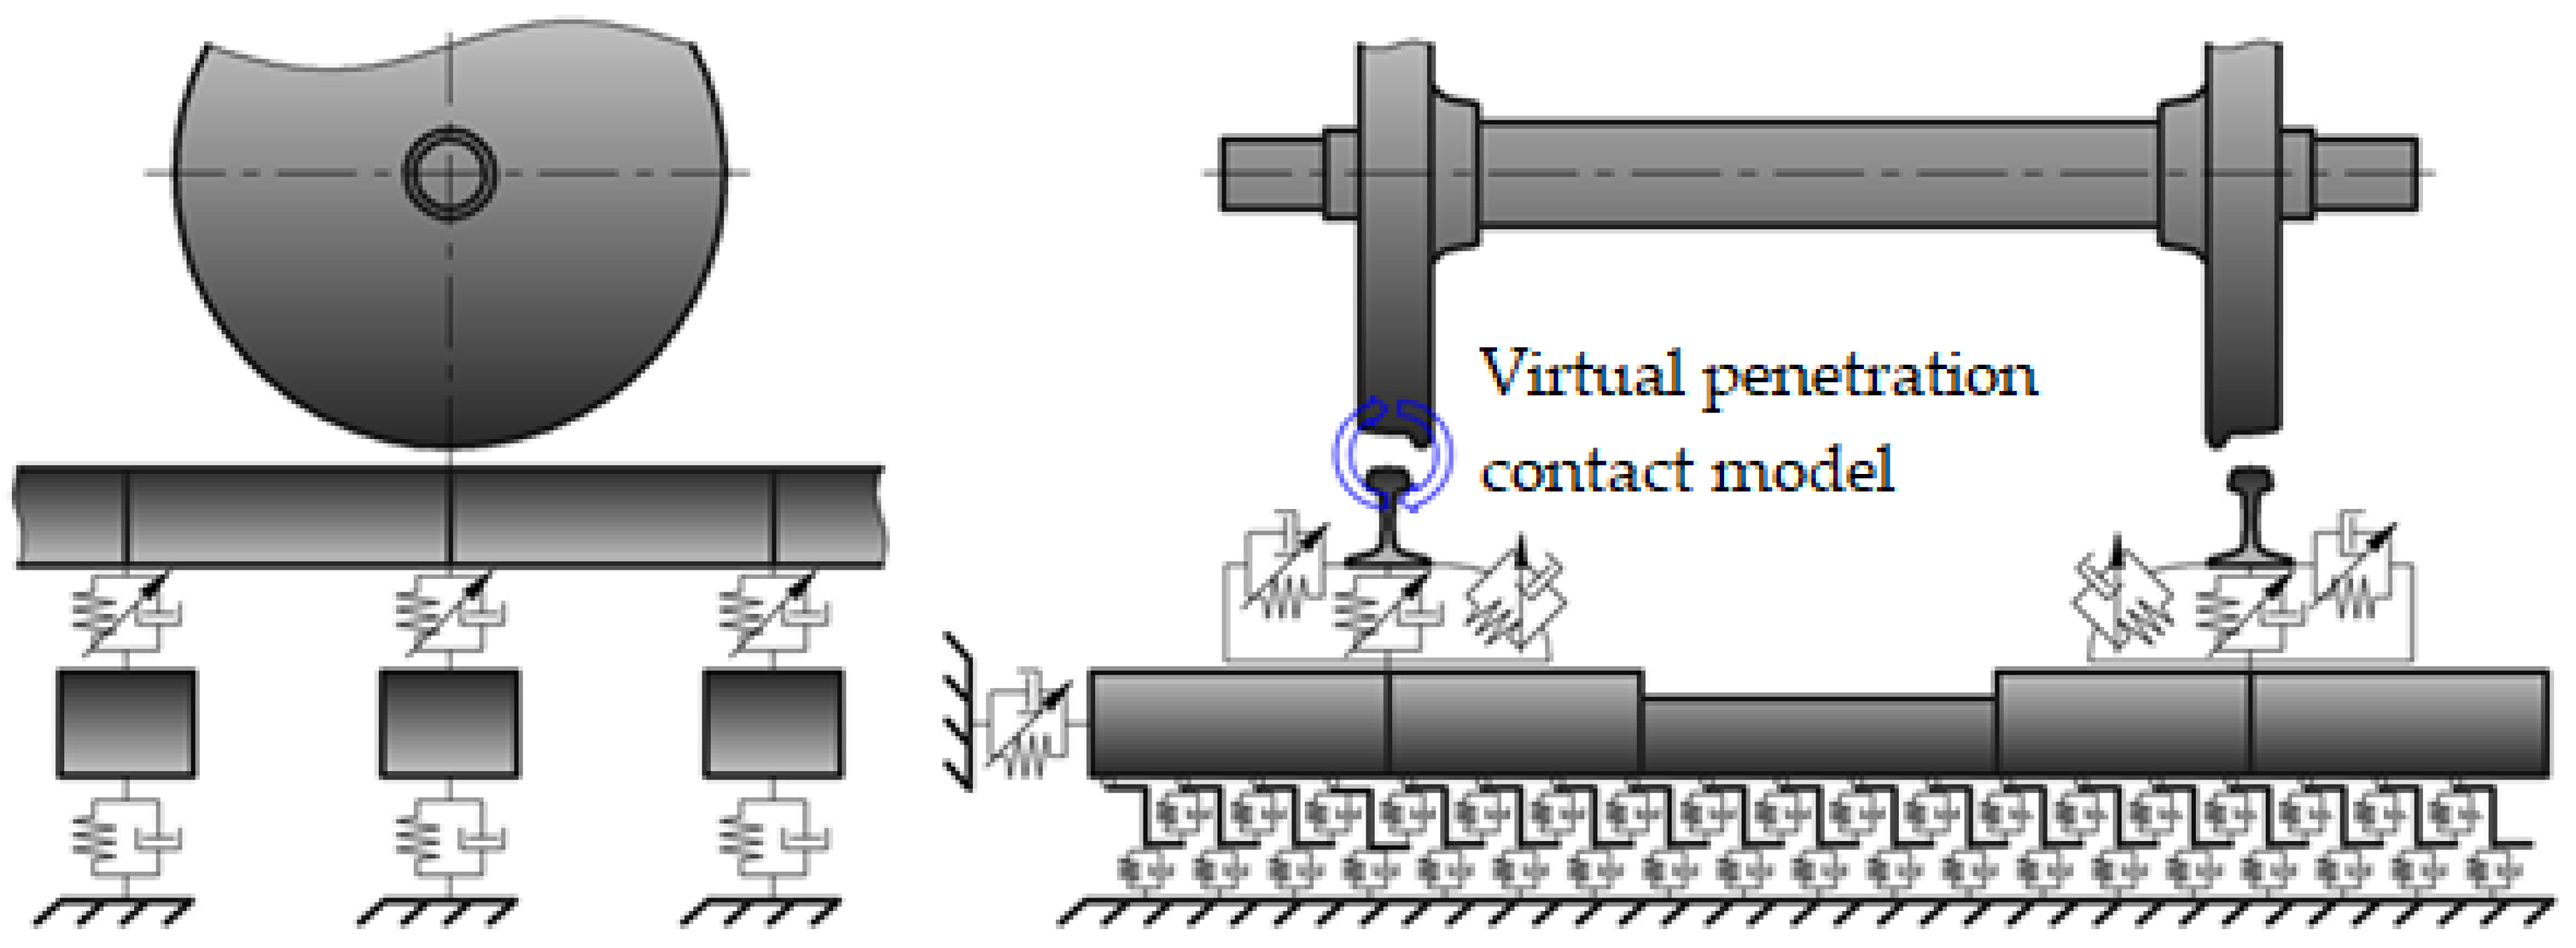
Figure 3.
Model of rolling stock.
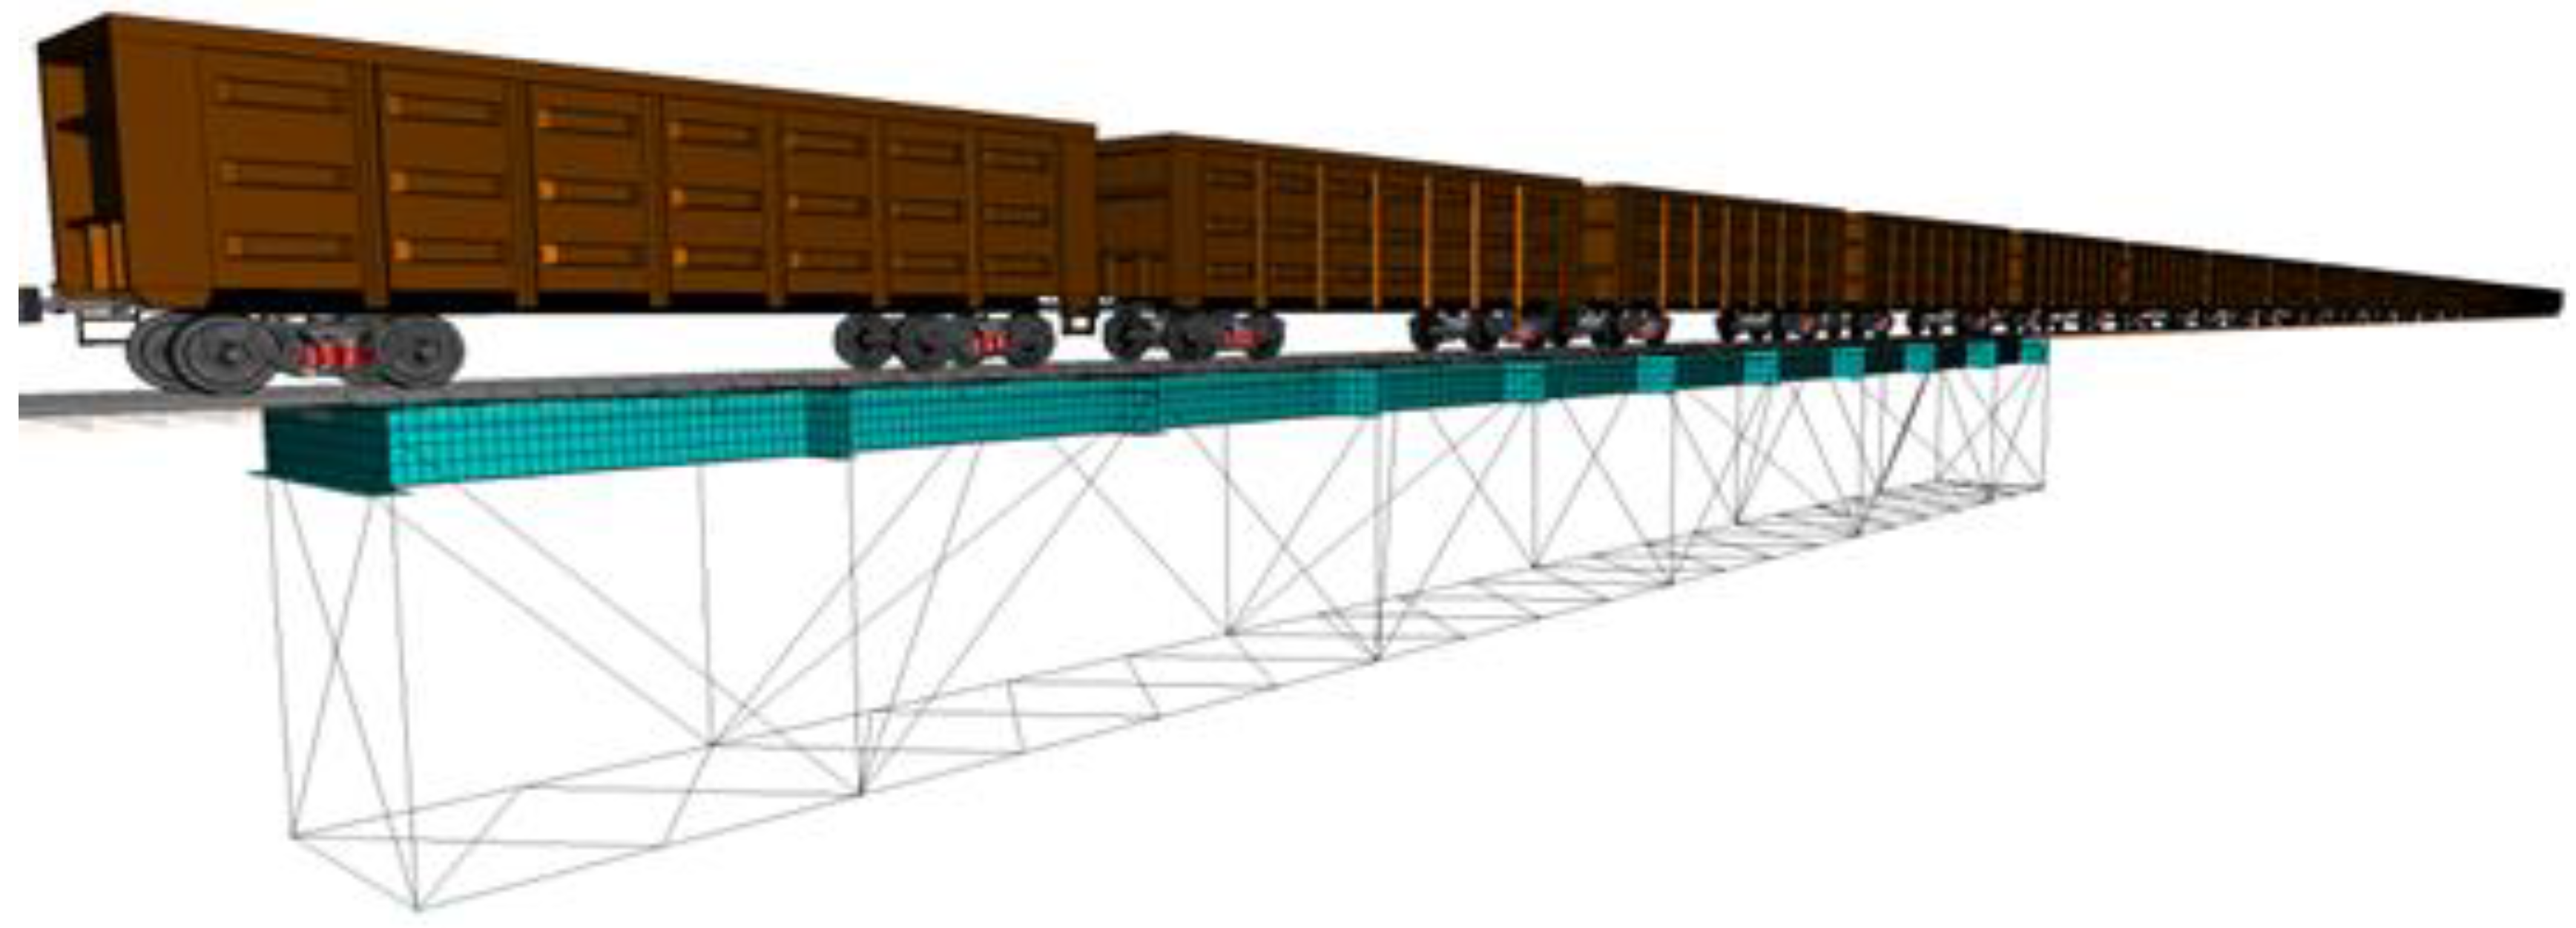
Figure 4.
Forms of car oscillations: upper lateral roll – on the left, bouncing – on the right.
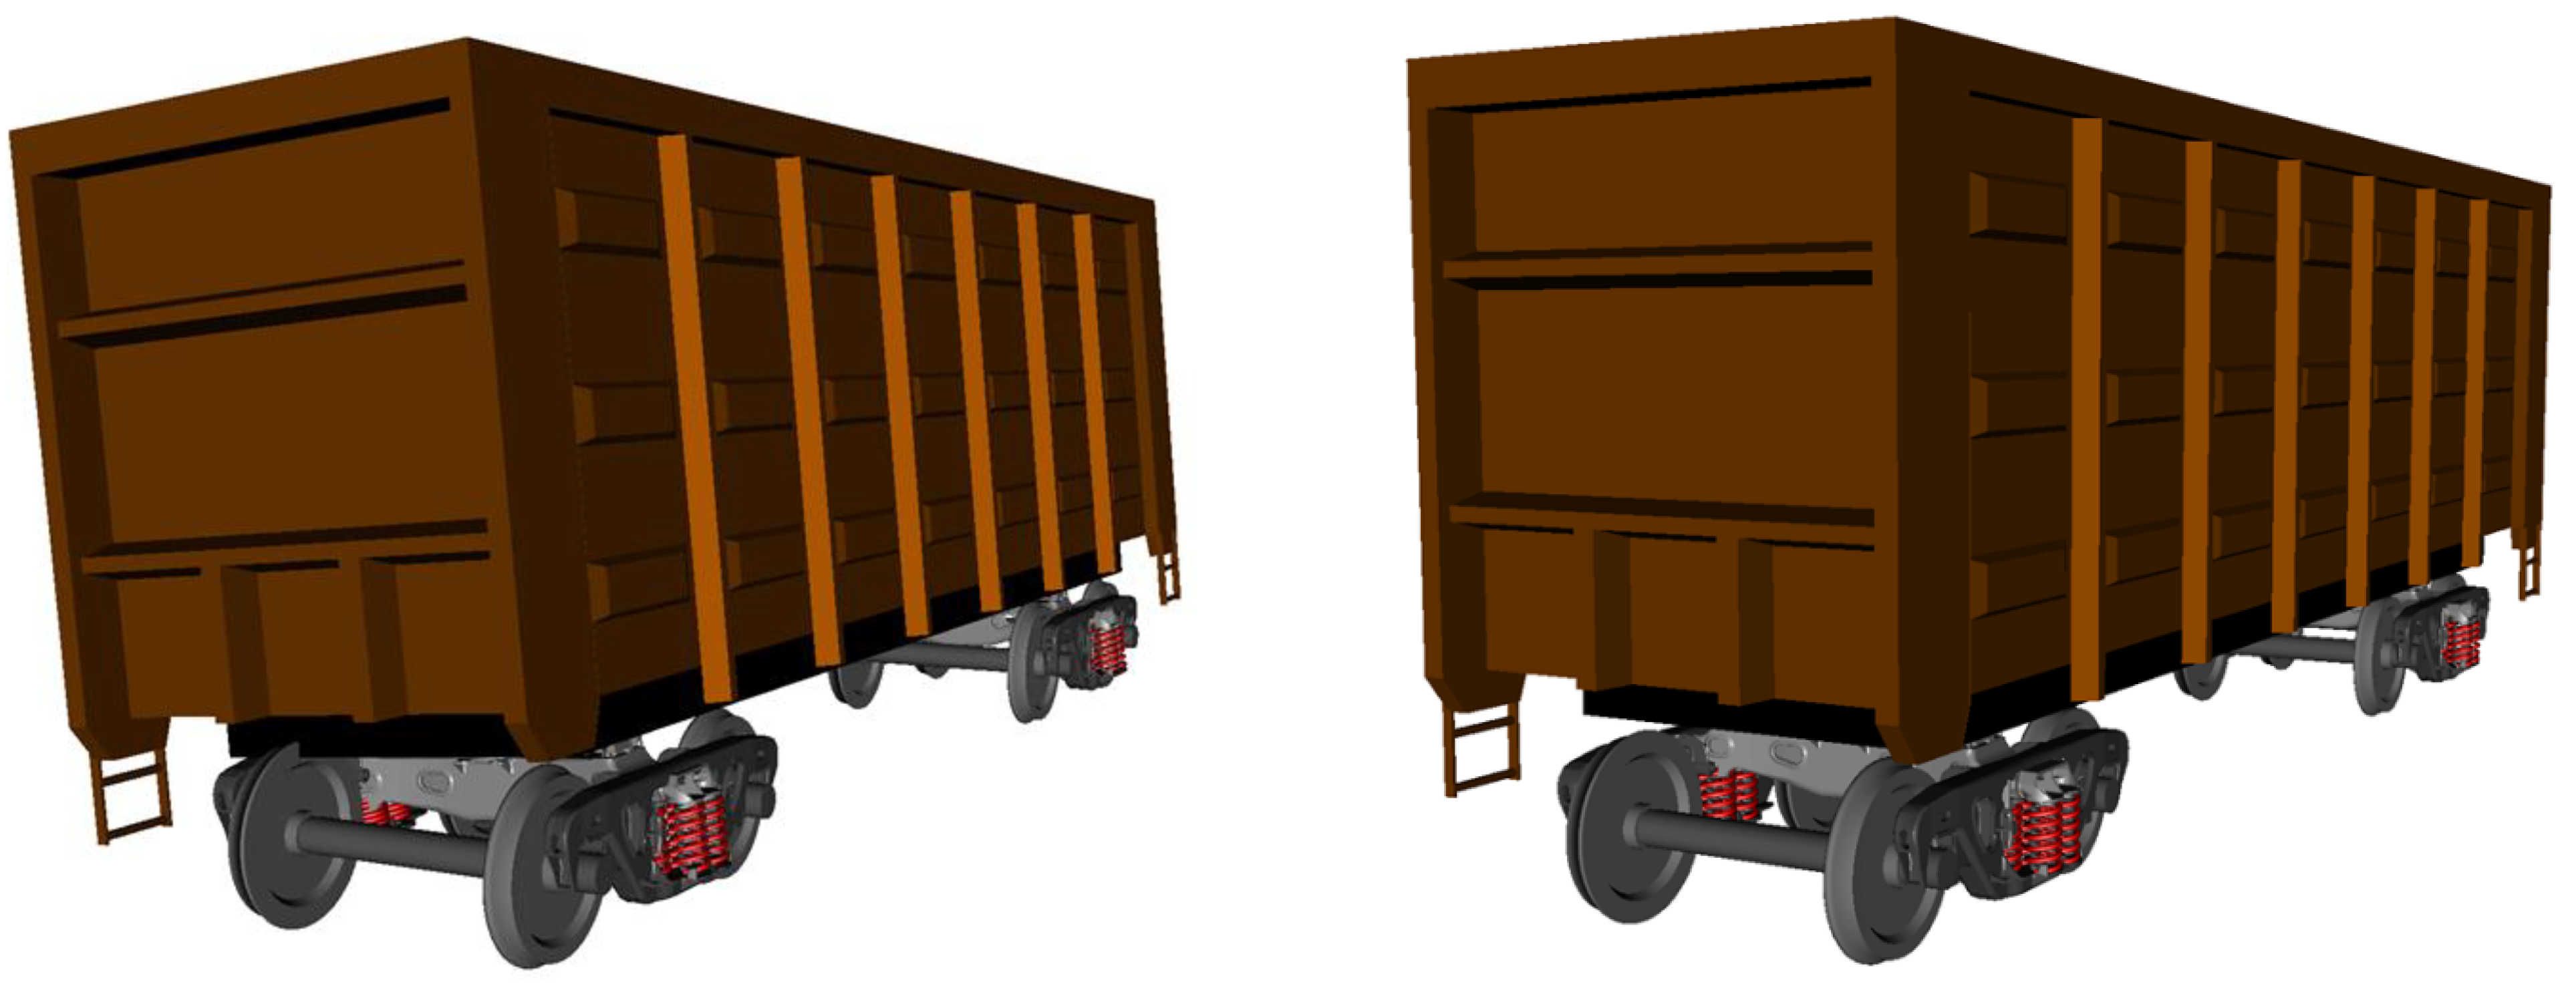
Figure 5.
New profile - red, worn profile - black.
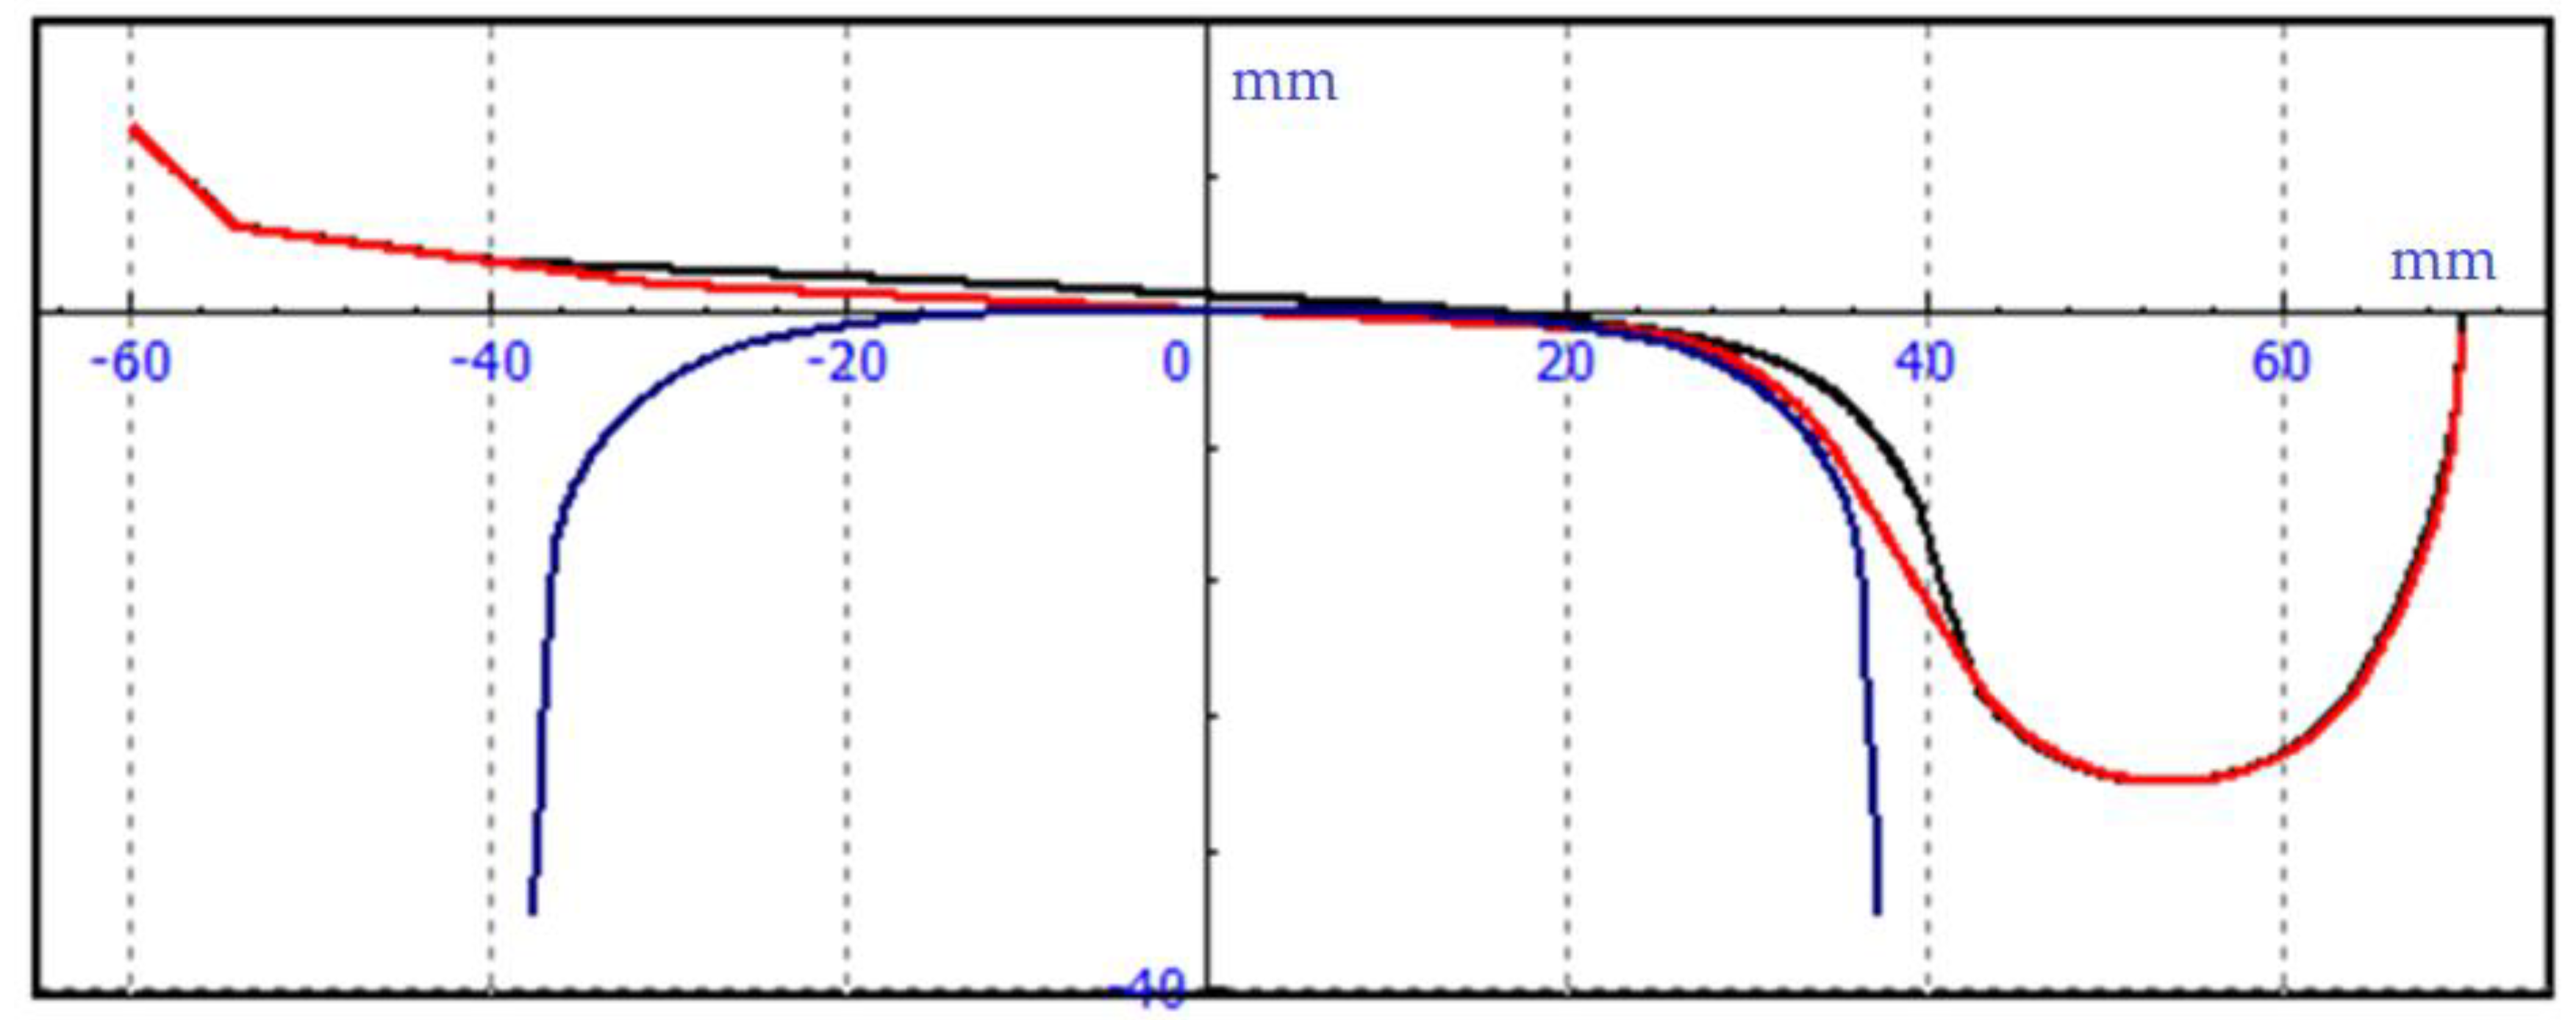
Figure 6.
Imperfections of the path.
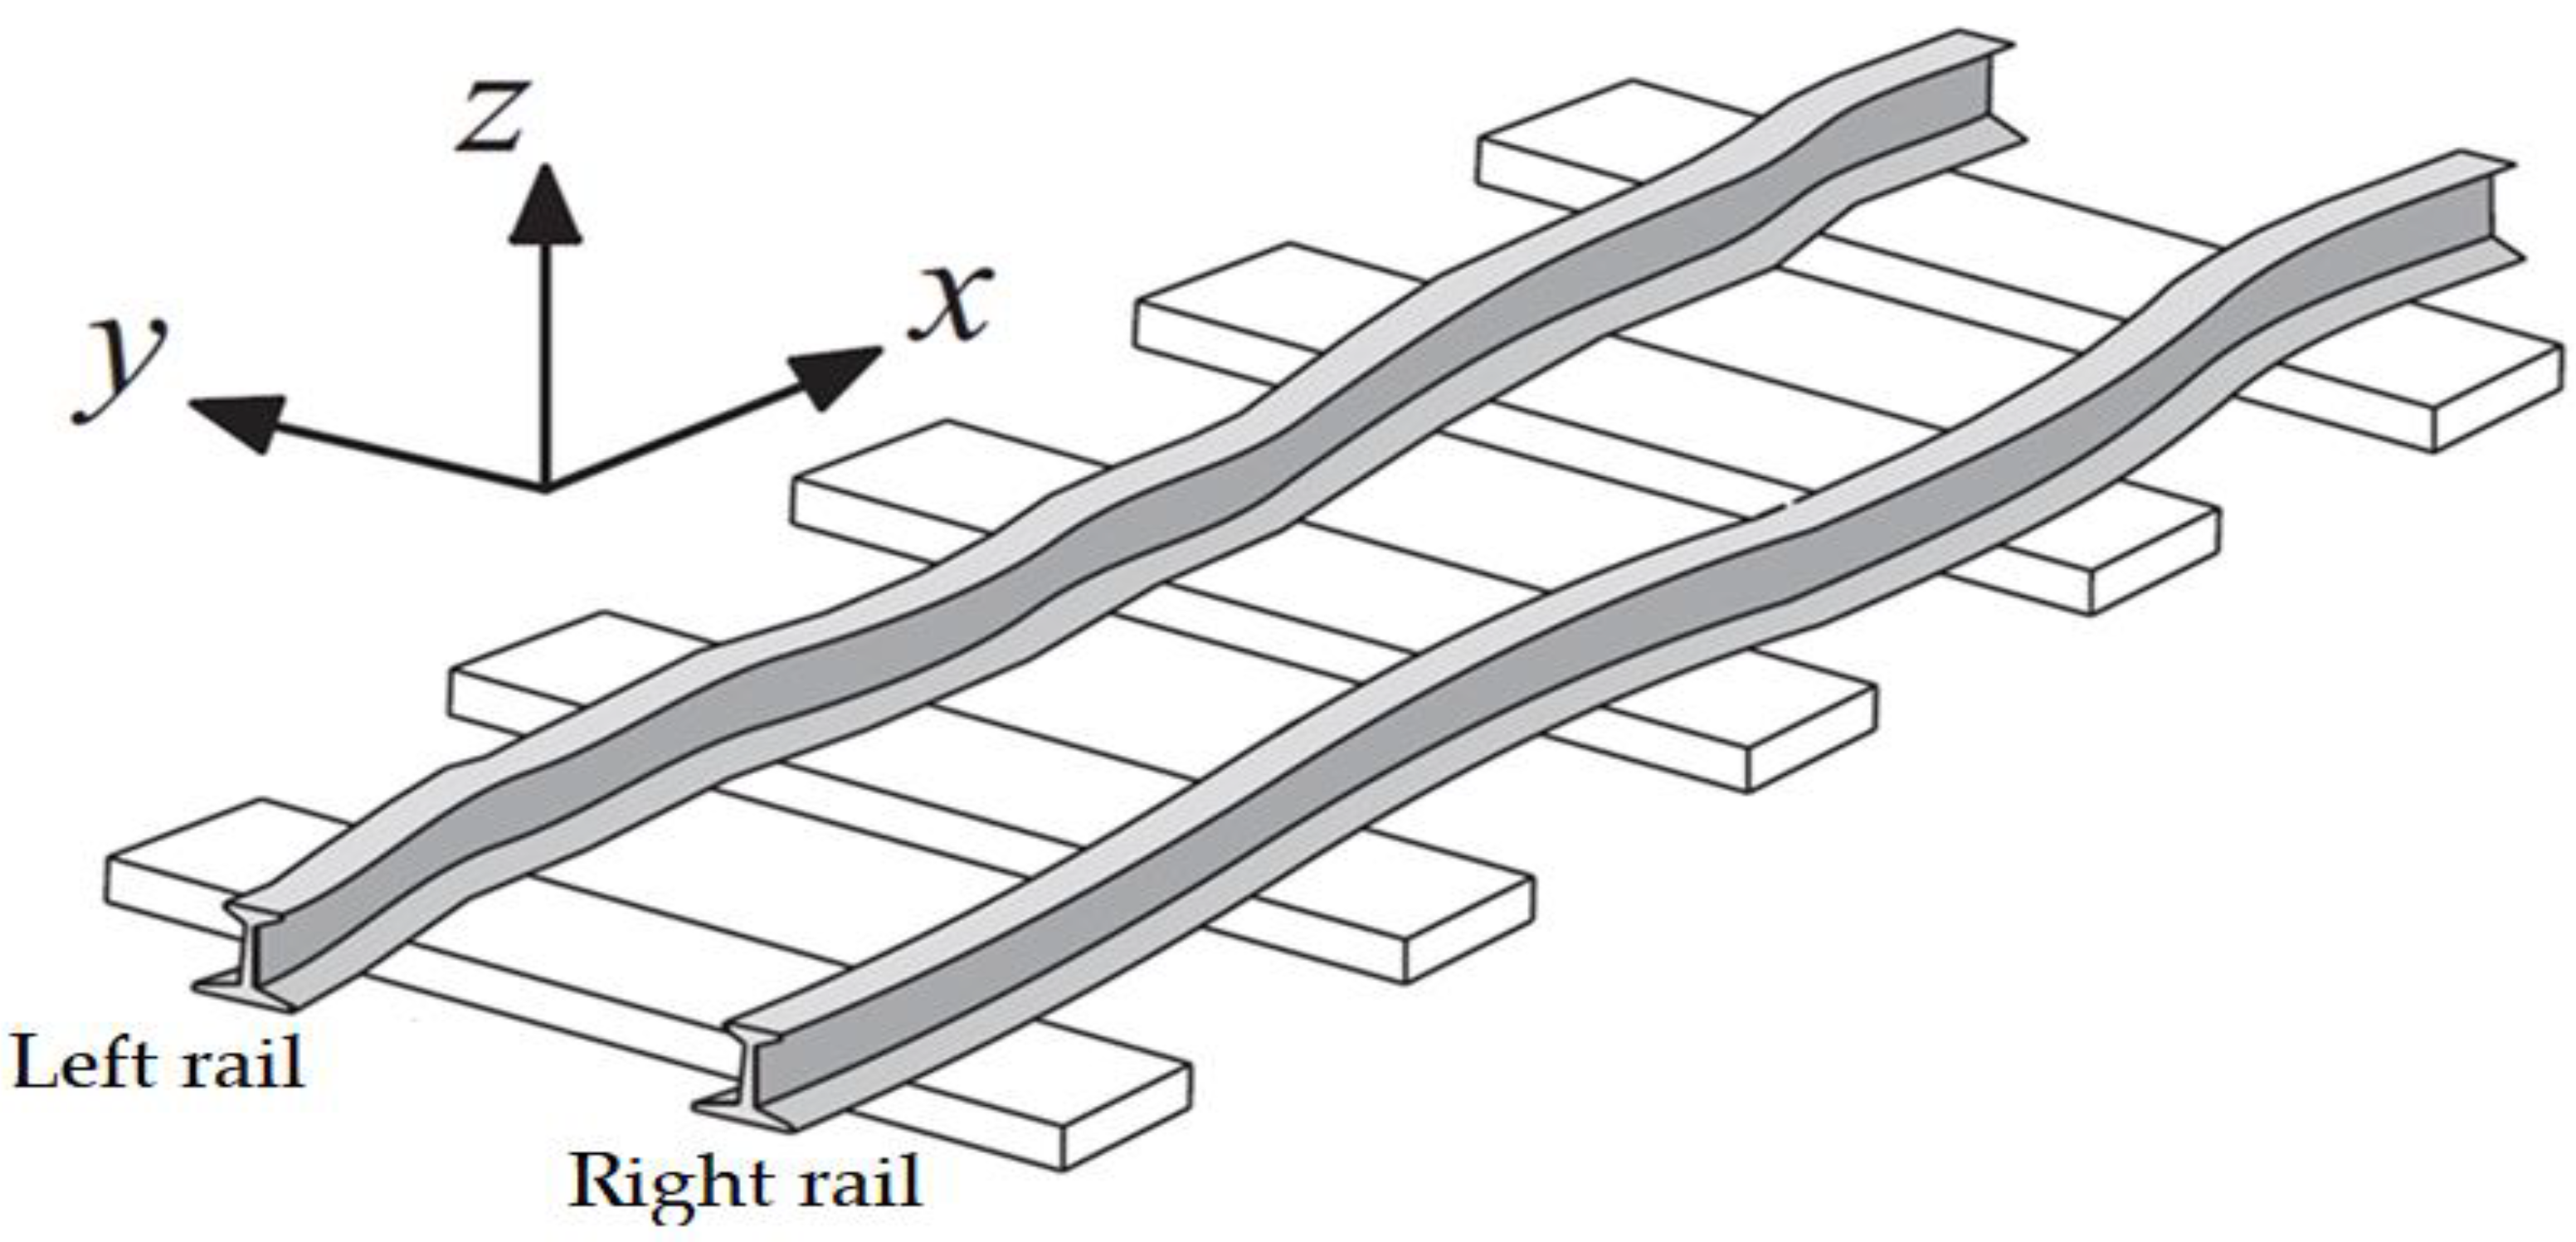
Figure 7.
Vertical and horizontal imperfections of the track.
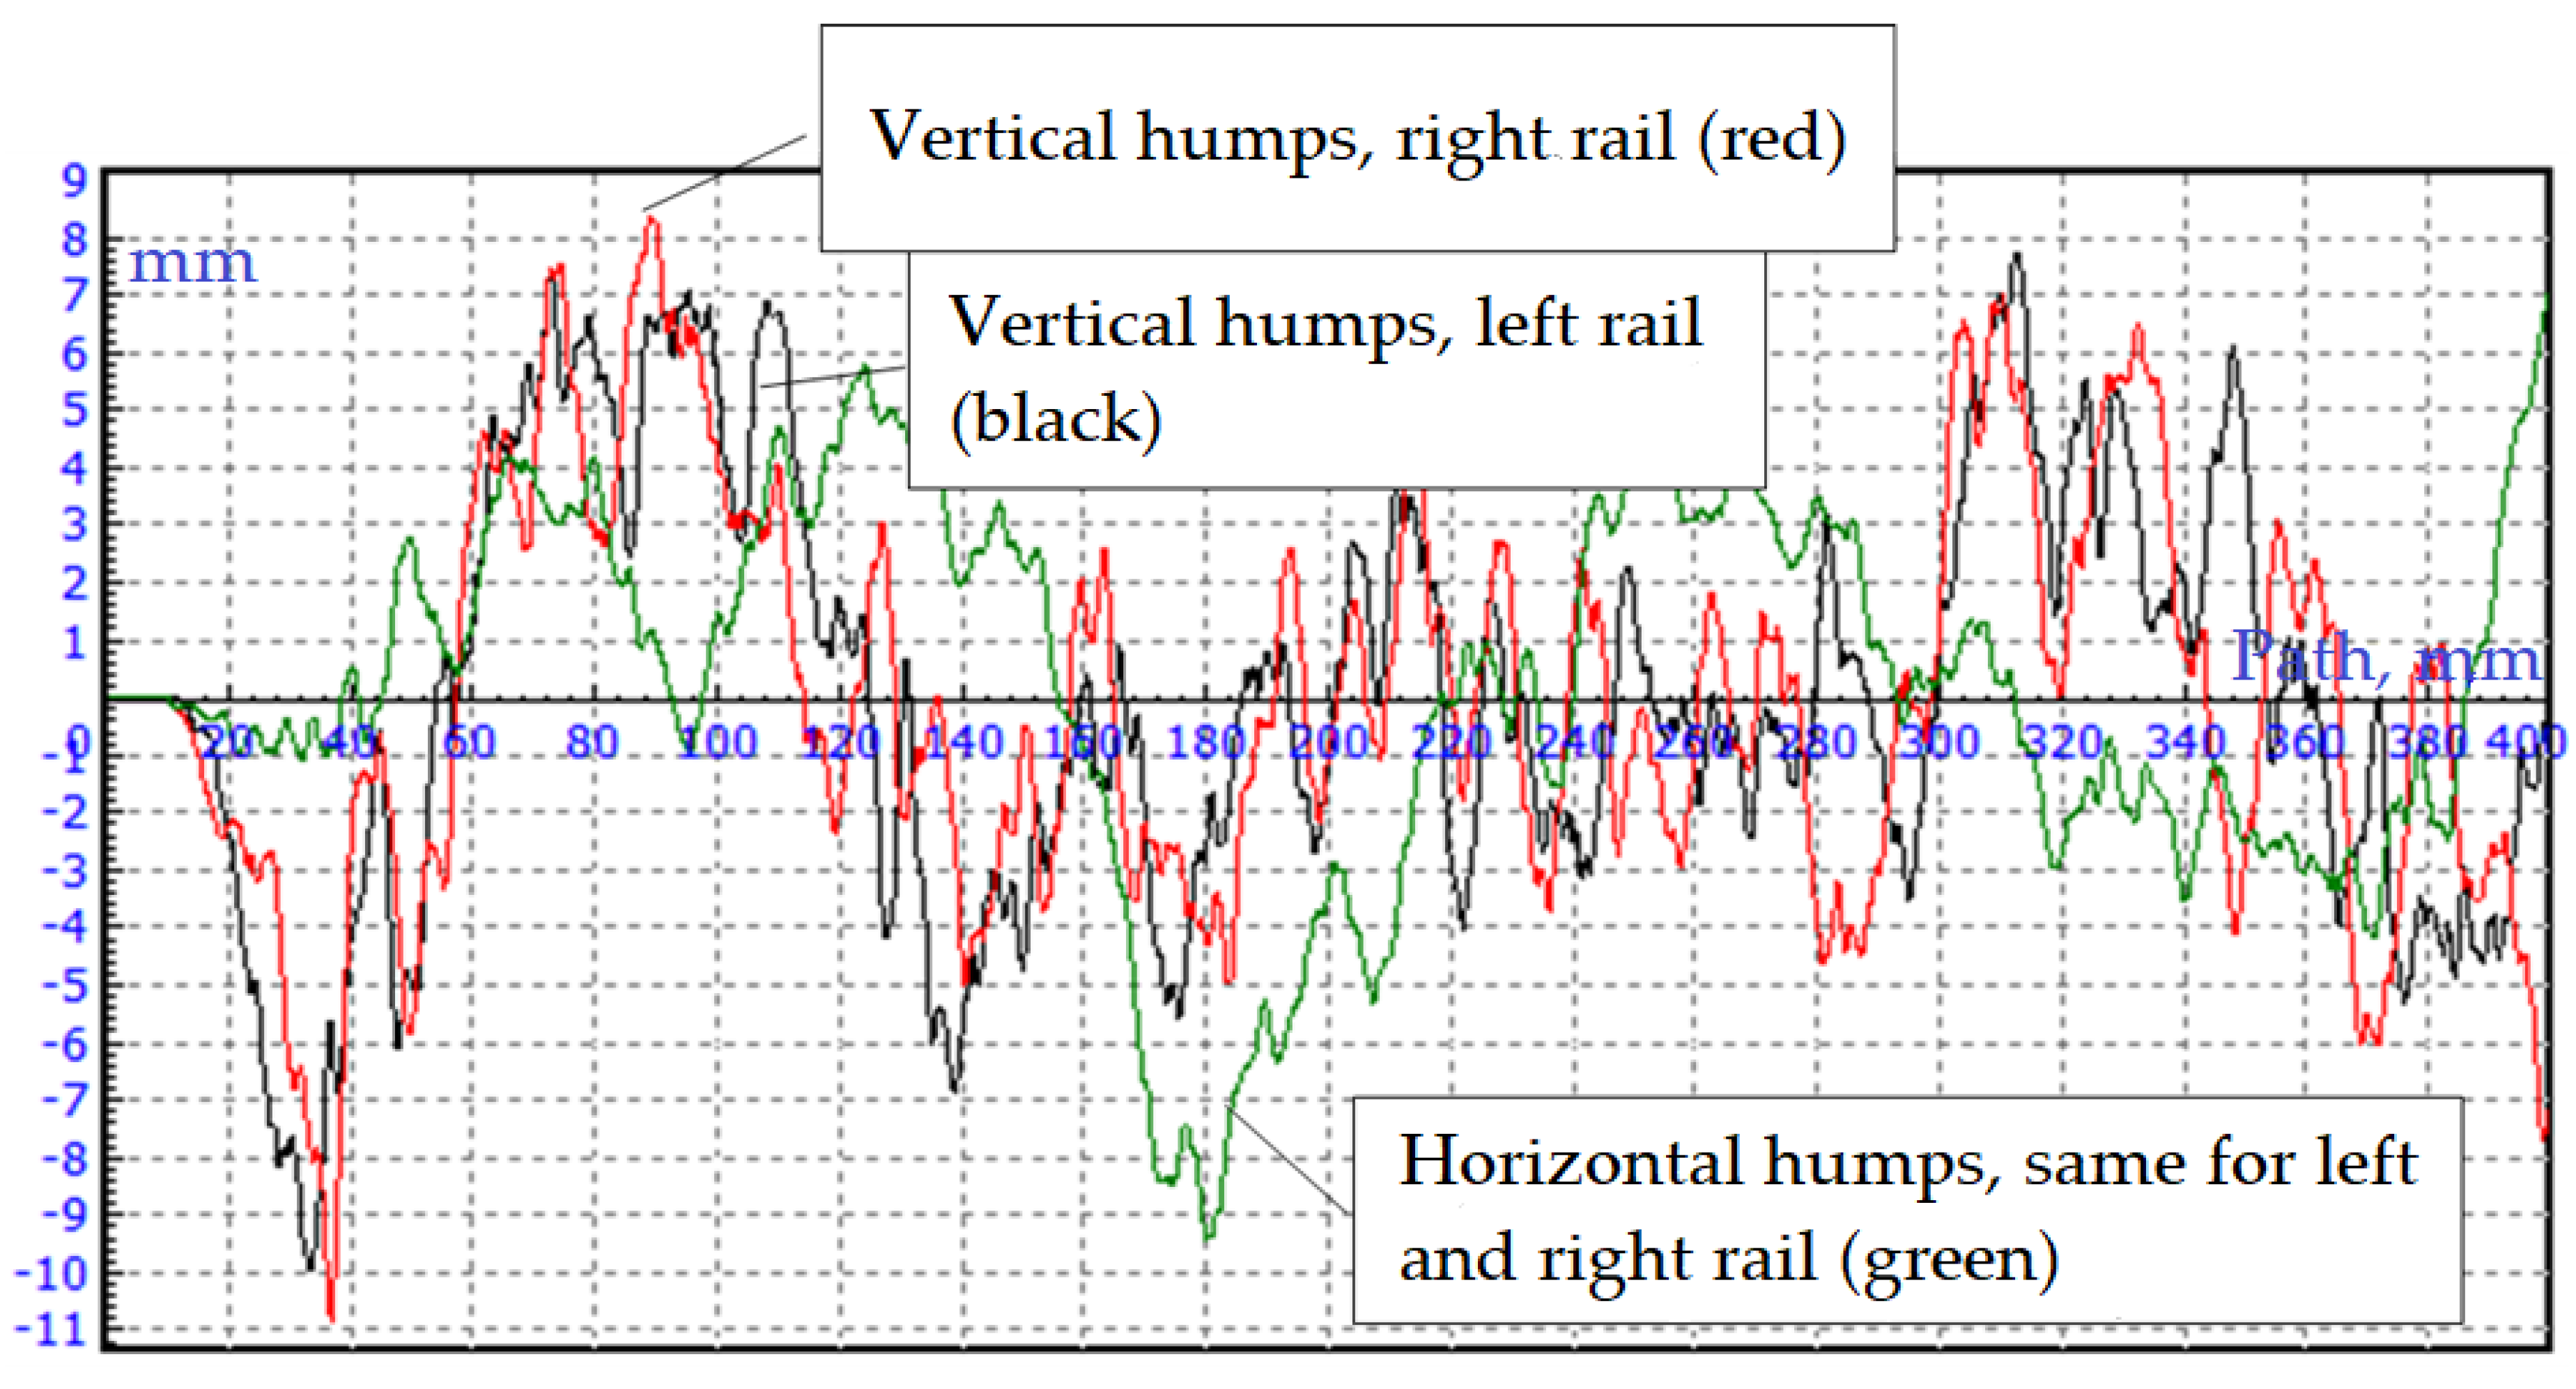
Figure 8.
Recording point of oscillograms of the span structure vibrations.
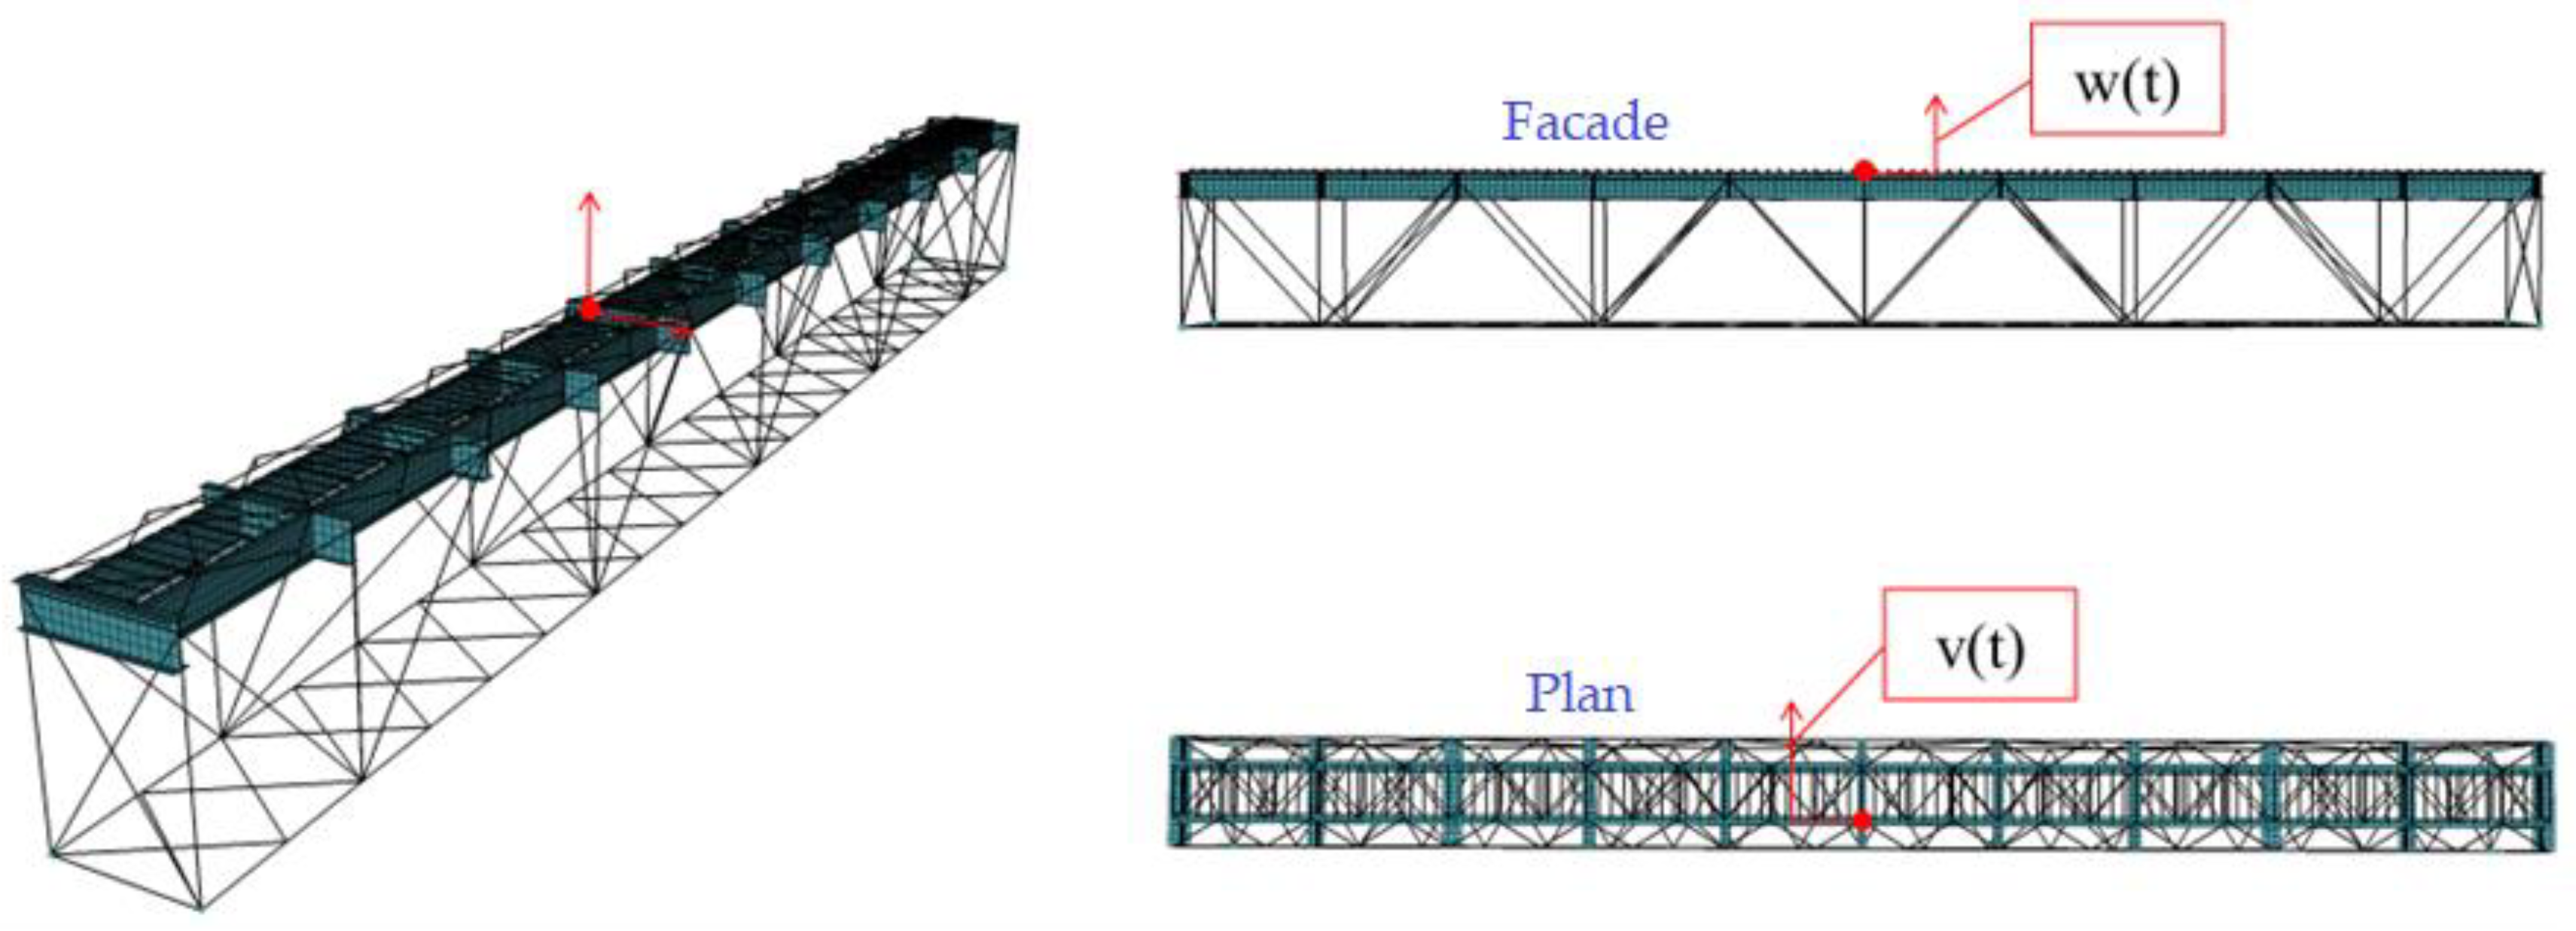
Figure 9.
Projection of forces in contact between the wheel flange and the rail on the transverse vertical plane at the moment of the start of derailment.
Figure 9.
Projection of forces in contact between the wheel flange and the rail on the transverse vertical plane at the moment of the start of derailment.
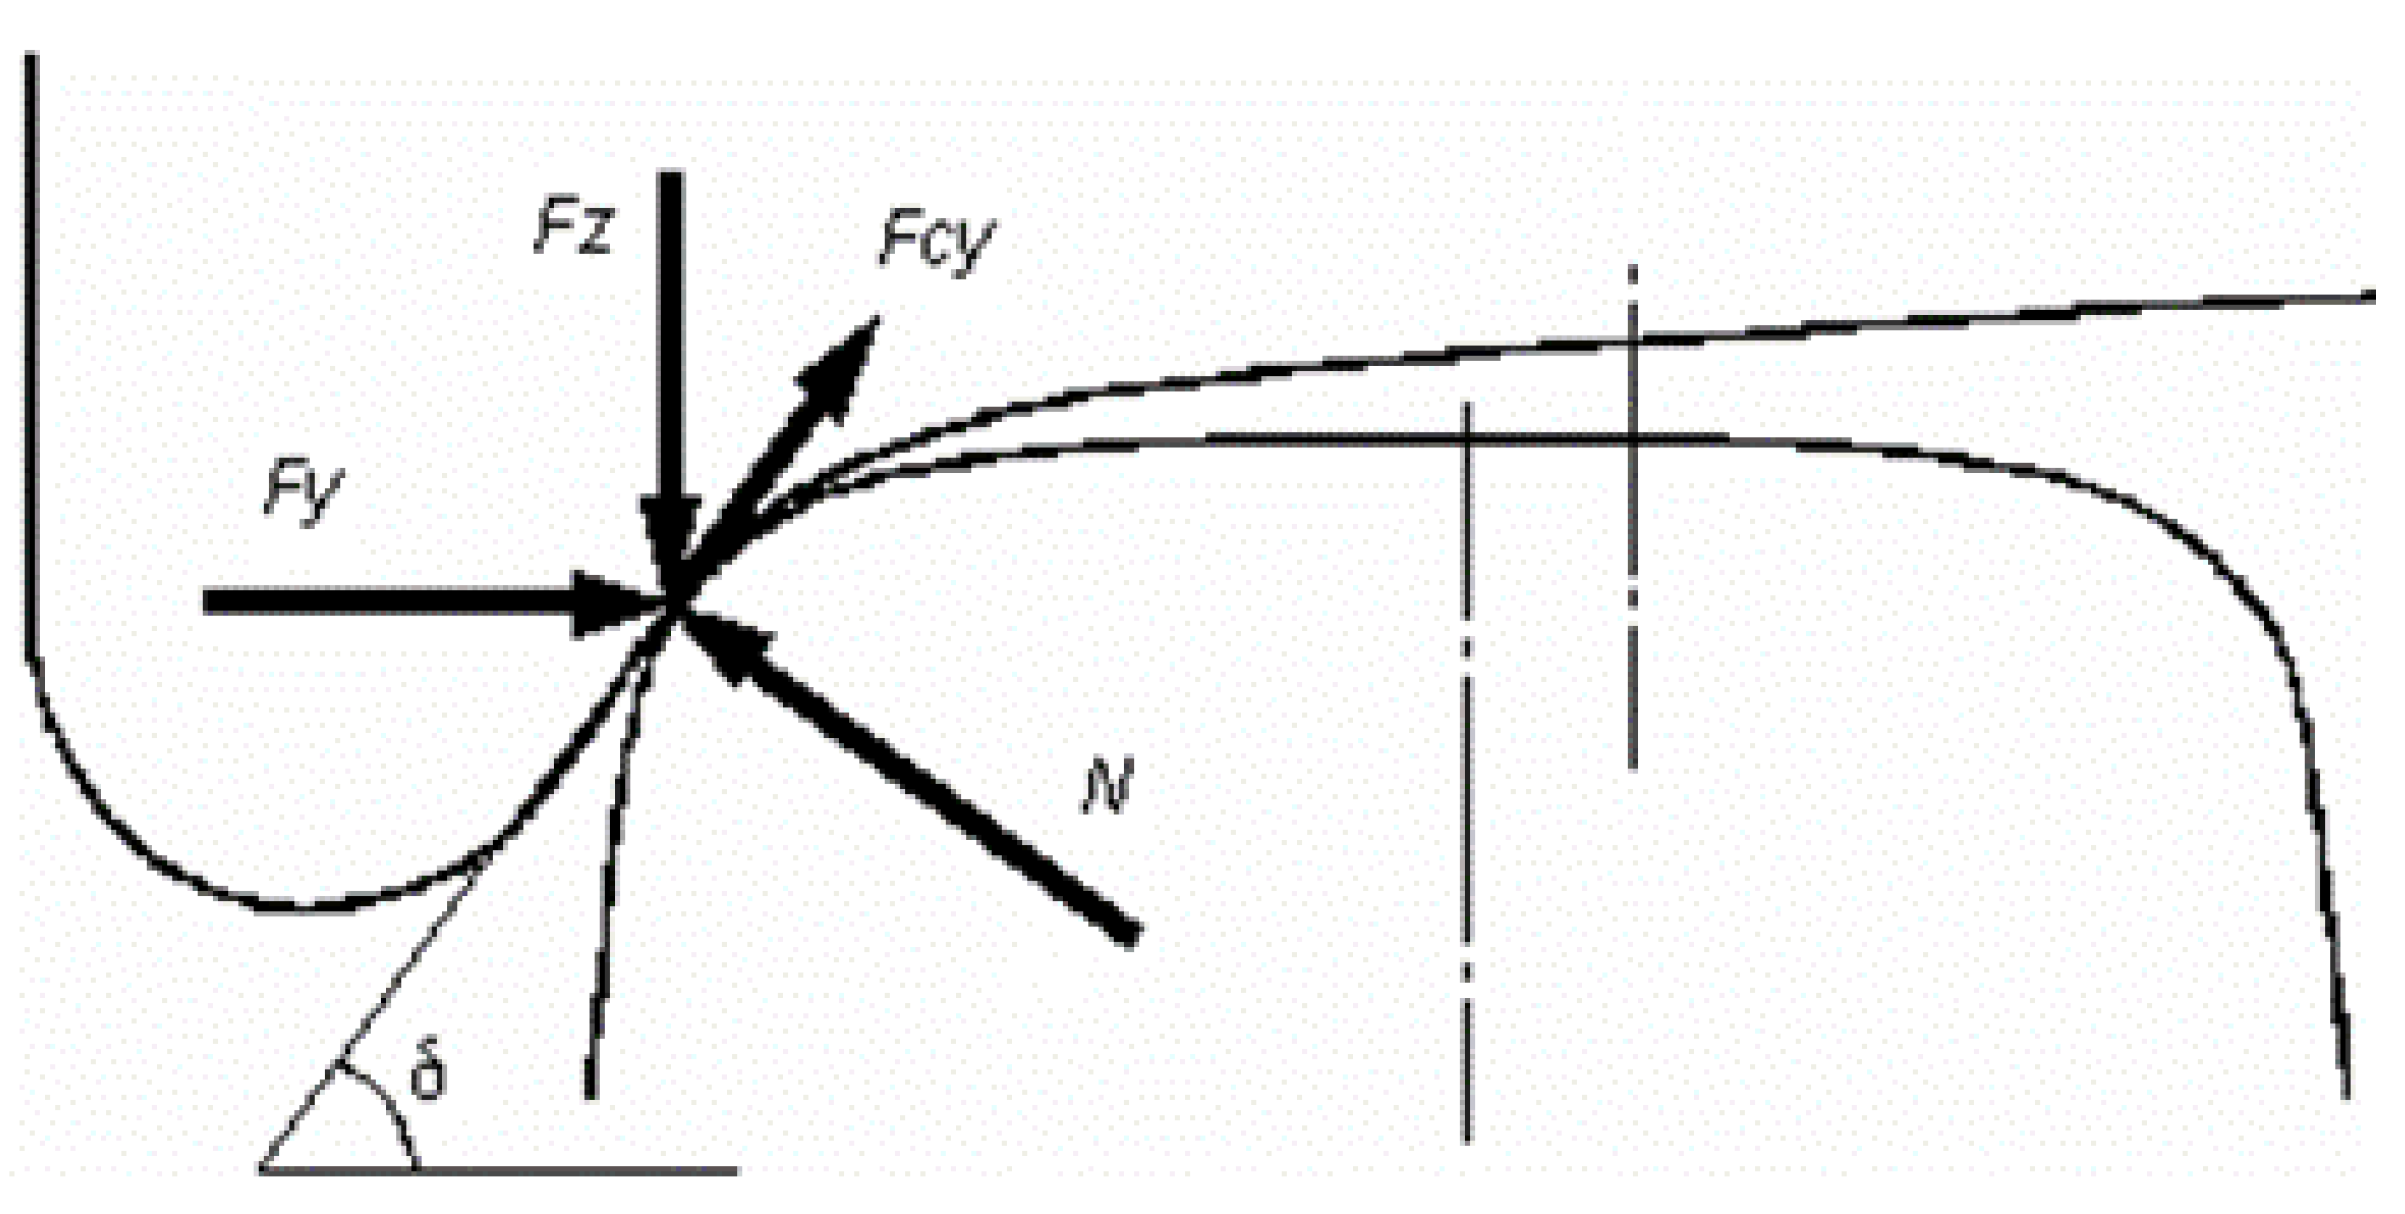
Figure 10.
Dependence of the limiting ratio according to the Nadal criterion on the comb inclination angle for different values of the friction coefficient.
Figure 10.
Dependence of the limiting ratio according to the Nadal criterion on the comb inclination angle for different values of the friction coefficient.
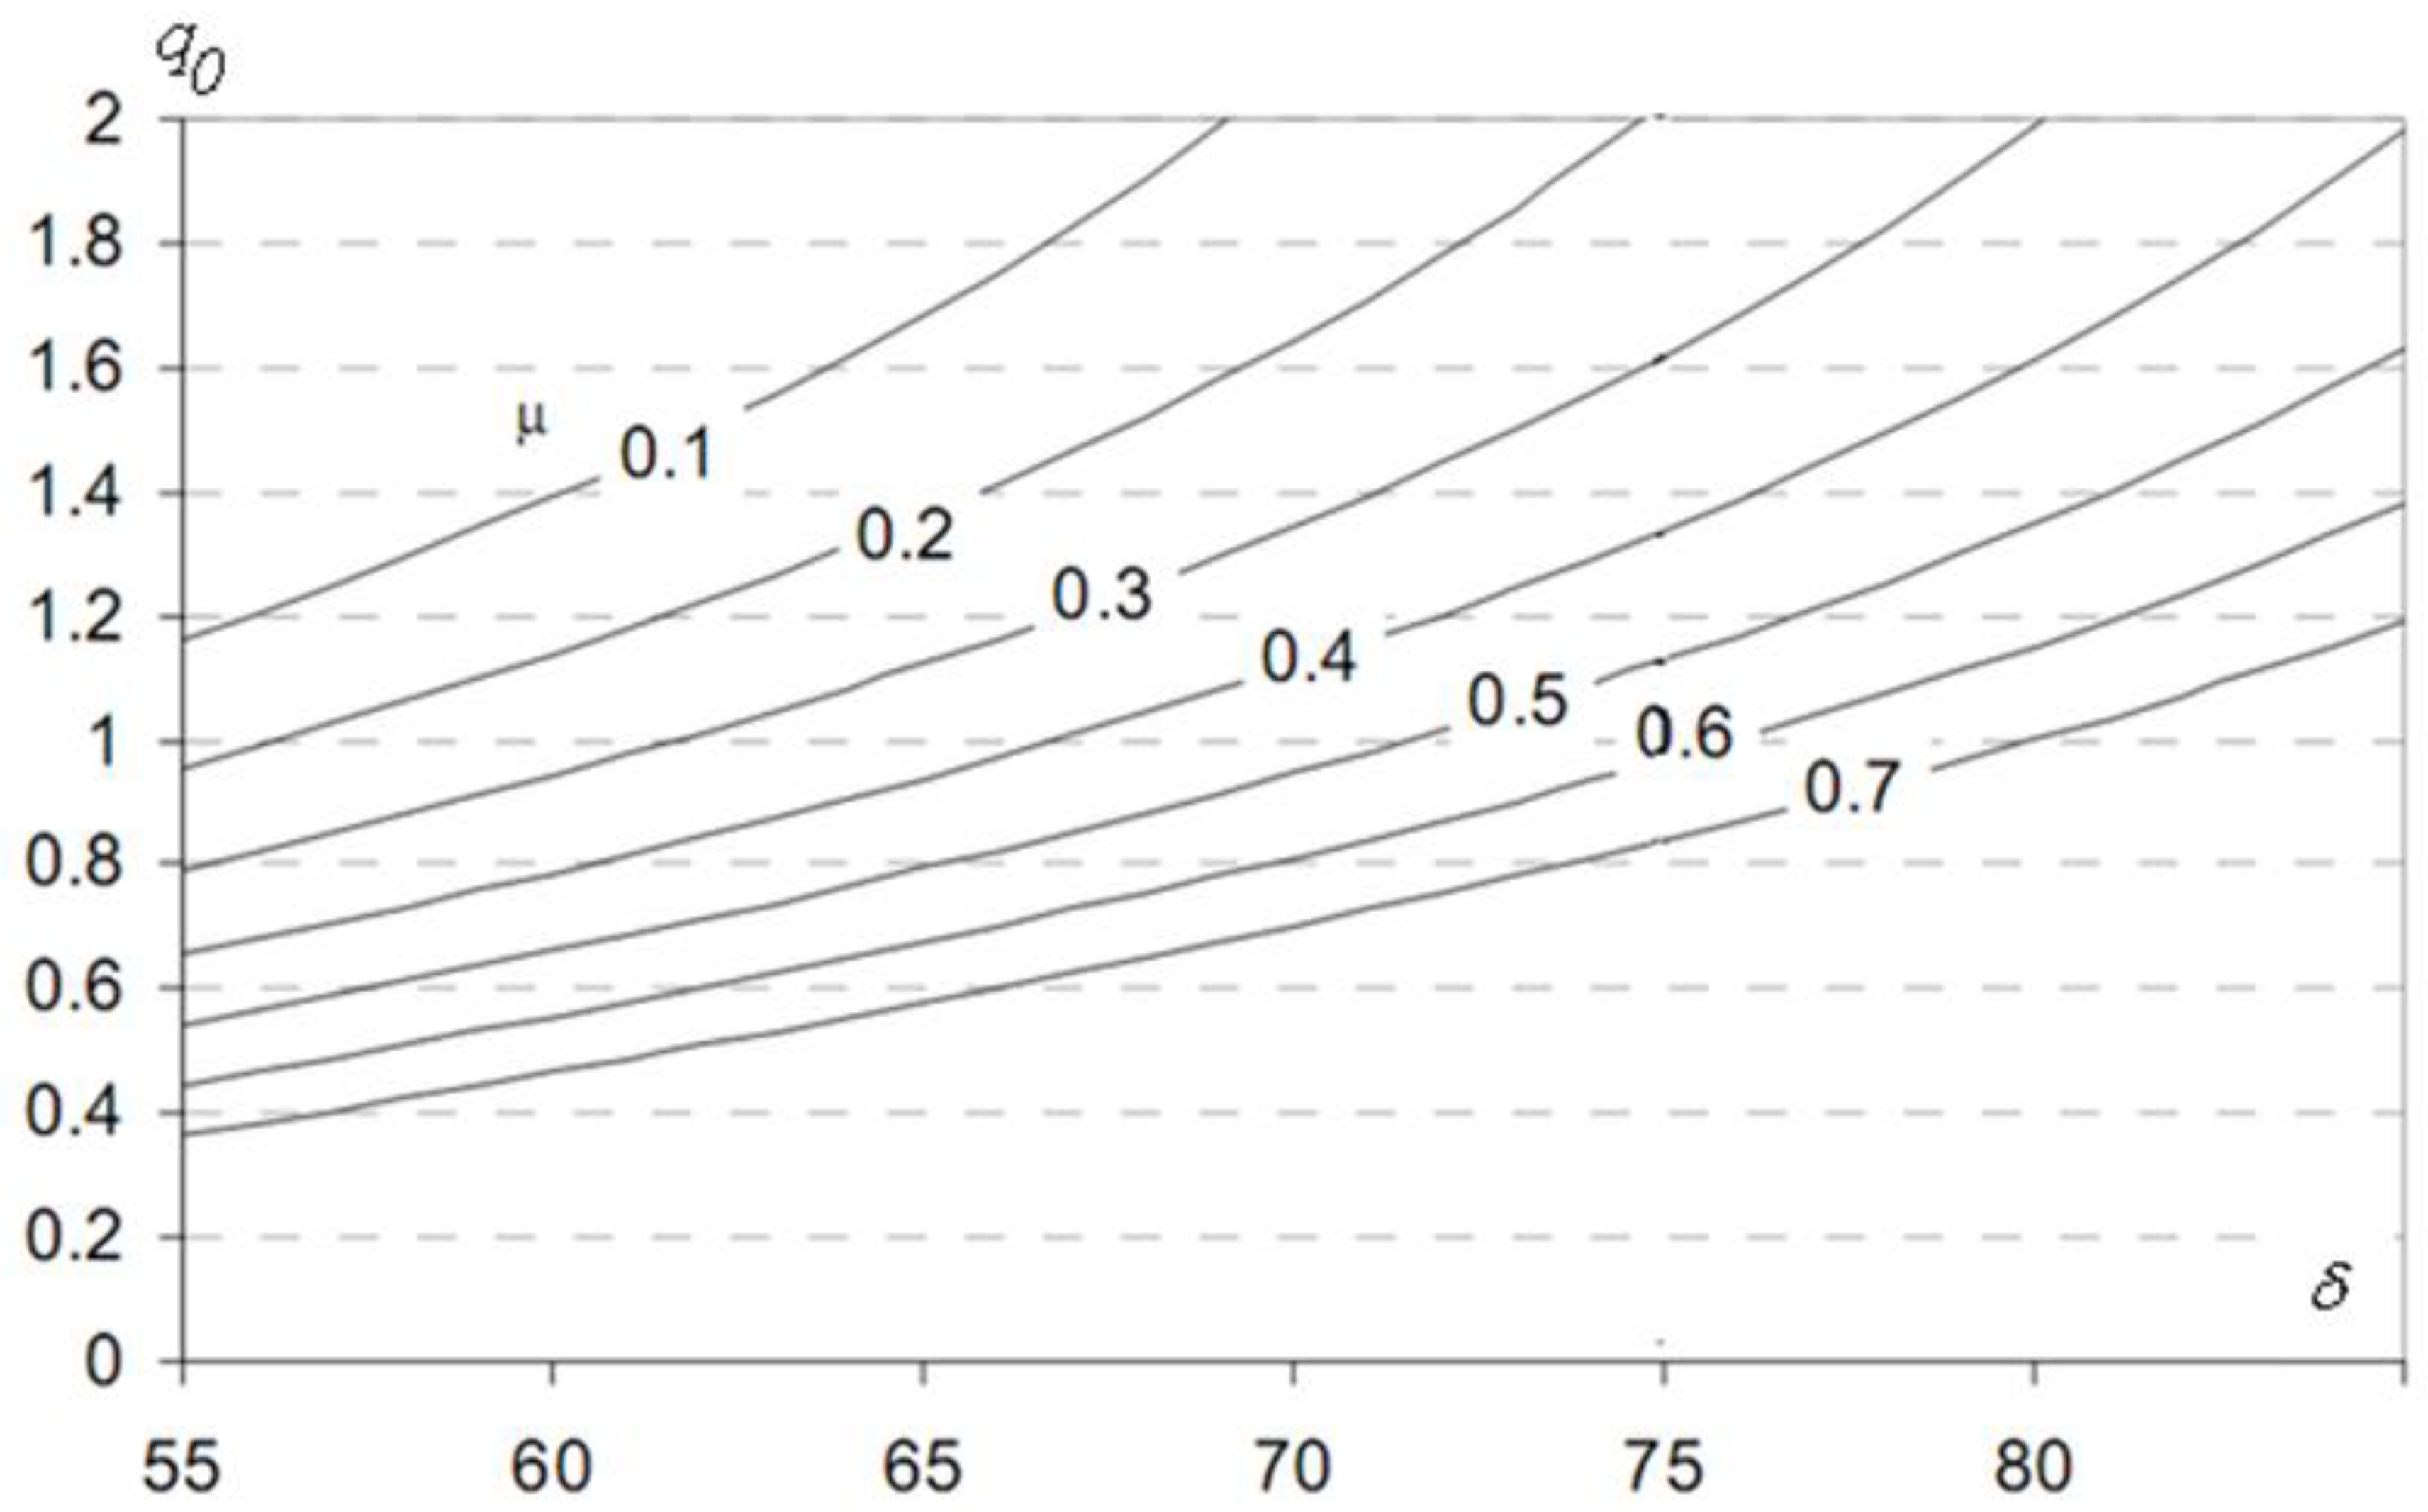
Figure 11.
Winding motion of a wheel pair.
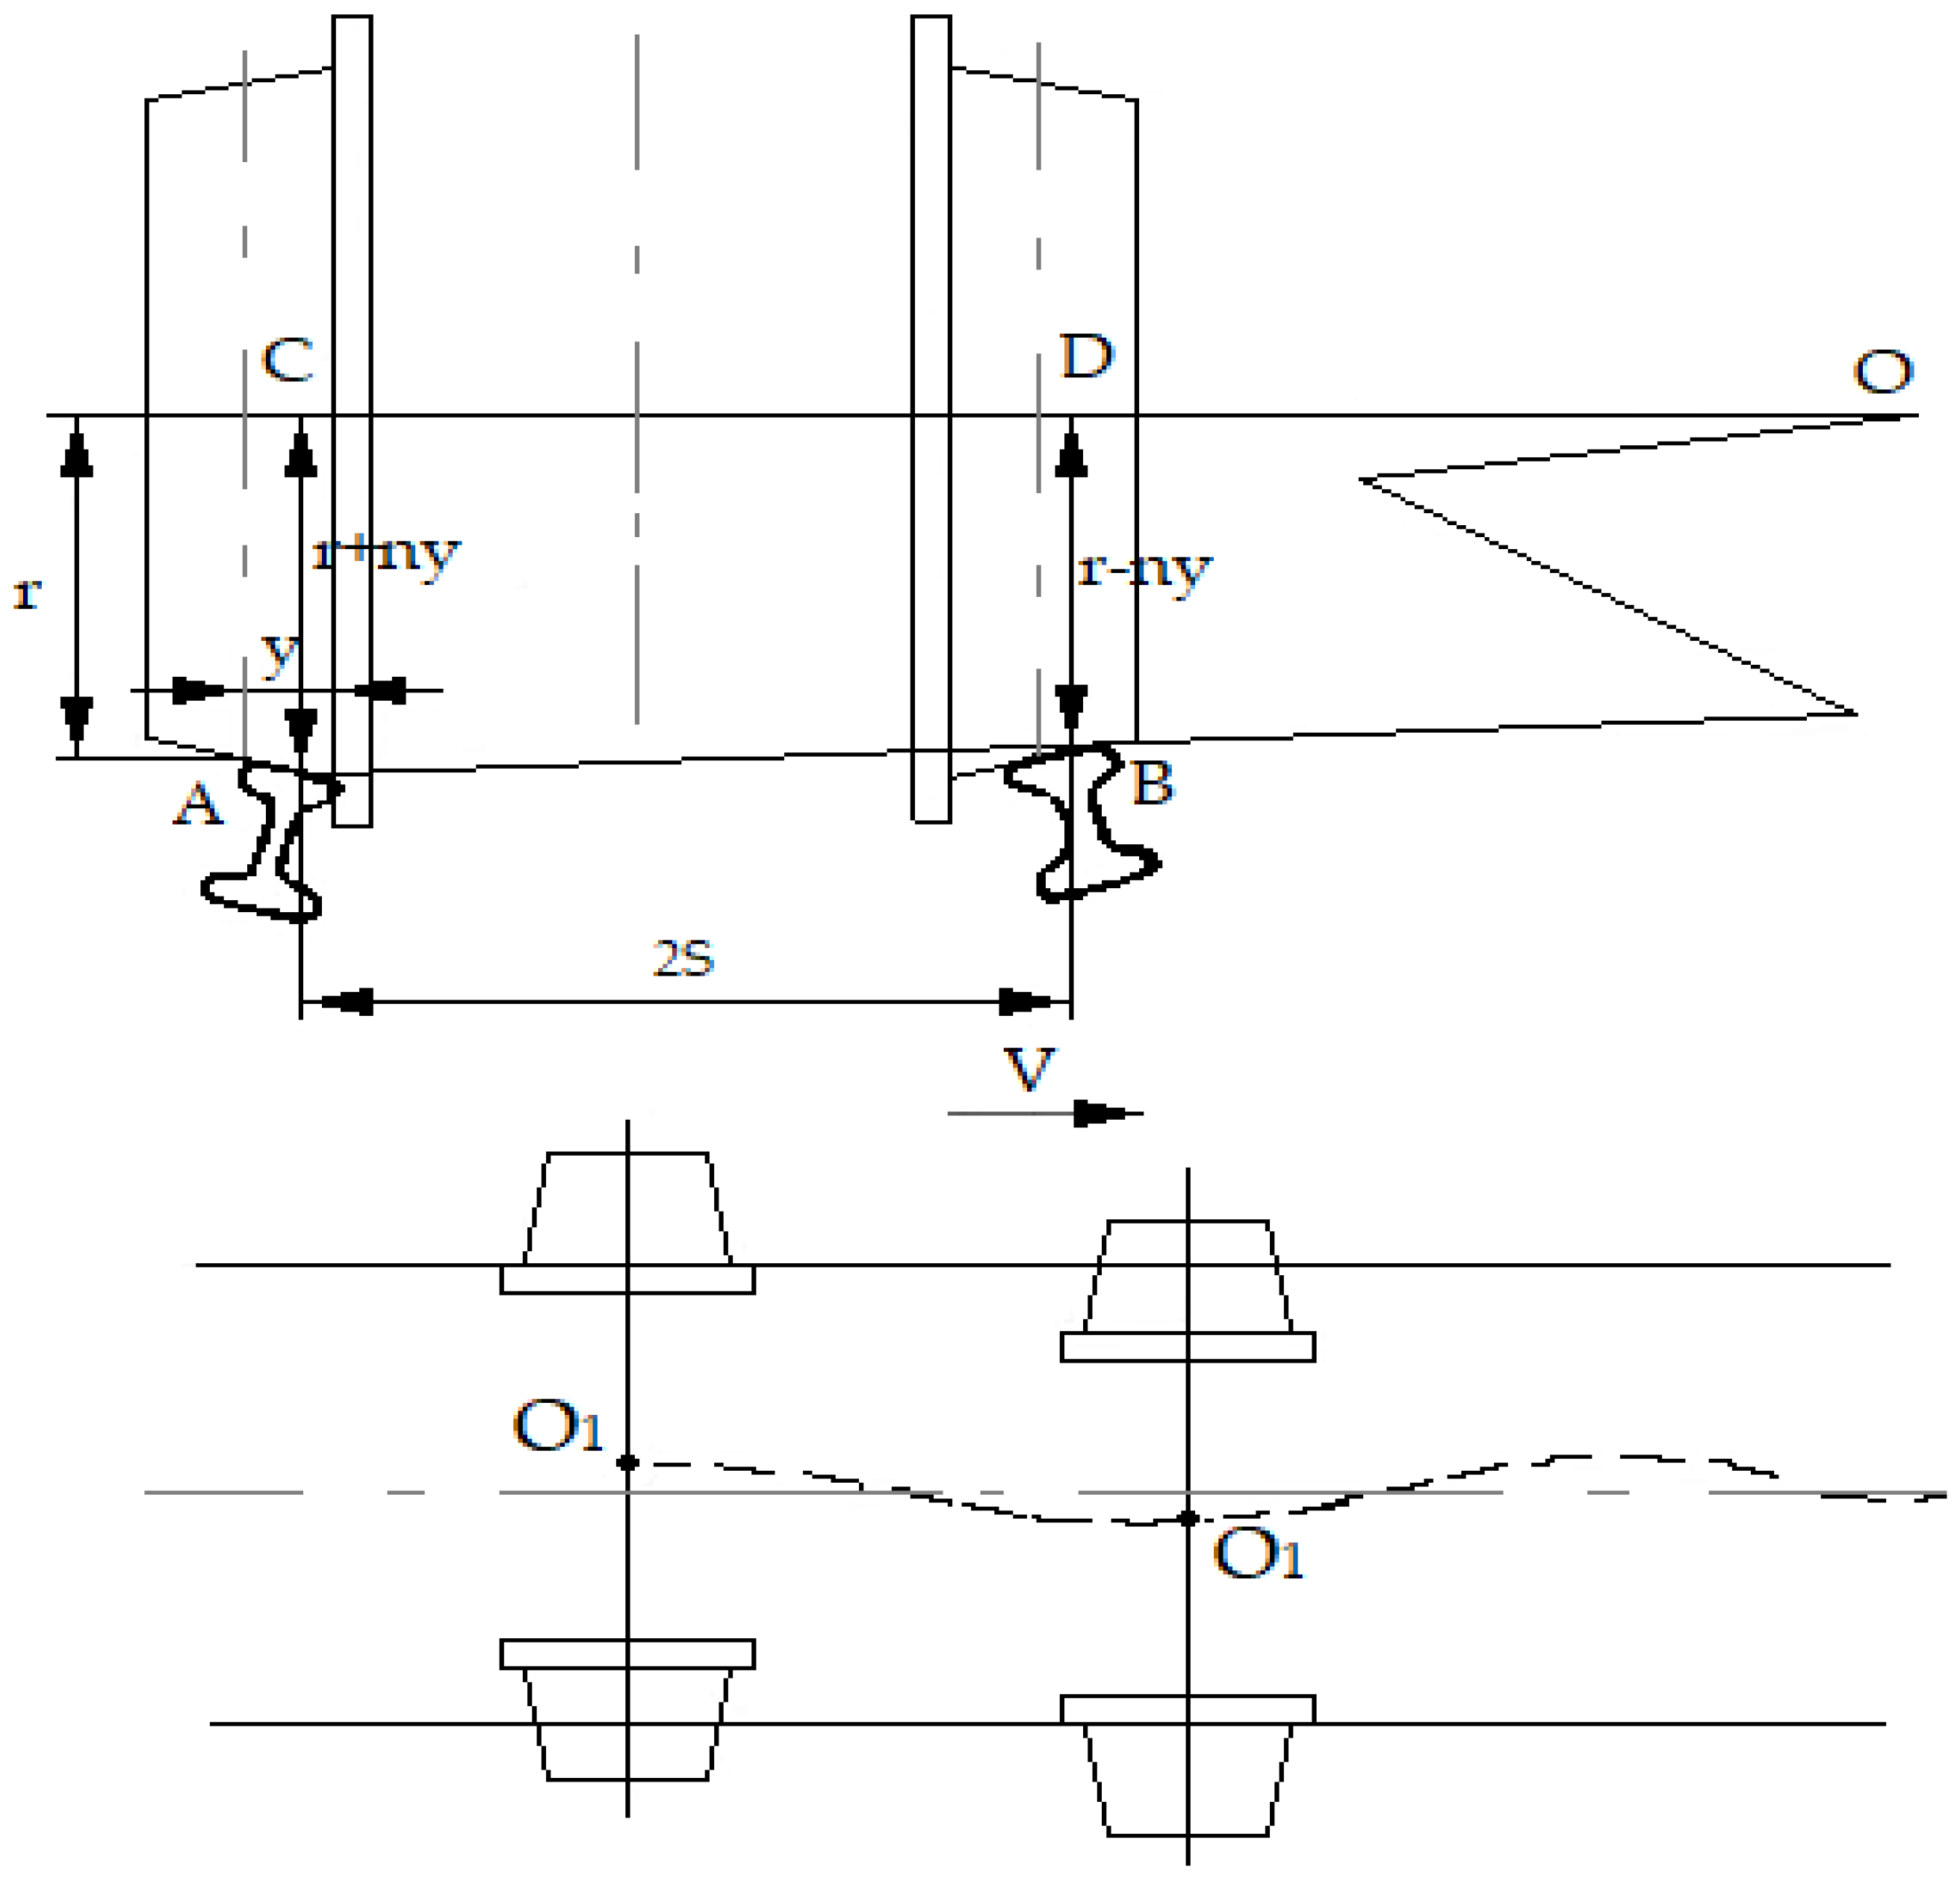
Figure 12.
Wheel pair for which transverse movements are recorded.
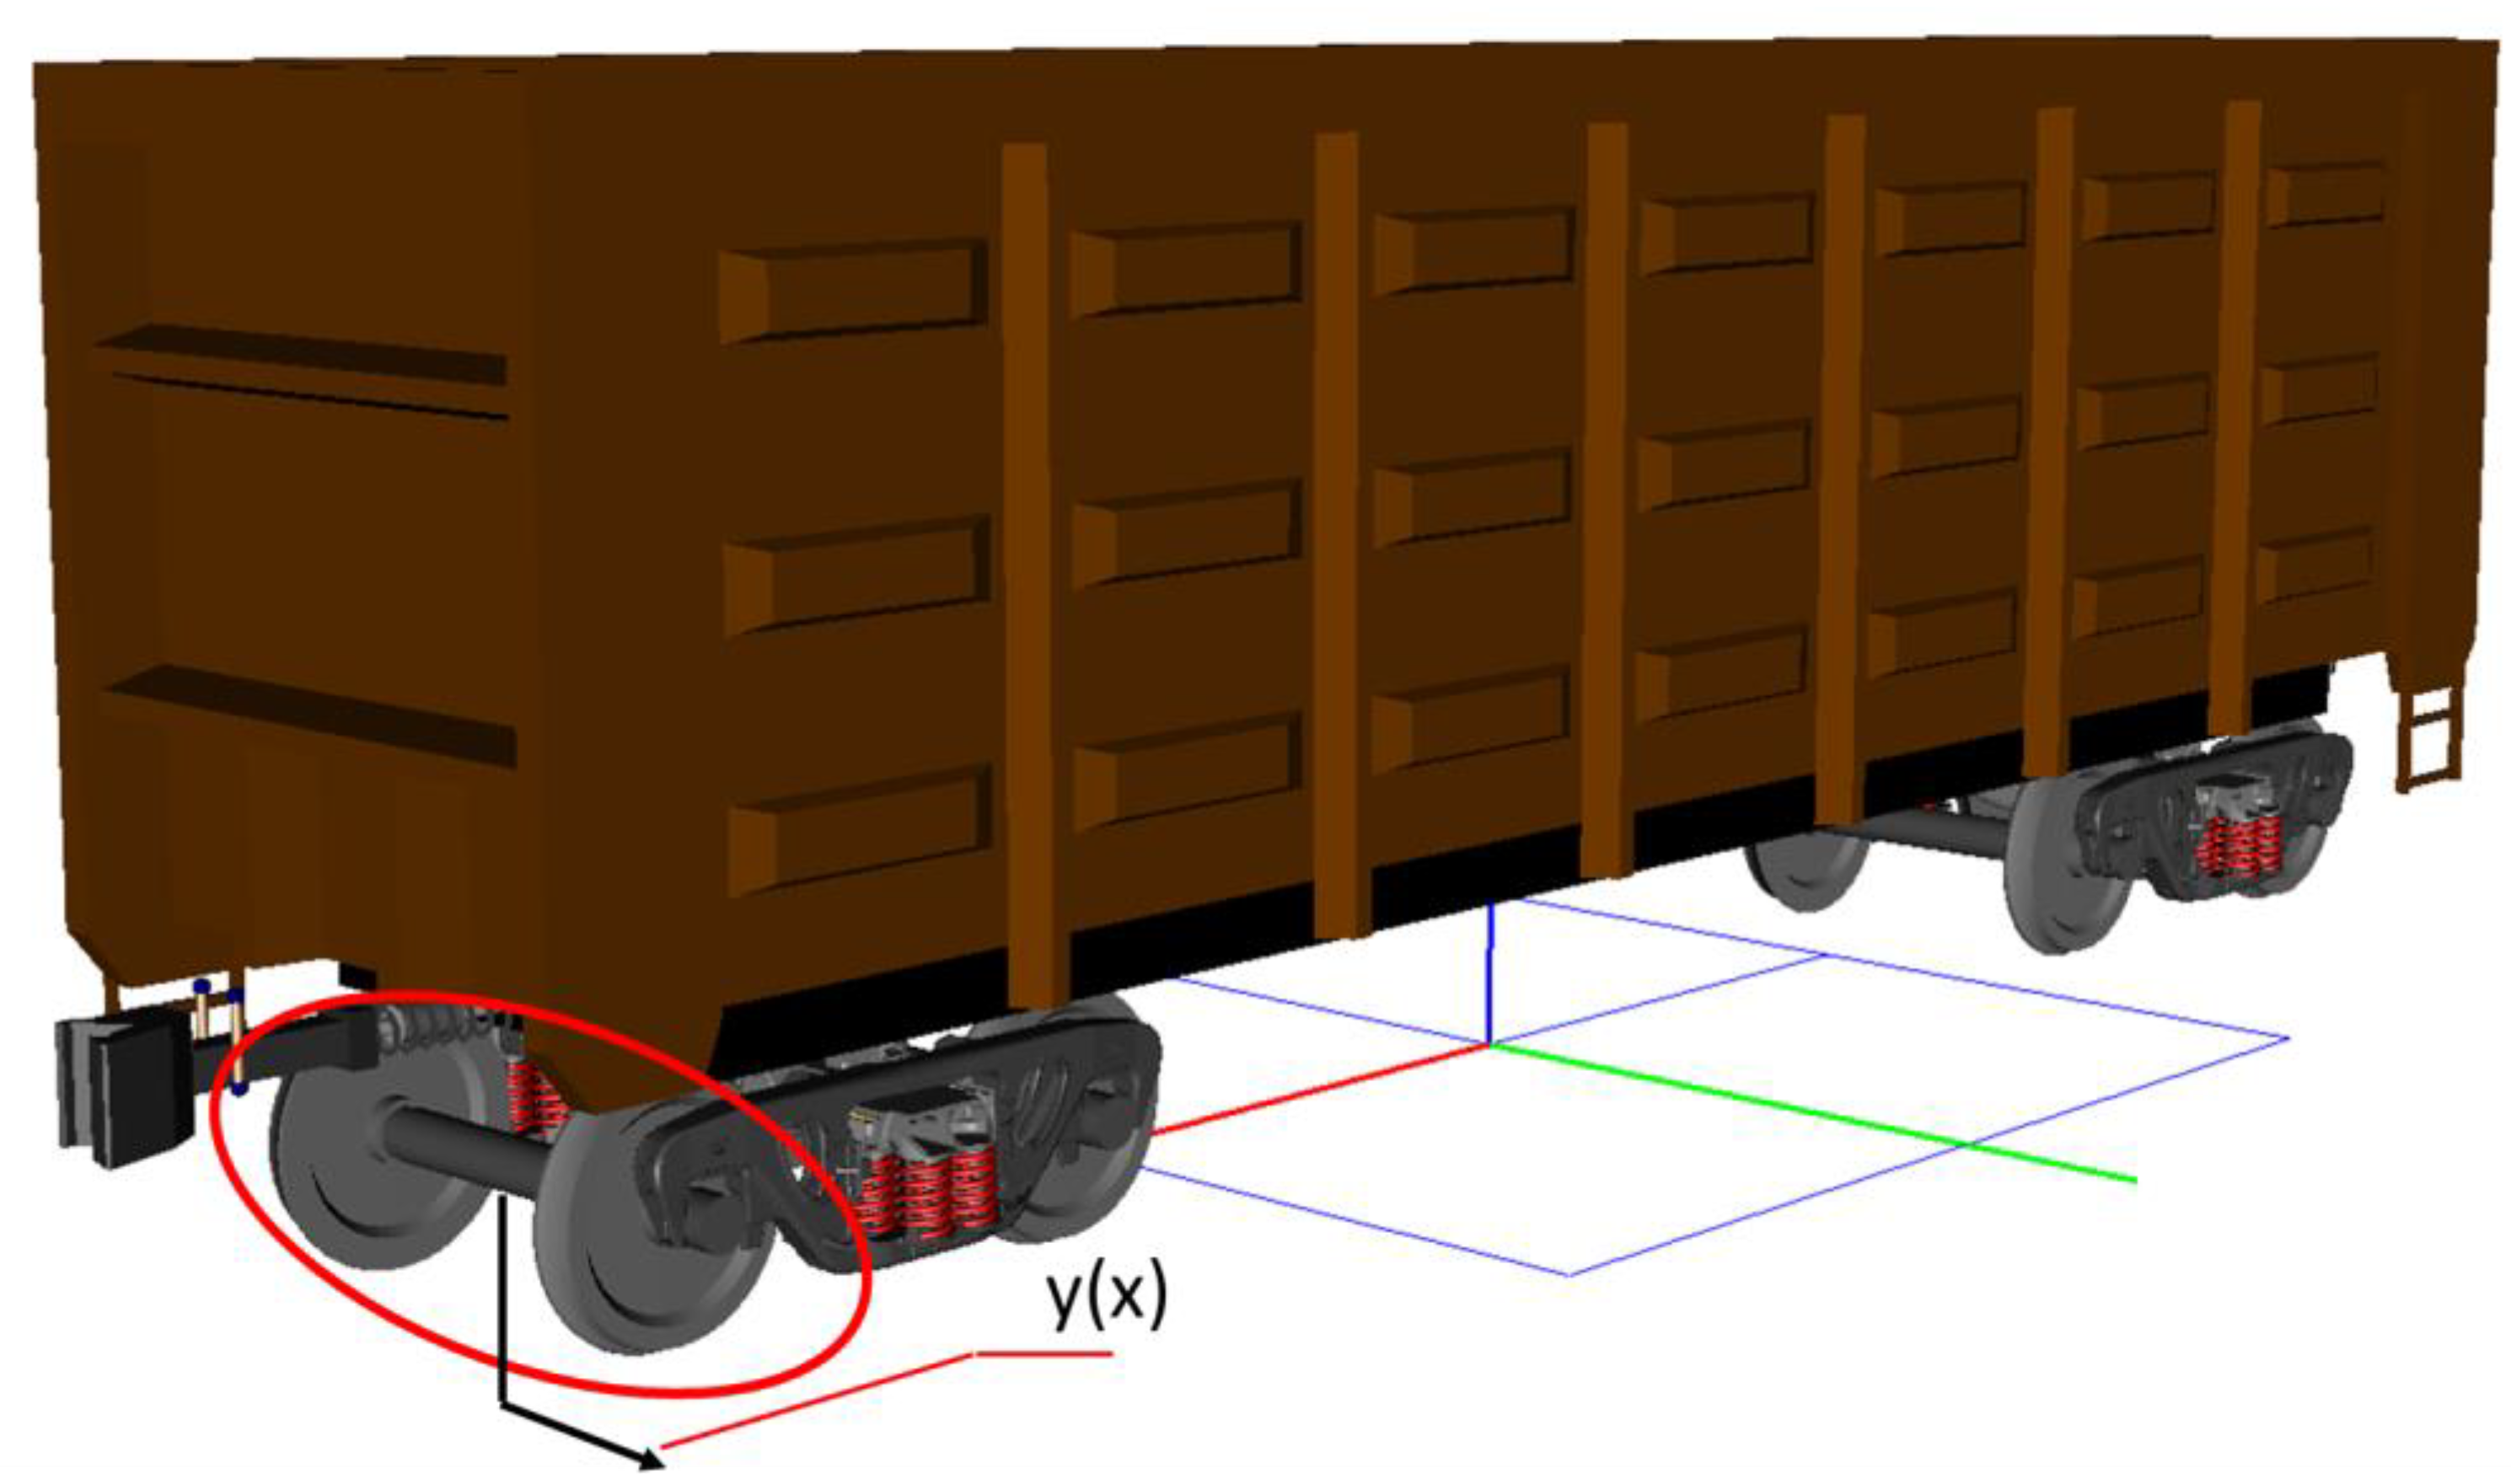
Figure 13.
Transverse displacements of the 1st wheel pair at subcritical and supercritical speeds. New wheels.
Figure 13.
Transverse displacements of the 1st wheel pair at subcritical and supercritical speeds. New wheels.
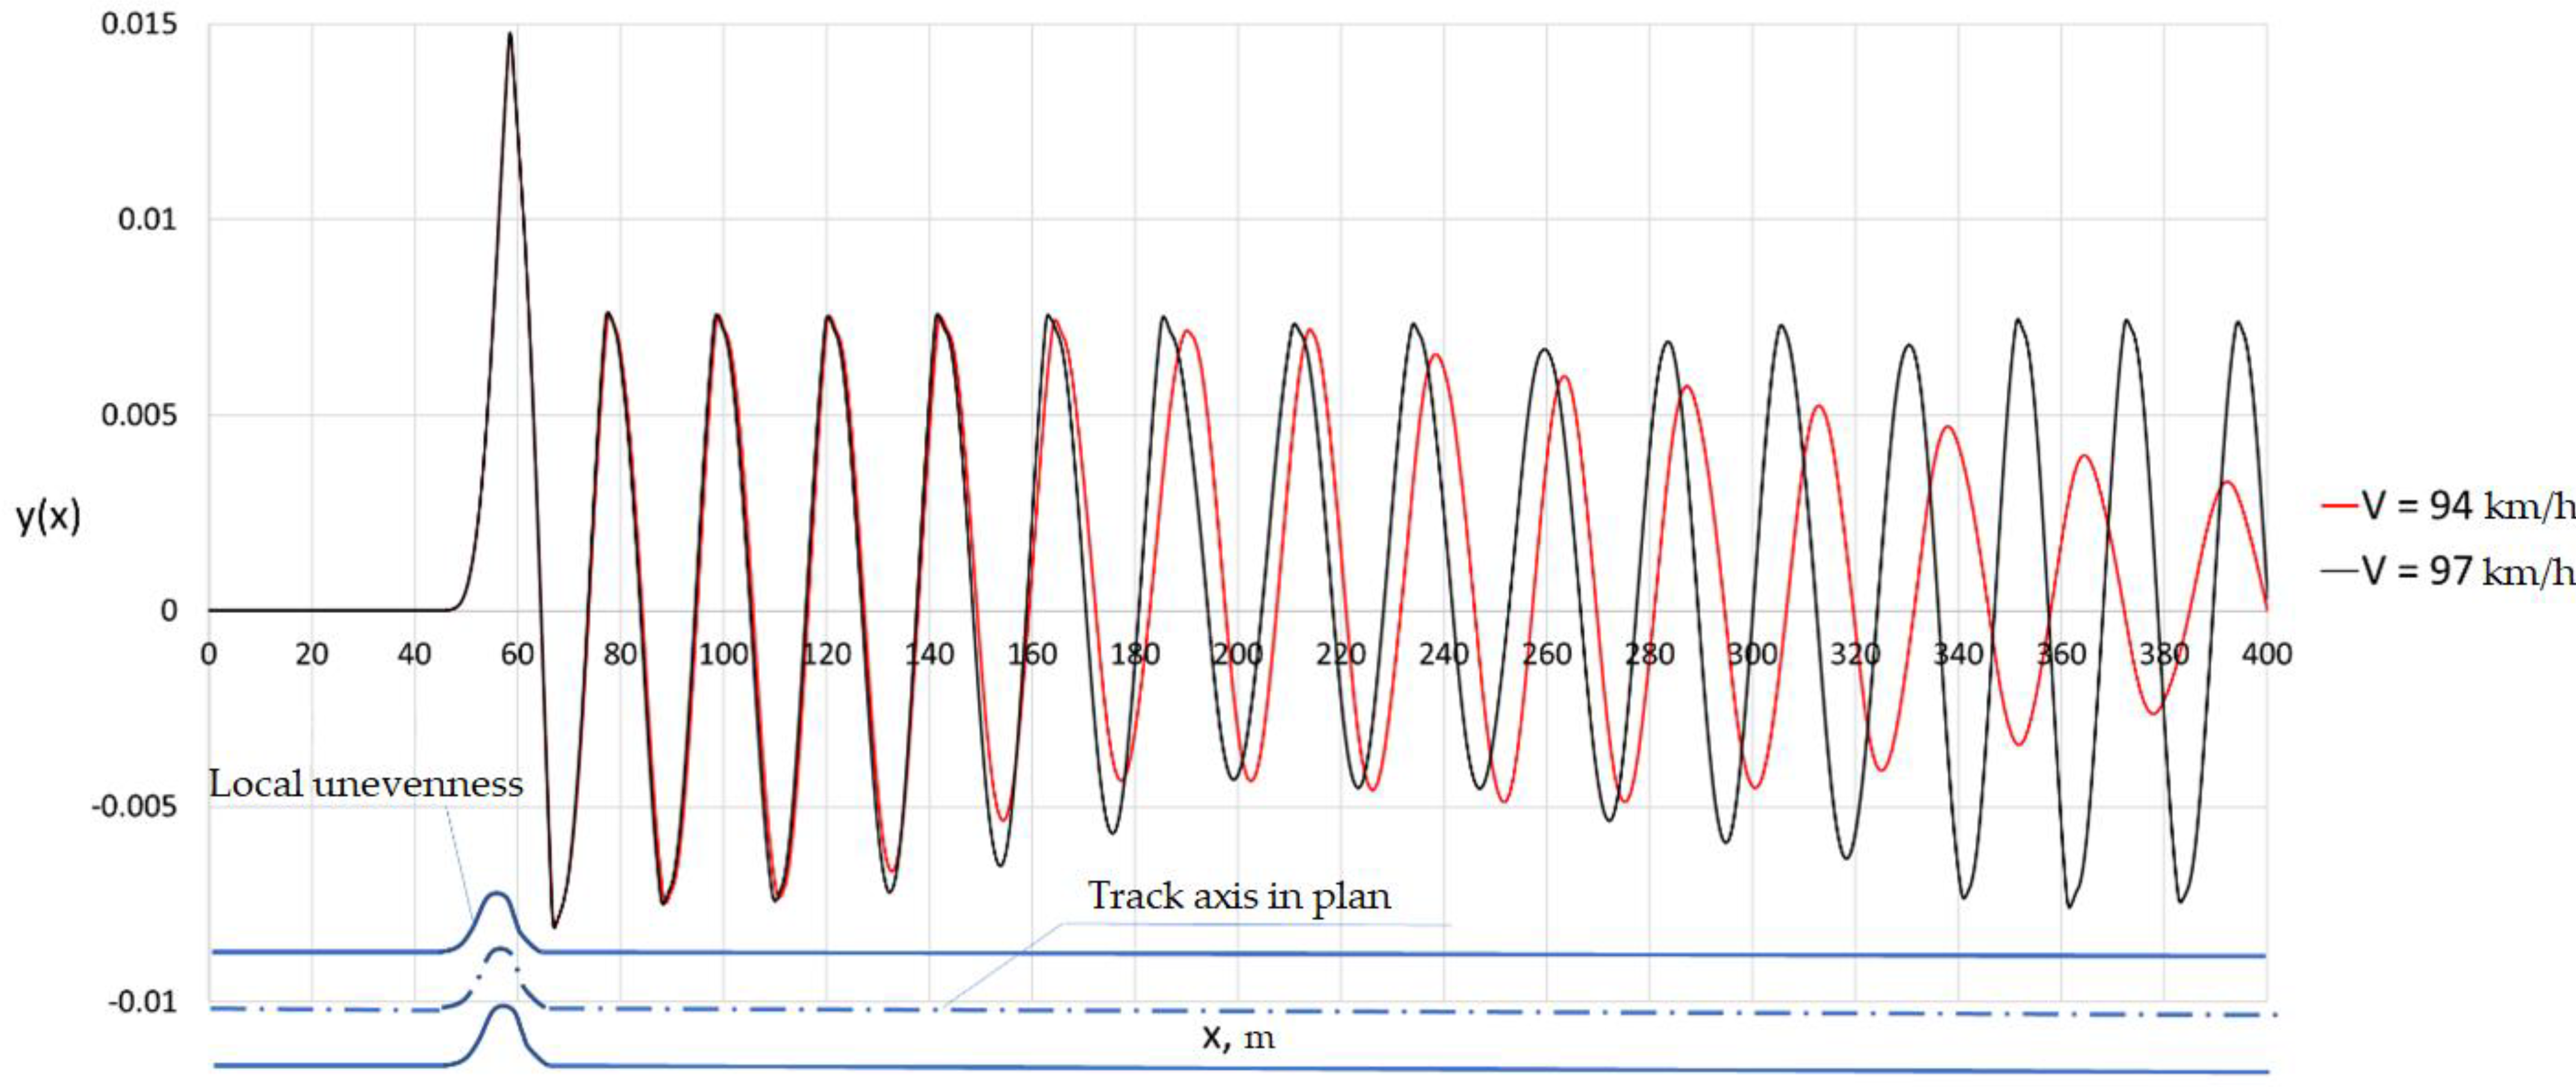
Figure 14.
Dependence of the amplitude of transverse vibrations in the middle of the span on the speed of the train.
Figure 14.
Dependence of the amplitude of transverse vibrations in the middle of the span on the speed of the train.
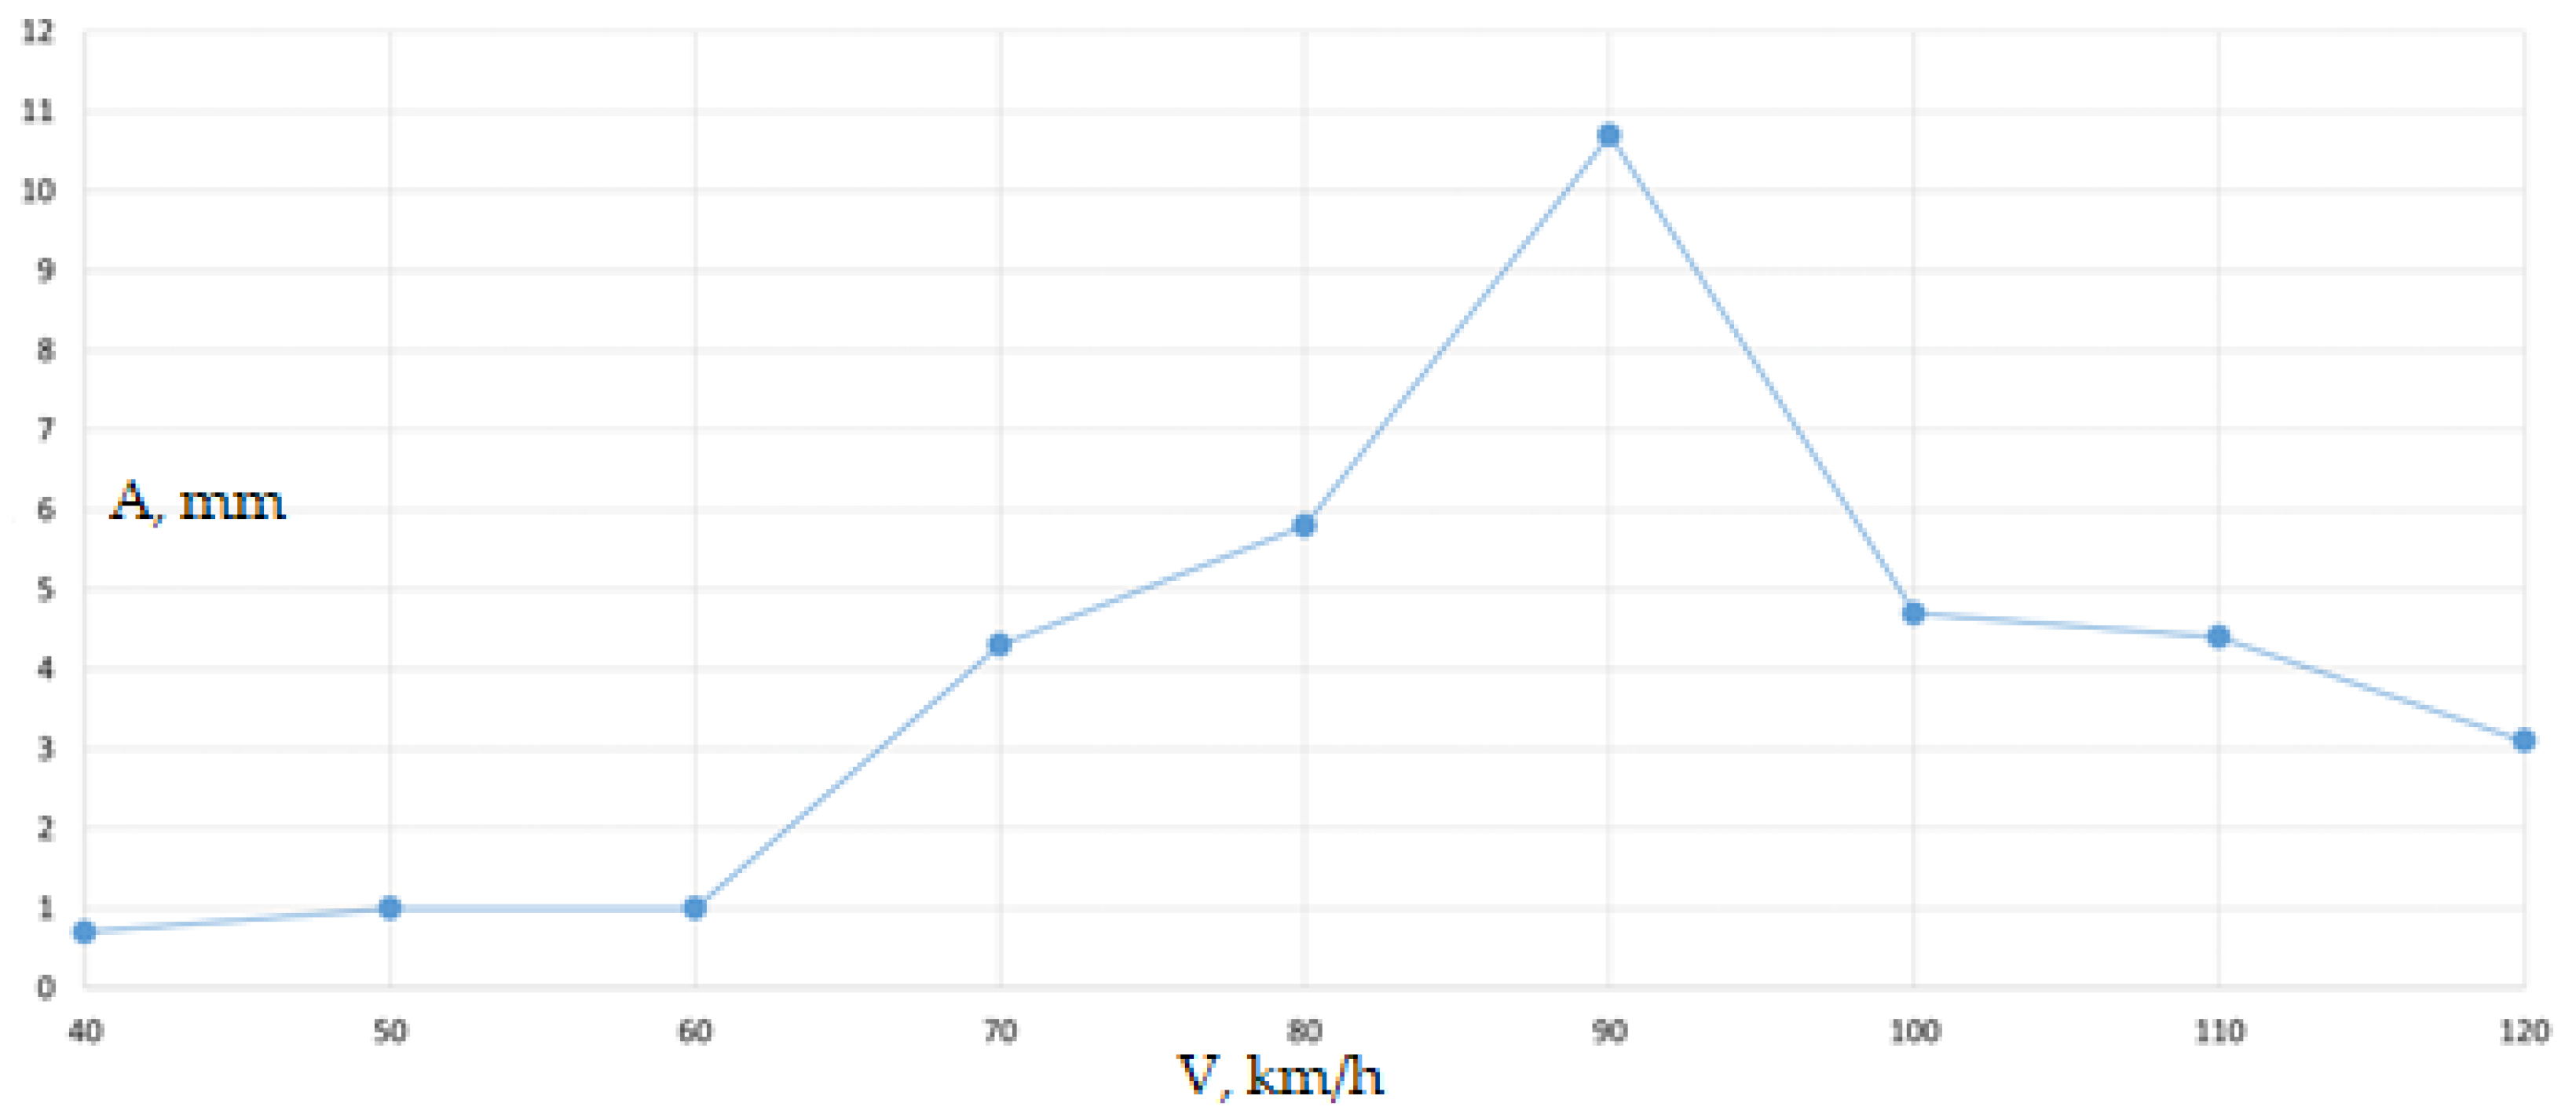
Figure 15.
Dependences of the maximum absolute and standard deviations of vertical and horizontal transverse accelerations in the middle of the span.
Figure 15.
Dependences of the maximum absolute and standard deviations of vertical and horizontal transverse accelerations in the middle of the span.
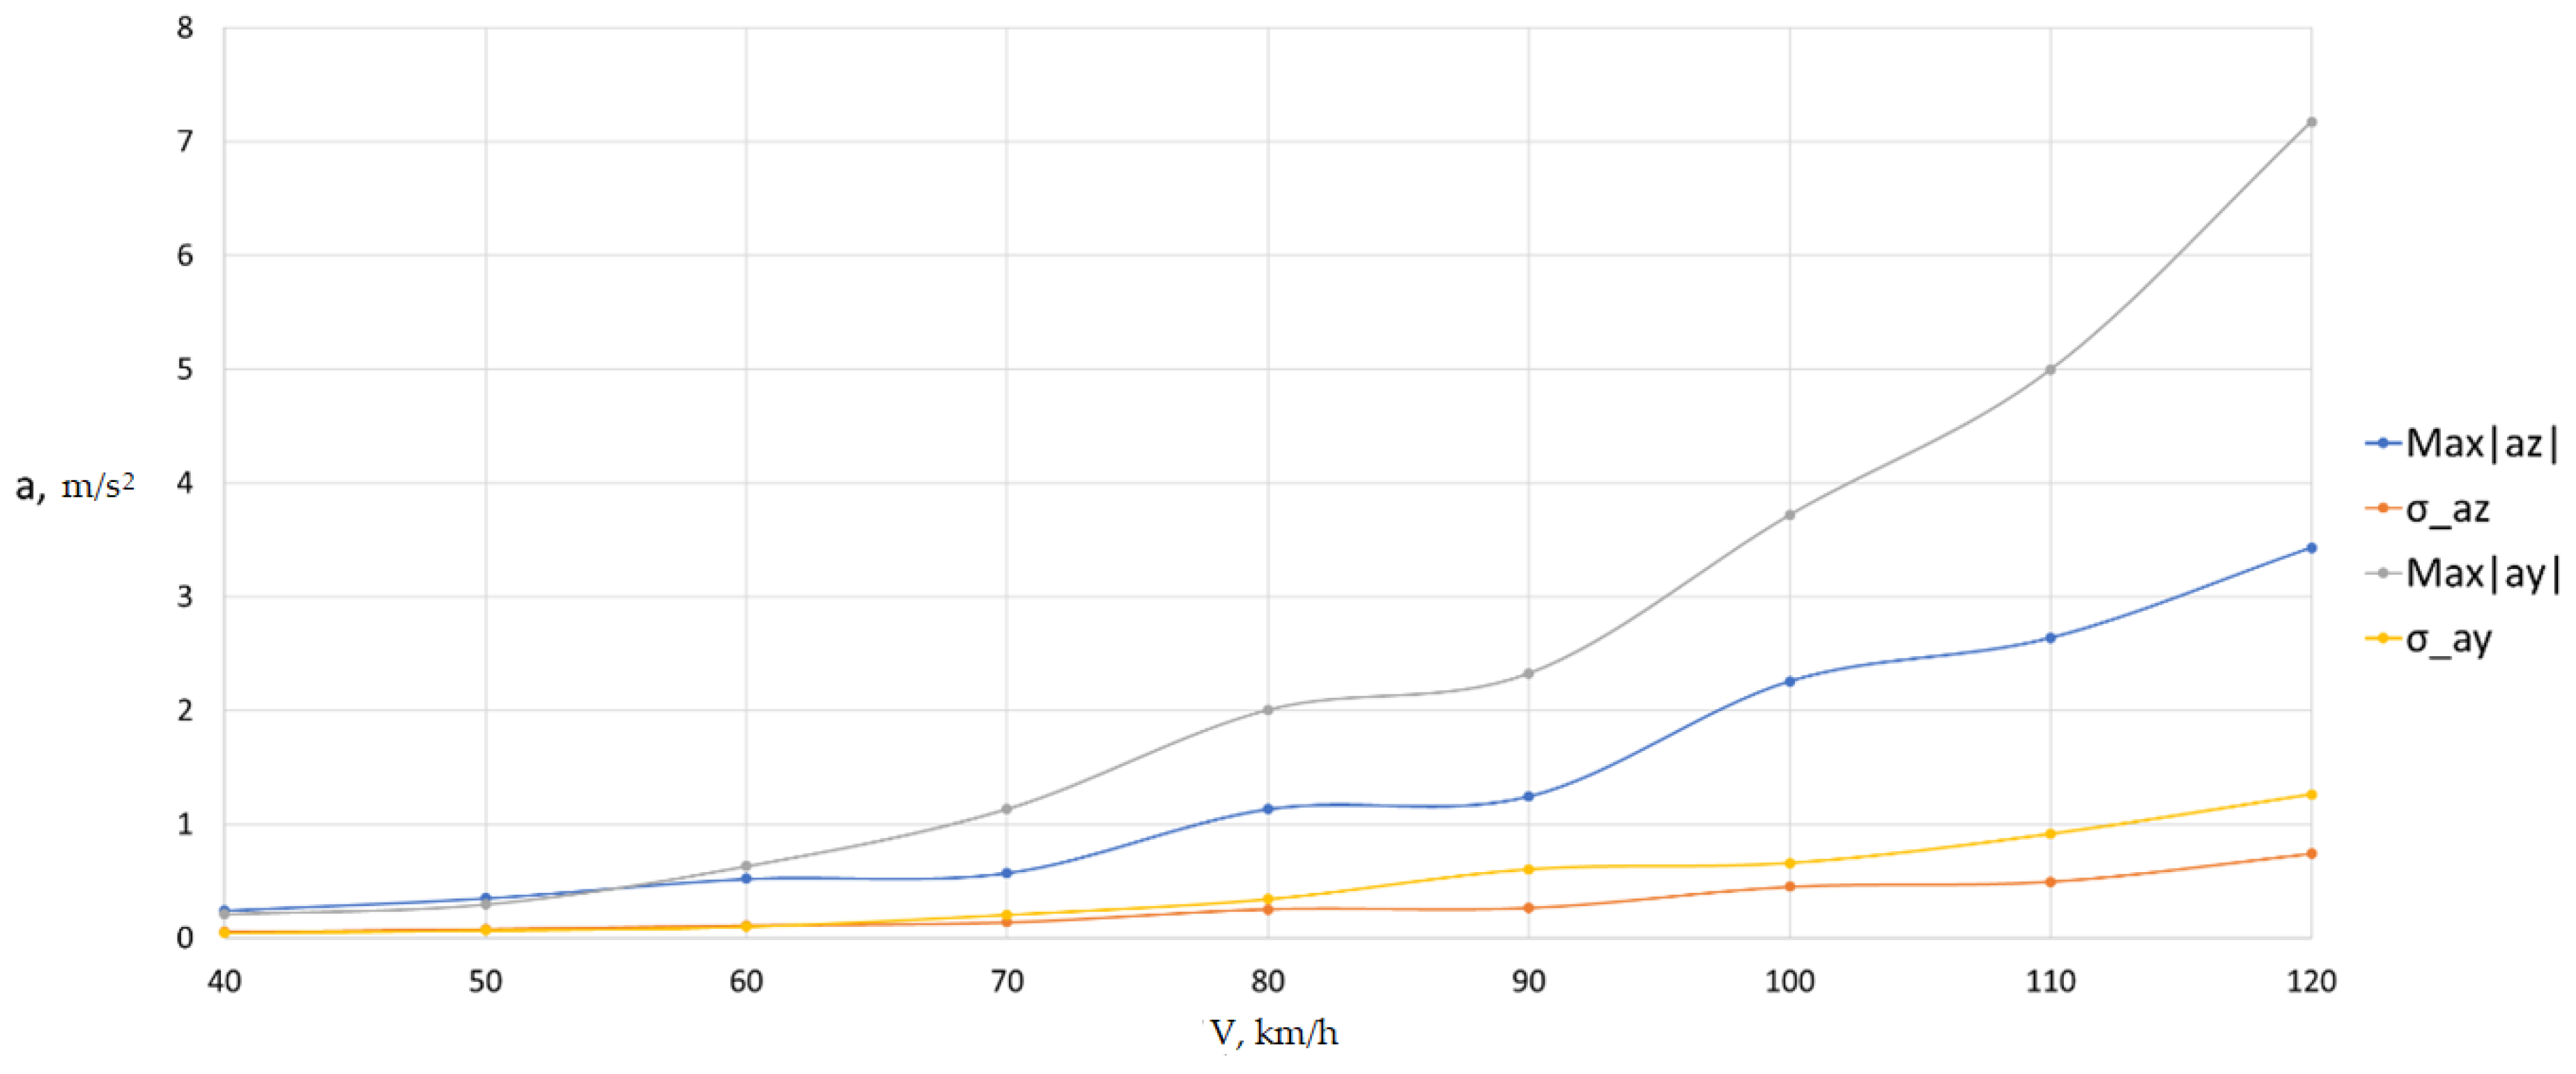
Figure 16.
Transverse vibrations in the middle of the span at a train speed of V = 90 km/h.
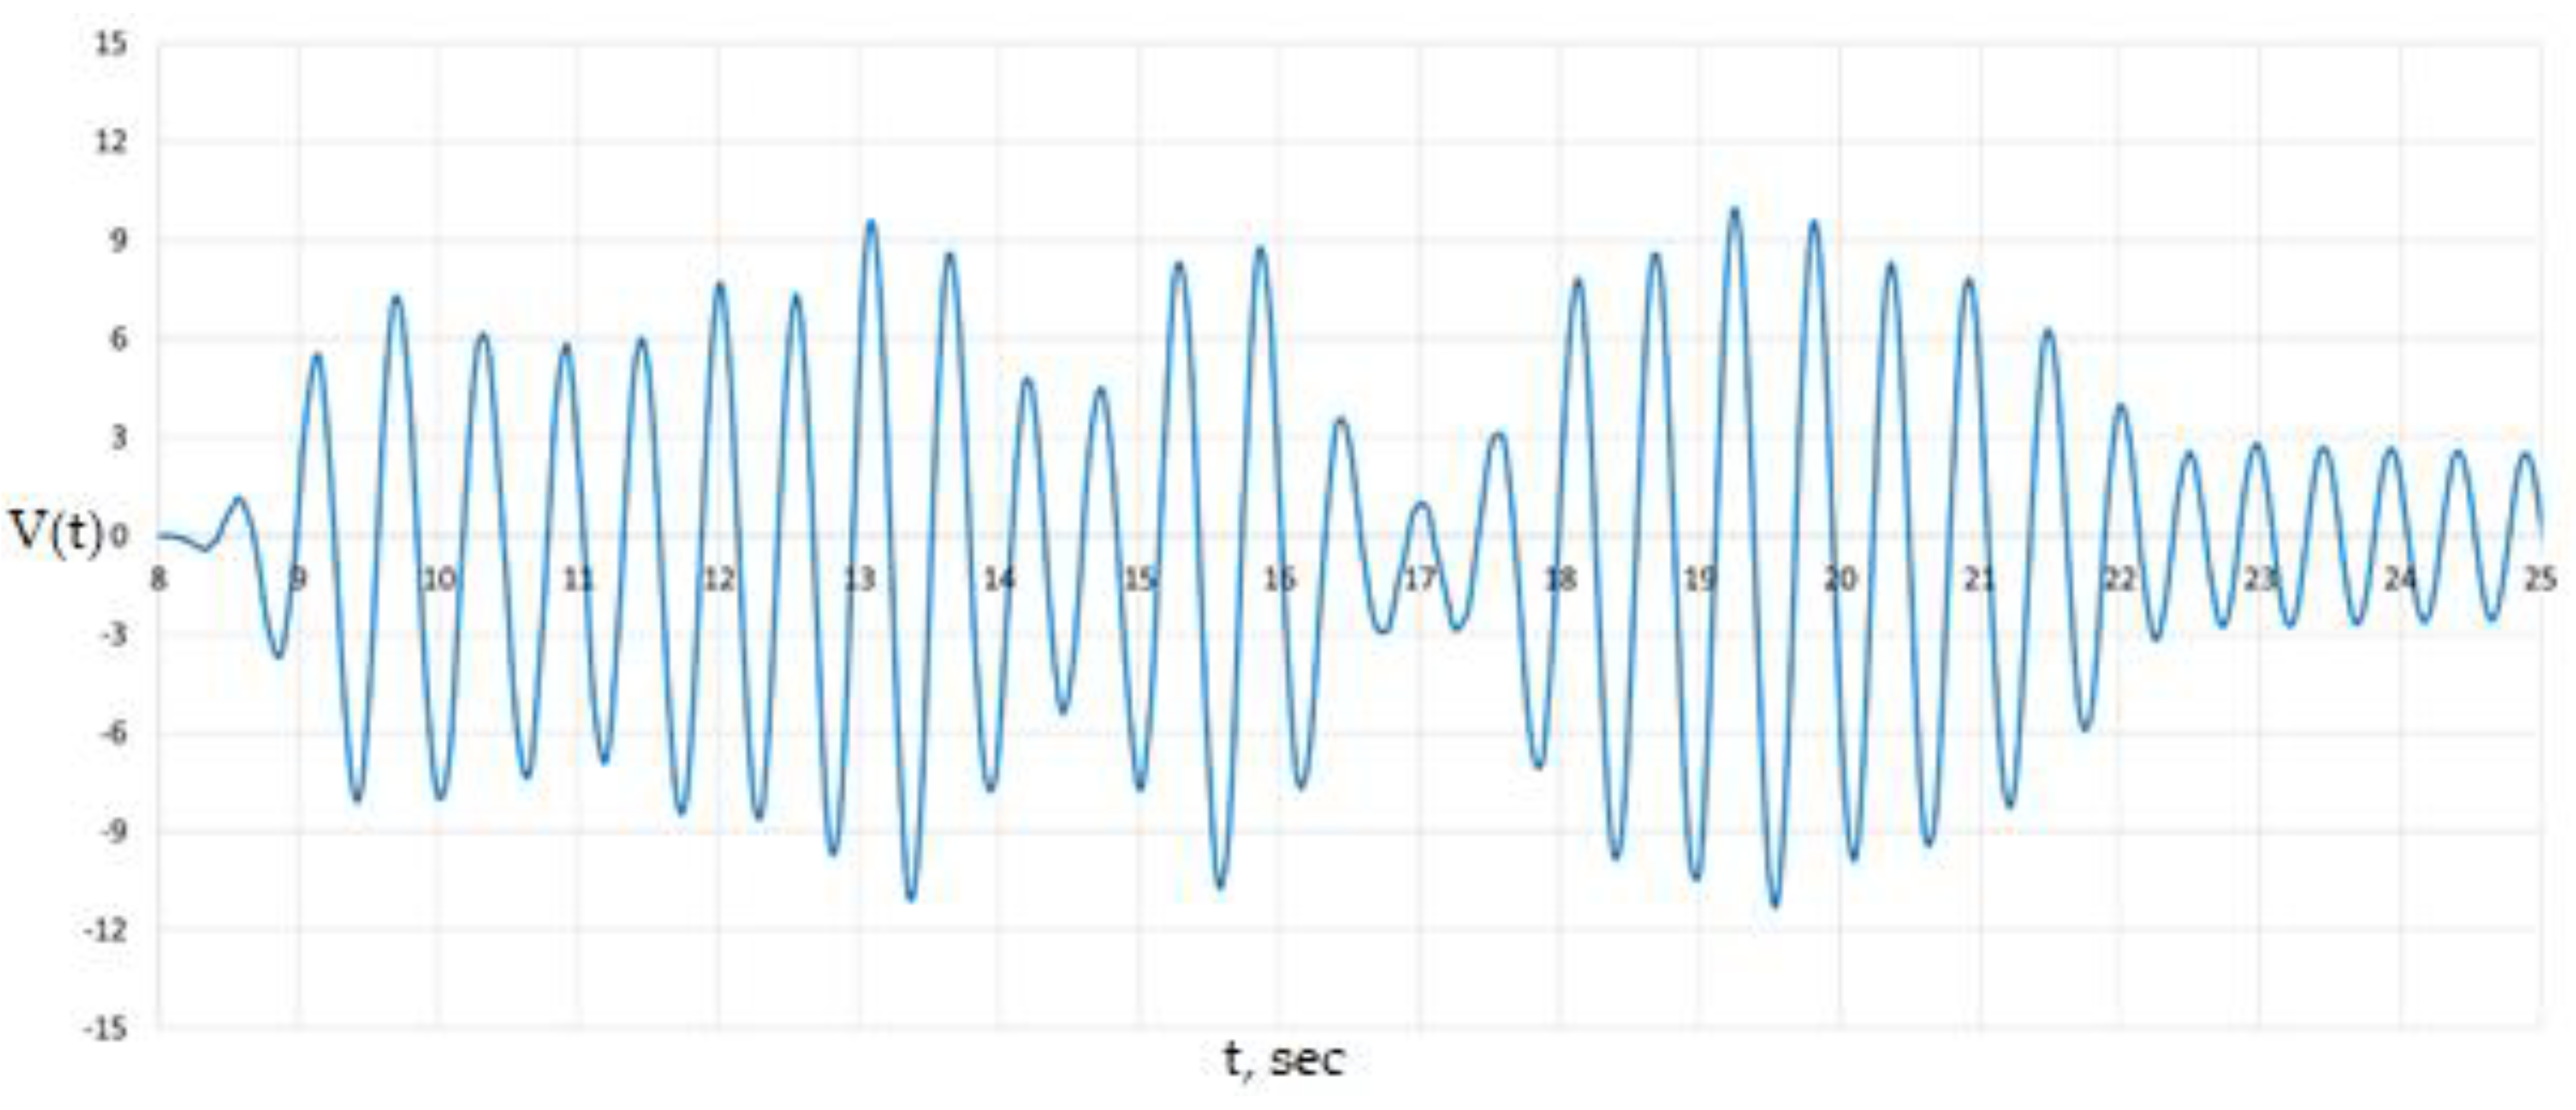
Figure 17.
Spectral power density of transverse oscillations.
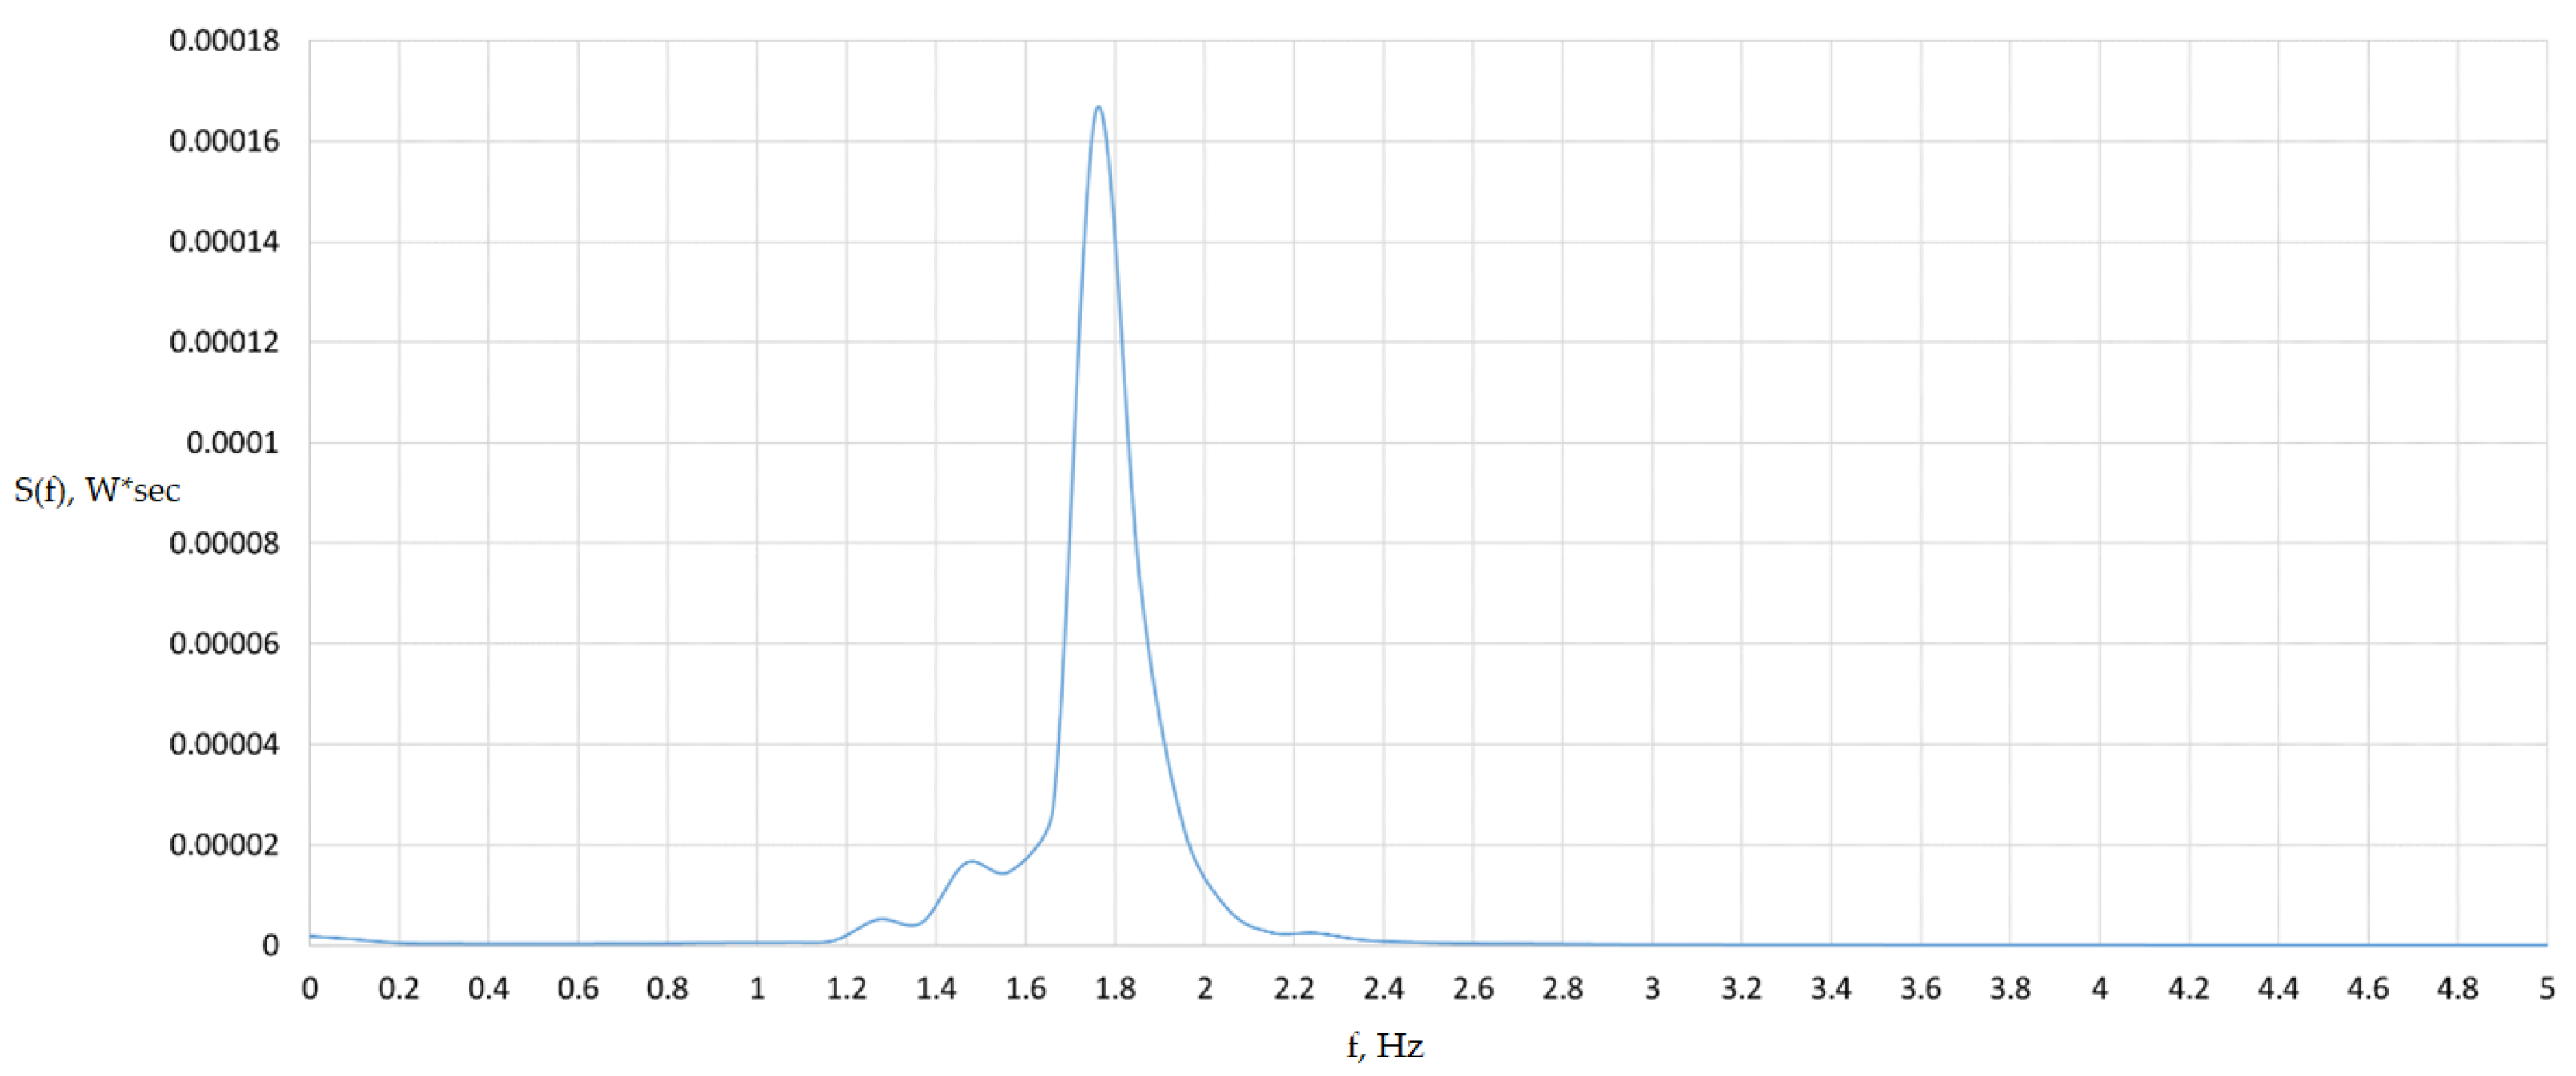
Figure 18.
Transverse forces Fy in the wheel-rail contact of car No. 23. Left wheel is red, right wheel is blue.
Figure 18.
Transverse forces Fy in the wheel-rail contact of car No. 23. Left wheel is red, right wheel is blue.
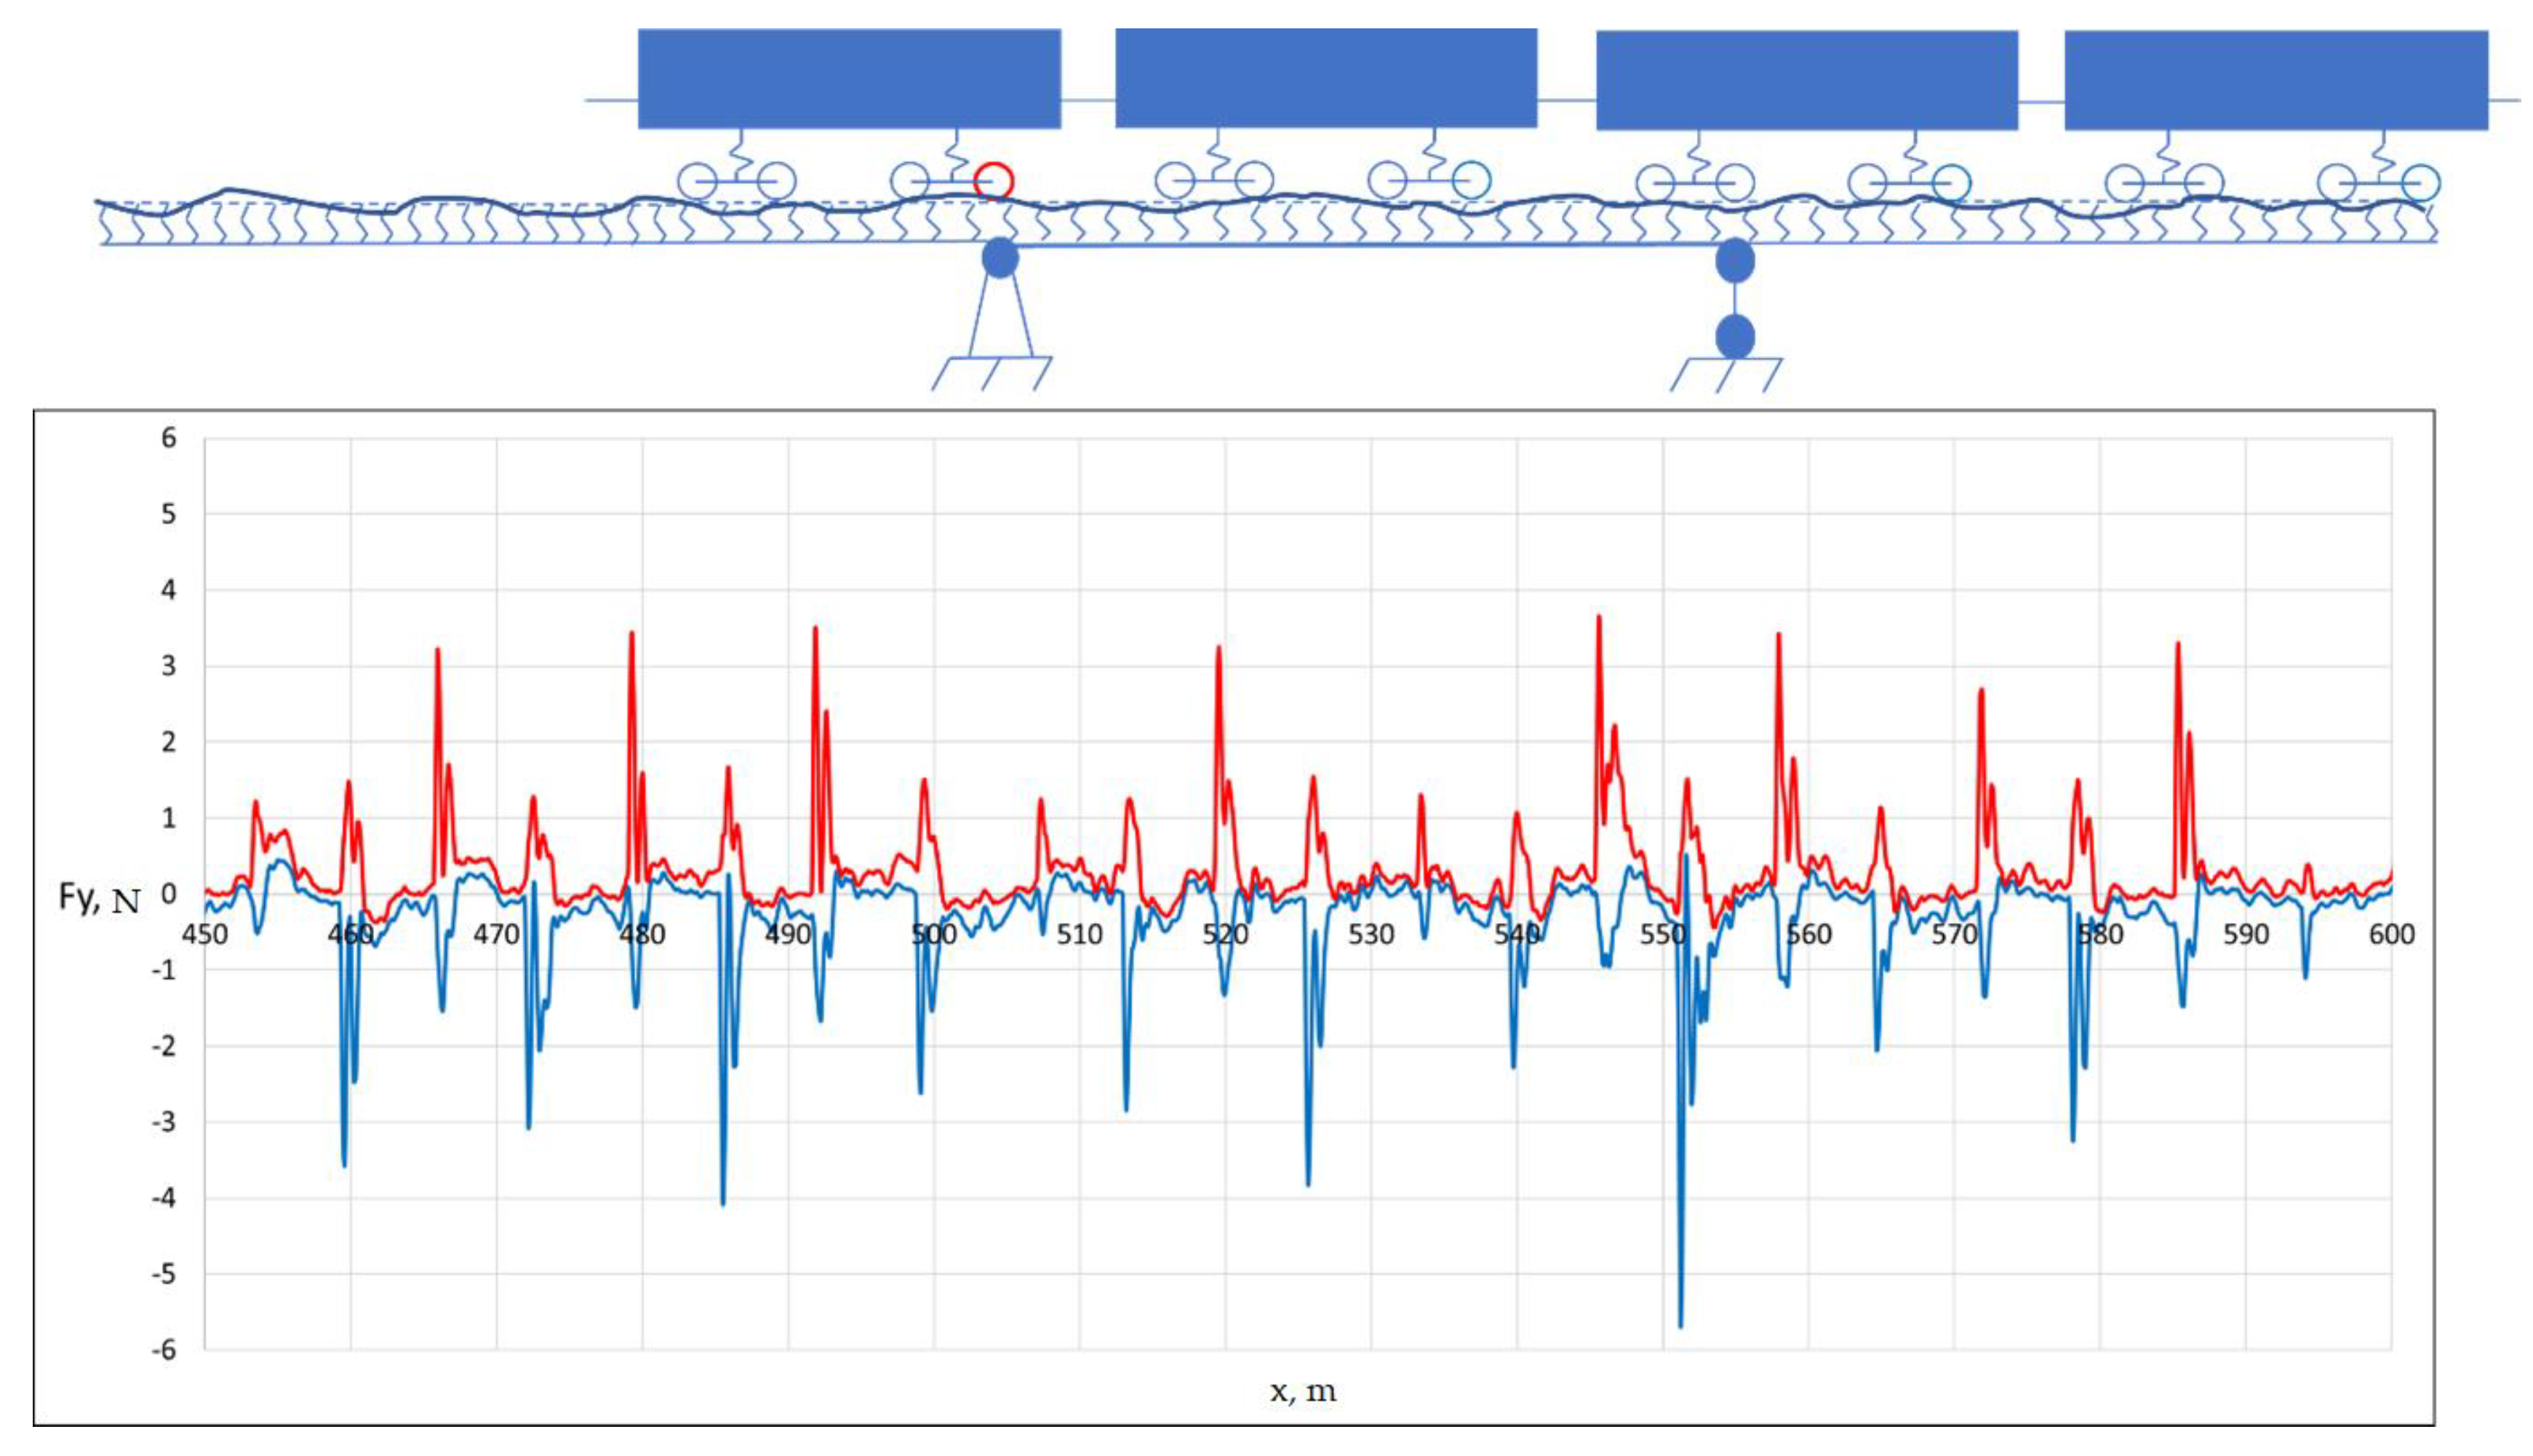
Figure 19.
Spectral density of transverse forces in the wheel-rail contact. Left wheel – red, blue – right wheel.
Figure 19.
Spectral density of transverse forces in the wheel-rail contact. Left wheel – red, blue – right wheel.
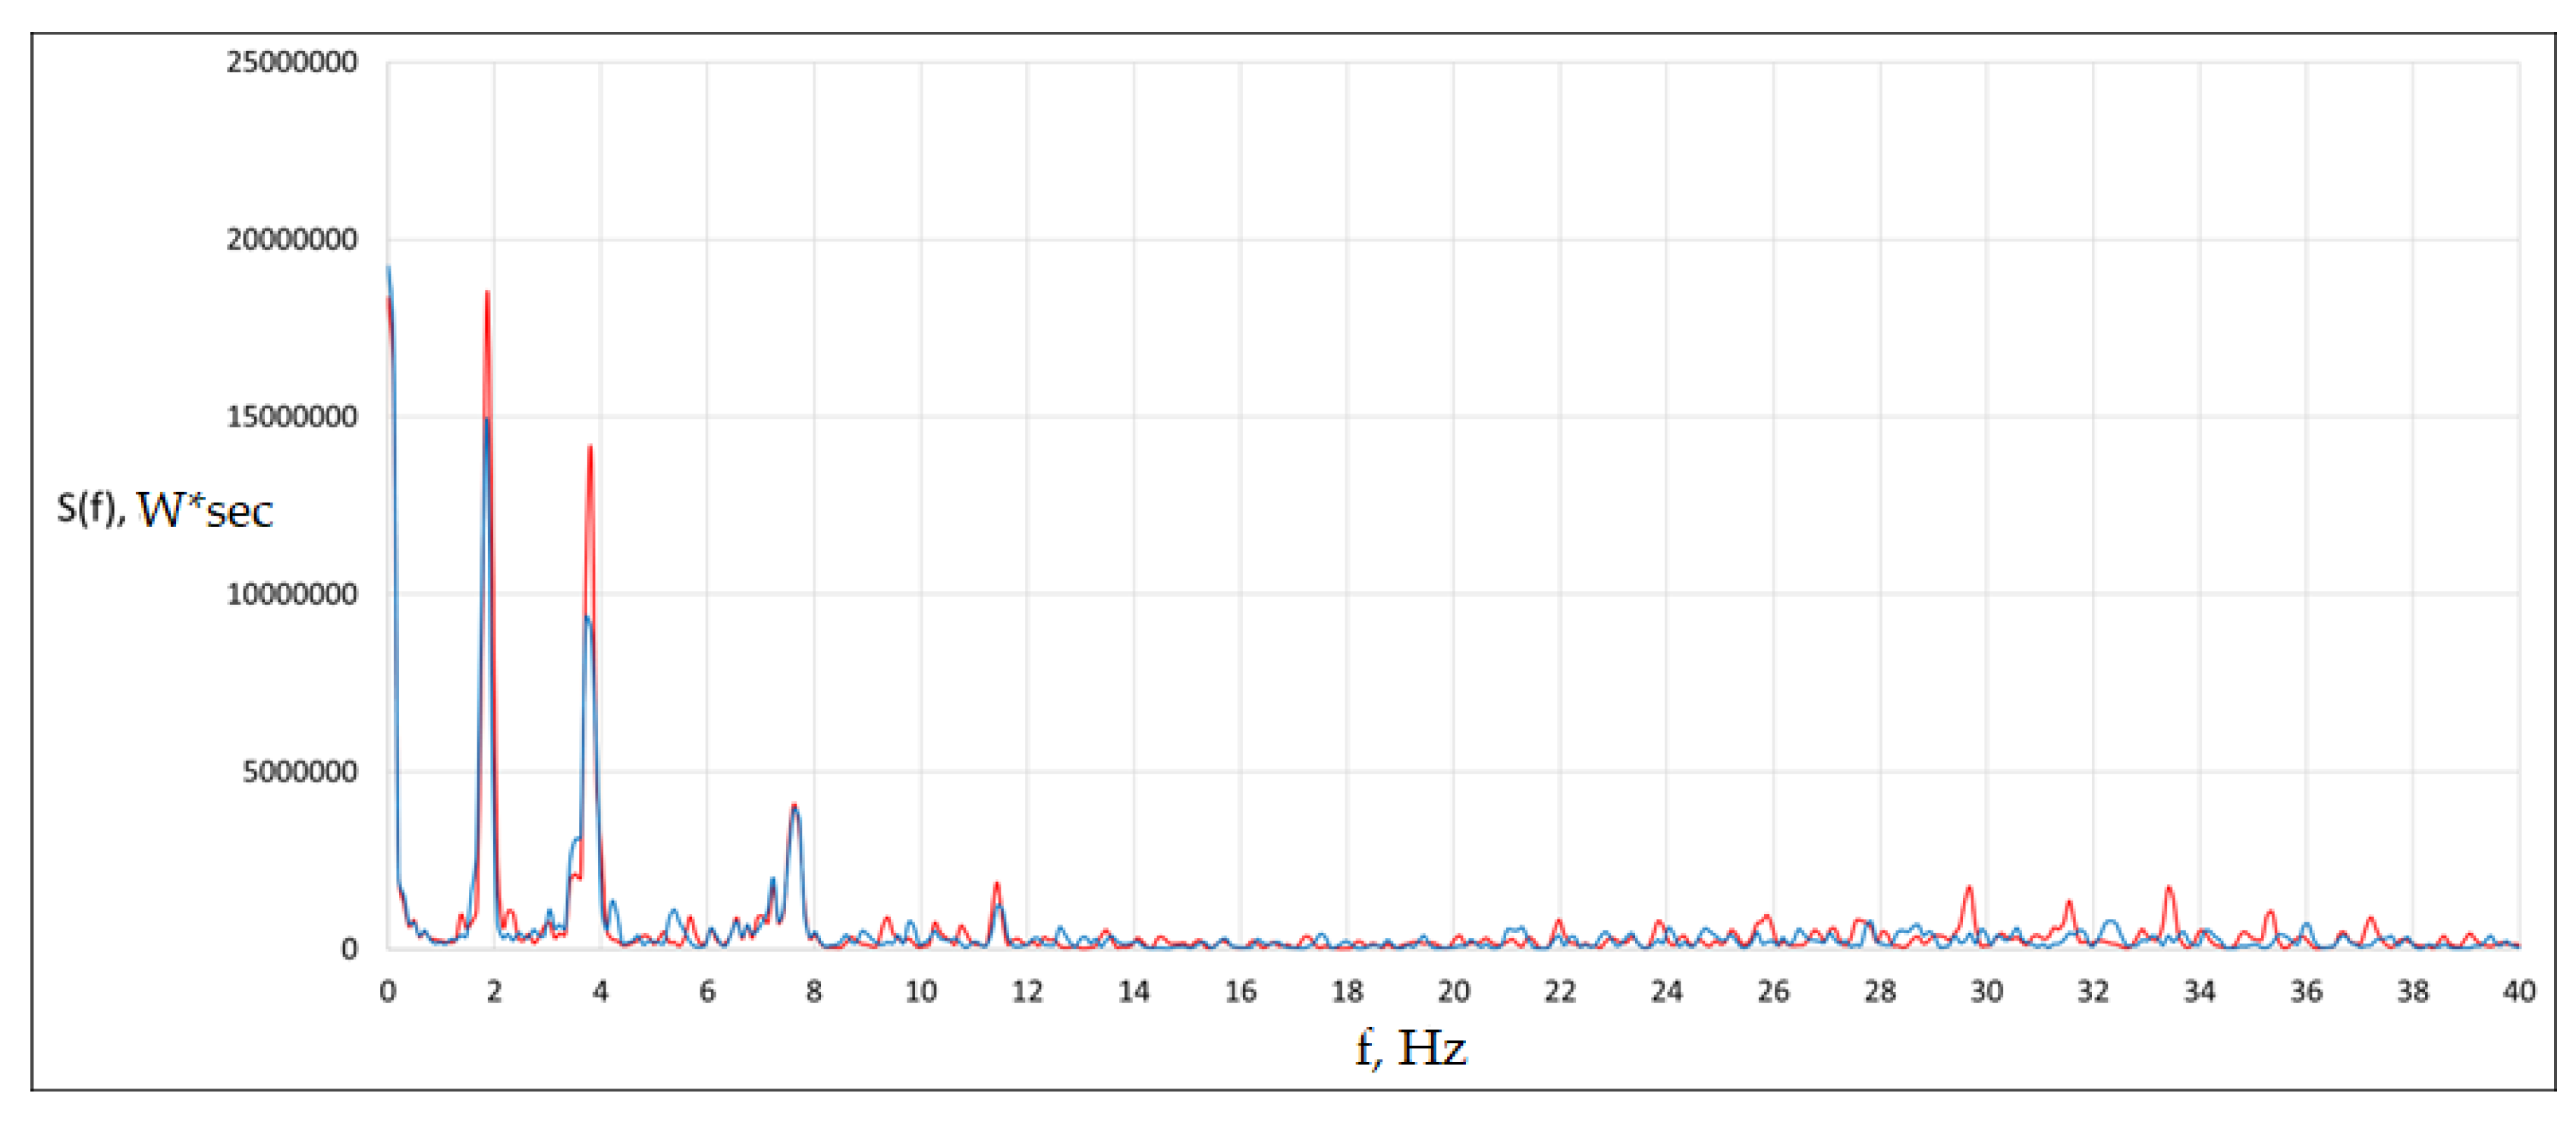
Figure 20.
Nadal criterion. Wheel pair No. 3. Car No. 6. Left wheel – blue, right wheel – grey, permissible value – red.
Figure 20.
Nadal criterion. Wheel pair No. 3. Car No. 6. Left wheel – blue, right wheel – grey, permissible value – red.
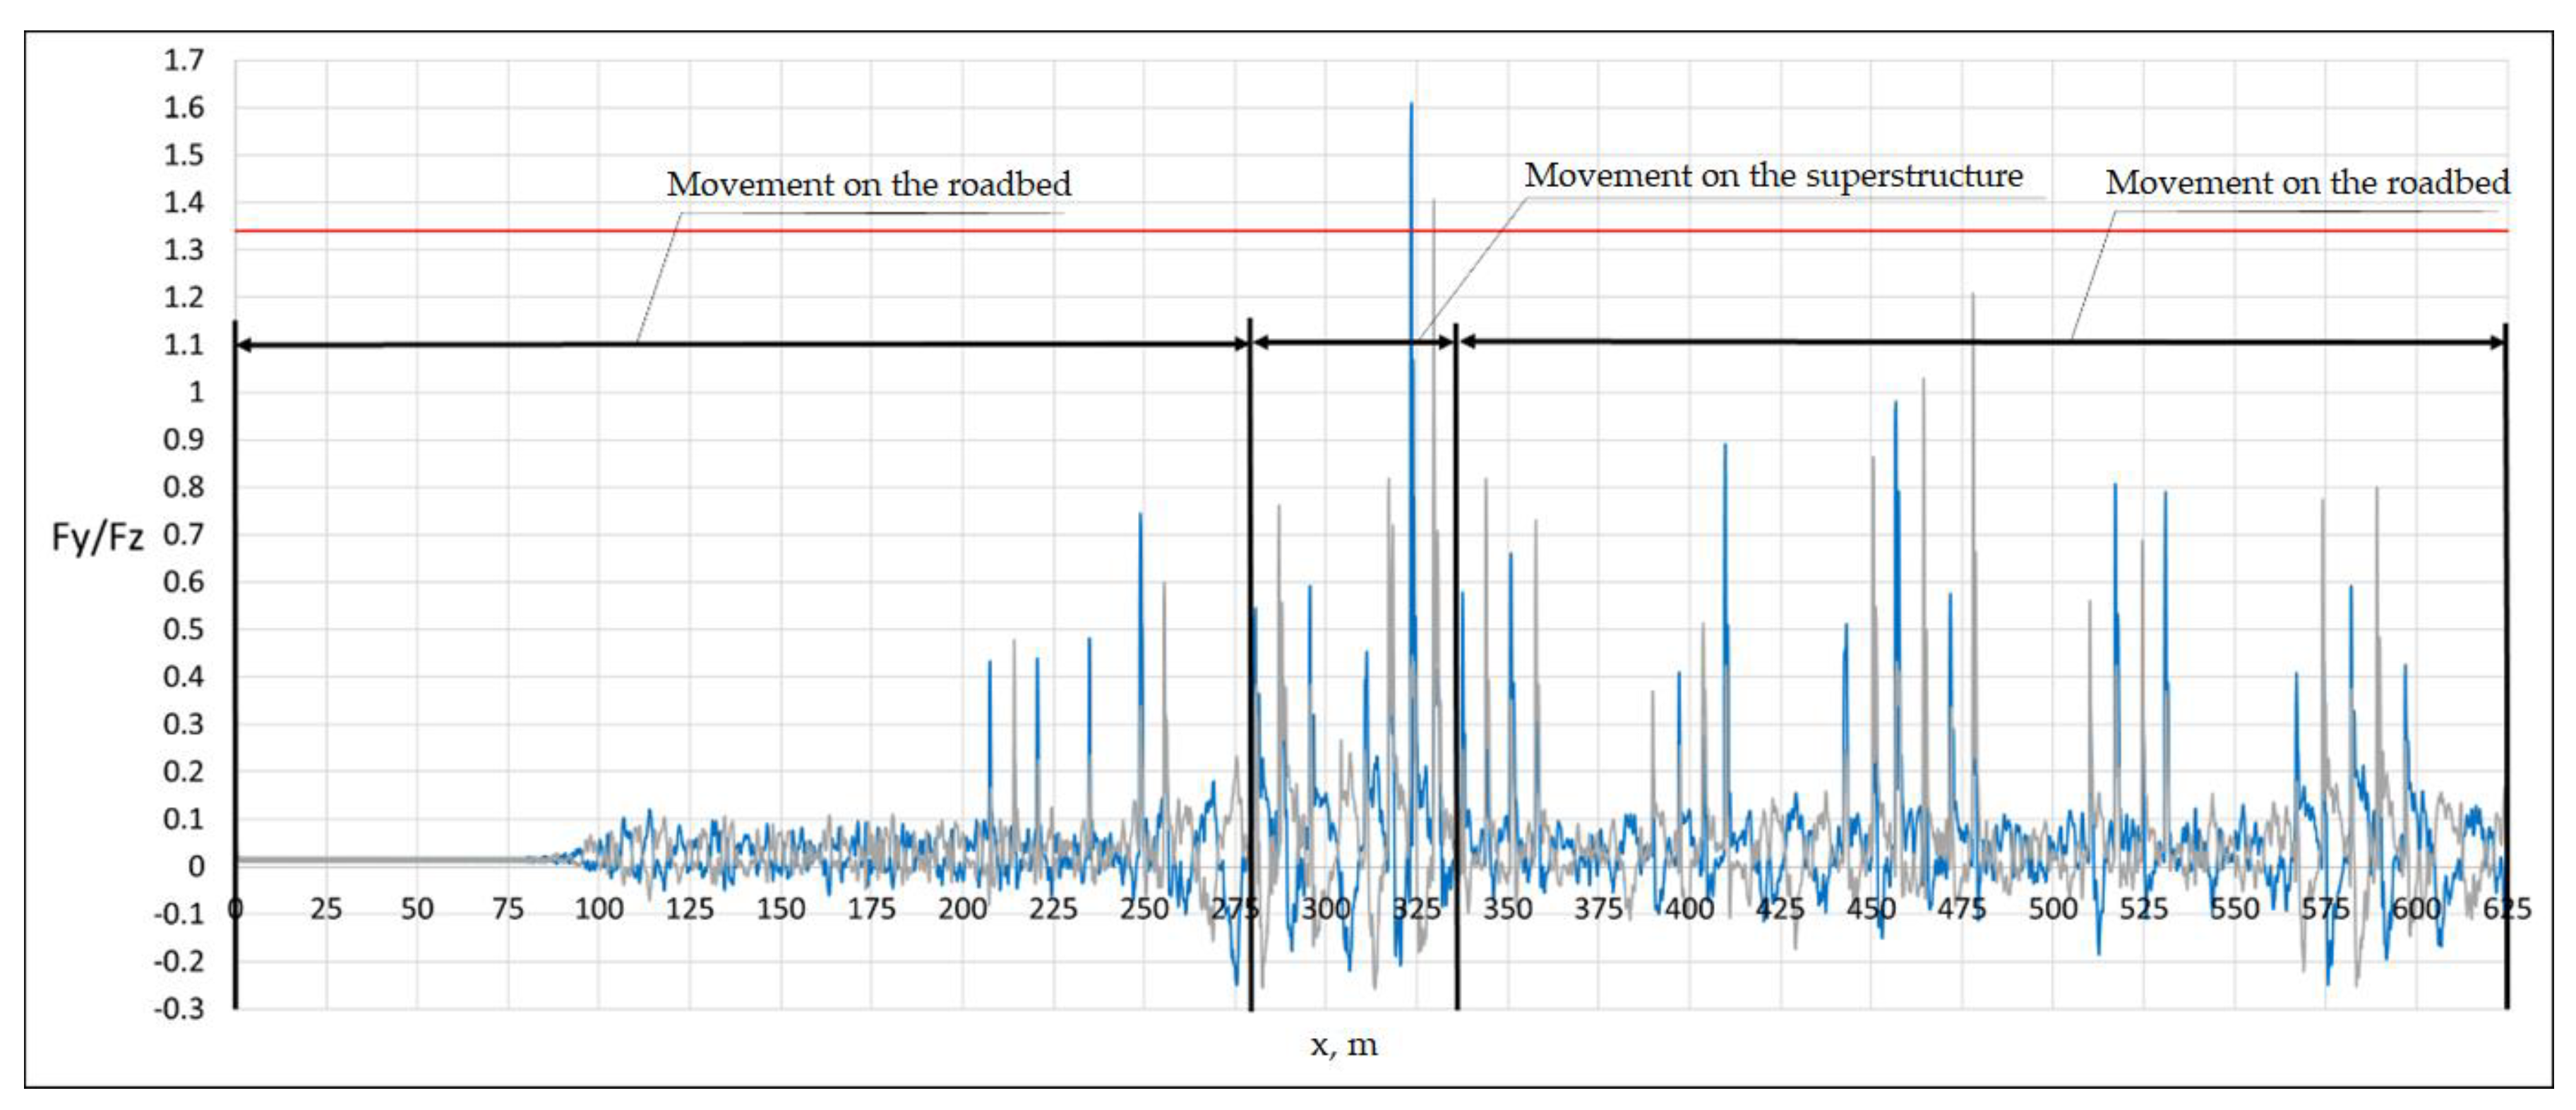
Figure 21.
Wheel-rail dynamic coefficient. Wheel pair No. 3. Car No. 6. Left wheel – blue, right wheel – gray, permissible value – red.
Figure 21.
Wheel-rail dynamic coefficient. Wheel pair No. 3. Car No. 6. Left wheel – blue, right wheel – gray, permissible value – red.
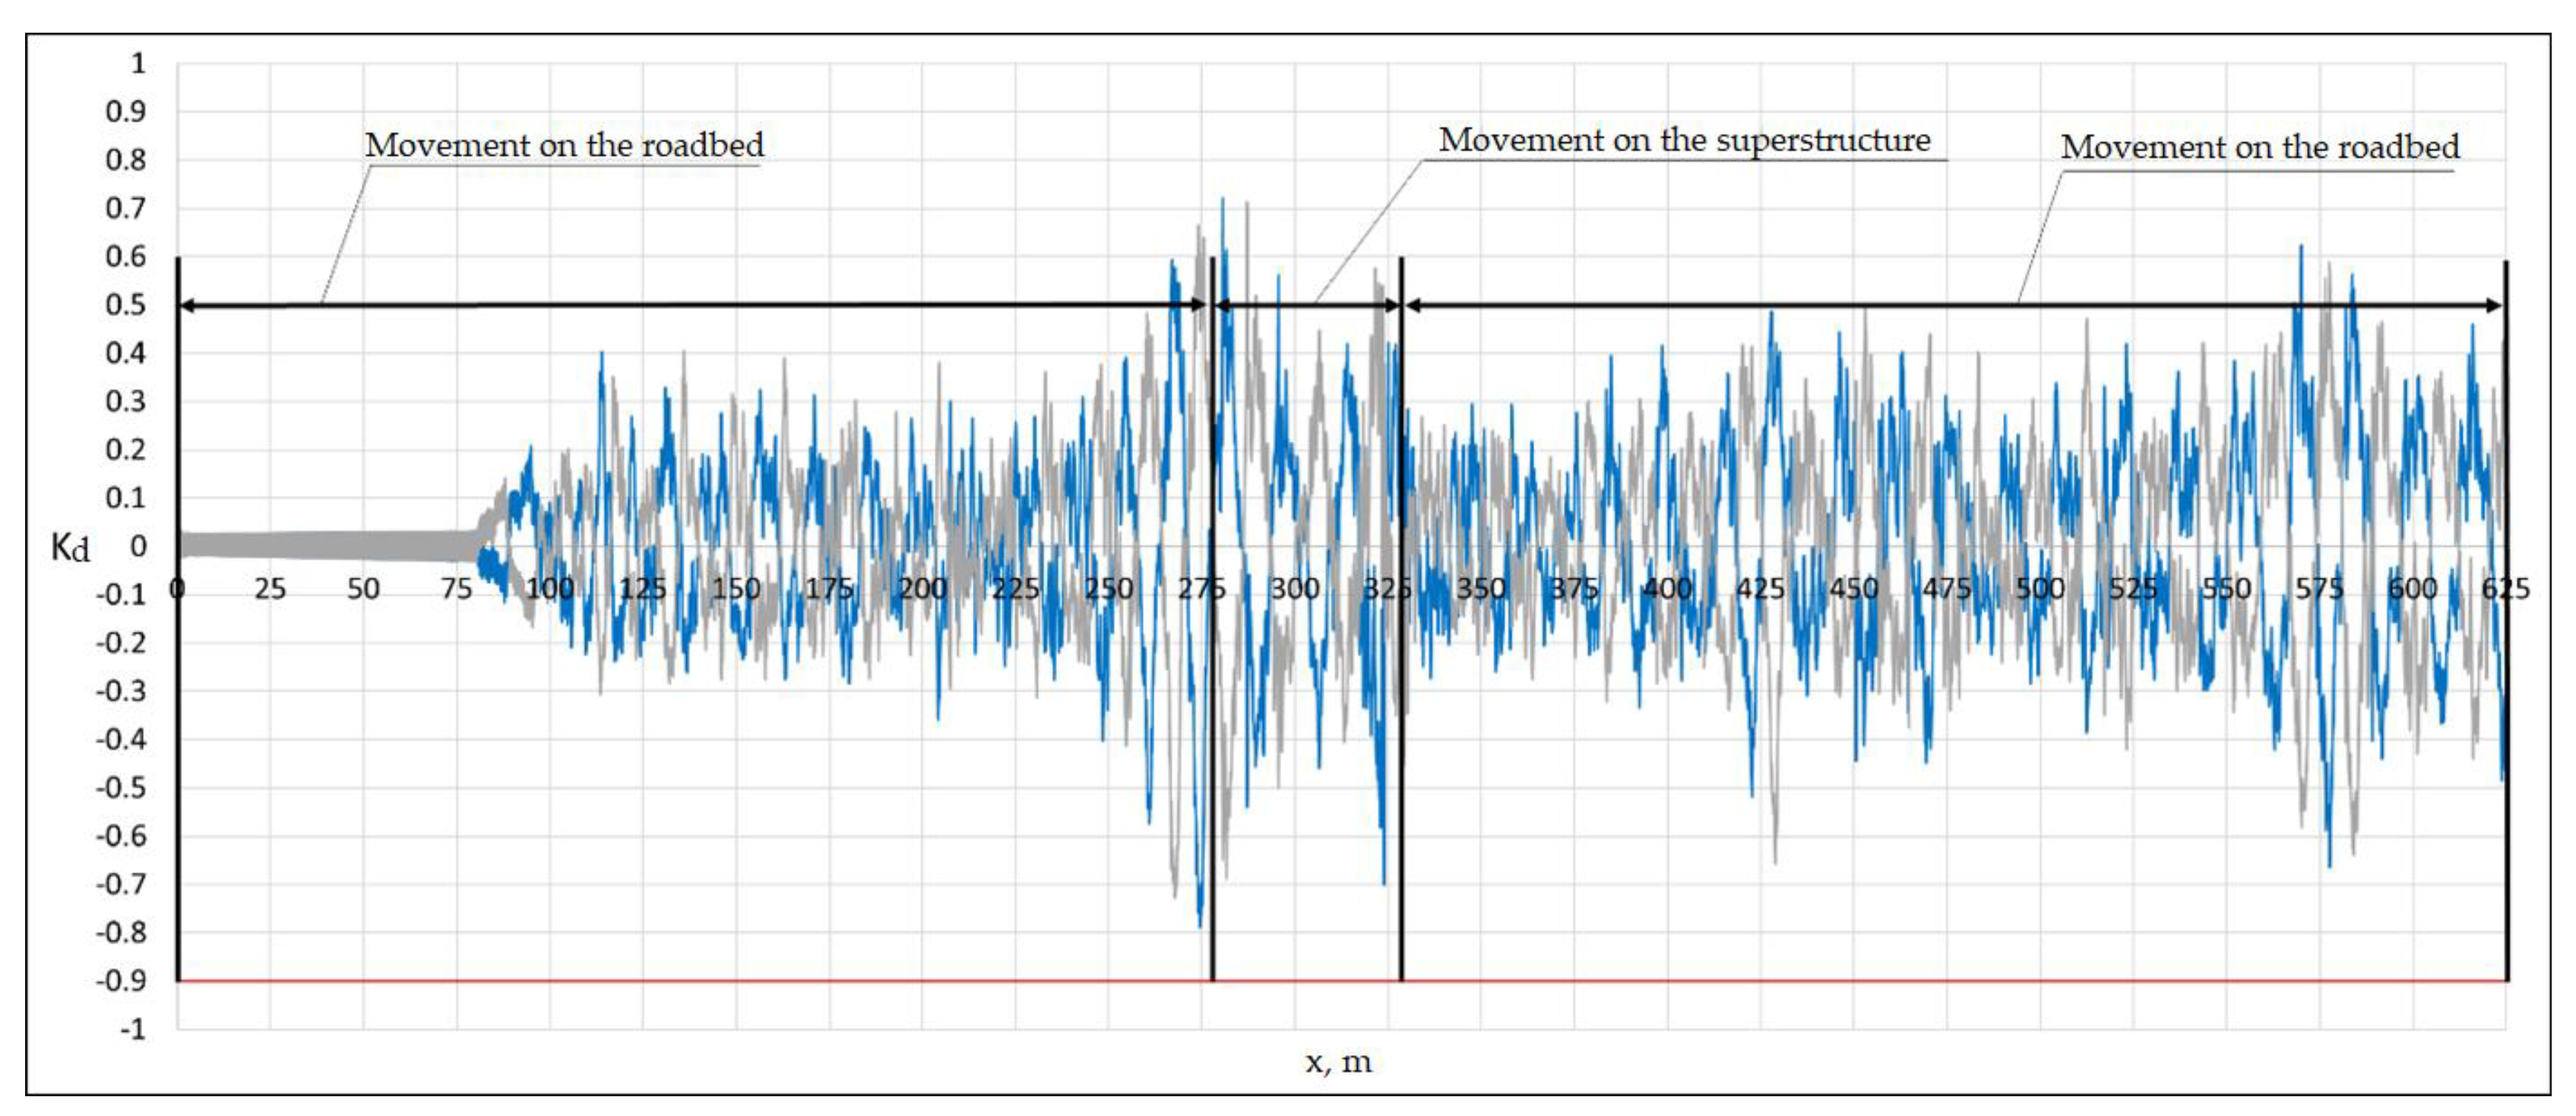
Figure 22.
Wheel-rail dynamic coefficient. Wheel pair No. 1. Car No. 2. Left wheel – blue, right wheel – grey, permissible value – red.
Figure 22.
Wheel-rail dynamic coefficient. Wheel pair No. 1. Car No. 2. Left wheel – blue, right wheel – grey, permissible value – red.
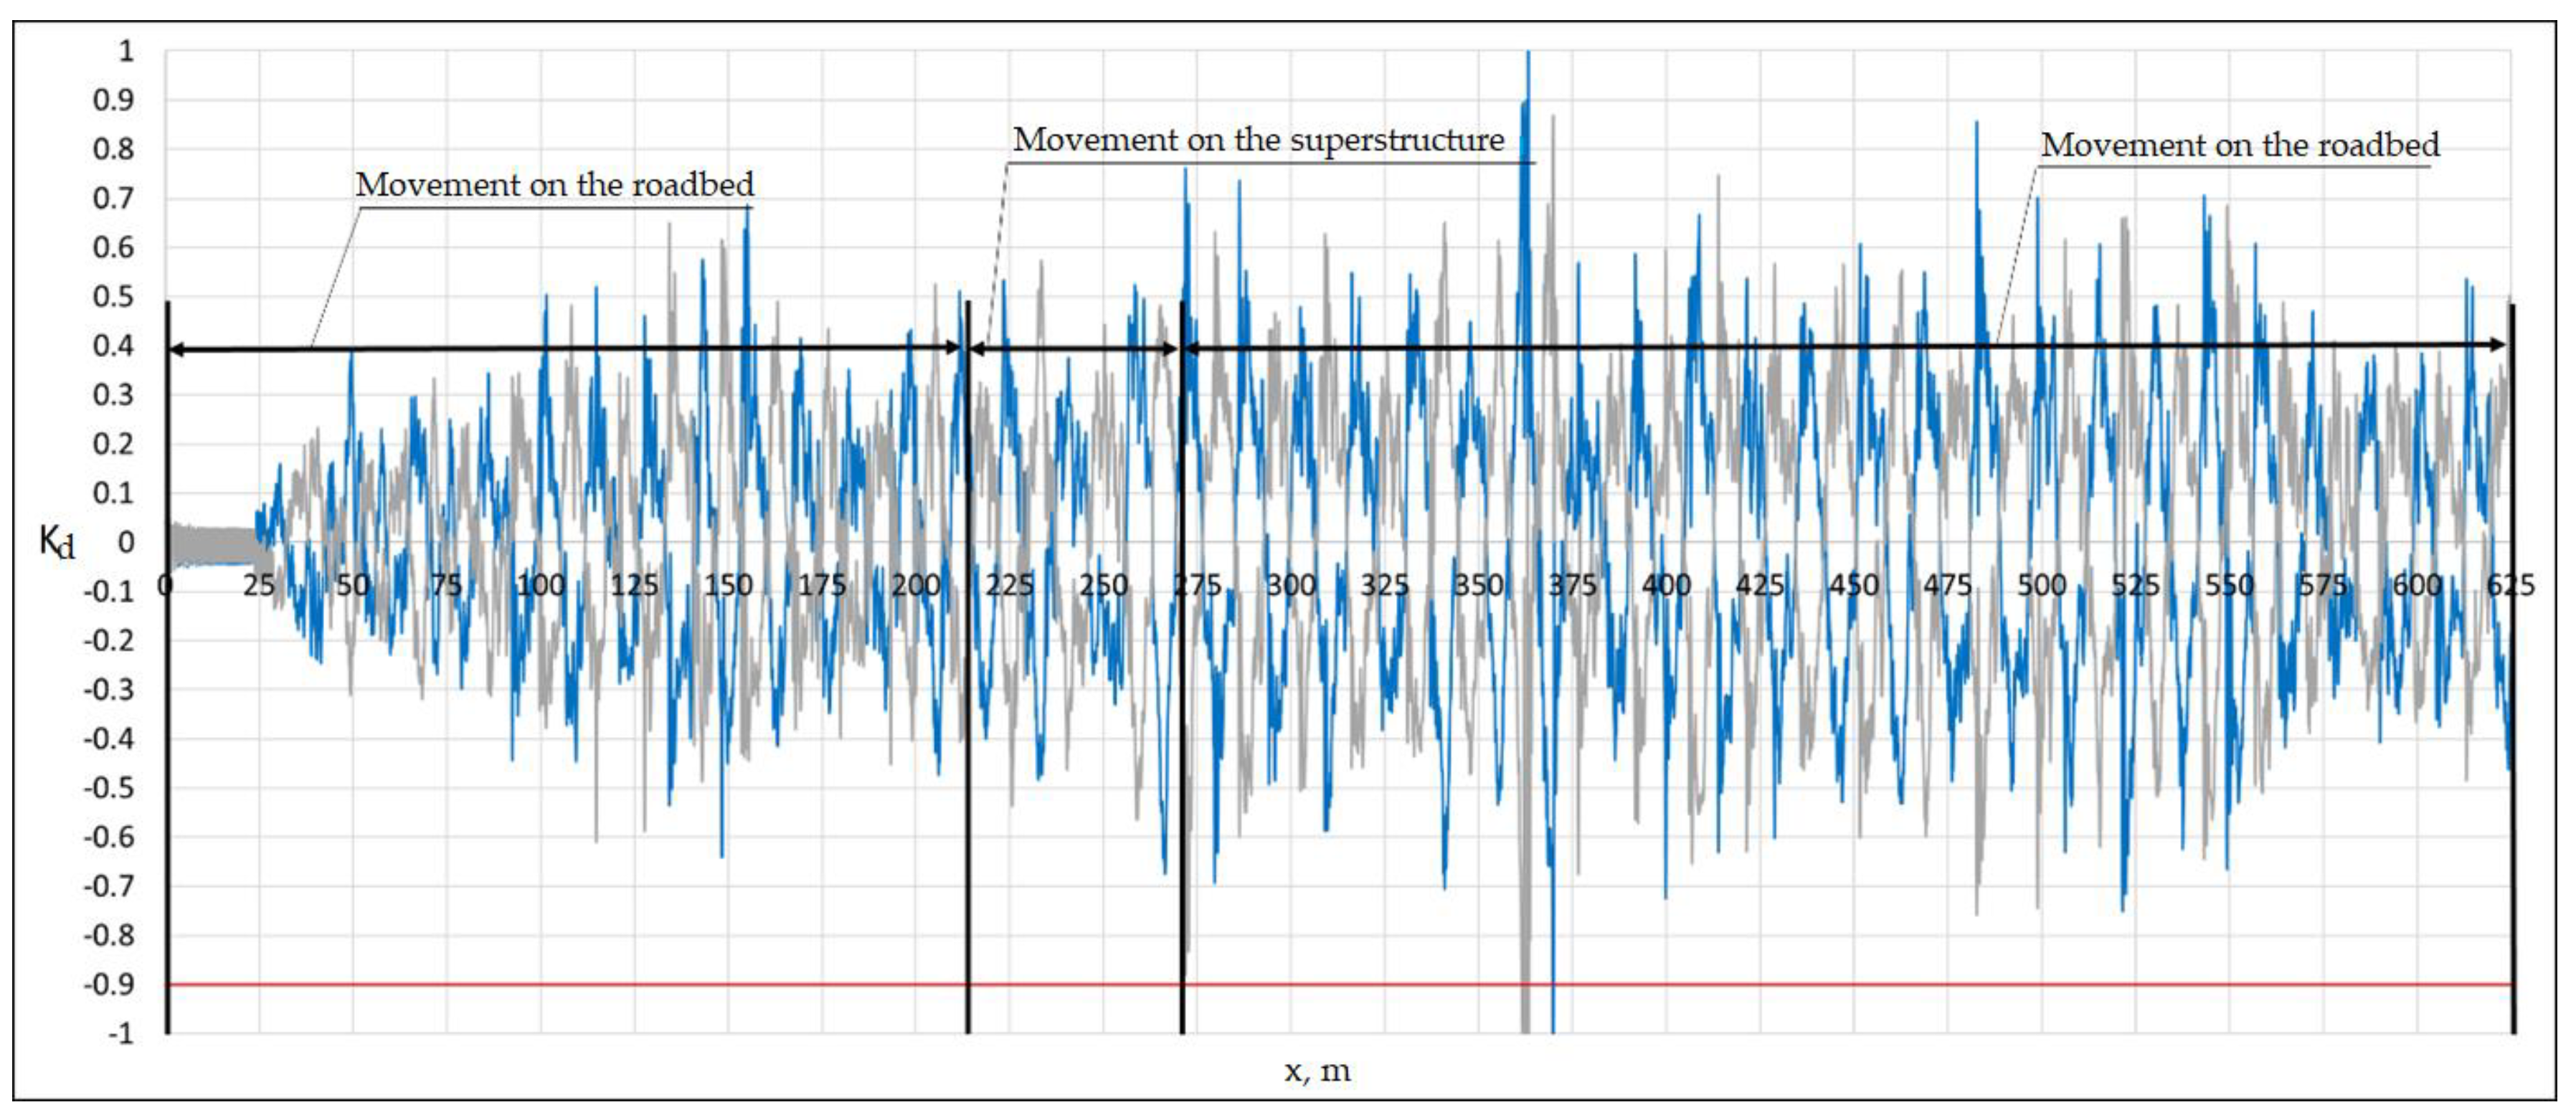
Figure 23.
Scheme of movement of rolling stock in calculations with and without the superstructure.
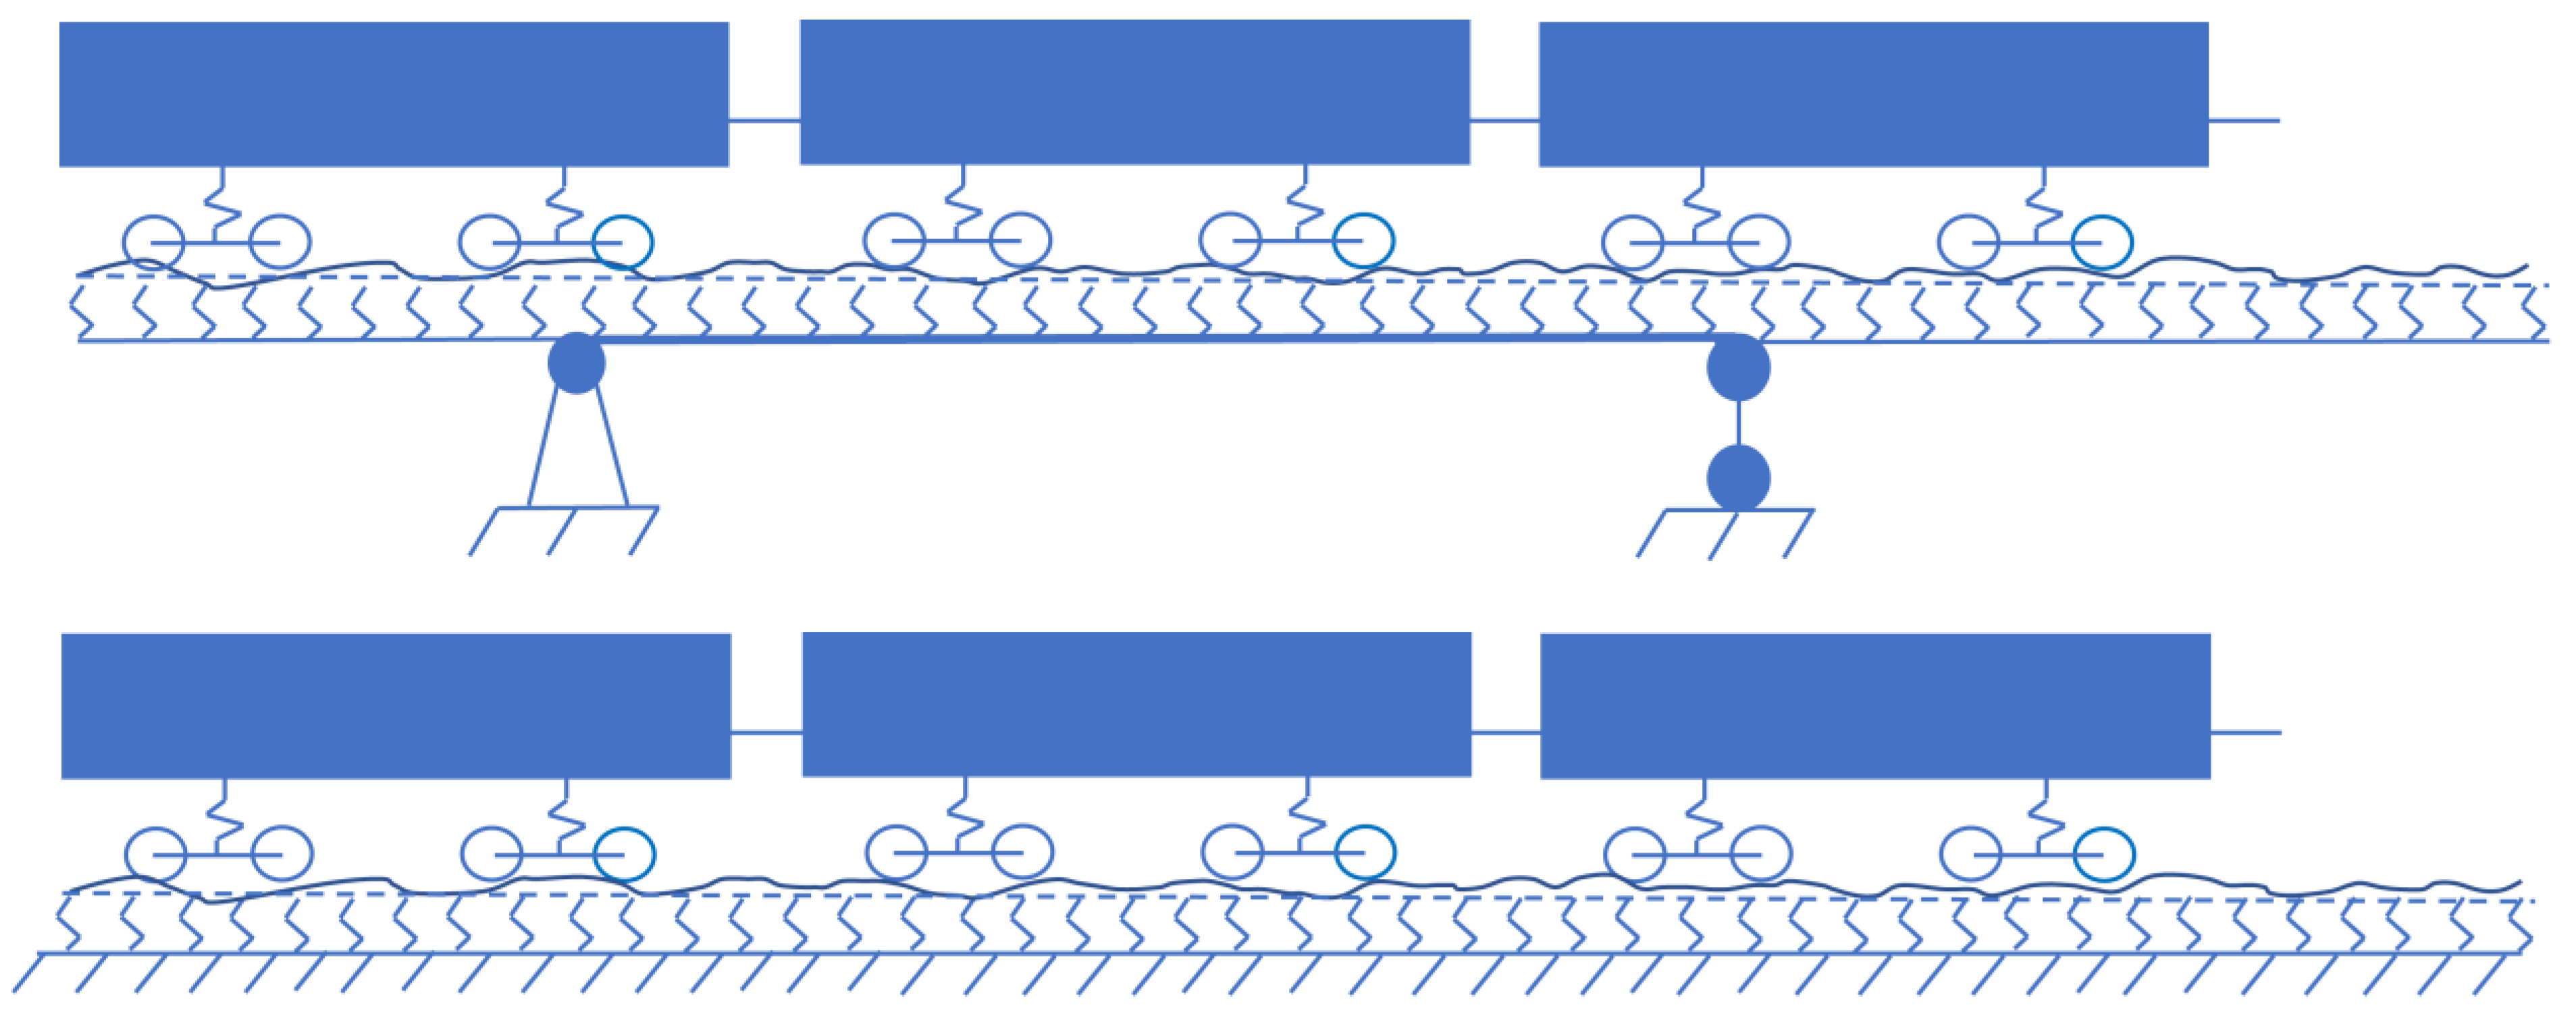
Figure 24.
Nadal criterion. Wheel pair No. 1. Car No. 5. Left wheel – gray. Permissible value – red.
Figure 24.
Nadal criterion. Wheel pair No. 1. Car No. 5. Left wheel – gray. Permissible value – red.
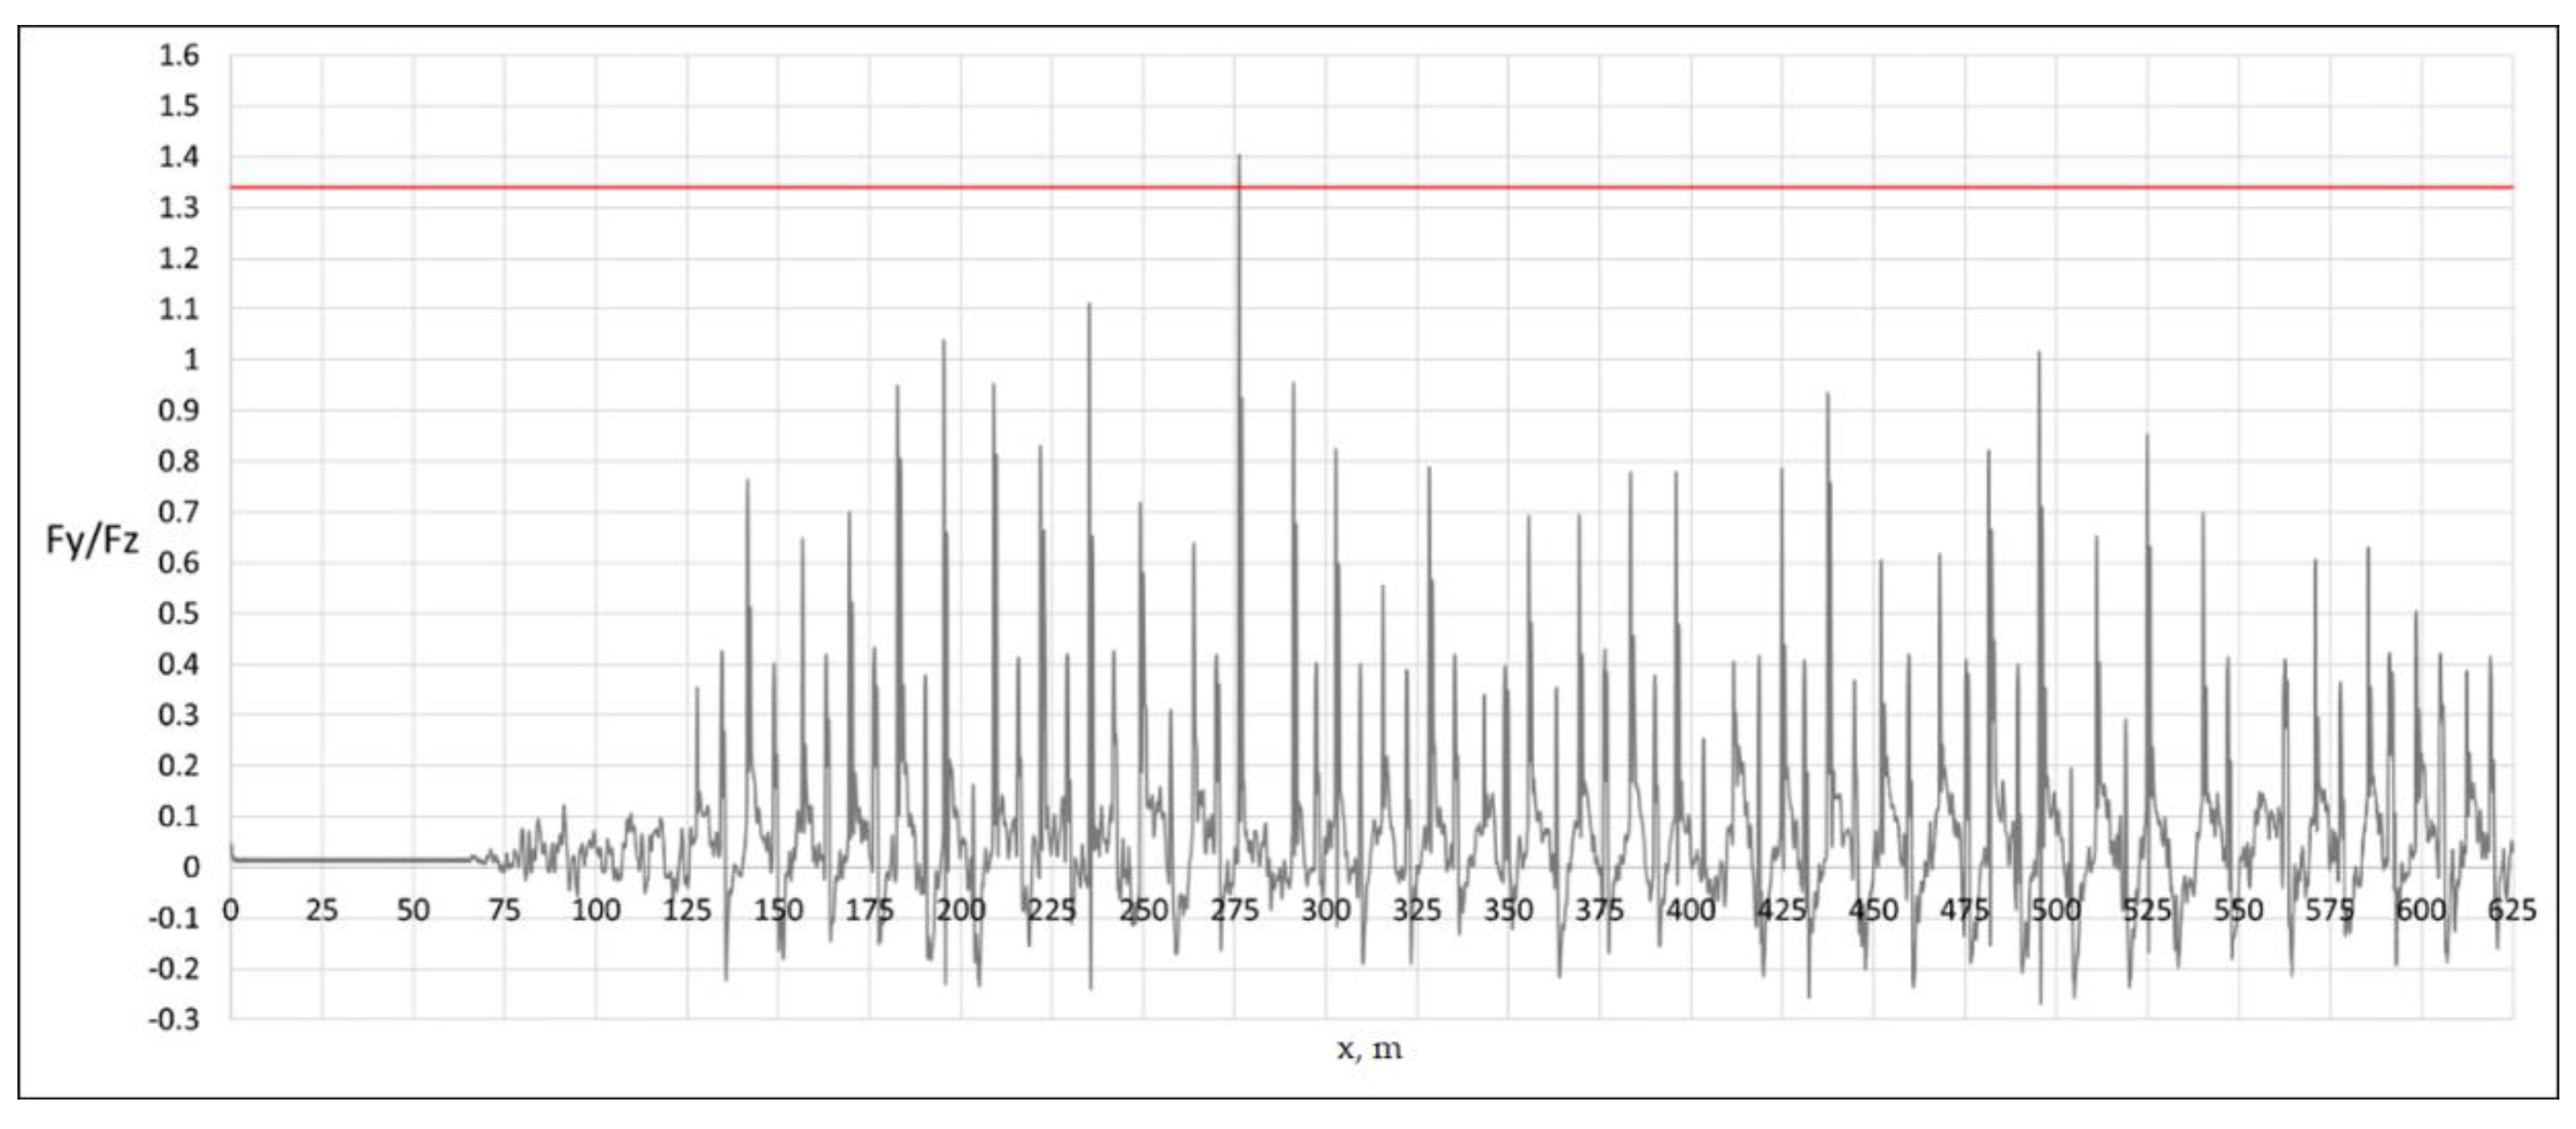
Figure 25.
Dependence of the maximum value of the Nadal criterion on the speed of the train.
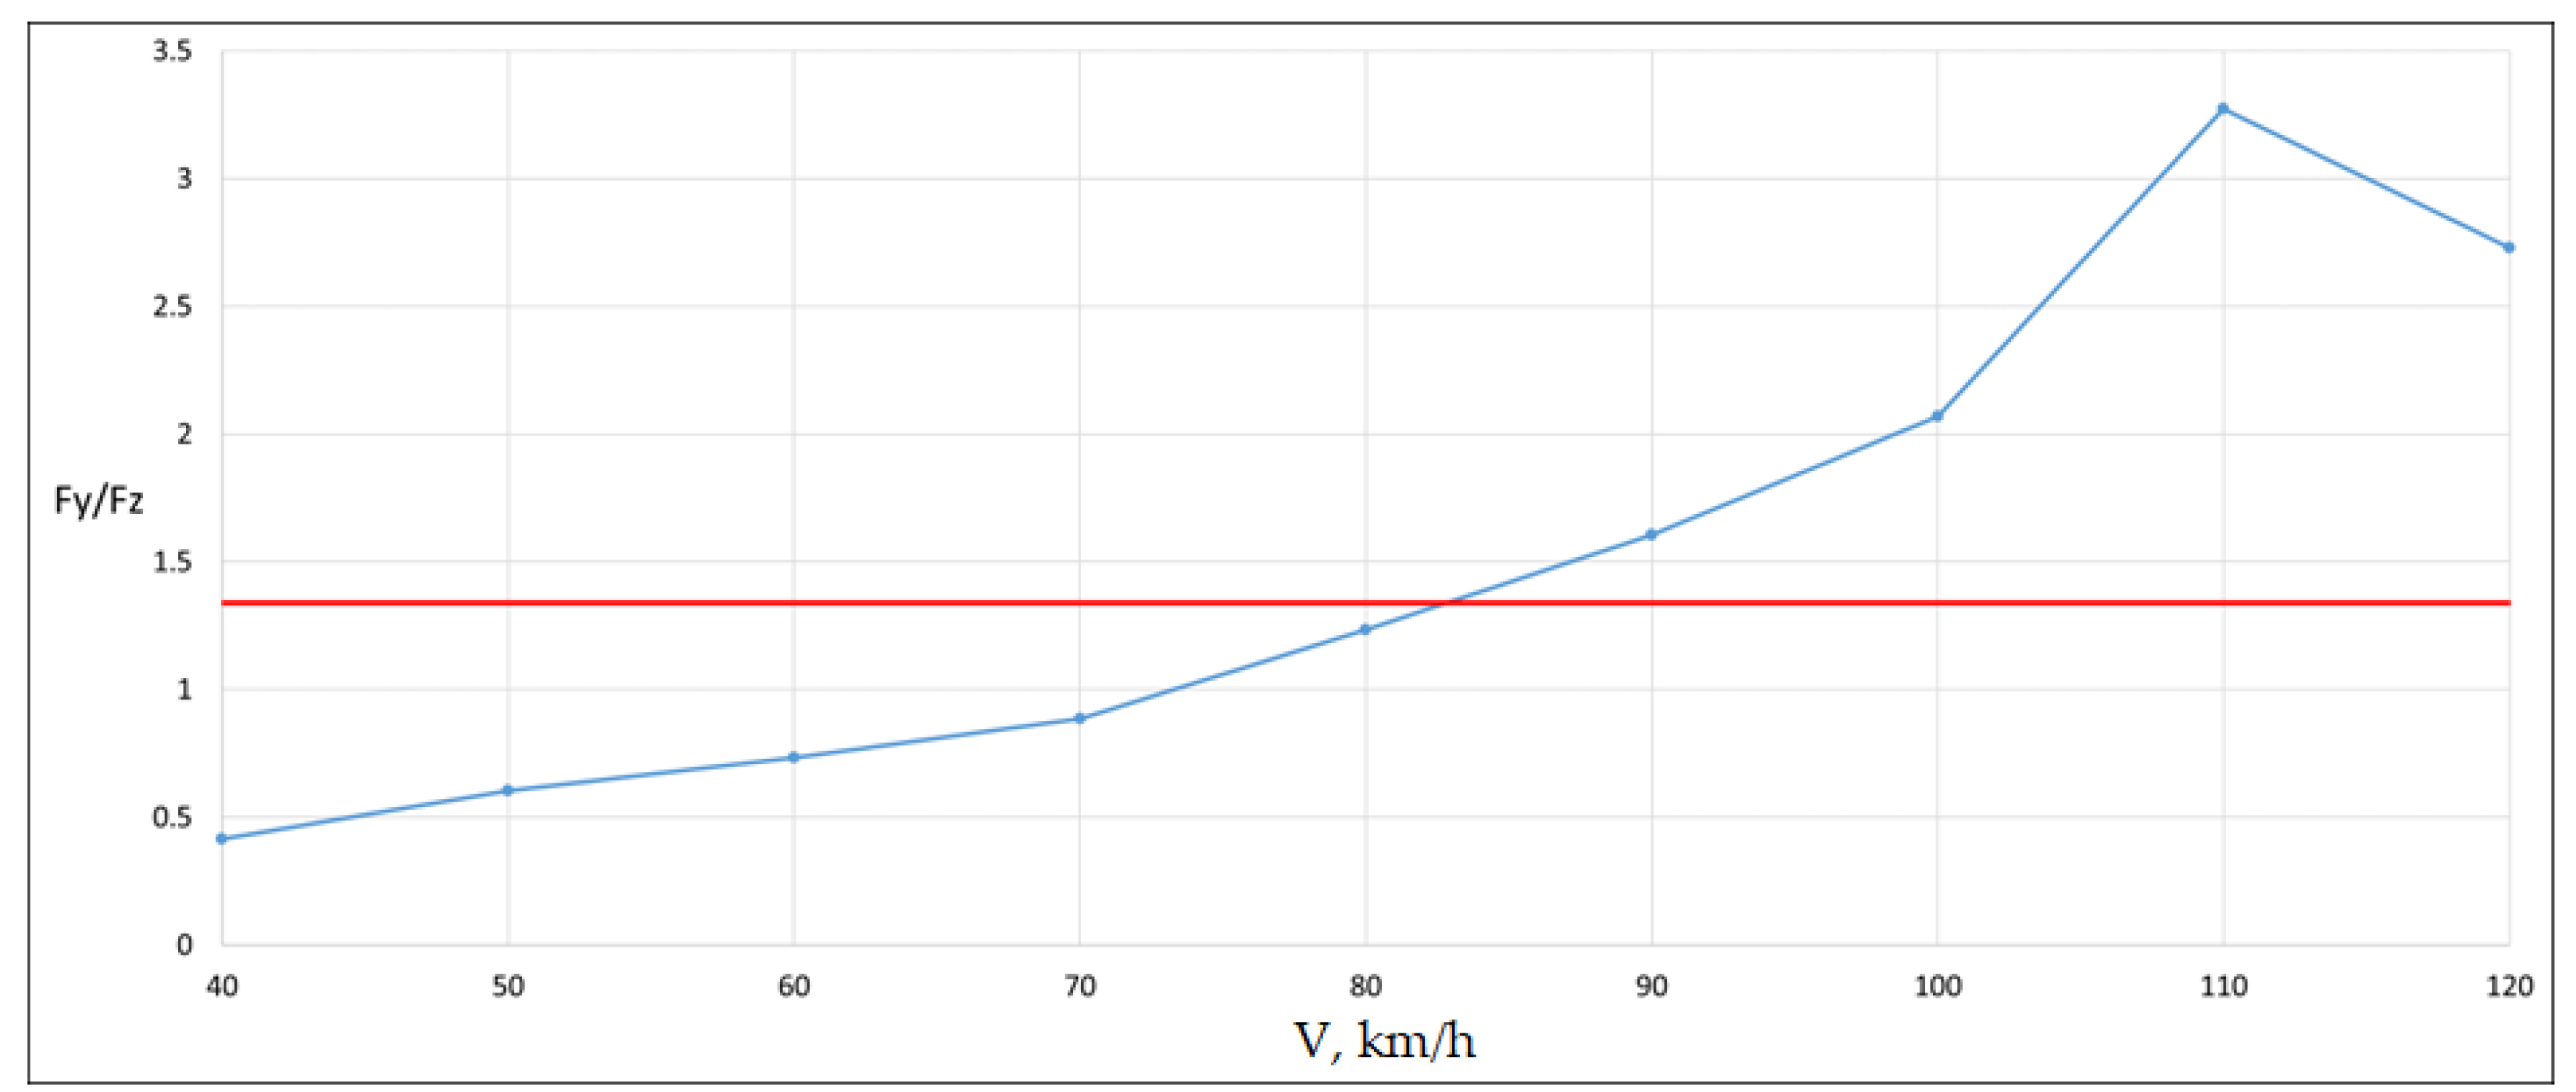
Figure 26.
Transverse horizontal vibrations of the span structure in the middle of the span.
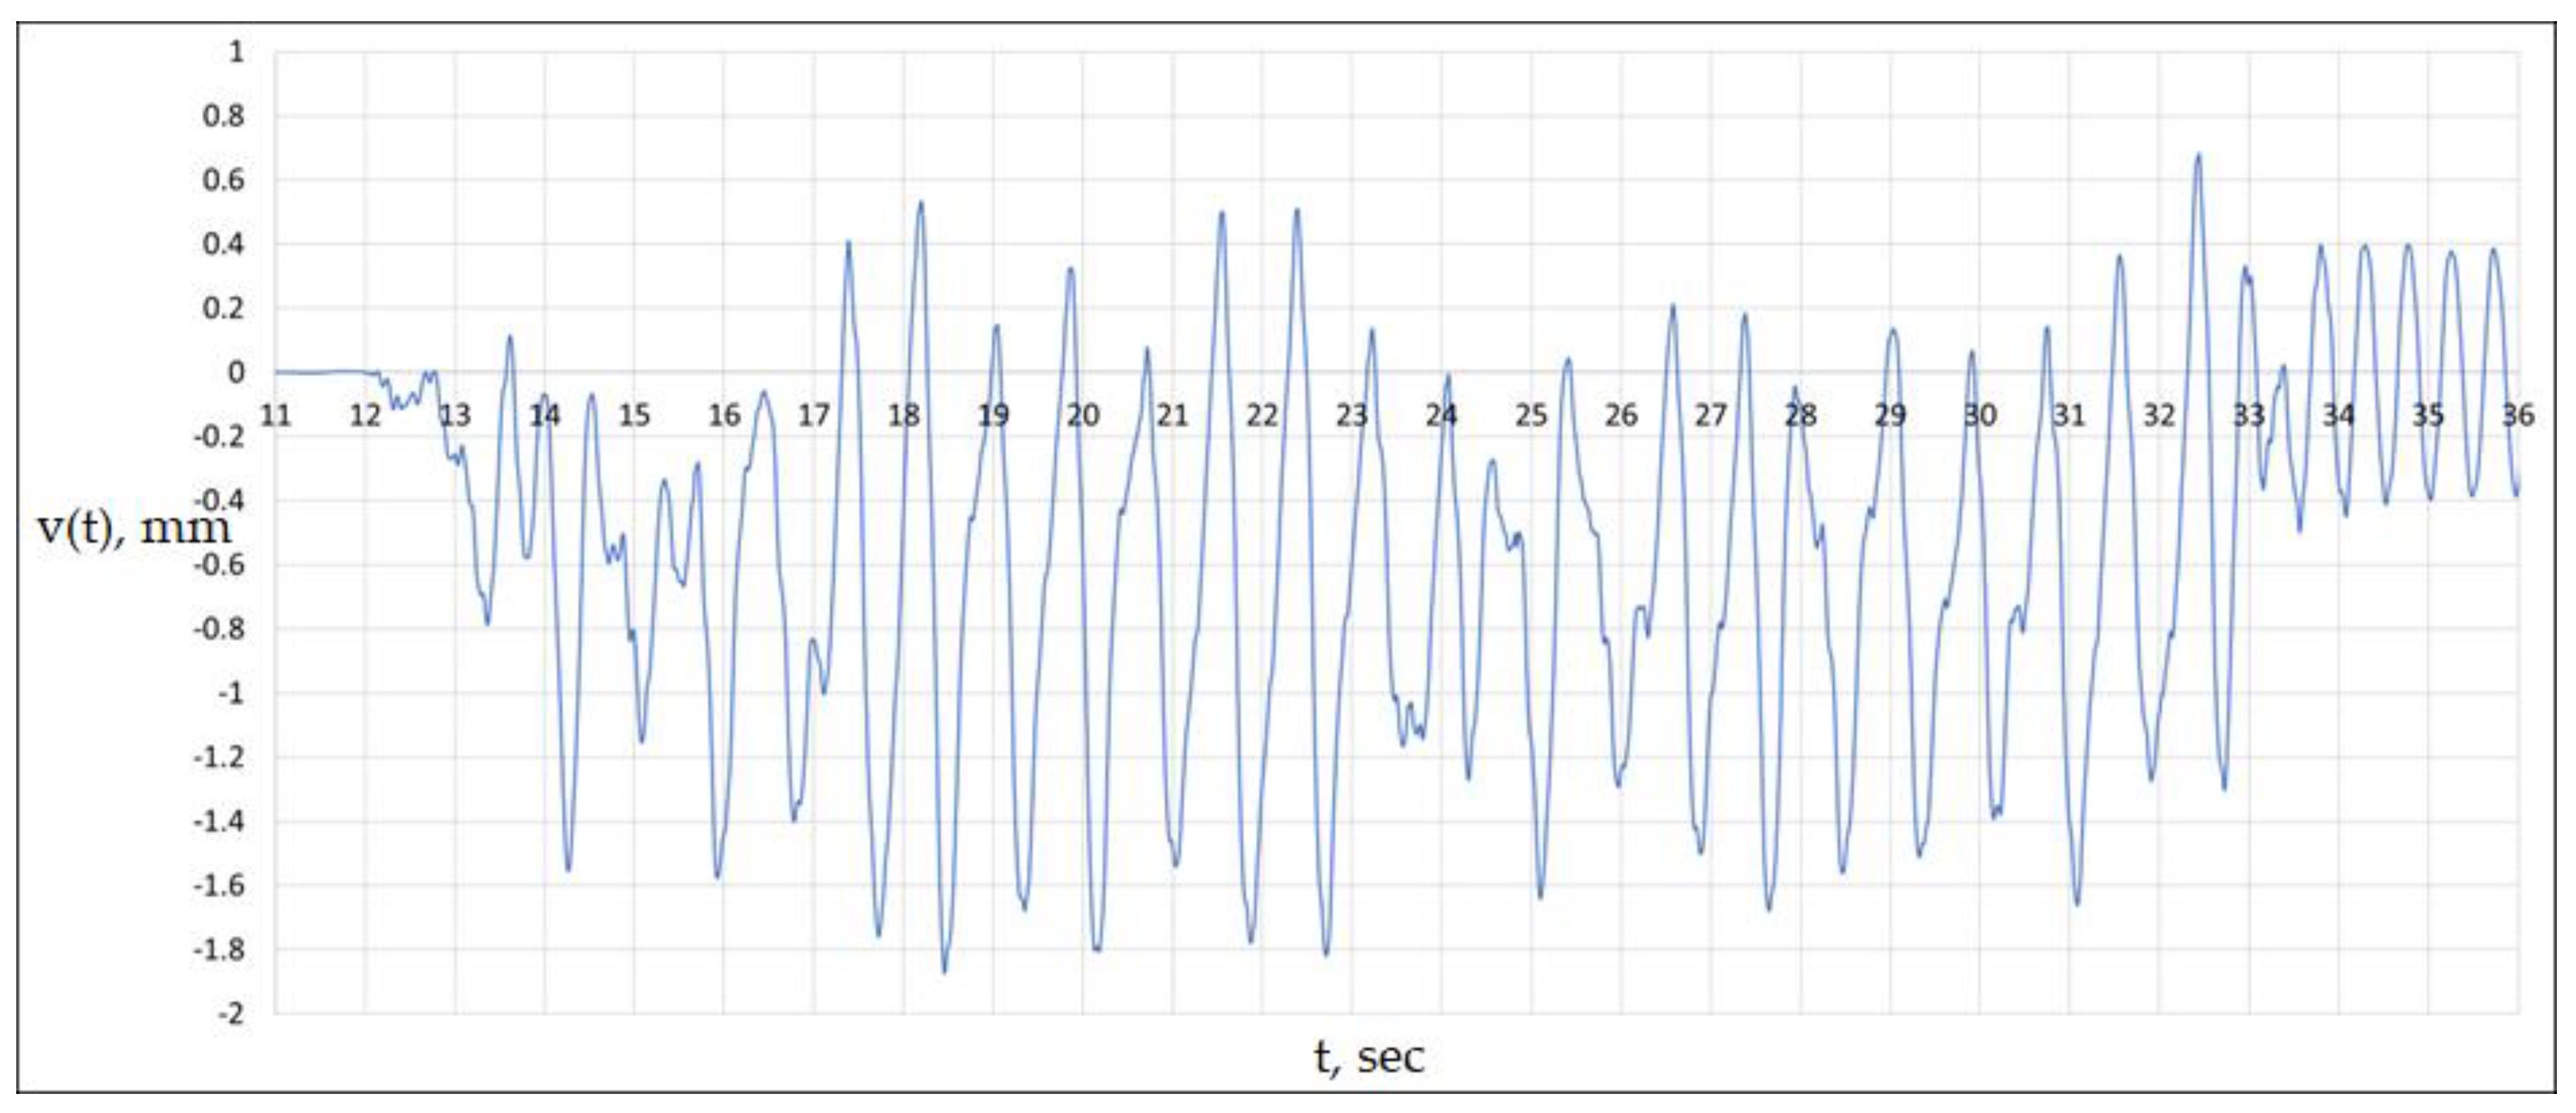
Figure 27.
Nadal criterion. Wheel pair No. 1. Car No. 9. Left wheel. Calculation with a span – blue, calculation without a span – grey, permissible value – red.
Figure 27.
Nadal criterion. Wheel pair No. 1. Car No. 9. Left wheel. Calculation with a span – blue, calculation without a span – grey, permissible value – red.
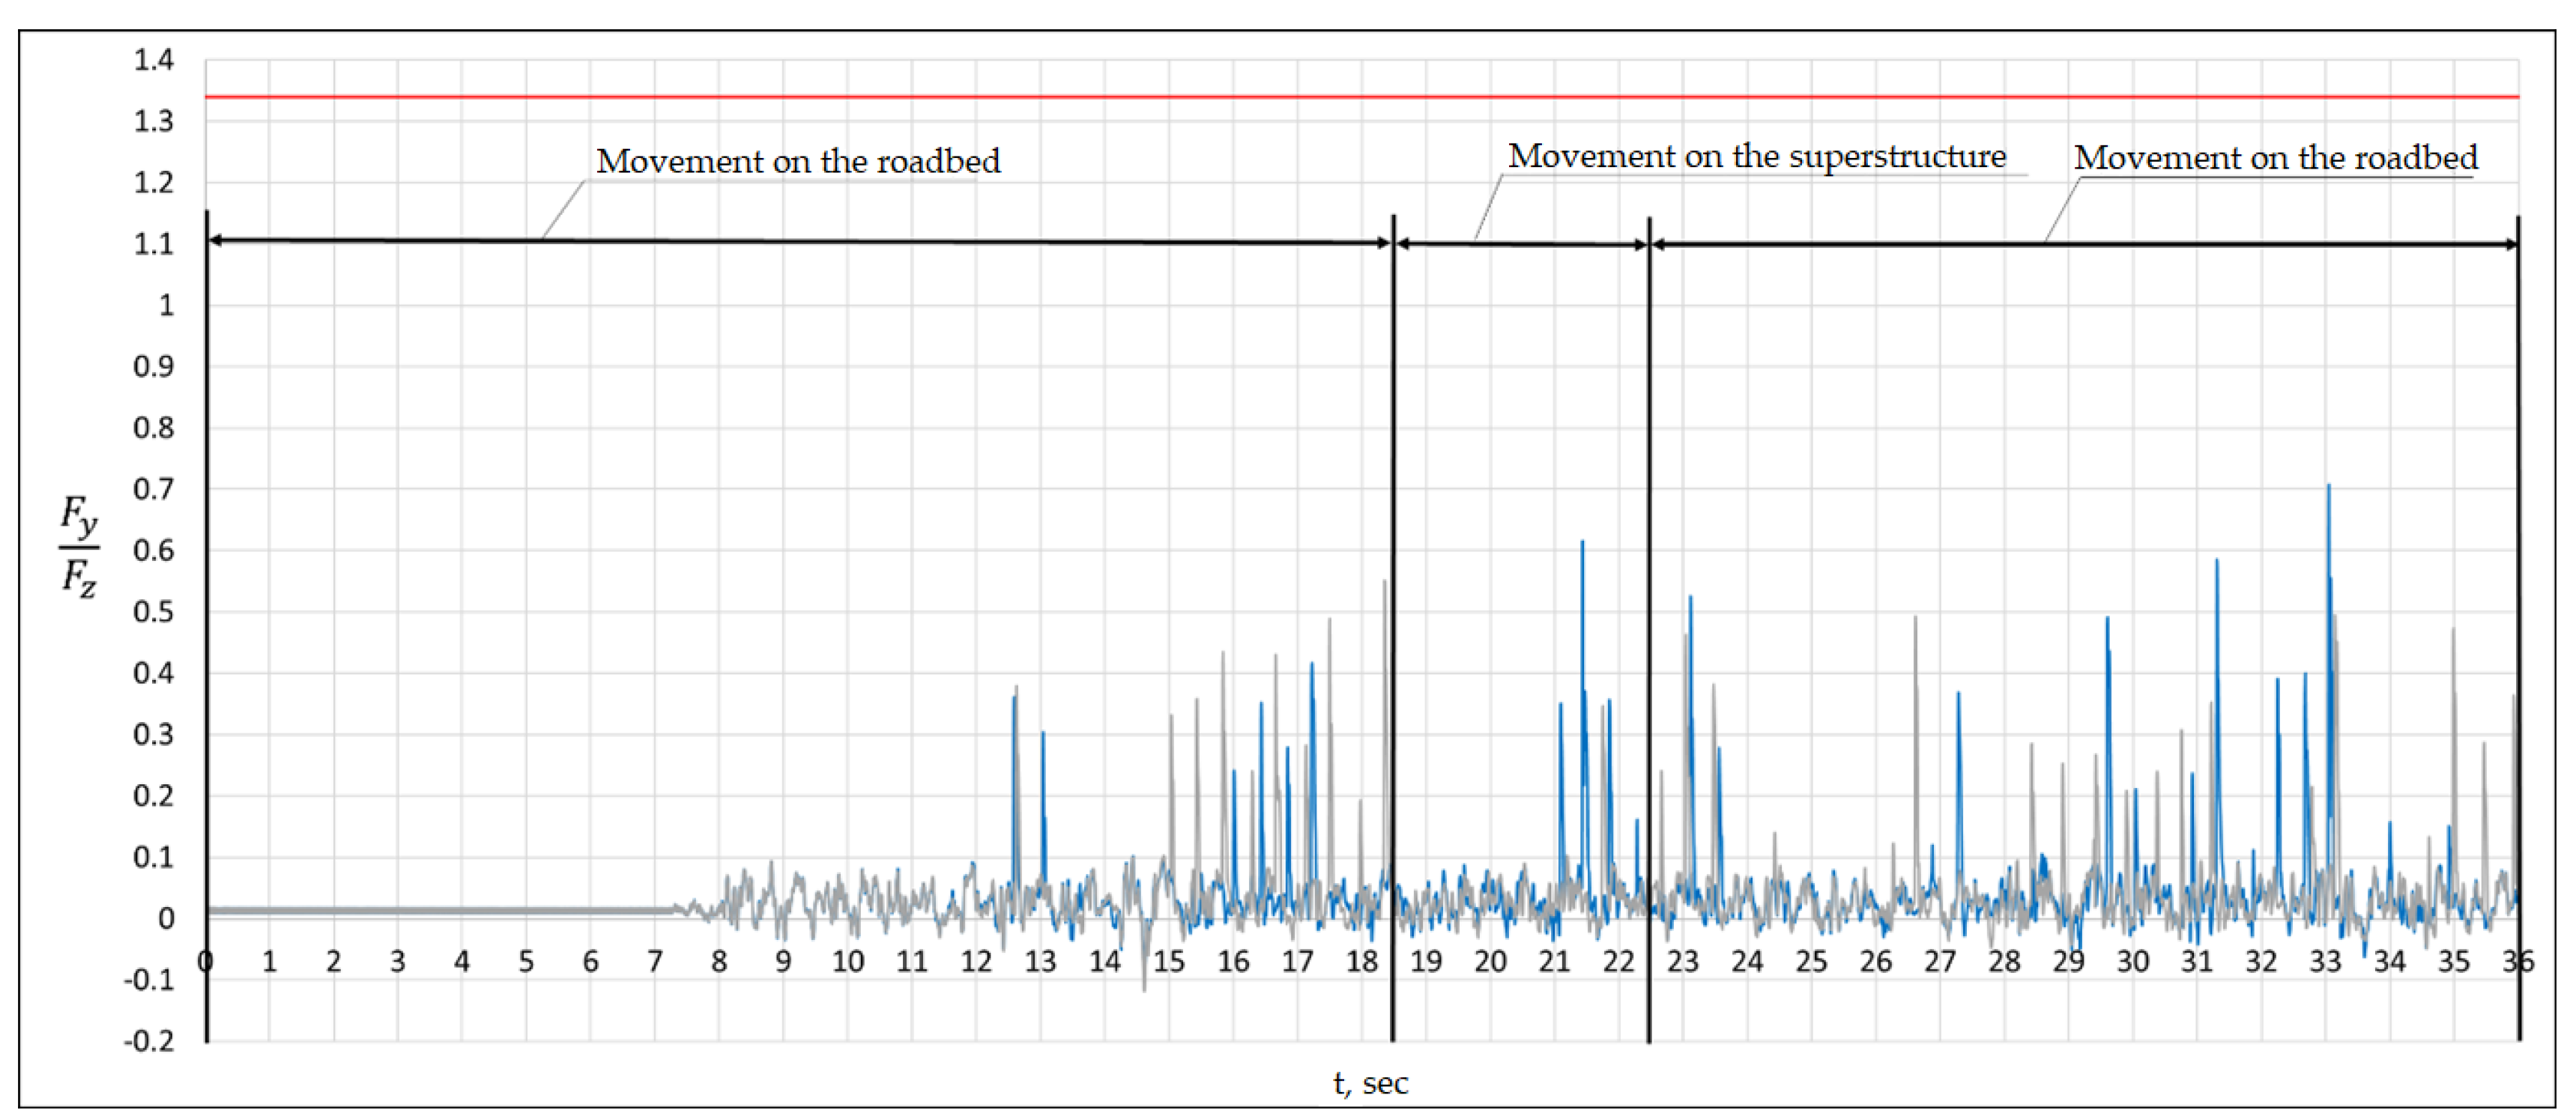
Figure 28.
Wheel-rail dynamic coefficient. Wheel pair No. 1. Car No. 9. Left wheel. Calculation with span structure – blue, calculation without span structure – grey, permissible value – red.
Figure 28.
Wheel-rail dynamic coefficient. Wheel pair No. 1. Car No. 9. Left wheel. Calculation with span structure – blue, calculation without span structure – grey, permissible value – red.
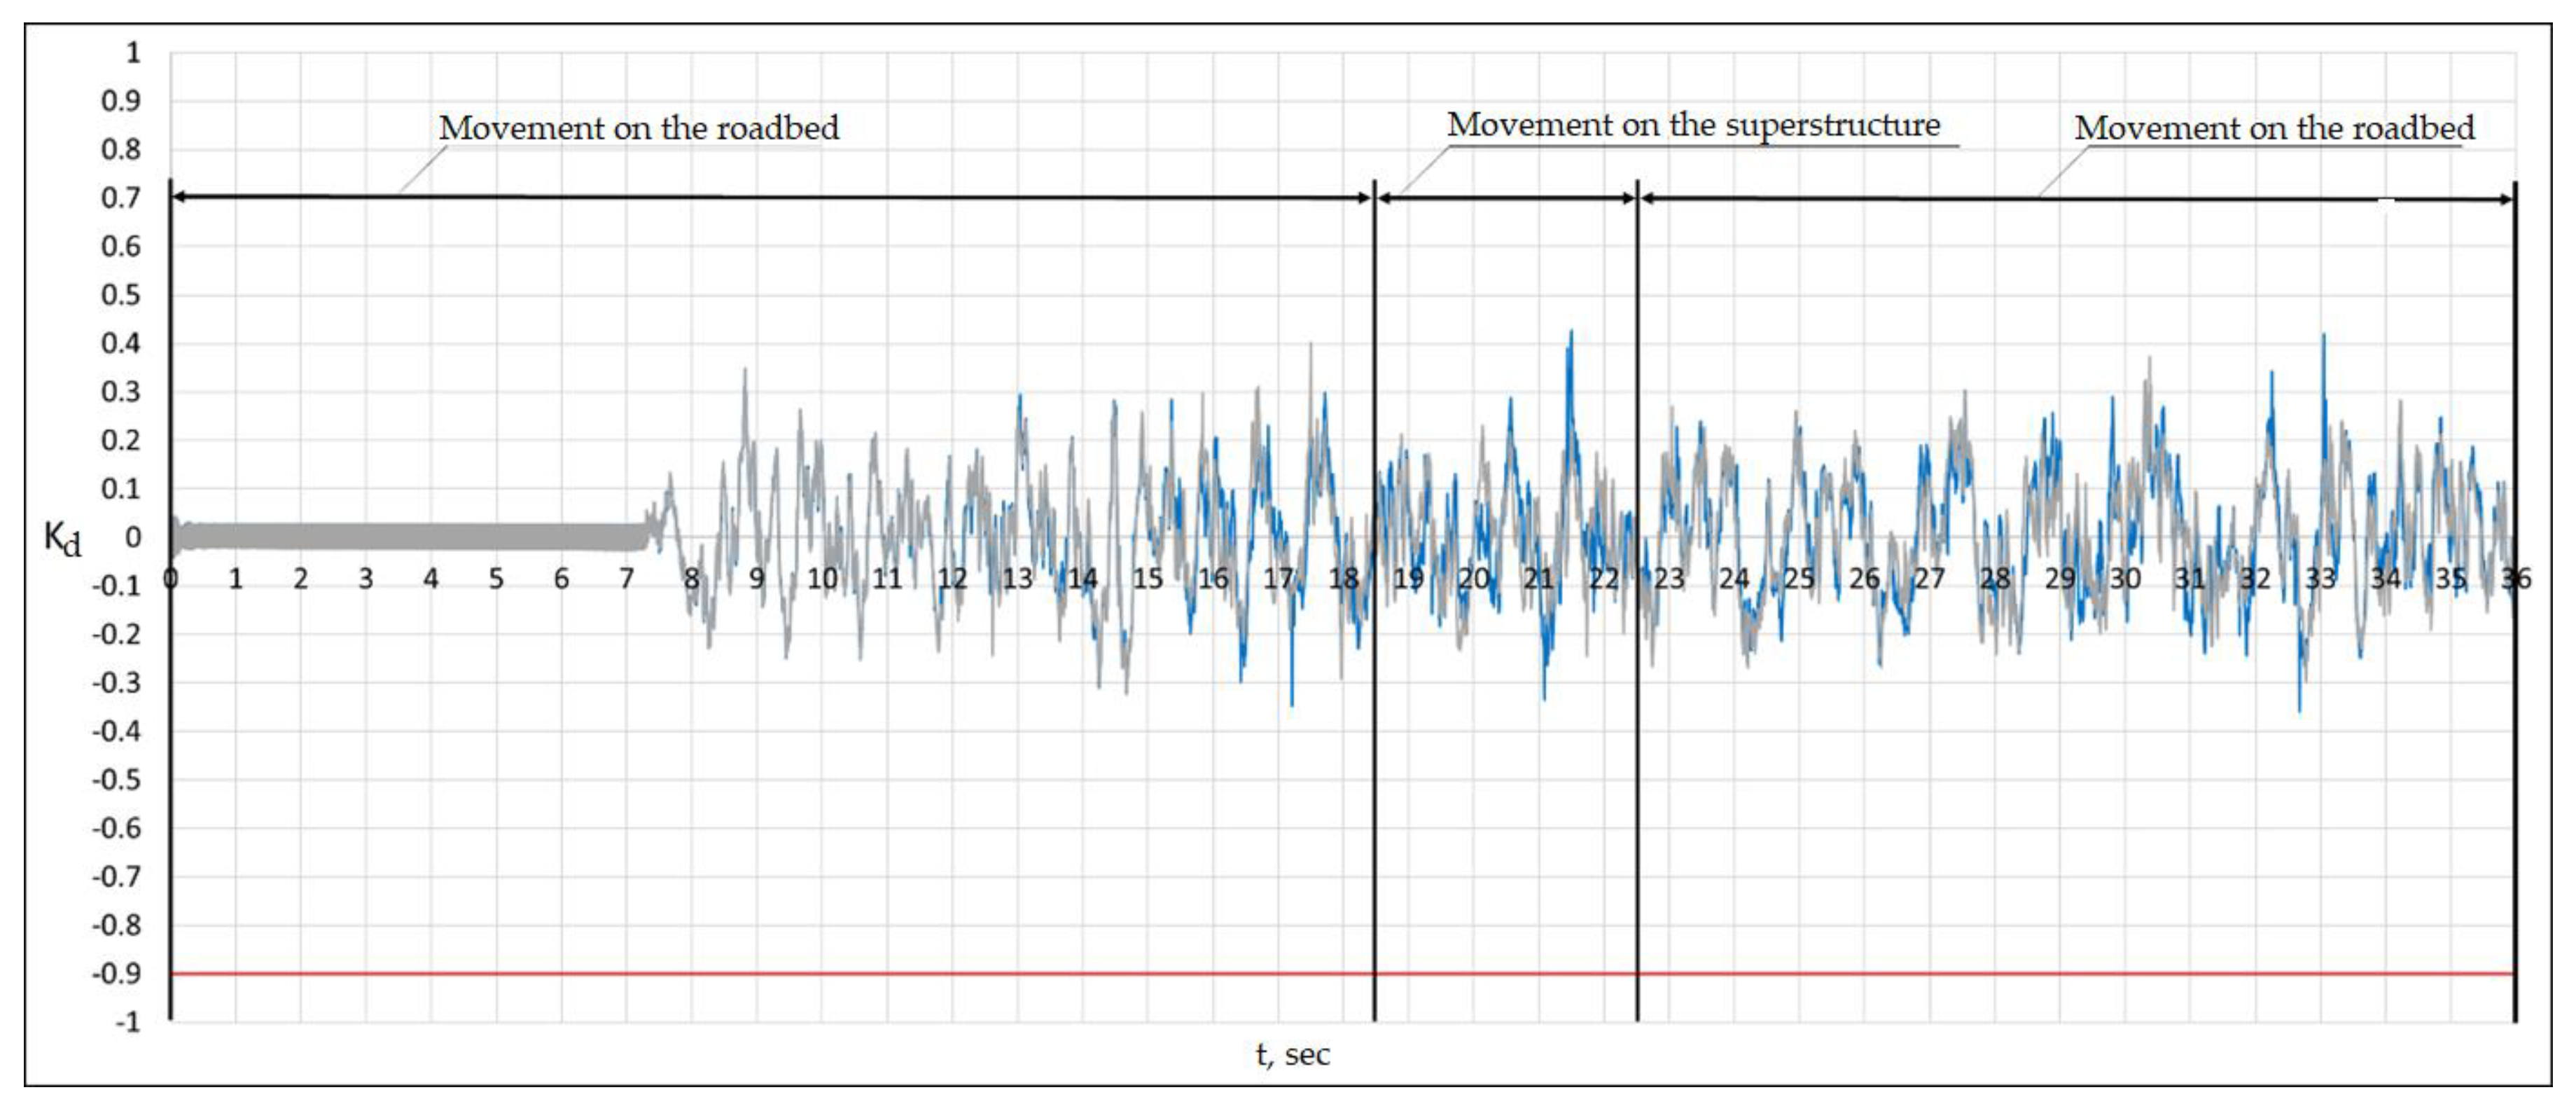
Table 2.
Vertical and horizontal accelerations of the span structure.
| V, km/h | ||||
| Max|Az|, m/s2 | σ_Az, m/s2 | Max|Ay|, m/s2 | σ_Ay, m/s2 | |
| 40 | 0.243 | 0.052 | 0.211 | 0.047 |
| 50 | 0.352 | 0.078 | 0.298 | 0.069 |
| 60 | 0.522 | 0.111 | 0.633 | 0.102 |
| 70 | 0.574 | 0.138 | 1.137 | 0.207 |
| 80 | 1.135 | 0.254 | 2.008 | 0.344 |
| 90 | 1.247 | 0.265 | 2.329 | 0.607 |
| 100 | 2.258 | 0.451 | 3.721 | 0.662 |
| 110 | 2.639 | 0.496 | 4.997 | 0.917 |
| 120 | 3.431 | 0.741 | 7.174 | 1.264 |
Table 3.
Tests of the early 20th century.
| № | Estimated span L m. | Test train | V, km/h | Amplitude, mm |
| 1 | 54.88 | 2 locomotives + 2 freight cars | 57 | 7.5 |
| 42 | 5.0 | |||
| 64 | 9.0 | |||
| 2 | 55.1 | 2 steam locomotives + 4 freight platforms | 16 | 2.5 |
| 13 | 3.0 | |||
| 37 | 4.0 | |||
| 40 | 3.0 | |||
| 17 | 2.5 | |||
| 5 | 1.0 | |||
| 2 steam locomotives | 16 | 2.2 | ||
| 17 | 3.0 | |||
| 45 | 2.0 | |||
| 3 | 55.06 | 2 steam locomotives + 4 freight platforms | 5 | 2.0 |
| 16 | 2.5 | |||
| 13 | 2.2 | |||
| 37 | 2.5 | |||
| 40 | 3.0 | |||
| 2 steam locomotives | 6 | 1.8 | ||
| 17 | 2.5 | |||
| 40 | 5.5 |
Disclaimer/Publisher’s Note: The statements, opinions and data contained in all publications are solely those of the individual author(s) and contributor(s) and not of MDPI and/or the editor(s). MDPI and/or the editor(s) disclaim responsibility for any injury to people or property resulting from any ideas, methods, instructions or products referred to in the content. |
© 2025 by the authors. Licensee MDPI, Basel, Switzerland. This article is an open access article distributed under the terms and conditions of the Creative Commons Attribution (CC BY) license (http://creativecommons.org/licenses/by/4.0/).
Copyright: This open access article is published under a Creative Commons CC BY 4.0 license, which permit the free download, distribution, and reuse, provided that the author and preprint are cited in any reuse.


