
Submitted:
17 March 2025
Posted:
17 March 2025
You are already at the latest version
Abstract
Background and Objectives: Preeclampsia (PE) is a major cause of adverse perinatal outcomes. Early diagnosis of pregnant women at risk of PE can facilitate disease prevention and management. However, the presence of different phenotypes of the disease complicates its prediction. In particular, the challenges in the early diagnosis of term PE cases necessitate research on PE prediction in the second and third trimesters. This study aims to examine the association between PE development and mid-trimester blood urea nitrogen (BUN), serum creatinine, and the BUN/creatinine ratio in pregnant women. Materials and Methods: This retrospective case-control study was conducted on women diagnosed with PE. Pregnant women who underwent routine biochemical blood tests between the 18th and 24th weeks of gestation and subsequently gave birth at our hospital between January 2022 and May 2023 were categorized into three groups. Accordingly, healthy women who had term deliveries were classified as Group 1 (150 cases), women diagnosed with PE were classified as Group 2 (58 cases), and those diagnosed with severe PE were classified as Group 3 (44 cases). Results: There were no significant differences in age, gravidity, parity, body mass index, or gestational week at blood sampling between the patient and control groups (p > 0.05). When comparing the mean blood urea nitrogen, serum creatinine, and BUN/creatinine ratios, a significant difference was observed between the control group and those who developed PE (p = 0.001, p < 0.001, and p = 0.031, respectively). Univariate analysis revealed a significant association between BUN levels and PE development (OR 1.083; 95% CI, 1.031-1.139; p = 0.002). A stronger association was observed between serum creatinine levels and PE development (OR 112.344; 95% CI, 11.649-1083.416; p < 0.001). However, no significant association was found between the BUN/creatinine ratio and PE in univariate analysis (OR 1.003; 95% CI, 0.979-1.028; p > 0.05). Mid-trimester BUN and serum creatinine levels were significantly higher in patients who developed PE and severe PE. The AUC value for the BUN parameter in predicting PE was 0.614 (AUC 0.614; 95% CI, 0.539-0.689; p = 0.002). A BUN cut-off value of 16.2 mg/dL predicted disease development with a sensitivity of 52.9% and a specificity of 74%. Similarly, the AUC value for the serum creatinine parameter in predicting PE was 0.644 (AUC 0.644; 95% CI, 0.574-0.751; p < 0.001). A serum creatinine cut-off value of 0.58 mg/dL was able to predict disease development with 37.2% sensitivity and 88% specificity. No significant AUC value was obtained for the BUN/creatinine ratio (p > 0.05). Conclusions: There is a positive correlation between elevated mid-trimester BUN and serum creatinine levels and the subsequent development of preeclampsia syndrome.
Keywords:
blood urea nitrogen
; mid-trimester biomarkers
; preeclampsia
; prediction
; serum creatinine
1. Introduction
Preeclampsia (PE) is a multisystemic disease affecting 2–8% of pregnancies and is a leading cause of perinatal mortality and morbidity [1]. Gestational hypertension contributes to 14% of maternal deaths, and annually, 500,000 newborns die as a result of PE [2,3]. The pathophysiology of PE remains unclear, and there is still no effective treatment. Therefore, predicting and preventing the disease are important areas of research. Various biophysical and biochemical markers have been used to identify high-risk patients, and these markers have been found effective in detecting early-onset PE (before 34 weeks).
In 2020, a predictive model utilizing a multivariable Gaussian distribution incorporated maternal characteristics, mean arterial pressure measurement, uterine artery Doppler assessment, and biochemical parameters, including placental growth factor. This model detected 94% of early-onset PE cases with a 10% false-positive rate (AUC 0.96, 95% CI, 0.94–0.98) [4]. Although this form of PE, which begins before 34 weeks of gestation, is associated with more severe disease characteristics, 80% of PE cases present after 34 weeks as late-onset PE. First-trimester predictive tests are insufficient for detecting term preeclampsia [5].
Identifying patients at risk of developing PE in the second and third trimesters remains important, as it increases the opportunity for early diagnosis. Early diagnosis can lead to timely and appropriate management, thereby improving maternal and perinatal outcomes [6]. However, the strategy for predicting and preventing late-onset PE remains unclear, and current research suggests that patients should be screened for PE at 24, 28, 32, and 36 weeks of gestation [7,8]. Additionally, as gestational age advances, biomarkers become less relevant in identifying high-risk groups.
Undoubtedly, the most significant impact of PE occurs in the kidneys, and PE is recognized worldwide as the most common glomerular disease [9]. Regardless of its form, the diagnostic criteria for PE include renal parameters such as proteinuria and/or elevated creatinine levels [10].
Given PE's systemic impact, early warning signs related to kidney function may emerge during its progression. In our study, we investigated the mid-trimester blood urea nitrogen (BUN) and serum creatinine levels of pregnant women who developed PE and explored their potential role in predicting PE.
2. Materials and Methods
2.1. Patients
This study was designed as a retrospective case-control study. The medical records of pregnant women who underwent routine biochemical blood tests between 18 and 24 weeks of gestation and subsequently gave birth at Elazig Firat University between January 2022 and May 2023 were retrospectively reviewed. Prior to data collection, the study received approval from the local ethics committee (Ethics Committee Approval Number: 2022/11-02) and permission from the provincial health directorate to access patient data. The control group consisted of healthy, normotensive women who delivered at term (≥37 weeks) and did not develop obstetric complications during pregnancy. These women were matched with those diagnosed with PE and severe PE based on age, gravidity, parity, and body mass index. Accordingly, the study groups were categorized as follows: Group 1 (150 cases) included healthy women who delivered at term, Group 2 (58 cases) consisted of women diagnosed with PE, and Group 3 (44 cases) comprised women diagnosed with severe PE.
In 2013, the American College of Obstetricians and Gynecologists (ACOG) revised the diagnostic criteria for PE, with the latest update released in June 2020, finalizing the new classification principles [10]. The diagnostic criteria outlined in this guideline were used to identify patients with PE and severe PE.
According to these criteria, PE was diagnosed in women with previously normal blood pressure if, after 20 weeks of gestation, systolic blood pressure exceeded 140 mmHg or diastolic blood pressure exceeded 90 mmHg on at least two occasions at least four hours apart, with or without proteinuria, accompanied by at least one systemic finding.
For severe PE diagnosis, the presence of systolic blood pressure >160 mmHg or diastolic blood pressure >110 mmHg, regardless of proteinuria, along with at least one systemic finding, was required.
The proteinuria criteria used for diagnosis included at least one of the following: ≥300 mg proteinuria in a 24-hour urine sample, a protein/creatinine ratio >0.3, or ≥+1 proteinuria detected by dipstick testing in a spot urine sample. Systemic findings included thrombocytopenia (platelet count <100,000/mm³), renal insufficiency (serum creatinine >1.1 mg/dL or a baseline creatinine level at least twice the normal value in the absence of other renal diseases), hepatic dysfunction (elevated liver transaminases at least two times the upper normal limit), pulmonary edema, or the presence of cerebral or visual symptoms.
Women with multiple pregnancies, chronic or gestational hypertension, obesity (BMI >30 kg/m²), advanced maternal age (>35 years), smoking, kidney disease, diabetes mellitus, thrombophilia, or connective tissue disorders were excluded from the study. Additionally, patients using medication for any disease were also excluded from the study. Maternal demographic characteristics and other medical data were obtained from medical records.
Laboratory data included renal function parameters, specifically blood urea nitrogen (BUN), serum creatinine, and the BUN/creatinine ratio measured between 18 and 24 weeks of gestation.
2.2. Statistical Analysis
Data were analyzed using IBM Statistical Package for the Social Sciences (SPSS) version 23. The normality of data distribution was assessed using the Shapiro-Wilk and Kolmogorov-Smirnov tests. The Chi-square test was used to compare categorical variables between groups. For comparisons of non-normally distributed data among three or more groups, the Kruskal-Wallis test was employed, followed by the Dunn test for multiple comparisons.
Binary logistic regression analysis was performed to evaluate risk factors associated with preeclampsia, and the results were reported as odds ratios (ORs) with 95% confidence intervals (CIs). The sensitivity and specificity of different threshold values for each variable (BUN, serum creatinine, BUN/creatinine ratio) in detecting PE were calculated and presented as receiver operating characteristic (ROC) curves.
Multivariable logistic regression analysis was applied to identify independent predictors of PE and severe PE, with results reported as odds ratios (ORs) and 95% confidence intervals (CIs). Continuous variables were expressed as mean ± standard deviation, and categorical variables were presented as counts (percentage). A p-value of <0.05 was considered statistically significant.
3. Results
Between January 2022 and May 2023, a total of 1,331 deliveries were recorded at Elazig Firat University. During this period, 119 patients were diagnosed with PE (8.9%), and 57 patients were diagnosed with severe PE (4.2%), as determined from hospital records. Among these, 58 pregnant women with preeclampsia who had available mid-trimester biochemical measurements were classified as Group 2, while 44 women diagnosed with severe PE were categorized as Group 3. The control group (Group 1) consisted of 150 healthy, term-delivering pregnant women who were matched and had accessible mid-trimester laboratory data.
The gravidity and parity characteristics of the patients are presented in Table 1. There was no significant difference in gravidity and parity between the groups (p > 0.05). In Group 1, 72% of cases had a gravidity of 1, compared to 67.2% in Group 2 and 75% in Group 3 (p = 0.851). Regarding parity, 82.7% of cases in Group 1, 77.2% in Group 2, and 79.5% in Group 3 had a parity of 0 (p = 0.907).
A comparison of the obstetric and demographic data, as well as renal parameters of the patients, is presented in Table 2.
The mean gestational weeks at delivery for Groups 1, 2, and 3 were 38.20 ± 1.30, 37.50 ± 1.51, and 31.33 ± 2.95, respectively (KW test: Group 1 vs. Group 2, p = 0.40; Group 1 vs. Group 3, p = 0.002; Group 2 vs. Group 3, p = 0.004). The median BUN values for Groups 1, 2, and 3 were 14.00, 18.00, and 15.00, respectively. A significant difference in median BUN values was observed among the groups (p = 0.001), with the difference originating from the comparison between Group 1 and Group 2. The median serum creatinine values for Groups 1, 2, and 3 were 0.46, 0.50, and 0.53, respectively. A significant difference in serum creatinine values was also observed among the groups (p < 0.001), with significant differences noted between Group 1 and Group 2, as well as between Group 1 and Group 3.
Furthermore, a significant difference was found in the median BUN/creatinine ratio among the groups (p = 0.031). The median BUN/creatinine ratios for Groups 1, 2, and 3 were 30.92, 32.75, and 28.87, respectively, with a significant difference between Group 2 and Group 3. However, no significant differences were found between the groups in terms of gestational week at blood sampling, BMI, or maternal age (p > 0.05).
To evaluate mid-trimester BUN, serum creatinine, and BUN/creatinine values as potential risk factors for PE, binary logistic regression analysis was performed using both univariate and multivariate models. The univariate model showed that a one-unit increase in BUN levels is associated with a 1.08-fold increase in the risk of PE (p = 0.002). A rise in serum creatinine levels was associated with a 112.34-fold increased risk of PE (p < 0.001). In multivariate model 1 (excluding the BUN/creatinine ratio), a one-unit increase in serum creatinine levels was found to increase the risk of PE by 59.74 times (p = 0.001). In multivariate model 2, which included the BUN/creatinine ratio, no significant effect of any variable was found (p > 0.050). The odds ratio values with 95% confidence intervals for laboratory parameters are presented in Table 3.
For PE prediction, the area under the curve (AUC) value for BUN was 0.614, which was statistically significant (p = 0.002). Based on this, a BUN cut-off value of 16.2 mg/dL yielded a sensitivity of 52.94%, specificity of 74%, positive predictive value (PPV) of 58.06%, and negative predictive value (NPV) of 69.81%. The AUC value for serum creatinine was 0.644, which was also statistically significant (p < 0.001). With a serum creatinine cut-off value of 0.58 mg/dL, the sensitivity, specificity, PPV, and NPV were determined to be 37.25%, 88%, 67.86%, and 67.35%, respectively. No significant AUC value was obtained for the BUN/creatinine ratio (p = 0.936). The ROC analysis results for BUN, serum creatinine, and BUN/creatinine are presented in Table 4.
A boxplot graph for serum creatinine values is shown in Figure 1.
The Receiver operating characteristic (ROC) curve for BUN, serum creatinine, and BUN/creatinine values is shown in Figure 2.
4. Discussion
We demonstrated that mid-trimester BUN and serum creatinine levels were significantly elevated in patients who developed preeclampsia (PE). We also calculated cut-off values for mid-trimester BUN and serum creatinine levels in patients at risk of developing PE. Additionally, we demonstrated that the BUN/creatinine ratio does not have a significant predictive value for PE.
Our findings should be regarded as part of an ongoing search for predictive markers, in parallel with various biophysical and biochemical parameters that have been developed for preeclampsia (PE) prediction over the years. The etiology and pathogenesis of PE remain incompletely understood, involving multiple heterogeneous factors that contribute to its development, resulting in a highly variable clinical phenotype [11,12]. Clinically, PE may present as mild or severe and can have an early onset (before 34 weeks of gestation) or late onset (after 34 weeks). Additionally, it may be superimposed on chronic hypertension, and its phenotype can further vary based on the presence of fetal growth restriction and/or HELLP syndrome (hemolysis, elevated liver enzymes, low platelet count). This heterogeneity suggests that PE should be considered a syndrome rather than a single disease entity. Consequently, this complexity complicates the prediction, prophylaxis, and successful management of PE [12].
Although various theories have been proposed regarding the pathogenesis of PE, the most widely accepted model is the "two-stage model." According to this model, genetic, immunological, and acquired abnormalities contribute to inadequate remodeling of spiral arteries during early pregnancy, leading to impaired placental perfusion and resulting in placental ischemia (Stage 1). As pregnancy progresses, systemic endothelial dysfunction and vascular inflammation develop, leading to widespread and severe clinical manifestations (Stage 2) [13,14]. In Stage 1, starting from the 8th week of gestation, endovascular trophoblasts begin to replace maternal endothelial cells, allowing spiral arterioles to communicate with the intervillous space. This invasion progresses in a stepwise manner, reaching the myometrial segment of the spiral arteries after the 14th week of gestation [15]. By 20-22 weeks of gestation, endovascular and interstitial trophoblast invasion is completed and remains limited to the inner third of the myometrium. At this stage, interstitial trophoblast cells that fail to reach the perivascular space halt their migration [16]. Inadequate remodeling during this initial stage lays the foundation for PE. Various cytokines, growth factors, chemokines, and adhesion molecules have been identified as key players in this process, some of which are currently used as biomarkers for disease prediction. In Stage 2, systemic endothelial dysfunction leads to oxidative stress and an imbalance involving vascular endothelial growth factor (VEGF), placental growth factor (PlGF), soluble fms-like tyrosine kinase-1 (sFlt-1), the renin-angiotensin-aldosterone system, and other inflammatory mediators, ultimately resulting in the clinical manifestations of PE [17]. Changes in serum levels of these factors are utilized in PE prediction.
The cardiovascular and renal systems are the most affected by PE, with the presence of pre-existing kidney disease increasing susceptibility to PE. PE has been identified as the most frequently studied glomerular pathology worldwide [9]. Normal pregnancy is characterized by fundamental physiological adaptations in renal function, which are altered in PE. During pregnancy, renal glomerular hyperfiltration occurs, facilitated by nitric oxide-mediated vasodilation induced by relaxin, leading to an approximately 80% increase in effective renal plasma flow [18]. Consequently, the glomerular filtration rate (GFR) increases by approximately 50%, resulting in a 0.4 mg/dL reduction in serum creatinine levels [19]. In normal pregnancy, serum creatinine levels typically range between 0.4 and 0.8 mg/dL, and a level of 1 mg/dL or higher is indicative of renal dysfunction in pregnant women [20]. Expanding upon this knowledge, our study identified a cut-off value of 0.58 mg/dL for serum creatinine, beyond which the risk of PE development significantly increased (AUC 0.644, 95% CI, 0.574-0.751, p<0.001). Similarly, elevated blood urea nitrogen (BUN) levels (cut-off 16.2 mg/dL) were also associated with an increased risk of PE, albeit with a lower predictive accuracy (AUC 0.614, 95% CI, 0.539-0.689, p=0.002).
Each year, PE accounts for approximately 70,000 maternal deaths and 500,000 neonatal deaths worldwide [21]. Moreover, women who have experienced PE remain at an increased risk of developing chronic hypertension, end-stage renal disease, stroke, metabolic syndrome, and cognitive impairments later in life. Additionally, children born to mothers with PE are at higher risk of neurodevelopmental disorders, hypertension, diabetes, and coronary artery disease [22,23]. Therefore, identifying asymptomatic women at high risk for PE is of paramount importance. Once diagnosed, treatment primarily consists of antihypertensive therapy, magnesium sulfate for seizure prophylaxis in severe cases, and ultimately, the timely termination of pregnancy remains the only definitive intervention.
Currently, the most effective screening approach relies on a combination of maternal history-based risk factors, mean arterial pressure (MAP), uterine artery pulsatility index (UtA-PI), and PlGF, performed during the first trimester. Initiation of low-dose aspirin prophylaxis before the 16th week of gestation has been shown to reduce the incidence of preterm PE by 62%. However, this screening method is not yet optimal. While it has a high detection rate for early-onset PE (90%) and preterm PE (75%) with a 10% false-positive rate, its accuracy drops significantly for term PE (41%) [24]. Although highly effective for early-onset PE, it should be noted that approximately 80% of PE cases present as late-onset PE [12]. Consequently, efforts to refine prediction models for later stages of pregnancy are ongoing. Second-trimester screening methods are less well-established but generally involve extending first-trimester screening parameters. A 2016 study including 7,748 singleton pregnancies assessed maternal risk factors, MAP, UtA-PI, and PlGF between 19-24 weeks, yielding detection rates of 99%, 85%, and 46% for PE developing before 32 weeks, before 37 weeks, and at term, respectively, with a 10% false-positive rate [25]. These results highlight the persistent challenge in accurately predicting term PE, emphasizing the need for further research. In the third trimester, individualized risk assessment models have demonstrated superior performance compared to the sFlt-1/PlGF ratio alone [26]. A prospective study conducted in 2022 involving 29,677 pregnancies reported that screening at 35-37 weeks using maternal risk factors, MAP, UtA-PI, and PlGF detected PE with a sensitivity of 79% (AUC 0.923) at a 10% false-positive rate [8]. Another study in 2022 evaluated 1,014 pregnancies diagnosed with gestational hypertension between 23-35 weeks, demonstrating that an sFlt-1/PlGF ratio exceeding 40 pg/mL predicted severe PE development within two weeks with 94% sensitivity, 75% specificity, 65% positive predictive value, and 96% negative predictive value [27].
Regardless of whether it is used in general screening or during the second and third trimesters, no single predictive marker is sufficient for PE detection. This is due to the complex, multifactorial nature of PE, which remains incompletely understood. Consequently, research continues to identify potential biochemical and biophysical markers that can enhance prediction models. This has led to the development of "combined models," integrating multiple markers to improve predictive accuracy [24]. A single-marker approach yields limited results; for example, a model based solely on maternal risk factors detects early PE, late PE, and gestational hypertension with detection rates of 89.2%, 93%, and 85%, respectively, but with a high false-positive rate of 64.1% [28]. Similarly, using uterine artery pulsatility index alone detects early-onset PE at a rate of 77% and late-onset PE at 27%, with a 10% false-positive rate [29].
In studies predicting early-onset preeclampsia (PE) using placental growth hormone (PlGH), the detection rate was 72% with a 10% false-positive rate. However, when maternal serum pregnancy-associated plasma protein-A (PAPP-A), mean arterial pressure (MAP), and uterine artery pulsatility index (UtA-PI) were also included, the detection rate increased to 96% [30]. A meta-analysis evaluating MAP as a predictive marker for PE reported an AUC of 0.76 (95% CI, 0.70-0.82) [31]. In our study, BUN showed a modest predictive power for PE with an AUC of 0.614 (p=0.002), a cut-off value of 16.2 mg/dL, and a sensitivity of 52.9% with a specificity of 74%. Although its sensitivity is relatively low, its specificity is acceptable. Creatinine demonstrated slightly stronger predictive capability, with an AUC of 0.644 (p<0.001), a cut-off value of 0.58 mg/dL, a sensitivity of 37.2%, and a specificity of 88%. While the specificity is high, the low sensitivity indicates that creatinine alone is insufficient for identifying all cases of PE. Additionally, the BUN/creatinine ratio did not yield a significant AUC value (p>0.05), indicating that it is not a useful biomarker for PE prediction.
We acknowledge that in a syndrome as heterogeneous as PE, utilizing only a few markers may not yield definitive predictive results. However, if these parameters are incorporated into combined predictive models in future studies, they may contribute to improving PE detection rates. Furthermore, blood urea nitrogen (BUN) and serum creatinine levels, which reflect renal function, are routinely used clinical parameters that do not require specialized biochemical assay kits for measurement. They are inexpensive, widely available, and easily accessible. From this perspective, these markers could provide a cost-effective and practical window for PE prediction without imposing additional financial burdens.
Our study has several strengths. First, since it was conducted on patients presenting to our clinic, the entire study process was under our control. The same clinical researchers diagnosed PE according to clinical and laboratory guidelines, ensuring consistency across different phenotypes. To ensure reliability, we followed standardized laboratory measurement protocols and adhered to ACOG diagnostic criteria. Additionally, all laboratory assessments were performed in accordance with the standards set by the Ministry of Health’s biochemistry laboratory. From this perspective, the studied parameters were analyzed using standardized and shared laboratory equipment, enhancing the reliability of the results. One of the key strengths of our study is its focus on BUN and creatinine, which are cost-effective and widely available clinical parameters, making them accessible for routine screening.
Nevertheless, our study also has some limitations. First, the study population was limited to patients from a single city, indicating a need for larger sample sizes in future research. Moreover, the retrospective nature of the study highlights the necessity for further prospective investigations in this field. Additionally, our study evaluated all PE cases collectively, without stratifying them based on severity or gestational age at onset. For these reasons, our study should be considered preliminary, and new, more comprehensive studies should be planned to further investigate these findings.
Our findings present a hypothetical perspective on second-trimester prediction of preeclampsia. To validate our results, larger multicenter studies should be planned. Additionally, further research should include diverse patient populations with different racial and socioeconomic backgrounds to enhance the generalizability of the findings.
5. Conclusion
We demonstrated that mid-trimester blood urea nitrogen (BUN) and serum creatinine levels are elevated in cases that develop preeclampsia. Future research should explore multimodal prediction models, prospective validation, and stratification based on PE phenotypes to enhance the clinical utility of these biomarkers.
Author Contributions
Conceptualization, E.C.K, S.B.K.; methodology, E.C.K, C.A, M.D.; validation, E.C.K, I.B. M.A.H.; formal analysis, M.D, C.S., A.S., B.T; investigation, M.D., M.O, B.T.; resources, E.C.K., C.A., M.A.H.; data curation, E.C.K., C.A., M.O., M.D.; writing—original draft preparation, E.C.K., S.B.K.,; writing—review and editing, E.C.K., S.B.K., M.A.H.; supervision, I.B., C.S., A.S. All authors have read and agreed to the published version of the manuscript.
Funding
This research received no external funding.
Institutional Review Board Statement
This research was conducted in accordance with the Ethics Committee of the Firat University Scientific Research and Publication Ethics Board (2022/11-02).
Informed Consent Statement
A waiver of informed consent was granted due to the retrospective design.
Data Availability Statement
Datasets generated or analyzed in this study are accessible upon reasonable request from the corresponding author.
Conflicts of Interest
The authors declare no conflicts of interest.
Abbreviations
The following abbreviations are used in this manuscript:
| PE | Preeclampsia |
| BUN | Blood urea nitrogen |
| ACOG | American College of Obstetricians and Gynecologists |
| SPSS | Statistical Package for the Social Sciences |
| ORs | Odds ratios |
| Cis | Confidence intervals |
| ROC | Receiver operating characteristic |
| AUC | Area under the curve |
| PPV | Positive predictive value |
| NPV | Negative predictive value |
References
- Duley, L. The global impact of pre-eclampsia and eclampsia. Semin. Perinatol. 2009, 33, 130–137. [Google Scholar]
- Say, L.; Chou, D.; Gemmill, A.; Tunçalp, Ö.; Moller, A. B.; Daniels, J.; Gülmezoglu, A. M.; Temmerman, M.; Alkema, L. Global causes of maternal death: a WHO systematic analysis. Lancet Glob. Health 2014, 2, 323–333. [Google Scholar]
- Rana, S.; Lemoine, E.; Granger, J. P.; Karumanchi, S. A. Preeclampsia: Pathophysiology, Challenges, and Perspectives. Circ. Res. 2019, 124, 1094–1112. [Google Scholar] [PubMed]
- Serra, B.; Mendoza, M.; Scazzocchio, E.; Meler, E.; Nolla, M.; Sabrià, E.; Rodríguez, I.; Carreras, E. A new model for screening for early-onset preeclampsia. Am. J. Obstet. Gynecol. 2020, 222, 608. [Google Scholar] [CrossRef]
- van der Merwe, J. L.; Hall, D. R.; Wright, C.; Schubert, P.; Grove, D. Are early and late preeclampsia distinct subclasses of the disease–what does the placenta reveal? Hypertens. Pregnancy 2010, 29, 457–467. [Google Scholar] [PubMed]
- US Preventive Services Task Force. Screening for Preeclampsia: US Preventive Services Task Force Recommendation Statement. JAMA 2017, 317, 1661. [Google Scholar]
- Litwinska, M.; Litwinska, E.; Astudillo, A.; Syngelaki, A.; Wright, A.; Nicolaides, K. H. Stratification of pregnancy care based on risk of pre-eclampsia derived from biophysical and biochemical markers at 19–24 weeks' gestation. Ultrasound Obstet. Gynecol. 2021, 58, 360–368. [Google Scholar]
- Döbert, M.; Wright, A.; Varouxaki, A. N.; Mu, A. C.; Syngelaki, A.; Rehal, A.; Delgado, J. L.; Akolekar, R.; Muscettola, G.; Janga, D.; Singh, M.; Martin-Alonso, R.; Dütemeyer, V.; De Alvarado, M.; Atanasova, V.; Wright, D.; Nicolaides, K. H. STATIN trial: predictive performance of competing-risks model in screening for pre-eclampsia at 35–37 weeks' gestation. Ultrasound Obstet. Gynecol. 2022, 59, 69–75. [Google Scholar]
- van der Graaf, A. M.; Toering, T. J.; Faas, M. M.; Lely, A. T. From preeclampsia to renal disease: a role of angiogenic factors and the renin-angiotensin aldosterone system? Nephrol. Dial. Transplant. 2012, 27, iii51–iii57. [Google Scholar] [CrossRef]
- American College of Obstetricians and Gynecologists (ACOG). ACOG Practice Bulletin No. 222: Gestational Hypertension and Preeclampsia. Obstet. Gynecol. 2020, 135, 237–260. [Google Scholar]
- Gathiram, P.; Moodley, J. Pre-eclampsia: its pathogenesis and pathophysiology. Cardiovasc. J. Afr. 2016, 27, 71–78. [Google Scholar] [PubMed]
- Myatt, L. The prediction of preeclampsia: the way forward. Am. J. Obstet. Gynecol. 2022, 226, S1102–S1107e8. [Google Scholar] [PubMed]
- Pankiewicz, K.; Fijałkowska, A.; Issat, T.; Maciejewski, T. M. Insight into the key points of preeclampsia pathophysiology: uterine artery remodeling and the role of microRNAs. Int. J. Mol. Sci. 2021, 22, 3132. [Google Scholar] [CrossRef]
- Redman, C. W.; Sargent, I. L. Latest advances in understanding preeclampsia. Science 2005, 308, 1592–1594. [Google Scholar]
- Pijnenborg, R.; Dixon, G.; Robertson, W. B.; Brosens, I. Trophoblastic invasion of human decidua from 8 to 18 weeks of pregnancy. Placenta 1980, 1, 3–19. [Google Scholar]
- Sato, Y.; Fujiwara, H.; Konishi, I. Mechanism of maternal vascular remodeling during human pregnancy. Reprod. Med. Biol. 2012, 11, 27–36. [Google Scholar] [PubMed]
- Kornacki, J.; Olejniczak, O.; Sibiak, R.; Gutaj, P.; Wender-Ożegowska, E. Pathophysiology of pre-eclampsia: two theories of the development of the disease. Int. J. Mol. Sci. 2023, 25, 307. [Google Scholar] [CrossRef]
- Conrad, K. P.; Davison, J. M. The renal circulation in normal pregnancy and preeclampsia: is there a place for relaxin? Am. J. Physiol. Ren. Physiol. 2014, 306, F1121–F1135. [Google Scholar]
- Dunlop, W. Serial changes in renal hemodynamics during normal human pregnancy. BJOG 1981, 88, 1–9. [Google Scholar]
- Gonzalez Suarez, M. L.; Kattah, A.; Grande, J. P.; Garovic, V. Renal disorders in pregnancy: core curriculum 2019. Am. J. Kidney Dis. 2019, 73, 119–130. [Google Scholar]
- Kuklina, E. V.; Ayala, C.; Callaghan, W. M. Hypertensive disorders and severe obstetric morbidity in the United States. Obstet. Gynecol. 2009, 113, 1299–1306. [Google Scholar] [CrossRef] [PubMed]
- McKinney, D.; Boyd, H.; Langager, A.; Oswald, M.; Pfister, A.; Warshak, C. R. The impact of fetal growth restriction on latency in the setting of expectant management of preeclampsia. Am. J. Obstet. Gynecol. 2016, 214, 395.e1–e7. [Google Scholar] [CrossRef] [PubMed]
- Hammad, I. A.; Meeks, H.; Fraser, A.; Theilen, L. H.; Esplin, M. S.; Smith, K. R.; Varner, M. W. Risks of cause-specific mortality in offspring of pregnancies complicated by hypertensive disease of pregnancy. Am. J. Obstet. Gynecol. 2020, 222, 75.e1–e9. [Google Scholar] [CrossRef] [PubMed]
- Lee, N. M. W.; Chaemsaithong, P.; Poon, L. C. Prediction of preeclampsia in asymptomatic women. Best Pract. Res. Clin. Obstet. Gynaecol. 2024, 92, 102436. [Google Scholar] [CrossRef]
- Gallo, D. M.; Wright, D.; Casanova, C.; Campanero, M.; Nicolaides, K. H. Competing risks model in screening for preeclampsia by maternal factors and biomarkers at 19–24 weeks' gestation. Am. J. Obstet. Gynecol. 2016, 214, 619.e1–e17. [Google Scholar] [CrossRef]
- Tan, M. Y.; Wright, D.; Syngelaki, A.; Akolekar, R.; Cicero, S.; Janga, D.; Singh, M.; Greco, E.; Wright, A.; Maclagan, K.; Poon, L. C.; Nicolaides, K. H. Comparison of diagnostic accuracy of early screening for pre-eclampsia by NICE guidelines and a method combining maternal factors and biomarkers: results of SPREE. Ultrasound Obstet. Gynecol. 2018, 51, 743–750. [Google Scholar] [CrossRef]
- Thadhani, R.; Lemoine, E.; Rana, S.; Costantine, M. M.; Calsavara, V. F.; Boggess, K.; Wylie, B. J.; Moore Simas, T. A.; Louis, J. M.; Espinoza, J.; Gaw, S. L.; Murtha, A.; Wiegand, S.; Gollin, Y.; Singh, D.; Silver, R. M.; Durie, D. E.; Panda, B.; Norwitz, E. R.; Burd, I.; Plunkett, B.; Scott, R. K.; Gaden, A.; Bautista, M.; Chang, Y.; Diniz, M. A.; Karumanchi, S. A.; Kilpatrick, S. Circulating angiogenic factor levels in hypertensive disorders of pregnancy. NEJM Evid. 2022, 1, EVIDoa2200161. [Google Scholar] [CrossRef]
- O'Gorman, N.; Wright, D.; Poon, L. C.; Rolnik, D. L.; Syngelaki, A.; Nicolaides, K. H. Multicenter screening for pre-eclampsia by maternal factors and biomarkers at 11–13 weeks' gestation: comparison with NICE guidelines and ACOG recommendations. Ultrasound Obstet. Gynecol. 2017, 49, 756–760. [Google Scholar] [CrossRef]
- Plasencia, W.; Maiz, N.; Poon, L.; Yu, C.; Nicolaides, K. H. Uterine artery Doppler at 11+0 to 13+6 weeks and 21+0 to 24+6 weeks in the prediction of pre-eclampsia. Ultrasound Obstet. Gynecol. 2008, 32, 138–146. [Google Scholar] [CrossRef]
- Poon, L. C.; Nicolaides, K. H. Early prediction of preeclampsia. Obstet. Gynecol. Int. 2014, 2014, 297397. [Google Scholar] [CrossRef]
- Cnossen, J. S.; Vollebregt, K. C.; de Vrieze, N.; ter Riet, G.; Mol, B. W.; Franx, A.; Khan, K. S.; van der Post, J. A. Accuracy of mean arterial pressure and blood pressure measurements in predicting pre-eclampsia: systematic review and meta-analysis. BMJ 2008, 336, 1117–1120. [Google Scholar] [PubMed]
Figure 1.
Boxplot graph of the creatinine parameter. n. number, G. group, a, b and c show that there is a significant difference between the median values, p< 0.05, Kruskall Wallis variance analysis.
Figure 1.
Boxplot graph of the creatinine parameter. n. number, G. group, a, b and c show that there is a significant difference between the median values, p< 0.05, Kruskall Wallis variance analysis.
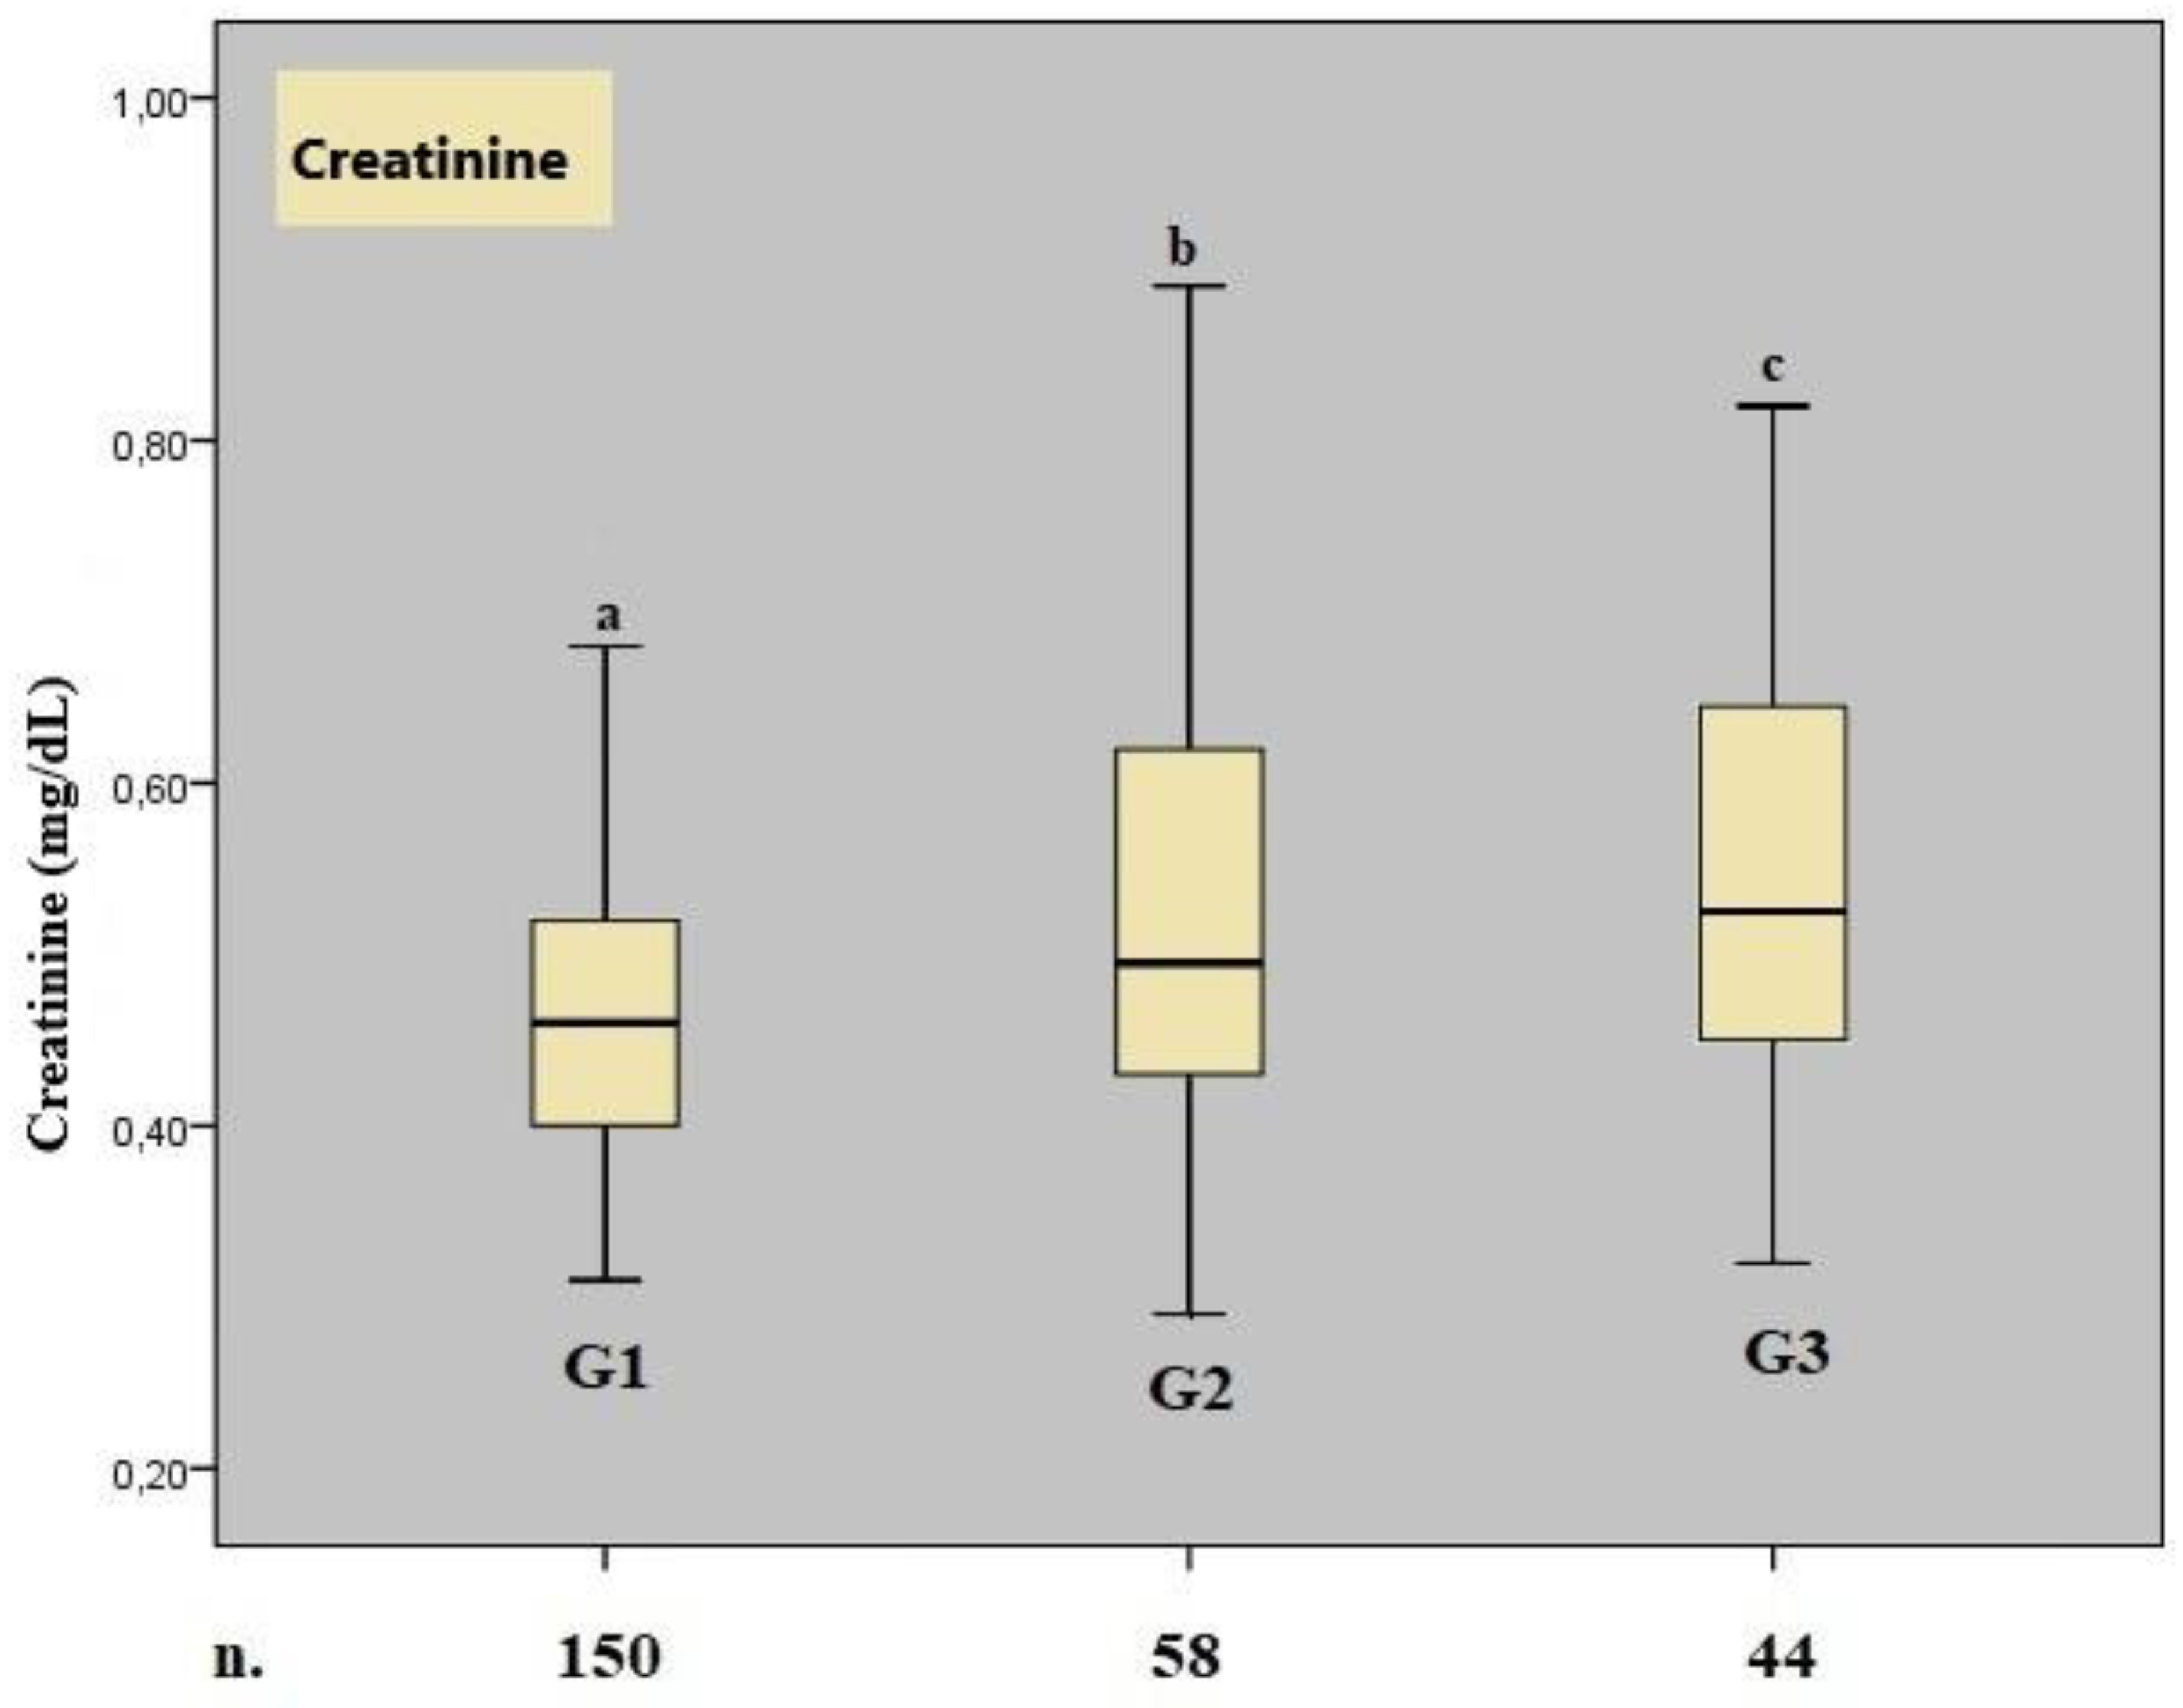
Figure 2.
ROC curves for BUN, serum creatinine, and BUN/creatinine values.
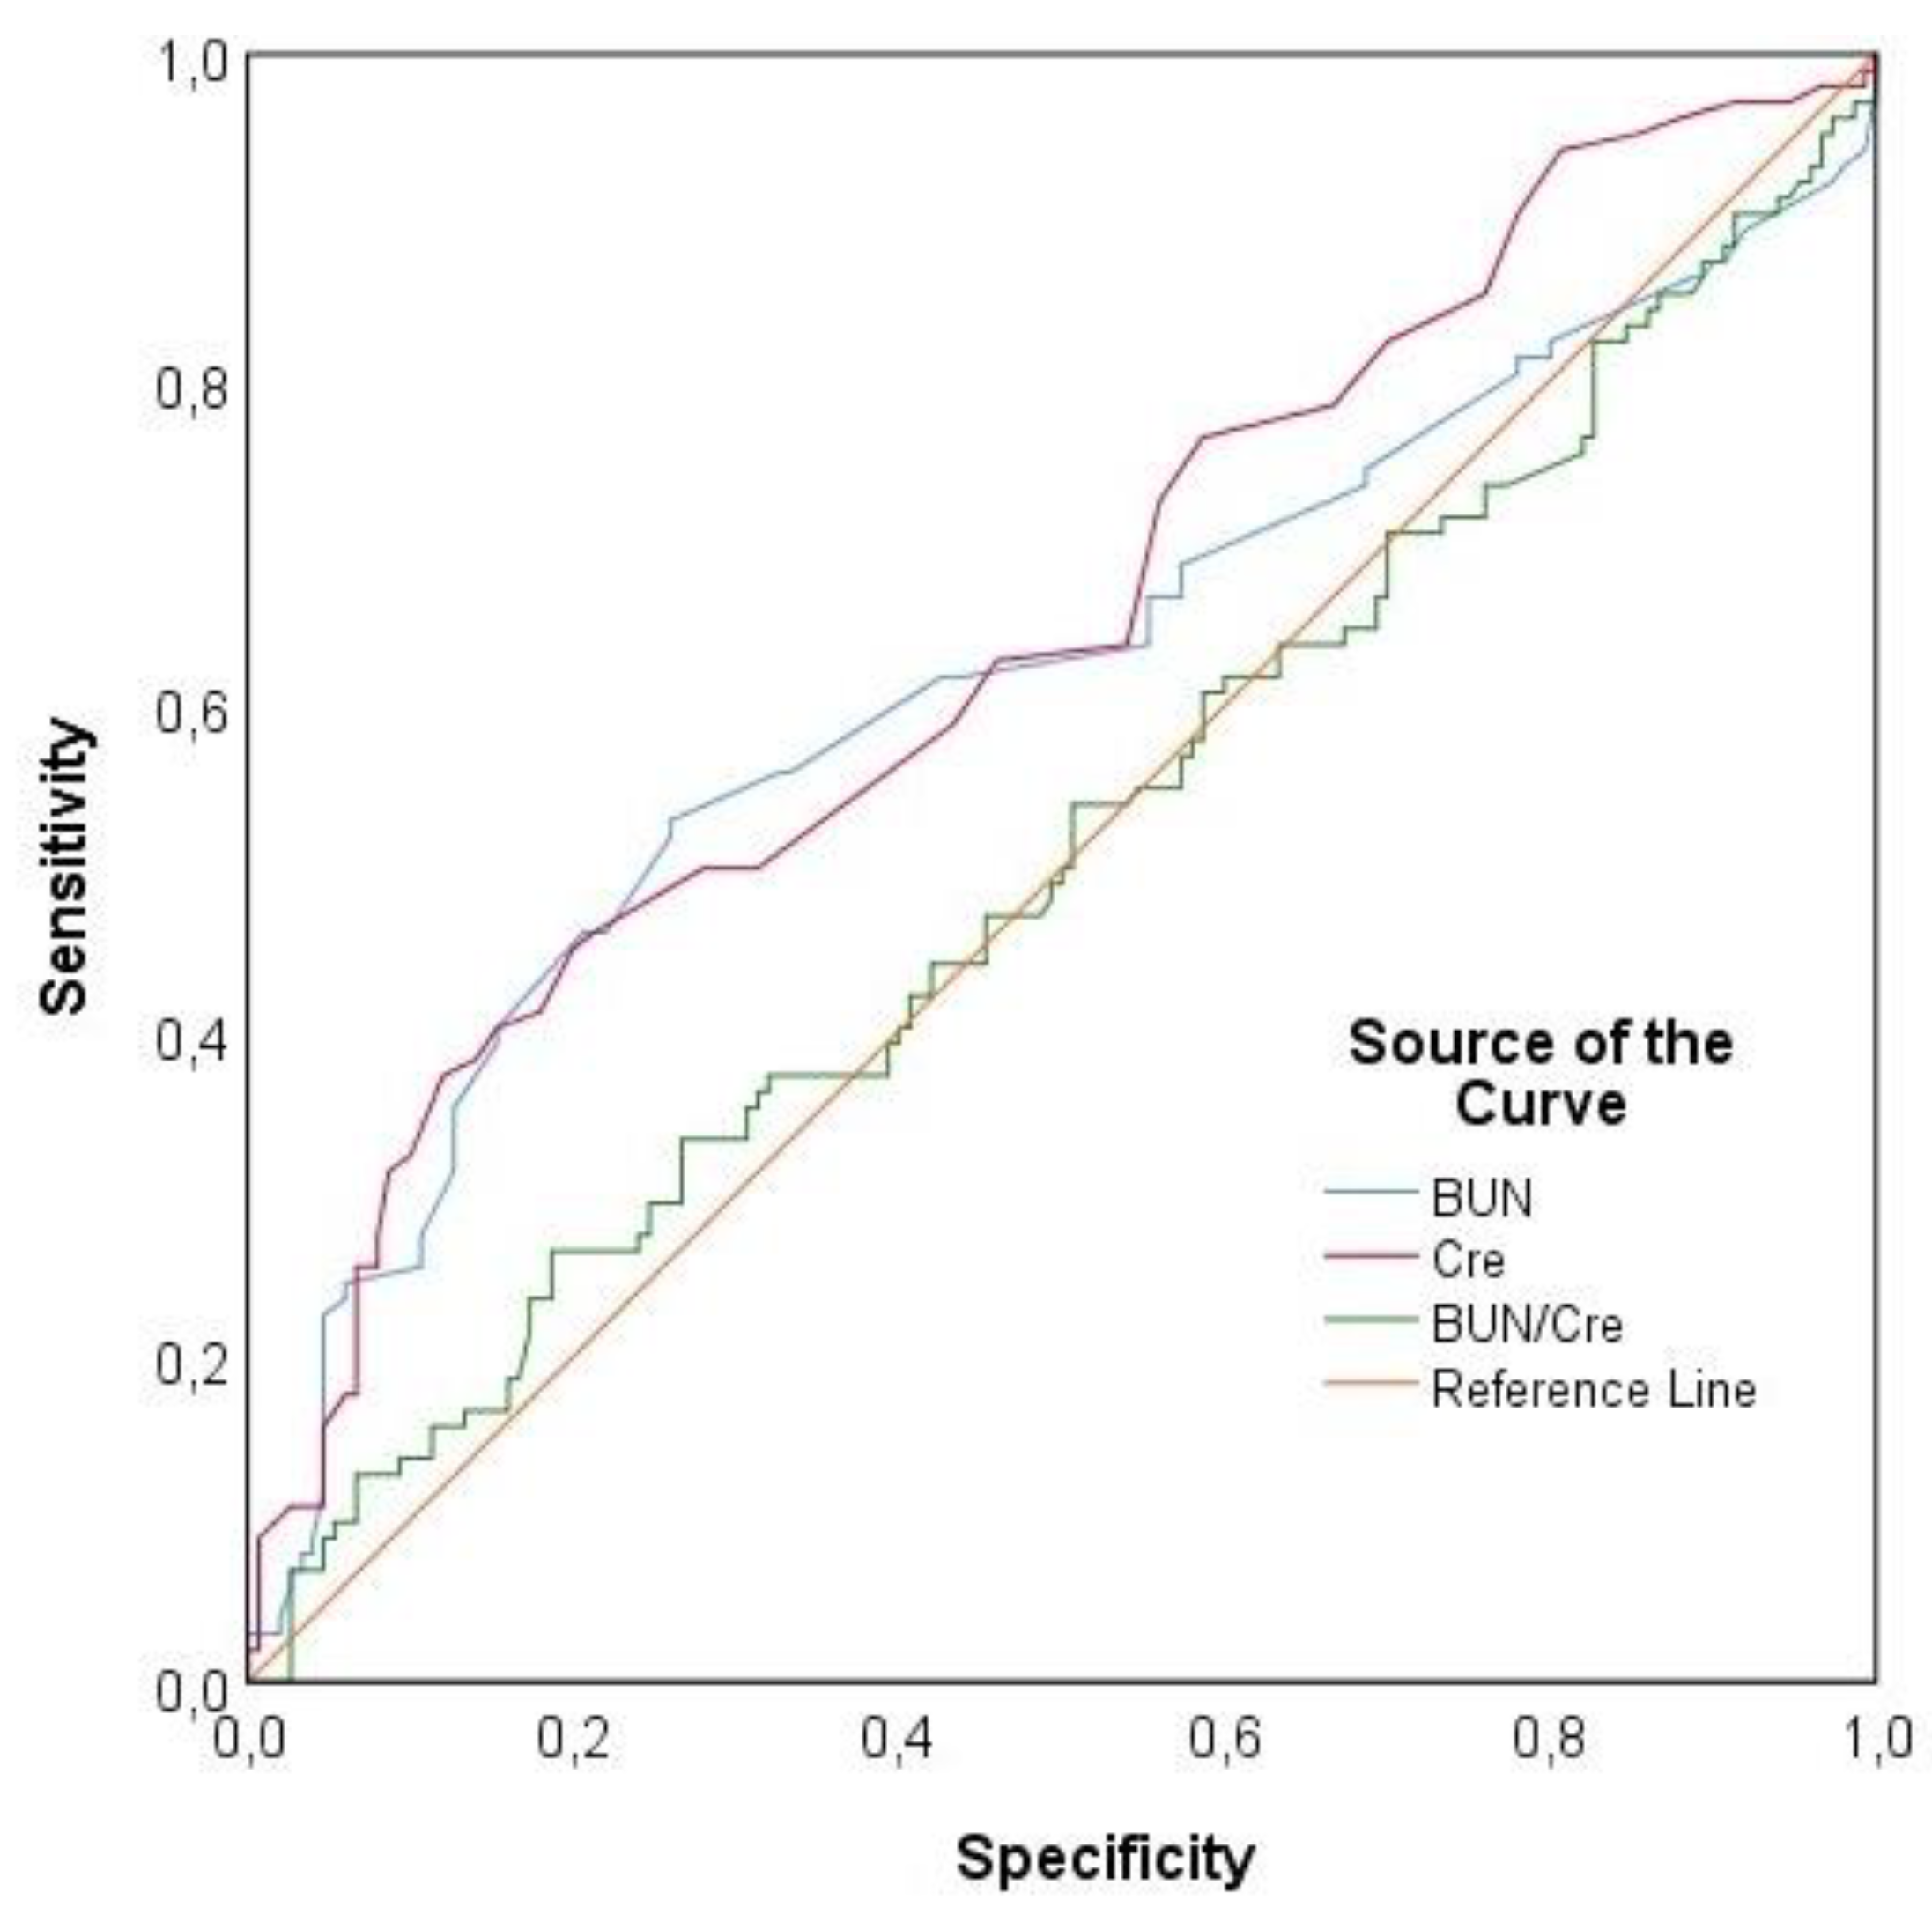

Table 1.
Comparison of Gravidity and Parity Among Groups.
|
Parameters |
Group 1 (%) | Group 2 (%) | Group 3 (%) | Total (%) | p value* |
|---|---|---|---|---|---|
| Gravida (number) | |||||
| 1 | 108 (72) | 39 (67,2) | 33 (75) | 180 (71,4) | 0.851 |
| 2 | 27 (18) | 13 (22,4) | 6 (13,6) | 46 (18,3) | |
| 3 | 15 (10) | 6 (10,3) | 5 (11,4) | 26 (10,3) | |
| Parity (number) | |||||
| 0 | 124 (82,7) | 44 (77,2) | 35 (79,5) | 203 (80,9) | 0.907 |
| 1 | 23 (15,3) | 11 (19,3) | 8 (18,2) | 42 (16,7) | |
| 2 | 3 (2) | 2 (3,5) | 1 (2,3) | 6 (2,4) |
*: Chi-square test, frequency (%).
Table 2.
Comparison of Obstetric and Demographic Data Along with Renal Parameters Among Groups.
|
Parameters |
Group 1 | Group 2 | Group 3 | p* value |
|---|---|---|---|---|
| GW (weeks) |
20,91±1,84 |
20,84±1,83 |
20,77±1,52 |
0,959 |
| 21,00 (18,00 - 24,00) | 21,00 (18,00 - 24,00) | 21,00 (18,00 - 24,00) | ||
| BMI (kg/m2) |
24,08±1,14 |
24,15±0,97 |
24,23±0,99 |
0,739 |
| 24,10 (21,60 - 26,70) | 24,15 (21,80 - 26,70) | 24,15 (22,40 - 26,70) | ||
| Age (years) |
27,05±4,47 |
25,98±4,17 |
26,45±5,21 |
0,299 |
| 26,00 (18,00 - 34,00) | 27,00 (19,00 - 32,00) | 26,00 (18,00 - 34,00) | ||
| Birth Week (weeks) |
38.20±1.30 |
37.50±1.51 |
31.33±2.95 |
0.002 |
| 38.00 (38.00 - 40,00) | 37.00 (36.00 – 40.00) | 31.00 (28.00 – 37.00) | ||
| BUN (mg/dL) |
14,91±4,47 |
18,23±7,00 |
16,01±5,95 |
0,001 |
| 14,00 (8,00 - 34,32)a | 18,00 (5,00 - 42,00)b | 15,00 (8,00 - 41,00)ab | ||
| Crea. (mg/dL) |
0,47±0,10 |
0,53±0,14 |
0,55±0,15 |
<0,001 |
| 0,46 (0,31 - 0,95)a | 0,50 (0,29 - 0,89)b | 0,53 (0,32 - 1,00)b | ||
|
BUN/Crea. ratio |
32,26±9,69 |
34,87±11,89 |
29,52±9,21 |
0,031 |
| 30,92 (14,00 - 72,22)ab | 32,75 (7,58 - 61,54)a | 28,87 (9,76 - 60,29)b |
*: Kruskal-Wallis test; GW: gestational week, BMI: body mass index, BUN: blood urea nitrogen, Crea: serum creatinine. Groups sharing the same letters indicate no significant difference; data are presented as mean ± standard deviation, with median (minimum–maximum) values given in the lower row.
Table 3.
Analysis of Risk Factors Affecting Preeclampsia.
| Univariate | Multivariate 1 | Multivariate 2 | ||||
|---|---|---|---|---|---|---|
|
OR (%95 CI) |
p value | OR (%95 CI) | p value | OR (%95 CI) | p value | |
| BUN (mg/dL) |
1,083 (1,031 - 1,139) |
0,002 |
1,05 (0,996 - 1,108) |
0,069 |
--- |
--- |
| Crea. (mg/dL) |
112,344 (11,649 - 1083,416) |
<0,001 |
59,748 (5,214 - 684,706) |
0,001 |
--- |
--- |
|
BUN/Crea. ratio |
1,003 (0,979 - 1,028) |
0,818 |
--- |
--- |
1,002 (0,978 - 1,028) |
0,845 |
BUN: blood urea nitrogen, Crea: serum creatinine, OR: odds ratio, CI: confidence interval.
Table 4.
ROC Analysis Results of Renal Function Parameters.
|
Parameters |
Cut-off value | AUC (%95 CI) | P value | Sensitivity (%) | Specificity (%) | PPV (%) | NPV (%) |
|---|---|---|---|---|---|---|---|
|
BUN (mg/dL) |
≥16,2 |
0,614 (0,539 - 0,689) |
0,002 |
52,94 |
74 |
58,06 |
69,81 |
|
Crea. (mg/dL) |
≥0,58 |
0,644 (0,574 - 0,715) |
<0,001 |
37,25 |
88 |
67,86 |
67,35 |
|
BUN/Crea. ratio |
--- |
0,503 (0,429 - 0,577) |
0,936 |
--- |
--- |
--- |
--- |
BUN: blood urea nitrogen, Crea: serum creatinine, AUC: area under the curve, PPV: positive predictive value, NPV: negative predictive value.
Disclaimer/Publisher’s Note: The statements, opinions and data contained in all publications are solely those of the individual author(s) and contributor(s) and not of MDPI and/or the editor(s). MDPI and/or the editor(s) disclaim responsibility for any injury to people or property resulting from any ideas, methods, instructions or products referred to in the content. |
© 2025 by the authors. Licensee MDPI, Basel, Switzerland. This article is an open access article distributed under the terms and conditions of the Creative Commons Attribution (CC BY) license (http://creativecommons.org/licenses/by/4.0/).
Copyright: This open access article is published under a Creative Commons CC BY 4.0 license, which permit the free download, distribution, and reuse, provided that the author and preprint are cited in any reuse.


