Submitted:
16 March 2025
Posted:
17 March 2025
You are already at the latest version
Abstract
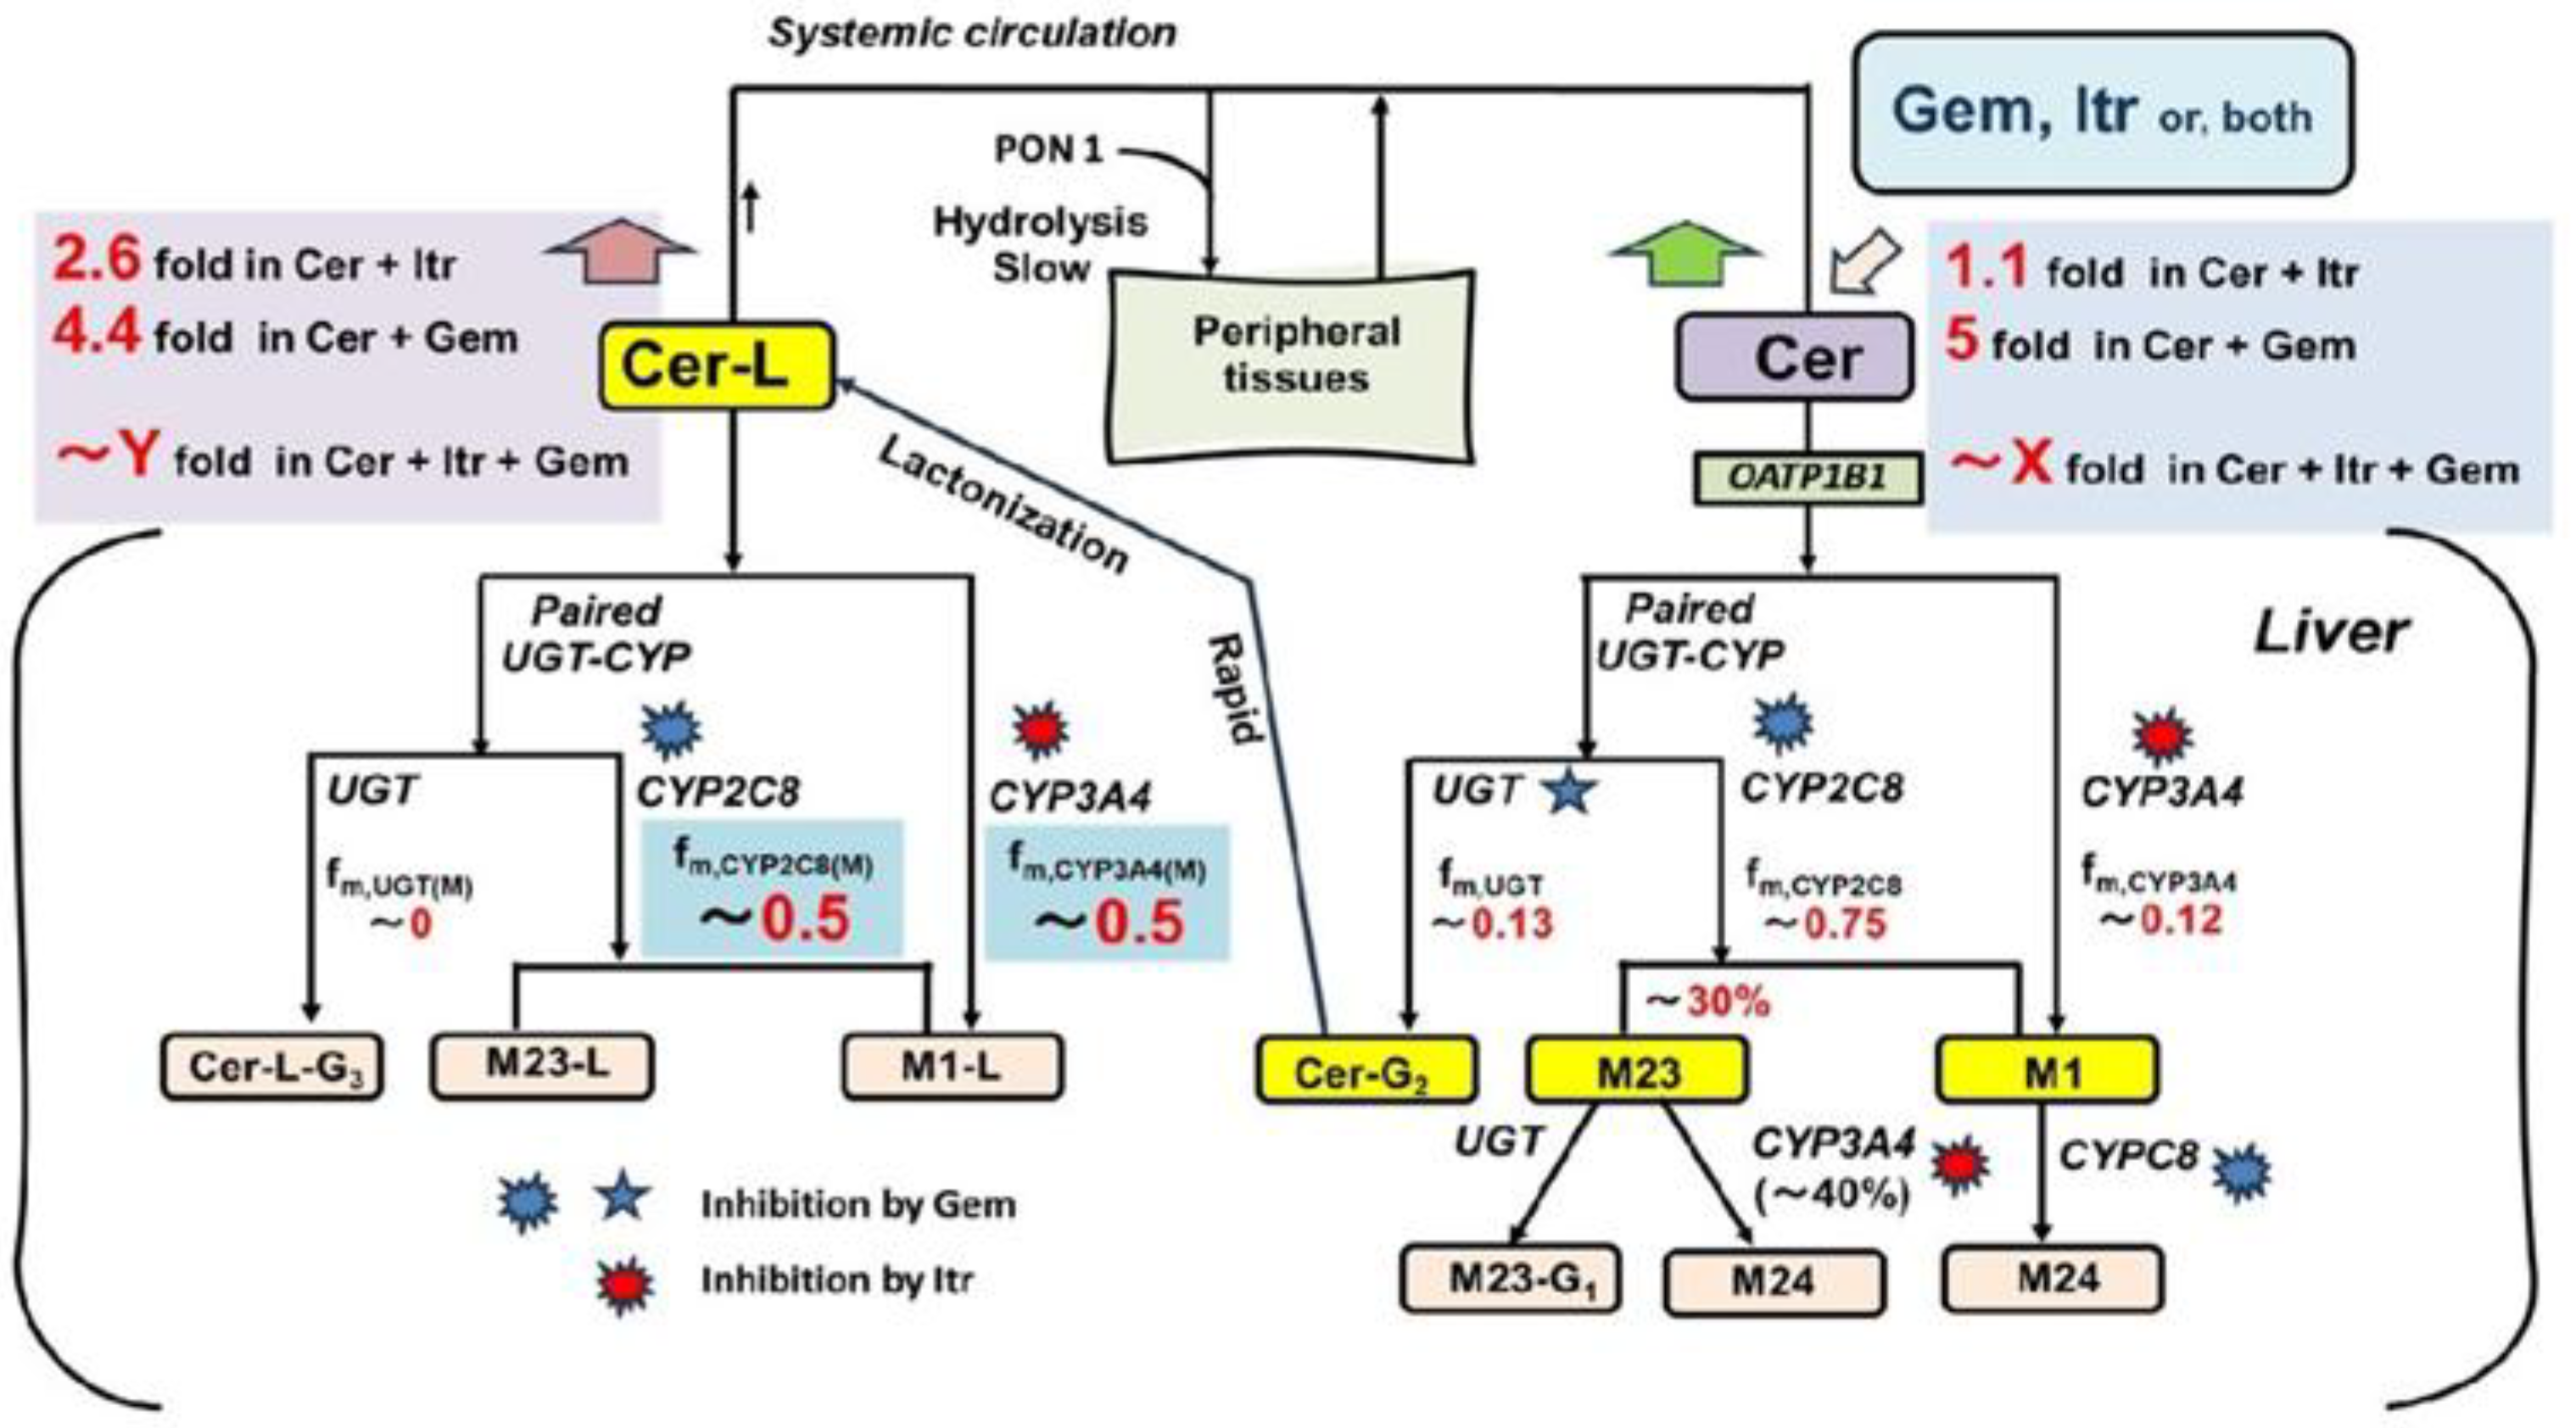
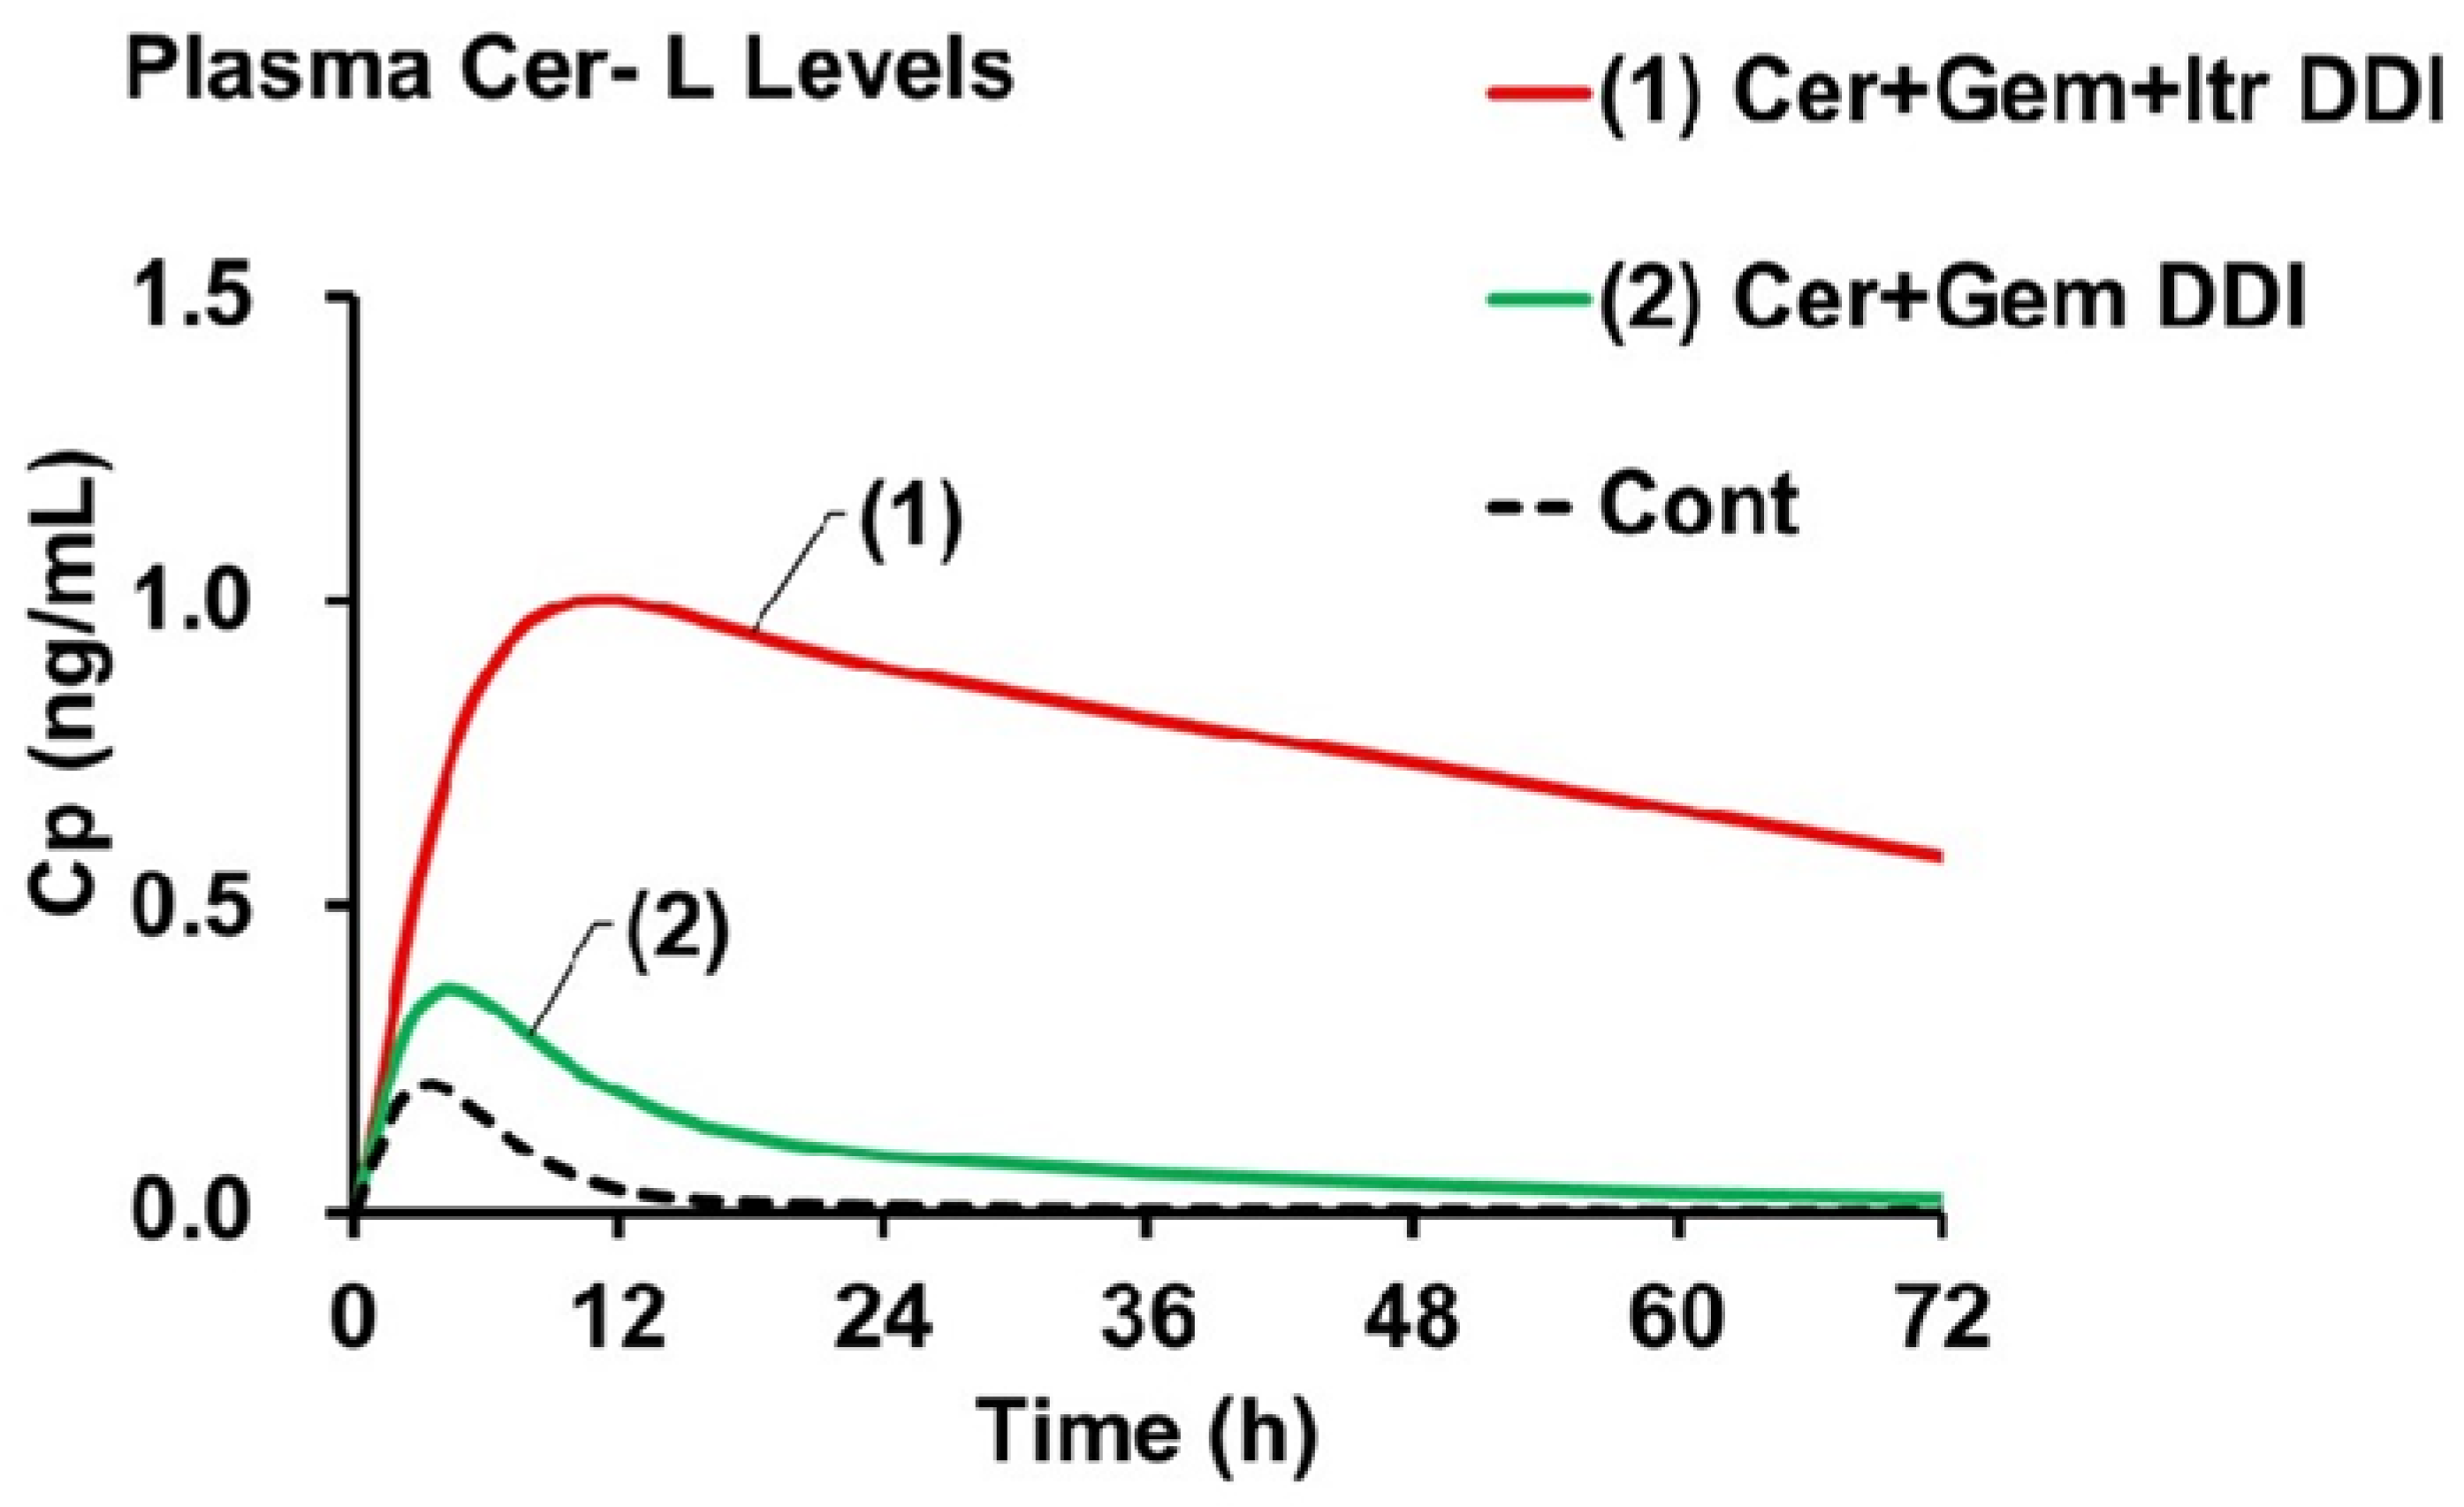
Background/Objective: This study investigates how drug-drug interactions (DDIs) with gemfibrozil (Gem), a potent CYP2C8 inhibitor, and itraconazole (Itr), a strong CYP3A4 inhibitor, affect the plasma levels of Cerivastatin (Cer) and its metabolites (M23, M1, and Cerivastatin lactone, Cer-L). The primary goal is to assess the risk of abnormal Cer-L elevation when Cer is co-administered with both Gem and Itr. Methods: We employed a newly developed Metabolite-Linked Model, which analyzes plasma metabolite levels by integrating the extent of formation (fM) and elimination rate (KeM) of both the parent drug and its metabolites. This model provides simultaneous analysis of Cer and its metabolites while determining the values for fM and KeM. Results: Simulated plasma concentrations of Cer and its metabolites in Cer + Gem and Cer + Itr DDIs matched observed data. The predicted area under the concentration-time curve ratios (AUCR) for Cer-L were 4.2 (Cer + Gem) and 2.1 (Cer + Itr), with KeM(+)/KeM ratios of 0.56 (Cer + Gem) and 0.53 (Cer + Itr), indicating elimination via CYP2C8 and CYP3A4, without involvement of other enzymes. In the Cer + Gem + Itr combination, the predicted AUCR for Cer-L was about 70, nearly seven times higher than the parent drug. Conclusions: These findings underscore the toxic risk associated with Cer, particularly due to fatal rhabdomyolysis when co-administered with both Gem and Itr, as a result of limited alternative pathways for Cer-L elimination. This pharmacokinetic model proves to be a valuable tool for as-sessing DDI risks and enhancing clinical drug development.
Keywords:
1. Introduction
2. Theory
2.1. Magnitude of DDI (AUCR or Ai,overall)
2.2. UGT–CYP2C8 Interplay Model [6]
2.3. Mechanistic Term for Ai,overall in the UGT–CYP2C8 Interplay Model
2.4. Perpetrator’s Specifc Inhibitory Activity (pAi)[6]
2.5. Static 2-Compartment Model for Time-Dependent Plasma Unchanged Drug Levels
2.6. Metabolite-Linked Model for Time-Dependent Plasma Metabolite Levels [6]
2.7. The Values of fM and fM(+) for the Metabolites
2.8. The Values of KeM and KeM(+) for the Metabolites
2.9. Relationship between Ai,overall(M) and fm(M)s to Elimination of M23, M1 and Cer-L
3. Results
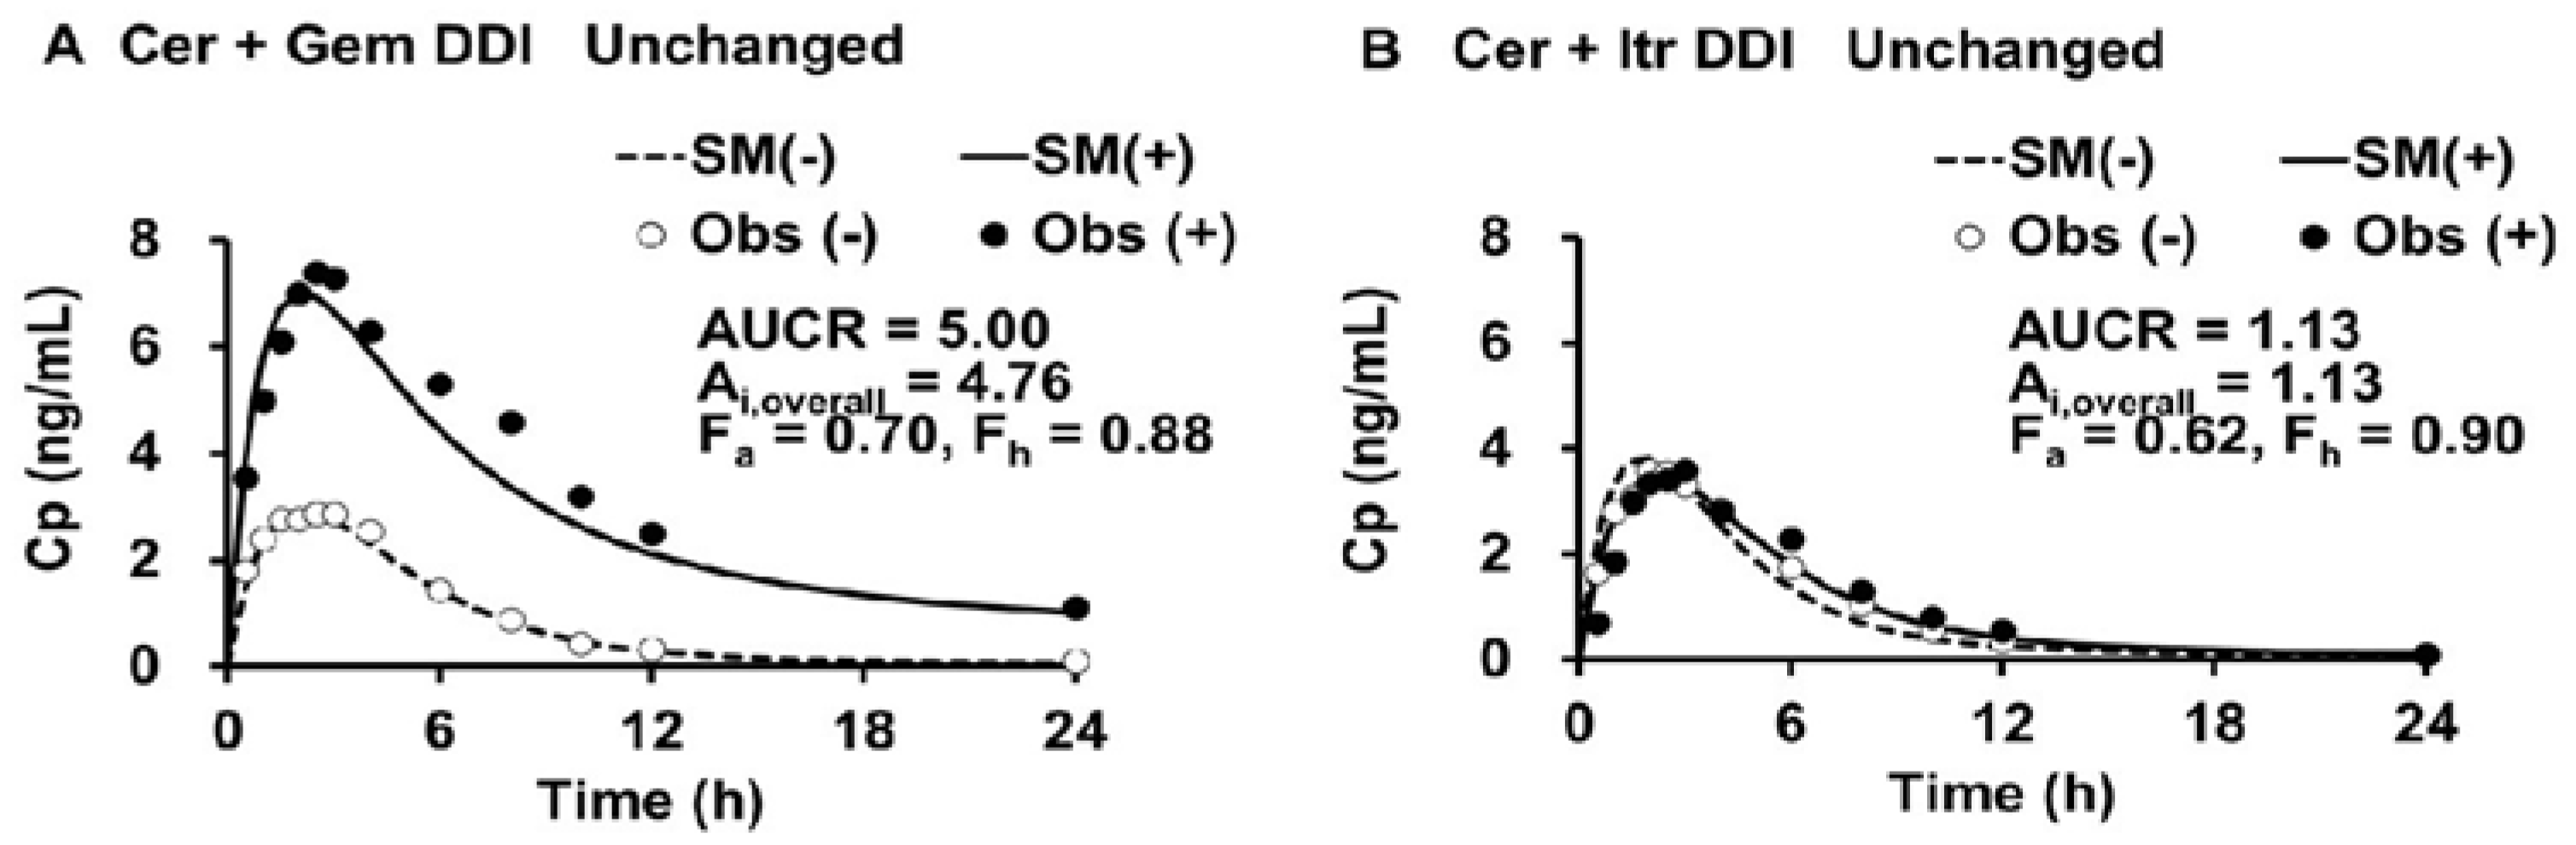
3.1. Simulated Cp(t) and Cp(t)(+) in the Cer + Gem and Cer + Itr DDIs, PK Parameters for Cer, and Ai,overall Values
3.2. PK Parameters for M23 and M1, and Cer-L
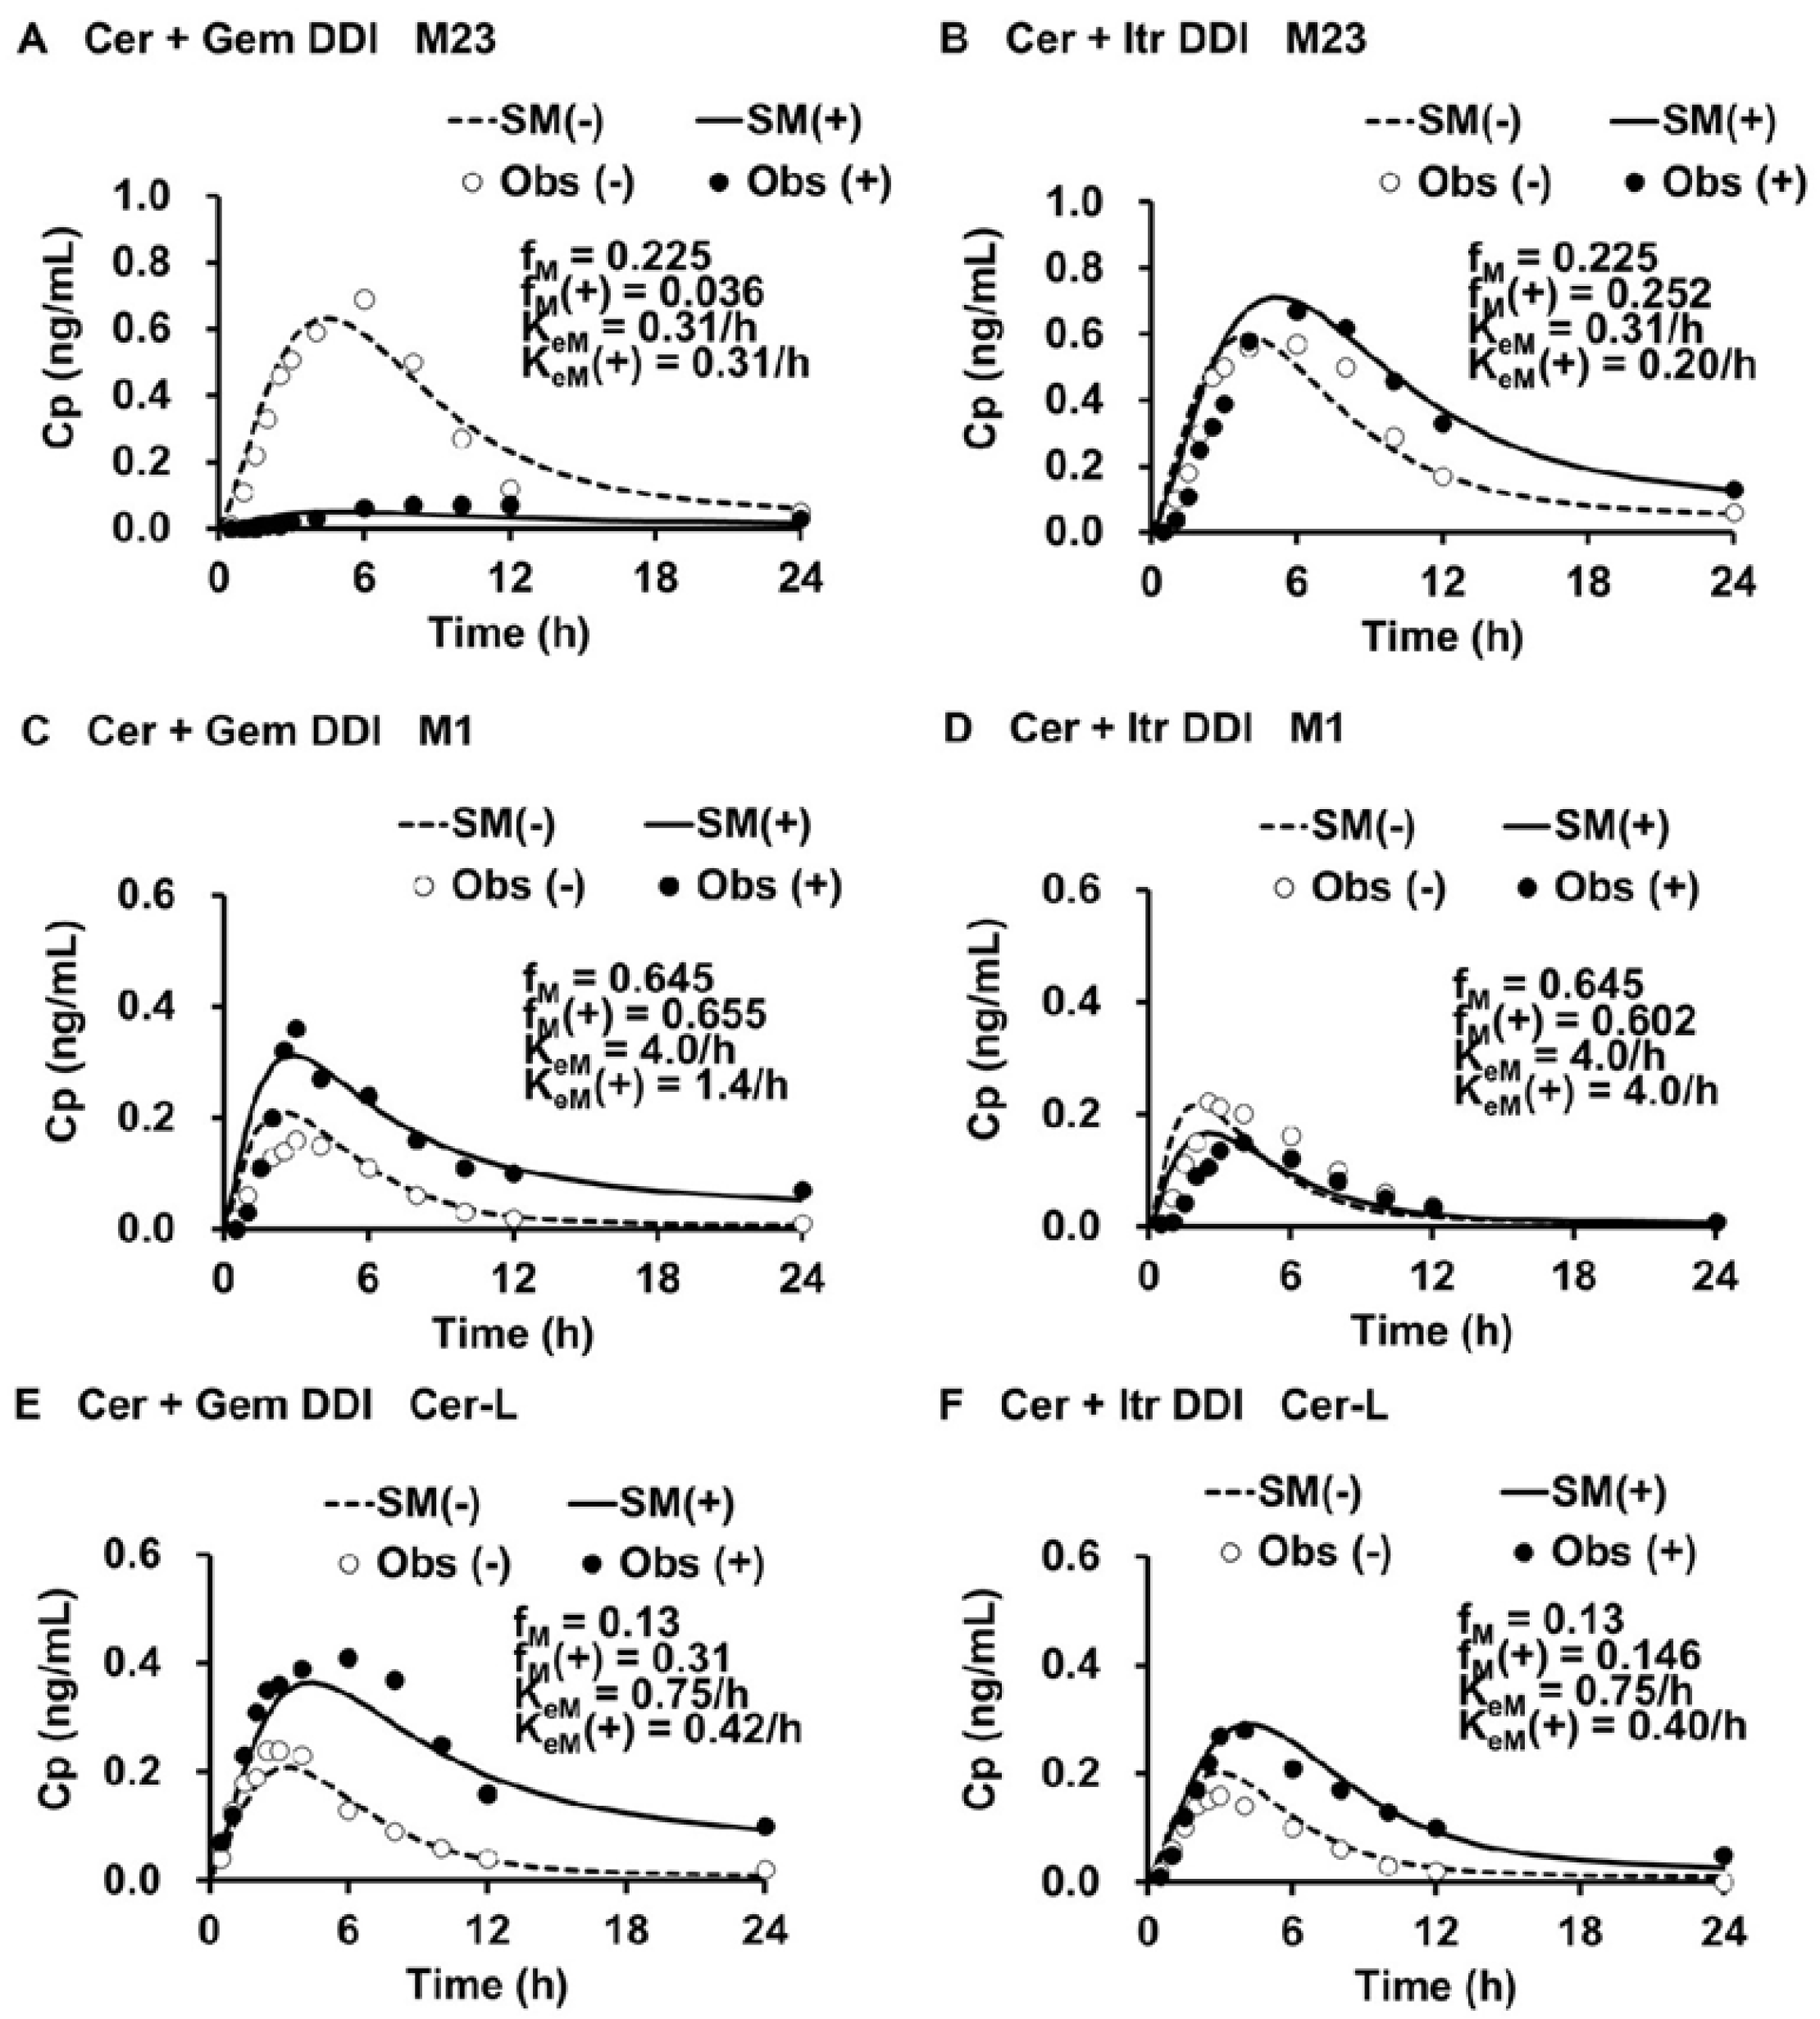
3.3. Simulated Cp,M(t) and Cp,M(t)(+), fM(+)/fM, and KeM(+)/KeM for each Metabolite in the Cer + Gem and Cer + Itr DDIs
3.4. Contribution of each Enzyme to the Metabolism of M23, M1 and Cer-L
3.5. Sensitivity Tests for fm,CYP3A4, “r” and pAi,UGT(d)
3.6. Prediction of fM(+)/fM and KeM(+)/KeM for each Metabolite in the Cer + Gem + Itr DDI
4.7. Prediction of AUCR(M) for Each Metabolite in the Cer + Gem + Itr DDI
4. Discussion
5. Methods
5.1. Data of the Cer + Gem and Cer + Itr DDIs
5.2. Predictions of Changes in Plasma Levels of Cer and Its Metabolates, and AUCR(M)s in Each DDI
5.2.1. Step 1: Determination of PK Parameters for Cer and Simulation of Changes in Cer Levels [Cp(t)]
5.2.2. Step 2: Determination of Ai,overall
5.2.3. Step 3: Determination of fm,CYP3A4, fm,CYP2C8 and fm,UGT
5.2.4. Step 4: Determination of PK parameters of M23, M1 and Cer-L
5.2.5. Step 5: Determination of fM(+)/fM for M23, M1 and Cer-L for Each DDI
5.2.6. Step 6: Simulation of Plasma Levels of M23, M1 and Cer-L by Adjusting KeM(+) for Each DDI
5.2.7. Step 7: Determination of Ai,overall(M) for Each DDI
5.2.8. Step 8: Determination of fm(M)s in the Cer + Gem and Cer + Itr DDIs
5.2.9. Step 9: Determination of Ai,overall(M) and KeM/KeM(+) in the Cer + Gem + Itr DDI
5.2.10. Step 10: Determination of AUCR(M) for Each Metabolite
6. Conclusions
Supplementary Materials
Funding
Institutional Review Board Statement
Informed Consent Statement
Data Availability Statement
Conflicts of Interest
Abbreviations
| AUC | The area under the plasma drug level curve |
| AUCR | AUC ratio (Fold increase in AUC) |
| CYP | Cytochorme P450 |
| DDI | Drug-drug interaction |
| PK | Pharmacokinetics |
| UGT | UDP-glucuronosyltransferase |
References
- Iga K Use of three-compartment physiologically based pharmacokinetic modeling to predict hepatic blood levels of fluvoxamine relevant for drug-drug interactions. J. Pharm. Sci. 2015, 104, 1478–1491.
- Iga K Simulation of metabolic drug-drug interactions perpetrated by fluvoxamine using hybridized two-compartment hepatic drug-pool-based tube modeling and estimation of in vivo inhibition constants. J. Pharm. Sci. 2015, 104, 3565–3577. [CrossRef] [PubMed]
- Iga K Dynamic and static simulations of fluvoxamine-perpetrated drug-drug interactions using multiple cytochrome P450 inhibition modeling, and determination of perpetrator-specific CYP isoform inhibition constants and relative CYP isoform contributions to victim clearance. J. Pharm. Sci. 2016, 105, 1307–1317.
- Iga K; Kiriyama A Simulations of cytochrome P450 3A4-mediated drug-drug interactions by simple two-compartment model-assisted static method. J. Pharm. Sci. 2017, 106, 1426–1438.
- Iga K; Kiriyama A Usefulness of two-compartment model-assisted and static overall inhibitory-activity method for prediction of drug-drug interaction. Biol. Pharm. Bull. 2017, 40, 2024–2037.
- Iga K; Kiriyama A Interplay of UDP-glucuronosyltransferase and CYP2C8 for CYP2C8 mediated drug oxidation and its impact on drug-drug interaction produced by standardized CYP2C8 inhibitors, clopidogrel and gemfibrozil. Clin. Pharmacokinet. 2024, 63, 43–56.
- Friedman MA; Woodcock J; Lumpkin MM; Shuren JE; Hass AE; Thompson LJ The safety of newly approved medicines: do recent market removals mean there is a problem? JAMA. 1999, 281, 1728–1734. [CrossRef]
- Smogorzewski M The myopathy of statins. J. Ren. Nutr. 2005, 15, 87–93.
- Alfirevic A; Neely D; Armitage J; Chinoy H; Cooper RG; Laaksonen R; Carr DF; Bloch KM; Fahy J; Hanson A; Yue Q-Y; Wadelius M; Zee AHMD; Voora D; Psaty BM; Palmer CAN; Pirmohamed M Phenotype standardization for statin-induced myotoxicity. Clin. Pharmacol. Ther. 2014, 96, 470–476.
- Turner RM; Pirmohamed M Statin-Related Myotoxicity: A Comprehensive Review of pharmacokinetic, pharmacogenomic and muscle components. J. Clin Med. 2019, 9, 22.
- Backman JT; Kyrklund CI; Neuvonen M; Neuvonen PJ Gemfibrozil greatly increases plasma concentrations of cerivastatin. Clin. Pharmacol. Ther. 2002, 72, 685–691. [CrossRef]
- Farnier M Cerivastatin in the treatment of mixed hyperlipidemia: the RIGHT study. The cerivastatin study group. cerivastatin gemfibrozil hyperlipidemia treatment. Am. J. Cardiol. 1998, 82, 47J–51J. [Google Scholar] [CrossRef]
- Mück W Clinical pharmacokinetics of cerivastatin. Clin. Pharmacokinet. 2000, 39, 99–116. [CrossRef]
- Plosker GL; Dunn CI; Figgitt DP Cerivastatin: a review of its pharmacological properties and therapeutic efficacy in the management of hypercholesterolaemia. Drugs. 2000, 60, 1179–206.
- Generaux GT; Bonomo FM; Johnson M; Doan KMM Impact of SLCO1B1 (OATP1B1) and ABCG2 (BCRP) genetic polymorphisms and inhibition on LDL-C lowering and myopathy of statins. Xenobiotica. 2011, 41, 639–651. [CrossRef]
- Tornio A; Neuvonen PJ; Niemi M; Backman JT Role of gemfibrozil as an inhibitor of CYP2C8 and membrane transporters. Expert. Opin. Drug. Metab. Toxicol. 2017, 13, 83–95. [CrossRef]
- Shitara Y; Hirano M; Sato H; Sugiyama Y Gemfibrozil and its glucuronide inhibit the organic anion transporting polypeptide 2 (OATP2/OATP1B1:SLC21A6)-mediated hepatic uptake and CYP2C8-mediated metabolism of cerivastatin: analysis of the mechanism of the clinically relevant drug-drug interaction between cerivastatin and gemfibrozil. J. Pharmacol. Exp. Ther. 2004, 311, 228–236.
- Izumi S; Nozaki Y; Maeda K; Komori T; Takenaka O; Kusuhara H; Sugiyama Y Investigation of the impact of substrate selection on in vitro organic anion transporting polypeptide 1B1 inhibition profiles for the prediction of drug-drug interactions. Drug Metab. Dispos. 2015, 43, 235–247.
- Tátrai P; Schweigler P; Poller B; Domange N; Wilde RD; Hanna I; Gáborik Z; Huth F A systematic in vitro investigation of the inhibitor preincubation effect on multiple classes of clinically relevant transporters. Drug Metab. Dispos. 2019, 47, 768–778. [CrossRef] [PubMed]
- Kantola T; Kivistö KT; Neuvonen PJ Effect of itraconazole on cerivastatin pharmacokinetics. Eur. J. Clin. Pharmacol. 1999, 54, 851–855. [CrossRef] [PubMed]
- Boberg M; Angerbauer R; Fey P; Kanhai WK; Karl W; Kern A; Ploschke J; Radtke M Metabolism of cerivastatin by human liver microsomes in vitro. Characterization of primary metabolic pathways and of cytochrome P450 isozymes involved. Drug Metab Dispos. 1997, 25, 321–331. [Google Scholar]
- Prueksaritanont T; Subramanian R; Fang X; Ma B; Qiu Y; Lin JH; Pearson PG; Baillie TA Glucuronidation of statins in animals and humans: a novel mechanism of statin lactonization. Drug Metab Dispos. 2002, 30, 505–512.
- 23 Schirris TJJ; Ritschel T; Bilos A; Smeitink JAM; Russel FGM Statin lactonization by uridine 5’-diphospho-glucuronosyltransferases (UGTs). Mol. Pharm. 2015, 12, 4048–4055.
- Taha DA; Moor CHD; Barrett DA; Lee JB; Gandhi RD; Hoo CW; Gershkovich P The role of acid-base imbalance in statin-induced myotoxicity. Transl. Res. 2016, 174, 140–160.
- Skottheim IB; Dahl AG; Hejazifar S; Hoel K; Asberg A Statin induced myotoxicity: the lactone forms are more potent than the acid forms in human skeletal muscle cells in vitro. Eur. J. Pharm Sci. 2008, 33, 317–325.
- Ogilvie BW; Zhang D; Li W; Rodrigues AD; Gipson AE; Holsapple J; Toren P; Parkinson A Glucuronidation converts gemfibrozil to a potent, metabolism-dependent inhibitor of CYP2C8: implications for drug-drug interactions. Drug. Metab. Dispos. 2006. 34, 191–197.
- Backman JT; Filppula AM; Niemi M; Neuvonen PJ Role of cytochrome P450 2C8 in drug metabolism and interactions. Pharmacol. Rev. 2016, 68, 168–241.
- Kazmi F; Barbara JE; Yerino P; Parkinson A A long-standing mystery solved: the formation of 3-hydroxydesloratadine is catalyzed by CYP2C8 but prior glucuronidation of desloratadine by UDP-glucuronosyltransferase 2B10 is an obligatory requirement. Drug Metab. Dispos. 2015, 43, 523–533.
- Kazmi F; Yerino P; Barbara JE; Parkinson, A. Further characterization of the metabolism of desloratadine and its cytochrome P450 and UDP-glucuronosyltransferase inhibition potential: identification of desloratadine as a relatively selective UGT2B10 inhibitor. Drug Metab Dispos. 2015, 43, 1294–1302. [Google Scholar]
- Gan J; Chen W; Shen H; Gao L; Hong Y; Tian Y; Li W; Zhang Y; Tang Y; Zhang H; Humphreys WG; Rodrigues AD Repaglinide-gemfibrozil drug interaction: inhibition of repaglinide glucuronidation as a potential additional contributing mechanism. Br. J. Clin. Pharmacol. 2010, 70, 870–880.
- VandenbBrink BM; Foti RS; Rock DA; Wienkers LC; Wahlstrom JL Evaluation of CYP2C8 inhibition in vitro: utility of montelukast as a selective CYP2C8 probe substrate. Drug Metab. Dispos. 2011, 39, 1546–1554.
- Cardoso JO; Oliveira RV; Lu JBL; Desta Z In vitro metabolism of montelukast by cytochrome P450s and UDP-glucuronosyltransferases. Drug Metab. Dispos. 2015, 43, 1905–1916.
- Ma Y; Fu Y; Khojasteh SC; Dalvie D; Zhang D Glucuronides as potential anionic substrates of human cytochrome P450 2C8 (CYP2C8). J. Med. Chem. 2017, 60, 8691–8705.
- Goosen TC; Bauman JN; Davis JA; Yu C; Hurst SI; Williams JA; Loi CM Atorvastatin glucuronidation is minimally and nonselectively inhibited by the fibrates gemfibrozil, fenofibrate, and fenofibric acid. Drug Metab. Dispos. 2007, 35, 1315–1324.
- Kearney AS; Crawford LF; Mehta SC; Radebaugh GW The interconversion kinetics, equilibrium, and solubilities of the lactone and hydroxyacid forms of the HMG-CoA reductase inhibitor, CI-981. Pharm. Res. 1993, 10, 1461–1465.
- Khersonsky O; Tawfik DS Structure-reactivity studies of serum paraoxonase PON1 suggest that its native activity is lactonase. Biochemistry. 2005, 44, 6371–6382.
- Meneses MJ; Silvestre R; Sousa-Lima I; Macedo MP Paraoxonase-1 as a regulator of glucose and lipid homeostasis: impact on the onset and progression of metabolic disorders. Int. J. Mol. Sci. 2019, 20, 4049.
- Mollazadeh H; Tavana E; Fanni G; Bo S; Banach M; Pirro M; von Haehling S; Jamialahmadi T; Sahebkar A Effects of statins on mitochondrial pathways. J. Cachexia. Sarcopenia. Muscle. 2021, 12, 237–251.
- Floyd JS; Kaspera R; Marciante KD; Weiss NS; Heckbert SR; Lumley T; Wiggins KL; Tamraz B; Kwok PY; Totah RA; Psaty BM A screening study of drug-drug interactions in cerivastatin users: an adverse effect of clopidogrel. Clin. Pharmacol. Ther. 2012, 91, 896–904.
- Eljaaly K; Alshehri S An updated review of interactions of statins with antibacterial and antifungal agents. J. Transl. Sci. 2017, 3, 2–4. Available online: https://www.researchgate.net/publication/322933149_An_updated_review_of_interactions_of_statins_with_antibacterial_and_antifungal_agents (accessed on 5 March 2025).
- Yeo KR; Yeo WW; Wallis EJ; Ramsay LE Enhanced cholesterol reduction by simvastatin in diltiazem-treated patients. Br. J. Clin. Pharmacol. 1999, 48, 610–615.
- Varhe A; Olkkola KT; Neuvonen PJ Diltiazem enhances the effects of triazolam by inhibiting its metabolism. Clin. Pharmacol. Ther. 1996, 59, 369–375.
- Mück W; Ritter W; Ochmann K; Unger S; Ahr G; Wingender W; Kuhlmann J Absolute and relative bioavailability of the HMG-CoA reductase inhibitor cerivastatin. Int. J. Clin. Pharmacol. Ther. 1997, 35, 255–260.

| Cer + Gem DDI | Cer + Itr DDI | |||
|---|---|---|---|---|
| (-) | (+) | (-) | (+) | |
| CLoral (1/h) | 15.0 | 3.0 | 13.0 | 11.5 |
| CLtotal (1/h) | 9.24 | 2.04 | 7.32 | 6.55 |
| Fa×Fg | 0.7 | 0.7 | 0.62 | 0.62 |
| Ka (1/h) | 0.4 | 1.0 | 0.7 | 0.5 |
| Fha | 0.88 | 0.97 | 0.90 | 0.91 |
| F | 0.61 | 0.68 | 0.56 | 0.56 |
| V0 (L) | 20 | 20 | 20 | 20 |
| Vdss (L) | 45 | 45 | 45 | 45 |
| Kd (1/h) | 0.15 | 0.15 | 0.15 | 0.15 |
| AUCR | 1 | 5.00 | 1 | 1.13 |
| Ai,overall | 1 | 4.76 | 1 | 1.12 |
| fm,CYP2C8 | 0.75 | 0.75 | ||
| fm,UGT | 0.13 | 0.13 | ||
| fm,CYP3A4 | 0.12 | 0.12 | ||
| pAi,CYP2C8 | 1 | 16 | 1 | 1 |
| pAi,UGT(d) | 1 | 2 | 1 | 1 |
| pAi,CYP3A4 | 1 | 1 | 1 | 10 |
| M23 | M1 | Cer-L | |
|---|---|---|---|
| fM | 0.225 [= 0.3a×fm,CYP2C8] |
0.654 [= fm,CYP3A4 + 0.7a×fm,CYP2C8] |
0.13 [= fm,UGT] |
| KeM (1/h) | 0.31 | 4.0 | 0.75 |
| V0M (L) | 20 | 20 | 20 |
| VdssM (L) | 45 | 45 | 45 |
| KdM (1/h) | 0.15 | 0.15 | 0.15 |
| CLtotM [= KeM×V0M] (L/h) | 6.1 | 80 | 15 |
| FhM | 0.93 | 0 | 0.80 |
| aAssuming “r” = 0.3. |
| Metabolite | Cer + Gem DDI | Cer + Itr DDI | |
|---|---|---|---|
| M23 | fM(+)/fM | 0.16 | 1.12 |
| KeM(+)/KeM | 1.00 | 0.64 | |
| FhM(+) Ai,overall(M) |
0.93 1.00 |
0.95 1.58 |
|
| M1 | fM(+)/fM | 1.01 | 0.93 |
| KeM(+)/KeM | 0.35 | 1.00 | |
| FhM(+) Ai,overall(M) |
0.35 32 |
0a 1.00 |
|
| Cer-L | fM(+)/fM | 2.38 | 1.12 |
| KeM(+)/KeM | 0.56 | 0.53 | |
| FhM(+) Ai,overall(M) |
0.89 1.97 |
0.89 2.11 |
|
| aFhM(+)Ai,overall = 0.3532≈ 0. | |||
| Enzyme | M23 | M1 | Cer-L |
|---|---|---|---|
| fm,CYP3A4(M) | 0.33 | 0 | 0.58 (from 0.5 to 0.6) |
| fm,CYP2C8(M) | 0 | 1 | 0.50 (from 0.5 to 0.4) |
| fm,UGT(G2)(M) | 0 | 0 | 0 |
| fm,UGT(G1)(M) | 0.67 | 0 | 0 |
| Products | M24 (by CYP3A4) | M24 [by CYP2C8] | M1-L (by CYP3A4) |
| M23-G1 [by UGT(G1)] | M23-L (by CYP2C8) |
| Metabolite | Cer + Gem + Itr DDI | |
|---|---|---|
| M23 | fM(+)/fM | 0.312 |
| KeM(+)/KeM | 0.64 | |
| Fh(M)(+) | 0.95 | |
| Ai,overall(M) | 1.58 | |
| M1 | fM(+)/fM | 0.44 |
| KeM(+)/KeM | 0.35 | |
| Fh(M)(+) | 0.35 | |
| Ai,overall(M) | 32 | |
| Cer-L | fM(+)/fM | 5 |
| KeM(+)/KeM | 0.072~0.080 | |
| Fh(M)(+) | 0.98 | |
| Ai,overall(M) | 13.8~15.2 |
| Cer + Gem DDI | Cer + Itr DDI | Cer + Gem + Itr DDI | |||
|---|---|---|---|---|---|
| Simulated | Obserbed | Simulated | Obserbed | Predicted | |
| AUCR(Cer) | 5.0 | 5.0 | 1.1 | 1.1 | 10 |
| AUCR(M23) | 0.16 | 0.17 | 1.7 | 1.3 | 0.48 |
| AUCR(M1) | 2.9 | 4.4 | 0.93 | 0.76 | 1.2 |
| AUCR(Cer-L) | 4.2 | 4.4 | 2.1 | 2.6 | 62~69 |
Disclaimer/Publisher’s Note: The statements, opinions and data contained in all publications are solely those of the individual author(s) and contributor(s) and not of MDPI and/or the editor(s). MDPI and/or the editor(s) disclaim responsibility for any injury to people or property resulting from any ideas, methods, instructions or products referred to in the content. |
© 2025 by the authors. Licensee MDPI, Basel, Switzerland. This article is an open access article distributed under the terms and conditions of the Creative Commons Attribution (CC BY) license (http://creativecommons.org/licenses/by/4.0/).


