1. Introduction
To avoid severe side effects caused by unfavorable combinations of medical drugs, it is crucial to predict drug-drug interactions (DDIs) from the early stages of drug development. To this end, we have been developing a systematic method for predicting enzyme inhibition-based DDIs [
1,
2,
3,
4,
5,
6]. The method was developed based on fundamental concepts: the impact of DDIs depends on the specific characteristics of both the victim drug and the perpetrator; and changes in plasma concentrations—both for the unchanged drug and its metabolites—can be effectively simulated using a simplified compartment model-assisted pharmacokinetic (PK) modeling that incorporates a ‘metabolite-linked to unchanged drug’ system (Metabolite-Linked Model).
In the present study, we focused on the abnormal PKs of the cholesterol-lowering drug cerivastatin (Cer), which was withdrawn from the market shortly after its release due to numerous cases of fatal rhabdomyolysis (particularly notable among statin drugs) in the early 2000s [Supplementary Material (SM1)][
7,
8]. The primary suspected cause of these adverse events was the abnormal elevation of Cer plasma concentrations, potentially due to the concurrent use of inhibitors of metabolic enzymes and hepatic uptake transporters [
9,
10]. However, a comprehensive explanation for these occurrences remains elusive. For instance, Cer is a substrate of the oxidative enzyme cytochrome P450 2C8 (CYP2C8), and its plasma concentration has been reported to increase significantly (a five-fold increase in the area under the plasma concentration curve, AUCR ≈ 5) when co-administered with the CYP2C8 inhibitor gemfibrozil (Gem; 600 mg BID)[
11]. In this combination, Cer is considered the victim drug, while Gem is identified as the perpetrator. This DDI was thought to contribute to the adverse effects. However, the increase in unchanged Cer plasma concentration with this combination appears insufficient to cause severe side effects, based on the results of the Cer-Gem hyperlipidemia treatment study [
12], which showed no abnormal effects, as well as typical dose-escalation clinical studies [
13,
14].
It has been suggested that Gem’s inhibition of the hepatic uptake transporter OATP1B1 could worsen the interaction [
15,
16]. However, the reported in vitro inhibitory activity of Gem is not strong enough to exacerbate the interaction (R = 1 + [I
u]/K
i,u < 1.1) [
17,
18,
19]. Moreover, our previous research suggests that OATP1B1 inhibition does not significantly contribute to the interaction [
6].
Cer is a weak substrate of CYP3A4, but co-administration with the CYP3A4 inhibitor itraconazole (Itr; 200 mg QD) results in a minimal increase in plasma concentration (AUCR = 1.1)]20]. Thus, the likelihood of rhabdomyolysis due to increased Cer plasma concentration from CYP2C8 or CYP3A4 inhibition is also extremely low.
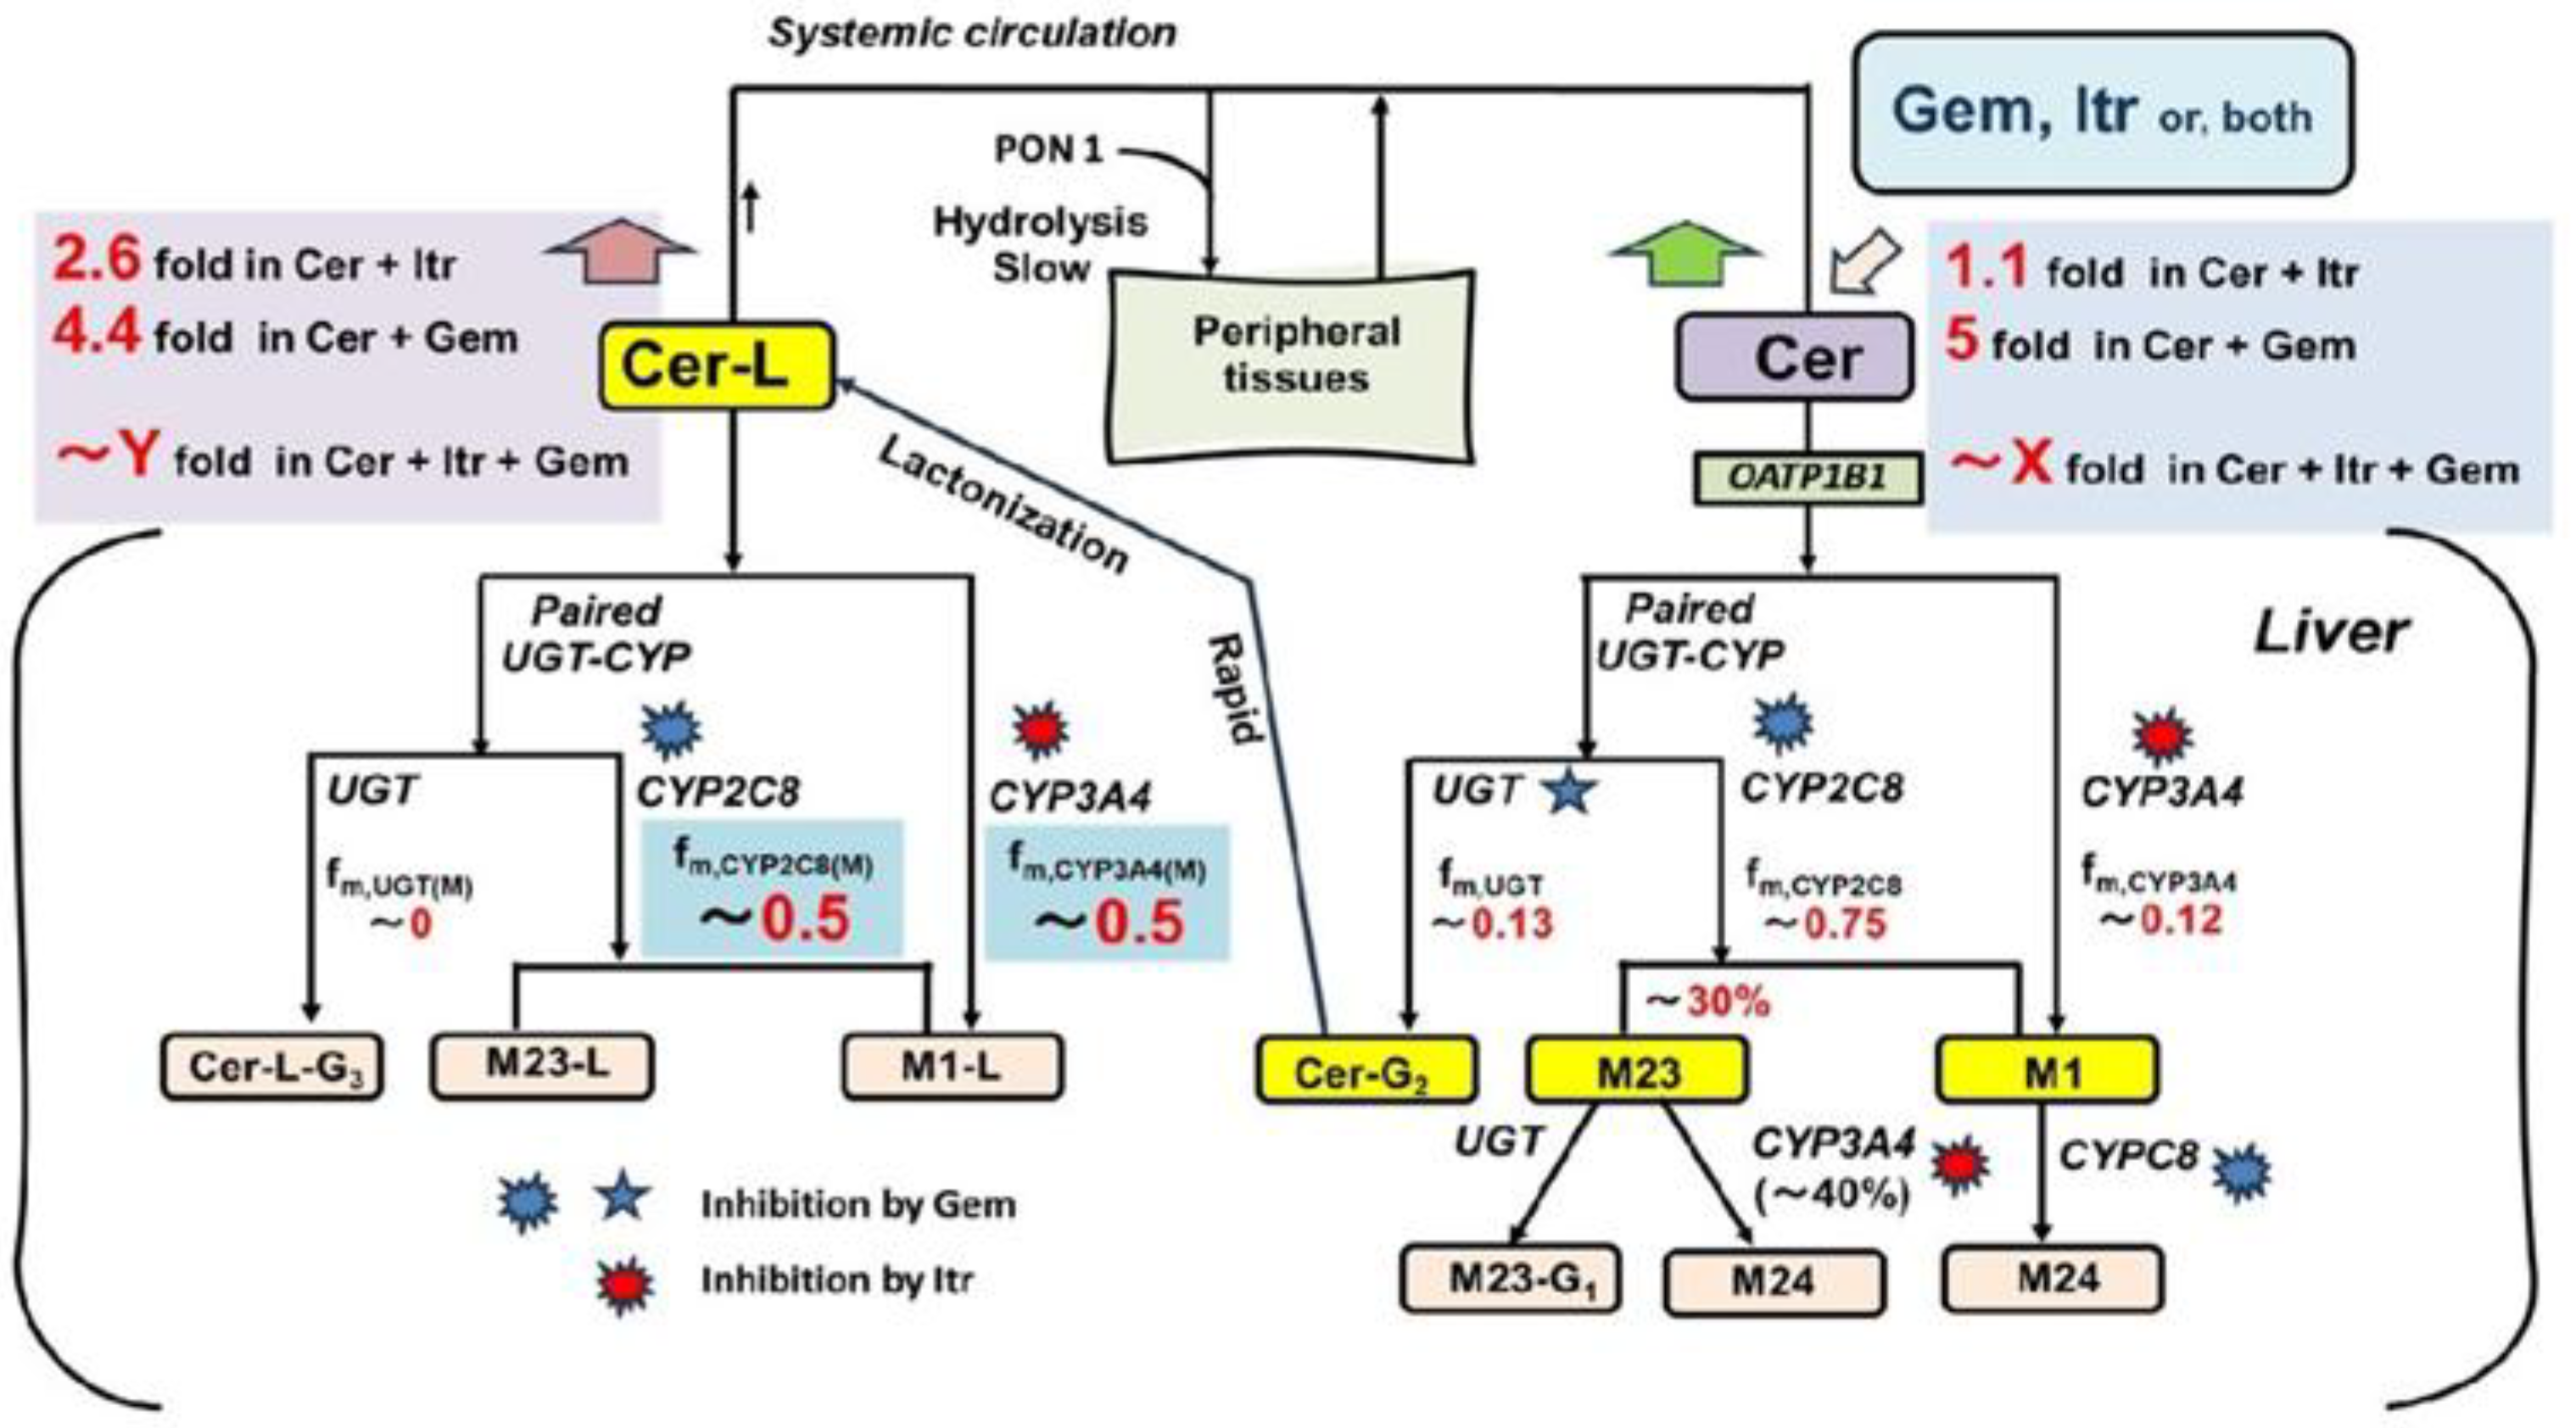
Although no interaction studies have been conducted on the co-administration of Cer with Gem and Itr, it is hypothesized that complete inhibition of oxidative metabolism (a severe scenario) by these inhibitors would result in a significant increase in plasma Cer levels. Plasma levels of one of Cer’s metabolites, the lactone form (Cer-L), would also rise dramatically, unlike other metabolites. This possibility is illustrated in
Figure 1.
Here, Cer is metabolized by CYP2C8, CYP3A4, and UGT into its primary metabolites, M23, M1, and Cer-G2 (the acyl glucuronide of Cer) [
21](SM2). Cer-G2 is quickly converted to Cer-L [
22,
23]. Although Cer-L is prone to hydrolysis at lower pH levels in vitro [
24], it remains relatively stable in the bloodstream. As a result, Cer-L is primarily metabolized through oxidation by CYP2C8 and CYP3A4. Notably, Cer-L has been identified as a potential causative agent in the rhabdomyolysis events observed in previous studies [
10,
25]. In this hypothesis, the co-administration of Cer with Gem and Itr could potentially block the elimination of Cer-L, leading to serious consequences.
In this context, this study aims to predict changes in plasma levels of Cer and its metabolites, including M23, M1, and particularly Cer-L, which may contribute to Cer-induced rhabdomyolysis when co-administered with Gem and Itr. Additionally, this report seeks to demonstrate the usefulness of the Metabolite-Linked Model for DDI analysis.
Based on our previous studies, the changes in plasma levels of unchanged victim drugs in all types of CYP-mediated DDIs can be effectively simulated and predicted using our simplified static method. Specifically, for CYP2C8-mediated DDIs, the prediction of unchanged drug levels can be made using the UGT-CYP2C8 interlay model [
6]. However, predicting changes in plasma metabolite levels is more complex, as these levels are influenced by both the generation and elimination rates of the metabolites, which are closely tied to the parent drug levels. Therefore, accurately predicting metabolite levels requires determining these rates and the PK parameters of the metabolites. To address this challenge, we extended the previously developed Metabolite-Linked model to apply to the current study. Details of the theoretical framework and methodology relevant to this study are provided in the following sections.
2. Theory
2.1. Magnitude of DDI (AUCR or Ai,overall)
According to the tube-based hepatic extraction kinetics [
1,
2], the AUCR value is determined by the hepatic availability (F
h) of the victim drug and the overall inhibitory activity (A
i,overall).
AUCR =[1/Fh – 1]/ [1/Fh(+) – 1] = [1/Fh – 1]/[exp{-Ln(Fh)/Ai,overall}-1]
Or 1/Ai,overall = [Ln(AUCR)-Ln(AUCR – 1 + 1/Fh)]/Ln(Fh) (1)
Here, the (+) symbol indicates the test group in the DDI.
The overall inhibitory activity is mechanistically determined by the interactions between the perpetrator and the victim, as explained in the following sections.
2.2. UGT–CYP2C8 Interplay Model [6]
When a CYP2C8 substrate drug (Cer) undergoes oxidation by CYP2C8, it first binds to UGT, with part of it undergoing conjugation. Gem inhibits UGT through competitive binding and inhibits CYP2C8 via non-competitive inhibition. The non-competitive inhibition of CYP2C8 is attributed to Gem’s acyl glucuronide (Gem-O-glu). In contrast, Itr only inhibits CYP3A4, outside of the UGT-CYP2C8 pathway [
17,
26,
27,
28,
29,
30,
31,
32,
33]
2.3. Mechanistic Term for Ai,overall in the UGT–CYP2C8 Interplay Model
The mechanistic expression for Ai,overall in Cer-DDIs is given by the following equation:
1/Ai,overall = fm,CYP3A4/pAi,CYP3A4 + [fm,UGT + fm,CYP2C8/pAi,CYP2C8]/pAi,UGT(d) (2)
In this equation, f
m,CYP represents the fractional contribution of a specific CYP isoform to the clearance of the victim drug. The terms pA
i,CYP3A4, pA
i,CYP2C8, and pA
i,UGT(d) (where ’d’ denotes distribution) refer to the inhibitory activities of the perpetrator on CYP3A4, CYP2C8, and UGT, respectively. Each pA
i is defined as R= 1+ [I
u]/K
iu where detailed information on their in vitro values can be found in
Supplementary Materials (SM3 and SM4). Additionally, A
i,overall represents the total inhibition resulting from the combined effects on various CYP isoforms.
2.4. Perpetrator’s Specifc Inhibitory Activity (pAi)[6]
The pAi values used in this study, are the same as those previously determined. For Itr (200 mg QD), pAi,CYP3A4 = 10 and pAi,CYP2C8 = pAi,UGT(d) = 1. For Gem (600mg, BID), pAi,CYP3A4 = 1, pAi,CYP2C8 = 16 and pAi,UGT(d) = 2.
2.5. Static 2-Compartment Model for Time-Dependent Plasma Unchanged Drug Levels
The present DDI simulations assume that A
i,overall remains constant, even though the plasma concentration of the perpetrator is time dependent. This assumption enables the simulation of changes in the plasma concentration of the victim drug using a simplified static 2-compartment model [
3,
4,
5]. Further details can be found in Supplementary Material (SM5).
2.6. Metabolite-Linked Model for Time-Dependent Plasma Metabolite Levels [6]
The plasma metabolite concentration at time (t) [Cp,M(t)] (where “M” denotes metabolite) is determined by the convolution of the metabolite’s generation and elimination rates. This relationship is illustrated in Supplementary Material (SM6). More specifically, Cp,M(t) is is calculated as the sum of metabolite levels generated during the first-pass (Cp,M(1)(t)) and those generated in systemic circulation (Cp,M(2)(t)). These are calculated using the following convolution equations:
Cp,M(1)(t) = fM×∫ D × (Fa × Fg - F) × (dInput(T)/dT) × Fh,M(eff) × GM(t-T)dT (3)
Cp,M(2)(t) = fM×∫ CLoral × F × Cp(T) × GM(t-T)dT (4)
Here, fM represents the ratio (or extent) of the metabolite’s dose generated from the parent drug to the dose of the parent drug itself, dInput(T)/dT represents the absorption rate per unit dose of the parent drug, Fh,M(eff) represents effective hepatic availability of the metabolite (1 - Eh,M × α; α = 0.6), and GM(t) represents the function describing the plasma metabolite level after intravenous bolus administration of a unit dose of the metabolite. Cp,M(t) and Cp,M(+)(t) are calculated using these equations, assuming the same 2-compartment model as Cp(t) (SM7). The key condition is that the distribution parameters for the metabolite must be identical to those of the parent drug.
The integration of Cp,M(t) with respect to time (t) from 0 to infinity yields the AUC for Cp,M, given by:
AUC(M) = fM×Fa×Fg×D/V0M/KeM [= fM×Fa×Fg×D/CLtotM] (5)
As a result, the AUC(M) ratio resulting from DDI, AUCR(M), is determined as:
AUCR(M) = [fM(+)/fM] ×[KeM/KeM(+)] (6)
2.7. The Values of fM and fM(+) for the Metabolites
The primary metabolites of Cer (M23, M1 and Cer-L) are formed through its metabolic processes, as shown in
Figure 1.
Specifically, M23 is produced by CYP2C8, and its formation extent from Cer is given by:
fM(M23) = r × fm,CYP2C8 (“r” ranges from 0.3 to 0.4). (7)
M1 is formed through the remaining activity of CYP2C8 as well as the full activity of CYP3A4, with its formation extent from Cer is expressed as:
fM(M1) = (1 - r) × fm,CYP2C8 + fm,CYP3A4. (8)
Cer-L is exclusively formed by UGT, and its formation extent from Cer is given by:
fM(Cer-L) = fm,UGT. (9)
In this contex, the DDI-induced formation extents, fM(+)/fM for M23, M1 and Cer-L are given as:
fM(+)/fM (for M23) = Ai,overall / pAi,UGT(d) / pAi,CYP2C8 (10)
fM(+)/fM (for M1) = Ai,overall ×[ fm,CYP3A4/pAi,CYP3A4 + (1 - r) × fm,CYP2C8/pAi,UGT(d)/pAi,CYP2C8]/[(1 - r) × fm,CYP2C8 + fm,CYP3A4] (11)
fM(+)/fM (for Cer-L) = Ai,overall /pAi,UGT(d) (12)
These relationships clarify the relationships between the metabolites, the enzymes involved, and how the DDIs affect the formation extents.
2.8. The Values of KeM and KeM(+) for the Metabolites
The elimination rate of each metabolite, KeM, is expressed as:
KeM = CLtotM / V0M = Rb × Qh × (1 – FhM) / V0M
Then, the ratio, KeM/KeM(+) is calculated as:
KeM/KeM(+) = CLtotM/CLtotM(+)
= [1 – FhM] /[1 – FhM(+)] = [1 – FhM] / [1 – {FhM}1/Ai,overall(M)] (13)
Here, CLtotM and FhM represent the total body clearance and the hepatic availability of each metabolite, respectively. Ai,overall(M) represents the overall inhibitory activity in the elimination of the metabolite in the resence of the perpetrator.
Accordingly, Ai,overall(M) is given by:
Ai,overall(M) = Ln [1 – {Ke(M)/KeM(+)}×(1 -FhM)] / Ln(FhM) (14)
2.9. Relationship between Ai,overall(M) and fm(M)s to Elimination of M23, M1 and Cer-L
In the Cer + Gem DDI, the following relationships hold:
1/Ai,overall(M)(M1) = fm,CYP2C8(M)(M1)/pAi,UGT(d)/pAi,CYP2C8 + 1 – fm,2C8(M)(M1)
= 1 – 31/32 ×fm,CYP2C8(M)(Cer-L) (15)
1/Ai,overall(M)(Cer-L) = fm,CYP2C8(M)(Cer-L)/pAiUGT(d)/pAi,CYP2C8 + 1 - fm,CYP2C8(M)(Cer-L)
=1 – 31/32×fm,CYP2C8(M)(Cer-L) (16)
In the Cer + Itr DDI, the following relationships hold:
1/Ai,overall(M)(M23) = fm,CYP3A4(M)(M23)/pAi,CYP3A4 + 1 - fm,CYP3A4(M)(M23)
=1 – 9/10×fm,CYP3A4(M)(M23) (17)
1/Ai,overall(M)(Cer-L) = fm,CYP3A4(M)(Cer-L)/pAi,CYP3A4 + 1 - fm,CYP3A4(M)(Cer-L)
= 1 – 9/10×fm,CYP3A4(Cer-L) (18)
In the Cer + Gem + Itr DDI, the following relationships hold:
1/Ai,overall(M)(Cer-L) = fm,CYP2C8(M)(Cer-L)/pAi,UGT(d)/pAi,CYP2C8
+ fm,CYP3A4(M)(Cer-L)/pAi,CYP3A4 + 1 – fm,CYP2C8(M)(Cer-L) - fm,CYP3A4(M)(Cer-L)
= 1 – 31/32×fm,CYP2C8(M)(Cer-L) – 9/10 ×fm,CYP2C8(M)(Cer-L) (19)
3. Results
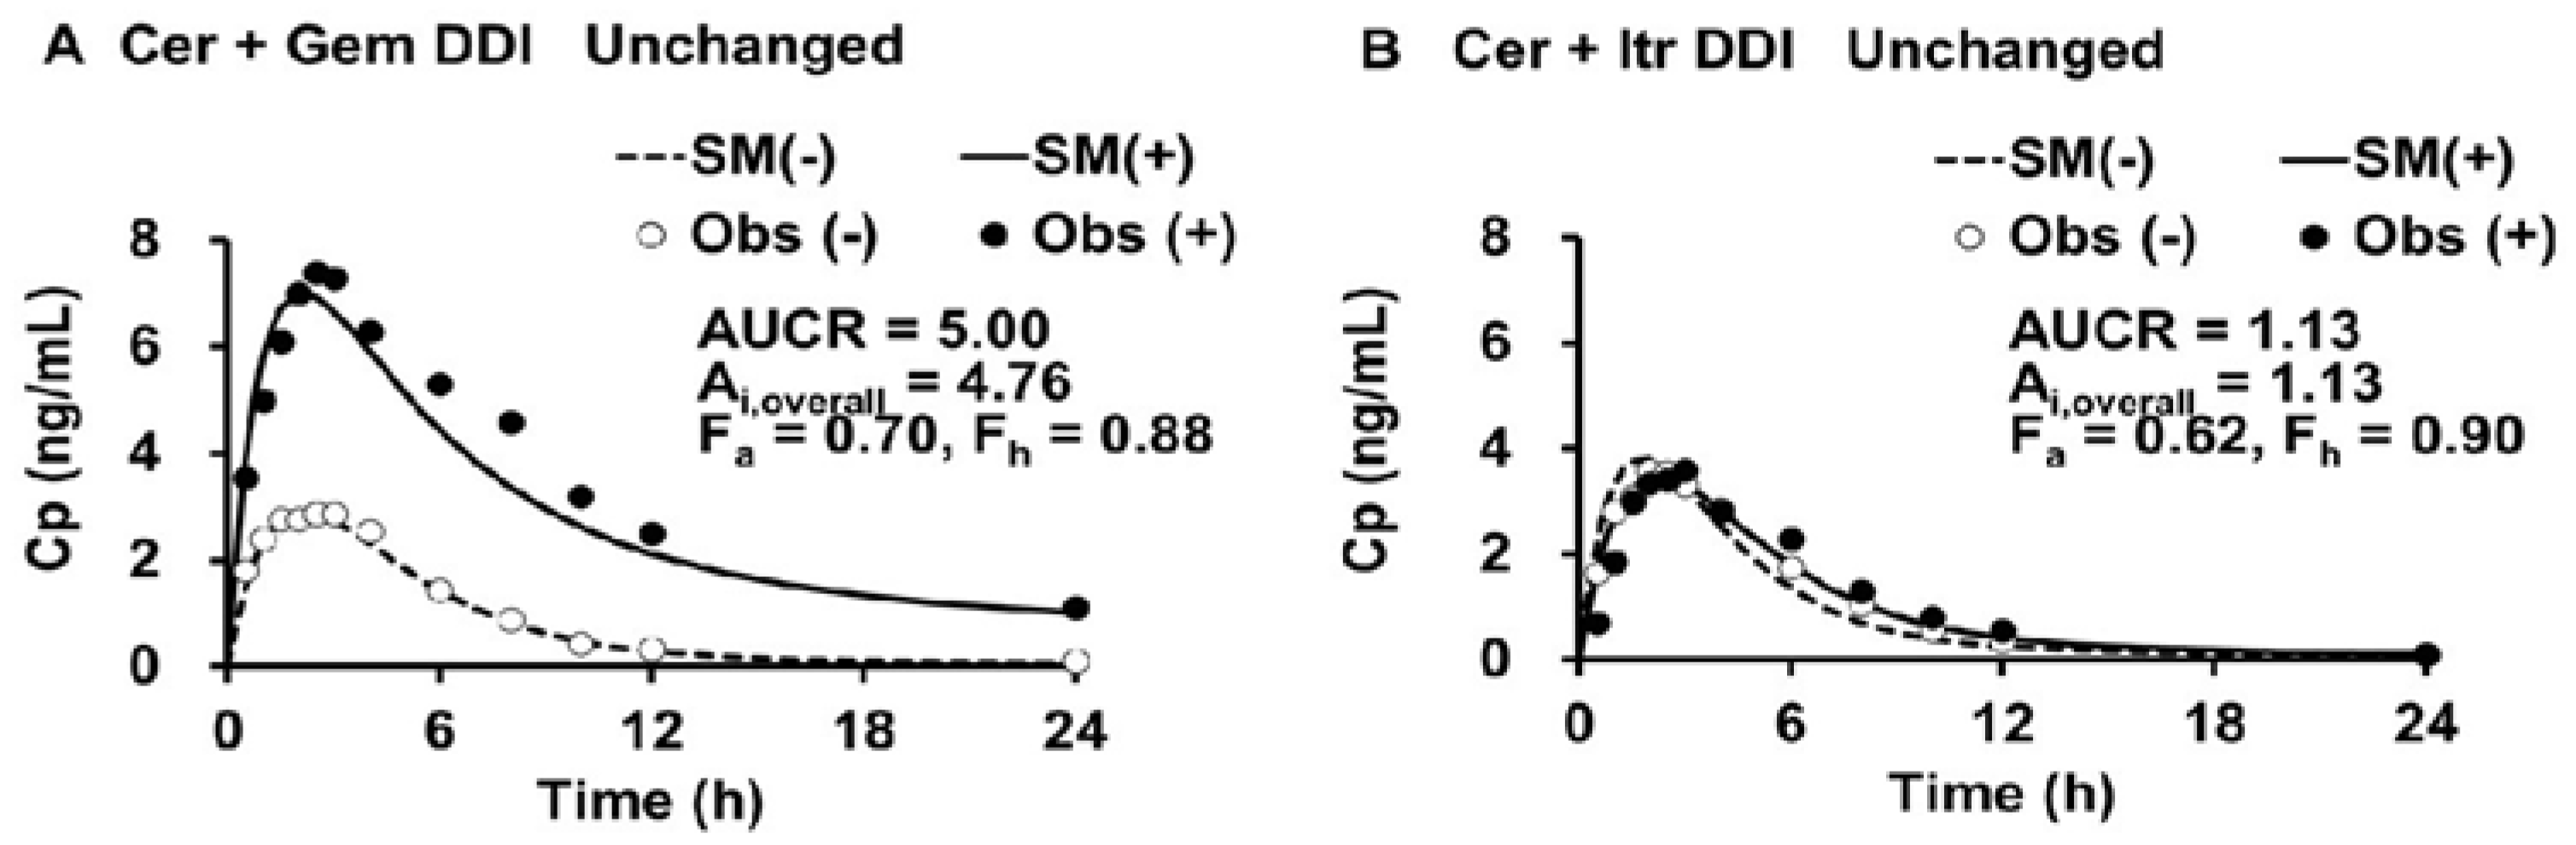
3.1. Simulated Cp(t) and Cp(t)(+) in the Cer + Gem and Cer + Itr DDIs, PK Parameters for Cer, and Ai,overall Values
The simulated plasma levels of Cer in the Cer + Gem and Cer + Itr DDIs are shown in
Figure 2.
The doses of Cer, Gem and Itr were 0.3 mg SD, 600 mg BID×3 days and 100 mg QD×3days, respectively.(-) control, (+) co-administration, SM simulation, Obs observed.
The PK parameters for Cer, both with and without perpetrators (Gem or Itr), were determined (as outlined in Step 1) and are shown in
Table 1.
The values for V0, Vdss and Kd of Cer were 20 (L), 45 (L) and 0.15 (1/h), respectively. The Ai,overall values for Cer in the Cer + Gem and Cer + Itr DDIs were 4.75 and 1.12, respectively (as shown in Step 2). The Fh value (~0.9) had minimal impact on the determination of the Ai,overall. The optimal values for fm,CYP3A4, fm,CYP2C8 and fm,UGT were determined (as shown in Step 3) to be 0.12, 0.75, and 0.13, respectively.
3.2. PK Parameters for M23 and M1, and Cer-L
The values of V
0M, V
dss(M) and K
d(M) for M23, M1 and Cer-L were assumed to be the same as those Cer-L. The f
M values for M23 and M1 were calculated to be 0.225 and 0.645, using Equation 7 and Equation 8, resepctively assuming “r” = 0.3, while that for Cer-L were calculated to be 0.13, using from Eq. 9. The elimination rates (K
eM) for M23, M1 and Cer-L were calculated to be 0.31, 4.0 and 0.75, respectively, using Equation 5. These values were shown along with CL
totM and F
h(M) in
Table 2.
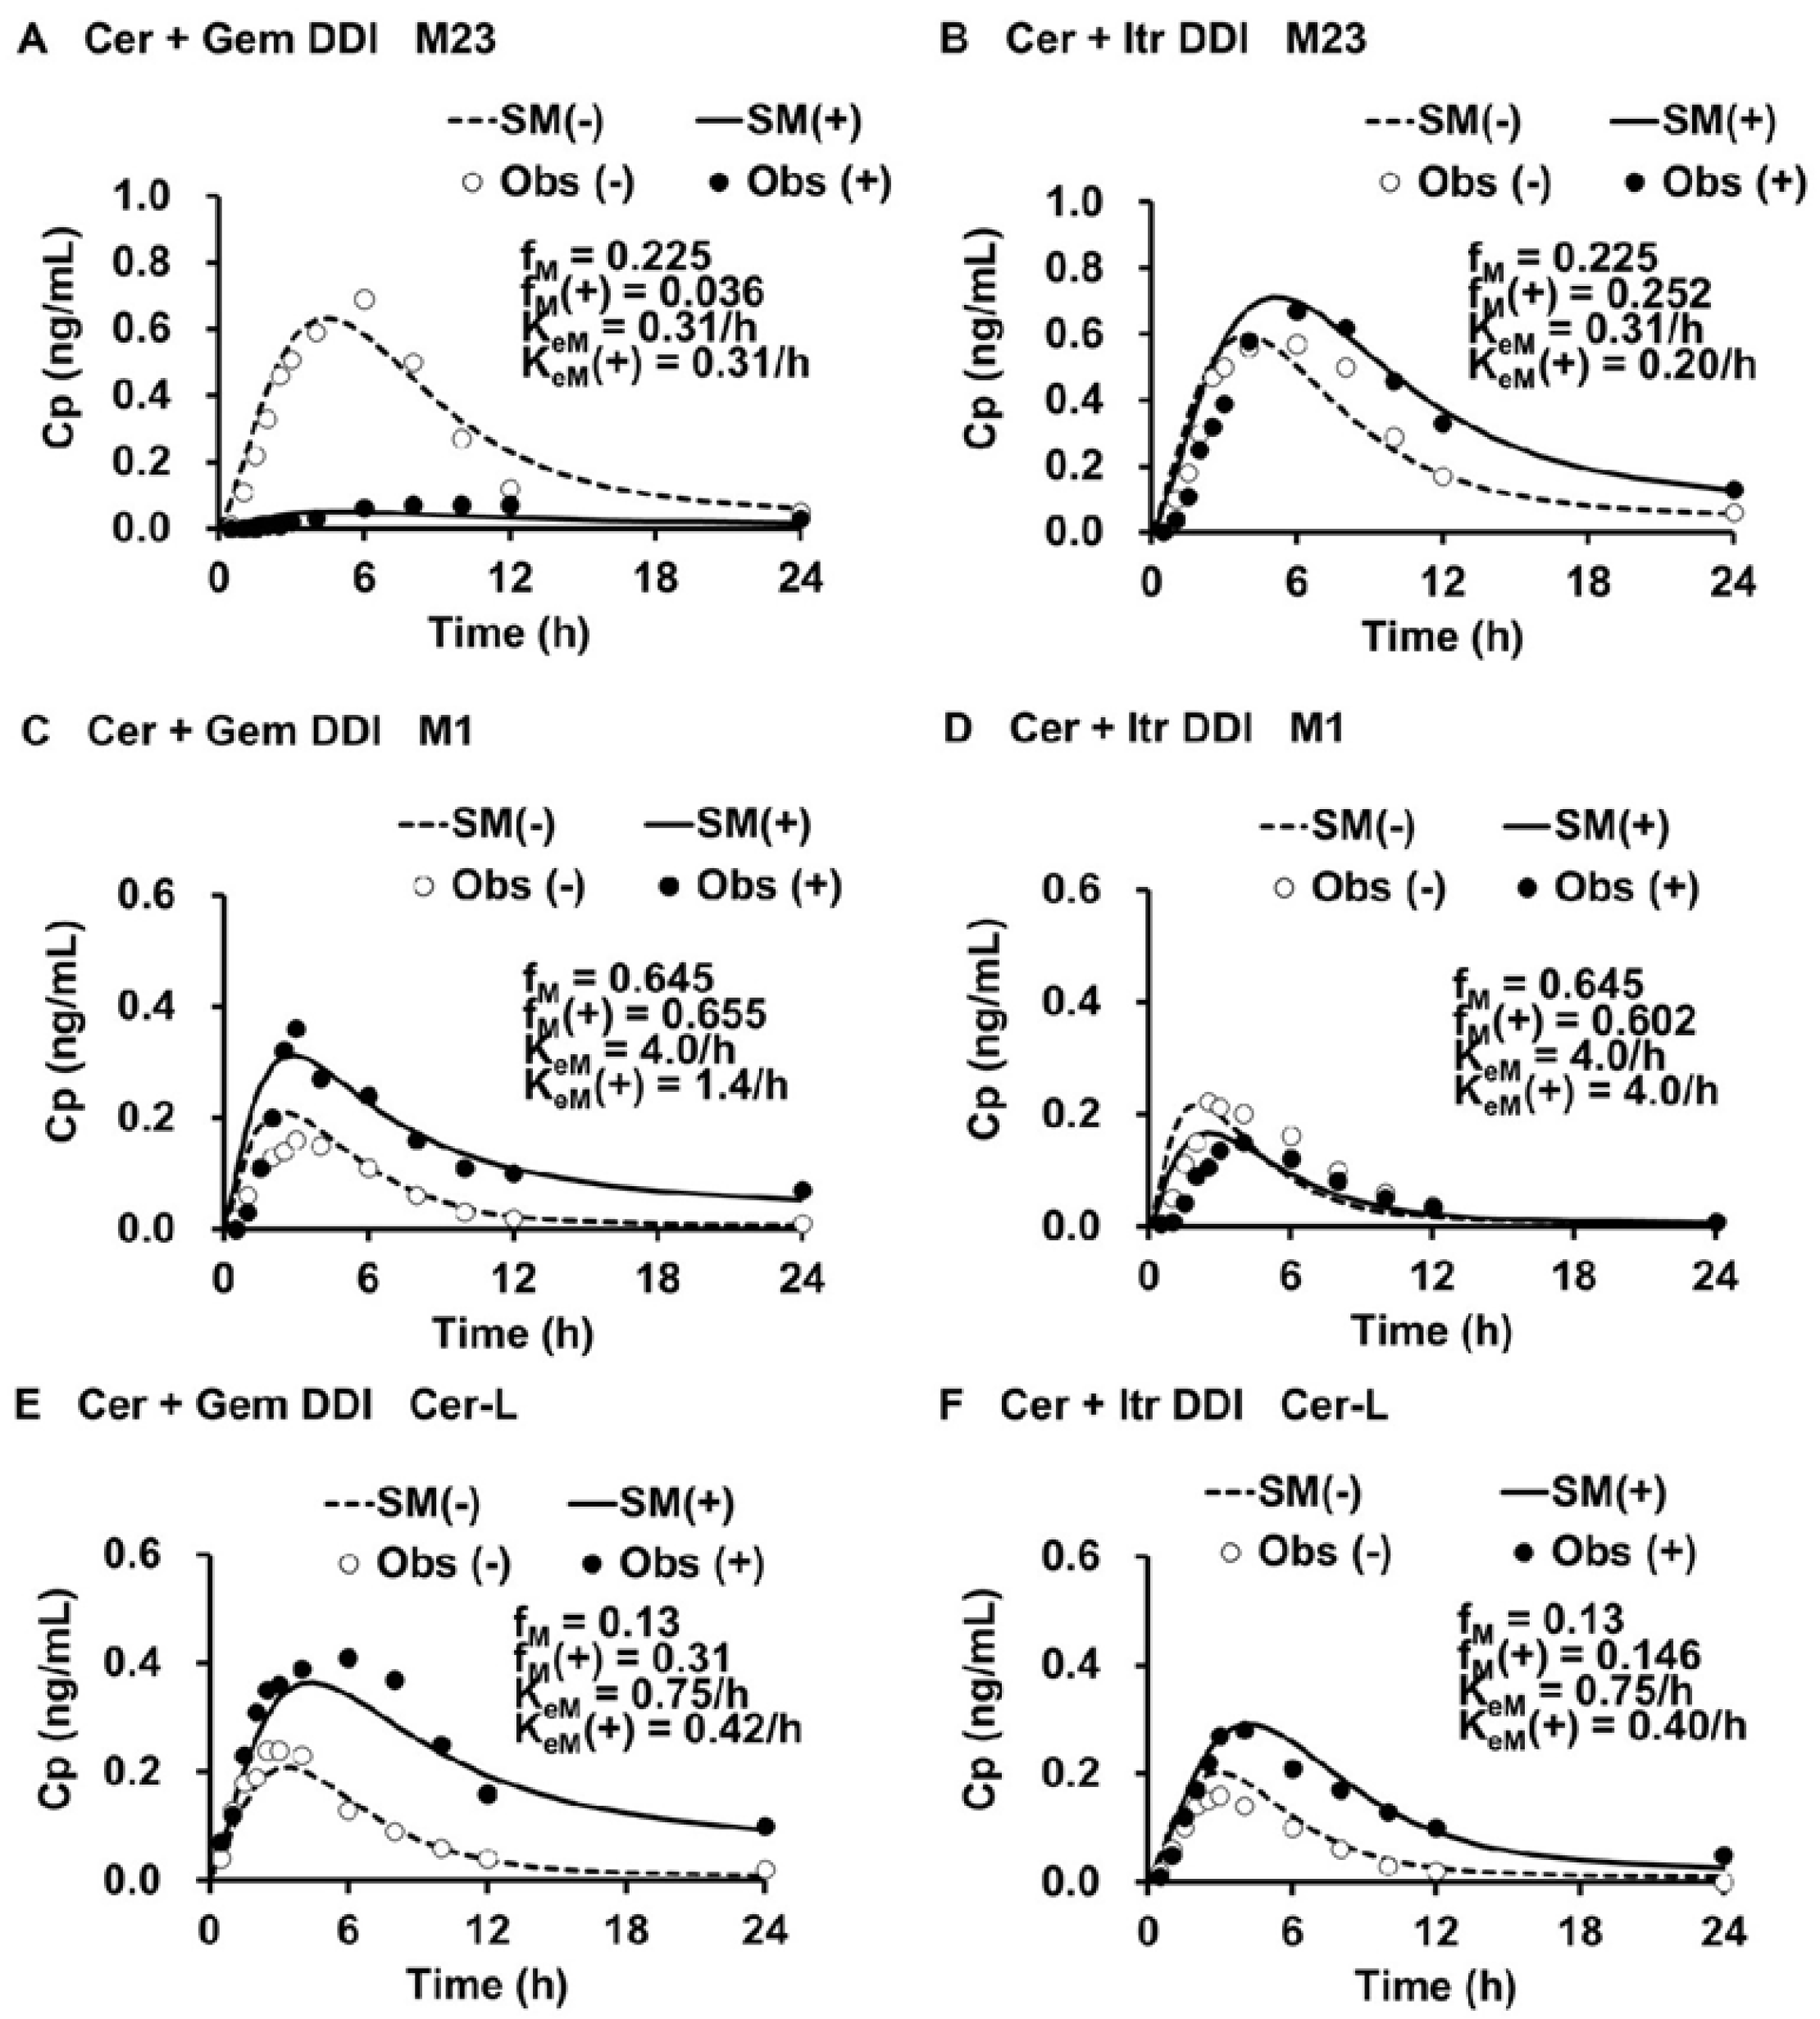
3.3. Simulated Cp,M(t) and Cp,M(t)(+), fM(+)/fM, and KeM(+)/KeM for each Metabolite in the Cer + Gem and Cer + Itr DDIs
The simulated plasma levels of M1, M23, and Cer-L in the Cer + Gem and Cer + Itr DDIs are shown in
Figure 3.
The simulated plasma levels closely matched the observed ones. In the Cer + Gem DDI, the formation of M23 was significantly reduced (fM(+)/fM = 0.16), with no change in the elimination rate (KeM(+)/KeM = 1). The formation of M1 remained unchanged, but a reduced elimination rate (KeM(+)/KeM = 0.35) led to a value of Ai,overall(M) = pAi,UGT(d) × pAi,CYP2C8 = 32. Conversely, the formation of Cer-L increased (fM(+)/fM = 2.38), with a reduced elimination rate (KeM(+)/KeM = 0.56), resulting in Ai,overall(M) = 1.97.
In the Cer + Itr DDI, the formation of M23 slightly increased (fM(+)/fM = 1.12) with a minor reduction in the elimination rate (KeM(+)/KeM = 0.64), leading to an Ai,overall(M) = 1.58. The formation of M1 slightly decreased (fM(+)/fM = 0.93) with no change in the elimination rate (KeM(+)/KeM = 1). The formation of Cer-L slightly increased (fM(+)/fM = 1.12), with a reduction in the elimination rate (KeM(+)/KeM = 0.53), resulting in Ai,overall(M) = 2.11.
The f
M(+)/f
M, K
eM(+)/K
eM, and A
i,overall(M) values are summarized in
Table 3.
3.4. Contribution of each Enzyme to the Metabolism of M23, M1 and Cer-L
The relative contribution of each enzyme to the metabolism of M23, M1, and Cer-L was estimated, as shown in
Table 4.
M23 was found to be metabolized approximately 33% by CYP3A4 (fm,CYP3A4(M)(M23) = 0.33), which is inhibited by Itr, while the remaining 67% of M23 was metabolized by UGT, an enzyme that is not inhibited by Gem. M1 was shown to be metabolized 100% by CYP2C8, to M24 which is inhibited by Gem. Cer-L was found to be metabolized 50% to 60% to M1-L by CYP3A4 (fm,CYP3A4(M)(Cer-L) = 0.5 to 0.6), an enzyme inhibited by Itr. The remaining 40% to 50% of Cer-L (fm,CYP2C8(M)(Cer-L) = 0.5 to 0.4) was converted to M23-L by CYP2C8, an enzyme inhibited by Gem.
3.5. Sensitivity Tests for fm,CYP3A4, “r” and pAi,UGT(d)
The sensitivities of fm,CYP3A4 to the optimal simulations (fm,CYP3A4 = 0.12) were tested. The results are presented in the following examples.
Example 1: Adjusting fm,CYP3A4 to 0.15 (from 0.12) and fm,CYP2C8 to 0.72 (from 0.75) led to an underestimation of the Ai,overall (4.39 instead of 4.76) and the AUCR (4.39 instead of 5.00) for the Cer + Gem DDI. As a result, this adjustment caused slightly lower-than-expected plasma levels of unchanged Cer.
Example 2: Assuming fm,CYP3A4 = 0.15 (from 0.12) and fm,UGT = 0.1 (from 0.13), while maintaining consistent KeM values between the Cer + Gem and Cer + Itr DDIs, did not yield a good fit for Cer-L levels.
The sensitivity of “r” to the optimal simulations (r = 0.3) was tested. The results are presented in the following examples.
Example 3: Adjusting fM (M23) = fm,CYP2C8 = 0.75 (with r = 1, from 0.3) did not result in a good fit for plasma M23 levels in the control group, even when adjusting KeM (= 0.75/h, from 0.31/h) for both the Cer + Gem and Cer + Itr DDIs. The fit could be improved by nearly tripling the value of one of the distribution parameters (V0M) for M23. However, this adjustment violates the rules established in the present study.
Example 4: Adjusting fM (M23) = 0.5 × fm,CYP2C8 = 0.385 (with r = 0.5) did not provide a good fit for plasma M23 levels in the control group, even when adjusting KeM (= 0.75/h, from 0.31/h) for both the Cer + Gem and Cer + Itr DDIs.
The sensitivity of pAi,UGT(d) to the optimal simulations (pAi,UGT(d)= 2) was tested. The result is presented in the following examples.
Example 5: Setting pAi,UGT(d) = 1 for Gem, indicating no inhibition of UGT, resulted in fM(+)/fM for Cer-L increasing to 3.33 (from 2.38) for the Cer + Gem DDI. As a result, KeM(+)/KeM = 1, indicating no CYP2C8-mediated elimination of Cer-L. However, this condition produced a lower-than-expected plasma Cer Levels (AUCR =3.48<5.00), which contradicts previous findings from the analysis of CYP2C8-mediated DDIs. Setting pAi,UGT(d) = 1.5 also produced a lower-than expected plasma Cer levels (AUCR =4.37<5.00) .
Example 6: Despite a good fit in the plasma Cer levels (AUCR = 5.00), setting pAi,UGT(d) = 2.5 results in a KeM(+)/KeM ratio of 0.4. As a result, fm,CYP2C8(M) (0.69) exceeded the limit of 1 - fm,CYP3A4(M).
Further details can be found in Supplementary Material (SM8).
3.6. Prediction of fM(+)/fM and KeM(+)/KeM for each Metabolite in the Cer + Gem + Itr DDI
In the Cer + Gem + Itr DDI, the A
i,overall value for Cer was calculated as 1/(0.13/2 + 0.75/32 + 0.12/10), resulting in an A
i,overall of 9.96. Accordingly, the f
M(+)/f
M ratios for M23, M1, and Cer were determined to be 0.31, 0.43, and 5, respectively, using Equation 10 through Equation 12. The K
eM(+)/K
eM value for M23 was assumed to be the same as in the Cer + Itr DDI (0.64), since the elimination rate would not be affected by Gem. Similarly, the K
eM(+)/K
eM value for M1 was assumed to be the same as in the Cer + Gem DDI (0.35), as the elimination rate would not be affected by Itr. The extremely low K
eM(+)/K
eM value for Cer-L (ranging from 0.072 to 0.080) was determined based on the large A
i,overall(M)(Cer-L) value (ranging from 13.8 to 15.2), calculated using Equation 19. These values are summarized in
Table 5.
4.7. Prediction of AUCR(M) for Each Metabolite in the Cer + Gem + Itr DDI
The AUCR(M) values for each metabolite in the Cer + Gem, Cer + Itr, and Cer + Gem + Itr DDIs were predicted by calculating [f
M(+)/f
M] × [K
eM/K
eM(+)]. These predicted values were then compared with the observed values and also with the AUCR of Cer (
Table 6).
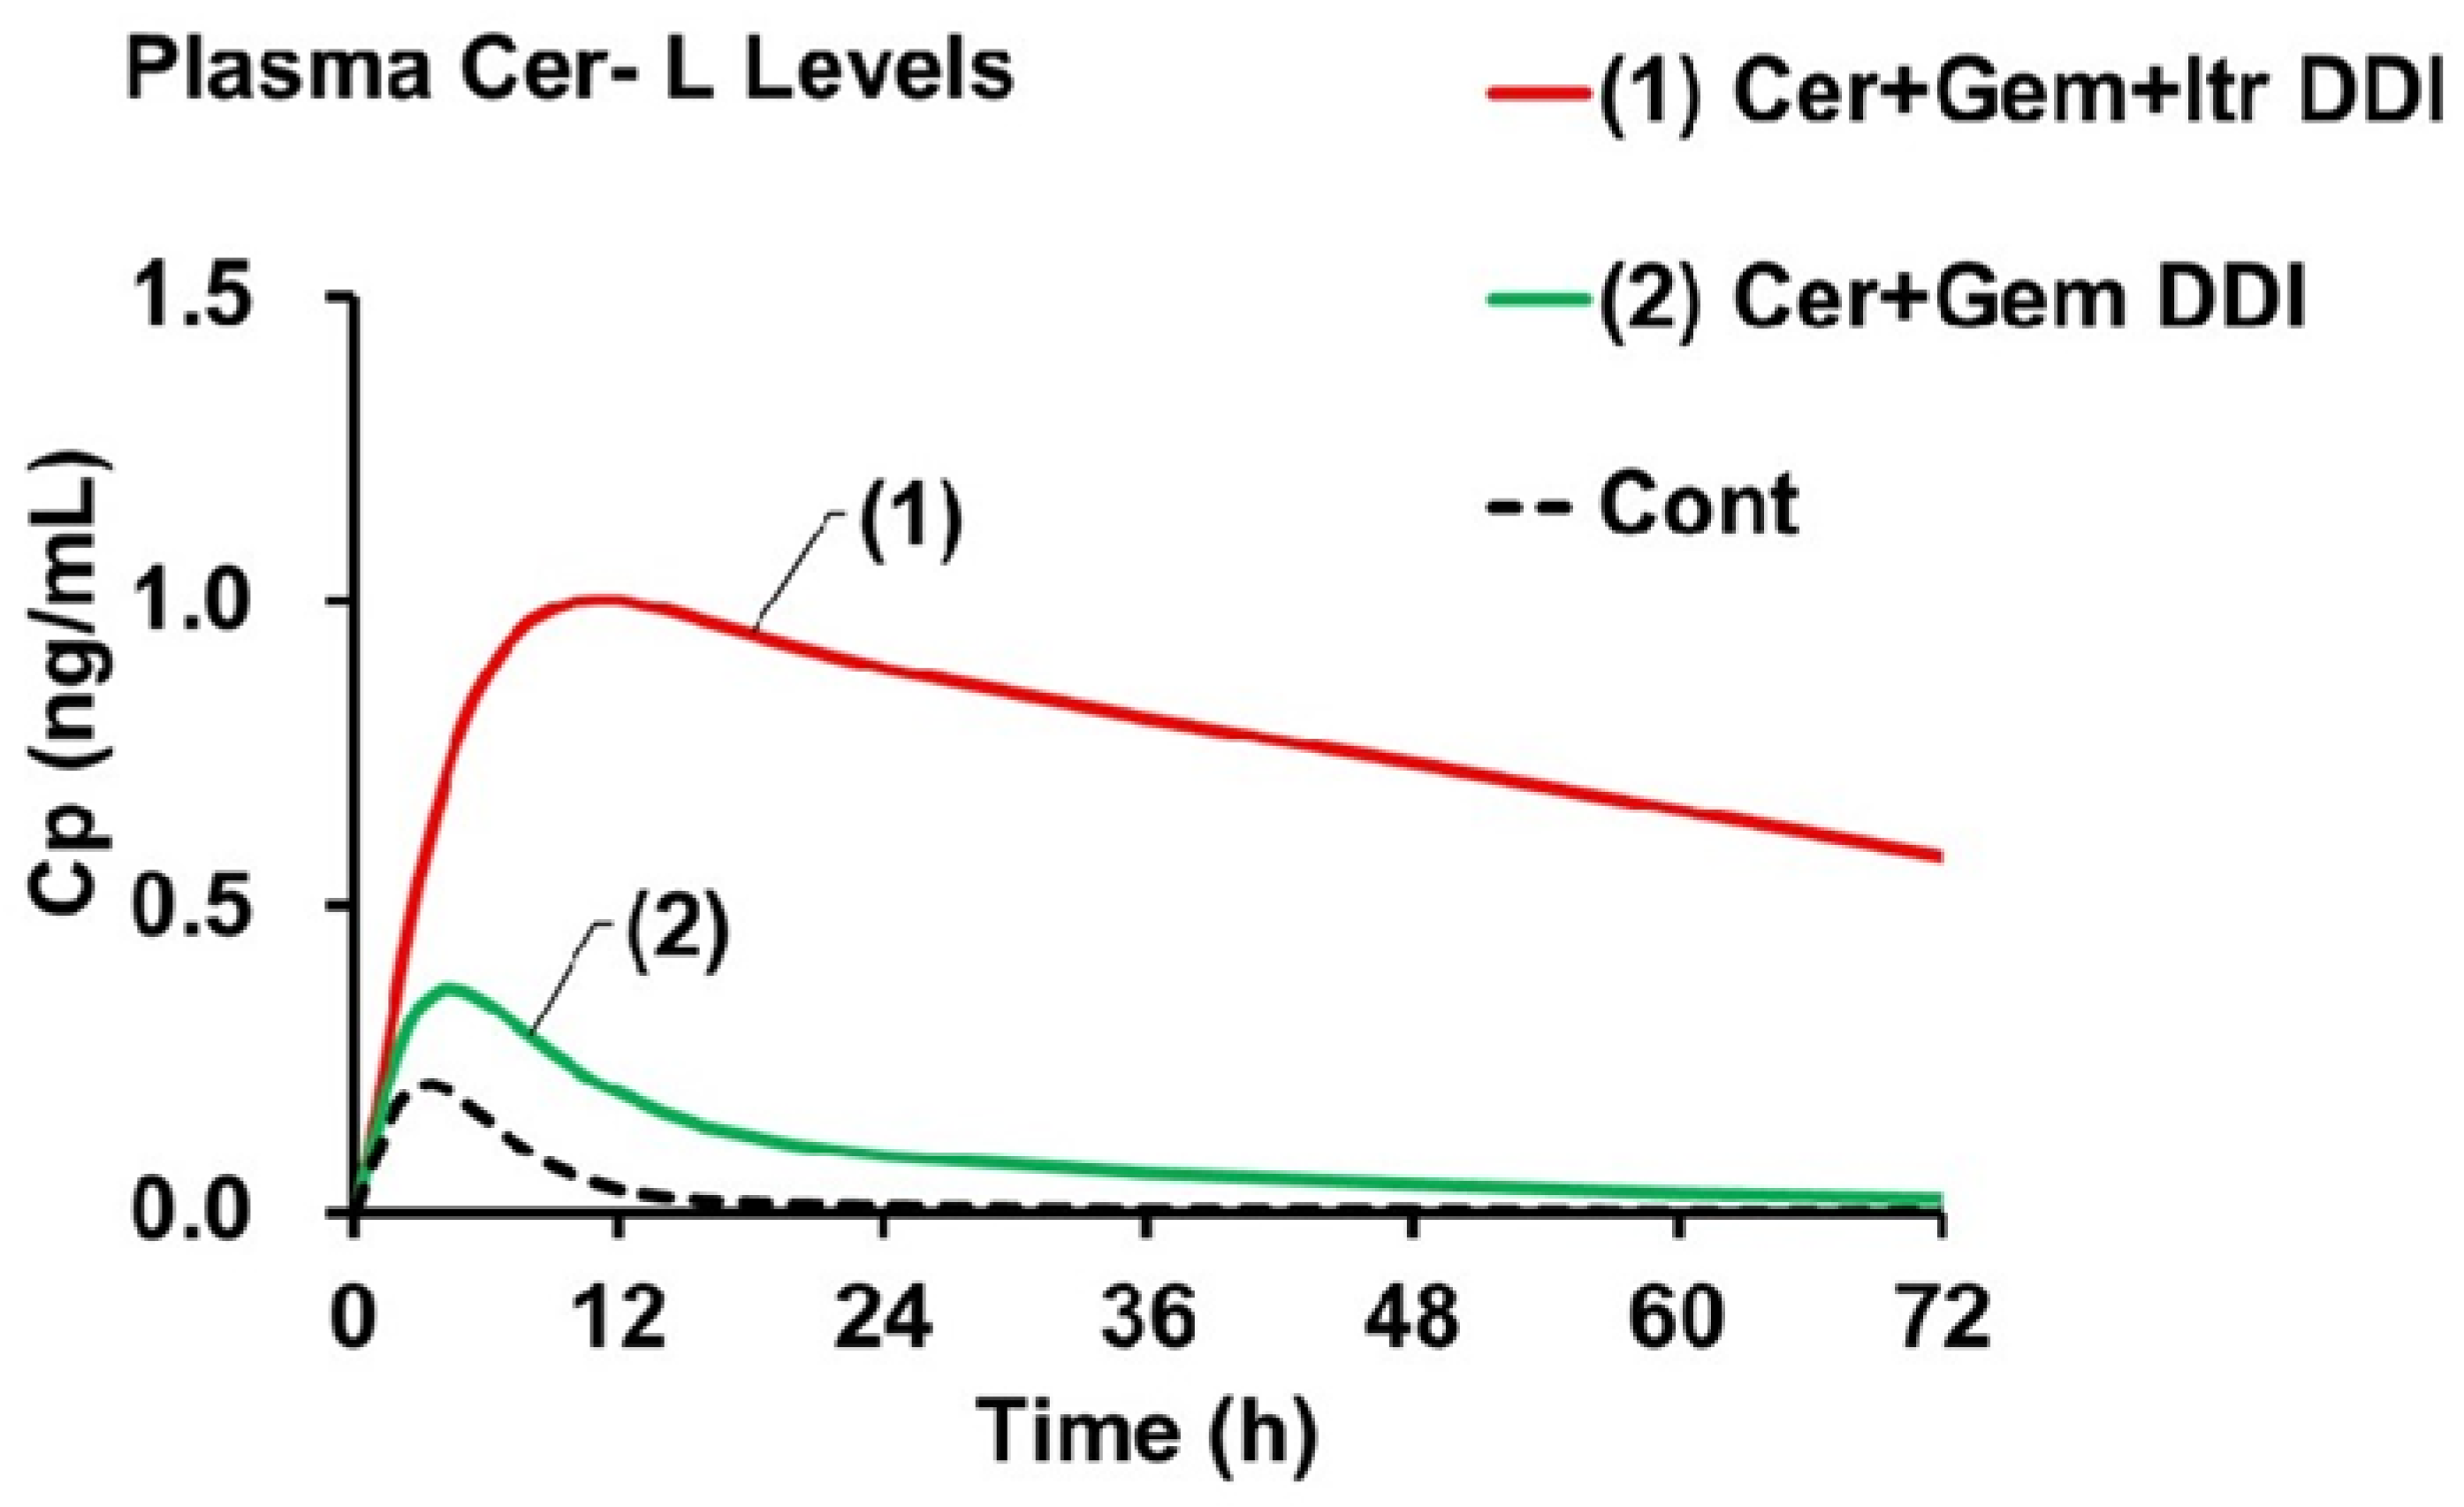
The AUCR of Cer in the Cer + Gem + Itr DDI (approximately 10) was predicted to be double that observed in the Cer + Gem DDI (approximately 5). The AUCR of Cer-L [AUCR(M)(Cer-L)] (ranging from approximately 62 to 72) was predicted to be 15 to 17 times higher compared to Cer + Gem (4.2). In contrast, the AUCR(M) values for M23 and M1 in Cer + Gem + Itr did not show significant changes.
Figure 4 shows the plasma Cer-L levels in the Cer + Gem and Cer + Gem + Itr DDIs compared to the control group. The increases in C
max were primarily influenced by f
M(+)/f
M, while the decreases in t
1/2 were mainly determined by K
eM(+)/K
eM.
4. Discussion
The primary objective of this study is to predict changes in plasma levels of Cer and its metabolites during Gem-induced DDIs using a novel DDI analysis method, the Metabolite-Linked Model. Specifically, we aim to evaluate the potential for an abnormal increase in plasma Cer-L levels when Cer is combined with Gem and Itr. We initiated our study by simulating plasma Cer levels using the DDI prediction model, which was developed based on unchanged drug levels. The model effectively predicted changes in plasma Cer levels for both the Cer+Gem and Cer+Itr DDIs. From these simulations, we determined the PK parameters of Cer and Ai, overall, as a function of AUCR and Fh. The Ai, overall for the Cer+Gem DDI was notably higher (4.76) compared to typical DDIs. The value of Fh (~0.9) had minimal impact on the Ai,overall determination based on the observed AUCR (5.00) for this DDI.
Key enzymes involved in Cer metabolism were identified through the mechanistic analysis of Ai, overall. Results revealed that Cer’s elimination is primarily mediated by three enzymes: CYP2C8, UGT, and CYP3A4. The relative contributions of these enzymes to Cer’s total elimination were quantified using the mechanistic equation for Ai,overall: fm,CYP2C8 = 0.75, fm,UGT = 0.13, and fm,CYP3A4 = 0.12. Additionally, the pAiCYP2C8 and pAi,UGT(d) for Gem were 16 and 2, respectively, while the pAi,CYP3A4 for Itr was 10. These findings were confirmed through sensitivity testing of plasma Cer and metabolite levels (Examples 1 and 2).
The value pA
i, UGT(d) = 2 for Gem plays a pivotal role in our analysis when Gem is co-administered, as it influences the f
m,CYP2C8(M) estimate and, subsequently, the AUCR(M) of plasma Cer-L levels in the Cer + Gem + Itr DDI. Previous studies suggest that Gem’s competitive binding inhibits the distribution of CYP2C8 substrates to UGT, with Gem’s metabolite (Gem-O-glu) also inhibiting CYP2C8 [
6]. This inhibition is reflected by the equation 1/pA
i,UGT-CYP = [f
m, UGT + f
m, CYP2C8 / pA
i,CYP2C8] / pA
i, UGT(d), showing that UGT inhibition impacts the entire metabolic system. While the pA
i, CYP2C8 for Gem was determined experimentally, the pA
i, UGT(d) value was derived through DDI simulation method [
6]. In vitro studies have shown that Gem’s inhibitory effect on UGT is relatively weak, with IC
50 values for similar compounds ranging from 36 μM to 113 μM [
30,
32,
34]. Given that Gem’s maximal plasma concentration is approximately 100 μM [
6], the pA
i, UGT(d) value of 2 is considered reasonable. Although in vitro confirmation of this value is ideal, our DDI simulation approach including sensitivity tests provides reliable insights into the elimination kinetics of Cer-L.
Determining the f
M of each metabolite is crucial for assessing the pK of Cer’s metabolites. Due to the unavailability of specific data on Cer’s metabolic pathways, we assumed that Cer-L is predominantly formed via UGT-based glucuronidation (f
M = f
m,UGT(d) = 2). Additionally, we assumed that M23 and M1 are formed from the remaining 87% via CYP2C8 and CYP3A4. CYP3A4 produces only M1, while CYP2C8 produces both M1 and M23. Although the exact proportion of M23 generated by CYP2C8 was uncertain, it has been estimated to be around 40% [
13]. Nevertheless, we could determine the accurate value of 30% through the DDI simulation. As a result, we concluded that M23 and M1 are produced from 22.5% and 65.4% of the absorbed Cer, respectively. Therefore, the f
M values for M23, M1, and Cer-L are 0.225, 0.654, and 0.13, respectively.
Determining the elimination rate (KeM) for each metabolite is essential for evaluating the PK parameters of each metabilite. We determined the best-fit KeM value by simulating plasma levels of each metabolite in the control group using the Metabolite-Linked Model. This simulation assumed predetermined formation extent (fM) values and distribution parameters (V0M, VdssM, KdM) equivalent to those of Cer. From these simulations, we calculated the total body clearance (CLtotM = KeM × V0M) and FhM for each metabolite, providing the full PK profile. This approach is the first to determine PK parameters for metabolites, which is generally challenging due to the difficulty in identifying metabolite-specific parameters from the PK profile of the parent drug alone.
To predict changes in plasma levels of each metabolite, we first determined the change in the fM(+)/fM due to the DDI. In the Metabolite-Linked Model, the fM(+)/fM ratio for each metabolite is calculated using Equations 10 to 12. If the formation of the metabolite is unaffected by the perpetrator drug, the fM(+)/fM ratio equals Ai, overall. This implies that the formation extent increases with overall inhibitory activity. For metabolites formed by enzymes inhibited by the perpetrator, the formation extent will vary depending on the extent of inhibition. For example, in the Cer + Gem DDI, the formation of M23 decreased to nearly 1/7, while the fM(+)/fM value for Cer-L increased to 2.38. In contrast, the formation of M1 in both Cer + Gem and Cer + Itr DDIs remained largely unaffected.
Changes in the elimination rate (KeM(+)/KeM) of each metabolite are also crucial for simulating plasma metabolite levels. Best-fit simulations showed that the elimination rate of M23 was unaffected in the Cer + Gem DDI, indicating that M23 is not a substrate of CYP2C8. However, in the Cer + Itr DDI, the elimination rate of M23 decreased to 64%, suggesting that M23 is partially metabolized by CYP3A4, which is inhibited by Itr. The elimination rate of M1 decreased by 35% in the Cer + Gem DDI, while it remained unchanged in the Cer + Itr DDI. This decrease in M1’s elimination is attributed to Gem’s strong inhibition of its metabolism, as indicated by an FhM(+) increase from zero. The elimination rates of Cer-L in both DDIs decreased by about 50%, suggesting importantly that CYP3A4 and CYP2C8 are primarily responsible for its elimination.
The overall inhibitory activities in metabolite elimination, Ai,overall(M), were determined using the mechanistic term Ai,overall(M) with KeM(+)/KeM. For M23 in the Cer + Gem DDI, the Ai,overall(M) was 1, indicating no involvement of CYP2C8 or UGT, with CYP3A4 contributing approximately 33%. In the Cer + Gem DDI, the Ai,overall(M) for M1 was 32, while in the Cer + Itr DDI, it was 1, suggesting that CYP2C8 solely eliminates M1. For Cer-L, Ai,overall(M) was around 2 in both DDIs, indicating equal contributions from CYP3A4 and CYP2C8.The metabolic products of M23 are proposed to be M24 (oxidation by CYP3A4) and M23-G1 (glucuronidation), while M1 is oxidized by CYP2C8 to form M24. For Cer-L, the proposed metabolic products are M1-L (oxidation by CYP3A4) and M23-L (oxidation by CYP2C8).
The final goal is to predict the significant increase in plasma Cer-L levels in the Cer + Gem + Itr DDI using the Metabolite-Linked Model. The predicted AUC for Cer-L showed an unprecedented increase (AUCR(M) ≈ 70), which is unique compared to M23 and M1. This increase is attributed to the exclusive metabolism of Cer-L by CYP2C8 and CYP3A4, with both enzymes contributing equally. The increase in plasma Cer-L levels results from two factors: an increase in the formation extent (≈ 5), which is roughly half of the AUCR of the parent drug, and a decrease in the elimination rate (approximately 1/13). These parameters were used to generate the plasma concentration profile of Cer-L as shown in
Figure 4, showing that the increase in C
max corresponds with the increase in formation extent, while the plasma concentration’s half-life corresponds with the decrease in the elimination rate constant.
When analyzing the PK of Cer and Cer-L, a critical factor to consider is the hydrolysis of Cer-L. Cer-L, in its lactone form, undergoes hydrolysis, reverting to its parent compound Cer). This hydrolysis process is known to be rapid under acidic conditions; however, under physiological pH, the rate of elimination is slower. The estimated elimination rate constant for Cer-L is 0.028/h, based on a half-life of approximately 24 hours for simvastatin [
35]. Using this value, the systemic hydrolysis clearance for Cer-L is approximately 0.5 L/h (calculated as K
e × V
0).
In the Cer + Gem + Itr combination, the hepatic availability of Cer-L (F
hM(+)) has been estimated at 0.98, as shown in
Table 5. This led to an estimation of systemic clearance for Cer-L in co-administration scenarios of 1.6 L/h (calculated as E
hM × Q
h × blood/plasma ratio). When comparing these values, it appears that hydrolysis accounts for approximately 30% of the total clearance. As a result, the AUCR of Cer-L should be approximately 30% lower than previously calculated.
It remains unclear whether Cer, Cer-L, or their combination causes adverse events such as rhabdomyolysis. However, clinical trials that administered Cer with Gem did not report any significant adverse events [
12]. To determine which element may be responsible for the adverse events, the predicted AUCR for both Cer and Cer-L in the Cer + Gem + Itr DDIs should be compared to the Cer + Gem DDI as a reference. This comparison shows that the fold increases in AUCR(Cer) and AUCR(Cer-L) for the Cer + Gem + Itr DDI are approximately 2 and 17, respectively. This analysis suggests that the rise in Cer-L plasma levels may be a more likely contributor to adverse events, particularly rhabdomyolysis. While the exact mechanism of Cer-L’s adverse effects is not fully understood, it is believed that Cer-L can be converted back into its active form (Cer) through paraoxonase (PON1)-dependent hydrolysis in peripheral tissues [
36,
37]. This site-specific delivery of Cer may impact mitochondrial pathways, potentially leading to muscle toxicity and rhabdomyolysis [
38].
Clopidogrel is a potent CYP2C8 inhibitor, with an inhibitory constant of 8 [
6], making it a potential alternative to Gem in DDI studies. Prior research examined the interactions between Clopidgrel and Cer [
39], but no definitive conclusions were reached. Therefore, understanding the impact of Clopidogrel on the PK of Cer, particularly when replacing Gem, is valuable. While the co-administration of azole antifungals like Itr with cer is uncommon [
40], other CYP3A4 inhibitors, such as diltiazem (a calcium channel blocker), are frequently used in combination with statins [
41]. Diltiazem is a mild CYP3A4 inhibitor [
42], and its interaction with Cer could be more relevant. A preliminary analysis indicates that the AUCR for Cer-L when Clopidogrel and Itr are co-administered is approximately 30. In contrast, co-administration of Gem and diltiazem results in an AUCR for Cer-L of 12. Though the Gem + diltiazem is less pronounced than the Gem + Itr combination, the rise in Cer-L plasma levels in these co-administration scenarios could still contribute to the adverse effects associated with Cer, including rhabdomyolysis.
The utility of the Metabolite-Linked Model used for predicting DDIs is comfirmed. It provides a valuable tool for analyzing complex interactions involving different types of inhibitors, such as CYP2C8 and CYP3A4 inhibitors. This method is particularly effective when changes in both the parent compound and its metabolites are observed. One of its key strengths is its ability to analytically calculate the plasma concentration time course of metabolites based on the parent compound’s PK. This involves estimating both the formation extent and elimination rate of the metabolite.The method assumes that the volume of distribution of the metabolite is the same as that of the parent compound, a reasonable assumption that still requires validation through further studies. Current investigations are underway to confirm this assumption across multiple drugs. Additionally, the method evaluates changes in elimination rates by fitting plasma concentration data and estimating the formation extent based on enzyme relative contributions to plasma clearance, often guided by in vitro studies. This approach enables accurate predictions of the impact of drug interactions on both parent compounds and metabolites.
6. Conclusions
The primary cause of the widespread fatal rhabdomyolysis associated with Cer has been identified as the co-administration of the CYP2C8 inhibitor Gem. However, the PK mechanisms behind this severe adverse effect were previously unclear.
Using our newly developed DDI analysis approach, which incorporates the Metabolite-Linked Model, we were able to demonstrate that combining Cer with Gem and a CYP3A4 inhibitor significantly reduces the clearance of Cer-L. This results in a dramatic increase in plasma Cer-L levels, with a maximal rise of up to seventy-fold.
The Metabolite-Linked model, integrated into a static two-compartment framework, allows for the simultaneous analysis of both the parent drug and its metabolites. This model enables the concurrent evaluation of two types of DDIs involving different enzyme inhibitors, while sharing multiple key parameters (e.g., fm,CYPs, fm,UGT, pAi,CYPs, pAi,UGT(d), V0 (= V0M), Vdss (= VdssM), Kd (= KdM), metabolite-specific fM, and KeM). By resolving these parameters, which cannot be accurately determined in single DDI analyses, the model provides more reliable predictions of DDIs.
As demonstrated in the Cer-L case, this method proves particularly valuable during clinical drug development. It helps assess the risks associated with metabolites of safety concern and predict changes in plasma concentrations under metabolic inhibition.