
Submitted:
14 March 2025
Posted:
17 March 2025
You are already at the latest version
Abstract
In this study, we analyze the suitability of using CHIRPS, CMORPH and TRMM platforms (PPS) in monitoring precipitation extreme events, precipitation-runoff relationships, and seasonal/year-to-year variability on the Saltito semiarid subbasin in the Mexican state of Durango. Satellite precipitation products (PPS) in 16 sites were contrasted point to point with data from rainfall gauge stations and with daily temporal resolution for the period of four years (2015-2019). Using this information, we construct Rx1d, Rx2d, R25 mm, and RR95 extreme rainfall indices. For precipitation-runoff relationships, a runoff model based on the Storm Water Management Model (SWMM) was calibrated and validated with gauge data, and we get Qx1d, Qx2d, and Qx3d runoff indices. We use Bias Volume (%), MSE, Correlation coefficient, and Median vias to evaluate the ability of satellite products to detect and analyze extreme precipitation and run flow events. Although these sensors tend to overestimate both precipitation levels and the occurrence of extreme precipitation events, their high spatial and temporal resolution makes them a reliable tool for analyzing trends in climate change indices. As a result, they serve as a useful resource for evaluating the intensity of climate change in the region, particularly in terms of precipitation patterns. They also allow hydrological modeling and observe precipitation-runoff relationships acceptably. It is relevant in the absence of precipitation and hydrometric information, which is usually common in vast regions of the developing world.
Keywords:
Extreme precipitation events
; Extreme runoff events
; Runoff modeling
; Satellite precipitation products
; Storm Water Management Model
; SWMM
1. Introduction
Climate change has intensified the frequency and magnitude of extreme precipitation events, particularly in semiarid regions where water resources are already scarce and highly variable. Accurate monitoring and analysis of these events are crucial for effective water resource management, flood forecasting, and climate change adaptation[1,2]. However, in many developing regions, including semiarid sub-basins in Mexico, the lack of dense ground-based precipitation and hydrometric networks poses significant challenges for hydrological studies[3,4]. Satellite-derived precipitation products (PPS) have become a viable solution, providing extensive global coverage and high-frequency data, making them especially beneficial for areas with limited access to ground-based measurements. [5,6].
Precipitation, a key element of the Earth's water cycle, links atmospheric and surface processes, playing a critical role in hydrology, meteorology, and climatology. [7,8]. Under the influence of global warming, with the enhancement of evapotranspiration at the surface, atmospheric moisture content in the air increases, water cycle movement intensifies, and floods, storms, snowstorms, typhoons, and other extreme precipitation events have significantly increased in frequency and intensity[9,10]. Floods caused by extreme precipitation, droughts, snowstorms, and other extreme climate hazards disasters, which have a significant impact on society's economic development, ecosystems and human activities[11,12].
Precipitation is the main component for estimating the runoff in a region. Various authors [13,14] warn that a single weather station is responsible for a false prediction if it is not representative of the hydrographic surface due to the importance of precipitation as the main input for runoff modeling. Researchers have used radar to get precipitation data for building runoff simulations and flood forecast computational models. They have successfully reflected the hydrological situation of the study area [9,13] However, achieving sufficient spatial coverage of radar precipitation technology in large basins is complex, and it still has the disadvantage of spatial distribution limitation.
Satellite-based precipitation data has gained growing popularity in hydrological and climatological research because of its capacity to deliver spatially comprehensive and temporally uniform information, particularly in areas where ground-based monitoring is sparse.[7,15]. Several studies have demonstrated the utility of these products in monitoring extreme precipitation events and their impacts on runoff and water resources[16,17]. CHIRPS combines satellite imagery with in situ station data to provide high-resolution precipitation estimates. It has been widely used in regions with sparse ground-based networks, such as Africa and Latin America[18,19]. Studies have shown that CHIRPS performs well in capturing seasonal precipitation patterns and extreme events, particularly in semiarid and arid regions[9,20]. For example, in East Africa, CHIRPS was found to accurately represent the spatial and temporal distribution of rainfall, making it a valuable tool for drought monitoring and early warning systems[9,21].
CMORPH uses a morphing technique to blend satellite-derived precipitation estimates, providing high temporal resolution (30 minutes to 3 hours) and global coverage[22,23]. Studies have emphasized CMORPH's effectiveness in detecting the intensity and spatial patterns of extreme precipitation events. However, it has been observed to overestimate light rainfall and underestimate heavy rainfall in certain areas. In semiarid regions, CMORPH has been utilized to analyze the effects of extreme rainfall on flash flooding and soil erosion [14,24]. TRMM, although no longer operational, has been a cornerstone in satellite precipitation research. Its successor, the Global Precipitation Measurement (GPM) mission, continues this legacy[25,26]. TRMM has been extensively used to study extreme precipitation events and their relationship with runoff in various climatic regions. For example, in the Amazon Basin, TRMM data were used to analyze the impact of extreme rainfall on river discharge, demonstrating its utility in large-scale hydrological modeling[24,27]. In semiarid regions, TRMM has been used to assess the variability of monsoon rainfall and its impact on water resources [28,29].
Satellite data has the advantages of continuous spatial distribution, large coverage area, and uniform distribution. Therefore, studying extreme climate characteristics in small local watersheds with dense ground station data can achieve good results [30,31]. However, accuracy is poor in large watersheds with sparse site distribution. To compensate for the shortcomings of the lack of traditional climate stations in some basins, some researchers use the spatial interpolation methods to lattice the data of ground stations in order to achieve the effect of uniform distribution, but the accuracy of the results needs to be further verified[32,33].
Currently, research on extreme climates focuses on simple analysis of precipitation and temperature data based on data collected at meteorological sites while studies on re-analysis fusion data are rare. With the continuous development of satellite remote sensing, data fusion, and other advanced technologies, atmospheric data-fusion products have been widely used in areas with no or scarce data[28,34].
In this study, we evaluate the suitability of three widely used satellite precipitation platforms CHIRPS (Climate Hazards Group InfraRed Precipitation with Station data)[18,19] CMORPH (CPC MORPHing technique)[14,35] and TRMM (Tropical Rainfall Measuring Mission)[36,37] for monitoring extreme precipitation events, analyzing precipitation-runoff relationships, and assessing seasonal and year-to-year variability in the Saltito semiarid sub-basin, located in the Mexican state of Durango. This region is characterized by low annual rainfall, high climatic variability, and frequent extreme weather events, making it an ideal case study for evaluating the performance of satellite products in semiarid environments[28,31].
2. Materials and Methods
2.1. Study Area
The polygon of study area was obtained from the hydrological network available at INEGI (https://www.inegi.org.mx/temas/hidrologia. The El Saltito (saS) (Figure 1), located in the Mexican state of Durango, in the northern part of the country. It lies between the parallels corresponding to 22°40' and 26°50' north latitude and between the meridians 102°25'55" and 107°08'50" west latitude about the Greenwich Meridian [38]. The study area corresponds to an approximate drained area of 11,942 km2. It is within the Mezquital River basin, with the main River stream being El Rio Durango. The hydrological network begins in the Sierra de La Cacaria stream, formed by the Mimbres Stream and the Sauceda River. The hydrometric station "El Saltito" has records of the average daily discharge for this area from 1956 to 2019 [39,40].

Table 1.
Rain Gauge station located within the El Saltito sub-basin.
| KEY | NAME | STATE | LAT | LON | HEIGHT (msnm) |
Topograpy |
|---|---|---|---|---|---|---|
| 10002 | Canatlán/SMN) | Durango | 24.55 | 104.74 | 1960 | Plane |
| 10016 | Chinacates | Durango | 25.01 | 105.21 | 2050 | Mountain |
| 10022 | El Pino | Durango | 24.62 | 104.87 | 2100 | Mountain |
| 10024 | El Saltito | Durango | 24.03 | 104.35 | 1847 | Plane |
| 10027 | Francisco I. Madero | Durango | 24.4 | 104.32 | 1960 | Plane |
| 10030 | Guadalupe Victoria [40] | Durango | 24.45 | 104.12 | 2000 | Plane |
| 10051 | Otinapa | Durango | 24.05 | 105.01 | 2400 | Mountain |
| S10066 | San José de Acevedo | Durango | 23.81 | 104.27 | 2100 | Mountain |
| 10076 | Santiago Bayacora | Durango | 23..9 | 104.6 | 2150 | Mountain |
| 10083 | Tejamén | Durango | 24.81 | 105.13 | 1930 | Plane |
| 10090 | Canatlán [40] | Durango | 24.52 | 104.78 | 2000 | Plane |
| 10092 | Durango [40] | Durango | 24.02 | 104.67 | 1900 | Plane |
| 10103 | Santa Barbara [40] | Durango | 23.82 | 104.93 | 2260 | Mountain |
| 10110 | Hacienda La Pila | Durango | 24.12 | 104.29 | 1890 | Plane |
| 10137 | Guatimape | Durango | 24.81 | 104.92 | 1974 | Plane |
2.2. Datos
2.2.1. Satellite Precipitation Products
We utilized the fusion data CHIRPS, CMORPH, and TRMM satellite precipitation products to analyze the suitability of using CHIRPS, CMORPH, and TRMM platforms (PPS) in monitoring precipitation extreme events, precipitation-runoff relationships, and seasonal/year-to-year variability. Satellite precipitation products (PPS) in 16 sites were contrasted point to point with data from rainfall gauge stations and with daily temporal resolution for four years (2015-2019). Table 2 provides a brief description of these four PPSs. CHIRPS emerged from a collaborative effort involving scientists at the USGS Earth Resources Observation and Science (EROS) Center [41,42]. It is a critical tool for providing accurate, up-to-date, and extensive datasets that aid in early warning systems, such as evaluating trends and tracking drought conditions across seasons. The platform delivers global precipitation information at a high resolution of 0.05°, with data available at daily, monthly, and yearly intervals[17,43]. CHIRPS datasets span from 1981 to the present. Daily CHIRPS data with a spatial resolution of 0.25° was utilized for this research to evaluate its suitability for hydrological-related analyses.
The TRMM (Tropical Rainfall measuring mission) tropical Satellite precipitation program covers the global range of 38°N~38°S [44,45].The TRMM (Tropical Rainfall Measuring Mission) satellite was launched into space in 1997 in a joint mission between NASA (National Aeronautics and Space Administration) and JAXA (Japan Aerospace and Exploration Agency)[46,47]. The TRMM satellite was the first satellite with the specific objective of monitoring tropical precipitation [48,49]. The TRMM satellite's orbit is a polar orbit with an inclination of 35° and an altitude of 403 km (as of 2001), with a period of 92.5 minutes (about 16 times per day). This orbit provides detailed spatial resolutions to capture the variation of the diurnal cycle of tropical Rainfall [50,51].
On board the TRMM satellite, different sensors for different spectral bands exist. The sensors on board the satellite and their characteristics are TMI (TRMM Microwave Imager), PR (Precipitation Radar), VIRS (Visible and Infrared Radiometer System), and TMPA [52]. All of them are converted to the TSDI (TRMM Science Data and Information System) precipitation estimation with the GPROF version of the algorithm [53,54]. In the case of rainfall AMSU estimation, the estimate is converted by NESDIS (National Environmental Satellite Data and Information Service) with the algorithm proposed by [55].
The most recent CMORPH V1.0 release includes three distinct versions: CMORPH RAW, CMORPH CRT, and CMORPH BLD [56,57]. CMORPH RAW is a satellite-derived precipitation dataset that integrates passive microwave (PMW) estimates from various low-orbiting satellites with infrared (IR) data collected from multiple geostationary satellites [42,58]. The CMORPH CRT version is developed by calibrating CMORPH RAW against the CPC unified daily gauge analysis over land and the Global Precipitation Climatology Project (GPCP) pentad data over oceans, utilizing a probability density function technique for bias correction[43,58]. The CMORPH BLD product is further refined by incorporating optimal interpolation (OI) methods, combining additional gauge analyses to enhance accuracy [44,59].
2.2.2. Rain and Hydrometric Gauge Data
From 2014 to 2019, daily rainfall data were collected at 16 weather stations (Table 1) and Average Daily flow was obtained by The hydrometric station "El Saltito", located in the outlet for sub-basin El Saltito (saS. Climate data were provided by the National Water Commission (CONAGUA). The digital elevation model [60] maps were provided by the National Institute of Statistics and Geography (INEGI; https://www.inegi.org.mx/temas/edafologia/). The comparison between on-site measurements and satellite precipitation data was made point-by-point. processed with the help of free-to-use software Java(http://jdk.java.net/), RStudio (https://github.com/rstudio/rstudio), Python (https://www.python.org/).
2.3. Methods
2.3.1. Extreme Rainfall and Runoff Indices
The Expert Team on Climate Change Detection and Indices (ETCCDI), established by the World Meteorological Organization, has created a series of metrics to track extreme climate events, particularly emphasizing temperature and precipitation extremes. These metrics are essential for evaluating climate extremes[45,61]. The indices related to extreme precipitation are calculated using daily precipitation data and are designed to be simple in concept, broadly applicable, and statistically reliable. They demonstrate minimal noise and high significance, facilitating a thorough examination of the intensity, frequency, and duration of extreme temperature and precipitation events. They exhibit low noise levels and high statistical significance, enabling a detailed analysis of the intensity, frequency, and duration of extreme temperature and precipitation events. These indices provide a robust framework for studying and interpreting the patterns of extreme climate events [62,63].
These indicators are commonly employed to evaluate precipitation products (PPSs) ability to represent extreme precipitation events accurately. This study focuses specifically on intense precipitation due to its direct association with flooding, which significantly impacts water resource management, natural ecosystems, and human livelihoods[46,48]. Additionally, extreme runoff events were analyzed. The research utilized widely recognized extreme runoff indices, as referenced in prior studies. Researchers globally have shown significant interest not only in extreme meteorological events but also in extreme runoff phenomena. These include high runoff events linked to flood risks and low runoff events associated with drought conditions [64,65].
To study extreme runoff characteristics, methods such as the annual maximum sampling, peak-over-threshold sampling, and quantile sampling are typically employed. High runoff events are often described using attributes like peak flow, flood volume, and duration, while low runoff events are characterized by flow frequency[66,67]. The choice of sampling methods and attribute indicators depends on the specific research context. In this study, the maximum runoff over 1, 3, 5, and 7 days was selected to analyze extreme runoff patterns in the watershed [68,69].
2.3.2. Accuracy Assessment Methods
To assess the effectiveness of PPSs in modeling extreme rainfall and runoff, Table 3 [72,73] outlines these indices in detail. Statistical measures such as Pearson’s correlation coefficient (R), relative bias (BIAS), mean error (ME), and root mean square error (RMSE) were utilized to compare PPSs with observations from gauges. R evaluates the linear relationship's strength, BIAS identifies systematic deviations, and RMSE and ME measure the average magnitude of errors[74,75]. A perfect agreement is indicated by an R-value of 1, while BIAS, RMSE, and ME values of 0 signify optimal performance, Table 4. These metrics were computed using the programming tool R Studio to ensure data consistency and accuracy.
2.3.3. Hydrologic Model Calibration
The Storm Water Management Model (SWMM) is a real-time computational tool designed to simulate and analyze surface hydrology and stormwater systems. It functions as a dynamic model that captures the entire rainfall-runoff process, including the response of stormwater pipe networks [76,77]. Developed in the United States during the 1970s, SWMM provides detailed outputs for surface and pipe network conditions. For surface hydrology, it generates data on rainfall patterns, infiltration losses, evaporation rates, and the final storage of surface water [78,79]. Stormwater networks offer insights into lateral inflows, hydraulic head, water depth, and other critical parameters related to pipes, nodes, and discharge points [40,80].
A notable feature of SWMM is its capability to function as a distributed, physically based hydrological model at the basin scale[81,82]. The system segments the study area into smaller sections called Hydrological Response Units (HRUs), which are determined by factors like land use, vegetation cover, soil characteristics, and the natural drainage network[60,83]. These HRUs enable the simulation of water balance components at a sub-basin level [84,85]. The runoff generated from these units is then combined into stream networks and directed toward the watershed outlet [76,86].
A notable extension of SWMM is PCSWMM, which integrates advanced functionalities for simulating flood-prone areas, water depths, and flood risks during extreme rainfall events Table 5[87,88]. PCSWMM also incorporates ArcGIS capabilities, providing a user-friendly interface and enhanced operational efficiency[89,90]. Additionally, it supports 2D flood analysis, offering a more comprehensive assessment of flood dynamics [91,92]. In a recent application, PCSWMM was utilized with data from 2015 to 2019, split into a calibration phase (2015–2017) and a validation phase (2018–2019). During calibration, the necessary model parameters were fine-tuned to ensure accurate simulations.
3. Results and Discussion
3.1. Satellite Product Comparison
For a large sub-basin such as the present study area, the systematization of the spatial – temporal distribution of precipitation is of importance, due to the spatial variability of precipitation. The Saltito sub-basin has high mountainous zones to the northwest and the southwest and valleys to rest of the area, which have different precipitation ranges[93,94]. If the other variables, such as soil moisture, temperature, are similar within these different zones, therefore the spatial difference in precipitation seems to be the main factor that explains the spatial variability of surface runoff [95,96]. It is possible to see a correspondence of high precipitation in the high mountainous zone and lower precipitation in the valley zones, this correspondence is observed with PPS and the observations of gauge rainfall stations, Figure 2. For 31 surface meteorological observation stations, calculations are based on surface observation data and their corresponding grid fusion data.
CMORPH presents the best performance at the daily scale, when there is little or close to zero precipitation, while the performance of the three is similar and better when providing precipitation estimation on a monthly basis[97,98]. It can be observed that the days without precipitation are overestimated by the satellite products[99,100]. This is also true for the 0-1 and 1-10 ranges. From the ranges 10-25 to 25-50 and over 50, the satellite values are more in line with the ground station values and in the ranges 25-50 and over 50 the satellite estimates start to underestimate with reference to the reference values Figure 3.
3.2. The Efficiency of PPS in Monitoring Extreme Precipitation Events
The evaluation of the data information corresponding to 16 stations is used to evaluate the efficiency of PPS in monitoring extreme precipitation events, trough extreme rainfall indices. The statistical measures of the extreme precipitation indices for the three PPS, 16 points are provided in Table 6. The analysis reveals that CHIRPS and CMORPH demonstrate superior performance in detecting extreme precipitation events, exhibiting lower RMSE, ME, and BIAS values, along with higher R values for most extreme precipitation indices when compared to TRMM[101]. CHIRPS performs the best overall, with the lowest RMSE, ME, and bias for most indices (RR95p, Rx1d, Rx3d, and Rx5d). It also has competitive correlation coefficients, particularly for RR95p and Rx3d/Rx5d. CMORPH shows the highest correlation for RR95p and Rx1d but has higher RMSE, ME, and bias values compared to CHIRPS, making it less reliable overall. TRMM performs poorly for most indices, with negative correlations for Rx1d, Rx3d, and Rx5d, and higher RMSE and bias values compared to CHIRPS. The difference in performance between these precipitation products (PPSs) can be attributed to the varying data sources and calibration algorithms used in their development[102,103]. For CMORPH, the probability distribution function (PDF) matching the unified daily calibration analysis of the CPC MORPHing technique was applied to correct biases [91,92]. This correction enhances CMORPH's performance for precipitation probability estimates, though it may still exhibit limitations in capturing extreme precipitation events, as evidenced by higher RMSE and bias values compared to CHIRPS. On the other hand, CHIRPS benefits significantly from its integration of IR-based precipitation estimates and a combination of NASA and NOAA satellite-based precipitation data. This multi-source approach, supported by robust calibration and validation techniques[104,105] contributes to its superior performance in estimating precipitation, particularly for extreme indices [106,107].
Distribution patterns in extreme rainfall analysis play an important role. To this end, the following will conduct an in-depth study of the extreme, extremes in the Saltito River Basin based on fused data. From the spatial distribution for the Rx1d, Rx2d, Rx25mm, and RR95p indices for the years 2015-2019, calculated from satellite observations (TRMM, CHIRPS, CMORPH) and ground-based observations (CNA), several conclusions can be drawn with respect to the topography and time series (Figure 4).
Topography (flat vs. mountainous area) has a significant impact on the accuracy of satellite precipitation estimates compared to ground-based observations (CNA). In flat Areas, presents overestimation for Satellite products (TRMM, CHIRPS, CMORPH) tend to overestimate precipitation compared to ground-based observations (CNA). This is evident at stations such as Tejamen and Hacienda la Pila, where the values of Rx1d, Rx2d, and RR95p are consistently higher in the satellites than in CNA. It could be attributed that in flat areas, satellites may have difficulty distinguishing between the precipitation signal and surface reflectivity, leading to overestimation. For Mountainous Areas, there are underestimation and more variability, than Flat areas. In some stations, such as Santa Barbara and Santiago Bayacora, the satellites underestimate precipitation compared to CNA.
At others, such as El Pino, the values are closer to ground observations. This may be attributed to Topographic complexity in mountainous areas can distort satellite measurements, especially due to effects such as mountain shadowing or snow reflectivity.
The satellite products (TRMM, CHIRPS, CMORPH) show differences in their performance. TRMM tends to overestimate precipitation at most stations, especially in flat areas, and presents the worst performance in the area for monitoring extreme precipitation events. CHIRPS show a mixed behavior, with overestimation in some stations and underestimation in others. In general, it performs better in mountainous areas than TRMM. CMORPH tend to underestimate precipitation at some stations, especially in mountainous areas. In flat areas, its performance is closer to ground observations, although still with some overestimation, and CMORPH present the best performance in general.
3.3. The performance of SPPs in Extreme Flow Capture
3.3.1. Validation of the PCSWMM Model
With the observations measured by the runoff stations as input, we obtain a hydrological simulation for the calibration (2015-2018) and validation (2018-2019) periods. The figure 5 shows the statistical metrics provided by hydrological model, they indicate good performance in describing runoff (streamflow) across all rainfall data sources (Gauge Precipitation, TRMM, CHIRPS, and CMORPH). Gauge Precipitation performs better than Satellite products, this is expected, as ground-based data is typically more accurate than satellite-based data. All rainfall data sources achieve NSE values above 0.6, with Gauge Precipitation and CMORPH exceeding 0.7, indicating that the model acceptably simulates runoff [108,109]. All rainfall data sources achieve R² values above 0.6, with Gauge Precipitation and CMORPH exceeding 0.7, indicating that the model explains a significant portion of the variability in observed streamflow. All rainfall data sources have BIAS values below 16%, indicating that the model does not significantly overestimate or underestimate streamflow. The slight overestimation (positive BIAS) is consistent across all datasets. The CMORPH, CHIRPS, TRMM and gauge values show good correspondence with the runoff values in terms of trend and variability[110,111]. This suggests that the models are adequately capturing runoff dynamics over time (Figure 5). However, there are times when the modeled values differ significantly from the reference values, which could indicate errors in the models or specific events that are not being captured correctly. The data show a clear annual seasonality, it could be noted that the area is characterized by the strong mid to late summer precipitation maximum in June, July, August, and September with consider-ably less precipitation during the rest of the year, which is typical in time series related to hydrology of this arid zones [112,113]. Runoff tends to be higher in certain months of the year (e.g., during the rainy season) and lower in others (during the dry season). This seasonality can be observed in the runoff values, which show recurring peaks and valleys throughout the years.
In addition to seasonality, it is possible that there are long-term trends or inter-annual patterns that could be related to climatic phenomena such as El Niño or La Niña. It would be interesting to perform a more detailed analysis to identify these trends. There are also some outlier peaks in the data, which could be related to extreme events such as floods or droughts.
3.3.2. Extreme Flow Assessment of the Three PPSs
To assess the ability of the four precipitation products (PPSs) to capture extreme flow events, three extreme flow indices—Qx1d, Qx3d, and Qx5d—were chosen for evaluation. The Bias Volume (%) is the lowest (+3.0% to +3.5%), indicating that CONAGUA's estimates are closest to the observed values. CHIRPS performs better than CMORPH and TRMM but not as well as CONAGUA. The Bias Volume (%) ranges from +7.5% to +8.5%, indicating a consistent but acceptable overestimation. TRMM's performance is very close to CHIRPS, with slightly higher Bias Volume (%) and MSE. CMORPH has Worst Performance with the highest Bias Volume (%), MSE, and Medium Bias among all sources. It was mentioned earlier that there is generally little or no precipitation in the area, and the PPSs tend to overestimate these measurements, similar to the performance of PPs in modeling streamflow, in section above. These results are only observed for arid zones; a tendency to underestimate the observed averages has been reported in other studies whose study in arid zone[114,115].
Table 7.
Error evaluation statistics of extreme runoff indexes (Qx1d, Qx3d, Qx5d) , using various rainfall inputs (CONAGUA, TRMM, CHIRPS, and CMORPH) generated by the PCSWMM software.
Table 7.
Error evaluation statistics of extreme runoff indexes (Qx1d, Qx3d, Qx5d) , using various rainfall inputs (CONAGUA, TRMM, CHIRPS, and CMORPH) generated by the PCSWMM software.
| Extreme runoff indices | Statistical results | TRMM | CHIRPS | CMORPH | Precipitation Gauge (CONAGUA) |
|---|---|---|---|---|---|
| Qx1d | R | 0.40 | 0.45 | 0.50 | 0.95 |
| RMSE (mm) | 174.80 | 153.74 | 185.78 | ||
| ME (mm) | 17.25 | 5.38 | 17.35 | ||
| BIAS (%) | -11.40 | -1.54 | -12.40 | 3.0 | |
| Qx3d | R | 0.35 | 0.14 | 0.35 | 0.94 |
| RMSE (mm) | 4.10 | 4.088 | 4.089 | ||
| ME (mm) | 2.83 | 2.85 | 2.83 | ||
| BIAS (%) | 35.86 | 14.36 | 36.16 | 3.5 | |
| Qx5d | R | -0.183 | 0.006 | 0.123 | 0.93 |
| RMSE (mm) | 21.15 | 20.81 | 21.17 | ||
| ME (mm) | 15.34 | 15.14 | 15.42 | ||
| BIAS (%) | -15.48 | -23.88 | -2.50 | 3.2 |
4. Conclusions
Based on the number of sites, 16 according to the data, the spatial distribution pattern of extreme climate index is presented. With the development of remote sensing, satellite and computer technology, multi-source fusion data has become a new data source. These fused data have wide coverage, space, time and it has the advantages of relatively continuous space, which is suitable for extreme climate spaces in large watersheds with sparse research sites and null or little data.
Satellite products tend to overestimate precipitation in flat areas, while in mountainous areas their performance is more variable, with cases of underestimation. Topographic complexity in mountainous areas affects the accuracy of satellite estimates. Precipitation index values show interannual variability, but no clear trend of increase or decrease during the period 2015-2019. Extreme precipitation events (Rx1d, Rx2d) and days with intense precipitation (Rx25mm) are relatively rare and do not follow a defined pattern.
In general, the CMORPH and CHIRPS sensors show better performance than the TRMM for the study area (smearid zone). This performance can be improved by creating a correction algorithm to increase their correspondence, which can be taken up in another future study. Satellite products could benefit from better calibration, especially in flat areas, to reduce overestimation. Combining satellite data with ground observations and meteorological models could improve the accuracy of estimates, especially in mountainous areas. Perform more detailed trend analysis to identify changes in long-term precipitation patterns is posible specially with the CMORPH and CHIRPS, in similar regions to study zone .
Although these sensors tend to overestimate precipitation levels, given their spatial and temporal resolution, they represent a good alternative for the construction of climate change indices, and to evaluate the intensity of climate change in the region, in terms of precipitation. Perform more detailed trend analysis to identify changes in long-term precipitation patterns is posible specially with the CMORPH and CHIRPS, in similar regions to study zone .
The hydrological model demonstrates good statistical metrics for describing runoff, with strong performance across all rainfall data sources. It is particularly effective when using Gauge Precipitation and CMORPH, but even with TRMM and CHIRPS, the model performs acceptably to well. This makes the model a robust tool for streamflow simulation, especially in data-scarce regions where satellite-based rainfall products are essential.
We found a discrepancy between the good performance of satellite data in modeling runoff and its lower accuracy in estimating extreme precipitation indices this can be attributed to several reasons related to the characteristics of the satellite data, the nature of the extreme events and the way hydrological models process the information. We obtained hydrological modeling in an acceptable manner, in the absence of precipitation and hydrometric information, which is usually very scarce in most semiarid areas, the PPS can be used as a source of analysis of these hydrological processes.
Author Contributions
Conceptualization, R. L. B and D.A.M.C; methodology, R. L. B; D.A.M.C and M. T. A. H.; writing—original draft preparation, R. L. B. and D.A.M.C.; A.E.M.C. ; writing—review and editing, D.A.M.C; M. T. A. H; R. L. B and A.E.M.C. All authors have read and agreed to the published version of the manuscript.
Funding
This research did not receive any grants from public, commercial, or non-profit sectors.
Data Availability Statement
Data will be made available on request..
Acknowledgments
Thanks the Secretaría de Ciencia, Humanidades, Tecnología e Innovación (SECIHTI) for awar-ding a Ph.D. scholarship (No. 422478) and the Centro de Investigación en Materiales Avanzados (CIMAV).
Conflicts of Interest
The authors declare no conflict of interest.
References
- Myhre, G.; Alterskjær, K.; Stjern, C.W.; Hodnebrog, Ø.; Marelle, L.; Samset, B.H.; Sillmann, J.; Schaller, N.; Fischer, E.; Schulz, M.; et al. Frequency of extreme precipitation increases extensively with event rareness under global warming. Scientific Reports 2019, 9, 16063. [CrossRef]
- Papalexiou, S.M.; Montanari, A.J.W.R.R. Global and regional increase of precipitation extremes under global warming. 2019, 55, 4901-4914. [CrossRef]
- Flint, L.E.; Flint, A.L.; Stolp, B.J.; Danskin, W.R. A basin-scale approach for assessing water resources in a semiarid environment: San Diego region, California and Mexico. Hydrol. Earth Syst. Sci. 2012, 16, 3817-3833. [CrossRef]
- Deng, C.; Pisani, B.; Hernández, H.; Li, Y.J.B.d.l.S.G.M. Assessing the impact of climate change on water resources in a semi-arid area in central Mexico using a SWAT model. 2020, 72. [CrossRef]
- Liu, Z. Accuracy of satellite precipitation products in data-scarce Inner Tibetan Plateau comprehensively evaluated using a novel ground observation network. Journal of Hydrology: Regional Studies 2023, 47, 101405. [CrossRef]
- Jahanshahi, A.; Roshun, S.H.; Booij, M.J. Comparison of satellite-based and reanalysis precipitation products for hydrological modeling over a data-scarce region. Climate Dynamics 2024, 62, 3505-3537. [CrossRef]
- Tavakol-Davani, H.; Goharian, E.; Hansen, C.H.; Tavakol-Davani, H.; Apul, D.; Burian, S.J. How does climate change affect combined sewer overflow in a system benefiting from rainwater harvesting systems? Sustainable Cities and Society 2016, 27, 430-438. [CrossRef]
- Yang, D.; Yang, Y.; Xia, J. Hydrological cycle and water resources in a changing world: A review. Geography and Sustainability 2021, 2, 115-122. [CrossRef]
- Shrestha, A.; Chaosakul, T.; Priyankara, D.P.; Chuyen, L.H.; Myat, S.S.; Syne, N.K.; Irvine, K.N.; Koottatep, T.; Babel, M.S.J.J.o.W.M.M. Application of PCSWMM to explore possible climate change impacts on surface flooding in a Peri-urban area of Pathumthani, Thailand. 2014. [CrossRef]
- Schuurmans, J.M.; Bierkens, M.F.P. Effect of spatial distribution of daily rainfall on interior catchment response of a distributed hydrological model. Hydrol. Earth Syst. Sci. 2007, 11, 677-693. [CrossRef]
- Upadhyay, R.K.J.A.J.o.C.C. Markers for global climate change and its impact on social, biological and ecological systems: A review. 2020, 9, 159. [CrossRef]
- Rijal, M.; Luo, P.; Mishra, B.K.; Zhou, M.; Wang, X. Global systematical and comprehensive overview of mountainous flood risk under climate change and human activities. Science of The Total Environment 2024, 941, 173672. [CrossRef]
- Michaelides, S.; Levizzani, V.; Anagnostou, E.; Bauer, P.; Kasparis, T.; Lane, J.E. Precipitation: Measurement, remote sensing, climatology and modeling. Atmospheric Research 2009, 94, 512-533. [CrossRef]
- Joyce, R.J.; Janowiak, J.E.; Arkin, P.A.; Xie, P. CMORPH: A Method that Produces Global Precipitation Estimates from Passive Microwave and Infrared Data at High Spatial and Temporal Resolution %J Journal of Hydrometeorology. 2004, 5, 487-503. [CrossRef]
- Hu, Q.; Li, Z.; Wang, L.; Huang, Y.; Wang, Y.; Li, L. Rainfall Spatial Estimations: A Review from Spatial Interpolation to Multi-Source Data Merging. 2019, 11, 579. [CrossRef]
- Chintalapudi, S.; Sharif, H.O.; Yeggina, S.; Elhassan, A. Physically Based, Hydrologic Model Results Based on Three Precipitation Products. 2012, 48, 1191-1203. [CrossRef]
- Tsintikidis, D.; Georgakakos, K.P.; Sperfslage, J.A.; Smith, D.E.; Carpenter, T.M. Precipitation Uncertainty and Raingauge Network Design within Folsom Lake Watershed. 2002, 7, 175-184. [CrossRef]
- Funk, C.; Nicholson, S.E.; Landsfeld, M.; Klotter, D.; Peterson, P.; Harrison, L. The Centennial Trends Greater Horn of Africa precipitation dataset. Scientific Data 2015 b, 2, 150050. [CrossRef]
- Funk, C.; Peterson, P.; Landsfeld, M.; Pedreros, D.; Verdin, J.; Shukla, S.; Husak, G.; Rowland, J.; Harrison, L.; Hoell, A.; et al. The climate hazards infrared precipitation with stations—a new environmental record for monitoring extremes. Scientific Data 2015 a, 2, 150066. [CrossRef]
- Paredes-Trejo, F.J.; Barbosa, H.A.; Lakshmi Kumar, T.V. Validating CHIRPS-based satellite precipitation estimates in Northeast Brazil. Journal of Arid Environments 2017, 139, 26-40. [CrossRef]
- Katsanos, D.; Retalis, A.; Tymvios, F.; Michaelides, S. Analysis of precipitation extremes based on satellite (CHIRPS) and in situ dataset over Cyprus. Natural Hazards 2016, 83, 53-63. [CrossRef]
- Poméon, T. Evaluating the Contribution of Remote Sensing Data Products for Regional Simulations of Hydrological Processes in West Africa using a Multi-Model Ensemble. Dissertation, Bonn, Rheinische Friedrich-Wilhelms-Universität Bonn, 2019, 2019.
- Maggioni, V.; Nikolopoulos, E.I.; Anagnostou, E.N.; Borga, M.J.I.T.o.G.; Sensing, R. Modeling satellite precipitation errors over mountainous terrain: The influence of gauge density, seasonality, and temporal resolution. 2017, 55, 4130-4140. [CrossRef]
- Sayama, T.; Ozawa, G.; Kawakami, T.; Nabesaka, S.; Fukami, K. Rainfall–runoff–inundation analysis of the 2010 Pakistan flood in the Kabul River basin. Hydrological Sciences Journal 2012, 57, 298-312. [CrossRef]
- Skofronick-Jackson, G.; Berg, W.; Kidd, C.; Kirschbaum, D.B.; Petersen, W.A.; Huffman, G.J.; Takayabu, Y.N. Global Precipitation Measurement (GPM): Unified Precipitation Estimation from Space. In Remote Sensing of Clouds and Precipitation, Andronache, C., Ed.; Springer International Publishing: Cham, 2018; pp. 175-193.
- You, Y.; Wang, N.-Y.; Kubota, T.; Aonashi, K.; Shige, S.; Kachi, M.; Kummerow, C.; Randel, D.; Ferraro, R.; Braun, S.; et al. Comparison of TRMM Microwave Imager Rainfall Datasets from NASA and JAXA %J Journal of Hydrometeorology. 2020, 21, 377-397. [CrossRef]
- Li, N.; Wang, Z.; Chen, X.; Austin, G. Studies of General Precipitation Features with TRMM PR Data: An Extensive Overview. 2019, 11, 80. [CrossRef]
- George Huffman, W.M., Charles Cosner and Jacob Reed. Global Precipitation Measurement. The Global Precipitation Measurement Mission (GPM). Earth Science Division/National Aeronautics and Space Administration. 2024.
- Demirdjian, L.; Zhou, Y.; Huffman, G.J. Statistical Modeling of Extreme Precipitation with TRMM Data %J Journal of Applied Meteorology and Climatology. 2018, 57, 15-30. [CrossRef]
- Sheffield, J.; Wood, E.F.; Pan, M.; Beck, H.; Coccia, G.; Serrat-Capdevila, A.; Verbist, K.J.W.R.R. Satellite remote sensing for water resources management: Potential for supporting sustainable development in data-poor regions. 2018, 54, 9724-9758. [CrossRef]
- Pakoksung, K.; Takagi, M. Effect of satellite based rainfall products on river basin responses of runoff simulation on flood event. Modeling Earth Systems and Environment 2016, 2, 143. [CrossRef]
- Bhattacharjee, S.; Ghosh, S.K.; Chen, J. Spatial Interpolation. In Semantic Kriging for Spatio-temporal Prediction; Springer Singapore: Singapore, 2019; pp. 19-41.
- Wu, Y.-H.; Hung, M.-C.J.A.o.s.s. Comparison of spatial interpolation techniques using visualization and quantitative assessment. 2016, 17-34. [CrossRef]
- Kuras, A. Airborne hyperspectral imaging for multisensor data fusion. 2023.
- Ye, X.; Guo, Y.; Wang, Z.; Liang, L.; Tian, J.J.R.S. Extensive evaluation of four satellite precipitation products and their hydrologic applications over the Yarlung Zangbo River. 2022, 14, 3350. [CrossRef]
- Wang, J.; Petersen, W.A.; Wolff, D.B. Validation of Satellite-Based Precipitation Products from TRMM to GPM. 2021, 13, 1745. [CrossRef]
- Kidd, C.; Matsui, T.; Blackwell, W.; Braun, S.; Leslie, R.; Griffith, Z. Precipitation Estimation from the NASA TROPICS Mission: Initial Retrievals and Validation. 2022, 14, 2992. [CrossRef]
- Adam Hernández Hernández, M.L.A.J., Ramón Domínguez Mora, ; Ibarra, E.C.E.e.I.P. HIDROGRAMAS DE DISEÑO OBTENIDO CON ANÁLISIS DE ESCURRIMIENTOS. UNIVERSIDAD NACIONAL AUTÓNOMA DE MÉXICO FACULTAD DE INGENIERÍA 2018.
- Banco, I.M.D.T.D.A.; (BANDAS)., N.d.D.d.A.S. Regiones hidrologicas administrativas. 2020.
- Tu, M.-c.; Wadzuk, B.; Traver, R.J.P.O. Methodology to simulate unsaturated zone hydrology in storm water management model (SWMM) for green infrastructure design and evaluation. 2020, 15, e0235528. [CrossRef]
- Clark, P.E.; Rilee, M.L. Remote sensing tools for exploration: observing and interpreting the electromagnetic spectrum; Springer Science & Business Media: 2010.
- Awasthi, N.; Tripathi, J.N.; Petropoulos, G.P.; Gupta, D.K.; Singh, A.K.; Kathwas, A.K. Performance Assessment of Global-EO-Based Precipitation Products against Gridded Rainfall from the Indian Meteorological Department. 2023, 15, 3443.
- Harrison, L.; Landsfeld, M.; Husak, G.; Davenport, F.; Shukla, S.; Turner, W.; Peterson, P.; Funk, C. Advancing early warning capabilities with CHIRPS-compatible NCEP GEFS precipitation forecasts. Scientific Data 2022, 9, 375. [CrossRef]
- Koo, M.-S.; Hong, S.-Y.; Kim, J.J.A.-P.J.o.A.S. An evaluation of the tropical rainfall measuring mission (TRMM) multi-satellite precipitation analysis (TMPA) data over South Korea. 2009, 45, 265-282.
- Prat, O.P.; Nelson, B.R.J.W.R.R. Mapping the world's tropical cyclone rainfall contribution over land using the TRMM Multi-satellite Precipitation Analysis. 2013, 49, 7236-7254. [CrossRef]
- Council, N.R.; Policy, B.o.H.S.; Earth, D.o.; Studies, L.; Sciences, B.o.E.; Resources; Science, C.o.R.P.f.E.; Health, P. Earth materials and health: Research priorities for earth science and public health; National Academies Press: 2007.
- Nakamura, K.J.J.o.t.M.S.o.J.S.I. Progress from TRMM to GPM. 2021, 99, 697-729.
- Kummerow, C.; Simpson, J.; Thiele, O.; Barnes, W.; Chang, A.; Stocker, E.; Adler, R.; Hou, A.; Kakar, R.; Wentz, F.J.J.o.A.M.; et al. The status of the Tropical Rainfall Measuring Mission (TRMM) after two years in orbit. 2000, 39, 1965-1982. [CrossRef]
- Zagrodnik, J.P. Comparison and validation of Tropical Rainfall measuring mission (TRMM) Rainfall algorithms in Tropical Cyclones. 2012. [CrossRef]
- Kummerow, C.; Simpson, J.; Thiele, O.; Barnes, W.; Chang, A.; Stocker, E.; Adler, R.; Hou, A.; Kakar, R.; Wentz, F. The status of the Tropical Rainfall Measuring Mission (TRMM) after 2 years in orbit. 1999.
- YANG, R.; RUI, H. APPLICATIONS OF TRMM SCIENTIFIC DATA. In Observation, Theory and Modeling of Atmospheric Variability; pp. 473-483.
- Cheema, M.J.M.; Bastiaanssen, W.G.M. Local calibration of remotely sensed rainfall from the TRMM satellite for different periods and spatial scales in the Indus Basin. International Journal of Remote Sensing 2012, 33, 2603-2627. [CrossRef]
- Kummerow, C.; Olson, W.S.; Giglio, L.J.I.T.o.G.; Sensing, R. A simplified scheme for obtaining precipitation and vertical hydrometeor profiles from passive microwave sensors. 1996, 34, 1213-1232. [CrossRef]
- Giglio, L.; Kendall, J.D.; Tucker, C.J. Remote sensing of fires with the TRMM VIRS. International Journal of Remote Sensing 2000, 21, 203-207. [CrossRef]
- Weng, F.; Zhao, L.; Ferraro, R.R.; Poe, G.; Li, X.; Grody, N.C.J.R.S. Advanced microwave sounding unit cloud and precipitation algorithms. 2003, 38, 33-31-33-13. [CrossRef]
- Bruster-Flores, J.L.; Ortiz-Gómez, R.; Ferriño-Fierro, A.L.; Guerra-Cobián, V.H.; Burgos-Flores, D.; Lizárraga-Mendiola, L.G.J.W. Evaluation of precipitation estimates CMORPH-CRT on regions of Mexico with different climates. 2019, 11, 1722. [CrossRef]
- Liu, J.; Xia, J.; She, D.; Li, L.; Wang, Q.; Zou, L.J.R.S. Evaluation of six satellite-based precipitation products and their ability for capturing characteristics of extreme precipitation events over a climate transition area in China. 2019, 11, 1477.
- Chen, J.; Li, Z.; Li, L.; Wang, J.; Qi, W.; Xu, C.-Y.; Kim, J.-S. Evaluation of Multi-Satellite Precipitation Datasets and Their Error Propagation in Hydrological Modeling in a Monsoon-Prone Region. 2020, 12, 3550. [CrossRef]
- Duan, Z.; Liu, J.; Tuo, Y.; Chiogna, G.; Disse, M. Evaluation of eight high spatial resolution gridded precipitation products in Adige Basin (Italy) at multiple temporal and spatial scales. Science of The Total Environment 2016, 573, 1536-1553. [CrossRef]
- Filianoti, P.; Gurnari, L.; Zema, D.A.; Bombino, G.; Sinagra, M.; Tucciarelli, T. An Evaluation Matrix to Compare Computer Hydrological Models for Flood Predictions. 2020, 7, 42. [CrossRef]
- Yosef, Y.; Aguilar, E.; Alpert, P.J.I.J.C. Is it possible to fit extreme climate change indices together seamlessly in the era of accelerated warming. 2021, 41, E952-E963. [CrossRef]
- Chang, M.; Dereczynski, C.; Freitas, M.A.V.; Chou, S.C. Climate Change Index: A Proposed Methodology for Assessing Susceptibility to Future Climatic Extremes %J American Journal of Climate Change. 2014, Vol.03No.03, 12. [CrossRef]
- Russo, S.; Sterl, A.J.J.o.G.R.A. Global changes in indices describing moderate temperature extremes from the daily output of a climate model. 2011, 116. [CrossRef]
- Codjoe, S.N.; Atiglo, D.Y.J.F.i.C. The implications of extreme weather events for attaining the sustainable development goals in sub-Saharan Africa. 2020, 2, 592658. [CrossRef]
- Mishra, A.; Alnahit, A.; Campbell, B. Impact of land uses, drought, flood, wildfire, and cascading events on water quality and microbial communities: A review and analysis. Journal of Hydrology 2021, 596, 125707. [CrossRef]
- Pan, X.; Rahman, A.; Haddad, K.; Ouarda, T.B.J.S.E.R.; Assessment, R. Peaks-over-threshold model in flood frequency analysis: a scoping review. 2022, 36, 2419-2435. [CrossRef]
- Norheim, S. Flood frequency analysis: Comparing annual maximum series and peak over threshold: A case study for Norway. Høgskulen på Vestlandet, 2018.
- Mostofi Zadeh, S.; Durocher, M.; Burn, D.H.; Ashkar, F.J.H.S.J. Pooled flood frequency analysis: a comparison based on peaks-over-threshold and annual maximum series. 2019, 64, 121-136.
- Wi, S.; Valdés, J.B.; Steinschneider, S.; Kim, T.-W.J.S.e.r.; assessment, r. Non-stationary frequency analysis of extreme precipitation in South Korea using peaks-over-threshold and annual maxima. 2016, 30, 583-606. [CrossRef]
- Dams, J.; Nossent, J.; Senbeta, T.B.; Willems, P.; Batelaan, O. Multi-model approach to assess the impact of climate change on runoff. Journal of Hydrology 2015, 529, 1601-1616. [CrossRef]
- Cooley, A.K.; Chang, H.J.J.o.W.; Change, C. Detecting change in precipitation indices using observed (1977–2016) and modeled future climate data in Portland, Oregon, USA. 2021, 12, 1135-1153. [CrossRef]
- Moran-Tejeda, E.; López-Moreno, J.I.; Vicente-Serrano, S.M.; Lorenzo-Lacruz, J.; Ceballos-Barbancho, A.J.H.s.j. The contrasted evolution of high and low flows and precipitation indices in the Duero basin (Spain). 2012, 57, 591-611. [CrossRef]
- Rahmani, V.; Harrington Jr, J.J.I.J.o.C. Assessment of climate change for extreme precipitation indices: A case study from the central United States. 2019, 39, 1013-1025. [CrossRef]
- Bitew, M.M.; Gebremichael, M. Assessment of satellite rainfall products for streamflow simulation in medium watersheds of the Ethiopian highlands. Hydrol. Earth Syst. Sci. 2011, 15, 1147-1155. [CrossRef]
- Maggioni, V.; Massari, C. On the performance of satellite precipitation products in riverine flood modeling: A review. Journal of Hydrology 2018, 558, 214-224. [CrossRef]
- Tikkanen, H. Hydrological modeling of a large urban catchment using a stormwater management model (SWMM). Aalto University, 2013.
- Zeng, Z.; Yuan, X.; Liang, J.; Li, Y. Designing and implementing an SWMM-based web service framework to provide decision support for real-time urban stormwater management. Environmental Modelling & Software 2021, 135, 104887. [CrossRef]
- Lee, H.; Woo, W.; Park, Y.S. A User-Friendly Software Package to Develop Storm Water Management Model (SWMM) Inputs and Suggest Low Impact Development Scenarios. 2020, 12, 2344. [CrossRef]
- Zhang, X.; Qiao, W.; Xiao, Y.; Lu, Y.J.N.H. Analysis of regional flooding in the urbanization expansion process based on the SWMM model. 2023 a, 117, 1349-1363. [CrossRef]
- Dell, T.; Razzaghmanesh, M.; Sharvelle, S.; Arabi, M. Development and Application of a SWMM-Based Simulation Model for Municipal Scale Hydrologic Assessments. 2021, 13, 1644.
- Montalvo, C.; Reyes-Silva, J.D.; Sañudo, E.; Cea, L.; Puertas, J. Urban pluvial flood modelling in the absence of sewer drainage network data: A physics-based approach. Journal of Hydrology 2024, 634, 131043. [CrossRef]
- Sun, N.; Hall, M.; Hong, B.; Zhang, L. Impact of SWMM Catchment Discretization: Case Study in Syracuse, New York. Journal of Hydrologic Engineering 2014, 19, 223-234. [CrossRef]
- Fujita, T.; Capozzoli, C.R.; Rafee, S.A.A.; de Freitas, E.D. Hydrological Modeling of Urbanized Basins. In Environmental Governance of the São Paulo Macrometropolis: Perspectives on Climate Variability, Jacobi, P.R., Turra, A., Bermann, C., Freitas, E.D.d., Frey, K., Giatti, L.L., Travassos, L., Sinisgalli, P.A.d.A., Momm, S., Zanirato, S., et al., Eds.; Springer Nature Switzerland: Cham, 2024; pp. 231-240.
- Gichamo, T.; Nourani, V.; Gökçekuş, H.; Gelete, G.J.J.o.W.; Change, C. Ensemble rainfall–runoff modeling of physically based semi-distributed models using multi-source rainfall data fusion. 2024, 15, 325-347. [CrossRef]
- Snikitha, S.; Kumar, G.P.; Dwarakish, G.S. A Comprehensive Review of Cutting-Edge Flood Modelling Approaches for Urban Flood Resilience Enhancement. Water Conservation Science and Engineering 2024, 10, 2. [CrossRef]
- Abedin, S.; MacVicar, B. Understanding the impacts of hydraulic uncertainties on urban flood mapping. In River Flow 2022; CRC Press: 2024; pp. 1028-1034.
- Manandhar, B.; Cui, S.; Wang, L.; Shrestha, S. Urban Flood Hazard Assessment and Management Practices in South Asia: A Review. 2023, 12, 627. [CrossRef]
- Nasrollahi, F. Modeling the effectiveness of flood adaptation strategies under climate change. Drexel University, 2024.
- Mayou, L.A.; Alamdari, N.; Ahmadisharaf, E.; Kamali, M. Impacts of future climate and land use/land cover change on urban runoff using fine-scale hydrologic modeling. Journal of Environmental Management 2024, 362, 121284. [CrossRef]
- Khatooni, K.; Hooshyaripor, F.; MalekMohammadi, B.; Noori, R. A new approach for urban flood risk assessment using coupled SWMM–HEC-RAS-2D model. Journal of Environmental Management 2025, 374, 123849. [CrossRef]
- Sañudo, E.; Cea, L.; Puertas, J. Modelling Pluvial Flooding in Urban Areas Coupling the Models Iber and SWMM. 2020, 12, 2647. [CrossRef]
- Zafeirakos, N. A study on the Mandra flash flood of 2017 using a coupled 1D/2D model (SWMM/P-DWave). 2020.
- de Lourdes Corral-Bermudez, M.; Sánchez-Ortiz, E.; Álvarez-Bernal, D.; Gutiérrez-Montenegro, M.O.; Cassio-Madrazo, E.J.P. Scenarios of availability of water due to overexploitation of the aquifer in the basin of Laguna de Santiaguillo, Durango, Mexico. 2019, 7, e6814. [CrossRef]
- Ferrari, L.; Levresse, G.; Aranda-Gómez, J.J.; Henry, C.D.; Valencia-Moreno, M.; Landín, L.O.; Ferrari, L.; Levresse, G.; Aranda-Gómez, J.J.; Henry, C.D.; et al. Tectonomagmatic Pulses and Multiphase Mineralization in the Sierra Madre Occidental, Mexico. In Tectonomagmatic Pulses and Multiphase Mineralization in the Sierra Madre Occidental, Mexico; Society of Economic Geologists: 2020; Volume 61, p. 0.
- Qiu, Y.; da Silva Rocha Paz, I.; Chen, F.; Versini, P.A.; Schertzer, D.; Tchiguirinskaia, I. Space variability impacts on hydrological responses of nature-based solutions and the resulting uncertainty: a case study of Guyancourt (France). Hydrol. Earth Syst. Sci. 2021, 25, 3137-3162. [CrossRef]
- Gwak, Y.; Kim, S.J.H.P. Factors affecting soil moisture spatial variability for a humid forest hillslope. 2017, 31, 431-445. [CrossRef]
- Kim, J.; Han, H.J.A.R. Evaluation of the CMORPH high-resolution precipitation product for hydrological applications over South Korea. 2021, 258, 105650. [CrossRef]
- Zhang, C.; Chen, X.; Shao, H.; Chen, S.; Liu, T.; Chen, C.; Ding, Q.; Du, H. Evaluation and Intercomparison of High-Resolution Satellite Precipitation Estimates—GPM, TRMM, and CMORPH in the Tianshan Mountain Area. 2018, 10, 1543. [CrossRef]
- Katiraie-Boroujerdy, P.-S.; Nasrollahi, N.; Hsu, K.-l.; Sorooshian, S. Evaluation of satellite-based precipitation estimation over Iran. Journal of Arid Environments 2013, 97, 205-219. [CrossRef]
- Shen, Y.; Xiong, A.; Wang, Y.; Xie, P.J.J.o.G.R.A. Performance of high-resolution satellite precipitation products over China. 2010, 115. [CrossRef]
- Xiao, S.; Xia, J.; Zou, L. Evaluation of Multi-Satellite Precipitation Products and Their Ability in Capturing the Characteristics of Extreme Climate Events over the Yangtze River Basin, China. 2020, 12, 1179. [CrossRef]
- Funk, C.; Peterson, P.; Landsfeld, M.; Pedreros, D.; Verdin, J.; Shukla, S.; Husak, G.; Rowland, J.; Harrison, L.; Hoell, A.J.S.d. The climate hazards infrared precipitation with stations—a new environmental record for monitoring extremes. 2015, 2, 1-21.
- Beck, H.E.; Van Dijk, A.I.; Levizzani, V.; Schellekens, J.; Miralles, D.G.; Martens, B.; De Roo, A.J.H.; Sciences, E.S. MSWEP: 3-hourly 0.25 global gridded precipitation (1979–2015) by merging gauge, satellite, and reanalysis data. 2017, 21, 589-615.
- Guo, H.; Bao, A.; Liu, T.; Chen, S.; Ndayisaba, F. Evaluation of PERSIANN-CDR for Meteorological Drought Monitoring over China. 2016, 8, 379. [CrossRef]
- Guo, H.; Bao, A.; Liu, T.; Ndayisaba, F.; He, D.; Kurban, A.; De Maeyer, P. Meteorological Drought Analysis in the Lower Mekong Basin Using Satellite-Based Long-Term CHIRPS Product. 2017, 9, 901. [CrossRef]
- Miao, C.; Ashouri, H.; Hsu, K.-L.; Sorooshian, S.; Duan, Q. Evaluation of the PERSIANN-CDR Daily Rainfall Estimates in Capturing the Behavior of Extreme Precipitation Events over China %J Journal of Hydrometeorology. 2015, 16, 1387-1396. [CrossRef]
- Yang, L.; Shi, Z.; Liu, R.; Xing, M. Evaluating the performance of global precipitation products for precipitation and extreme precipitation in arid and semiarid China. International Journal of Applied Earth Observation and Geoinformation 2024, 130, 103888. [CrossRef]
- Guo, H.; Li, M.; Nzabarinda, V.; Bao, A.; Meng, X.; Zhu, L.; De Maeyer, P. Assessment of Three Long-Term Satellite-Based Precipitation Estimates against Ground Observations for Drought Characterization in Northwestern China. 2022, 14, 828. [CrossRef]
- Manchikatla, S.K.; Umamahesh, N.J.W.P. Simulation of flood hazard, prioritization of critical sub-catchments, and resilience study in an urban setting using PCSWMM: a case study. 2022, 24, 1247-1268. [CrossRef]
- Irvine, K.N.; Chua, L.H.C.J.J.o.W.M.M. Modeling stormwater runoff from an urban park, Singapore using PCSWWM. 2016. [CrossRef]
- Moriasi, D.N.; Arnold, J.G.; Van Liew, M.W.; Bingner, R.L.; Harmel, R.D.; Veith, T.L.J.T.o.t.A. Model evaluation guidelines for systematic quantification of accuracy in watershed simulations. 2007, 50, 885-900. [CrossRef]
- Martinez-Cruz, D.; Gutiérrez, M.; Alarcón-Herrera, M.J.S.o.F.D.; Challenges, C.C.i.t.G.S.; Agenda, O.f.t. Spatial and temporal analysis of precipitation and drought trends using the climate forecast system reanalysis (CFSR). 2020, 129-146.
- Agel, L.; Barlow, M.; Qian, J.-H.; Colby, F.; Douglas, E.; Eichler, T. Climatology of Daily Precipitation and Extreme Precipitation Events in the Northeast United States %J Journal of Hydrometeorology. 2015, 16, 2537-2557. [CrossRef]
- Jiang, D.; Wang, K. The Role of Satellite-Based Remote Sensing in Improving Simulated Streamflow: A Review. 2019, 11, 1615. [CrossRef]
- Wang, N.; Lombardo, L.; Gariano, S.L.; Cheng, W.; Liu, C.; Xiong, J.; Wang, R. Using satellite rainfall products to assess the triggering conditions for hydro-morphological processes in different geomorphological settings in China. International Journal of Applied Earth Observation and Geoinformation 2021, 102, 102350. [CrossRef]
Figure 1.
Location of the El Saltito sub-basin and the distribution of the stations used in this study.
Figure 1.
Location of the El Saltito sub-basin and the distribution of the stations used in this study.
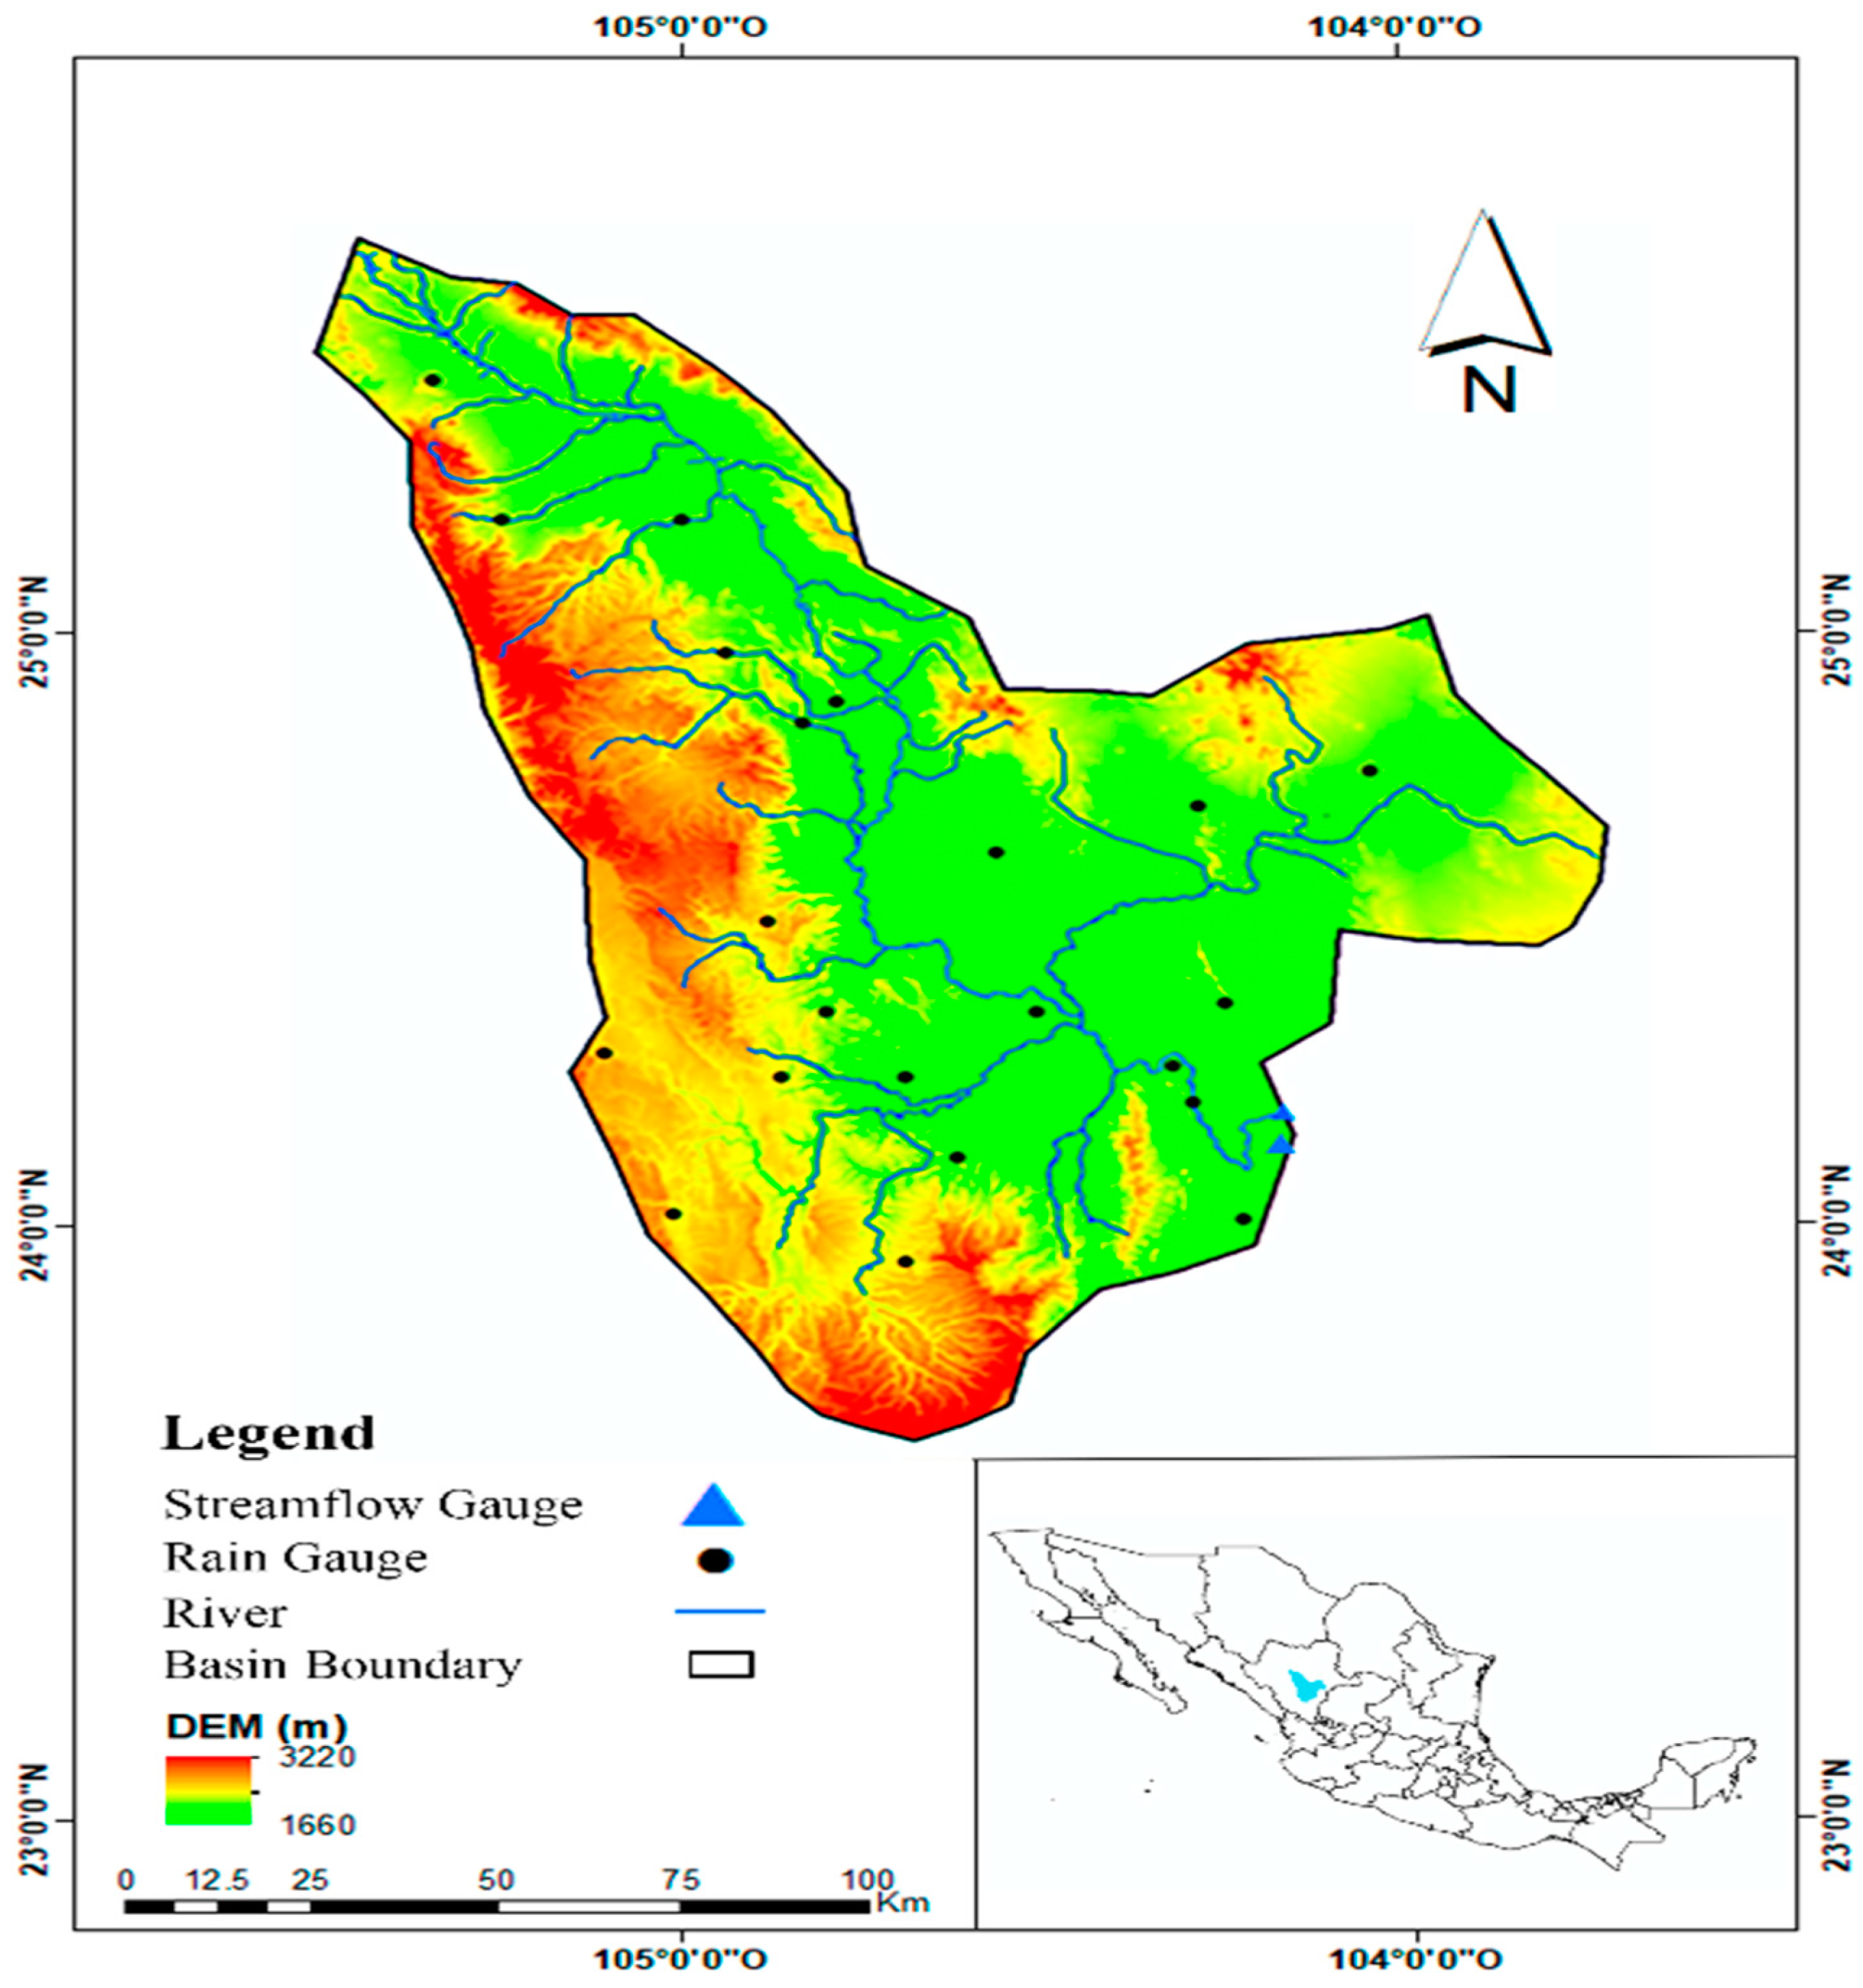
Figure 2.
Distribution of precipitation in the El Saltito sub-basin.
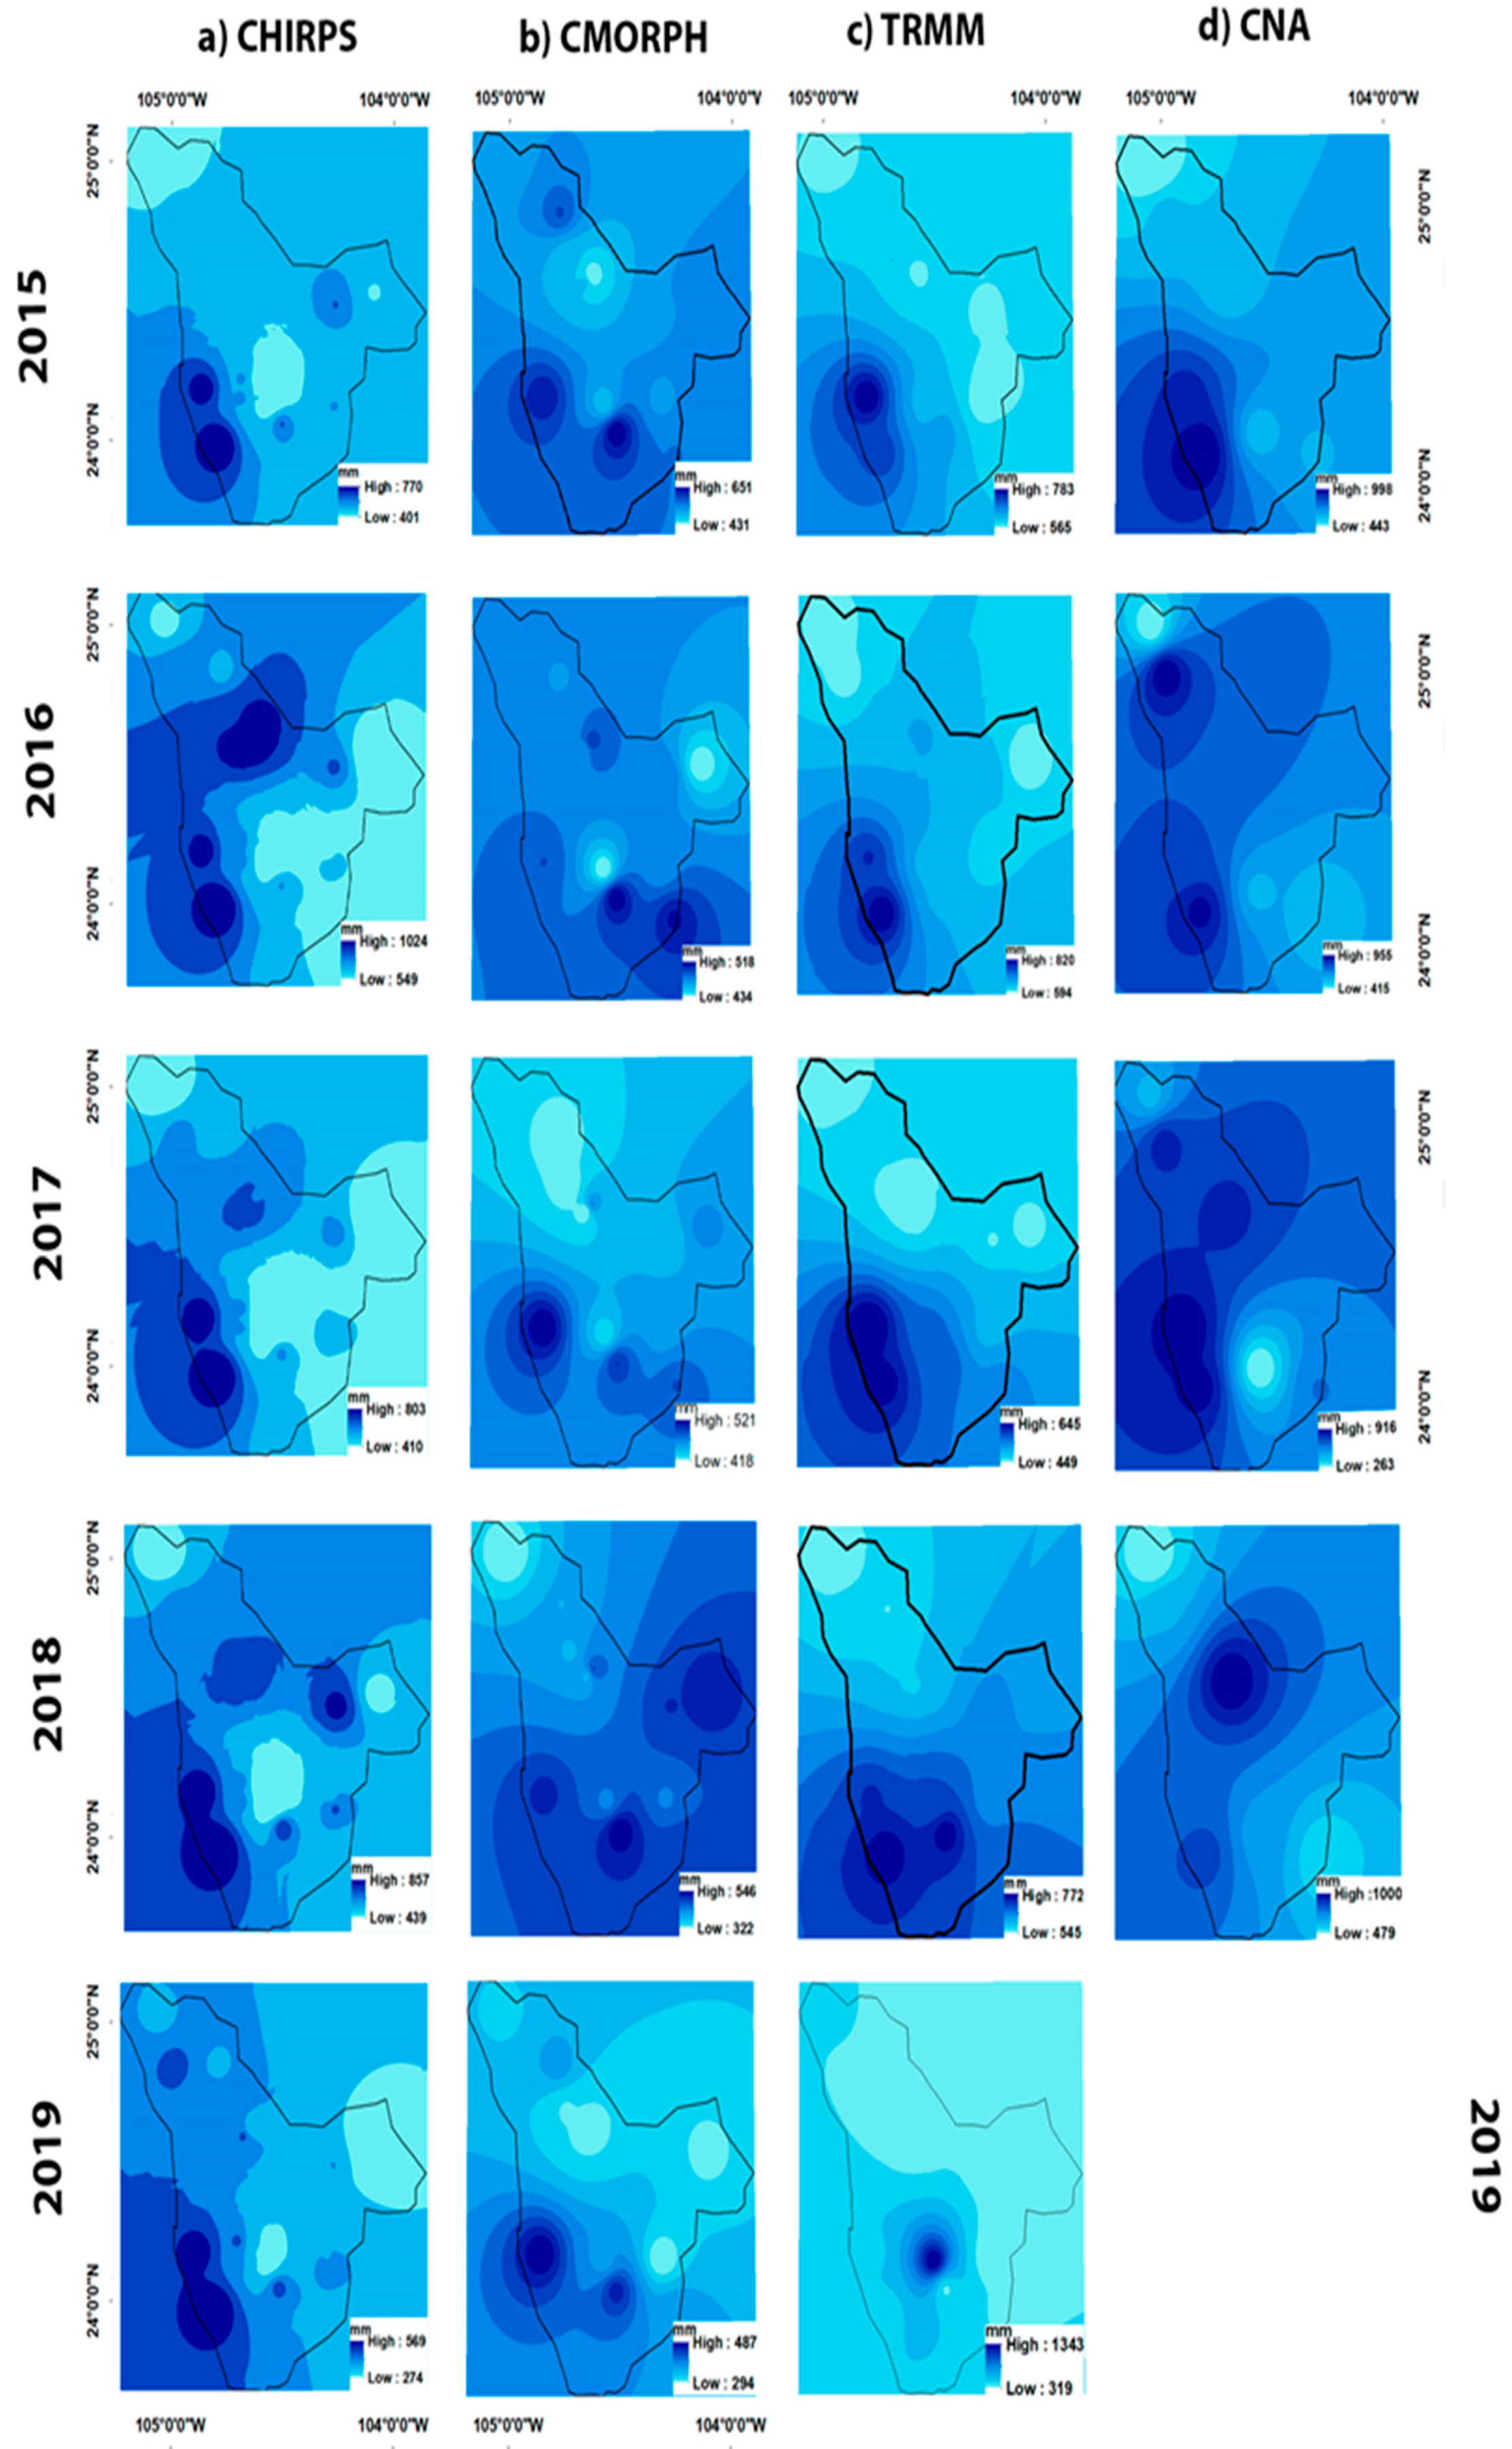
Figure 3.
(a) Ranges of daily precipitation intensity in different ranges and (b) proportional contributions to the total precipitation.
Figure 3.
(a) Ranges of daily precipitation intensity in different ranges and (b) proportional contributions to the total precipitation.
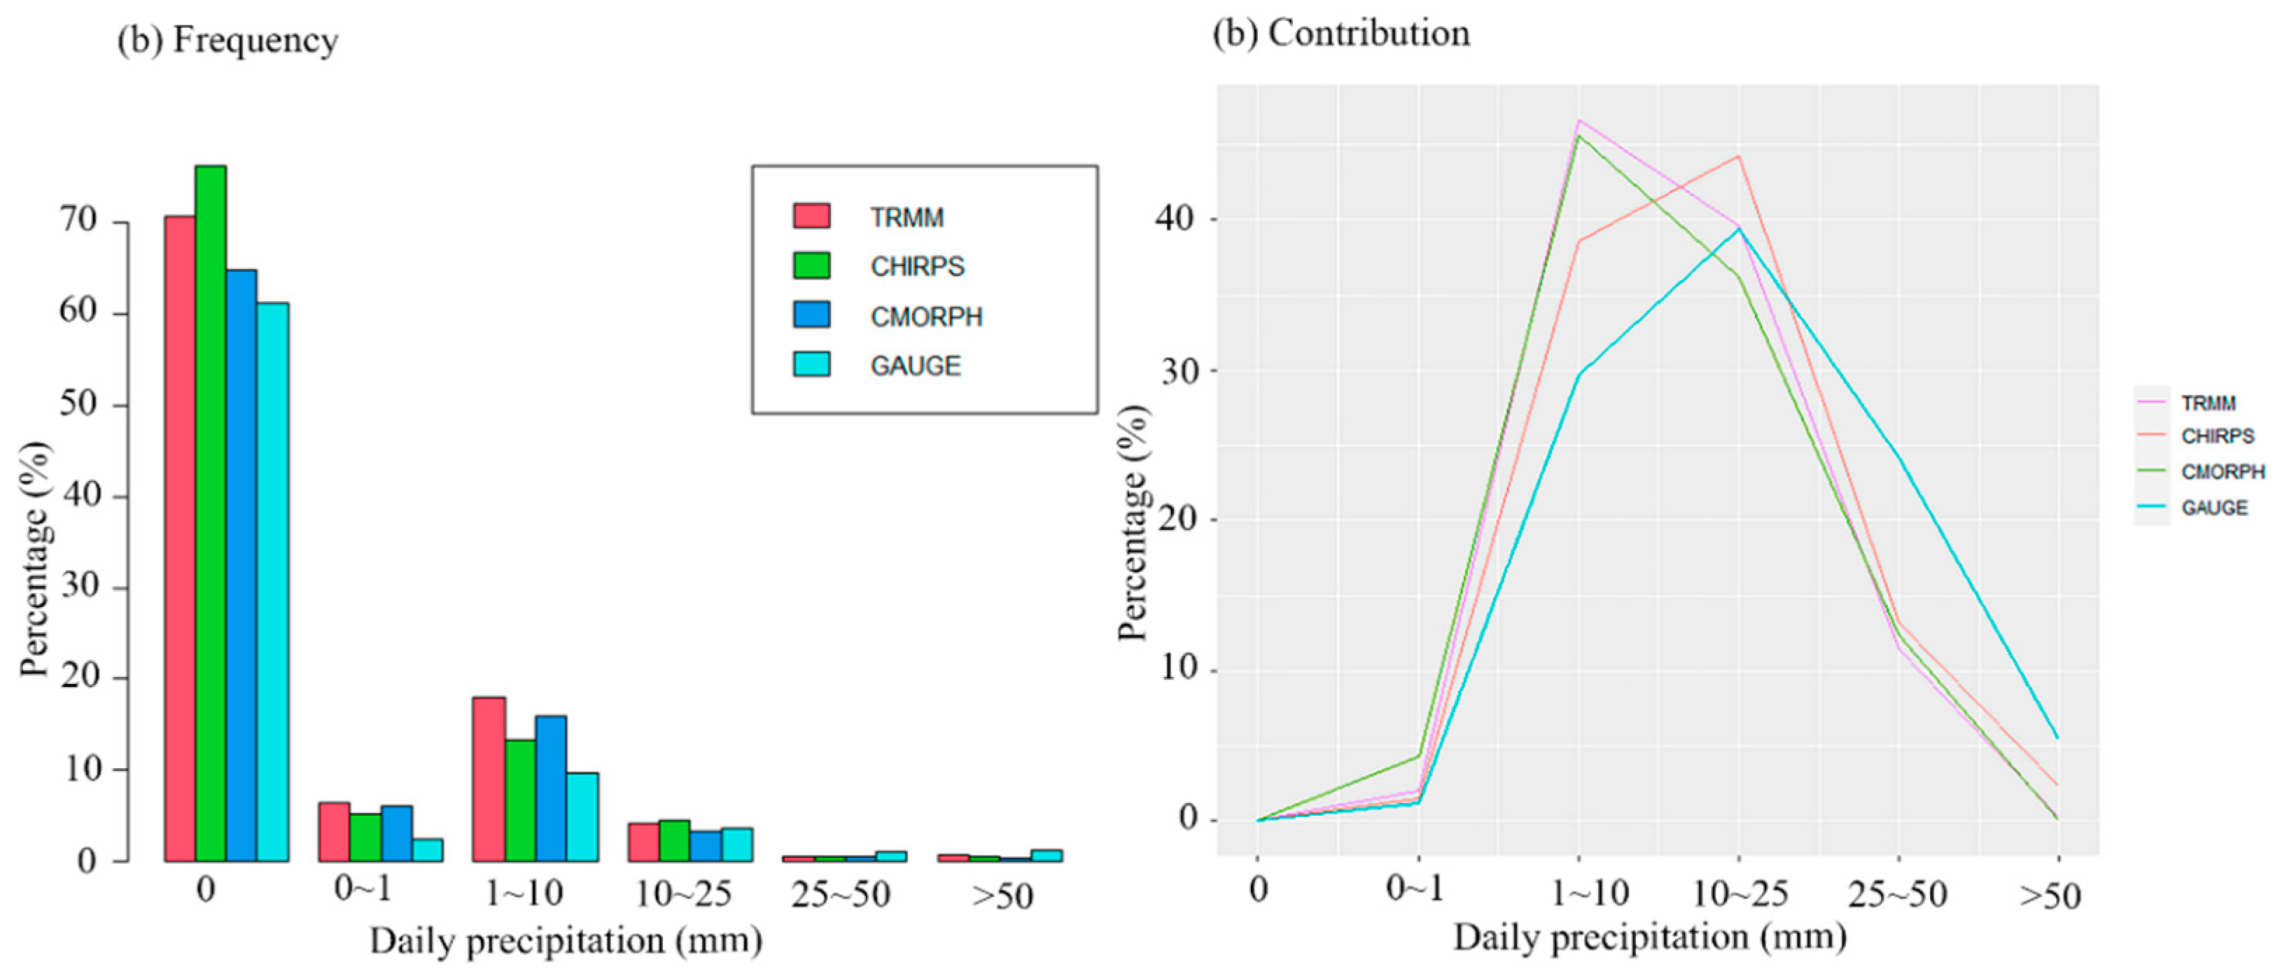
Figure 4.
Spatial distribution of extreme precipitation Rx1d indices based on different rainfall data sets (TRMM, CHIRPS, CMORPH, GAUGE), in the study area for the 2019-2021 period.
Figure 4.
Spatial distribution of extreme precipitation Rx1d indices based on different rainfall data sets (TRMM, CHIRPS, CMORPH, GAUGE), in the study area for the 2019-2021 period.
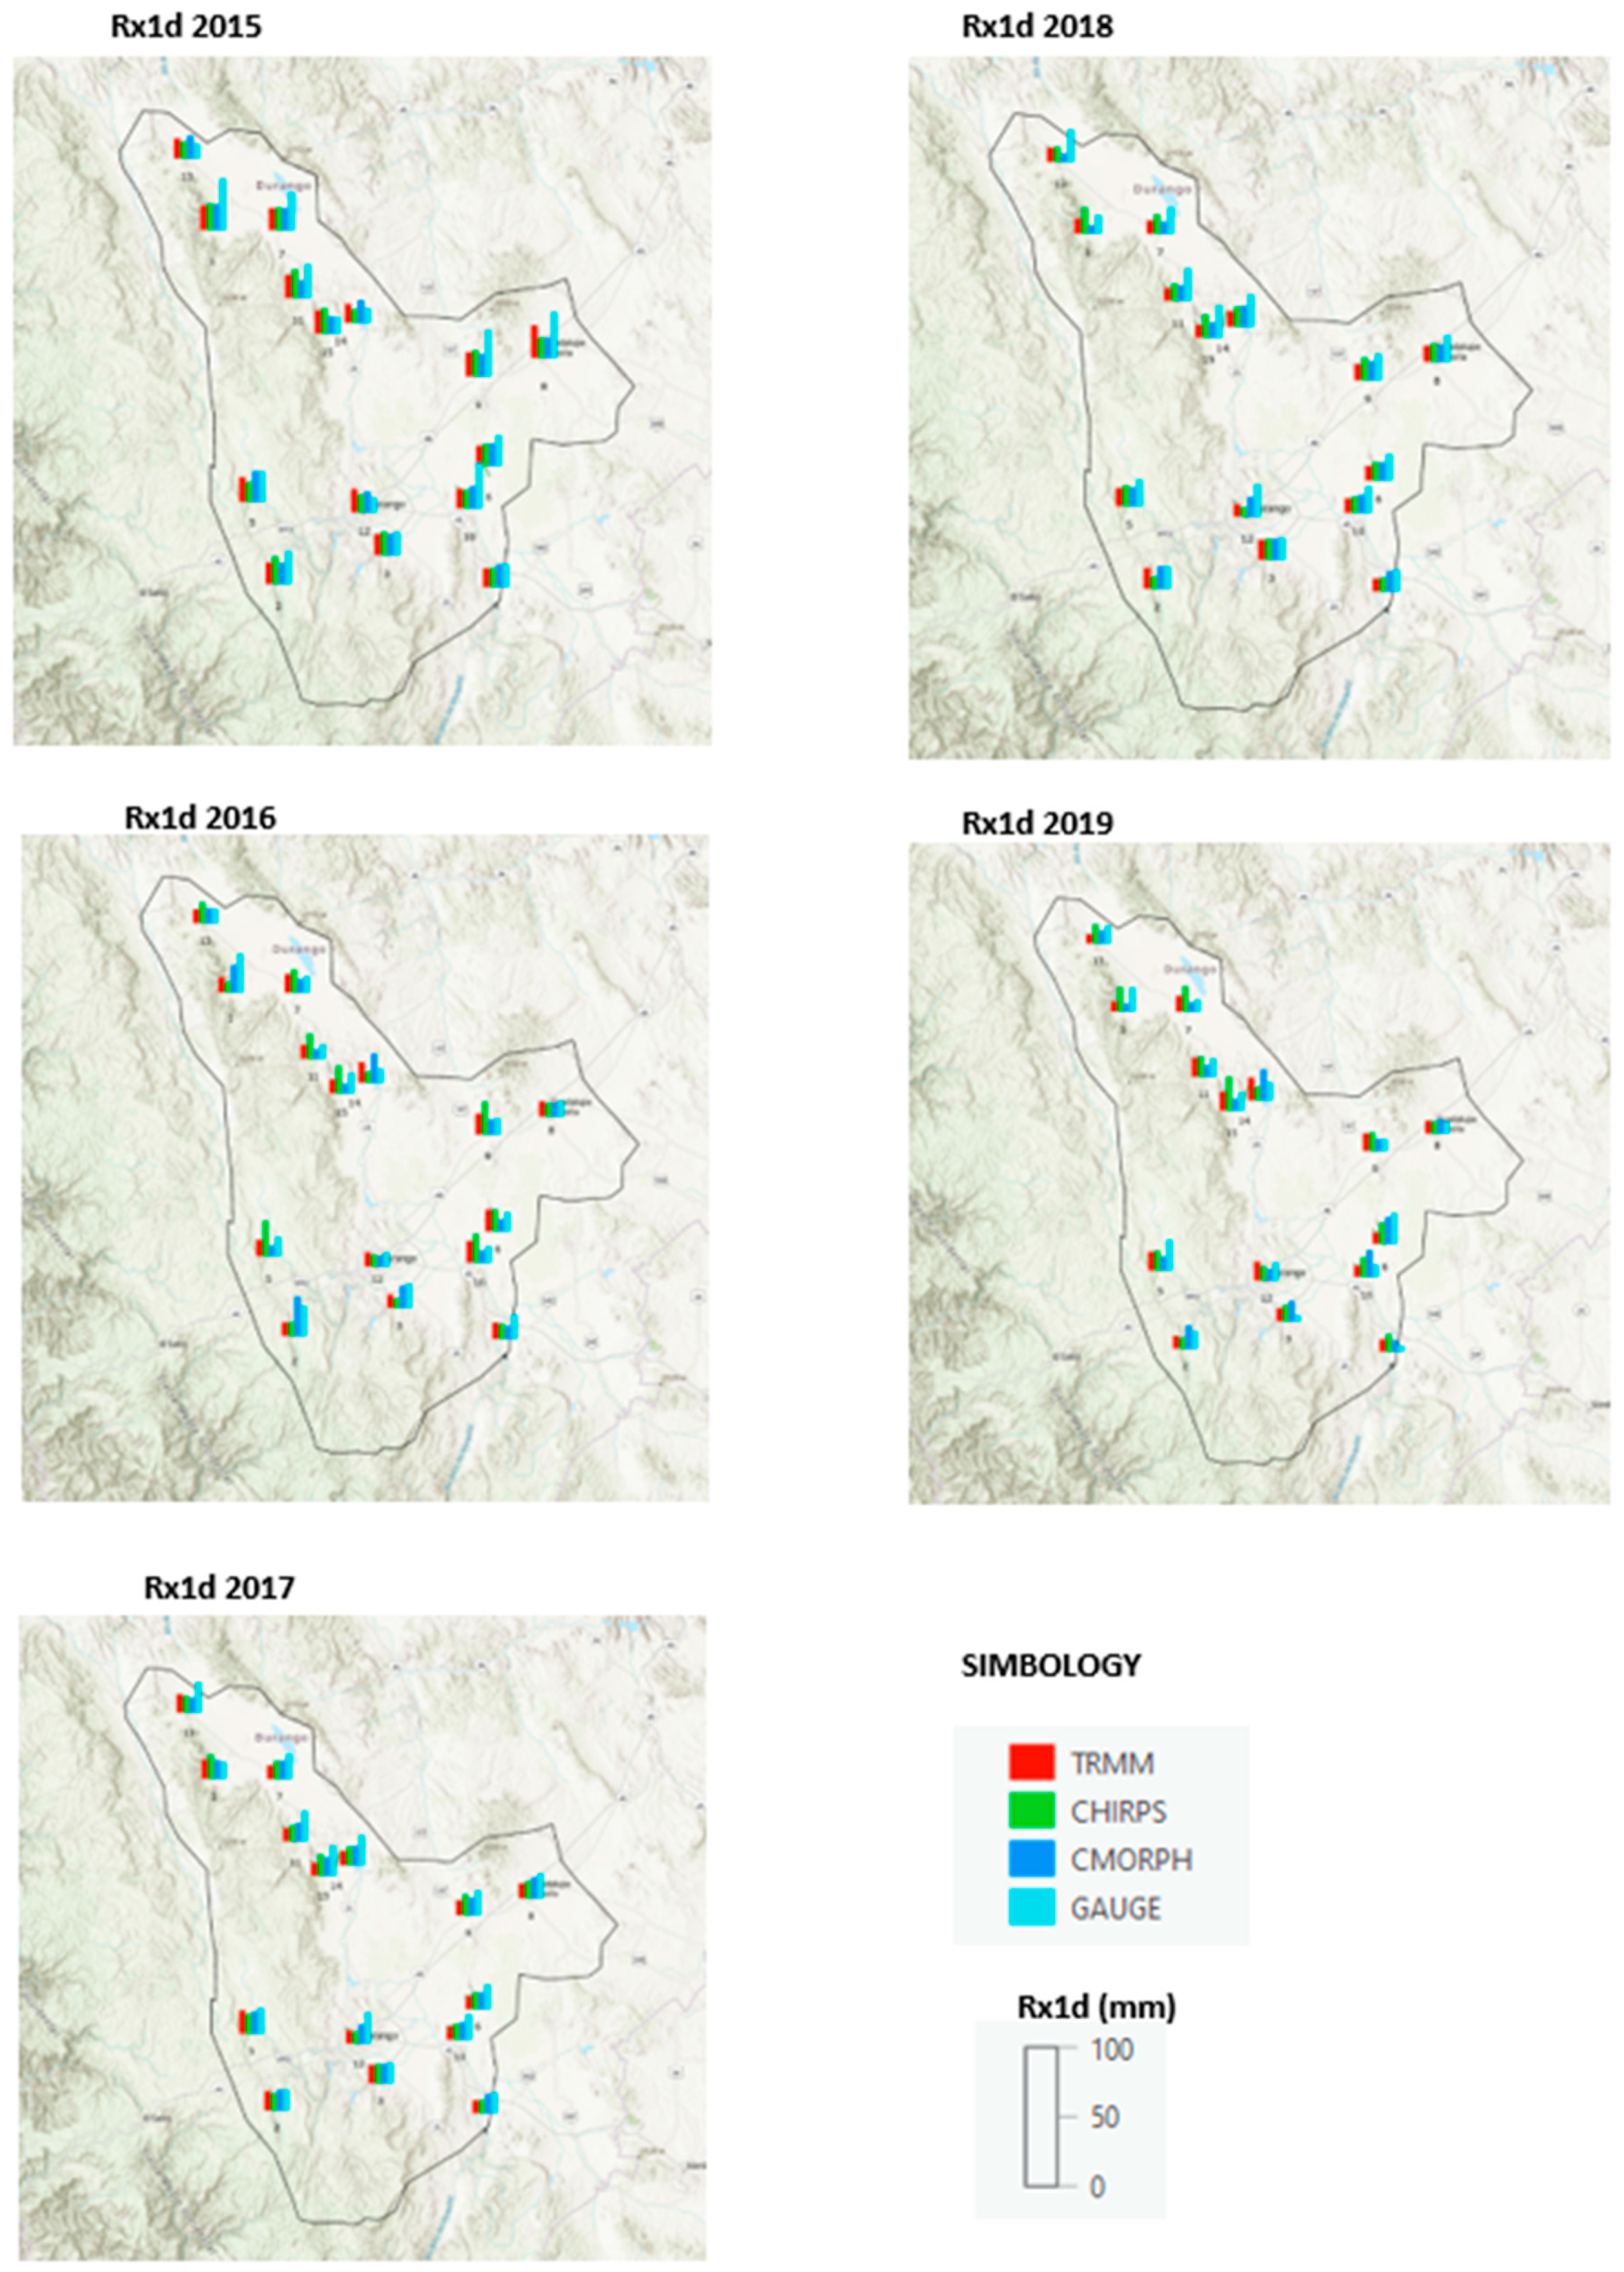
Figure 5.
Comparison of daily flow observations and simulations generated by the PCSWMM software, using various rainfall inputs (CONAGUA, TRMM, CHIRPS, and CMORPH) during the calibration and validation periods.
Figure 5.
Comparison of daily flow observations and simulations generated by the PCSWMM software, using various rainfall inputs (CONAGUA, TRMM, CHIRPS, and CMORPH) during the calibration and validation periods.
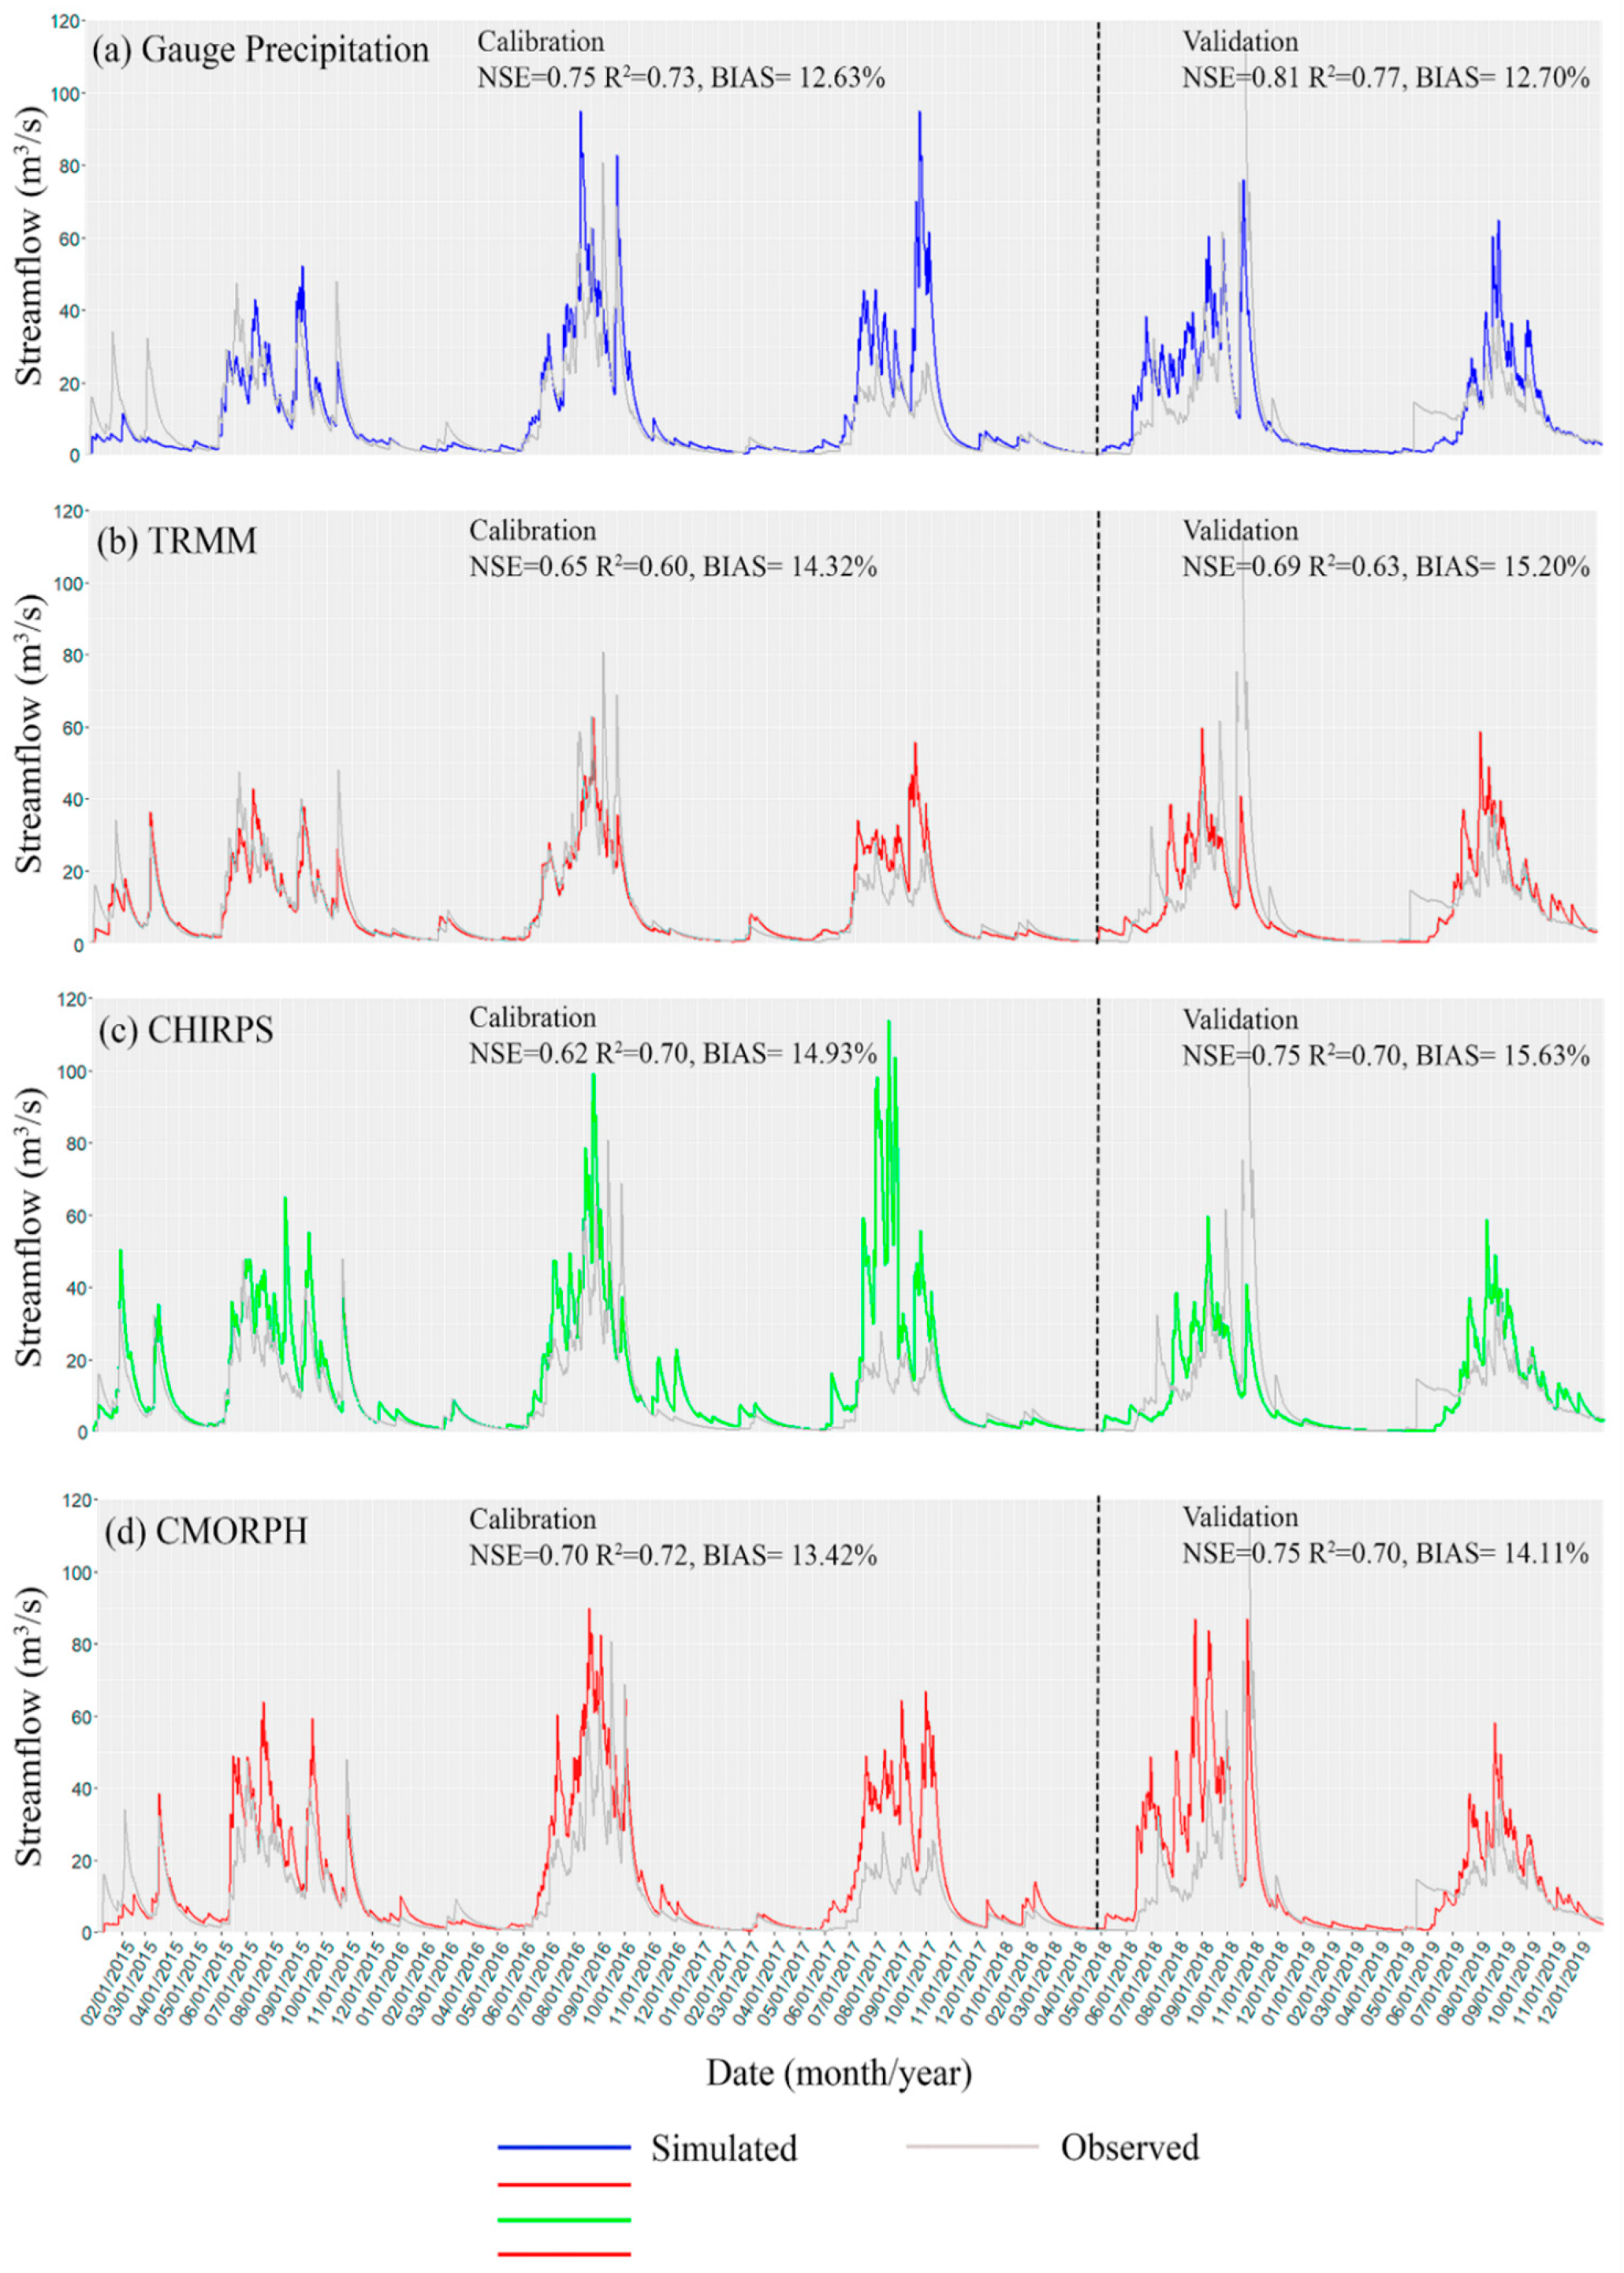
Table 2.
General parameters for PPS used in this study.
| Short name | Spatial coverage | Reference | Time span | Website |
|---|---|---|---|---|
| CHIRPS | 50°S-50°N | (Funk et al., 2015) | 1981—present | https://www.chc.uc sb.edu/data/chirps/ |
| CMORPH | 60°S-60°N | (Joyce et al., 2004) | 1998—present | ftp://ftp.cpc.ncep.noaa.gov/precip/ CMORPH_V1.0/ |
| TRMM | 35°S-35°N | (National Research Council 2006) | 1997-present | https://gpm.nasa.gov/missions/trmm/mission-end |
Table 3.
Extreme precipitation and flow rates definition.
| Category | ID | Definition | Unit |
|---|---|---|---|
| Extreme precipitation indices | RR95p | The 95th percentile of daily precipitation on wet days (days with daily precipitation ≥1 mm) | mm/día |
| R25mm | Annual count of days when daily precipitation is ≥25 mm | días | |
| Rx1d | Maximum annual precipitation of 1 day | mm | |
| Rx2d | Annual maximum of 5 days of consecutive precipitation | mm | |
| Extreme flow rates | Qx1d | Maximum annual flow rate of 1 day | m3/S |
| Qx2d | Maximum annual flow rate of 2 days | m3/S | |
| Qx3d | Maximum annual flow rate of 3 days | m3/S |
Table 4.
Understanding the Performance Statistic.
| Statistical index | Description | |
|---|---|---|
| Bias volume (%) | (1) | |
| Mean square error | (2) | |
| Correlation | (3) | |
| Medium bias |
where Qv is the volume of observation Qvs is the volume simulation Qpo is the observation peak Qps is the simulation peak Qo is the data of observation Qs is the simulation data n is the total sample number. |
(4) |
Table 5.
Input parameters for PCSWMM model calibration.
| Parameters and attributes | Description | |
|---|---|---|
| Area | Watershed area (hectares or acres) | |
| Width | Characteristic width of the flow path due to the runoff superficial. | |
| %Slope | Average slope of the basin in % | |
| %Imprev | Percentage of watershed whose soil is impermeable. | |
| N-Inprev | Manning's n coefficient for surface flow over the área Waterproof over the basin. | |
| N-Prev | Manning's N coefficient for surface flow over the área permeable over the basin. | |
| Dstore-Imperv | Storage height in depression above the Impermeable area of the basin. | |
| Dstore-Prev | Storage height in depression above the area permeable of the basin. | |
| %Zero-Imprev | Percentage of impermeable soil that does not have depression storage. | |
| Percent Routed | Percentage of runoff between different areas | |
| Infiltration | Infiltration is the process of precipitation that penetrates the Soil surface in the unsaturated soil zone of permeable catchment sub-areas SWMM offers five models as an option in infiltration modeling: Horton's classical method. Horton's Modified Method. Green-Ampt Method. Modified Green-Ampt method. Curve Number Method. |
|
Table 6.
Error evaluation statistics of extreme climatic indexes (RR95p, R25mm, Rx1d and Rx5d), derived from satellite precipitation products in the study area.
Table 6.
Error evaluation statistics of extreme climatic indexes (RR95p, R25mm, Rx1d and Rx5d), derived from satellite precipitation products in the study area.
| Extreme precipitation indices | Statistical results | TRMM | CHIRPS | CMORPH |
|---|---|---|---|---|
| RR95p | R | 0.50 | 0.60 | 0.65 |
| RMSE (mm) | 150.00 | 120.00 | 160.00 | |
| ME (mm) | 12.00 | 3.00 | 13.00 | |
| BIAS (%) | -8.00 | -0.50 | -9.00 | |
| R25mm | R | 0.40 | 0.25 | 0.40 |
| RMSE (mm) | 3.50 | 3.20 | 3.40 | |
| ME (mm) | 2.20 | 2.00 | 2.20 | |
| BIAS (%) | 30.00 | 10.00 | 32.00 | |
| Rx1d | R | -0.10 | 0.20 | 0.25 |
| RMSE (mm) | 18.00 | 16.50 | 18.50 | |
| ME (mm) | 12.00 | 11.50 | 12.50 | |
| BIAS (%) | -10.00 | -18.00 | -0.50 | |
| Rx3d | R | -0.10 | 0.55 | 0.50 |
| RMSE (mm) | 30.00 | 28.00 | 31.00 | |
| ME (mm) | 25.00 | 24.00 | 25.50 | |
| BIAS (%) | -30.00 | -22.00 | -35.00 | |
| Rx5d | R | -0.08 | 0.55 | 0.50 |
| RMSE (mm) | 29.50 | 27.50 | 30.00 | |
| ME (mm) | 25.00 | 24.00 | 25.50 | |
| BIAS (%) | -30.00 | -22.00 | -35.00 |
Disclaimer/Publisher’s Note: The statements, opinions and data contained in all publications are solely those of the individual author(s) and contributor(s) and not of MDPI and/or the editor(s). MDPI and/or the editor(s) disclaim responsibility for any injury to people or property resulting from any ideas, methods, instructions or products referred to in the content. |
© 2025 by the authors. Licensee MDPI, Basel, Switzerland. This article is an open access article distributed under the terms and conditions of the Creative Commons Attribution (CC BY) license (http://creativecommons.org/licenses/by/4.0/).
Copyright: This open access article is published under a Creative Commons CC BY 4.0 license, which permit the free download, distribution, and reuse, provided that the author and preprint are cited in any reuse.


