
Submitted:
17 March 2025
Posted:
17 March 2025
You are already at the latest version
Abstract
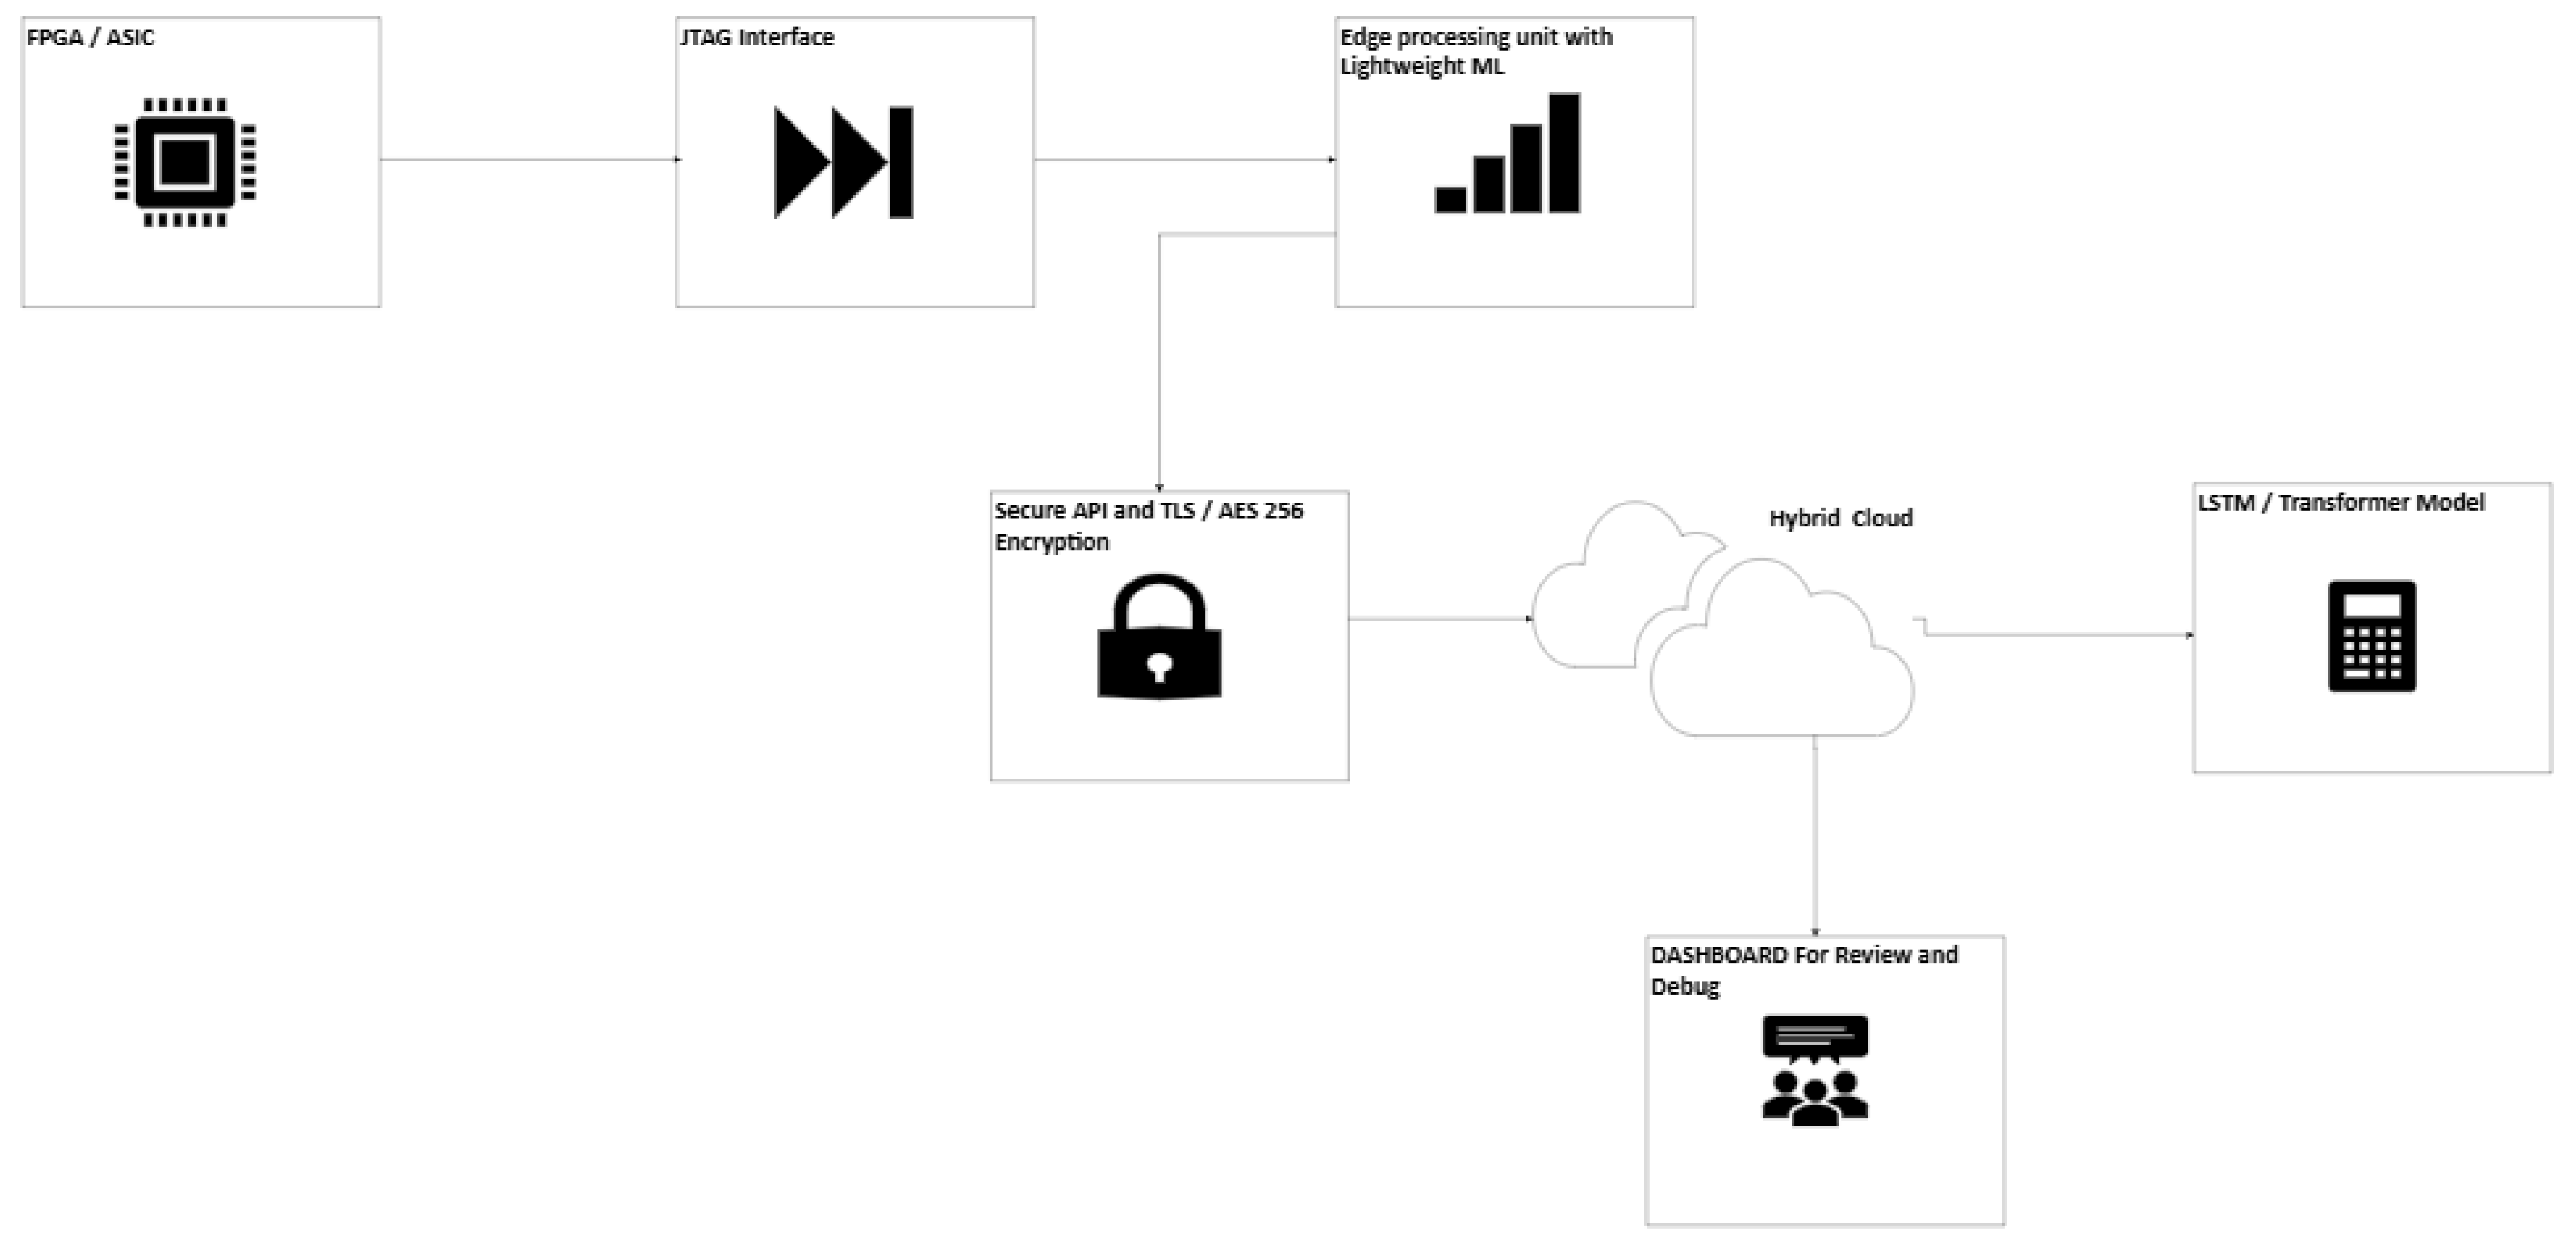
The FPGA and ASIC debugging, boundary scan testing, and device coding owe vivid gratitude to JTAG Interfaces (Joint Test Action Group format adhering largely to IEEE 1149.1 standards). In this paper, we experiment with an AI-based method for JTAG log monitoring and performance trend forecasting. Using deep learning models such as LSTMs and Transformers, the system can find deviations from log patterns and predict potential failures in advance. This kind of closed-loop analysis enhances our reliability to unprecedented levels. The system described in this work is made for hybrid cloud deployment, providing secure, scalable, and real-time log analysis software. The paper further discusses the architectural integration of AI into existing JTAG frameworks for FPGAs and RISC-V ASICs, detailing security considerations, implementation challenges, and potential industry applications. This paper is based on a patent: AI-Driven Hybrid Cloud JTAG Log Monitoring System for FPGA Debugging and Failure Prediction (Patent Number 63/771,667).
Keywords:
1. Introduction
- Need for AI in JTAG Log Monitoring
- AI Techniques for Log Analysis
1.1. Key Challenges
- Data Collection and Processing: JTAG logs differ in how they look and what they contain due to the device manufacturer; hence, standardization processing is necessary before AI-based analysis can be done.
- Model Learning and Generalization: The AI models that do well under a given FPGA/ASIC architecture may do terribly under some different types of architecture.
- Real-Time Processing Constraints: A significant challenge is to strike a balance between needing low-latency processing for real-time failure prediction and wanting high-quality levels of accuracy as well.
- Security Issues: If the JTAG interfaces suffer unauthorized access, the system's vital secrets can be taken away. This is why almost always there needs to be a strong encryption and authentication proposal system.
- Integration with Current Tools: AI must fit gracefully into the big picture of Enterprise IT, which runs on a vendor-specific debugging tool and doesn't interrupt workflow.
- False Positives and Model Interpretability: AI models should reduce false alarms and allow insights into how they think so that engineers can find and fix problems.
1.2. Scope of the Paper
- To identify the limitations of traditional JTAG-based debugging and log analysis.
- To use AI-driven anomaly detection methods with JTAG logs.
- To build a hybrid cloud solution that makes JTAG monitoring secure and scalable.
- To deal with security issues like illegal JTAG access, data privacy problems, and unauthorized information flows.
1.3. Significance of Study
2. System Architecture
2.1. System Requirements and Objectives
- Automatic Analysis of JTAG Logs: Using RNN-based deep learning models (such as LSTM and Transformer architectures), enabling anomaly detection and predictive failure analysis at scale. It should also learn normal scan chain behaviors and patterns to flag deviations (discrepancies and anomalies) in real-time, predict failures (such as an imminent boundary-scan failure or internal error), and react before these conditions ultimately manifest. Previous research demonstrates that LSTMs are effective at capturing sequential patterns in logs, and Transformers can address long-range dependency in logs, thus helping in model selection.
- Real-Time Monitoring and Alerts: Streamline the JTAG output of the devices and process it on the fly. When the system detects an anomaly or predicts failure, the system will trigger real-time alerts for engineers to act on. This involves scanning the integrity of scan chains and boundary-scan test results on FPGAs/ASICs. Suppose an anomaly is present, such as an unexpected bit returned from a boundary scan. In that case, the system will likely log the anomaly immediately and identify the offending device/pin. It also should track trends over time — e.g., rising frequency of correctable errors — and issue predictive alerts ("Device X scan chain is degrading, potential failure soon").
- Stand-alone Deployment: The solution will be a stand-alone service that operates independently of the specific vendor tools, as it will support a hybrid cloud/on-premises model. By "hybrid," it mean the key functions can be distributed across on-premise and cloud: the on-premise (edge) side will talk to the JTAG hardware, and it would do initial data processing (and even limited ML inference), while the cloud would provide heavy-duty analytics, model training, and centralized monitoring dashboards. This strikes a balance between latency and privacy vs. compute scalability. The system should work with low or no internet; on-prem edge processing allows local alerting to function, while cloud connectivity augments analysis with more information across many devices and more prominent, faster models.
- Protected Log Extraction & Transfer: Make JTAG log data secure from end to end. This includes secure extraction of log data from the device (ensuring that logs are read via JTAG do not create new potential entry points) and encryption of logs in transit and at rest when they are sent to the cloud. All log data must be encrypted with a strong algorithm (e.g., AES-256) before leaving the local network and transmitted over secure channels (TLS 1.3 or equivalent VPN tunnel). Authentication and access control are essential so only authorized systems/users can leverage JTAG data. Incorporation of AES security practices, as well as encrypting the log data, highly turns off the potential of eavesdropping or tampering with that data on the system.
- FPGA Integration: Comprehensive support for FPGA's JTAG interfaces and peculiarities. FPGAs are accessible through the USB-Blaster or Ethernet Blaster hardware, supported through the IEEE 1149.1 protocol for programming, configuration monitoring, debugging, etc. The system must connect with those devices and obtain logs like configuration failure messages, Signal Tap outputs (sent via JTAG), or user-defined JTAG UART streams. For instance, Intel offers a JTAG UART IP core, which enables an FPGA to send debug messages to the host through JTAG. This can connect to a UART like this (with jtagatlantic library or Python equivalent to read runtime logs from FPGA firmware). It will also cater to more than one FPGA family, dealing with device-specific JTAG IDs or oddities (e.g., absence of TRST on [...]). The solution should also be capable of recognizing boundary-scan descriptions (BSDL) of these devices so that it can meaningfully interpret scan results (e.g., mapping a failing bit to a specific pin). It uses a functional analogy as a smart layer on top of JTAG debugging solutions and, to a degree, will trigger or substitute Quartus's own implementation of JTAG with its monitoring service.
- API and Extensibility: Expose a straightforward API for integration and control, including an API for pushing logs/events to the analysis engine (in case the external tool wants to send data), an API to grab alerts or query the health status of the device, and maybe even an API to perform some JTAG operations through our system. The system should have RESTful endpoints (or a gRPC interface) like POST /logs (send device batch of JTAG log lines); GET /devices/id/anomalies (recent anomaly events); GET /devices/{id}/predictive status (summary of any predicted failures). Internally, the architecture will be modular to add more analyzers or new types of devices. For instance, the core monitor logic remains the same, and only the data collection module changes. APIs – e.g., a manufacturing test program can call our API after a boundary scan test so the AI can look at the log. It can also enable/integrate with CI/CD or test systems.
- Existing JTAG Tools Compatible: Device that can run alongside or be compatible with tools such as OpenOCD, PyJTAG, or vendor-specific debuggers. Many developers use OpenOCD for on-chip debugging (it provides a GDB server over JTAG). Our solution can interface in a few modes: (1) Passive Log Sniffing — allow OpenOCD (or Quartus Programmer, etc.) to continue controlling JTAG and have our agent tap into the log output. For instance, OpenOCD can be executed in verbose mode; our agent could read through OpenOCD's console or log output as it happens and look for things like JTAG chain errors or memory access failures. (2) Active Monitor Mode: Our system drives the JTAG interface (through low-level libraries or hardware drivers), essentially performing the JTAG data collection OpenOCD/PyJTAG would be doing. This mode allows it to do periodic scans or run small diagnostic JTAG sequences within its timeline. For example, we could have an embedded JTAG engine library (like PyJtag Tools, which provides a Python JTAG TAP controller client to dispatch ad-hoc instructions over JTAG). This has the potential to take the place of OpenOCD for monitoring while allowing the traditional debuggers to attach whenever necessary (not necessarily at the same time because the physical interfaces are usually shared but can be done through controlled switching). It is feasible to have our monitor paused/disabled so if a user wanted to be still able to use their JTAG debugger (e.g., Quartus Signal Tap or GDB), they would be able to utilize that or run our monitor in a non-intrusive mode where it would only listen when the bus was idle, whatever suits the user.
- Privacy and Compliance: Validate the processing of JTAG data to ensure it complies with data privacy and compliance regulations. JTAG logs don't usually have sensitive data (at least personal data), but they can have intellectual property (firmware states, cryptographic key registers, etc.). The system must protect the confidentiality and integrity of this data. Compliance measures include encryption (as mentioned), access controls, logging of who accessed the data in an audit log, and compliance with relevant regulations for the environment in which it is deployed. For example, a defense contractor using this would need ITAR compliance – no sensitive data can leave the site unencrypted, and maybe in-house analysis only. For instance, a consumer electronics company may need to adhere to enterprise IP protection policies and possibly GDPR if user-related info exists. The hybrid architecture helps with compliance: sensitive sites can keep the analysis on-premises ultimately or send anonymized or minimal metadata up to the cloud (e.g., send an anomaly score rather than entire log). Data will be encrypted both in transit and at rest on the cloud servers, and the system itself will adhere to industry best practices for cloud security (e.g., ISO 27001, SOC 2 compliant cloud infrastructure, data retention policies, etc.). For example, logs forwarded to a cloud database will be encrypted in storage (using keys only the client organization can access), and communications will be secured using TLS and modern cipher suites. These all-address trust issues of streaming low-level device data to a remote system.
2.2. JTAG Log Analysis Using Deep Learning Model
- Characteristics of Log Data: There are different types of JTAG logs. Usually, they are semi-structured text (messages from debug software: "Device ID 0xABC123 detected", "Scan test passed," ERROR: mismatch in IR at step 5", etc.) or binary results that we can decode (such as a stream of bits read from some boundary register or TDI / TDO / TMS / TRST pins). JTAG logs have a lower volume than the typical IT system log but are highly information-dense and repetitive for normal operations. These sequences are time-ordered and consist of events and values, perfect for sequential Modeling. Each device or test produces a sequence of events that have temporal dependencies (e.g., a string of "OK" messages followed by an “ERROR"" is a hint), which also means we need models that deal with sequence prediction and anomaly detection.
- Model Selection: The system suggests joining two vertical and complementary deep learning models, which are an LSTM-based recurrent neural network for text and another for a Transformer-based model. The two will then be trained to recognize the sequential patterns of the JTAG log. LSTM has been employed to model regular sequences and out-of-order/unexpected events as anomalous (Deep Log, the first example of LSTM applied to log analysis). Another methodology (Logsy) has shown that Transformers can classify the log sequences and detect anomalies by learning the relationships between complex sequences [4]. We will use LSTM’s strength to perform streaming prediction (maintain the hidden state efficiently) and the Transformer for deeper offline analysis when a significant context is helpful.
- Unsupervised Anomaly Detection (Sequence Modeling): The log sequence is modeled as a language modeling problem. When a new log entry appears, the LSTM is trained on sequences of log entries from standard cases to output the following log entry given prior entries. During operation, if the actual next entry has low probability under the model (which means it wasn't one of the things we predicted were likely to happen next), we flag it as an anomaly. This "forecasting" paradigm captures new or infrequent events. The model learns a probability distribution of event sequences, and anything outside the distribution is flagged. Under normal conditions, the sequence is something like "IR scan -> DR scan -> OK -> IR scan -> DR scan -> OK..." where the model expects to see an "OK" after each pair. If, in contrast, it sees "IR scan -> DR scan -> Fail", then the likelihood in this context for "Fail" may be very rare, thus possibly triggering an anomaly alert.
- Supervised Failure Prediction: Beyond unsupervised detection, if we have labeled data with known failure events (e.g., logs labeled as leading up to a power failure or a chip crash), we can train a supervised model to classify sequences or time windows as "healthy" or " failure approaching." A Transformer-based classifier can be employed here: it can take in a window of the last N log events and output a score indicating a probability of an impending failure. Transformers are a good choice since they can take long sequences into account (they attend every event with a weight) and detect subtle patterns (e.g., a specific pattern of minor mistakes preceding a big failure). A challenge is the lack of failure examples, which we overcome using data augmentation and predominantly unsupervised methods (genuine failures are rare in any system managed well). Any failure signatures we know can still be encoded into training data for the model (e.g., "observed JTAG clock frequency variations logged multiple times before a TAP controller lock-up").
- Information about Model Architecture: Build a stacked LSTM (2-3 layers) for the LSTM model and an embedding for the various types of log events. The first step is parsing the logs into a structured representation: for text logs, use the log parsing technique to extract a key or a template out of a log (e.g., a log "Scan %d: PASSED" becomes a template "Scan X: PASSED"). Map each unique template to an integer ID to feed into the model. More numerical fields (a scan result vector) or one-hot coded (error count high/low). The LSTM outputs a probability distribution over the following event identity at each time step. Cross-entropy loss is used to predict the actual next event during training. Use an autoencoder in a standard unsupervised model for sequences: encode a window of events and then decode it. It tries to reconstruct "normal" sequences, so it should have a higher reconstruction error when reconstructing an anomalous sequence. Statistic-based methods like LSTM forecasting have successfully detected log anomaly.
- Transformer Model Details: This would probably be a slight variant of the Transformer model (logs will not be as long as natural language text) — maybe with 4–6 self-attention layers with positional encoding to account for the fact that the order of the sequence matters. Train it in a few ways: either as a classifier over sliding windows labeled " anomalous/not", or like LSTM in a self-supervised way (predicting masked events, like BERT, or last event like GPT).
- Training Data and Process: Historical log data from the lab or field can be used to begin training. Assume that we have many JTAG logs from regular operation (which is likely because test outputs/device logs are usually stored). Treat all that as "normal" for anomaly detection and maybe inject a few synthetic anomalies for validation. Eventually, the system will log real anomalies (which we check with engineers to be true or false positives), which we can take to improve the models (semi-supervised learning). Use domain knowledge to augment training: e.g., boundary-scan patterns are well-defined, so pre-train the model to expect specific sequences of bits. Possibly fake specific failure modes (e.g., an open circuit that comes and goes, causing specific boundary-scan bit flips) to help the model learn those patterns.
- Model Deployment: The primary models will be hosted on the cloud platform, and ample computing is available (CPU or GPU). In the case of edge use for real-time, deploy a distilled version of the model on the edge agent to make fast decisions. LSTM with a small footprint can be run in Python on a Raspberry Pi (possibly by TensorFlow Lite or PyTorch JIT). This edge model can be the same weight as the cloud model but may run at a lower frequency or just on some critical subset of events (for ultra-fast failure shut-off triggers, perhaps). The cloud model is the source of truth for complex patterns and helps minimize false positives.
- Anomaly Interpretation: Interpretation is one of the issues with the deep models. To build user trust, the system will try to explain anomalies. Techniques, such as attention weights in the Transformer, help explain which specific sequence log events contributed most to classifying the entire sequence as anomalous. For LSTM, quantify what the model thought would happen and what event transpired. If the model expected the above event not to occur, the alert could read: "Event ''JTAG IR shift error'' occurred – model predicted ''shift successfully'' likelihood with 99%, indicative of a strong anomaly." These interpretations align with research advice that interpretability is critical in log analysis tools.
3. Integration in FPGA Workflows
- Using JTAG Hardware: USB-Blaster (similar) is the typical hardware dongle for JTAG on FPGAs. We will add interface support for these cables to our agent. This can be achieved through its API or an open-source one. However, one of the possible approaches is taking advantage of the jtag_atlantic library, which is exposed for JTAG UART communications. Elsewhere, use the open-source pyftdi/pyjtag route to bit-bang the USB-Blaster (if publicly documented).
- JTAG UART and Real-Time FPGA Logs: FPGAs are commonly developed with a virtual serial port over JTAG (no physical UART required) called JTAG UART IP core – this allows developers to print debug messages down to the FPGA firmware side. Our system can capture this output as part of the log stream. With on-board logic (similar capability can be integrated), any print or debug info from the FPGA would directly go into our analysis. In essence, this means our system no longer only tracks hardware-level events but also logs from the applications running behind it inside the FPGA.
- Boundary-scan (BST) Mechanism Integration: FPGAs support IEEE 1149.1 boundary scan like any other chip. BST should not be run that often in the actual system but on a periodic schedule or on-demand (for testing reachability). Our agent could send a boundary scan command to the FPGA (and other JTAG devices in a chain) so that you can read the boundary scan register. The response (which contains the state of all IO pins) can be verified for correctness (known patterns or against a golden signature if a test stimulus is provided). A fault here may indicate a fault in the external interface (e.g., a board trace). We can automate this such that the agent scans the systems occasionally (not too intrusive, when the system is idle or at regular intervals) and feeds that to the anomaly detector. The anomaly model would be trained on "normal" boundary scan bit patterns, and anything outside of that (like a stuck-at-1 pin) would be flagged. This way, our system augments traditional BST with AI — it records nuanced changes over time — instead of pass/fail.
- For FPGA Configuration and Status Registers: FPGA has a System Monitor (for voltage and temperature), and configuration registers are accessible via JTAG (such as the status of configuration error flags). This can include reading these as part of our monitoring. Some FPGAs have health monitors that can indicate high temperature or configuration CRC errors. If this is the case, our system will log that and raise an alert if the FPGA reports "configuration error detected" or "reconfiguration occurred unexpectedly."
- Signal Tap and Virtual JTAG: The Signal Tap in-system logic analyzer uses JTAG to stream captured signal data from within the FPGA to the host for debugging. Usually, it's user-fed through Quartus GUI, but the model could use something like the same IP but let it run constantly. Advanced usage of our system could be deploying a small logic inside the FPGA that checks critical internal signals, or error conditions and shows them in a custom DR register accessible through JTAG. Our agent can use a VIR (virtual IR) command to read that DR periodically. Essentially, we form an in-FPGA sensor network from which our system reads. This goes beyond just logs, as it is more like telemetry over JTAG, e.g., counting CRC errors (in one or more internal buses) and exposing that count on JTAG; then, our machine learning can see if the count is trending upwards abnormally.
4. Implementation Strategy and Requirements
- JTAG Probe/Interface: At least one JTAG adapter for each device (or per device chain) that we want to monitor. This is usually a USB-Blaster chip on board or an external Blaster module for FPGA boards. Our agent will support various adapters – through suitable drivers. In labs, a high-speed adapter (USB-Blaster II or J-Link Ultra or similar) may be used to address response speed, but even a low-end one will suffice since we do not push tons of data (we only read status, not frequent entire bitstream upload). It is a good idea to have a machine for each JTAG chain to remove contention or use a multi-port JTAG server if there are many devices.
- Edge Compute: An on-prem agent machine could look different. It must be capable of running a Python or C++ service reliably. A low-end x86_64 mini-PC with 4GB RAM running Linux is good enough for most cases. If a server exists on site (PXI chassis, test server), the agent can run it as a Docker container. For smaller deployments or IoT, an ARM-based SBC can suffice – our processing at the edge is not heavy (maybe a few hundred MB of RAM for latency and a light model). For local running of the ML model, it is highly recommended that at least an Arm Cortex-A class CPU with NEON or an Intel Atom processor is used.
- Network: Connecting you from the edge agent to the cloud is required unless you run offline. A steady internet connection (Ethernet or Wi-Fi) with minimal latency (for real-time alerts) and decent traffic is needed. Logs amount to text/binary, low single KBs max per second with negligible encryption overhead (a cellular 4G connection might serve if a remote site is required).
- Cloud Infrastructure: A server or a cloud instance runs the analytics. This can be an AWS EC2, Azure VM, or an on-prem server hosting the cloud components for an air-gapped solution. We will need enough CPU to stream all agents (single device, trivial, hundreds, scale-out). For many devices, horizontal scaling can be done using container orchestration (Kubernetes). While a GPU instance is helpful for model training, which can be done offline with historical data, as an alternative, load the model on the same server for inference.
- Edge Agent Software: The implementation language will be either Python or C++ (or a combination). Python offers rich libraries (at least PySerial for JTAG UART, PyFTDI/PyJTAG for JTAG control, requests or MQTT for networking, and possibly PyTorch for edge ML). Performance-sensitive bits (e.g., an inner loop reading repeatedly from a JTAG wire) could be written in C/C++. Typically, the agent will run as a system service (daemon). The config file will include the device type, the interface (e.g., "SB Blaster on USB bus X" or "penOCD at localhost:3333", and the cloud endpoint and keys.
- Cloud Analytics Software: A collection of microservices, possibly using Python (for easy ML integration) for the model inference service and Go or Java for the ingestion pipeline (for robustness and multi-threading). A service based on Python asyncio could also handle ingestion and inference efficiently.
- A database: possibly a time-series database (InfluxDB or TimescaleDB) for time-series anomalies and a document store (ElasticSearch or MongoDB) for raw logs. If high-volume buffering is anticipated, Kafka is an option for the real-time pipeline. In a lightweight deployment, the agent could push directly to a REST API that processes data with the model.
- AI Model Integration: Models will be in PyTorch or TensorFlow. PyTorch is preferred for dynamic sequence processing due to deployment support (TorchScript/C++ libtorch for production, if needed). At startup, the cloud service loads the model saved after training. Log parsing could also be handled within the model.
- Training Toolkit: A separate training pipeline (possibly Jupyter notebooks or scripts leveraging historical log files to train new models). This may not go into the production product—instead, it is an internal tool to enhance the model shipped.
- APIs and User Interface: The cloud should provide an API to instruct the edge agent if necessary, e.g., start/stop remote monitoring from a specific device or an on-demand action (like running a JTAG diagnostic). This could be over a secure MQTT channel (agent subscribing to a topic for commands) or via agent polling the cloud. Use-case: after an anomaly, the cloud may request "read register X and report" for additional context.
- Cloud REST API: A RESTful API for users and integration tools to obtain information, with key endpoints: GET /devices – return monitored devices with status (healthy, warning, error). GET /devices/{id}/logs?recent=100 – get the last 100 logs (for drill-down). GET /devices/{id}/anomalies?from=T1&to=T2 – retrieve anomalies within a time range. POST /devices/{id}/actions/{actionName} – trigger any action (like a JTAG test sequence) if the device supports it. HTTPS and token authentication would protect all these.
- User Dashboard: While not explicitly requested, a web dashboard often accompanies such systems for convenience. It could feature a simple web UI to show a list of devices (green/yellow/red markers), click to see recent logs, anomalies marked on a timeline, etc. This UI uses the REST API. It's not a hard requirement but adds value from a "technical report completeness" perspective.
- Unit Testing: Unit test the JTAG interface reading (e.g., simulate a JTAG device or use a dev board to output known patterns).
- Anomaly Detection Validation: Validate the anomaly detection on synthetic sequences (inject an error and check for alert trigger).
- Latency Testing: When an anomalous log appears on the device until the alert reaches the cloud, this should meet requirements (probably under a second in a LAN environment).
- Security Testing: Attempt to capture communication (expected to be indecipherable due to encryption), attempt unauthorized API calls (should be rejected), and use the agent to reach JTAG beyond the limit (this shouldn't be feasible as it would be beyond programming).
- Compatibility Testing: Simultaneous testing on various device types.
5. Data Privacy, Security, and Compliance Considerations
- Personal Data and Privacy: JTAG logs generally store more technical data about the device (register dumps, error codes) than personal data about device users. Thus, GDPR or consumer privacy rules may not apply. However, if used in a context where devices process user data (e.g., an FPGA in a medical device), it's plausible that memory accessed over JTAG might also include personal data. We have a policy of treating all data as sensitive for this purpose. We also have mechanisms to anonymize logs when necessary: in particular, if logs contain sensitive device identifiers, we will hash them in the agent before transmitting them. We keep the data only as long as required for our analysis purposes and based on the agreement with the customer. From a compliance point of view, suppose a customer requests to delete their data; only someone's logs can be wiped from cloud storage (along with some secure wipe protocol).
- Intellectual Property Protection: The JTAG interface exposes significant learnings about the device internals. IP: Bitstream ID, getting from JTAG, firmware state, getting from JTAG. We do this by ensuring that data in transit is encrypted and limiting access so that no one — not even our competitors — can intercept anything meaningful. At the company level, we also implement role-based access control over the monitoring data – only the responsible engineers who need to view the logs can do so. It prevents internal data leakage or exposure, as can be done with the least privilege principle.
- Compliance Standards: If our solution is used in specific industries:
- Military/Aerospace: Subject to ITAR or other similar regulations. For example, if JTAG logs could be considered export-controlled (e.g. if they exposed the inner workings of a defense chip), we would have to keep data on-prem or restrict access to US citizens only if data goes to the cloud, etc. One possible solution is to provide them with an on-premises cloud (private server) solution for those clients, and nothing leaves their facility. Our architecture can handle such hybrid cloud setups because the "cloud" is essentially just a server in their data center.
- Automotive: If functional safety or logging (ISO 26262 for functional safety, which requires strict systems monitoring) is needed, it's not necessarily about data privacy. Still, our system could facilitate compliance with it by providing evidence of monitoring. Automotive or industrial sectors likely have internal data protection policies, and we meet those through encryption and secure design.
- Medical: There is HIPAA if patient data is involved, which is unlikely through JTAG. However, if a log contains something identifying a patient (doubtful), it should be shielded. Encryption and limited storage (again) help. General Data Protection (GDPR, etc.): Users (data controllers) have rights if personal data is wrongfully collected.
- Data Retention Policy: We will define default retention (perhaps 1 year of logs), after which logs will be purged or archived on secure offline storage. Anomalies may be retained for longer as they are helpful for trend analysis. This retention can be configurable per user requirement, and you will be notified (in compliance, you will have to say how long you keep the data).
- Audit and Logs of the System: The monitoring system generates audit logs, such as who connected, what data was sent, etc. These are essential for security audits, e.g., one can double-check that only the expected agents are sending data and no new IP addresses have tried to push logs, etc. We also monitor the monitors – if someone were trying to tamper with an edge agent (the agent could have the type of heartbeat to the cloud, if the agent unexpectedly goes offline for whatever reason, alerting that perhaps something is wrong (or, at least, it was turned off).
- Legal Compliance and Exports: Due to cryptography, we ensure compliance with used libraries (OpenSSL, etc.) or follow export regulations for cryptographic products (mainly, it affects the distribution, but we will perform the necessary declarations if we ship worldwide).
- Attack Resilience: We assumed that an attacker might try to inject insufficient data into our application (to conceal an actual problem or generate false notifications). This is mitigated with authentication and encryption — only agents with keys can send data. If an attacker gets into one agent machine, its effect is limited to that device's data (it couldn't reach the others without those keys). Even then, this info isn't a sensitive secret, but we suggest that users treat the agent’s hardware as part of their secure perimeter.
- Assisted Compliance: We will base our implementation on standards like NIST SP 800-53 (security controls for information systems) to the extent applicable – items such as encrypting data at rest and in motion (which we do) map to corresponding controls. Also, ISO 27001 guidance on log management (which recommends protecting log integrity and confidentiality). This ensures enterprise customers are confident that best practices are being deployed.
- Edge vs. Cloud Control: We give our customers flexibility, especially those with strict data policies: the entire analysis can run on-prem (the "cloud" can be a local server). So, in that case, we're deployed only within their security network, and there is no talking to the outside world. They still receive the benefits of AI, just not the aggregate learnings across many companies (they can still use pre-trained models we provide if they choose). This solves cases when the use of the cloud is restricted from a compliance standpoint.
Conclusions
References
- Ren, X. et al. (2015). IEEE 1149.1 (JTAG) is the standard for the test access port and boundary-scan architecture. DATE Conference.
- Du, M. et al. (2017). Deep Log: Anomaly Detection and Diagnosis from System Logs through Deep Learning. CCS.
- Parikh, R., & Parikh, K. (2025). Survey on hardware security: PUFs, Trojans, and side-channel attacks. Preprints. [CrossRef]
- Zhang, J. et al. (2021). Logsy: first work utilizing the Transformer to detect anomalies on log data. IEEE Transactions.
- Parikh, R., & Parikh, K. (2025). A Survey on AI-Augmented Secure RTL Design for Hardware Trojan Prevention. Preprints. [CrossRef]
- Parikh, R., & Parikh, K. (2025). Mathematical Foundations of AI-Based Secure Physical Design Verification. Preprints. [CrossRef]
- SEGGER (2020). J-Link Remote Server uses authenticated access and encrypted communication tunnel for secure remote JTAG debugging.
- ACL Digital (2021). Employing AES encryption can protect the data transmitted via JTAG, enhancing overall security.
- Intel Corp. (2021). JTAG Over Protocol (JOP) IP allows remote JTAG debugging over PCIe, translating JTAG server communication into JTAG signals for FPGA debug logic.
- Parikh, R., & Parikh, K. (2025). AI-Driven Security in Streaming Scan Networks (SSN) for Design-for-Test (DFT). Preprints. [CrossRef]
- PyJTAGTools (2024). JTAG TAP controller client enabling support for various JTAG backends. GitHub.
- DesignSpark (2021). In a typical predictive maintenance setup, sensor data is collected and pre-processed at the edge, then transmitted to the cloud for storage and analysis.
- Sipos, R. et al. (2014). Predictive maintenance by mining equipment event logs. KDD.
- Ren, X. et al., (2015) Since an attacker will use JTAG differently from a legitimate user, it is possible to detect the difference using machine-learning algorithms (monitoring JTAG access patterns).
Disclaimer/Publisher’s Note: The statements, opinions and data contained in all publications are solely those of the individual author(s) and contributor(s) and not of MDPI and/or the editor(s). MDPI and/or the editor(s) disclaim responsibility for any injury to people or property resulting from any ideas, methods, instructions or products referred to in the content. |
© 2025 by the authors. Licensee MDPI, Basel, Switzerland. This article is an open access article distributed under the terms and conditions of the Creative Commons Attribution (CC BY) license (http://creativecommons.org/licenses/by/4.0/).


