
Submitted:
14 March 2025
Posted:
17 March 2025
You are already at the latest version
Abstract
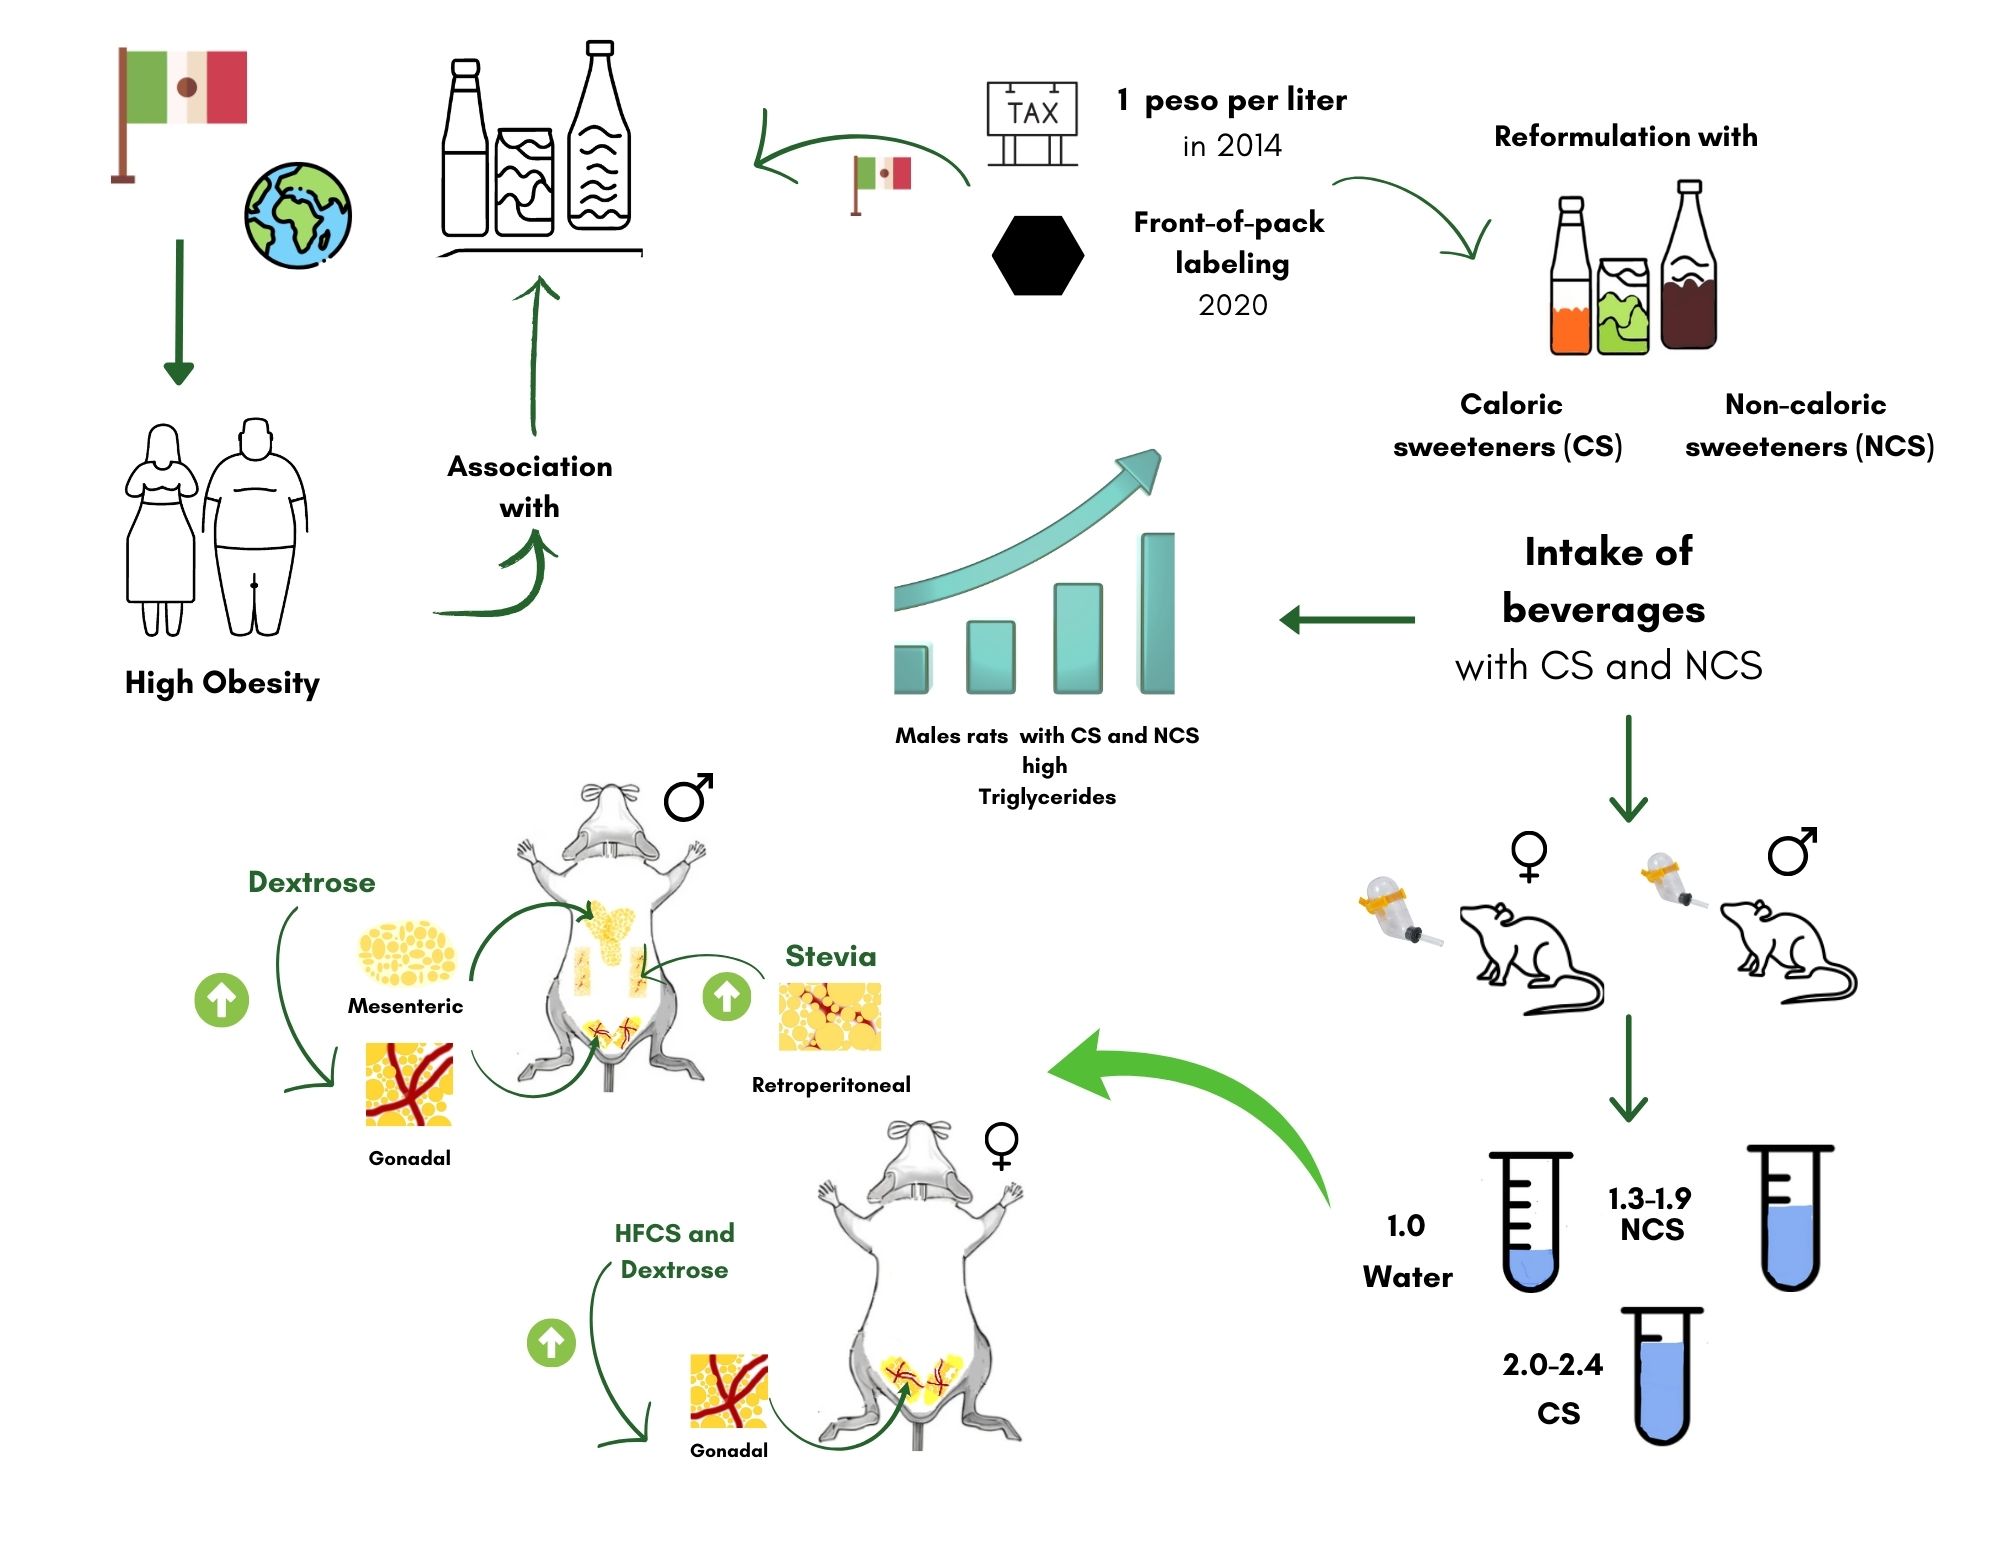
In Mexico and worldwide, the increase in the prevalence of overweight and obesity are associated with the consumption of sugary drinks. Therefore, in 2014, Mexico imple-mented a tax of one peso per liter on sugary drinks, in response, industry reformulated these beverages, but their health effects are little known. Rats’ males and females were in-cluded, who consumed beverages with caloric (CS) and non-caloric sweeteners (NCS) for 16 weeks. The weight, food and beverage intake of the animal was recorded weekly. At the end of the treatment, the gonadal (GAT), mesenteric (MAT) and retroperitoneal (RAT) ad-ipose tissue was dissecting; serum metabolic indicators were quantified. No differences were observed in weight gain, but there were higher beverage and energy intake, mainly in female rats. All groups with CS and NCS increased 2.0-2.4 or 1.3-1.9 times their intake of beverages, respectively, compared to control groups. With dextrose intake, males’ rats showed a higher amount of GAT and MAT, and RAT in Stevia group. The males’ rats of CS and NCS groups presented higher concentration of triglycerides. The consumption of CS and NCS of the beverages reformulated in México has effects on the volume ingested as well as metabolic and adiposity indicators, therefore they should not be considered in-nocuous.
Keywords:
adipose tissue: sugar-sweetened beverages
; energy intake
; rats
; triglycerides
1. Introduction
Obesity stands as a significant public health challenge in Mexico and worldwide, as it is closely associated with the development of dyslipidemias, metabolic syndrome, non-alcoholic liver disease, diabetes, and certain types of cancers [1]. Numerous factors contribute to its etiology in Mexico, with notable emphasis on the consumption of high-sugar and high-saturated-fat foods, coupled with sedentary lifestyles and elevated intake of sugary beverages [2].
Sugar sweetened beverages (SSBs) have been identified as a major factor to the obesity epidemic [3]. Studies estimate that between 12% and 19% of deaths among obese adults in Mexico, attributed to diabetes, cardiovascular diseases, and cancers in 2010 and 2012, were linked to SSB consumption [4,5]. SSBs intake correlates with weight gain [6] obesity [7] insulin resistance [8] and increases in visceral fat deposits [9]. Since 2014, in Mexico was implemented a tax to sweetened beverages as a strategic to reduce the prevalence of overweight and obesity in the population.
In response, the beverage industry reformulated beverages for children and adults, using non-caloric sweeteners (NCS) or a mixture of both, in place of only caloric sweeteners (CS). However, the long-term effects of substances that mimic sweetness without contributing energy, their impact on health outcomes, including energy intake, remain ambiguous [10,11]. The consumption of SSBs has also been associated with weight gain, increased energy intake [12,13,14,15] and glucose intolerance [16], while NCS have been implicated in altering satiety signaling pathways and fatty acid synthesis [17].
Currently, conclusive data regarding the influence of both caloric and non-caloric sweeteners used in reformulation of beverage in Mexico and their effect in energy intake regulation, body fat accumulation, and metabolic and adiposity indicators are lacking. Thus, evaluating the chronic effects of these sweeteners on energy intake, body composition, and metabolic and adiposity indicators in animal models like the Wistar rat is necessary.
2. Materials and Methods
2.1. Animals and Diets
The project procedures were approved by the Institutional Ethical Committee for the Care and Use of Laboratory Animals (CICUAL) at the Autonomous University of the State of Hidalgo (UAEH), code 01/2017. The study included 84 Wistar Han rats (42 males and 42 females) weighing between 40 and 50 grams. Throughout the 17-week experiment, the rats were housed in the UAEH vivarium. They were fed the AIN-93M diet from the American Institute of Nutrition [18], providing an energy contribution of 3.77 Kcal/g. The rats were kept in polycarbonate boxes under controlled conditions of temperature (22 °C ± 2 °C), humidity (40-70%), and a 12/12-hour light/dark cycle. During the adaptation period, all animals had ad libitum access to water for one week (week 1 of the experiment).
After adaptation, the rats were divided into 6 groups, each consisting of 7 females or males randomly selected. The control groups of females and males consumed ad libitum water for 16 weeks. Three groups received solutions containing 7% CS (0.28 Kcal/mL): 1) sucrose from sugar cane, 2) anhydrous dextrose, and 3) high fructose corn syrup (High fructose 55, MILLIKAN®). The remaining 2 groups ingested NCS at 0.3% dissolved in water: 4) steviol glycosides solution (2.5 g/100 g, Svetia®) and 5) sucralose (1.2 g/100 g, Splenda®).
2.2. Baseline and Consecutive Measurements
At the experiment’s onset, a total of 6 male and 6 female Wistar rats (one from each group) were sacrificed to obtain serum for baseline metabolic measurements, these animals had not consumed CS or NCS. For 16 weeks six female and 6 male rats from each group continued in the experiment. At the end of the 16-week treatment period, all animals were sacrificed to evaluate cumulative effects.
2.3. Weekly Weight and Caloric Intake Records
Individual body weights of the rats were recorded every seven days from the project’s commencement until its conclusion, a Triple beam 700/800 series Ohaus® scale with an accuracy of 0.1 g was utilized for this purpose. Continuous measurements of feed consumption (3 times per week) were recorded using a Tanita KD-160® scale. The volume of ingested solutions was calculated by measuring the liquid volume in the drinking troughs daily with a 500 mL Kimax® measuring cylinder.
2.4. Sacrifice and Blood Collection
At the end of the 16-week treatment period, sweetened beverage consumption was discontinued, and all animals were provided with only water for 24 hours. Prior to sacrifice, the rats were anesthetized using Pisa® brand isoflurane inhalation and with 8-hour fasting period, the animals were euthanized by decapitation to collect blood from the carotid artery and jugular vein. Blood was centrifuged at 5000 rpm for 10 minutes to obtain serum, which was then frozen at -30 degrees Celsius for a maximum of 10 days.
2.5. Dissection of Adipose Tissue
After sacrifice and blood extraction, the rat was opened in the middle abdominal region to obtain by dissection the mesenteric adipose tissue (MAT): located around of the small and large intestinal mesentery, right mesocolon, transverse mesocolon, small intestinal mesentery, mesosigmoid and mesorectum; the gonadal adipose tissue (GAT): located over the reproductive organs of females (ovaries and uterus) and males (surface of the testes and epididymis); and retroperitoneal adipose tissue (RAT): located in the posterior parietal peritoneum along the dorsal abdominal wall. Each tissue adipose was weighed separately using an Ohaus model Adventurer Pro ® analytical scale with an accuracy of 0.01 g.
2.6. Measurement of Biochemical Indicators
Serum obtained from the blood was used for analytical determinations of glucose, total cholesterol (TC), HDL cholesterol (high-density lipoprotein), triglycerides (TG), leptin, adiponectin, and insulin levels using enzymatic kits from Wiener Lab® and ELISA kits from Millipore®, following the manufacturer’s protocols.
2.7. Statistical Analysis
The statistical program IBM® SPSS® (Statistical Package for Social Sciences) version 25.0 for Windows® was used for the analysis of results. The variables were described as means ± standard deviation (SD), normal distribution and the homogeneity of variances were assessed to determine appropriate statistical test. Student’s t-test or Mann-Whitney U test was used to compare two groups, while one-way ANOVA with Bonferroni post-test or Dunnet’s T-3 or Kruskal-Wallis test was employed for cross-sectional comparisons between different diets and treatment groups. A significant level of p < 0.05 was considered statistically significant.
3. Results
3.1. Drink Intake and Weight Gain of Wistar Rats
Animals with caloric and non-caloric sweeteners consumed significantly more beverages compared to the control group (ANOVA, p < 0.05), with a preference for beverages with caloric sweeteners, Table 1. In relation to control group, male rats consumed 2.1, 2.0 and 2.1 times more beverage with sucrose, HFCS and dextrose, respectively and only 1.3 and 1.5 times more beverage with sucralose and Stevia. Females consumed 2.25, 2.3 and 2.45 times more beverage with sucrose, HFCS and dextrose, respectively, and only 1.9 and 1.8 times more beverage with sucralose and Stevia. Female rats showed higher consumption of sweetened beverages compared to males (Student’s t-test, p < 0.05).
At the beginning of the study, the average weight of the animals was 69.1 ± 8.3 g, without differences between sexes and study groups. There were no differences in weight gain between male and female rats at the end of the 16 weeks of treatment with caloric and non-caloric sweeteners. At the end of the study, the male rats recorded a weight of 430.5 ± 51.8 g and the female rats 245.2 ± 22.1 g, with no differences between the experimental groups.

Table 1.
Total intake of water or beverages (mL) with caloric and no caloric sweeteners in Wistar rats.
Table 1.
Total intake of water or beverages (mL) with caloric and no caloric sweeteners in Wistar rats.
| Males | ||||||
| Week | Sucrose | HFCS | Dextrose | Sucralose | Stevia | Control |
| 1 | 307.3 ± 9.5 bc | 290.8 ± 2.4 b | 331.3 ± 10.2 bd | 203.2 ± 10.0 bd | 272.0 ± 32.9 b | 170.7 ± 6.9 ad |
| 4 | 423.9 ± 25.6 bc | 432.5 ± 14.8b | 416.2 ± 21.4 b | 286.3 ± 2.5 bd | 338.3 ± 18.3 bd | 238.8 ± 13.7 ad |
| 8 | 391.3 ± 37.9 bc | 433.0 ± 7.7 b | 432.5 ± 35.6 b | 216.3 ± 26.6d | 304.3 ± 52.2 b | 188.3 ± 3.6 ad |
| 12 | 417.7 ± 58.8 bc | 447.2 ± 11.5 b | 434.3 ± 2.5 b | 256.3 ± 38.7 bd | 242.4 ± 30.8 bd | 172.2 ± 4.9 a |
| 16 | 408.3 ± 27.4 bc | 391.7 ± 9.1 b | 400.0 ± 3.3 b | 259.9 ± 58.4 d | 255.0 ± 68.5 d | 158.3 ± 10.9 a |
| Total | 386.2 ± 18.2 bc | 372.6 ± 10.8 b | 383.3 ± 3.7 b | 238.2 ± 27.6 bd | 281.3 ± 33.8 bd | 182.6 ± 3.2 a |
| Female | ||||||
| 1 | 306.5 ± 11.9 bc | 302.7 ± 46.4 b | 314.9 ± 14.6 b | 284.8 ± 13.7 b | 260.9 ± 12.4 bd | 180.5 ± 5.3 a |
| 4 | 414.7 ± 25.2 b | 406.5 ± 18.8 b | 397.5 ± 2.7 b | 344.5 ± 32.3 b | 347.2 ± 37.4 b | 180.8 ± 10.0 a |
| 8 | 333.8 ± 20.6 bc | 419.9 ± 18.2 bd | 408.7 ± 12.4 bd | 364.2 ± 39.2 b | 334.3 ± 21.2 b | 139.9 ± 25.6 a |
| 12 | 403.0 ± 30.7 bc | 407.5 ± 28.9 b | 448.6 ± 35.6 b | 278.0 ± 28.9 bd | 272.8 ± 20.1 bd | 154.9 ± 34.1 a |
| 16 | 367.5 ± 11.9 bc | 390.8 ± 2.8 bd | 461.5 ± 37.3 bd | 308.3 ± 3.6 bd | 315.8 ± 33.7 b | 140.8 ± 13.7 a |
| Total | 350.1 ± 22.9 bc | 364.2 ± 9.1 b | 379.6 ± 30.8 b | 296.8 ± 19.0 bd | 281.2 ± 5.2 bd | 154.6 ± 18.5 a |
The values represent the weekly intake averages ± standard deviation of the groups that consumed solution of sucrose, high fructose corn syrup (HFCS) or dextrose at 7% or sucralose and Stevia at 0.3% and the group with water (control). Different letters in each row indicate significant differences between groups according to ANOVA test, p < 0.05. The total represents the average consumption over the 16 weeks of treatment.
3.2. Energy Intake in Wistar Rats
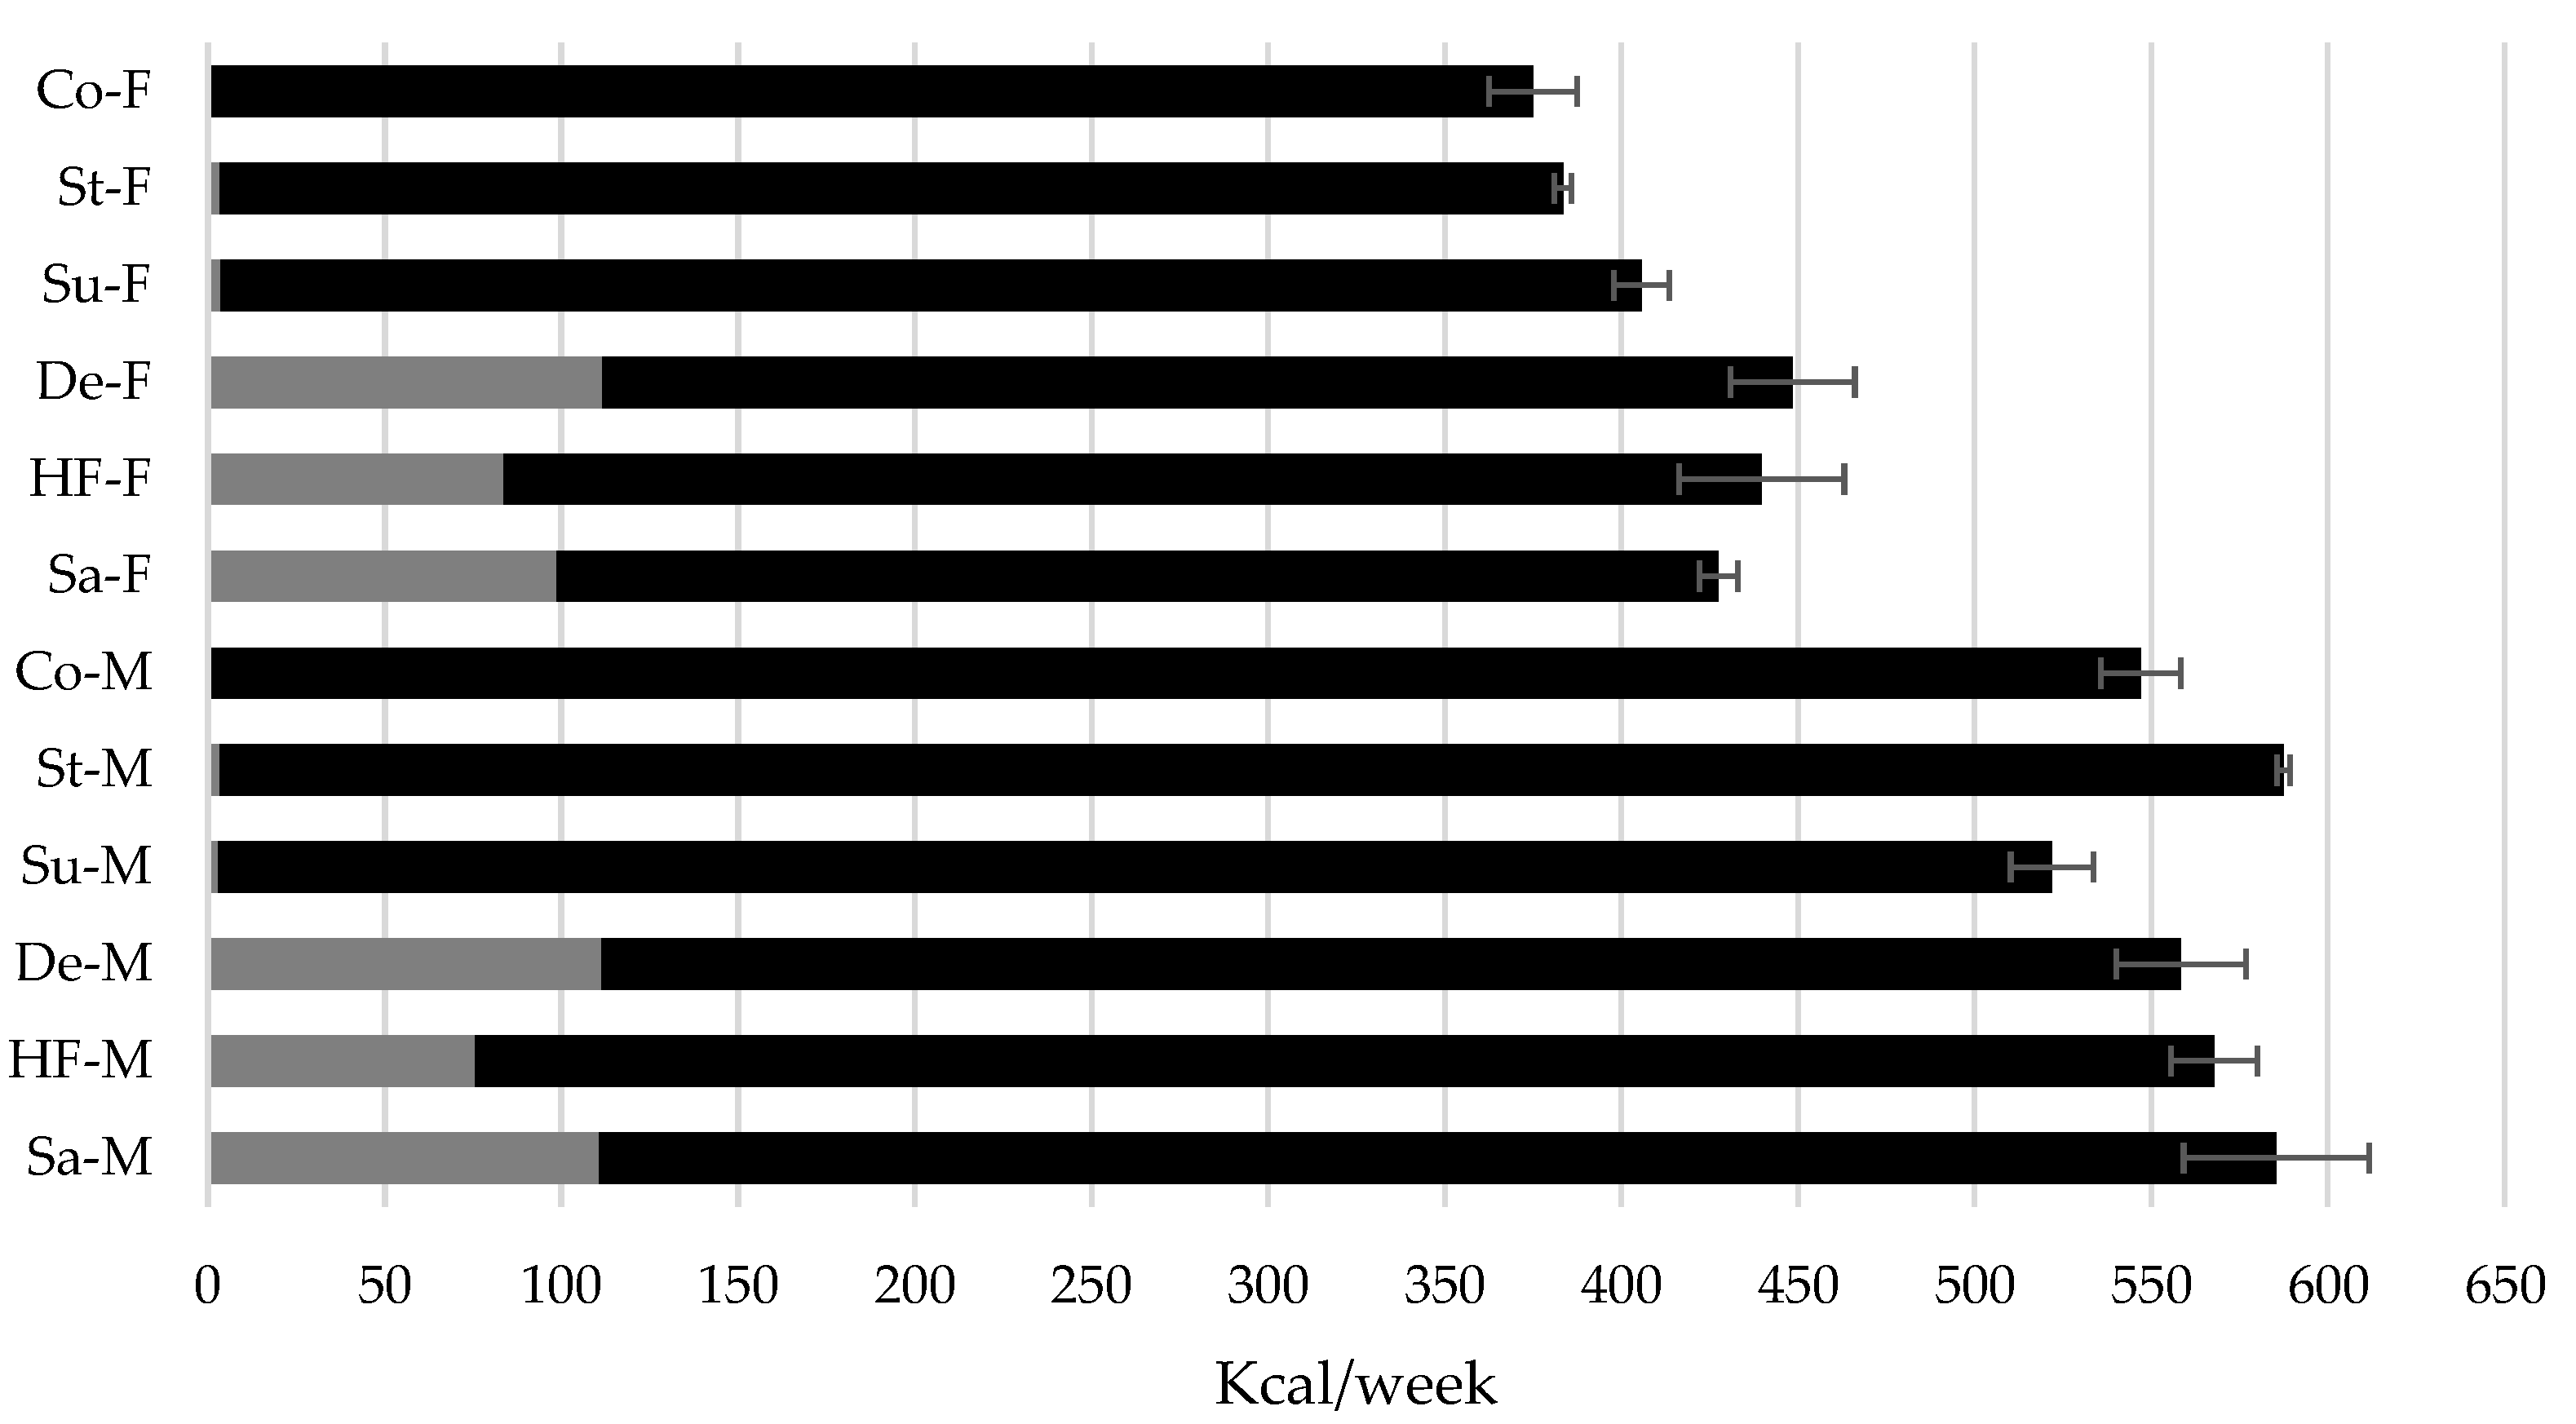
Figure 1 presents the mean ± SD of energy intake from food and drink (Kcal/week) in male and female rats. In males, energy intakes per week differed among the experimental groups, with higher intakes observed at weeks 8 and 12 in the sucrose, dextrose, and Stevia groups compared to the control group (ANOVA, p < 0.05). At the average of the 16 weeks of treatment (W16), the Stevia group of males consumed more energy (588.2 ± 4.4 Kcal) that the control group (547.2 ± 11.2 Kcal), p < 0.05.
In relation to the control, the female rats of the groups with caloric sweeteners sucralose, HFCS and dextrose registered a higher energy intake from week 4 of treatment (ANOVA, p < 0.05). At W16 the female control and sucralose group also recorded differences in energy intake (375.2 ± 12.5 vs. 406.2 ± 7.7 Kcal, respectively, p < 0.05). In contrast to observations in male rats, females in the Stevia group did not present differences in energy intake compared to the control group.
The amount of energy consumed from the beverage was similar between males and females in the sucrose (110.7 ± 5.7 vs. 98.5 ± 9.8 Kcal/week, p = 0.53), dextrose (111.4 ± 1.5 vs. 111.5 ± 9.2 Kcal/week, p = 0.99) and HFCS (75.8 ± 12.5 vs. 83.7 ± 2.3, p = 0.96) groups, (Figure 1). Although, the proportion of energy intake from beverages with caloric sweeteners was higher (p < 0.01) in females compared to males for the sucrose (23.0% vs. 18.9%), dextrose (24.8% vs. 19.9%) and HFCS (19.1% vs. 13.4%) groups (Figure 1).
Figure 1.
Average energy intake in Wistar rats with caloric and non-caloric sweeteners during 16 weeks of treatment. Co = control group, St = Stevia, Su = sucralose, De = dextrose, HF = high fructose corn syrup 55 and Sa = sucrose. M = male and F = female. The black bars represent the energy of the food and the grays of the drink. Different letters indicate significant differences between groups of males o females with their control, ANOVA test, p < 0.05.
3.3. Adipose Tissue in Wistar Rats
The amount of GAT, MAT and RAT in male and female Wistar rats treated with caloric and non-caloric sweeteners for 16 weeks are described in Table 2. Higher GAT (3.7 ± 0.61 mg/g wt) and MAT (2.8 ± 0.80 mg/g wt) were present in male rats of the dextrose group compared to the control group (TAG: 2.3 ± 0.33 and MAT: 1.7 ± 0.33 mg/g wt), p < 0.05. Male rats in the Stevia group presented a higher amount of RAT (4.6 ± 0.64 mg/g wt) compared to the control group (2.7 ± 0.19 mg/g wt), p < 0.05. In males the total amount (GAT + MAT + RAT) of adipose tissue was higher in the dextrose and Stevia group.
In female rats, a higher amount of TAG was identified in the HFCS and dextrose group relative to the control group (4.7 ± 0.81, 4.1 ± 0.24 vs. 2.2 ± 0.75 mg/g wt, respectively, ANOVA p < 0.05). In TAM and TAR, no differences were found in any of the study groups. The total amount of adipose tissue was higher in the HFCS and dextrose group with no significant differences between the groups with non-caloric sweeteners.
3.4. Biochemical and Adiposity Indicators
At the beginning of the experiment, the average glucose concentration in all Wistar rats (baseline) was 66.1 ± 18 mg/dL, with TG levels at 108.1 ± 35.9 mg/dL, TC at 112.6 ± 18.2 mg/dL, and HDL at 42.6 ± 8.9 mg/dL. Insulin concentration at baseline was 0.64 ± 0.19 ng/mL, and adiponectin levels of 0.45 ± 0.13 ng/dL, with no differences observed between males and females, Table 3.
Table 3 describes the averages ± SD of metabolic and adiposity indicators in male and female Wistar rats. At the end of treatment in males, all study groups showed higher concentrations of TG compared to the control group (ANOVA, p < 0.05). Additionally, the Stevia group exhibited a higher concentration of HDL cholesterol compared to the control group (39.3 ± 8.0 vs. 28.7 ± 3.9 mg/dL, p < 0.05).
No differences were found in glucose, TC, insulin, leptin and adiponectin markers in any study groups compared to the control group. However, insulin was lower in males of the JAMF group in relation to the glucose and sucralose groups (Table 3).
In female rats of the HFCS group, a higher serum glucose concentration was recorded compared to the control group (90.4 ± 11.8 vs. 65.1 ± 10.5, p < 0.05). Moreover, rats treated with sucrose, dextrose and sucralose showed higher TG concentration compared to the control group (ANOVA, p < 0.05). No significant differences were observed in TC, HDL, insulin, leptin and adiponectin concentrations between the control group and the other treatments. However, significant differences in insulin concentrations were recorded between females with dextrose compared to the sucralose group (Table 3). This section may be divided by subheadings. It should provide a concise and precise description of the experimental results, their interpretation, as well as the experimental conclusions that can be drawn.
4. Discussion
The reformulation of beverages and foods reduces energy density by replacing sugars or fats with other ingredients. These novel ingredients may introduce allergens or pose new physical, chemical or biological risks that were not present in the original formulation [19]. The incorporation of sweeteners in beverages reduces the energy and sugar content while preserving the sweet taste, because consumer demand is higher for beverages with a high sweetness intensity [20].
Both humans [21] and rodents [22] exhibit a preference for the sweet taste due to the pleasurable sensations associated with their consumption. The findings of this study suggest that this preference for sweet beverages regardless of their energy content. However, it was observed that consumption was higher with caloric sweeteners, which may be attributed to a greater reward response associated with the learned satiating capacity of calorically sweetened foods, influenced in part by the viscosity of energy drinks [23,24]. In this study, female rats demonstrated a stronger preference for sweet beverages, possibly due to gonadal sex hormones [25,26] and a heightened sensitivity to sweet taste [27].
Despite the increased consumption of beverages with caloric sweeteners, no significant differences in weight gain were observed after 16 weeks of treatment in both female and male rats. These results are aligned with previous studies conducted on Wistar rats over shorter durations, which used sucrose (35%) and high fructose (15%) in the animals’ drinks [28,29]. Conversely, some reports indicate weight gain in female and male BALB mice after consuming solutions containing sucrose (10%) or 0.25% sucralose for 6 weeks, while no changes were observed in those consuming steviol [30]. Similarly, Wistar rats consuming steviol and fructose did not exhibit weight changes [31]. In this study, the lack of association between increased consumption of caloric sweetened beverages and changes in body weight in the tested rats may be attributed to adjustments in total energy intake or changes in body composition, potentially involving an increase in adipose tissue.
Results regarding energy intake from food and sweetened solutions indicate that male rats exhibit greater adjustments in energy intake from food over the long term in response to the consumption of sweetened beverages (Table 1 and Figure 1). In contrast, females in the caloric sweetener group and the sucralose group did not adjust total energy intake (food and beverage), which was associated with higher energy intake from the beverage in the caloric sweetener group. Studies in humans and rats have reported sex-based differences [32,33] associated with the regulation of energy intake from sweetened beverages in the short [34] and medium term [35]. Male rats appear to have a greater capacity to regulate energy intake compared to females, although the underlying mechanisms for these differences remain unclear.
Consumption of non-caloric sweeteners was associated with higher energy intake in male rats of Stevia group and in females of sucralose group compared to the control group, suggesting that these non-caloric sweeteners have varying effects on energy intake. This difference may be due to the inconsistent coupling between sweet taste and caloric content [36] which can lead to a compensatory response in energy intake [37]. Despite the higher energy intake observed in female rats, no differences in weight gain were noted. However, both males and females exhibited differences in the amount of adipose tissue. With the consumption of the sweetened beverage, other nutrients, mainly lipids and proteins, were displaced from the diet, potentially explaining why body weight remained stable but adipose tissue increased. A study in men revealed that intake of drinks containing non-caloric sweeteners (sodium cyclamate, acesulfame K, aspartame, and sodium saccharin) increased neural activity in regions associated with reward, while sucrose and water primarily affected insula activation [38].
This study identified sex-specific differences in the total amount of adipose tissue and the type of sweetener consumed. Consumption of dextrose and Stevia in males, and dextrose and HFCS in females, was associated with a greater amount of adipose tissue, primarily in gonadal tissue. Increased accumulation of adipose tissue has been reported in rodents of both sexes associated with the consumption of caloric sweeteners such as dextrose [39,40] as well as non-caloric sweeteners such as sucralose in females and Stevia in males [41,42], consistent with the findings of this study.
Furthermore, an increase in serum insulin levels of male and female Wistar rats was observed with the intake of dextrose and sucralose. Chronic use of non-caloric sweeteners like sucralose has been shown to increase plasma levels of glucose insulinotropic peptide (GIP) and insulin in obese patients, indicating a potential development of insulin resistance [43]. The observed increase in HDL levels in male rats consuming Stevia aligns with previous reports in albino rats with hyperlipidemia [44], suggesting a beneficial effect on blood lipids through regulation of lecithin cholesterol acyl transferase (LCAT) activity [45,46].
The use of sweeteners may have adverse effects on the accumulation of adipose tissue, energy intake and insulin secretion, although their use in reformulated foods or beverages is not prohibited. In Mexico the cautionary legend in foods and beverage: “CONTAINS SWEETENERS, NOT RECOMMENDED FOR CHILDREN” indicated in the MODIFICATION to the Mexican Official Standard NOM-051-SCFI/SSA1-2010 [47], should include messages about adverse effects.
5. Conclusions
The consumption of both caloric and non-caloric sweeteners from early ages of life, was linked to elevated energy intake, particularly in female rats. Beverages containing HFCS and dextrose were associated with increased energy intake and higher amounts of gonadal adipose tissue in female rats. In male rats, consumption of Stevia beverages led to increased energy intake, while both Stevia and dextrose were correlated with higher total adipose tissue. These findings highlight the complex relationship between sweetener consumption, energy regulation, and adipose tissue deposition, which may vary based on sex and sweetener type. Labels on reformulated foods and beverages should include a warning about the adverse effects of sweeteners and sugars.
Author Contributions
Conceptualization, G.L.-R. and M.G.; methodology, G.L.-R. and J.G.C.; validation, G.L.-R. and J.G.C.; formal analysis, G.L.-R. and O.G.V.; investigation G.L.-R., M.G. and O.G.V.; data curation, G.L.-R. and J.G.C.; writing—original draft preparation, G.L.-R.; writing—review and editing, G.L.-R., M.G. and O.G.V. All authors have read and agreed to the published version of the manuscript.
Funding
This research received no external funding.
Data Availability Statement
The data can be available to researchers on request to the corresponding author.
Conflicts of Interest
The authors declare no conflicts of interest.
Abbreviations
| NCS | Non-caloric sweeteners |
| CS | Caloric sweeteners |
| GAT | Gonadal adipose tissue |
| MAT | Mesenteric adipose tissue |
| HDL | High-density lipoprotein |
| ANOVA | Analysis of variance |
| HFCS | High fructose corn syrup |
| TC | Total cholesterol |
| TG | Triglycerides |
References
- Spencer, S. Global Burden of Disease 2010 Study: A personal reflection. Glob Cardiol Sci Pract 2013, 2013, 115–126. [Google Scholar] [CrossRef] [PubMed]
- Perez-Herrera, A.; Cruz-Lopez, M. [Childhood obesity: current situation in Mexico]. Nutricion hospitalaria 2019, 36, 463–469. [Google Scholar] [CrossRef] [PubMed]
- Stanhope, K.L. Sugar consumption, metabolic disease and obesity: The state of the controversy. Crit Rev Clin Lab Sci 2016, 53, 52–67. [Google Scholar] [CrossRef]
- Singh, G.M.; Micha, R.; Khatibzadeh, S.; Lim, S.; Ezzati, M.; Mozaffarian, D. Estimated Global, Regional, and National Disease Burdens Related to Sugar-Sweetened Beverage Consumption in 2010. Circulation 2015, 132, 639–666. [Google Scholar] [CrossRef]
- Braverman-Bronstein, A.; Camacho-Garcia-Formenti, D.; Zepeda-Tello, R.; Cudhea, F.; Singh, G.M.; Mozaffarian, D.; Barrientos-Gutierrez, T. Mortality attributable to sugar sweetened beverages consumption in Mexico: an update. Int J Obes 2020, 44, 1341–1349. [Google Scholar] [CrossRef]
- Hu, F.B.; Malik, V.S. Sugar-sweetened beverages and risk of obesity and type 2 diabetes: epidemiologic evidence. Physiol Behav 2010, 100, 47–54. [Google Scholar] [CrossRef] [PubMed]
- Lowndes, J.; Sinnett, S.; Yu, Z.; Rippe, J. The effects of fructose-containing sugars on weight, body composition and cardiometabolic risk factors when consumed at up to the 90th percentile population consumption level for fructose. Nutrients 2014, 6, 3153–3168. [Google Scholar] [CrossRef] [PubMed]
- Golabek, K.D.; Regulska-Ilow, B. Dietary support in insulin resistance: An overview of current scientific reports. Adv Clin Exp Med 2019, 28, 1577–1585. [Google Scholar]
- Shearrer, G.E.; Daniels, M.J.; Toledo-Corral, C.M.; Weigensberg, M.J.; Spruijt-Metz, D.; Davis, J.N. Associations among sugar sweetened beverage intake, visceral fat, and cortisol awakening response in minority youth. Physiol Behav 2016, 167, 188–193. [Google Scholar] [CrossRef]
- Azad, M.B.; Abou-Setta, A.M.; Chauhan, B.F.; Rabbani, R.; Lys, J.; Copstein, L.; Mann, A.; Jeyaraman, M.M.; Reid, A.E.; Fiander, M.; MacKay, D.S.; McGavock, J.; Wicklow, B.; Zarychanski, R. Nonnutritive sweeteners and cardiometabolic health: a systematic review and meta-analysis of randomized controlled trials and prospective cohort studies. CMAJ 2017, 189, E929–E939. [Google Scholar] [CrossRef]
- Mattes, R.D.; Popkin, B.M. Nonnutritive sweetener consumption in humans: effects on appetite and food intake and their putative mechanisms. Am J Clin Nutr 2009, 89, 1–14. [Google Scholar] [CrossRef] [PubMed]
- DiMeglio, D.P.; Mattes, R.D. Liquid versus solid carbohydrate: effects on food intake and body weight. Int J Obes Relat Metab Disord 2000, 24, 794–800. [Google Scholar] [CrossRef]
- Raben, A.; Vasilaras, T.H.; Moller, A.C.; Astrup, A. Sucrose compared with artificial sweeteners: different effects on ad libitum food intake and body weight after 10 wk of supplementation in overweight subjects. Am J Clin Nutr 2002, 76, 721–729. [Google Scholar] [CrossRef]
- Tordoff, M.G.; Alleva, A.M. Effect of drinking soda sweetened with aspartame or high-fructose corn syrup on food intake and body weight. Am J Clin Nutr 1990, 51, 963–969. [Google Scholar] [CrossRef] [PubMed]
- Van Wymelbeke, V.; Beridot-Therond, M.E.; de La Gueronniere, V.; Fantino, M. Influence of repeated consumption of beverages containing sucrose or intense sweeteners on food intake. Eur J Clin Nutr 2004, 58, 154–161. [Google Scholar] [CrossRef] [PubMed]
- Vartanian, L.R.; Schwartz, M.B.; Brownell, K.D. Effects of soft drink consumption on nutrition and health: a systematic review and meta-analysis. Am J Public Health 2007, 97, 667–675. [Google Scholar] [CrossRef]
- Tovar, A.P.; Navalta, J.W.; Kruskall, L.J.; Young, J.C. The effect of moderate consumption of non-nutritive sweeteners on glucose tolerance and body composition in rats. Appl Physiol Nutr Metab 2017, 42, 1225–1227. [Google Scholar] [CrossRef]
- Reeves, P.G.; Nielsen, F.H.; Fahey, G.C., Jr. AIN-93 purified diets for laboratory rodents: final report of the American Institute of Nutrition ad hoc writing committee on the reformulation of the AIN-76A rodent diet. J Nutr 1993, 123, 1939–1951. [Google Scholar] [CrossRef]
- World Health Organization. Reformulation of food and beverage products for healthier diets: policy brief. World Health Organization, 2022. [Google Scholar]
- Jensen, J.D.; Mielby, L.A.; Kidmose, U. Consumer preferences for attributes in sweet beverages and market impacts of beverage innovation. Appetite 2024, 197, 107329. [Google Scholar] [CrossRef]
- Schiffman, S.S.; Gatlin, C.A. Sweeteners: state of knowledge review. Neurosci Biobehav Rev 1993, 17, 313–345. [Google Scholar] [CrossRef]
- Berridge, K.C. Modulation of taste affect by hunger, caloric satiety, and sensory-specific satiety in the rat. Appetite 1991, 16, 103–120. [Google Scholar] [CrossRef] [PubMed]
- Delogu, F.; Huddas, C.; Steven, K.; Hachem, S.; Lodhia, L.; Fernandez, R.; Logerstedt, M. A Dissociation Between Recognition and Hedonic Value in Caloric and Non-caloric Carbonated Soft Drinks. Front Psychol 2016, 7, 36. [Google Scholar] [CrossRef]
- Chen, H.H.; Chu, C.H.; Wen, S.W.; Lai, C.C.; Cheng, P.W.; Tseng, C.J. Excessive Fructose Intake Impairs Baroreflex Sensitivity and Led to Elevated Blood Pressure in Rats. Nutrients 2019, 11, 2581. [Google Scholar] [CrossRef]
- Gentry, R.T.; Wade, G.N. Sex differences in sensitivity of food intake, body weight, and running-wheel activity to ovarian steroids in rats. J Comp Physiol Psychol 1976, 90, 747–754. [Google Scholar] [CrossRef]
- Sclafani, A.; Hertwig, H.; Vigorito, M.; Feigin, M.B. Sex differences in polysaccharide and sugar preferences in rats. Neurosci Biobehav Rev 1987, 11, 241–251. [Google Scholar] [CrossRef] [PubMed]
- Michon, C.; O’sullivan, M.; Delahunty, C.; Kerry, J. The investigation of gender-related sensitivity differences in food perception. Journal of Sensory Studies 2009, 24, 922–937. [Google Scholar] [CrossRef]
- Martínez, C.; González, E.; Garc, R.S.; Salas, G.; Constantino-Casas, F.; Macías, L.; Gracia, I.; Tovar, C.; Durán-de-Bazúa, C. Effects on body mass of laboratory rats after ingestion of drinking water with sucrose, fructose, aspartame, and sucralose additives. The Open Obesity Journal 2010, 2. [Google Scholar] [CrossRef]
- Burgeiro, A.; Cerqueira, M.G.; Varela-Rodriguez, B.M.; Nunes, S.; Neto, P.; Pereira, F.C.; Reis, F.; Carvalho, E. Glucose and Lipid Dysmetabolism in a Rat Model of Prediabetes Induced by a High-Sucrose Diet. Nutrients 2017, 9, 638. [Google Scholar] [CrossRef]
- Barrios-Correa, A.A.; Estrada, J.A.; Martel, C.; Olivier, M.; Lopez-Santiago, R.; Contreras, I. Chronic Intake of Commercial Sweeteners Induces Changes in Feeding Behavior and Signaling Pathways Related to the Control of Appetite in BALB/c Mice. Biomed Res Int 2018, 2018, 3628121. [Google Scholar] [CrossRef]
- Sánchez-Tapia, M.; Martínez-Medina, J.; Tovar, A.R.; Torres, N. Natural and artificial sweeteners and high fat diet modify differential taste receptors, insulin, and TLR4-mediated inflammatory pathways in adipose tissues of rats. Nutrients 2019, 11, 880. [Google Scholar] [CrossRef]
- Hamilton, L.W.; Timmons, C.R. Sex differences in response to taste and postingestive consequences of sugar solutions. Physiology & Behavior 1976, 17, 221–225. [Google Scholar] [CrossRef]
- Mendoza-Perez, S.; Garcia-Gomez, R.S.; Ordaz-Nava, G.; Gracia-Mora, M.I.; Macias-Rosales, L.; Morales-Rico, H.; Salas-Garrido, G.; Perez-Armendariz, E.M.; Bustamante-Garcia, R.; Duran-Dominguez-de-Bazua, M.D. Consumption of sweeteners at different stages of life: effects on body mass, food and drink intake in male and female Wistar rats. Int J Food Sci Nutr 2021, 72, 935–946. [Google Scholar] [CrossRef] [PubMed]
- Ranawana, D.; Henry, C. Are caloric beverages compensated for in the short-term by young adults? An investigation with particular focus on gender differences. Appetite 2010, 55, 137–146. [Google Scholar] [CrossRef]
- Davy, B.M.; Van Walleghen, E.L.; Orr, J.S. Sex differences in acute energy intake regulation. Appetite 2007, 49, 141–147. [Google Scholar] [CrossRef] [PubMed]
- Mattes, R.D.; Popkin, B.M. Nonnutritive sweetener consumption in humans: effects on appetite and food intake and their putative mechanisms. The American Journal of Clinical Nutrition 2009, 89, 1–14. [Google Scholar] [CrossRef]
- Yang, Q. Gain weight by “going diet?” Artificial sweeteners and the neurobiology of sugar cravings: Neuroscience 2010. The Yale Journal of Biology and Medicine 2010, 83, 101. [Google Scholar] [PubMed]
- Smeets, P.A.; Weijzen, P.; de Graaf, C.; Viergever, M.A. Consumption of caloric and non-caloric versions of a soft drink differentially affects brain activation during tasting. Neuroimage 2011, 54, 1367–1374. [Google Scholar] [CrossRef]
- Jacquillet, G.; Debnam, E.S.; Unwin, R.J.; Marks, J. Acute saccharin infusion has no effect on renal glucose handling in normal rats in vivo. Physiological Reports 2018, 6, e13804. [Google Scholar] [CrossRef]
- Bian, X.; Chi, L.; Gao, B.; Tu, P.; Ru, H.; Lu, K. The artificial sweetener acesulfame potassium affects the gut microbiome and body weight gain in CD-1 mice. PLoS One 2017, 12, e0178426. [Google Scholar] [CrossRef]
- Rosales-Gómez, C.A.; Martínez-Carrillo, B.E.; Reséndiz-Albor, A.A.; Ramírez-Durán, N.; Valdés-Ramos, R.; Mondragón-Velásquez, T.; Escoto-Herrera, J.A. Chronic consumption of sweeteners and its effect on glycaemia, cytokines, hormones, and lymphocytes of GALT in CD1 mice. BioMed Research International 2018, 2018. [Google Scholar] [CrossRef]
- Kim, E.; Lim, S.M.; Kim, M.S.; Yoo, S.H.; Kim, Y. Phyllodulcin, a Natural Sweetener, Regulates Obesity-Related Metabolic Changes and Fat Browning-Related Genes of Subcutaneous White Adipose Tissue in High-Fat Diet-Induced Obese Mice. Nutrients 2017, 9, 1049. [Google Scholar] [CrossRef] [PubMed]
- Pepino, M.Y.; Tiemann, C.D.; Patterson, B.W.; Wice, B.M.; Klein, S. Sucralose affects glycemic and hormonal responses to an oral glucose load. Diabetes Care 2013, 36, 2530–2535. [Google Scholar] [CrossRef] [PubMed]
- Ahmad, U.; Ahmad, R.S.; Arshad, M.S.; Mushtaq, Z.; Hussain, S.M.; Hameed, A. Antihyperlipidemic efficacy of aqueous extract of Stevia rebaudiana Bertoni in albino rats. Lipids in Health and Disease 2018, 17, 1–8. [Google Scholar] [CrossRef]
- Elnaga, N.A.; Massoud, M.I.; Yousef, M.; Mohamed, H.H. Effect of stevia sweetener consumption as non-caloric sweetening on body weight gain and biochemical’s parameters in overweight female rats. Annals of Agricultural Sciences 2016, 61, 155–163. [Google Scholar] [CrossRef]
- Shukla, R.; Gupta, S.; Gambhir, J.K.; Prabhu, K.M.; Murthy, P.S. Antioxidant effect of aqueous extract of the bark of Ficus bengalensis in hypercholesterolaemic rabbits. J Ethnopharmacol 2004, 92, 47–51. [Google Scholar] [CrossRef]
- Diario Oficial de la Federación. Modificación a la Norma Oficial Mexicana NOM-051-SCFI/SSA1-2010, Especificaciones generales de etiquetado para alimentos y bebidas no alcohólicas preenvasados. Información comercial y sanitaria. DOF Mexico: 2020. Available online: https://www.dof.gob.mx/normasOficiales/8150/seeco11_C/seeco11_C.html (accessed on 19 February 2025).
Table 2.
Adipose tissue (mg/g body weight) of Wistar rats with chronic consumption of caloric and non-caloric sweeteners.
Table 2.
Adipose tissue (mg/g body weight) of Wistar rats with chronic consumption of caloric and non-caloric sweeteners.
| Males | ||||
| Group | Gonadal | Mesenteric | Retroperitoneal | Total |
| Sucrose | 2.8 ± 0.38 | 2.4 ± 0.31 | 3.5 ± 0.91 | 8.7 ± 1.2 |
| HFCS | 2.3 ± 0.29 | 2.2 ± 0.52 | 3.2 ± 0.34 | 7.7 ± 0.62 |
| Dextrose | 3.7 ± 0.61 b | 2.8 ± 0.80 b | 3.9 ± 1.2 | 10.4 ± 2.5 b |
| Sucralose | 2.9 ± 0.26 | 1.9 ± 0.38 | 3.3 ± 0.49 | 8.0 ± 0.91 |
| Stevia | 3.1 ± 0.53 | 2.2 ± 0.21 | 4.6 ± 0.64 b | 10 ± 1.16 b |
| Control | 2.3 ± 0.33 a | 1.7 ± 0.32 a | 2.7 ± 0.19 a | 6.7 ± 0.60 a |
| Females | ||||
| Sucrose | 3.3 ± 0.94 | 1.5 ± 0.56 | 1.6 ± 0.50 | 6.4 ± 1.9 |
| HFCS | 4.7 ± 0.81 b | 1.9 ± 0.48 | 2.2 ± 0.56 | 8.9 ± 0.43 b |
| Dextrose | 4.1 ± 0.24 b | 1.7 ± 0.45 | 2.2 ± 0.56 | 7.8 ± 0.45 b |
| Sucralose | 3.4 ± 0.49 | 1.8 ± 0.30 | 2.1 ± 0.56 | 7.3 ± 0.72 |
| Stevia | 1.7 ± 0.55 | 1.4 ± 0.14 | 1.6 ± 0.08 | 4.7 ± 0.64 |
| Control | 2.2 ± 0.75 a | 1.2 ± 0.44 | 1.7 ± 0.66 | 5.2 ± 0.46 a |
The values represent the averages of gonadal, mesenteric, and retroperitoneal adipose tissue ± standard deviation of the groups that consumed AIN 93 M food, and 7% solution of sucrose or high fructose corn syrup (HFCS) or dextrose and plain water (control); different letters in the same column indicate significant differences between groups according to ANOVA test, p < 0.05.
Table 3.
Metabolic and adiposity indicators in Wistar rats with chronic consumption of beverages caloric and non-caloric sweeteners.
Table 3.
Metabolic and adiposity indicators in Wistar rats with chronic consumption of beverages caloric and non-caloric sweeteners.
| Males | |||||||
| Group | Glucose (mg/dL) | Triglycerides (mg/dL) | ColT (mg/dL) | ColHDL (mg/dL) | Insulin (ng/mL) | Leptin (ng/mL) | Adiponectin (ng/mL) |
| Sucrose | 94.0 ± 9.8 | 257.0 ± 15.6 b | 73.1 ± 12.9 | 27.5 ± 3.6 | 1.2 ± 1.2 | 17.7 ± 8.3 | 36.5 ± 7.2 |
| HFCS | 94.6 ± 11.8 | 273.0 ± 44.7 b | 80.3 ± 15.4 | 32.7 ± 5.4 | 0.4 ± 0.2 b | 19.1 ± 8.8 | 37.6 ± 6.1 |
| Dextrose | 72.0 ± 8.0 | 299.7 ± 62.3 b | 75.9 ± 9.5 | 27.0 ± 4.8 | 1.9 ± 1.3 a | 21.3 ± 9.1 | 36.2 ± 5.6 |
| Sucralose | 85.8 ± 16.7 | 352.4 ± 36.2 b | 94.3 ± 7.0 | 26.6 ± 3.1 | 1.8 ± 1.4 a | 17.8 ± 9.8 | 27.7 ± 7.0 |
| Stevia | 87.0 ± 7.2 | 242.3 ± 36.4 b | 89.4 ± 6.3 | 39.3 ± 8.0 b | 0.9 ± 0.2 | 18.8 ± 6.7 | 28.6 ± 6.9 |
| Control | 78.8 ± 7.0 | 122.3 ± 51.2 a | 73.7 ± 7.4 | 28.7 ± 3.9 a | 1.7 ± 1.7 | 14.7 ± 5.8 | 28.8 ± 12.1 |
| Females | |||||||
| Sucrose | 63.8 ± 12.0 | 105.8 ± 32.1 b | 77.7 ± 11.2 | 33.6 ± 2.7 | 0.4 ± 0.1 | 5.2 ± 2.9 | 29.6 ± 4.2 |
| HFCS | 90.4 ± 11.8 b | 61.2 ± 21.1 | 83.7 ± 18.3 | 34.4 ± 2.5 | 0.4 ± 0.1 | 4.9 ± 4.6 | 28.6 ± 8.4 |
| Dextrose | 60.6 ± 19.2 | 88.4 ± 22.8 b | 100.1 ± 18.4 | 39.9 ± 4.7 | 0.8 ± 0.4 b | 6.8 ± 3.1 | 36.5 ± 5.0 |
| Sucralose | 67.5 ± 9.9 | 108.9 ± 15.7 b | 76.1 ± 12.9 | 34.3 ± 3.1 | 0.3 ± 0.1 a | 3.0 ± 1.1 | 27.5 ± 8.5 |
| Stevia | 70.9 ± 10.0 | 63.4 ± 18.9 | 82.6 ± 12.3 | 36.6 ± 2.7 | 0.5 ± 0.1 | 2.4 ± 1.7 | 24.8 ± 4.6 |
| Control | 65.1 ± 10.5 a | 56.0 ± 6.1 a | 72.0 ± 9.1 | 36.8 ± 5.2 | 0.7 ± 0.1 | 2.8 ± 1.8 | 25.1 ± 5.8 |
Data represents serum averages ± standard deviation. Total cholesterol (ColT), HDL cholesterol (ColHDL). The groups consumed AIN 93 M and 7% sucrose or high fructose corn syrup (HFCS) or dextrose, and 0.3% sucralose or stevia solution, and water (control); different letters in the same column indicate significant differences between groups for the ANOVA test, p < 0.05.
Disclaimer/Publisher’s Note: The statements, opinions and data contained in all publications are solely those of the individual author(s) and contributor(s) and not of MDPI and/or the editor(s). MDPI and/or the editor(s) disclaim responsibility for any injury to people or property resulting from any ideas, methods, instructions or products referred to in the content. |
© 2025 by the authors. Licensee MDPI, Basel, Switzerland. This article is an open access article distributed under the terms and conditions of the Creative Commons Attribution (CC BY) license (http://creativecommons.org/licenses/by/4.0/).
Copyright: This open access article is published under a Creative Commons CC BY 4.0 license, which permit the free download, distribution, and reuse, provided that the author and preprint are cited in any reuse.


