Preprint
Article

This version is not peer-reviewed.

Minimization of Defect and Rejection Rate in Convertex (Finishing Section) Using Six Sigma DMAIC (Case Study of Messebo PP Bag Production)

Submitted:

14 March 2025

Posted:

17 March 2025

You are already at the latest version

Abstract

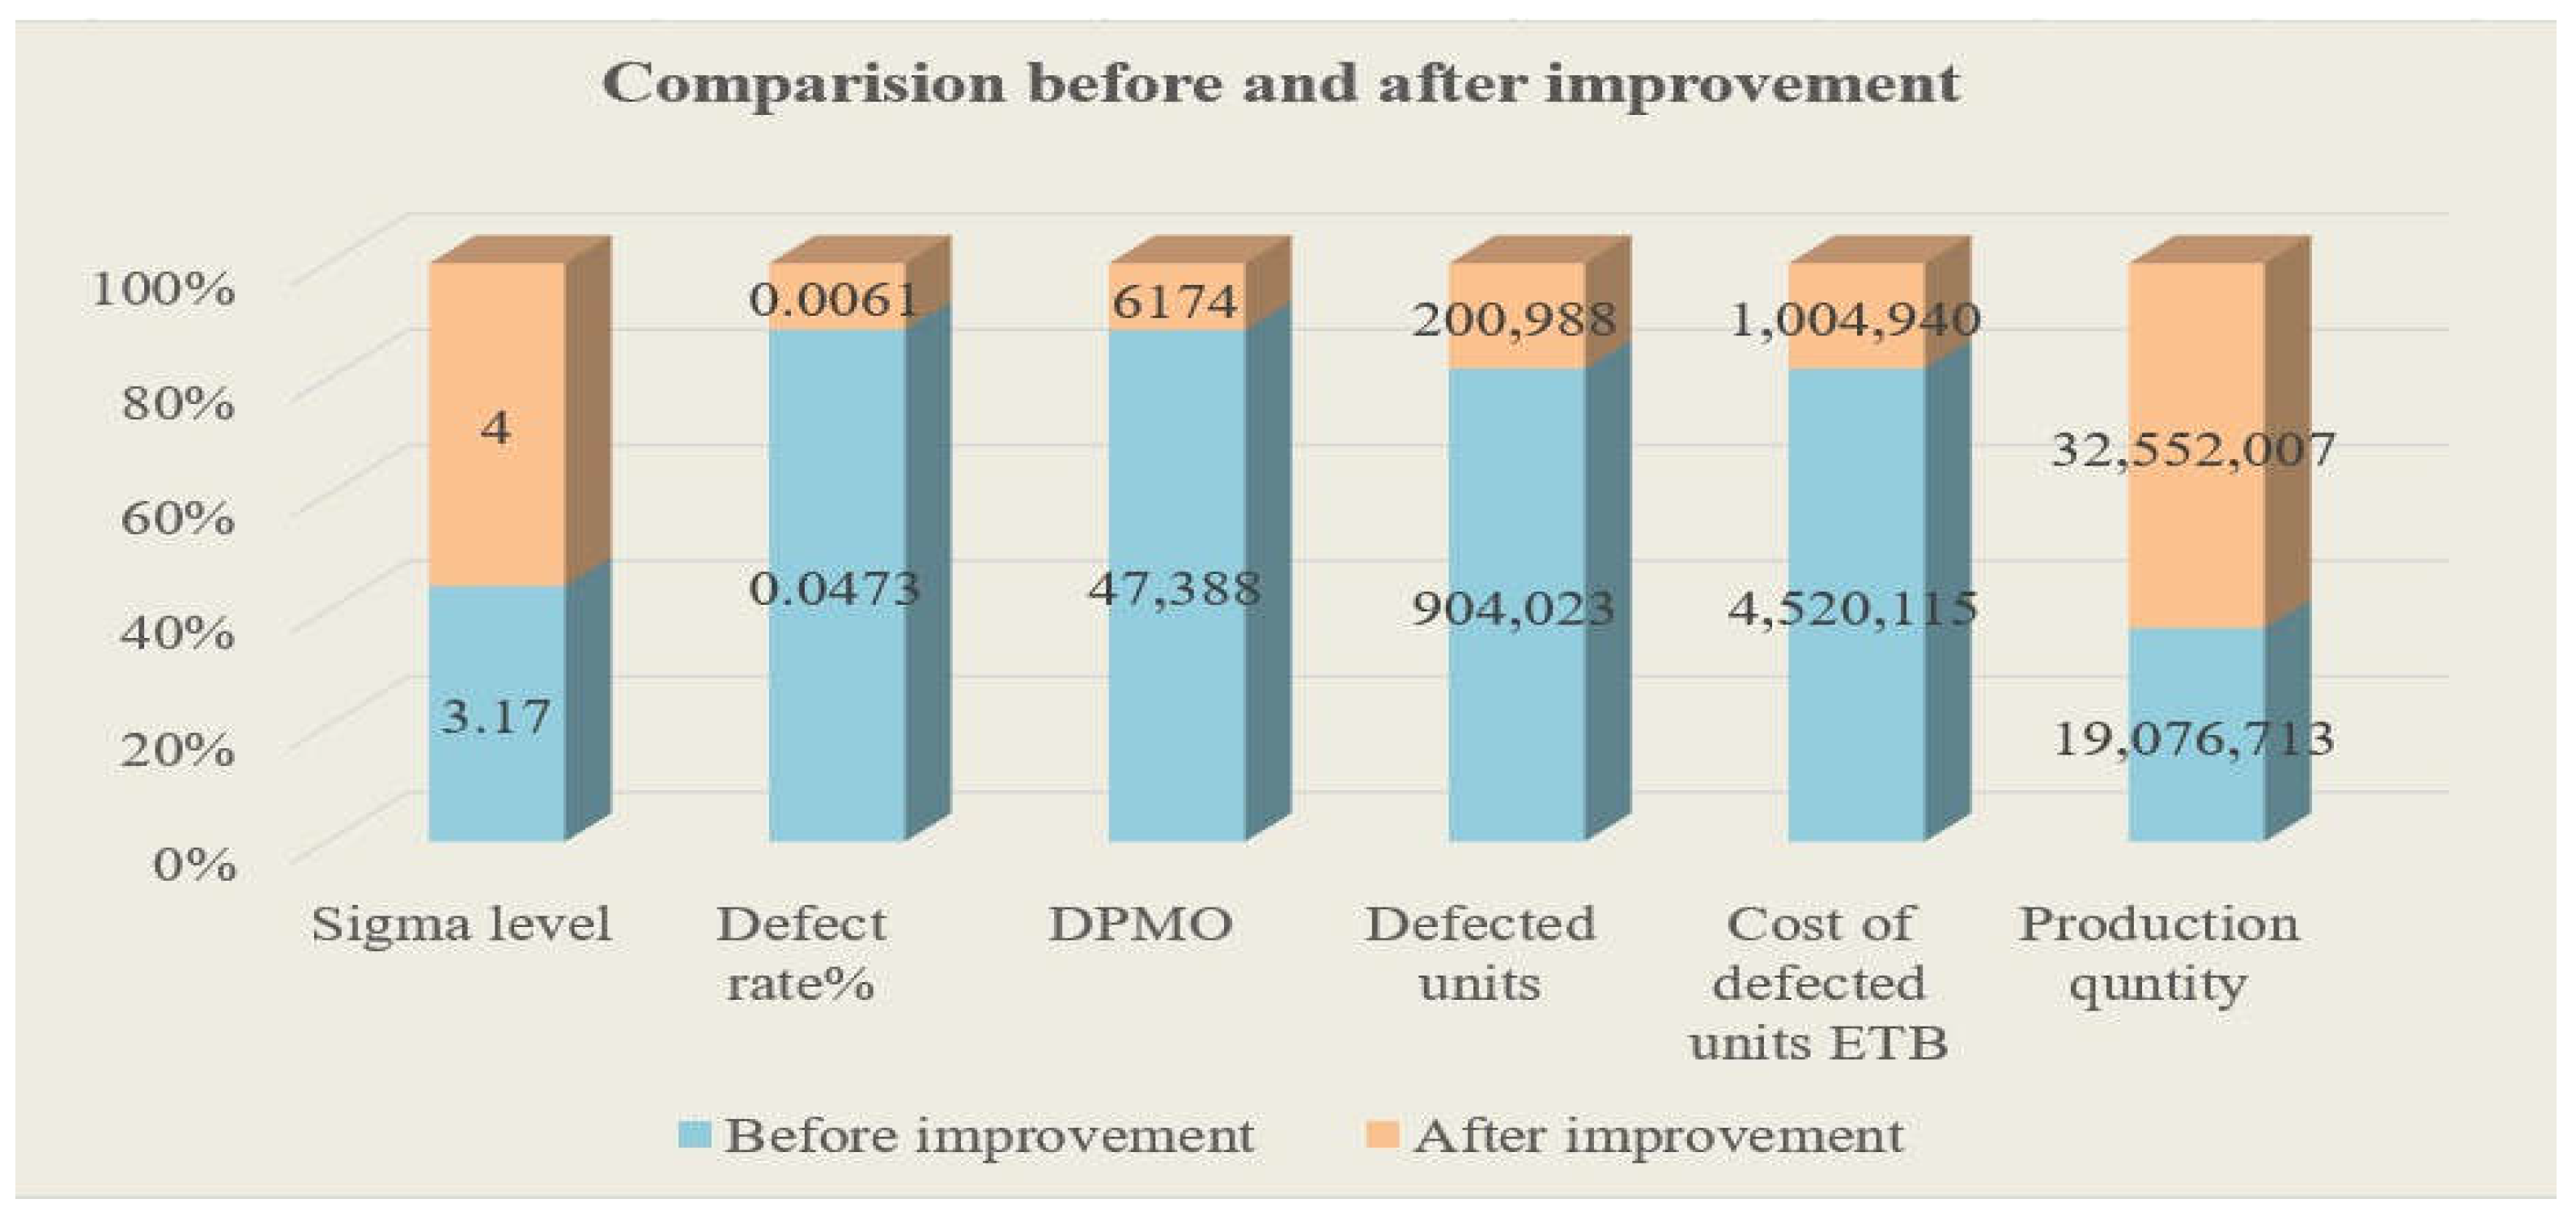
Total Quality Management (TQM) projects, particularly those utilizing Six Sigma, are globally recognized for enhancing quality and productivity in the manufacturing industry. The study applies Six Sigma's DMAIC framework and SQC tools to improve defects in Messebo PP bag manufacturing's Convertex finishing section. The objective is to identify and eliminate defects, reduce rejection rates, and enhance sigma levels. in the define phase of DMAIC process, SIPOC tool, and customer questionnaires were used to map process flows and align improvement efforts with customer requirements (VOC). The Measure phase involved analyzed of existing data considering the performance of the Convertex section and process capability plots were generated to understand the current process performance against requirements. A key six most dominated defects (vital few) contributing to the majority of issues were identified through pareto analysis. The initial performance baseline revealed a Sigma level of 3.17, considered non-competitive, with a defect rate of 4.73%, a Defects Per Million Opportunities (DPMO) of 47,389, and process capability indices of 0.55 and 0.58 for processing quantity and defective units respectively. This data demonstrated the urgent need for improvement. The analyzing phase investigates the root cause of the vital few causes of defects considering team brainstormed and systematically categorized potential causes using Fishbone diagram, in which this structural analysis helps the team to understand past symptoms and underlying reason for the issues and develop effective solutions. Considering analysis phase, in the improvement phase specific solutions were developed and put for improvement, as a result the sigma level becomes 4.00 (industry average), defect rate 0.61%, DPMO 6174, and the process capability of produced quantity and defect units becomes 1.19 and 1.26 respectively, which is very capable and led to significant and immediate positive results in the overall quality and productivity of the Convertex section. Lastly, the control phase was conducted to sustain the results found in the improvement phase and to keep the changes moving forward. It has four procedures, standardization documentation, monitoring plan, and response plan, which control the newly implemented changes and developed procedures.

Keywords: 
;  ;  ;  ;  ;  ;  ;  

1. Introduction

Quality in modern business areas is essential for the manufacturing or service industry [1], which assures a sufficient market, reduces customer compline, and increases the overall process. Researchers explain quality as a crucial dimension of products and processes. The studies discuss how quality organizations and companies benefit from enhanced competitiveness in world markets. [2]. Manufacturing industries have continuously been challenged to run their processes and systems in a way that delivers the required production quantities and high-quality products [3]. The study by [4] States that integrating quality management (QM) into operations based on reinforcement principles as a set of practices supports it. Considering the importance, “Production Quality” was recently formulated as the field that combines quality, production logistics, and maintenance methods and tools, which help to maintain throughput and improve over time with utilized minimum resources and materials [2,5].
Quality improvement plays a vital role in improving productivity and economic development for the country. Total quality managem ent (TQM) functions as a management approach that focuses on maintaining continuous cross-company efforts for quality service and fulfillment [6]. Manufacturing and service industries have utilized TQM techniques and Quality control tools such as Flow Charts, Cheek Sheets, Histograms, Pareto Charts, Scatter Diagrams, Control Charts, process capability plots, and Cause-and-Effect diagrams [7]. Applying these tools in the manufacturing process helps to find and minimize the number of reworks and scrapes, which enhances quality [8].
Many studies have determined primary quality improvement tools. Their paper discusses quality and productivity improvement in a manufacturing enterprise through practical research [9,10]. Quality tools have been used in many PP woven bag-manufacturing industries to boost quality, minimize defects, and increase the sigma level, particularly in manufacturing sectors and support functions.
The principal objective of quality tools is to improve quality by reducing variation or defect [11] while producing products that meet predetermined specifications with the minimum non-conformation rate [12]. Quality improvement measurements depend on the exact specification of measurable product quality characteristics to decrease process defects and variations [13,14]. Products not meeting specific quality standards are referred to as defective products. The severity of one or more defects in a product or service may cause it to be unacceptable or defective [11,15]. The modern term for the defect is nonconformity, and the term for defective is a nonconforming item [16]. Most laminated bag and textile industry products have a short lifespan, and new defects arise with new products [17]. Even after knowing the products inside and out, it is tough to prevent defects from reaching the finished products [18]. Defects are a significant concern in the polypropylene woven bag manufacturing industry. Due to the direct interaction between the bag and the customer, a very high safety factor must be maintained [19].
Six Sigma is an innovative quality management method introduced in Motorola by Bob Galvin and Bill Smith in the middle of the eighties [20,21]. ‘Sigma’ is a notation taken from statistics, and Six Sigma means six times the distance of standard deviation. A process cannot produce more than 3.4 defects per million opportunities to achieve Six Sigma [22,23,24].
DMAIC and DMADV (define, measure, analyze, design, and verify) are two main concepts of Six Sigma that may be considered in quality improvement methods [24,25]. According to the Deming cycle, the application is based on process improvement, which concerns the process improvement of any area in the enterprise [26]. Implementing the TQM minimizes and controls the overall production cost due to rework and scrap rates, from the raw material extraction to the final product output, making it a leading solution [27].

Justification and Specific Objectives of the Study

As technology is upgraded daily, implementing Six Sigma with statistical quality tools becomes important in manufacturing companies. Messebo PP bag factory is supplying 90% of its products (laminated PP woven packaging materials) to the Messebo cement factory, and around 10% of its products are supplied to other companies to satisfy the demand around its local area. Different types of defects affected numerous products across all stages of production, starting from raw material extrusion through final output, despite the section relying on advanced machinery. This study focuses on implementing Six Sigma DMAIC and statistical quality control methods to minimize the non-conformation rate and identify critical faults with their root causes, which may increase the overall quality of laminated PP bag products, as the main objective of this research is to improve an existing system.

2. Literature Review

2.1. Total Quality Management

Total Quality Management (TQM) and Six Sigma (SS) are two important and highly effective approaches to business management and process improvement that different organizations have widely adopted [28,29]. TQM and SS have consistently confirmed their value in enhancing organizational performance, reducing costs, increasing customer satisfaction, and driving growth [30]. TQM is a philosophy focused on customer satisfaction and procedures for continuously improving all facets of an organization’s operations [31,32]. TQM promotes the participation of all organization employees, from senior management to front-line personnel [33].
Conversely, SS is a data-driven methodology for process enhancement conceived by Motorola in the 1980s [34,35]. Six Sigma is based on statistical methodologies and attempts to minimize the number of defects in a process to 3.4 per million opportunities (DPMO) [36,37]. SS uses a structured method called Define, Measure, Analyze, Improve, and Control (DMAIC) to help identify and minimize or eliminate the root causes of process problems [24,38]. SS stresses using data and statistical analysis to make refined decisions and analyze the success of process improvement initiatives [39].
In sectors such as polymer manufacture, where polypropylene bag defects ranging from seal integrity failures to dimensional inaccuracies directly affect profitability, Six Sigma tools like DPMO and process capability indices (Cp, Cpk) evaluate baseline performance and guide improvements. Recent studies highlight how Pareto diagrams emphasize significant flaws (e.g., 80% of difficulties deriving from 20% of cases), whereas cause-and-effect analysis investigates root causes such as raw material impurities or extrusion temperature variations [40,41,42]. For instance, DMAIC cycles reduced sealing faults by 40% in polypropylene bag lines by monitoring thermoforming parameters in real time [43]. Concurrently, DMADV’s emphasis on design robustness has redefined defect avoidance, where computational modeling of bag geometry lowered DPMO by 58% [44,45].
TQM’s holistic focus on organizational culture emphasizes employee empowerment, cross-functional collaboration, and iterative quality improvement, which complements SS data-centric consistency. Research by [46,47] illustrates how TQM-driven training programs promoted process uniformity in polypropylene manufacture. Zhang et al. (2024) associated leadership commitment to TQM principles with sustained decreases in non-conformance rates [48,49]. Emerging trends further integrate Lean Six Sigma (LSS) to minimize waste [50], which has been demonstrated in optimizing raw material use for polypropylene films, yielding 30% cost savings [51]. Advanced statistical methods, such as machine learning-based defect prediction models and sustainability-driven quality frameworks (e.g., Green Six Sigma), are also gaining traction [52]. These frameworks target eco-efficiency with traditional [53,54].
The global shift toward Industry 4.0 has further enhanced the role of real-time data analytics in quality control. For example, smart sensors and IoT-enabled systems now enable predictive maintenance of extrusion gear, reducing downtime-related issues by 25% [55]. Meanwhile, sector-specific adaptations, such as Six Sigma in healthcare (reducing prescription errors) and automotive (minimizing assembly line flaws), underline its versatility [56]. However, problems exist, including resistance to cultural change and the complexity of expanding hybrid TQM-Six Sigma models across multinational supply chains [57]. Collectively, these developments emphasize a paradigm shift: Quality management is no longer an isolated job but a strategic, innovation-driven necessity, balancing precision, sustainability, and resilience in the face of growing industrial demands [58,59].

2.2. Quality Control

In manufacturing, quality control (QC) is a process that ensures customers receive products that are free of defects and meet their needs [60,61,62]. QC involves manufacturing products and performing services that adhere to defined quality criteria to meet customer specifications. However, failing to meet this requirement can put consumers at risk [11,63]. A manufacturer that delivers high-quality products will increase customer loyalty and build better business reputation while receiving new clients through customer referrals and keeping or strengthening its market position alongside better safety measures and reduced liability exposure which all positively impacts product branding [64,65]. Maintaining absolute satisfaction is difficult, but the judgment or realization of the product or service is compared with the same standards [66,67].

2.3. Six Sigma and Its Application in Manufacturing Process
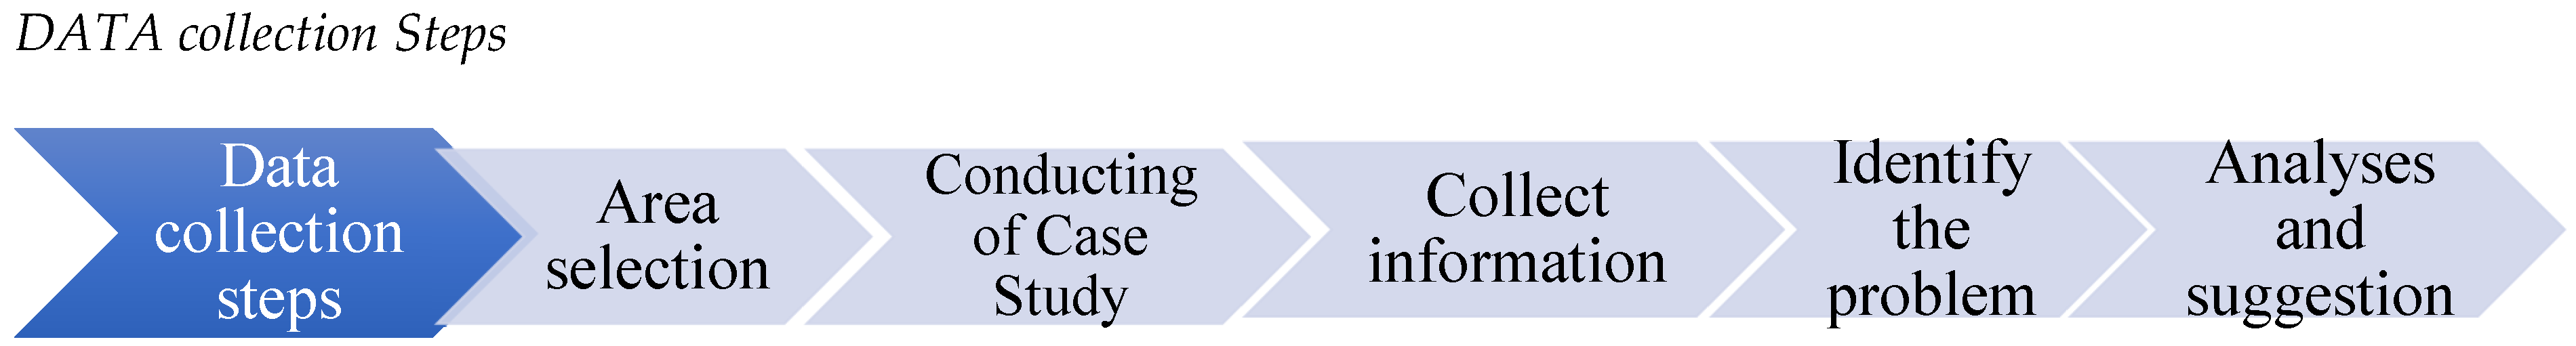
Six Sigma is a data-driven, customer-oriented, structured, systematic, proactive, and quantitative methodology applied company-wide to continuously improve processes by reducing defects and variability [68,69,70]. Six Sigma has been generally recognized as a framework for eliminating defects at the project level and improving performance and customer satisfaction at the corporate level [24,71].
Six Sigma is considered a process of transforming inputs into outputs in which quality excellence can be ensured using statistical tools and methods that enhance process capability by analyzing processes with problem identification and implementing improvements to resolve the [72,73]. It combines statistical performance measures with quality management principles of a process or product to enhance productivity, reduce costs, and improve quality [74,75]. It measures the degree to which the process deviates from the target and then takes action to improve it to achieve total customer satisfaction [17,76,77]. The variations are controlled using a hierarchical Six Sigma DMAIC approach [78], which has been derived from Deming’s improvement cycle, PDCA ( Plan, Do, Check, Act) [79,80,81]. Two methodologies, DMAIC and DMADV, can be used in Six Sigma, which aims to reduce defects to reach the ix-sigma level [24,82]. These methodologies can be used as statistical tools to define quality-related solutions based on data, which helps organizations succeed in achieving their objectives [83,84].

3. Methodology

The study conducted by [85]concludes that implementing Six Sigma in any organization, at any place, and on any platform helps decrease the frequency of errors and breakdowns and reduce waste. As a result, the study utilized Six Sigma DMAIC and statistical quality control tools to minimize defects and reduce rework in the Messebo laminated PP bag factory. The data related to this study was collected using both primary and secondary methods, including unstructured interviews and direct observations of defective products and high-failure machines, log books, databases of quality and production departments, and discussions with operators, middle management, and maintenance staff, which helps to identify the cause of failure.
Figure 1. Data collection steps.
Preprints 152388 g001
The primary purpose of this study is to improve customers' compliments regarding the quality of the factory's products. When we find customers' complaints about a company's product, we start communicating with the department about the defective product that causes customer complaints. Data was collected over twenty-six weeks, including the frequency of failure and the overall production of defect-free products. At this point, we investigated the nonconformity regarding the defective products with a negligible overall sigma level, below the required level, and a very high DPMO. We use Six Sigma DMAIC principles, statistical quality control tools like the Pareto Chart analysis, and a cause-and-effect diagram to mitigate this problem, which has helped enhance the overall quality and improve the company's production. A process capability analysis through Minitab 22 statistical software is developed with the Pareto Chart, Cause and Effect diagram, and process capability plots. The Pareto chart analysis is utilized to prioritize the critical defects that contribute to a bigger problem. Root cause analysis is also performed to dig into the root cause of the essential cause of defects. DMAIC is also used to calculate the defect per million opportunities. Concerning the principle of Six Sigma DMAIC, the study will be analyzed through the following phases.

4. Result and Discussion

Considering the problem, Six Sigma DMAIC methodologies, including the voice of customers, are discussed in this portion, which are the most convenient and proven techniques of problem-solving methods. [86].

4.1. Defining Phase

In the define phase, we describe the problem by considering the customers' voices, which diminishes the quality of the products and productivity and maximizes the defective rates. The company's primary customer (90%) is the Messob Cement Factor, which uses the bags for packing OPC, PPC, PLC, and LHHS types of cement powder with the same shape and size. The expected customer benefit is receiving the product with the expected overall quality, reducing the customer compline.
In this phase, SIPOC (Suppliers, input, process, output, and customers) for the case company was discussed.
Figure 2. SIPOC Information of The Case Company.
Preprints 152388 g002

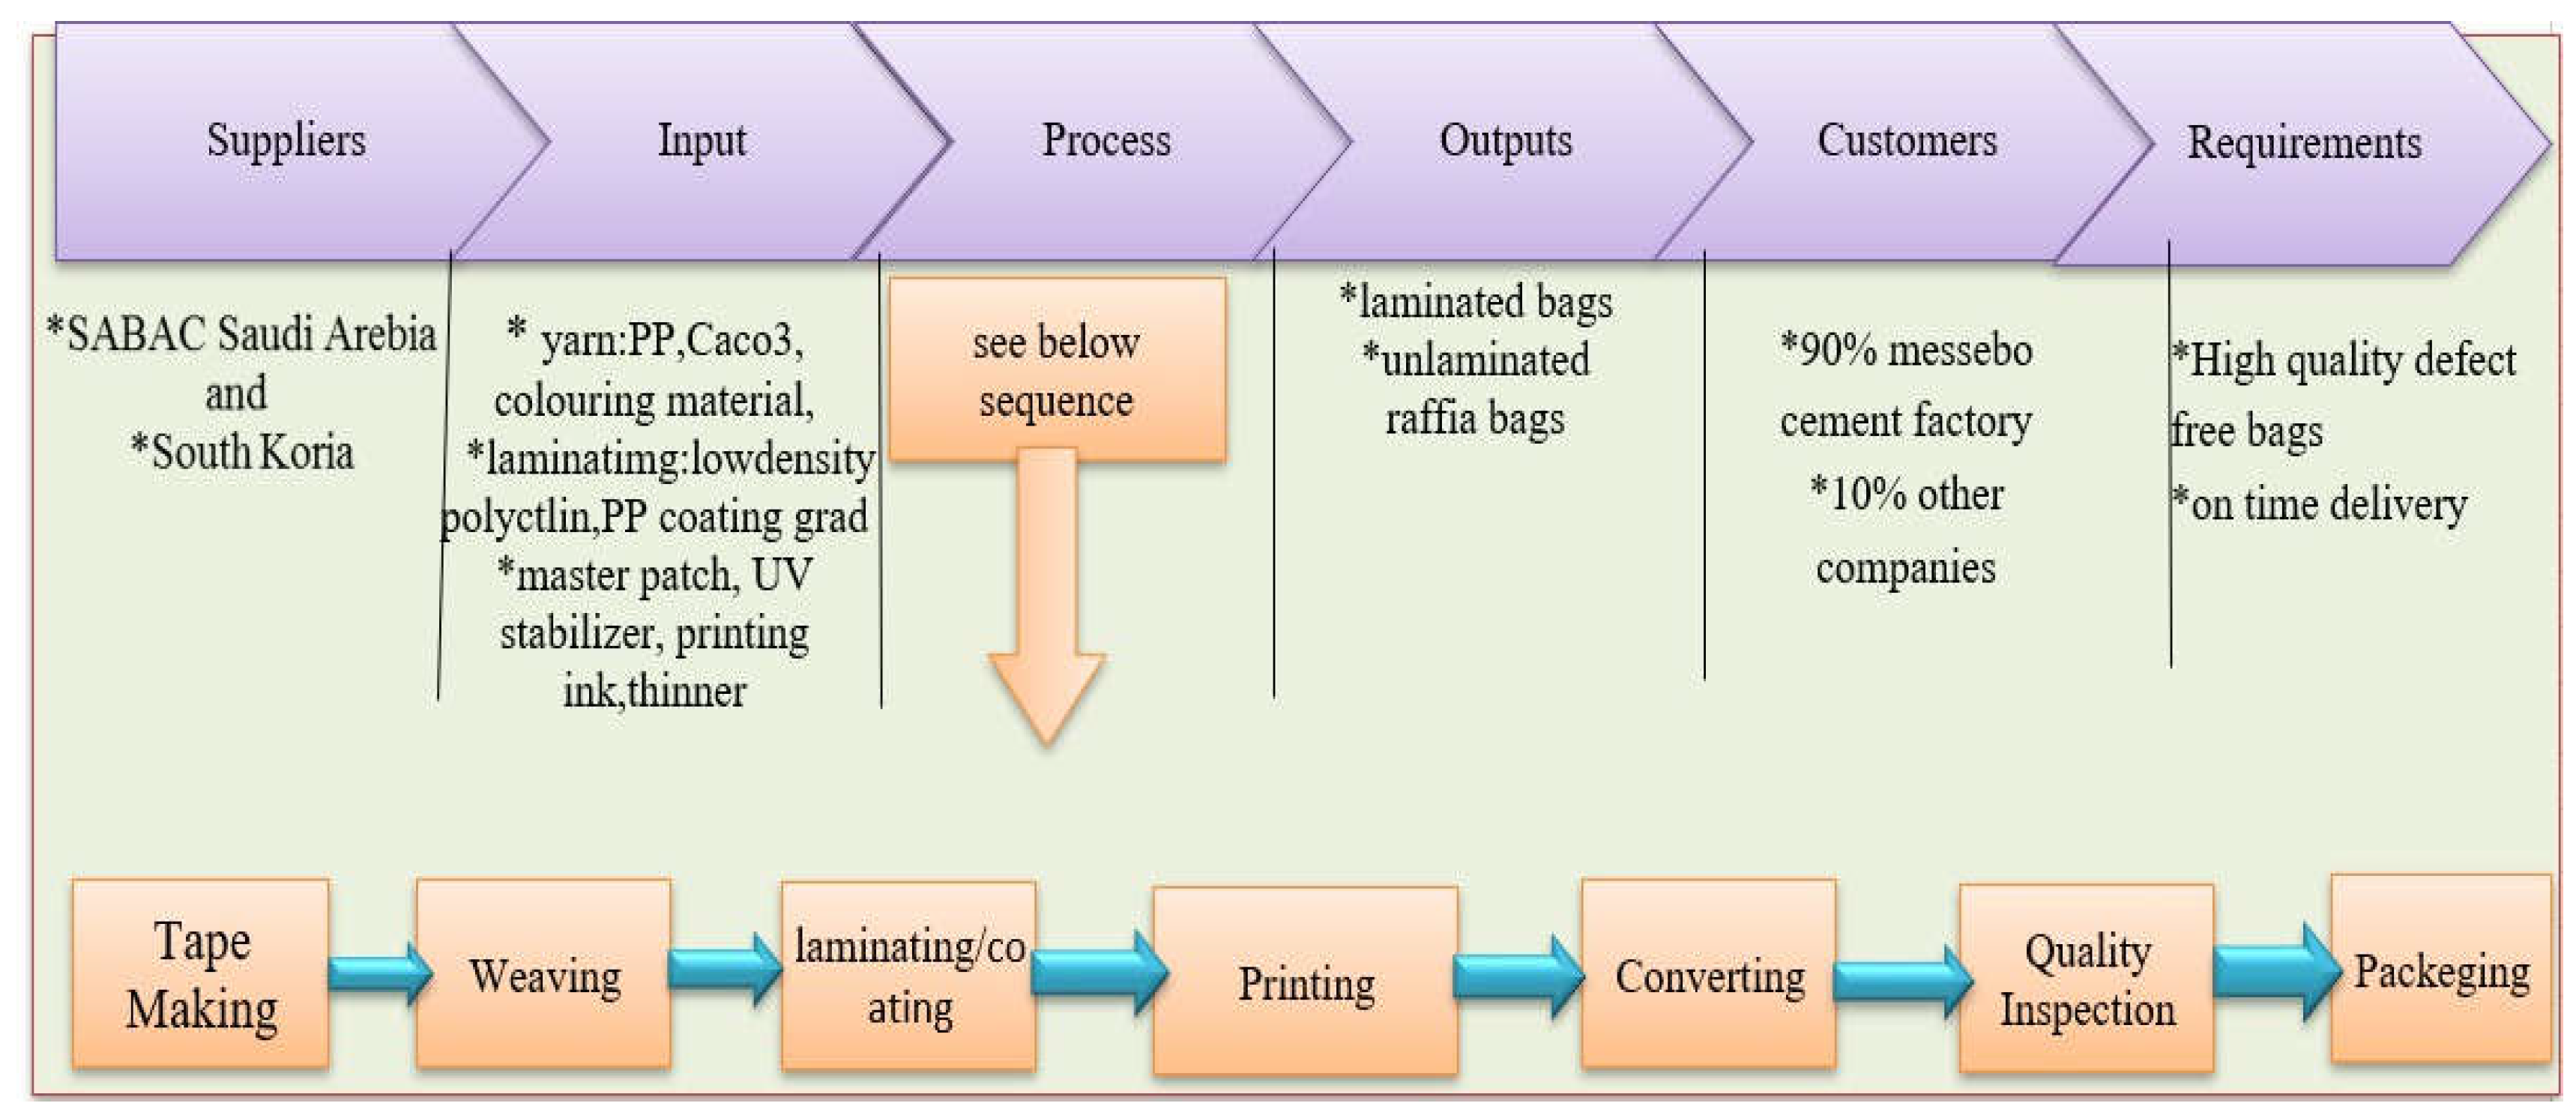
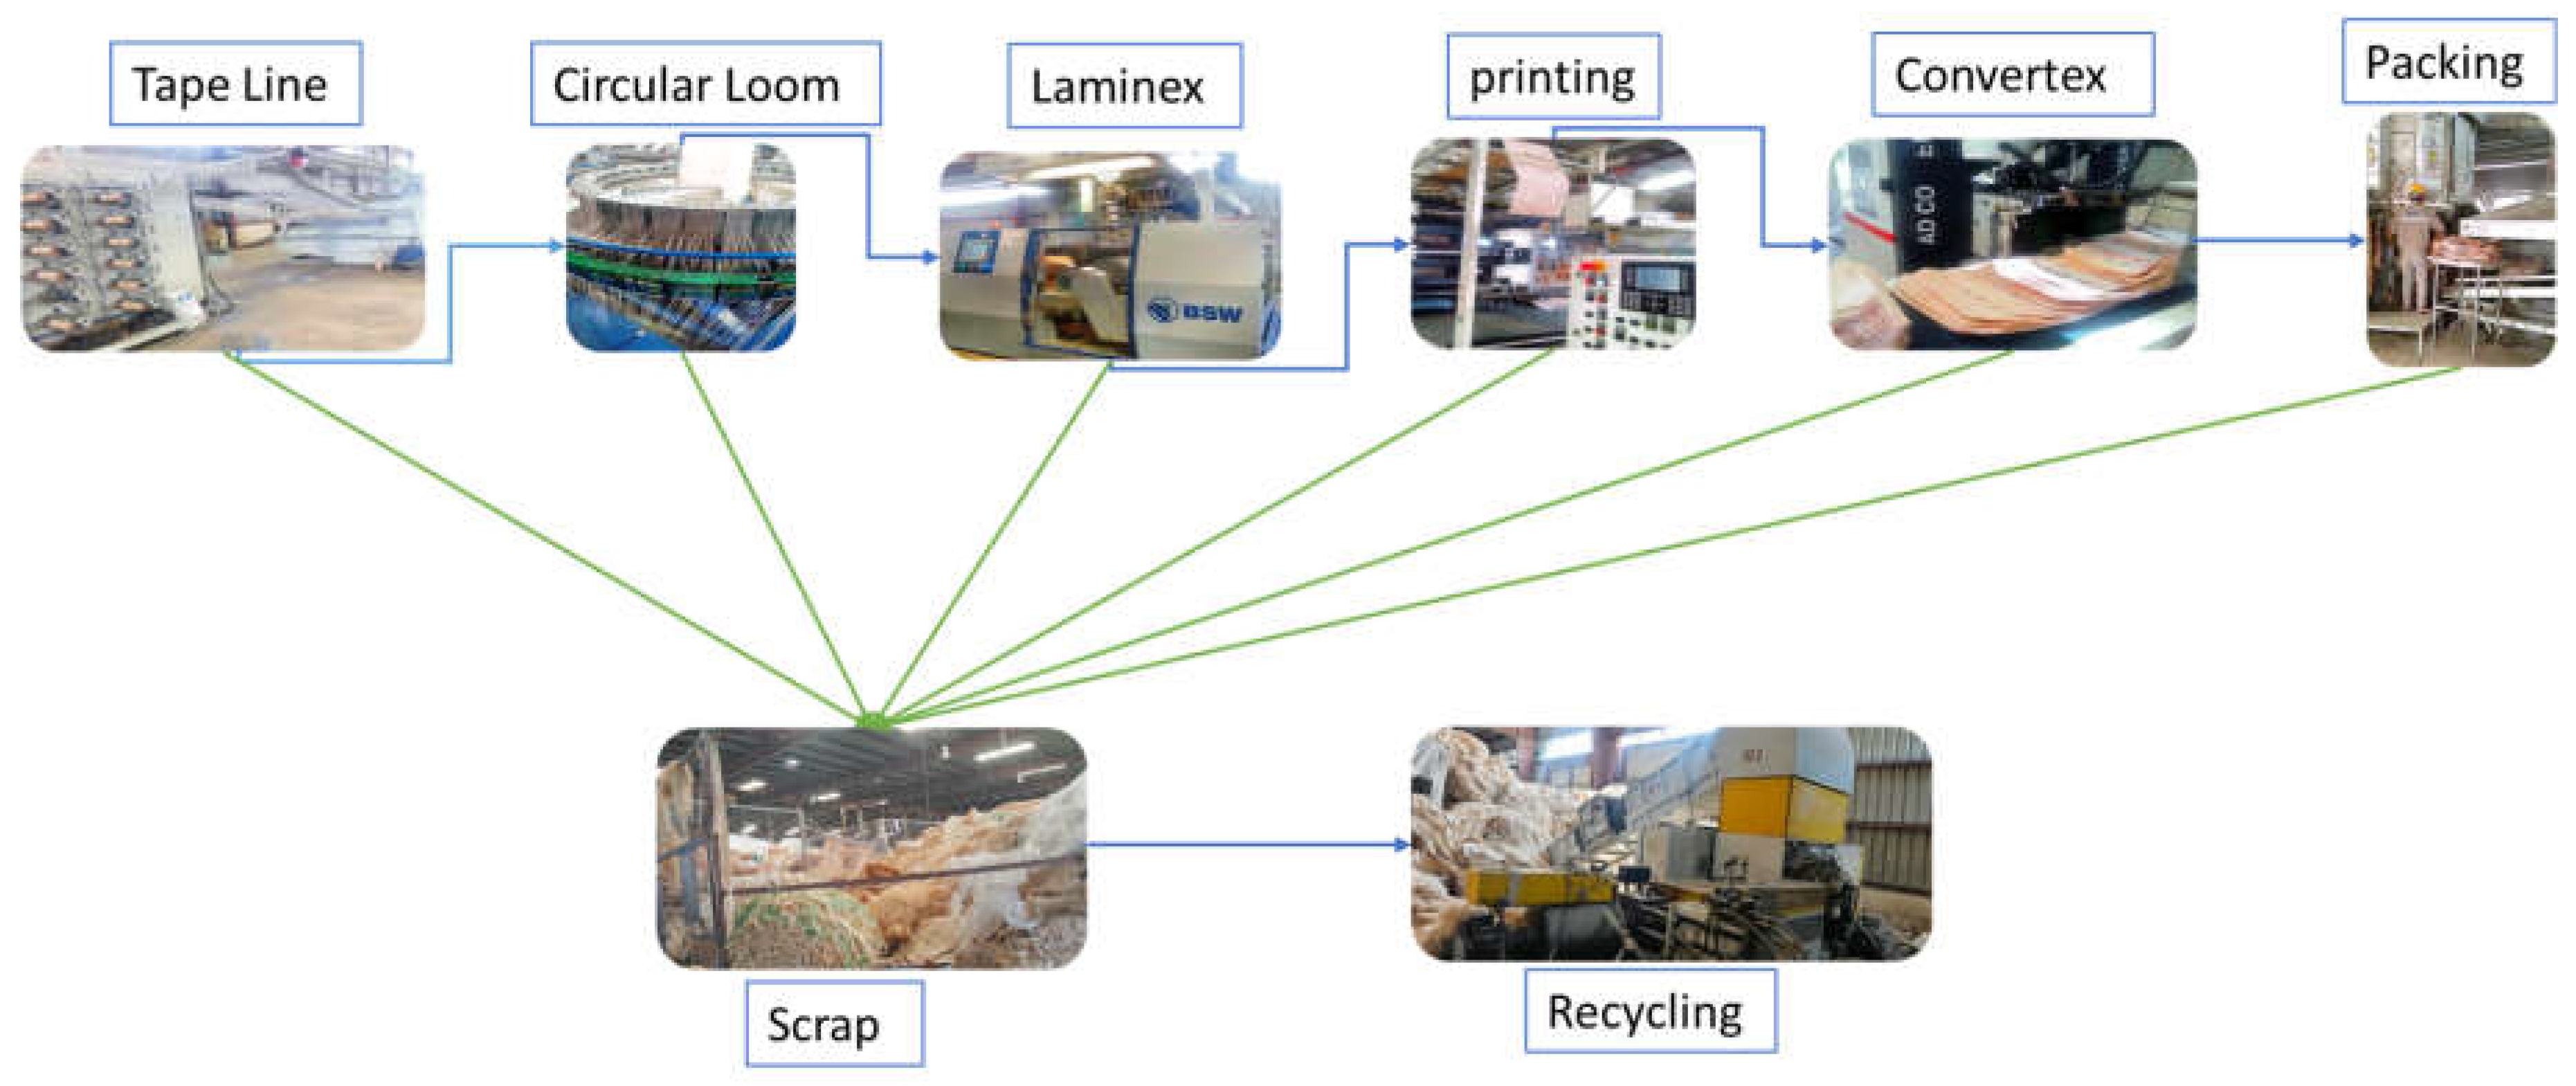
4.1.1. Flow Chart and Detail Expression of the Company

An initial operation during PP bag production is extrusion. The extrusion plant combines virgin polypropylene granules along with ultraviolet inhibitor, calcium carbonate, and occasionally color pigment to create tape products. Small bobbins receive the wound tapes according to their necessary dimensions. Tensile strength of the tape results from the process at this stage.
The weaving process starts as circular or tubular weaving looms receive the extruded tape bobbins for production of required specifications and dimensions then rolls the final fabric form. Polypropylene fabric receives moisture barrier protection through its combination with semi-clear PP film which bonds to cover the woven structure. The customer determines whether this process should be included. The automatic cutting machine operates on rolled fabrics until they obtain their required dimensions. The automatic method delivers more precise cut dimensions to users. A printing machine generates a printed effect on the fabric after the body fabric panels pass through it.
The bulk bag lift loops are created through webbing production by intertwining heavy polypropylene tapes with multifilament thread from polypropylene yarns. All manufacturing elements that build bulk bags find their union through final sewing operations.
Proficient workers who operate under technical management build FIBCs and bulk bags from collected materials due to their advanced skill sets. Reactively trained personnel from the quality control department check every produced bag to confirm its safety for use. The final operation involves compacting ready bags through a press before the manufacturing team completes their final arrangement in accordance with customer requirements.
Figure 3. The Process Flow Chart of Woven Plastic Bag Manufacturing.
Preprints 152388 g003

4.1.2. Voice of Customers

Knowing the VOC (customer's voice) and the company's SIPOC and flow chart are also essential. Customer comments, suggestions, and ideas about the product are collected through surveys and other means of communication. This helps to understand the quality of the product and the mitigation methods used to solve the problem, considering the customers' expectations and standards.
Also, it is helpful to control and monitor product quality inspection, from pre-production up to the production of the finished product. Whether the products are defective or not, they should be analyzed to understand the problem better and how to improve errors, defects, or customer dissatisfaction.
Considering the advantages of the VOC, we prepared the questionnaire format and distributed it to 20 company customers. Here, the workers in the cement packaging and bag stores in the Messebo cement factory are among the respondents because they know the quality of PP bags through their experience, and the bag is used practically there. The sample format is found in the appendix. Therefore, the ranges are as follows: excellent=5, very good=4, good=3, average=2, poor=1.
As shown in (Table 1), the VOC questionnaire show that the educational level of the majority of respondents is a college diploma (40%), followed by BA/BSC, which covers 30%, and the overall quality and service of the company by customers perspective also around 28% of respondents rated as good, followed by an average range of 26%. Therefore, the information is reliable, and the company's product quality and overall service need further improvement to reduce customer complaints and survive in the competitive market.
Table 1. Result and Educational Background of Respondents.
Q/no Excellent Very Good Good Average Poor No of Respondents Education No of Respondents Total %
1 3 4 7 4 2 20 Below Diploma 5 25%
2 3 3 5 6 3 20 Collage Diploma 8 40%
3 4 5 5 4 2 20 BA/BSc 6 30%
4 2 4 4 7 3 20 MA/MSc 1 5%
5 4 4 5 6 1 20 Total 20 100%
6 6 4 6 4 20
7 1 4 7 5 3 20
Total 23 28 39 36 14
16% 20% 28% 26% 10% 140

4.2. Measuring Phase

This is the second critical phase of the Six Sigma methodology, which confirms that any change to improvement is based on data-driven evidence. Data for analysis is systematically collected and analyzed to understand the current performance, which helps as a baseline for improvement.
In this stage, decisions are based on accurate data, including data collection steps and data validation based on the baseline for quality parameters, DPMO, Six Sigma levels, and the current quality level for existing products. A data collection plan, Pareto analysis, and baseline for performance parameters (Six Sigma) are utilized as tools and techniques.
As the process is interconnected, this study specifically focused on the finishing section equipped with roll-to-roll printing, Slitex machine, Converter machine, sacred machine, stitching line, and presses machine, and the defects are identified in Convertex through inspection.
Table 2. Cumulative Percentage of Each Defect For 26 Weeks.
Types of Defects Tot. Defected Total % Cumulative (%)
Weak sealing 4196 0.46% 0.46%
Without valve 100303 11.10% 11.56%
Without a top patch but folded 34417 3.81% 15.37%
Without a bottom patch but folded 25141 2.78% 18.15%
Punch out covered 2079 0.23% 18.38%
Shifting top patch alignment 16334 1.81% 20.18%
Shifting bottom patch alignment 23975 2.65% 22.84%
Burn on top 2421 0.27% 23.10%
Burn on bottom 3202 0.35% 23.46%
Without a top patch and not folded 22867 2.53% 25.99%
Without a bottom patch and not folded 14648 1.62% 27.61%
The top patch is not fully sealed 37830 4.18% 31.79%
The bottom patch is not fully sealed 44971 4.97% 36.77%
Not perforated 2948 0.33% 37.09%
With top patch but not folded 63894 7.07% 44.16%
With bottom patch but not folded 101395 11.22% 55.38%
Top and bottom without patch 169019 18.70% 74.07%
Jump and draw out 234383 25.93% 100.00%
Total 904023
The above table is equipped with a weekly list of 18 types of defects and a total of 26 weeks of defects, which are recorded daily by quality assistant staff from three company shifts; also, the total production and the total defects are calculated. Also, using the above information, the defect rate and current sigma level of the company are calculated below, after the formulation of the Pareto chart based on the 26 weeks of collected defect data of the finishing section of Convertex to know the most frequently occurring defects.

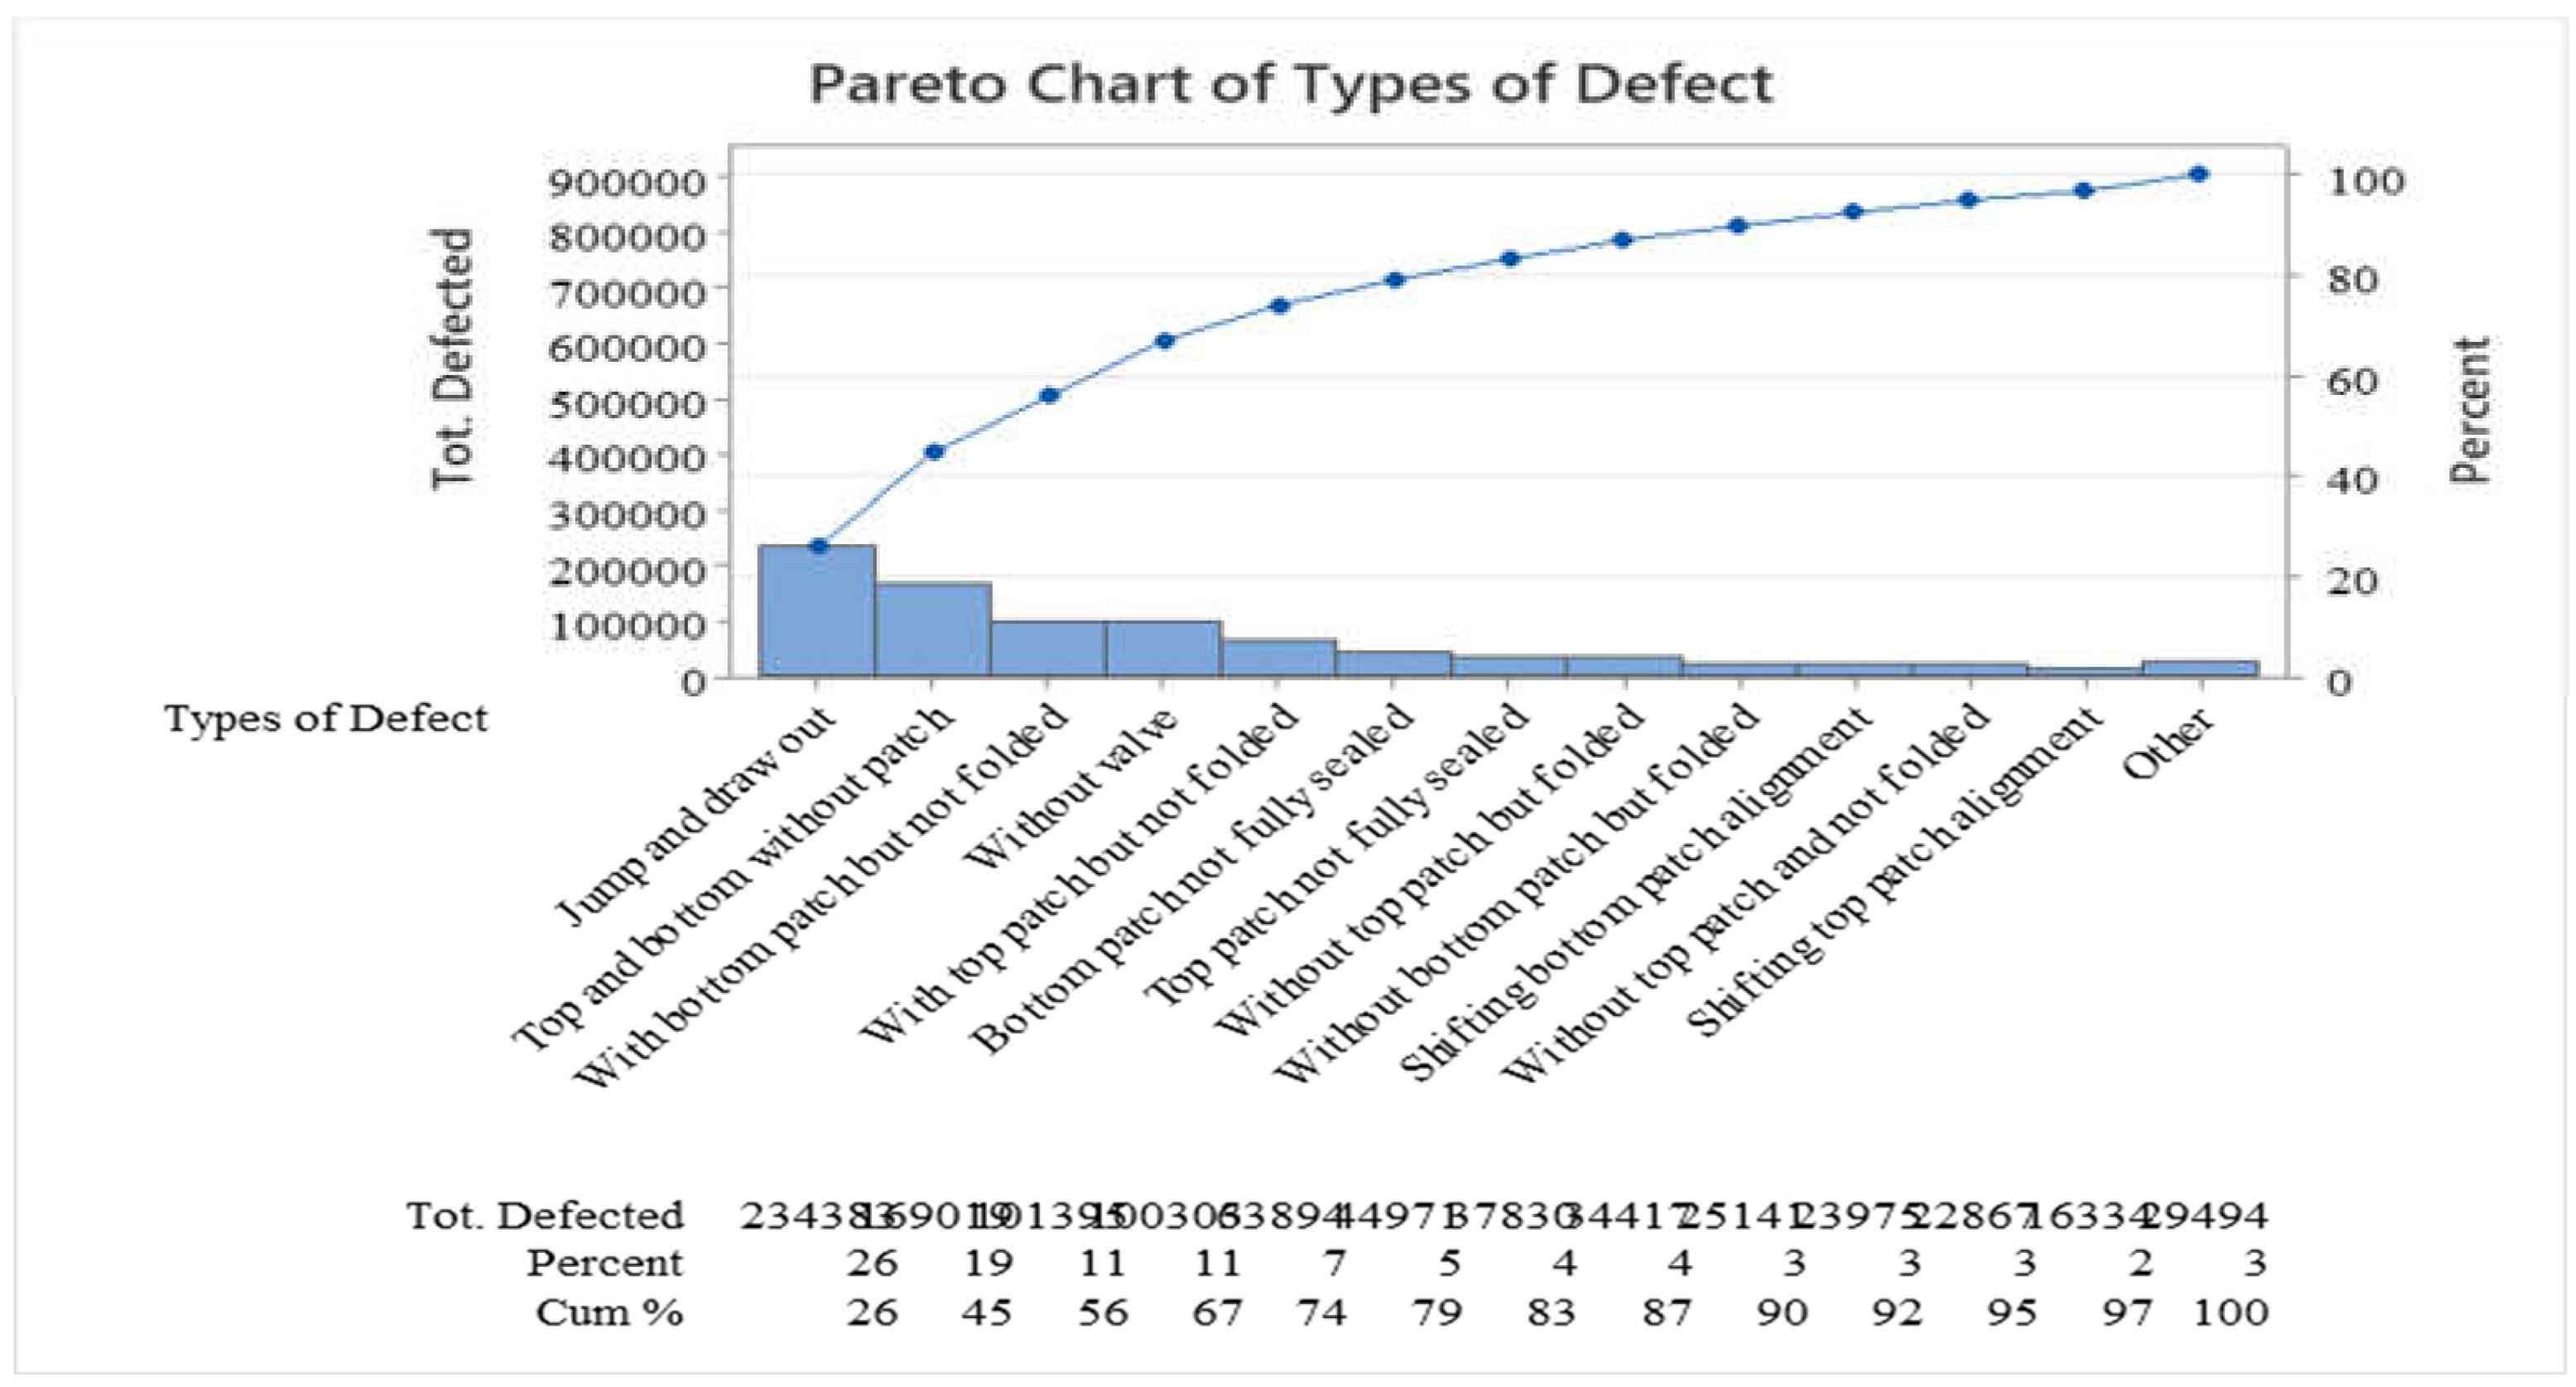
4.2.1. Pareto Analysis

Pareto Analysis is a decision-making technique based on the 80/20 rule [87,88], which states that 80% of a company's problems are caused by 20% of all items. This technique is essential for identifying and prioritizing issues related to the tasks under study. It was performed to identify critical products in the PP company. Pareto analysis was performed for individual bag defects of PP companies. In this bar chart, the various defects that contribute to an overall failure are arranged in order according to the magnitude of the effect.
Figure 4. Pareto bar of Bag Defects.
Preprints 152388 g004
Based on the Pareto analysis, the critical PP defects were Jump and draw out, Top and bottom without the patch, bottom patch but not folded, without the valve, with the top patch but not folded. The bottom patches not fully sealed are the ‘‘vital few’’ or 20% of causes that are responsible for 80% of total defects or the factors that warrant the most attention from the ‘‘Trivial many. ’’
These are the main reasons for customer satisfaction and the overall product defects of the company, as well as the reduction of Sigma level. That means the efforts should be solved and focus on the 20% or vital few to achieve the most significant improvement first, but it doesn’t mean to ignore the remaining 80% of the causes.
Using this diagram helps to display the relative importance of data, direct efforts to the most significant improvement opportunity by highlighting the vital few in contrast to the sound many, and concentrate the team's efforts on the factors that have the most significant impact. It also helps a team focus on specific areas effectively with an affordable solution.
Table 3. Shows the types of defects, total defects, and cumulative (%).
Types of Defects Tot. Defected Cumulative (%)
Jump and draw out 234383 25.93%
Top and bottom without patch 169019 18.70%
With bottom patch but not folded 101395 11.22%
Without valve 100303 11.10%
With top patch but not folded 63894 7.07%
The bottom patch is not fully sealed 44971 4.97%
Based on the Pareto analysis, the critical PP defects were Jump and draw out, Top and bottom without the patch, bottom patch but not folded, without the valve, with the top patch but not folded. The bottom patches not fully sealed are the ‘‘vital few’’ or 20% of causes responsible for 80% of total defects or the factors that warrant the most attention from the ‘‘Trivial many”.
Now, it is easy to highlight the vital few and the useful many. Therefore, the above six are the critical few overall defects and significantly impact the company's quality and productivity. Thus, the team or the company's management should focus on these specified defects and areas because these are the 20% main reasons for 80% of company defects. If these defects are solved successfully, most will be eliminated.

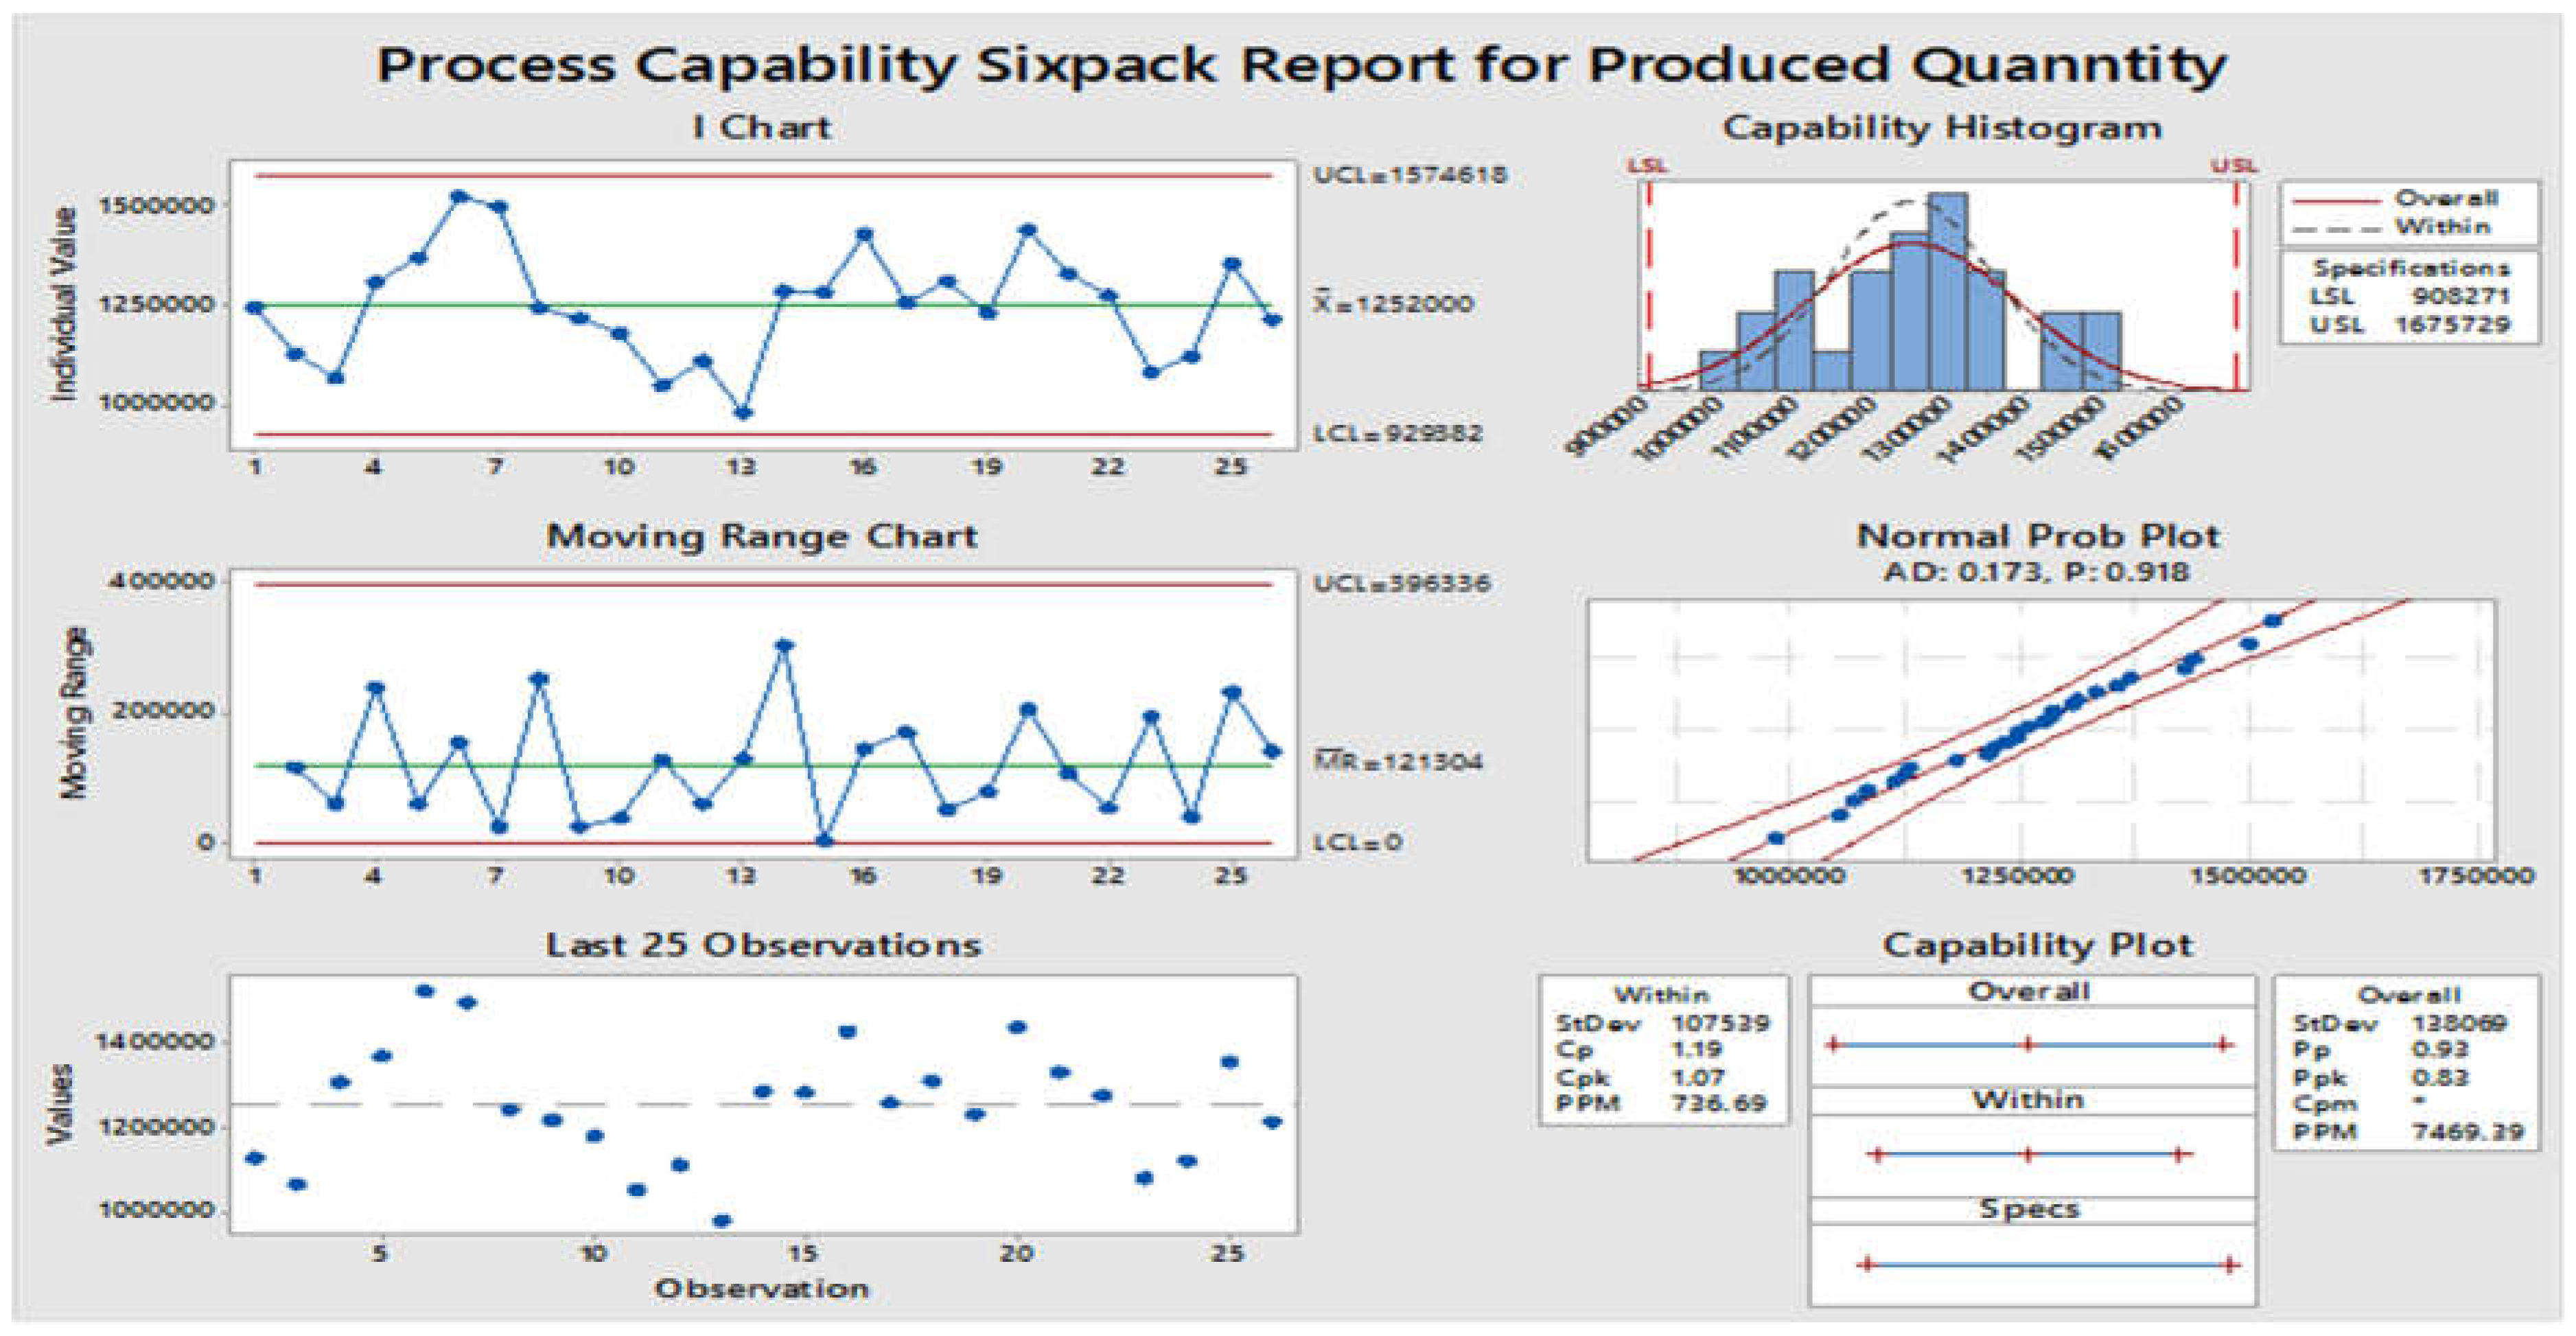
4.2.2. Calculation of Current Sigma Level and CP Before Improvement

T o t a l   n u m b e r   o f   c h e c k e d   o r   i n s p e c t e d   p r o d u c t s = 19076713   b a g s
N u m b e r   o f   n o n c o n f o r m i n g   p r o d u c t s = t h e   s u m   o f   t h e   18 e n   t o t a l   d e f e c t s   904023   b a g s
N u m b e r   o f   c o n f o r m i n g   p r o d u c t s = 19076713 904023 = 18,172,690   b a g s
D e f e c t   p e r   u n i t ( D P U ) = 904023   b a g s 19076713   b a g s = 0.04738882
D e f e c t   p e r   u n i t D P U i n   % = 0.04739 * 100 % = 4.739 %
D e f e c t   p e r   m i l l i o n   o p p o r t u n i t y   ( D P M O ) = D P U * 1,000,000 = 47,388.82   b a g s
Current Sigma level calculation;
Table 4. 95% Confidence Interval for Defect Rate%, Yield Rate%, DPM/Dpmo and Sigma Level Before Improvement.
Process outcome-95% Confidence interval for defect rate, yield rate %, DPM/DPMO and sigma (Short and long term)
Enter the number of defects 904023
Enter Sample Size(N) 19076713
Defect rate % 4.73888 Yield rate% 95.26112 DPM 47388.8243
Observed defect rate % (lower limit) 4.72936 Observed yield rate % (Upper limit) 95.25157 Observed DPM (lower limit) 47293.5699
observed defect rate % (Upper limit) 4.74843 Observed yield rate % (Lower limit) 95.27064 observed DPM (upper limit) 47484.26093
Short term Sigma 3.17 Long term Sigma 1.98
Observed Sigma (lower limit) 3.17 observed Sigma (lower limit) 1.98
Observed Sigma (upper limit) 3.17 Observed Sigma (Upper limit) 1.98
P r o p o r t i o n   o f   c o n f o r m i n g   u n i t = 1 0.04738882 = 0.9526  
P e r c e n t a g e   o f   c o n f o r m i n g   u n i t = p r o p o r t i o n   o f   c o n f o r m i n g   u n i t   *   100  
P e r c e n t a g e   o f   c o n f o r m i n g   u n i t = 0.9519 * 100 = 95.26   %  
From the standard regular distribution table, the standard deviations corresponding to 0.9526 Proportion of conforming units is Z = 1.67. therefore, process capability (Cp) can be calculated from the given number of standard deviations as:
C p   ( p r o c e s s   c a p a b i l i t y ) = Z 3 = 1.67 3 = 0.557
According to the above result, the Cp value is less than 1. Consequently, it can be concluded that the process is not capable. It needs immediate improvement to minimize defects and reduce variation to the point where it can produce consistently within the specification. Again, the following Process Capability Six-pack report chart was conducted to check the company's overall capability and reliability.
Figure 5. Process Capability Plots of Produced Quantity.
Preprints 152388 g005
Figure 6. Process Capability Plots of Rejected Units.
Preprints 152388 g006

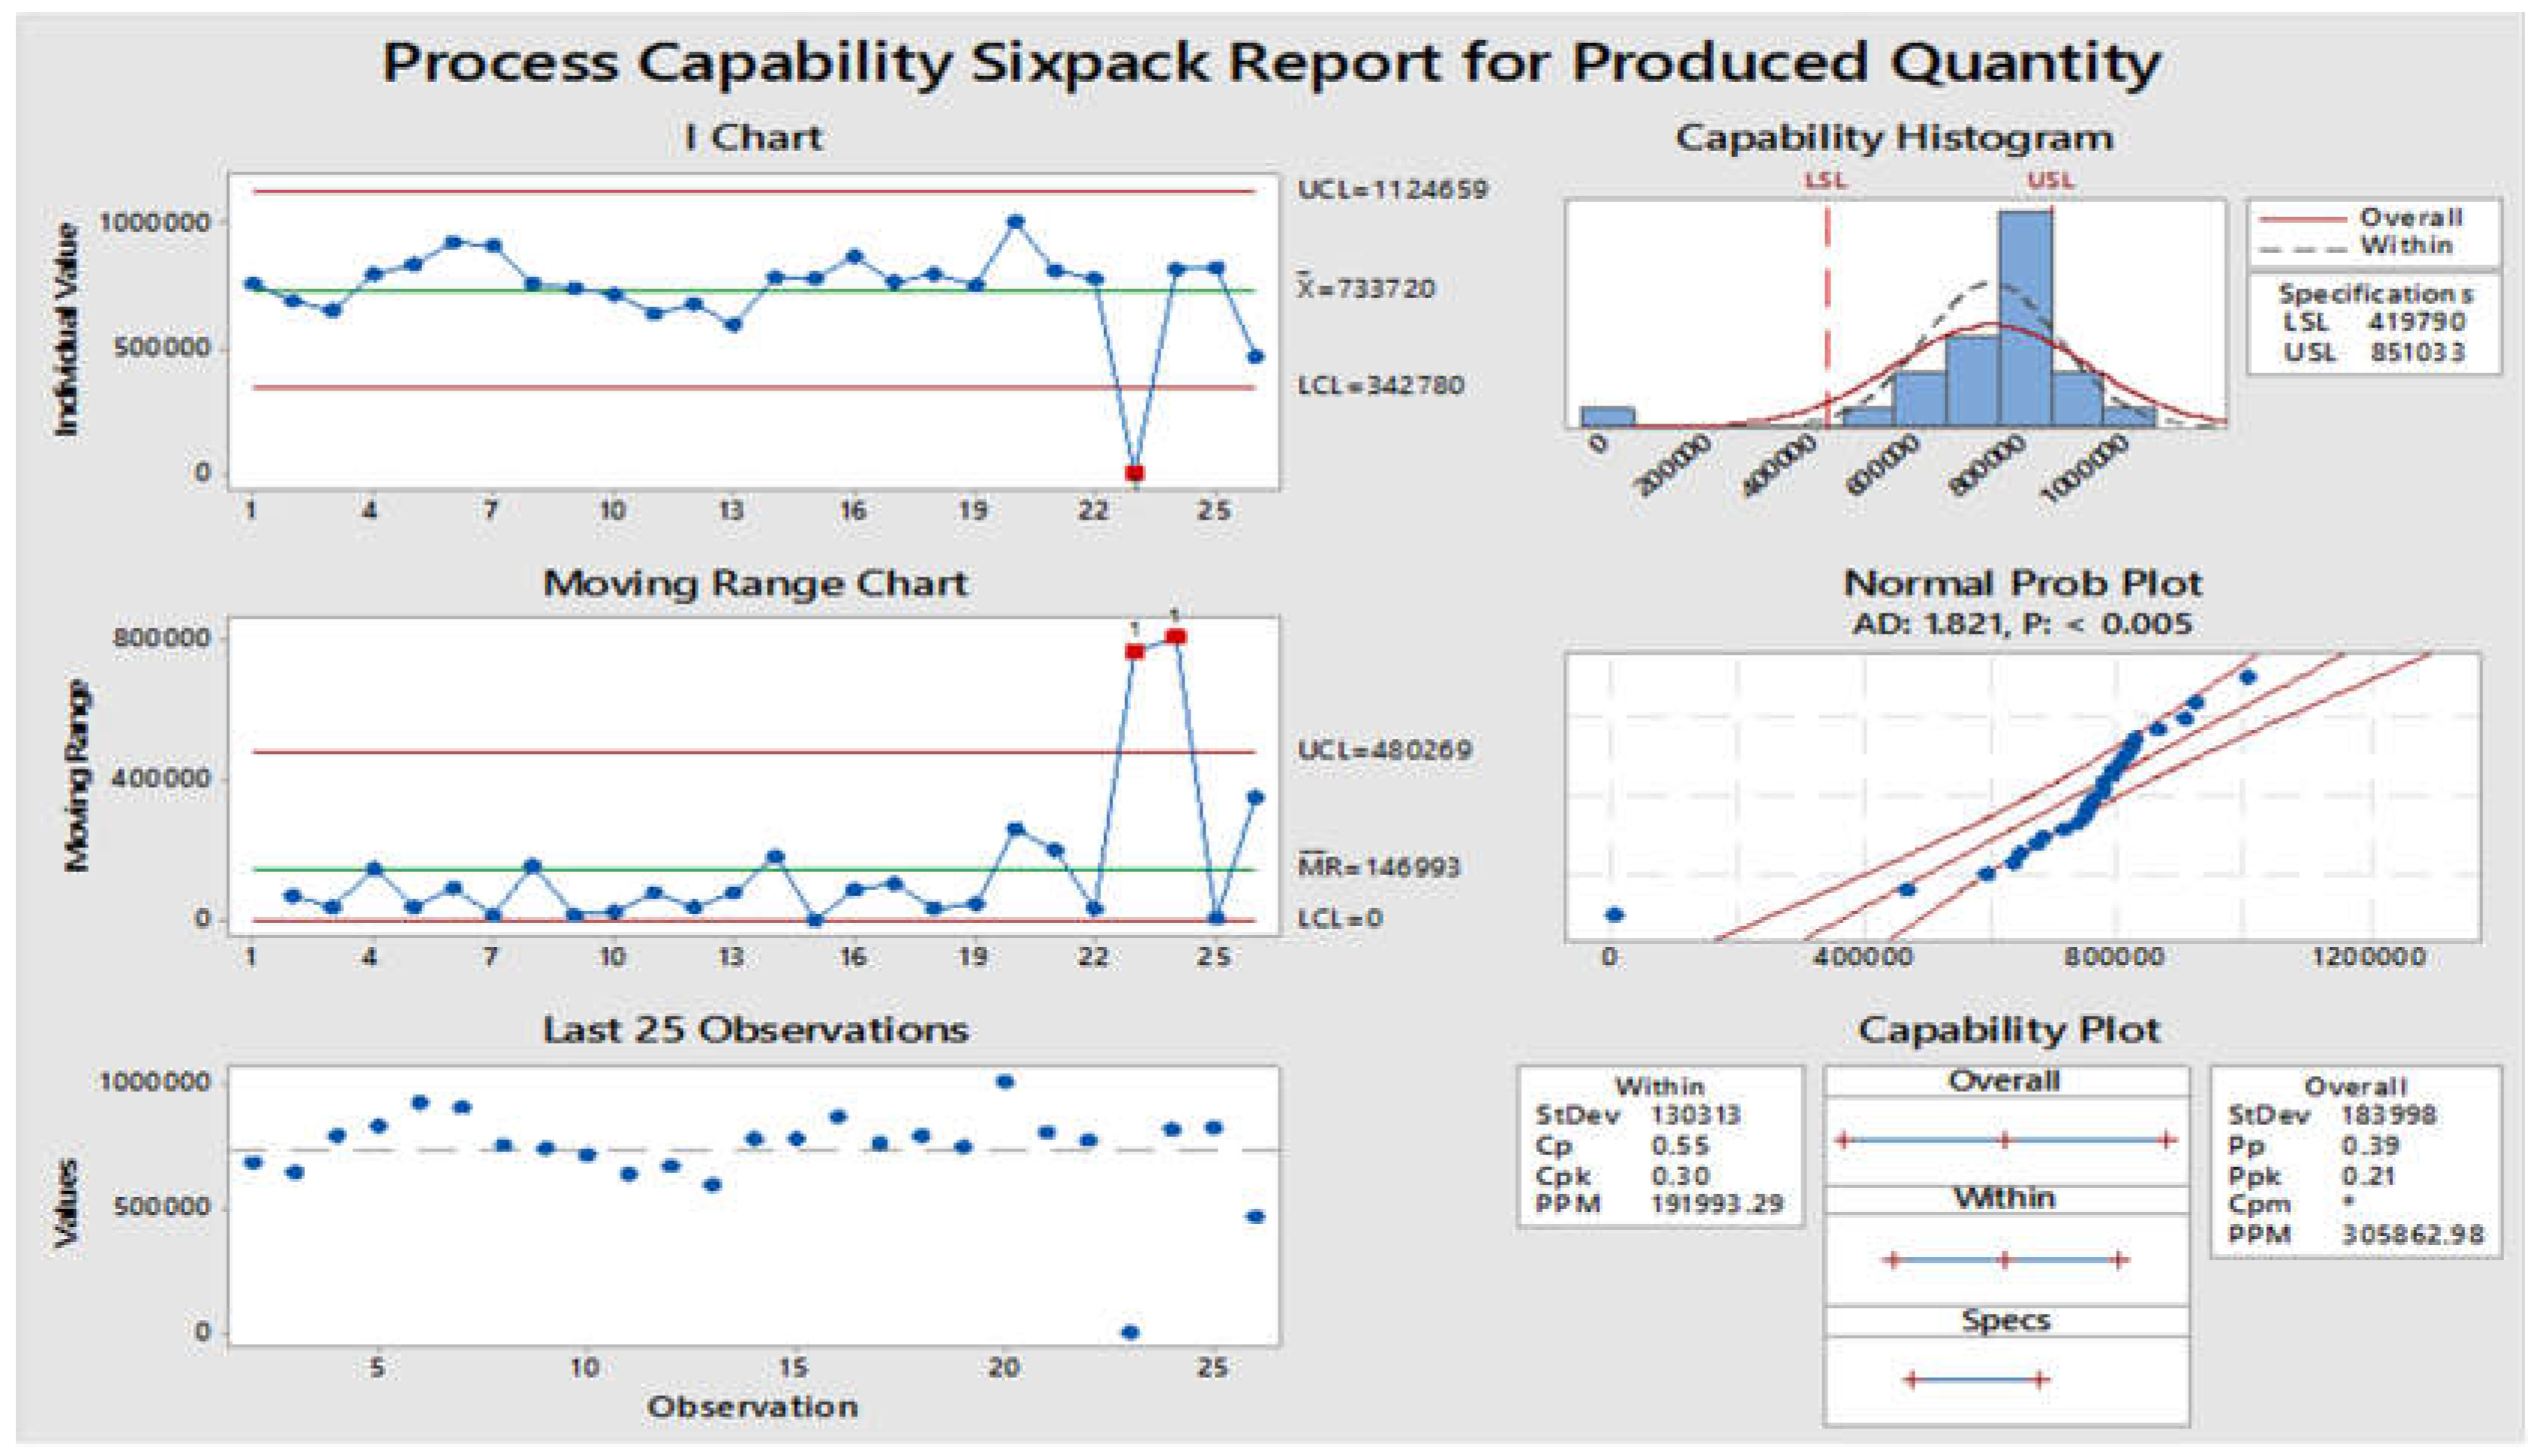
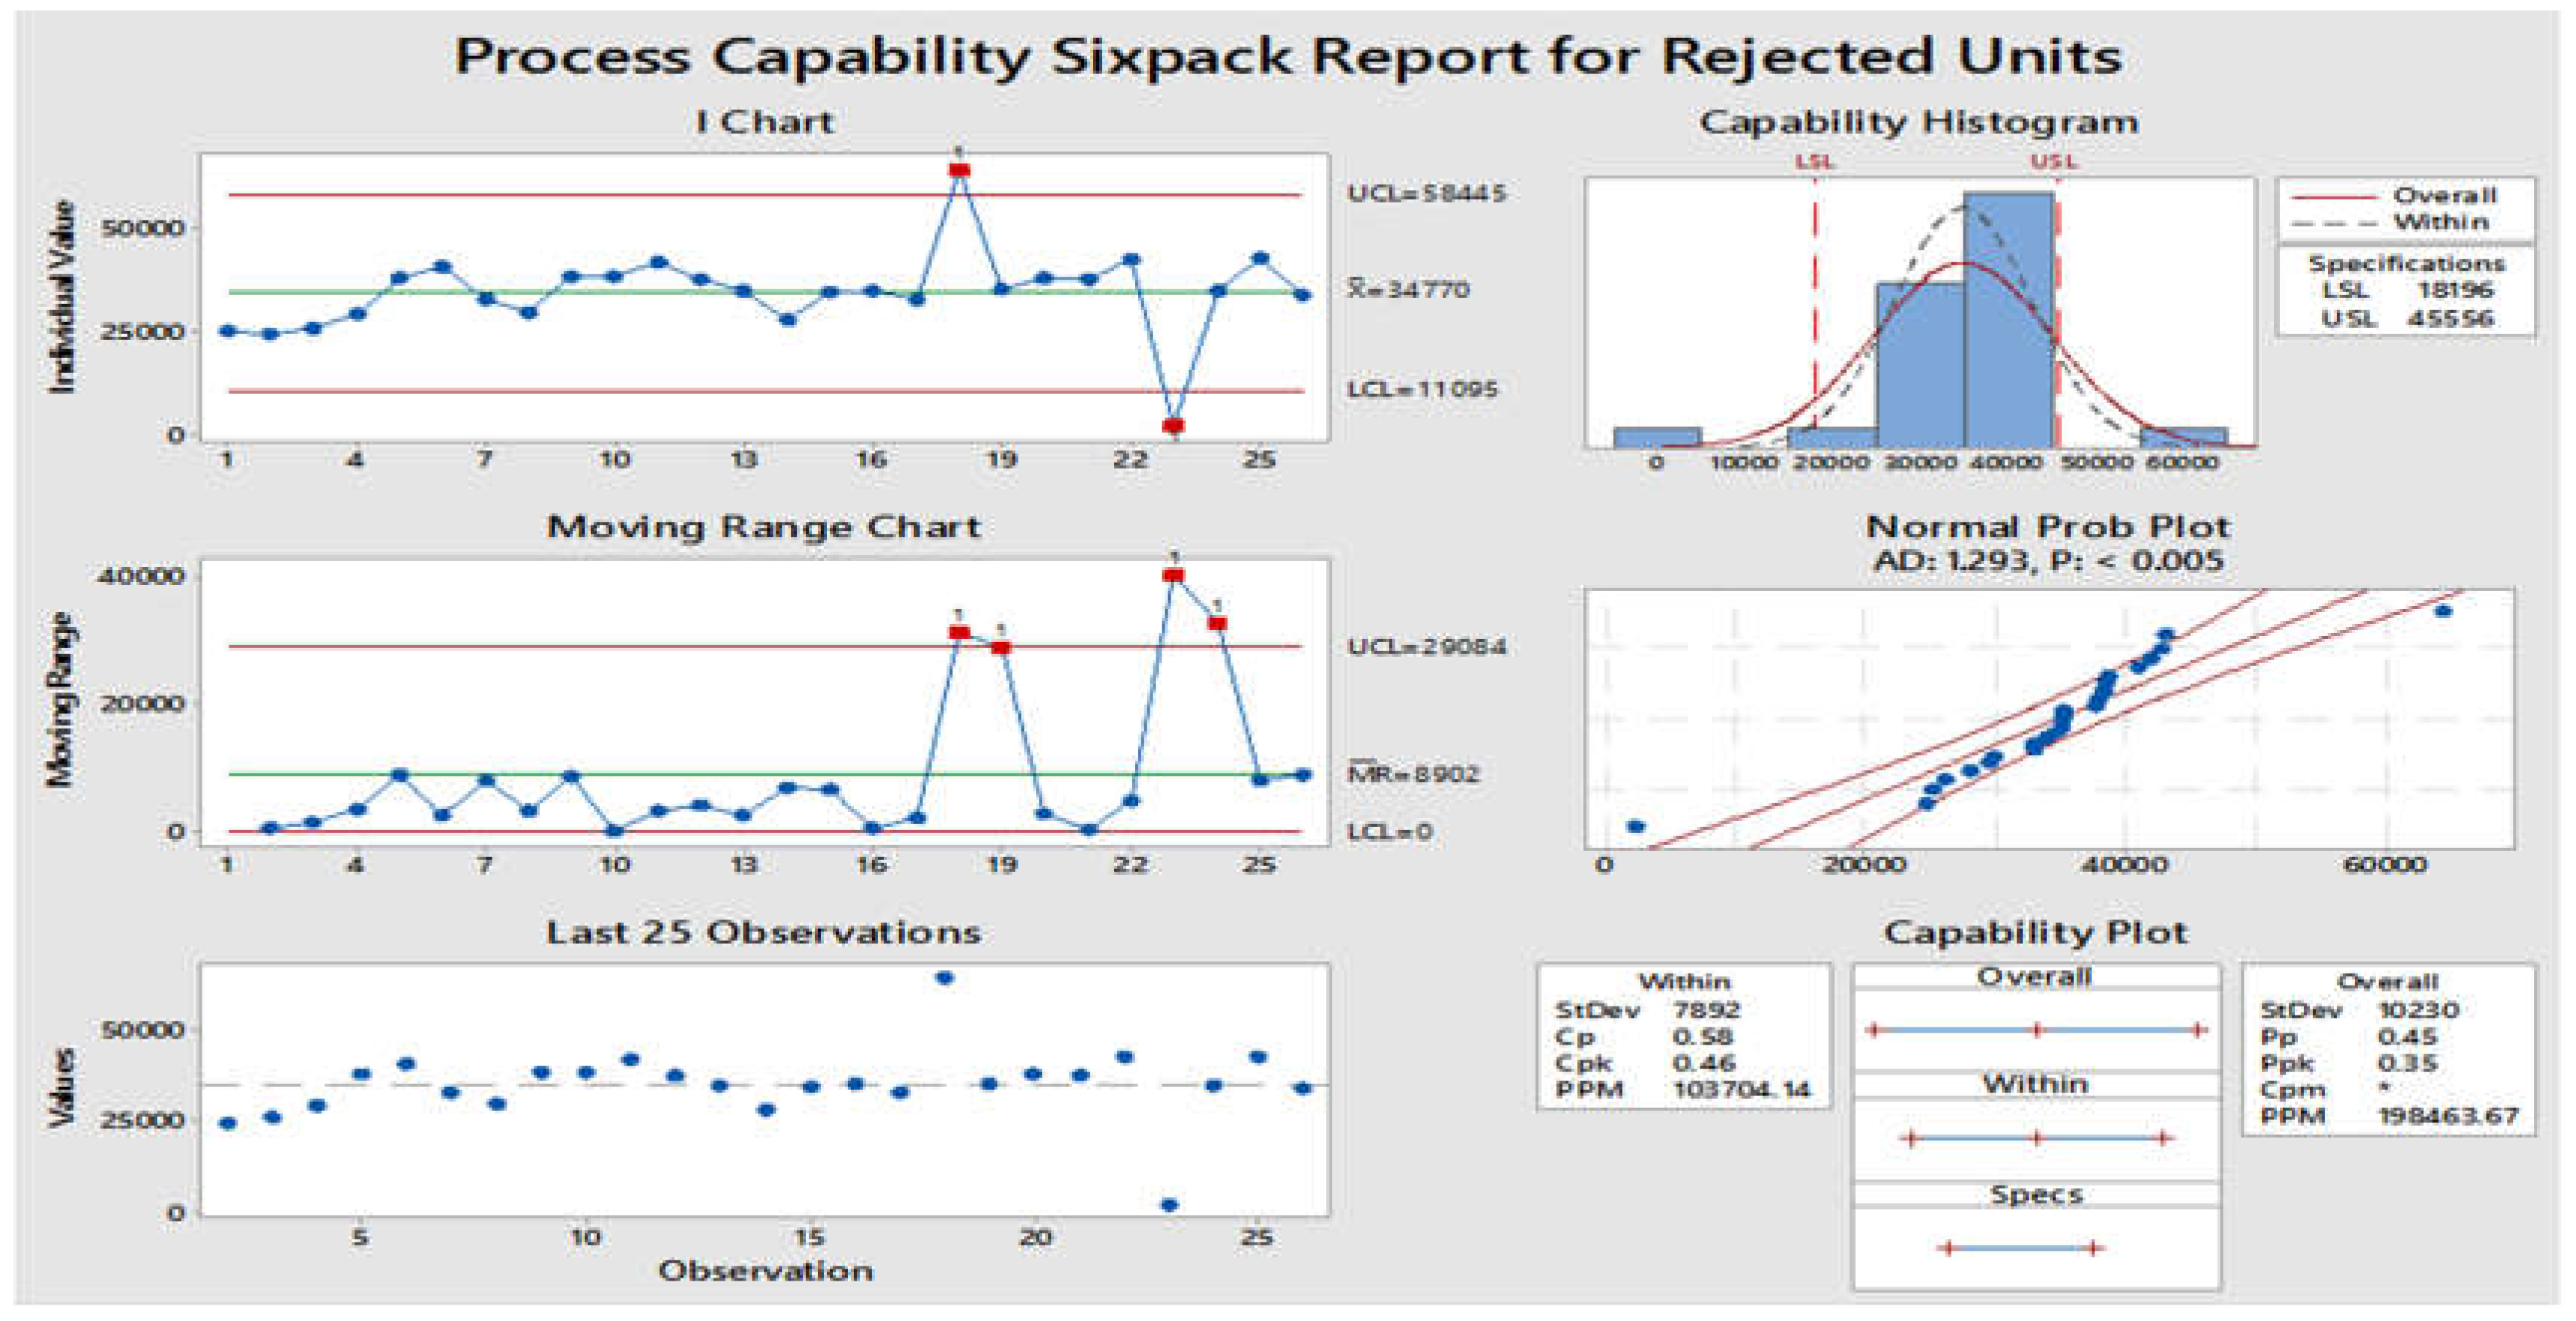
4.2.3. Key Assumptions and Interpretations of the Above Chart

Process capability indices (Cp/Cpk) compare the variability of a process quality measure against product specifications or tolerances and assume the process is under statistical control. [89,90]. Process performance indices (Pp/Ppk) (Process performance index)) are helpful when the process is not in a state of statistical control [91,92]. Cp and Cpk both give the process capability; while Cp talks about the data spread and width of the data range, Cpk discusses the data points near the mean [92,93]. Though both give the process capability, Cpk (Process capability indices) offers a more precise process capability. Since the data point has a mean, unlike Cp, which provides the data points between the USL and LSL, Cp and Pp will always be greater than Cpk and Ppk, respectively [94]. If the process is not stable, then we cannot calculate the process capability; we need to fix or adjust the data to be stable. If the data is normal and stable, we can calculate the capability for capability indices such as Cp and Cpk, compare the process variation to the customer specification, and check the process normality [95]. They are used to determine if the variation is wider than the specifications, the process is not centered, or both. Cp/Cpk estimates potential process performance or capability [91,92] how would the process perform without unique variation? Pp/Ppk also offers the actual process performance, given all of the variances currently present in the process. Pp/Ppk is generally = Cp/Cpk [96,97].

4.2.4. Chart Interpretation
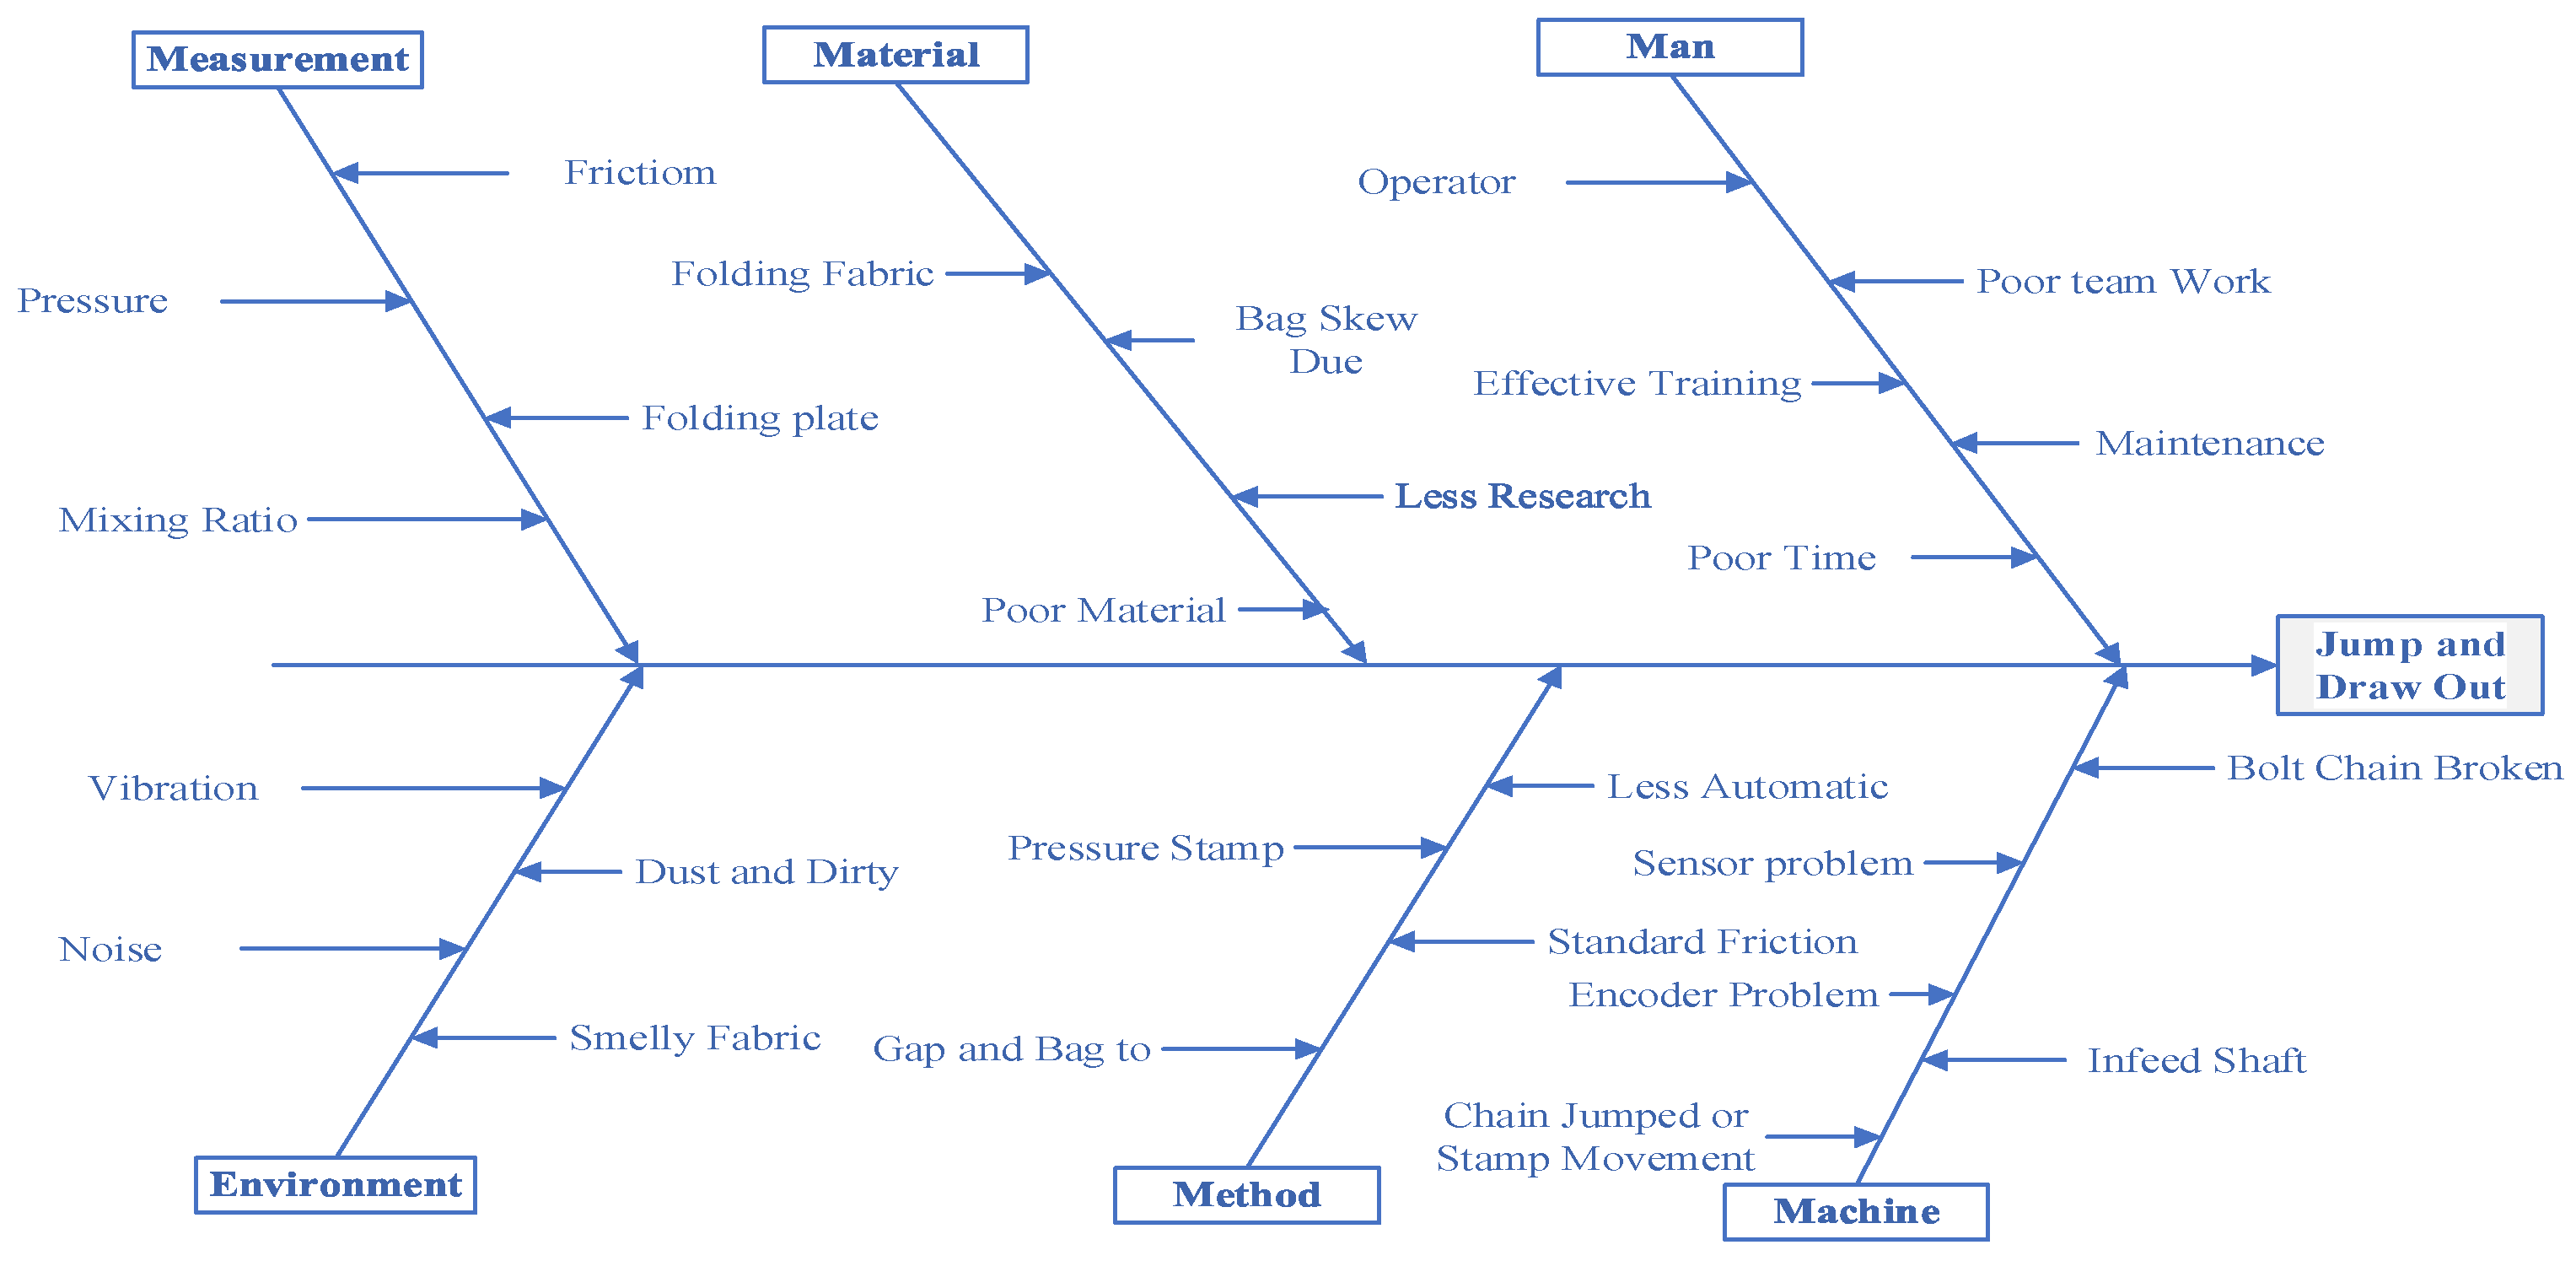
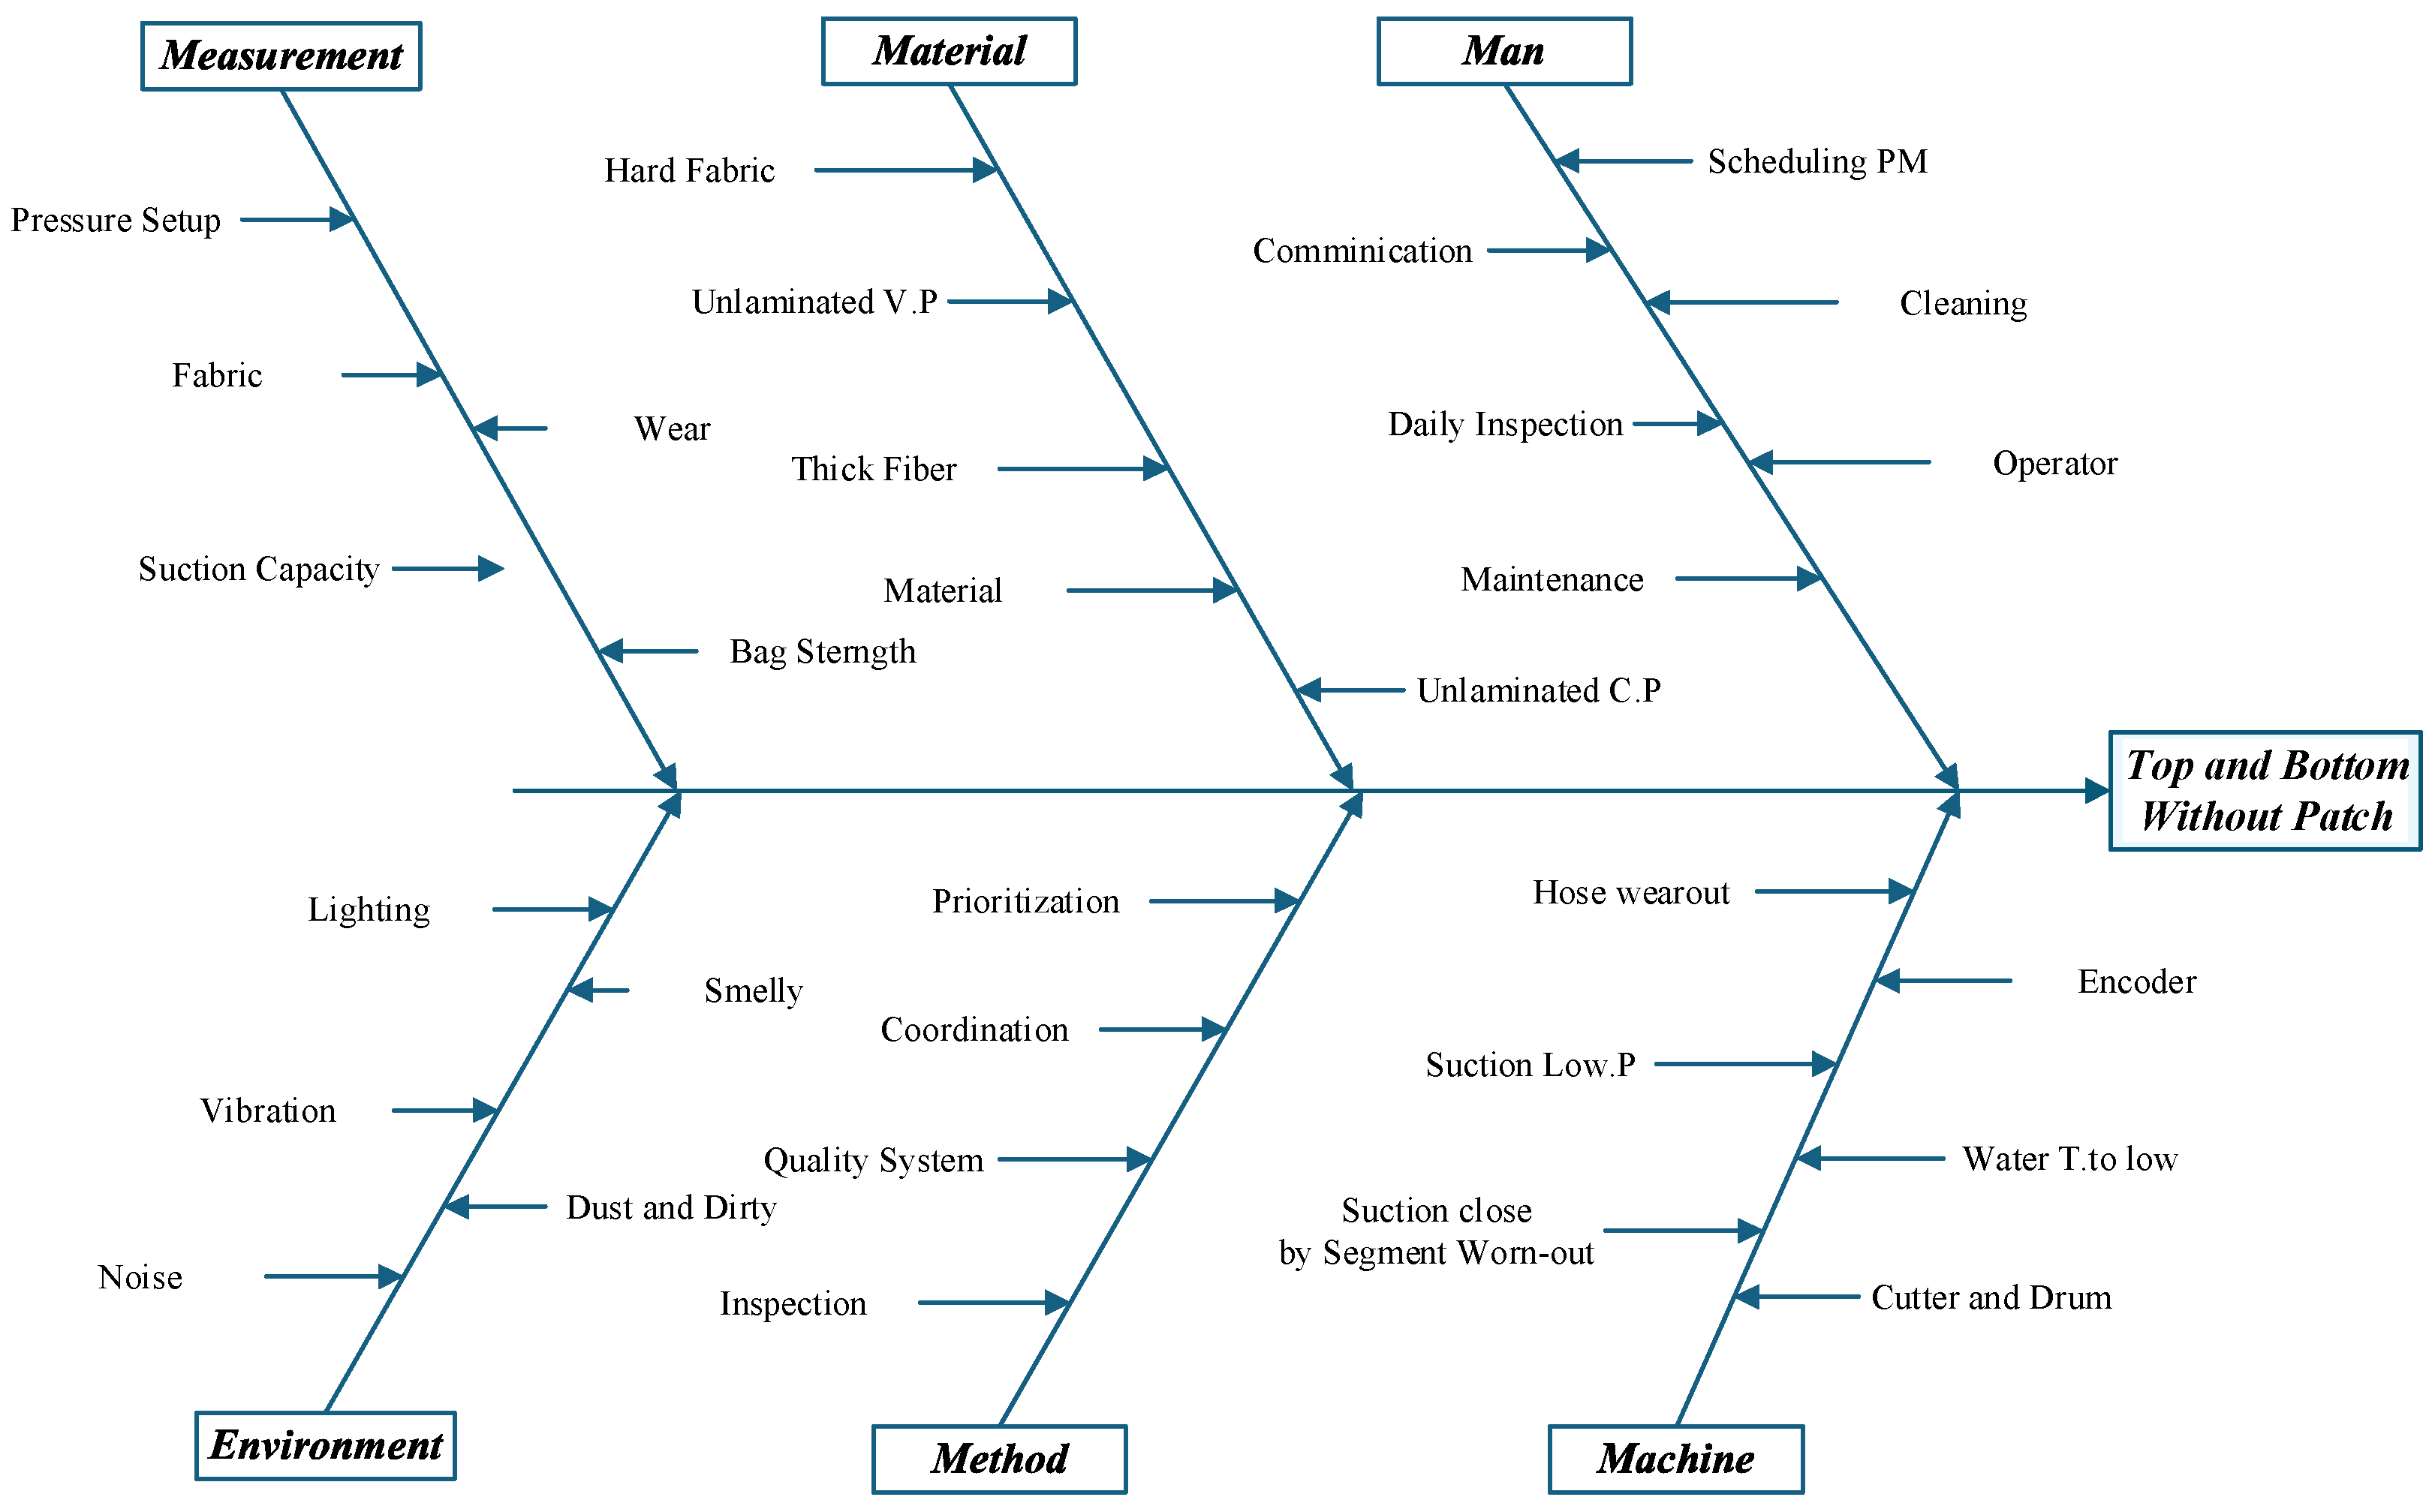
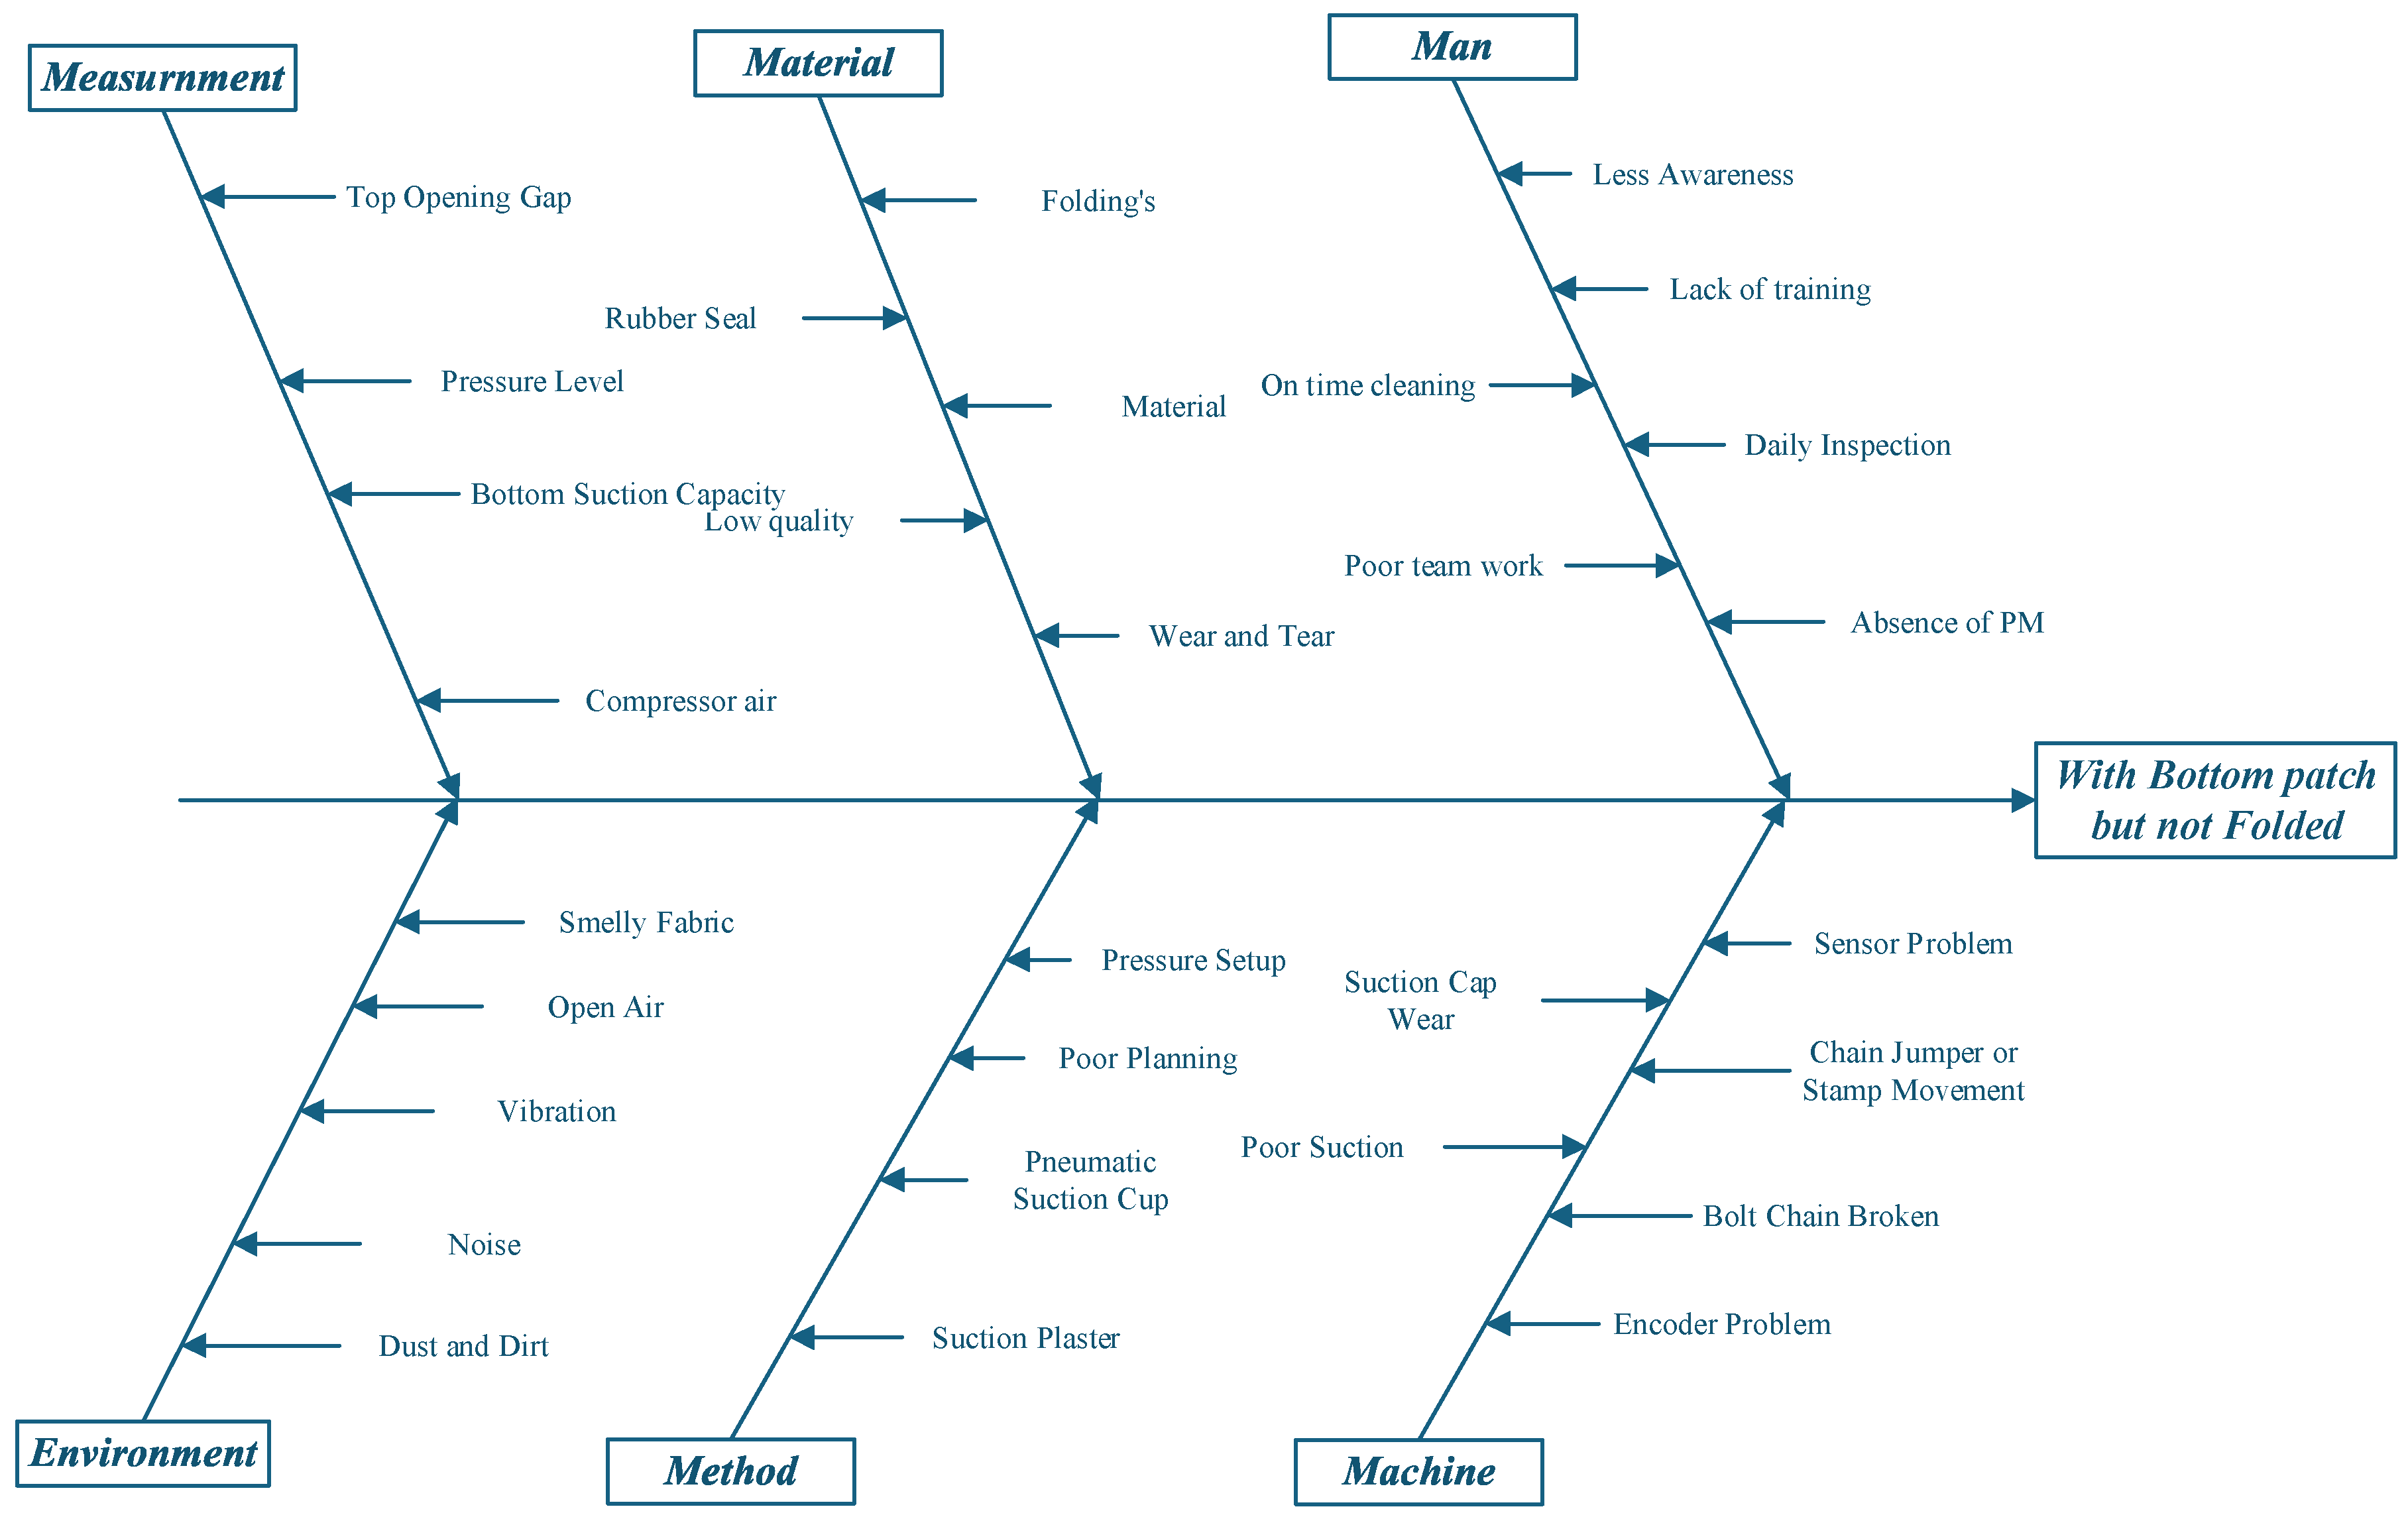
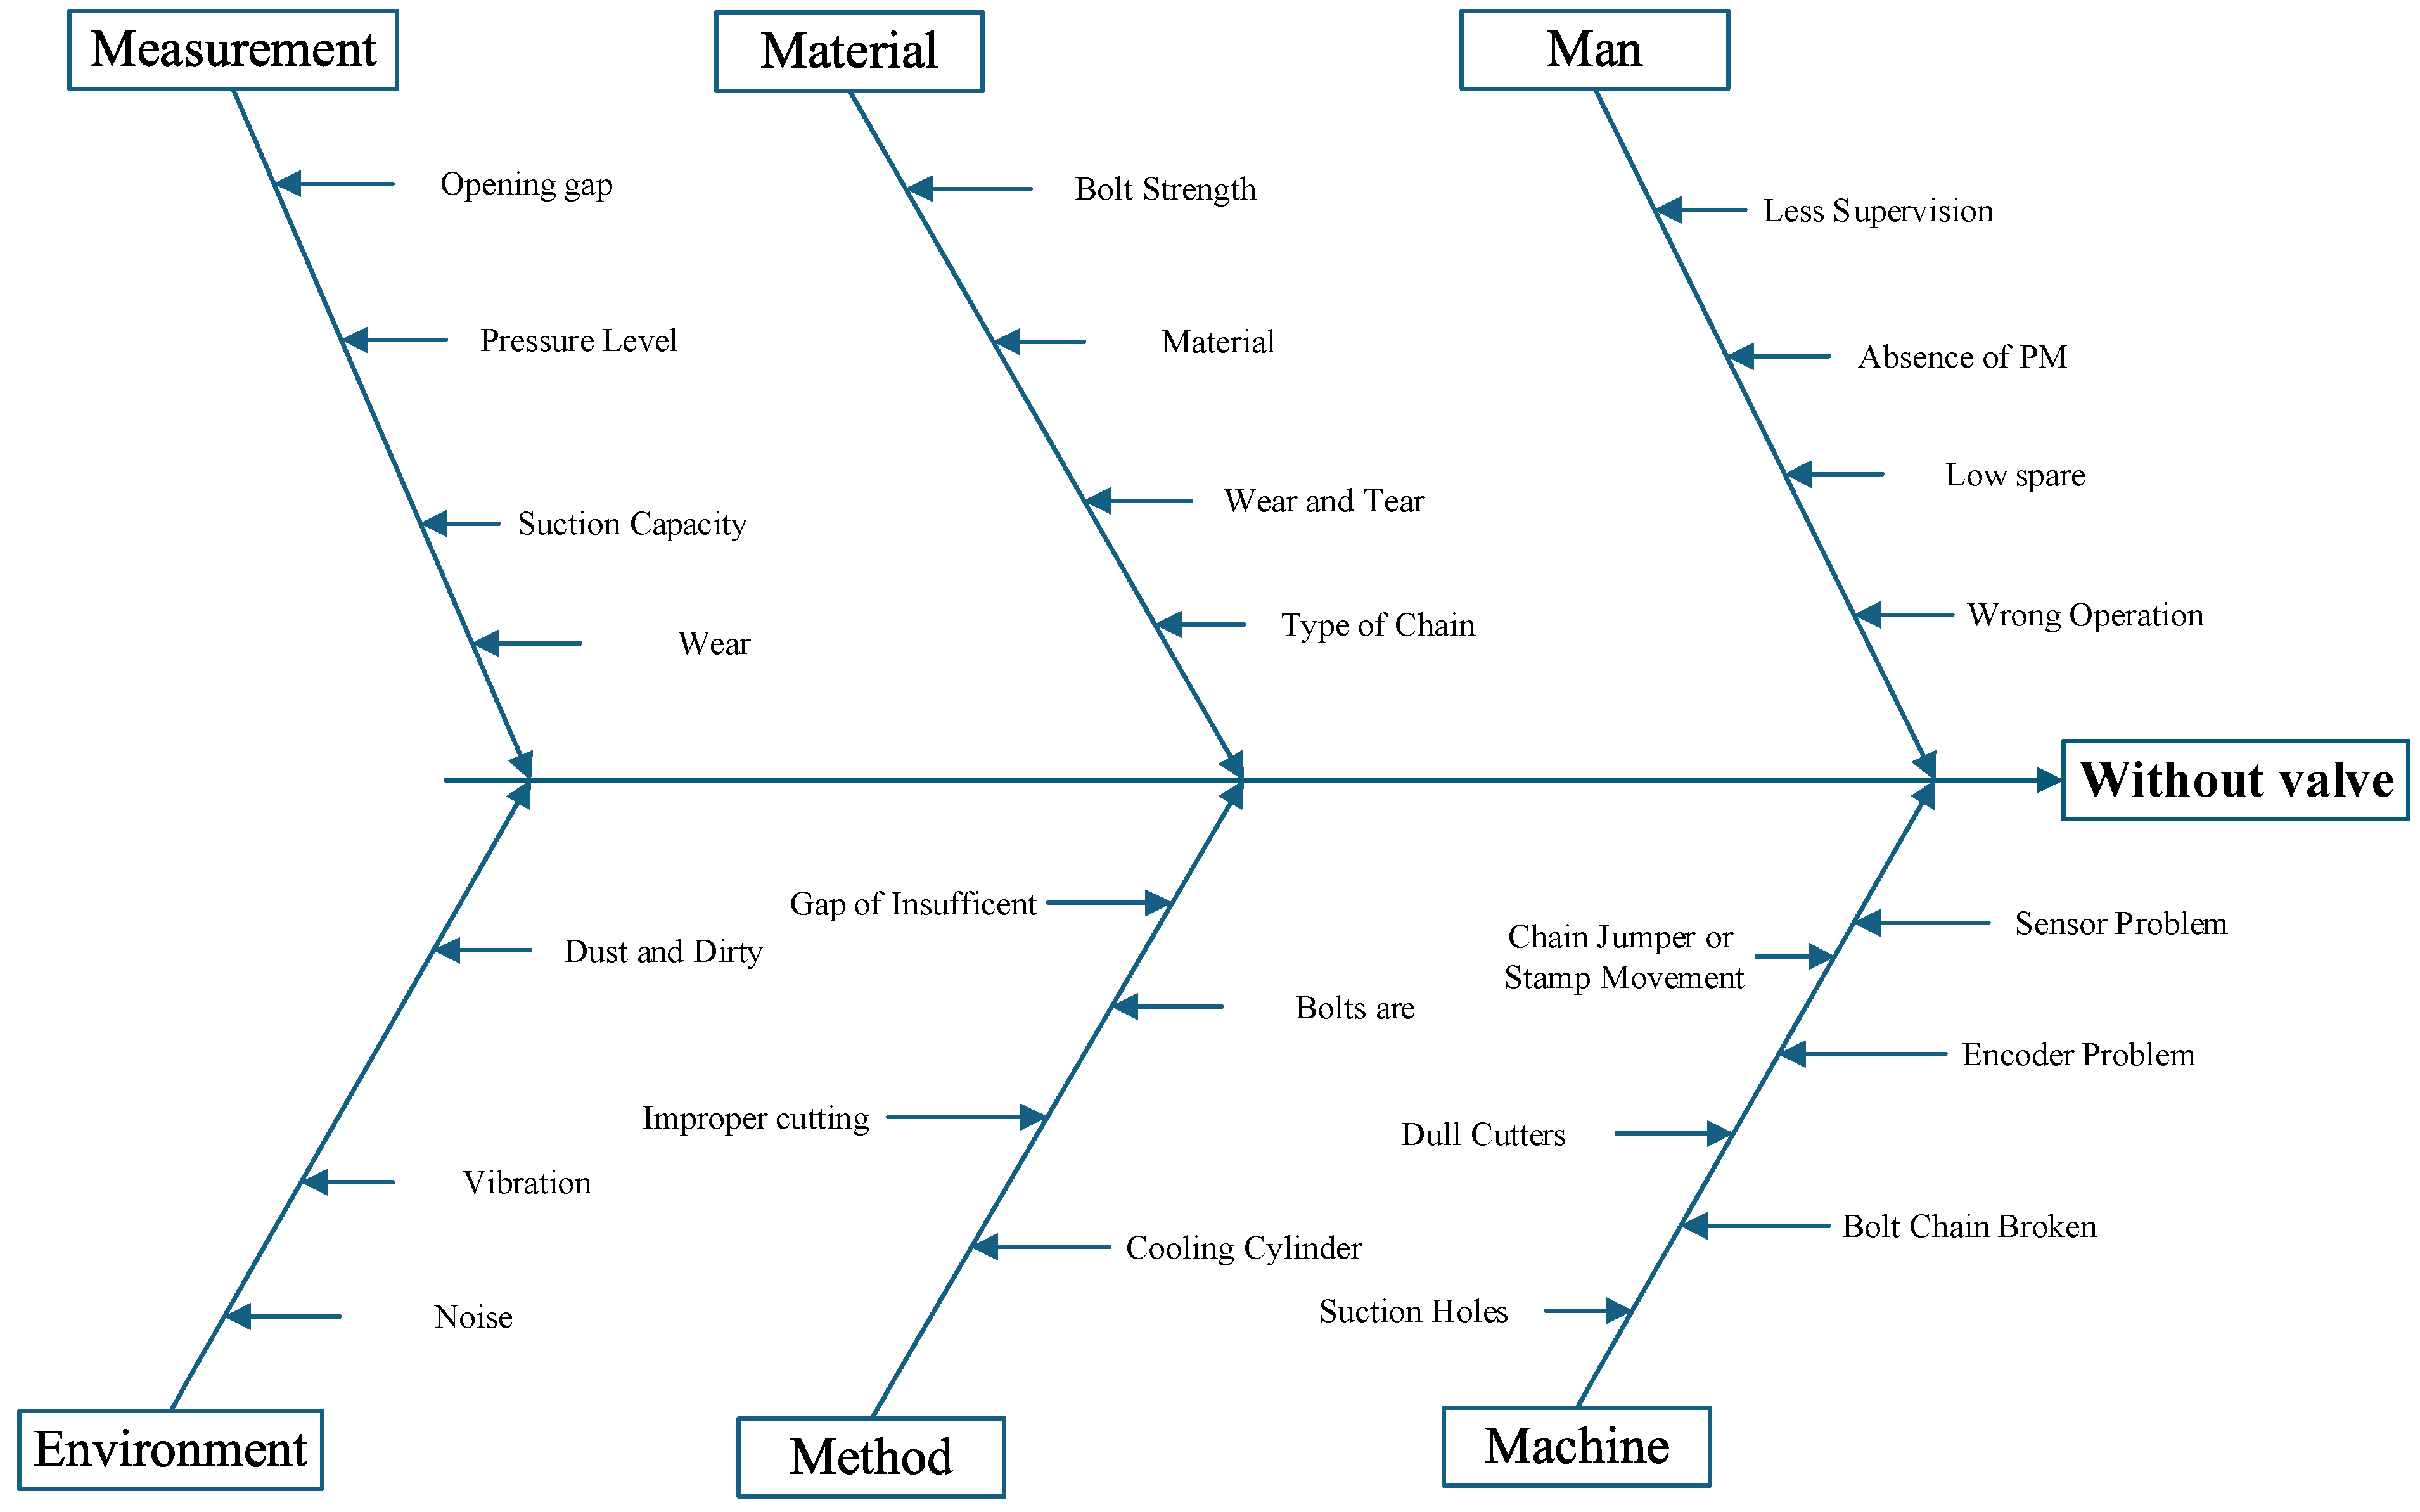
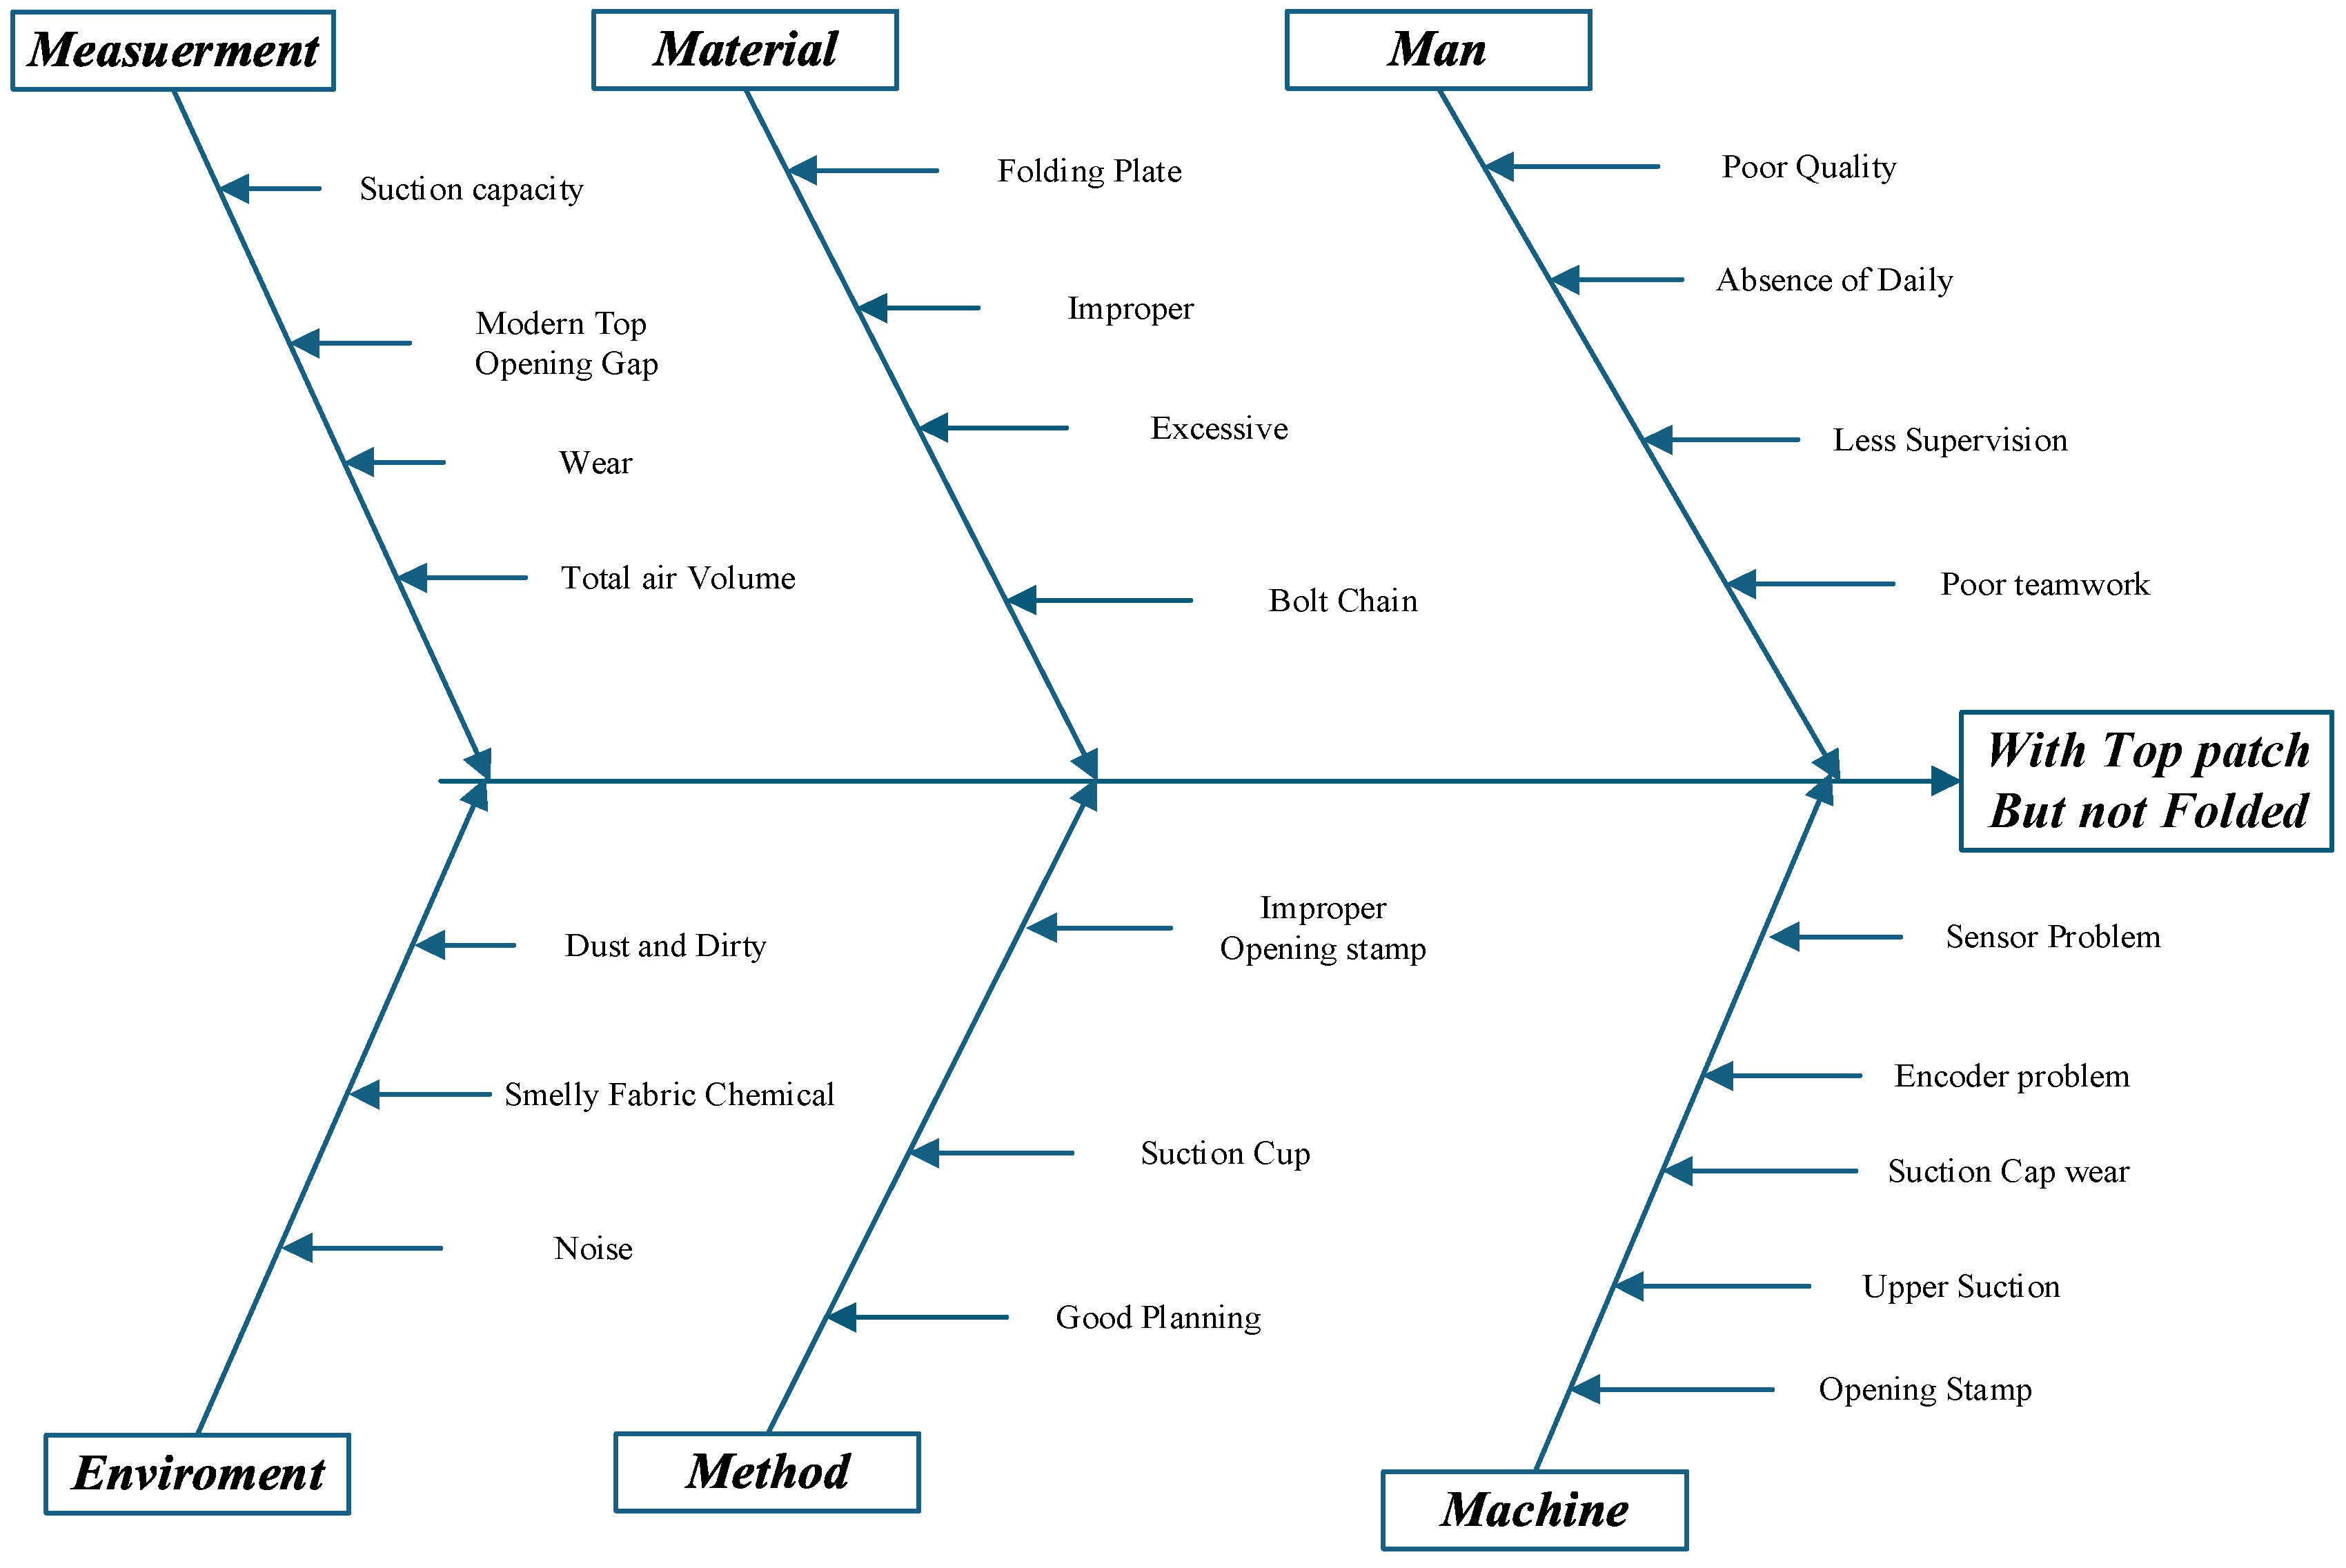
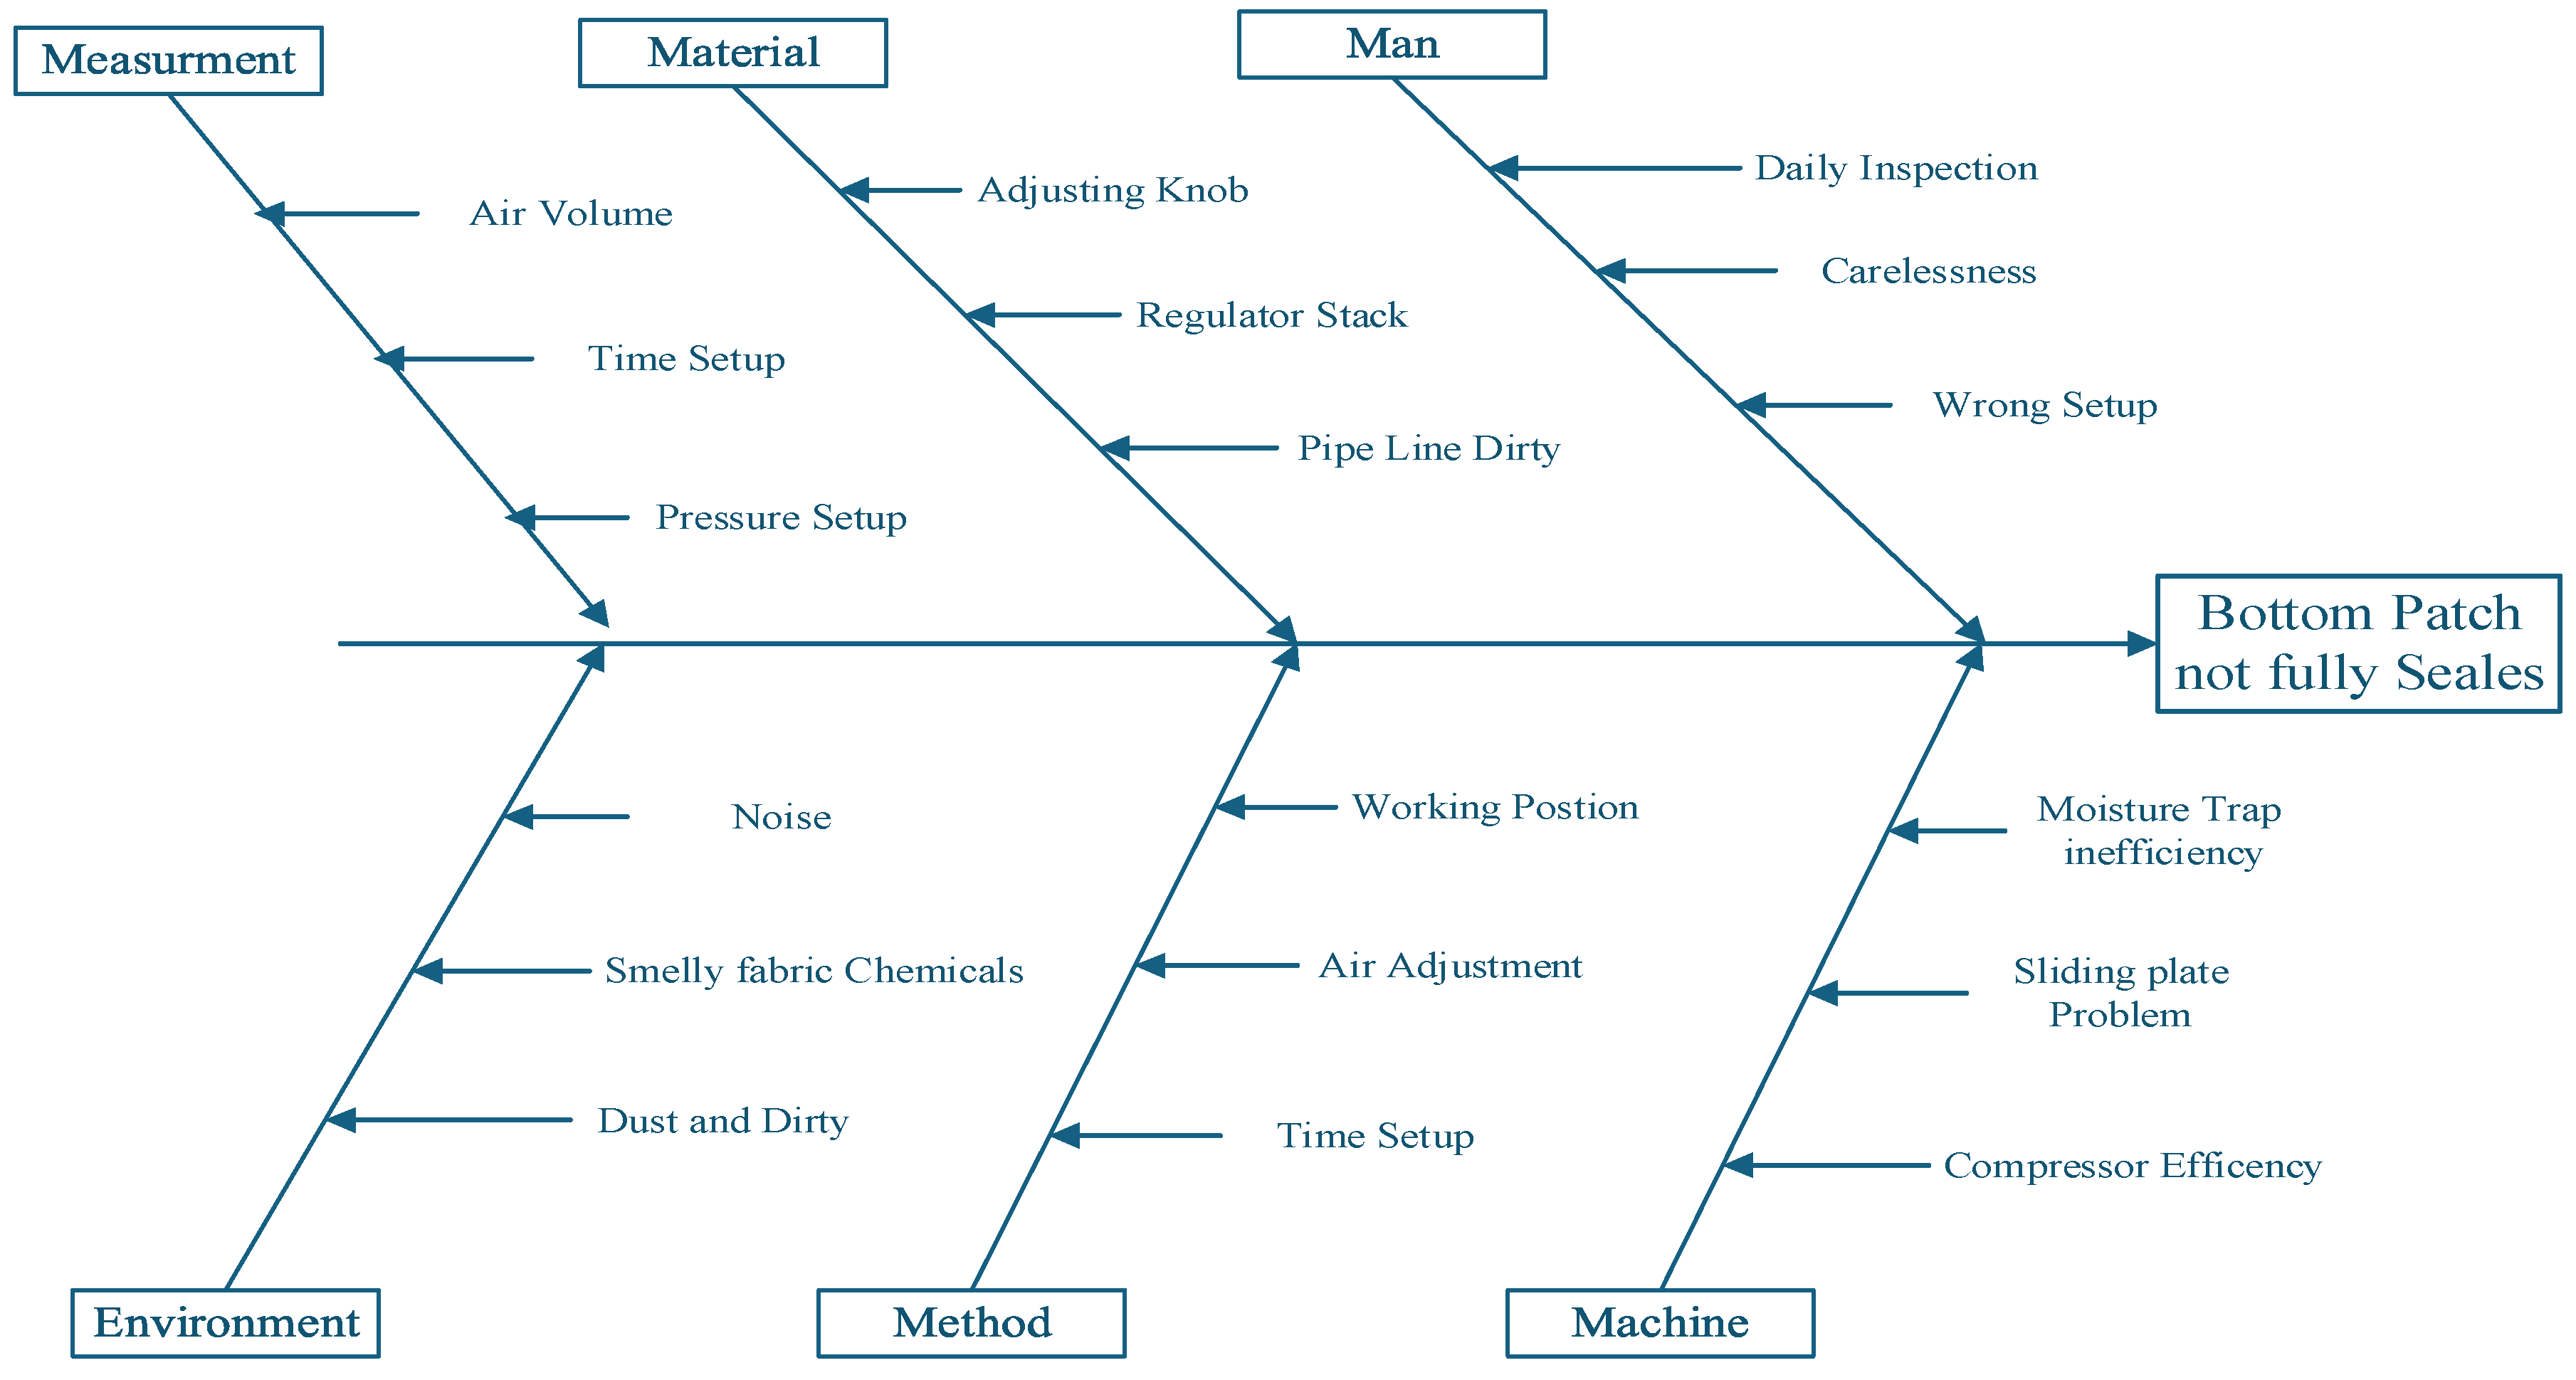
The first chart of the X bar chart is used to monitor the process's mean and determine whether it is stable enough to perform capability analysis. Therefore, as shown in (fig.4.4) of produced quantity at point 23, it is below the lower control limit, and in (fig.4.5) of rejected units, sample number 18 is above the upper control limit, and point 23 is also under the lower standard limit. The red points indicate subgroups that fail at least one of the tests for special causes and are not in control. Out-of-control points suggest that the process may not be stable and that the results of a capability analysis may not be reliable. It needs improvement and eliminates the causes of variation.
The second Moving Range (MR) chart also plots the moving range for consecutive observations, and the center line is the average of all moving ranges. The control limit, set at three standard deviations below and above the center line, indicates the variation expected in the moving parts. From the above-moving range chart in (fig.4.4) of produced quantity at sample points 22 and 23, it is above the upper control limit, and in (fig.4.5) of rejected units, sample points 17, 18, 22, and 23 are above the upper control limit the rest most of the points are below the center line. In general, from the chart, the process is not stable enough, and the results of capability analysis may not be reliable. It needs to identify the cause of out-of-control points and eliminate unique cause variation before the process capability analysis.
The third chart, the last 25 subgroups plot, also shows the data points for the previous 25 subgroups and displays a line for the overall process mean. However, in the above chart, most of the points are not randomly and symmetrically distributed about the process mean across the subgroups (fig.4.4) and (fig.4.5), so the process is unreliable.
The fourth Capability Histogram also shows the distribution of the sample data; each bar of the histogram represents the frequency of data; in these results, the process data does not appear pretty in the center, and the process spread curve. Also very wide, the data are outside the specification limit, representing nonconforming items in the specification spread, which suggests poor capability. All the data are inside the specification limits. Data outside the specification limits represent nonconforming items compared to the specification spread, which suggests poor capability.

4.3. Analyses Phase

The analysis is the third phase of DMAIC. Since the problems were already identified in the measuring phase using the Pareto diagram, the current reasons are investigated in this step, and the root cause of the most dominant defects is brainstormed using the Fishbone (cause and effect) diagram.
Cause and Effect Diagram of The Six Dominant Defects
Figure 7. Cause and Effect Diagram for Jump and Draw Out Defect.
Preprints 152388 g007
Figure 8. Cause and Effect Diagram for Top and Bottom Without Patch Defect.
Preprints 152388 g008
Figure 9. Cause and Effect Diagram for With Bottom Patch but Not Folded Defect.
Preprints 152388 g009
Figure 10. Cause and Effect Diagram for Without Valve Defect.
Preprints 152388 g010
Figure 11. Cause and Effect Diagram for With Top Patch but Not Folded Defect.
Preprints 152388 g011
Figure 12. Cause and Effect Diagram for Bottom Patch Not Fully Sealed Defect.
Preprints 152388 g012

4.4. Improve Phase

This part of the DMAIC process involves brainstorming possible causes of defects, testing, and recommending suggestions for the above-listed defects in the analysis phase. Then, effective solutions for the investigated causes of variation are applied to improve quality, productivity, the sigma level, and the company's defect rate.

4.4.1. Remedies of Jump and Draw-Out Defects

In the PP bag manufacturing company, well-trained experts are vital in improving company productivity and product quality. Quality improvement tools like Kaizen, JIT (just in time), statistical quality control tools, and processes that grant low-cost production processes are established by the training department.
The remedies to solve the defect include checking and adjusting the gap between bags to 100mm, checking the straightness of the steel band, and checking the availability of magnets. Adjust the stamp's pressure to a moderate level. Stamps should not knock on the bed; the stamp should be fixed to the exact position and inspected daily. Check the drive and roller of the chain diameter using precision measuring tools; if it is under the specification, change the new spare and fix it at the proper tension. Use the high-speed steel bolts more than other materials to prevent sudden broking, set the auto machine technicians up, and keep the area around the sensor from being covered by damaged bags and wastes.
Clean and check the proper functions of the follower and magnets; if it’s not working correctly, immediately replace them, ensure the friction line and plate attachment are straight and centered,
Make proper clearance of the friction line and bed at the entrance 2mm-3mm, and beyond the second pneumatic cylinder should be 1mm; make slight lubrication on the face of the friction line.
To prevent encoder problems, use 630-640℃ temperature for cover and valve patch sealing. Set the pressure to 30-33 bar, which will vary depending on the weather conditions. Also, take care of unlaminated bags, which can cause the encoder to burn out. The first step of sensor prevention is to clean and adjust to environmental conditions caused by wet optics, dust, and dirt, and change or inspect the cable break/lead breakage, broken connectors, and damaged cable insulations on time.
Apply the Standard Operating Procedure (SOP) system, a set of step-by-step instructions prepared by the company to help workers carry out complex routine operations and for trainee workers. Use the manufacturer's manual and international standards to set the required pressure setup and adjust the friction line chain. Modern inspection and measuring tools are used instead of old to keep the workers healthy and safe. Install enough chemical fume suckers, air conditioning, and ventilation system to prevent both the machine parts like sensor and raw material from contamination. Use safety tools like mouth musk, ear mug, steel-toed shoes, and eyeglasses.

4.4.2. Remedies Top and Bottom Without Patch Defects

Prepare maintenance standards, especially scheduled daily, weekly, monthly, quarterly, and monthly preventive maintenance and corrective maintenance plans, including inspection and lubrication. Proper maintenance is essential to avoid an accident and machinery breakdown, and the production rate will deliberately increase and adapt to on-the-job training. First, clean the suction vacuum, check the cutting sensor's proper functions, check the blades' cutting-edge sharpness, and adjust the cutters to align position and make an air gap b/n them. To keep the encoder, use 630-640℃ temperature for both cover patch and valve patch sealing and set the pressure to 30-33 bar to vary based on the weather conditions. And take care of unlaminated bags because they lead the encoder to burn out. The first step of sensor prevention is to clean and adjust to the environment caused by wet optics, dust, and dirt, and change or inspect the cable break/lead breakage, broken connectors, and damaged cable insulations on time.
Make sure to clean the areas of the bottom opening and sensors for any debris, ensure that they are properly blinded for unnecessary vacuum holes, check the suction pressure and suction caps, and check air control valves and lines for any leakage. Control the required temperature and pressure by using MBC (model-based control) (model-based control) in the Plc. This performs better than others and eliminates using a standalone temperature controller. Apply modern inspection and measuring tools rather than old tools and install enough chemical fume suckers, air conditioners, and ventilation systems, and wear safety tools like mouth musk, ear mug, and eyeglasses properly should be the best way of prevention.

4.4.3. Remedies of With Bottom Patch but Not Folded Defects

The finding shows a lack of practical technical skills to enhance machine efficiency, which indicates that training schedules must be prepared considering a preventive maintenance program that helps to fill the skill gap in every section in both practical and theoretical aspects.
Adjust the folding plates' forward and backward speeds as well. Make the gap between the stamp and folding plates 4-5mm. Adjust the stamp's pressure to moderate. Check the suction pressure and suction caps, blind unnecessary holes that affect the pressure-volume and the pneumatic cylinder filters, and maintain a balanced pressure output. To prevent encoder problems, set the temperature to 630-640℃ for both cover patch and valve patch sealing, put the pressure to 30-33 bar to vary based on the weather condition, and take care of unlaminated bags because of lead the encoder to burn out. The first step of sensor prevention is to clean and adjust to environmental conditions caused by wet optics, dust, and dirt, and change or inspect the cable break/lead breakage, broken connectors, and damaged cable insulations on time. Prepare a standard schedule of quality inspection and production control daily. Emphasize all problems frequently occurring in every section and record their solutions as soon as possible for further reference. Material selection for a given application begins with studying different material selection criteria, related costs, and specific application capabilities according to the manufacturer's details. The supply and purchase department should handle this serious issue because wrong material selection leads to huge costs and machine inefficiency. Installing enough chemical fume suckers, air conditioning, and ventilation system and wearing safety tools like mouth musk, ear mug, and eyeglasses properly should be the best way of prevention and prevent machines from being affected by dust and also keep the pipeline from free of dirty.

4.4.4. Remedies of Without Valve Defects

To solve the defect without a valve, it is recommended that more focus be placed on improving testing, developing motivation, and acknowledging the teamwork between quality circle members. Improving cut and sealing accuracy helps increase waste recycling rate and reduce associated costs. Considering these, the following points are essential to solve the defect:
Check and clean the valve patch unit and fabric roll property, including a cooling cylinder, impression cylinder, belt tension, and nip-roll thickness and smoothness.
Ensure the winder vacuum holes and solvent hose are clean with their vacuum hoses. Check the impression cylinder for tears and wear, and the functions of the cutting sensor and blades' proper cutting-edge sharpness. Adjust the cutters to the exact alignment position and make the appropriate gap between them. To prevent encoder problems, set the temperature to 630-640℃ for both cover patch and valve patch sealing, put the pressure to 30-33 bar to vary based on the weather condition, and take care of unlaminated bags because of lead the encoder to burn out. The first step of sensor prevention is to clean and adjust to environmental conditions caused by wet optics, dust, and dirt, and change or inspect the cable break/lead breakage, broken connectors, and damaged cable insulations on time. Emphasize problems frequently occurring in every section and record their solutions as soon as possible for further reference. Increase customer satisfaction by carefully listening to customer feedback and taking corrective action to identify and eliminate potential process or product failure modes by prioritizing deficiencies.
The supervisor should take the risk of job priority, which should be done first, and be aware of his workers sequentially before problems happen. Because problem prevention is much better than problem-fighting, communicating and accepting the ideas raised by the employees, giving them a chance to brainstorm about some issues, then acknowledging them, and showing courage are key ways of improving products and eliminating defects.

4.4.5. Remedies of With Top Patch but Not Folded Defects

Apply the Standard Operating Procedure (SOP) system, which is a set of step-by-step instructions prepared by the company for workers carrying out complex routine operations and trainee workers. Adjust the folding plates' forward and backward speeds as well. Make the gap between the stamp plate and the folding plate 4-5mm, and moderate the stamp's pressure. Check the suction pressure and suction caps, blind unnecessary holes that affect the pressure volume, check the pneumatic cylinder filters, and maintain a balanced pressure output. Maintaining and controlling the exact injection temperature allows the material to stiffen, permitting the trapped gases to escape from the melt stream. To prevent encoder problems, set the temperature to 630-640℃ for both cover patch and valve patch sealing, put the pressure to 30-33 bar to vary based on the weather condition, and take care of unlaminated bags because of lead the encoder to burn out. Clean and adjust sensor prevention to environmental conditions and change or inspect the cable break/lead breakage, broken connectors, and damaged cable insulations on time. Clean the areas of the bottom opening and sensors for debris, ensure they are properly blinded for unnecessary vacuum holes, check the suction pressure and suction caps, and check the air control valves and lines for any leakage.

4.4.6. Remedies of Bottom Patch Not Fully Sealed Defects

The shift leader should record the checklist for inspection of machine parts and daily QC reports, such as lamination, tape, loom, Convertex, etc. , its daily production, defects, and maintaining an adequate quality standard of every section, and also notice the workers' daily progress reports on maintenance and production status. Properly clean the hot air blowing nozzle, cooling cylinder holes, impression cylinder, the movement of arms sliding bearings, and the functions of a pneumatic cylinder. Finally, check the direction and volume of the air-blowing nozzle probe.
Apply the SOP, a set of step-by-step instructions prepared by the company for workers carrying out complex routine operations and trainee workers. The hot air blowing nozzle should adjust fully open; the position could not recommend any leakages at the stop. Make the gap between the cooling cylinder and impression cylinder zero mm at cool and hot times, and check the heating cartage’s efficiency. The producer must eliminate common errors like gauges, uniformity, and treatment. The incorrect polymer may have been used in the film, perhaps due to human error in the extrusion process, so it should be taken care of in the process.
When a product film is not sealing as expected, there could be faults with the sealing equipment, or it could require some simple adjustment to the machine settings; check for any faults on the machine that may contribute to the bags not feeding correctly and misalignment of rollers and their tensions and other feeding or sticking rollers that do not rotate freely stacked its bearing and due to shaft wear out.
Some common seal defects include creases in the seal, the product getting trapped in the seal, weak seals that peal easily, and holes or thin spots appearing next to the seal.
Check and prioritize all technical aspects of every fault, such as mixing ratio, temperature and pressure difference, density, time setup, and the quality of the raw material, ensuring it is free of contamination before and after processing.
Adjust the exact sealing temperature setting, calibrate sealing temperature readings with the required setup, adjust the correct sealing time and pressure setting, inspect the air supply and solenoid valve, and clean the sealing bar from a build-up of ink and other dust particles.

4.4.7. Calculation of Defect Rate, DPMO, and Sigma Level After Improvement

T o t a l   n u m b e r   o f   c h e c k e d   o r   i n s p e c t e d   p r o d u c t s = 32,552,008   b a g s
N u m b e r   o f   n o n c o n f o r m i n g   p r o d u c t s = t h e   s u m   o f   t h e   18 e n   t o t a l   d e f e c t s   200,988   b a g s
N u m b e r   o f   c o n f o r m i n g   p r o d u c t s = 32,552,008 200,988 = 32,351,019   b a g s
D e f e c t   p e r   u n i t ( D P U ) = 200,988   b a g s 32,552,008   b a g s = 0.00617438
D e f e c t   p e r   u n i t D P U i n   % = 0.00617438 * 100 % = 0.62 %
D e f e c t   p e r   m i l l i o n   o p p o r t u n i t y   ( D P M O ) = D P U * 0.00617438 = 6174   b a g s
The sigma quantity level of ± 1.5 δ is
= 0.8406 + ( 29.37 2.221 l n D P M O )
= 0.8406 + ( 29.37 2.221 l n ( 6174 ) ) = 4.00 δ
Table 5. Confidence Interval for Defect Rate%, Yield Rate%, DPM/DPMO and Sigma Level After Improvement.
Process outcome-95% Confidence interval for defect rate, yield rate %, DPM/DPMO and sigma (Short and long term)
Enter the number of defects 200988
Enter Sample Size(N) 32552007
Defect rate % 0.61744 Yield rate% 99.38256 DPM 6174.3658
Observed defect rate % (lower limit) 0.61475 Observed yield rate % (Upper limit) 99.38525 Observed DPM (lower limit) 6147.51376
observed defect rate % (Upper limit) 0.62013 Observed yield rate % (Lower limit) 99.37987 observed DPM (upper limit) 6201.33447
Short term Sigma 4.00 Long term Sigma 2.74
Observed Sigma (lower limit) 4.00 observed Sigma (lower limit) 2.74
Observed Sigma (upper limit) 4.00 Observed Sigma (Upper limit) 2.74
After the possible solutions and corrective actions are suggested in the improvement phase of Six Sigma DMAIC. The primary problem defects and their root causes have already been investigated. Suppose these remedies are applied correctly in the section. In that case, the parameters are changing as shown in (Tab.4-13) of 95% confidence interval for defect rate, yield rate DPMO, and Sigma level solver table, the defect rate is reduced to 0.61%, it was 4.73% at the very beginning, and the sigma level also increased from 3.17 to 4.00. That means based on the standard of the Six Sigma rule, the improvement was successful, and changes were recorded; 4.00 means the industry average level of Sigma. Therefore, the quality and productivity of the company increased linearly, the overall sigma level also improved, and the customer complaints about the product quality were reduced.
Figure 12. Process Capability Plots of Produced Quantity.
Preprints 152388 g016
Figure 13. Process Capability Plots of Rejected Units.
Preprints 152388 g013

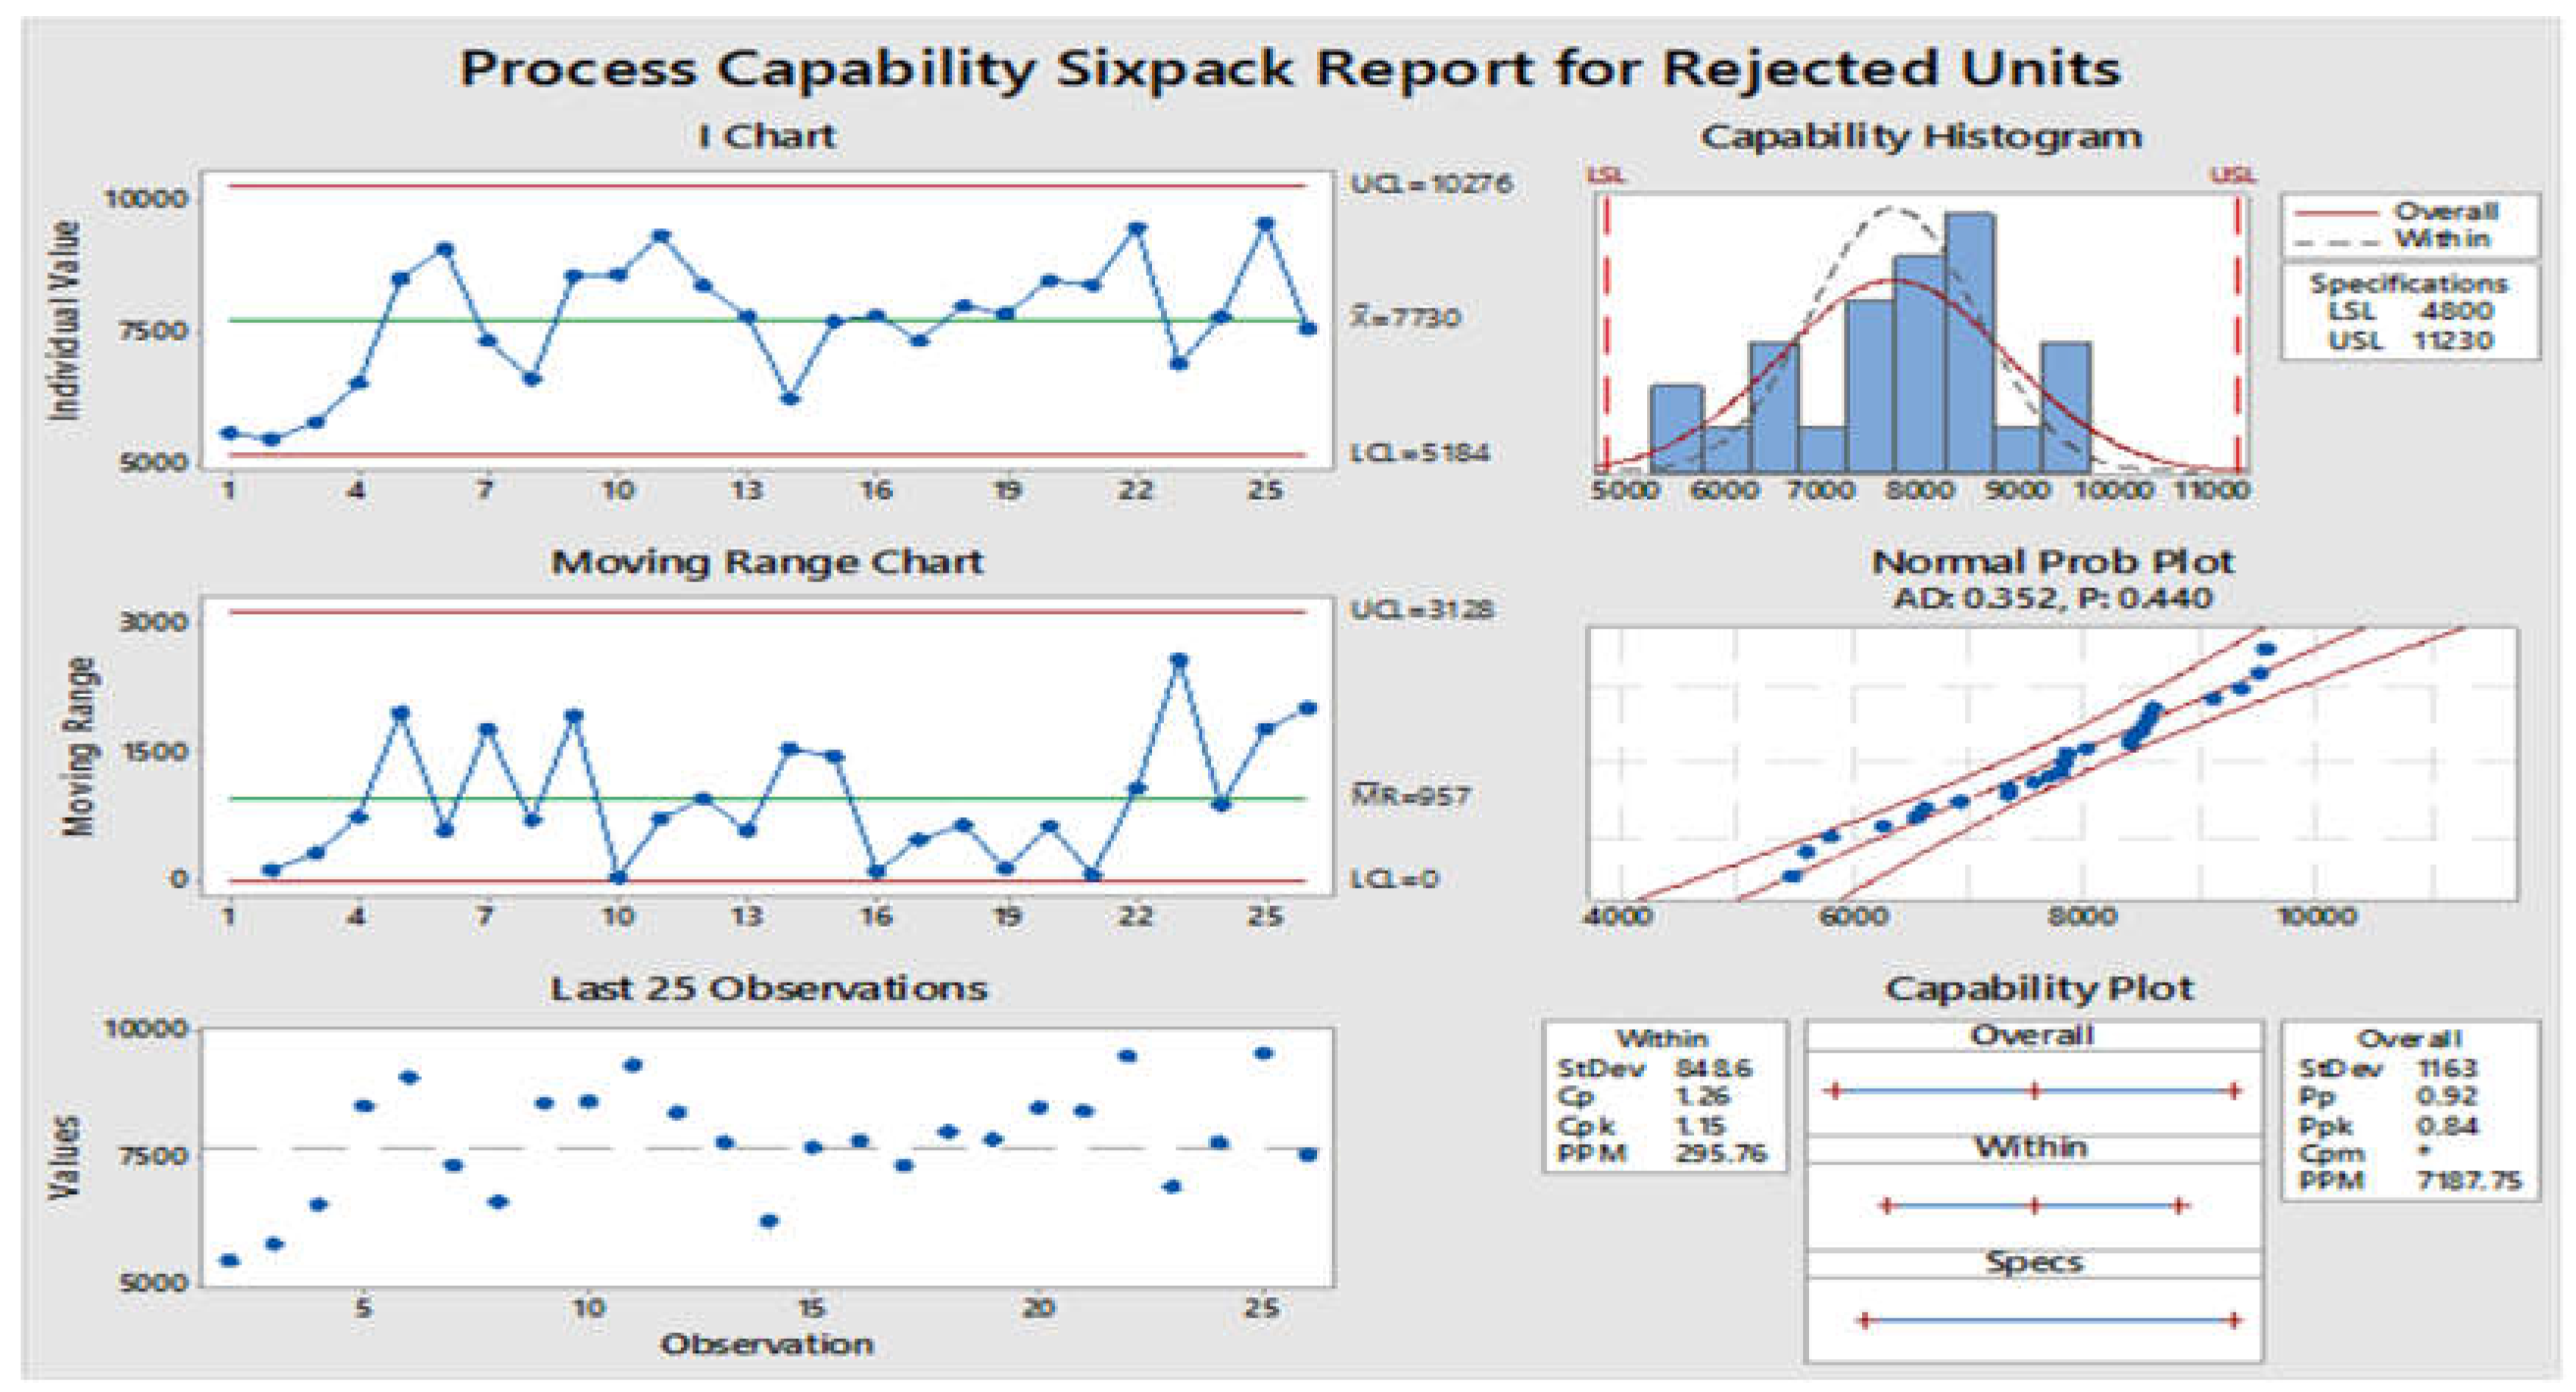
4.4.8. Chart Interpretation After Improvement

After the improvement has been made, all points or samples and numbers in the X chart are inside the control limit, and the red points are eliminated through continuous improvement in both (fig.4.12) and (fig.4.13). Therefore, this indicates that the process is stable and that the results of a capability analysis should be reliable because SPC methods eliminate the causes of variation. The second chart of Moving Range (MR) also contains the plots for consecutive observations, and the center line is the average of all moving ranges. The control limit, set at three standard deviations below and above the center line, indicates the variation expected in the moving parts. All sample points are in the control limit from the above-moving range chart (fig.4.12) and (fig.4.13). Therefore, the process is stable enough, and the results of capability analysis are also reliable. Its variations are identified, and the cause of variation is eliminated before the process capability analysis.
The third chart, the last 25 subgroups plot, also shows the data points for the previous 25 subgroups and displays a line for the overall process mean. Furthermore, the points are randomly and symmetrically distributed about the process mean across the subgroups (fig.4.12) and (fig.4.13), so the process is reliable after improvement.
The fourth Capability Histogram also shows the distribution of the sample data, and each bar of the histogram represents the frequency of data. The process data appear in the center of these results, and the process spread curve is a little broader. So that the nonconforming items are minimized. Also, the specification spread suggests good capability, and all the data are inside the specification limits. The processing capability of both production quality and rejected units are 1.19 and 1.26, respectively, and we can say that the process is successfully capable.
Figure 14. Comparisons Before and After Improvement.
Preprints 152388 g014
Therefore, the process capability percentage comparison of both production quantity and defect units between the existing and the current findings of the study after improvement are calculated as follows;
P r o d u c t i o n   q u a n t i t y = N e w O l d N e w * 100 % = 53.7 %
D e f e c t e d   u n i t s = N e w O l d N e w * 100 % = 53.9 %

4.5. Control Phase

Controlling is the last phase of Six Sigma DMAIC, which considers sustaining and implementing the improvement phase's results and advancing the changes. This phase ensures that the new process conditions or investigated improvements are well-documented and monitored via SPC methods with their recommended solutions. There are four procedures to perform an effective controlling system.
Figure 15. Controlling Steps.
Preprints 152388 g015
Standardization means that the workers have established a well-approved process and process parameters to eliminate quality and productivity problems on time and increase employee morale throughout the company. This paper mentions how to successfully apply the brainstormed causes and remedies and process capability analysis methods in the Messebo PP bag company. Management and workers of Messebo PP bag should identify the detailed process steps of each improvement technique and assign when and by whom these steps or techniques are performed within a specified timetable.
The second step is Documentation. It is essential to ensure the techniques and guidelines found from the improvement are well-documented with detailed steps, instructions, and procedures. Afterward, it should be distributed to the QC members or responsible teams to carry out overall process improvement activities. To perform adequate documentation, we should follow the steps: identify and name the process, define the process scope, explain the process boundary, identify the process outputs, identify the process inputs, brainstorm the process steps, organize the steps sequentially, and describe who is involved.
The third step is also the monitoring plan; in this plan, the changes are detected and well identified in the improved process, and the improvement will indeed be carried on to meet customer requirements and reduce complaints. Also, it helps to monitor when and how often the data is collected and define how to gather and record improvement data.
The fourth step of the controlling phase is the Response plan. It helps to identify the next steps and procedures for taking action. Once the improvements are detected in the monitoring phase, the response plan helps to define each measure in the monitoring plan and decide what action to take in the problem-solving, who to take action, where to find the troubleshooting procedures, and what action to take for an out-of-control production or quality system.

5. Conclusions

Defect minimization is vital to ensure product quality because quality is the only way manufacturing companies can sustain and win in today's competitive global market. The main objective of this study was to identify the major defects, eliminate defect rate, and increase the sigma level and CP of Convertex laminated using SSs’ DMAIC farmwork and SQC tools. Therefore, from the 18 listed defects in the section, the most dominant six, which cover 79% of the total defects, are identified using the Pareto diagram. Namely, Jump and draw out, top and bottom without the patch, with a bottom patch but not folded, without a valve, with a top patch but not folded, and Bottom patch not fully sealed. These are the ‘‘Vital Few’’ that account for the majority effect or 20% of causes of defects that are responsible for 80% of total defects or few contributors. The root causes of the six significant defects have been successfully determined using a fishbone diagram. Before improvement, the Sigma level was 3.17 (Non-competitive), the defect rate was 4.73 %, DPMO was 47389, and the process capability of produced quantity and defect units was 0.55 and 0.58, respectively. Therefore, if the process's CP is less than one, it is incapable. After possible solutions and corrective actions were suggested, the Sigma level became 4.00 (industry average), the defect rate was 0.61%, DPMO 6174, and the process capability of produced quantity and defect units was 1.19 and 1.26, respectively, which is very capable. Controlling procedures are suggested to sustain and advance the improvements. Therefore, the proposed improvement techniques and corrective actions will be implemented depending on the strong commitment and loyalty of the higher management of the Messebo PP bag factory.

References

  1. M. Q. Alsudani et al. , "RETRACTED ARTICLE: Smart logistics with IoT-based enterprise management system using global manufacturing," Journal of combinatorial optimization, vol.45, no.2, p.57, 2023.
  2. A. Zonnenshain and R. S. Kenett, "Quality 4.0—the challenging future of quality engineering," Quality Engineering, vol.32, no.4, pp.614-626, 2020.
  3. M. Colledani, T. Tolio, and A. Yemane, "Production quality improvement during manufacturing systems ramp-up," CIRP Journal of Manufacturing Science and Technology, vol.23, pp.197-206, 2018. [CrossRef]
  4. C. O. R. Okpala and M. Korzeniowska, "Understanding the relevance of quality management in agro-food product industry: From ethical considerations to assuring food hygiene quality safety standards and its associated processes," Food Reviews International, vol.39, no.4, pp.1879-1952, 2023. [CrossRef]
  5. M. Javaid, A. Haleem, R. P. Singh, and R. Suman, "Significance of Quality 4.0 towards comprehensive enhancement in the manufacturing sector," Sensors International, vol.2, p.100109, 2021.
  6. M. Helmold, "Total quality management (TQM)," in Virtual and Innovative Quality Management Across the Value Chain: Industry Insights, Case Studies and Best Practices: Springer, 2023, pp.27-41.
  7. T. A. Ibidapo, "Quality Tools and Techniques," in From Industry 4.0 to Quality 4.0: An Innovative TQM Guide for Sustainable Digital Age Businesses: Springer, 2022, pp.251-271.
  8. J. Singh, R. Singh, S. Singh, H. Vasudev, and S. Kumar, "Reducing scrap due to missed operations and machining defects in 90PS pistons," International Journal on Interactive Design and Manufacturing (IJIDeM), vol.17, no.5, pp.2527-2539, 2023. [CrossRef]
  9. J. Liu, D. Zhuang, and W. Shen, "The impact of quality management practices on manufacturing performance: an empirical study based on system theory," Soft Computing, pp.1-16, 2023. [CrossRef]
  10. D. Le, Y. Li, and F. Ren, "Does air quality improvement promote increased enterprise productivity? Based on the spatial spillover effect of 242 cities in China," Frontiers in Public Health, vol.10, p.1050971, 2022. [CrossRef]
  11. F. Psarommatis, J. Sousa, J. P. Mendonça, and D. Kiritsis, "Zero-defect manufacturing the approach for higher manufacturing sustainability in the era of industry 4.0: a position paper," International Journal of Production Research, vol.60, no.1, pp.73-91, 2022. [CrossRef]
  12. A. Palange and P. Dhatrak, "Lean manufacturing a vital tool to enhance productivity in manufacturing," Materials Today: Proceedings, vol.46, pp.729-736, 2021.
  13. J. Shi, "In-process quality improvement: Concepts, methodologies, and applications," IISE transactions, vol.55, no.1, pp.2-21, 2023.
  14. P. De Giovanni and G. Zaccour, "A survey of dynamic product quality models," European Journal of Operational Research, vol.307, no.3, pp.991-1007, 2023.
  15. F. Psarommatis and D. Kiritsis, "A hybrid Decision Support System for automating decision making in the event of defects in the era of Zero Defect Manufacturing," Journal of Industrial Information Integration, vol.26, p.100263, 2022.
  16. S. Azimpoor and S. Taghipour, "Joint inspection and product quality optimization for a system with delayed failure," Reliability Engineering & System Safety, vol.215, p.107793, 2021. [CrossRef]
  17. P. Tsarouhas, "Reliability, availability and maintainability analysis of a bag production industry based on the Six Sigma DMAIC approach," International Journal of Lean Six Sigma, vol.12, no.2, pp.237-263, 2021.
  18. S. Shingo, Zero quality control: Source inspection and the poka-yoke system. Routledge, 2021.
  19. S. Mandal, S. K. Kalakandan, and A. Sugumar, "Effective packaging and handling of food grains for quality and safety management," in Unit Operations in Food Grain Processing: Elsevier, 2024, pp.513-546.
  20. S. Bhat, J. Antony, M. Maalouf, G. EV, and S. Salah, "Applications of Six Sigma for service quality enhancement in the UAE: a multiple case study analysis and lessons learned," International Journal of Lean Six Sigma, vol.14, no.7, pp.1492-1517, 2023.
  21. A. Rosa et al. , "Assessing Lean Six Sigma and quality performance improvement in Italian public healthcare organizations: a validated scale," The TQM Journal, vol.36, no.9, pp.392-412, 2024.
  22. S. Rath and R. Agrawal, "Prediction of novel operating parameters using Six Sigma: A study in the steel making process," Quality Management Journal, vol.30, no.3, pp.187-201, 2023. [CrossRef]
  23. R. Joghee and R. Varghese, "Application of Six Sigma methodology in the analysis of variance: process shift versus inflation coefficient," International Journal of Quality & Reliability Management, 2024.
  24. S. Qayyum, F. Ullah, F. Al-Turjman, and M. Mojtahedi, "Managing smart cities through Six Sigma DMADICV method: A review-based conceptual framework," Sustainable Cities and Society, vol.72, p.103022, 2021.
  25. I. C. Pérez-Balboa and S. O. Caballero-Morales, "Define, Measure, Analyze, Improve, Control (DMAIC)," in Lean Manufacturing in Latin America: Concepts, Methodologies and Applications: Springer, 2024, pp.333-352.
  26. M. Milosevic, M. Djapan, R. D’Amato, N. Ungureanu, and A. Ruggiero, "Sustainability of the production process by applying lean manufacturing through the PDCA cycle–a case study in the machinery industry," in Advances in Manufacturing Engineering and Materials II: Proceedings of the International Conference on Manufacturing Engineering and Materials (ICMEM 2020), 21–25 June 2021, Nový Smokovec, Slovakia, 2021: Springer, pp.199-211.
  27. M. Colledani et al. , "Design and management of manufacturing systems for production quality," Cirp Annals, vol.63, no.2, pp.773-796, 2014. [CrossRef]
  28. M. Gamal Aboelmaged, "Six Sigma quality: a structured review and implications for future research," International Journal of Quality & Reliability Management, vol.27, no.3, pp.268-317, 2010.
  29. J. E. Brady and T. T. Allen, "Six Sigma literature: a review and agenda for future research," Quality and Reliability Engineering International, vol.22, no.3, pp.335-367, 2006. [CrossRef]
  30. A. Bazrkar, S. Iranzadeh, and N. Feghhi Farahmand, "Total quality model for aligning organization strategy, improving performance, and improving customer satisfaction by using an approach based on a combination of balanced scorecard and lean six sigma," Cogent Business & Management, vol.4, no.1, p.1390818, 2017.
  31. J. S. Oakland, Total quality management and operational excellence: text with cases. Routledge, 2014.
  32. A. Permana, H. H. Purba, and N. D. Rizkiyah, "A systematic literature review of Total Quality Management (TQM) implementation in the organization," International Journal of Production Management and Engineering, vol.9, no.1, pp.25-36, 2021. [CrossRef]
  33. M. Collinson, P. Edwards, and C. Rees, Involving employees in total quality management: employee attitudes and organizational context in unionized environments. Department of Trade and Industry London, 1998.
  34. J. Huang, M. Irfan, S. S. Fatima, and R. M. Shahid, "The role of Lean Six Sigma in driving sustainable manufacturing practices: an analysis of the relationship between Lean Six Sigma principles, data-driven decision making, and environmental performance," Frontiers in Environmental Science, vol.11, p.1184488, 2023.
  35. A. D. Makwana and G. S. Patange, "A methodical literature review on application of Lean & Six Sigma in various industries," Australian Journal of Mechanical Engineering, vol.19, no.1, pp.107-121, 2021. [CrossRef]
  36. R. Joghee, "Six Sigma quality evaluation of life test data based on Weibull distribution," International Journal of Quality & Reliability Management, vol.38, no.4, pp.1005-1022, 2021.
  37. S. Kalaivani and J. Ravichandran, "Performance evaluation of exponential distribution using Six Sigma-based tail probabilities," Communications in Statistics-Simulation and Computation, vol.50, no.11, pp.3125-3145, 2021. [CrossRef]
  38. M. Hollingshed, "Standardizing Six Sigma Green Belt training: identification of the most frequently used measure phase DMAIC tools," International Journal of Lean Six Sigma, vol.13, no.2, pp.276-294, 2022.
  39. N. Paneerselvam, N. A. Muhammad, A. M. Azhan, and N. Muhammad, "Analyzing critical success factors in Lean Six Sigma training," International Journal of Productivity and Performance Management, 2024.
  40. V. Gupta, R. Jain, M. Meena, and G. Dangayach, "Six-sigma application in tire-manufacturing company: a case study," Journal of Industrial Engineering International, vol.14, pp.511-520, 2018.
  41. M. H. Sajjad et al. , "Waste reduction of polypropylene bag manufacturing process using Six Sigma DMAIC approach: A case study," Cogent Engineering, vol.8, no.1, p.1896419, 2021.
  42. M. J. Ershadi, O. Qhanadi Taghizadeh, and S. M. Hadji Molana, "Selection and performance estimation of Green Lean Six Sigma Projects: a hybrid approach of technology readiness level, data envelopment analysis, and ANFIS," Environmental Science and Pollution Research, vol.28, pp.29394-29411, 2021.
  43. D. A. Desai, P. Kotadiya, N. Makwana, and S. Patel, "Curbing variations in packaging process through Six Sigma way in a large-scale food-processing industry," Journal of Industrial Engineering International, vol.11, pp.119-129, 2015.
  44. M. Hu and J. Pieprzak, "Using axiomatic design to improve conceptual design robustness in Design for Six Sigma (DFSS) methodology," International Journal of Six Sigma and Competitive Advantage, vol.1, no.3, pp.245-262, 2005.
  45. B. Rahardjo, F. -K. Wang, S. -C. Lo, and T. -H. Chu, "A Sustainable Innovation Framework Based on Lean Six Sigma and Industry 5.0," Arabian Journal for Science and Engineering, vol.49, no.5, pp.7625-7642, 2024.
  46. Y. Y. Liao, E. Soltani, A. Iqbal, and R. van der Meer, "The utility of performance review systems: A total quality management perspective," Strategic Change, 2024. [CrossRef]
  47. F. J. Lloréns Montes, A. Verdú Jover, and L. Miguel Molina Fernández, "Factors affecting the relationship between total quality management and organizational performance," International Journal of Quality & Reliability Management, vol.20, no.2, pp.189-209, 2003.
  48. S. P. Goffnett, "Leadership, goal acceptance, and QMS conformance readiness: exploring the mediating effects of audit team cohesion," Total Quality Management & Business Excellence, vol.31, no.1-2, pp.43-67, 2020. [CrossRef]
  49. V. Kumar and R. Sharma, "Leadership styles and their relationship with TQM focus for Indian firms: An empirical investigation," International Journal of Productivity and Performance Management, vol.67, no.6, pp.1063-1088, 2018.
  50. L. Gaikwad and V. Sunnapwar, "An integrated Lean, Green and Six Sigma strategies: a systematic literature review and directions for future research," The TQM Journal, vol.32, no.2, pp.201-225, 2020.
  51. J. A. González Ruiz, N. Blanco, and M. Gascons, "Enhancing process performance for composite padel racket manufacture using Six Sigma-DMAIC and VSM synergetic support," Cogent Engineering, vol.9, no.1, p.2084982, 2022. [CrossRef]
  52. J. Schmitt, J. Bönig, T. Borggräfe, G. Beitinger, and J. Deuse, "Predictive model-based quality inspection using Machine Learning and Edge Cloud Computing," Advanced engineering informatics, vol.45, p.101101, 2020.
  53. M. S. Kaswan and R. Rathi, "Green Lean Six Sigma for sustainable development: Integration and framework," Environmental impact assessment review, vol.83, p.106396, 2020.
  54. R. Rathi, M. S. Kaswan, J. A. Garza-Reyes, J. Antony, and J. Cross, "Green Lean Six Sigma for improving manufacturing sustainability: Framework development and validation," Journal of Cleaner Production, vol.345, p.131130, 2022. [CrossRef]
  55. S. Elkateb, A. Métwalli, A. Shendy, and A. E. Abu-Elanien, "Machine learning and IoT–Based predictive maintenance approach for industrial applications," Alexandria Engineering Journal, vol.88, pp.298-309, 2024.
  56. Y. Trakulsunti, J. Antony, R. Edgeman, B. Cudney, M. Dempsey, and A. Brennan, "Reducing pharmacy medication errors using Lean Six Sigma: A Thai hospital case study," Total Quality Management & Business Excellence, vol.33, no.5-6, pp.664-682, 2022.
  57. S. Bhat, E. Gijo, J. Antony, and J. Cross, "Strategies for successful deployment and sustainment of Lean Six Sigma in the healthcare sector in India: a multi-level perspective," The TQM Journal, vol.35, no.2, pp.414-445, 2023.
  58. G. D. Sharma, S. Kraus, M. Srivastava, R. Chopra, and A. Kallmuenzer, "The changing role of innovation for crisis management in times of COVID-19: An integrative literature review," Journal of Innovation & Knowledge, vol.7, no.4, p.100281, 2022. [CrossRef]
  59. F. Hacklin, Management of convergence in innovation: strategies and capabilities for value creation beyond blurring industry boundaries. Springer Science & Business Media, 2007.
  60. A. M. Evans et al. , "Dissemination and analysis of the quality assurance (QA) and quality control (QC) practices of LC–MS-based untargeted metabolomics practitioners," Metabolomics, vol.16, no.10, p.113, 2020. 10.1007/s11306-020-01728-5.
  61. L. K. Toke and S. D. Kalpande, "Total quality management in small and medium enterprises: An overview in Indian context," Quality Management Journal, vol.27, no.3, pp.159-175, 2020.
  62. J. Abbas, "Impact of total quality management on corporate green performance through the mediating role of corporate social responsibility," Journal of Cleaner Production, vol.242, p.118458, 2020. [CrossRef]
  63. J. Abbas, "Impact of total quality management on corporate sustainability through the mediating effect of knowledge management," Journal of Cleaner Production, vol.244, p.118806, 2020.
  64. A. Syafarudin, "The effect of product quality on customer satisfaction implications on customer loyalty in the era Covid-19," Ilomata International Journal of Tax and Accounting, vol.2, no.1, pp.71-83, 2021.
  65. P. Kwiatek, Z. Morgan, and M. Thanasi-Boçe, "The role of relationship quality and loyalty programs in building customer loyalty," Journal of Business & Industrial Marketing, vol.35, no.11, pp.1645-1657, 2020.
  66. N. Haber, M. Fargnoli, and T. Sakao, "Integrating QFD for product-service systems with the Kano model and fuzzy AHP," Total Quality Management & Business Excellence, vol.31, no.9-10, pp.929-954, 2020.
  67. N. M. Duc, D. T. P. Chi, N. H. Tien, and T. T. K. Hong, "Factors affecting customer satisfaction at Vietinbank in Vietnam," International Journal of Research in Human Resource Management, vol.3, no.2, pp.62-70, 2021.
  68. F. Pakdil and F. Pakdil, "Overview of quality and Six Sigma," Six Sigma for Students: A Problem-Solving Methodology, pp.3-40, 2020.
  69. E. Gijo, J. Scaria, and J. Antony, "Application of Six Sigma methodology to reduce defects of a grinding process," Quality and reliability Engineering International, vol.27, no.8, pp.1221-1234, 2011.
  70. S. Gupta, S. Modgil, and A. Gunasekaran, "Big data in Lean Six Sigma: a review and further research directions," International Journal of Production Research, vol.58, no.3, pp.947-969, 2020.
  71. M. Zhang, W. Wang, T. N. Goh, and Z. He, "Comprehensive Six Sigma application: a case study," Production Planning & Control, vol.26, no.3, pp.219-234, 2015.
  72. I. T. B. Widiwati, S. D. Liman, and F. Nurprihatin, "The implementation of Lean Six Sigma approach to minimize waste at a food manufacturing industry," Journal of Engineering Research, 2024.
  73. A. Mittal, P. Gupta, V. Kumar, A. Al Owad, S. Mahlawat, and S. Singh, "The performance improvement analysis using Six Sigma DMAIC methodology: A case study on the Indian manufacturing company," Heliyon, vol.9, no.3, 2023. [CrossRef]
  74. F. L. Lizarelli and D. H. Alliprandini, "Comparative analysis of Lean and Six Sigma improvement projects: performance, changes, investment, time and complexity," Total Quality Management & Business Excellence, vol.31, no.3-4, pp.407-428, 2020.
  75. N. Nandakumar, P. Saleeshya, and P. Harikumar, "Bottleneck identification and process improvement by lean six sigma DMAIC methodology," Materials Today: Proceedings, vol.24, pp.1217-1224, 2020.
  76. F. Tsung and K. Wang, "Six Sigma," in Springer Handbook of Engineering Statistics: Springer, 2023, pp.239-259.
  77. B. John and R. S. Kadadevaramath, "Improving the resolution time performance of an application support process using Six Sigma methodology," International Journal of Lean Six Sigma, vol.11, no.4, pp.663-686, 2020.
  78. E. Gijo, S. Bhat, and N. Jnanesh, "Application of Six Sigma methodology in a small-scale foundry industry," International Journal of Lean Six Sigma, vol.5, no.2, pp.193-211, 2014.
  79. K. C. Arredondo-Soto, J. Blanco-Fernández, M. A. Miranda-Ackerman, M. M. Solís-Quinteros, A. Realyvasquez-Vargas, and J. L. García-Alcaraz, "A plan-do-check-act based process improvement intervention for quality improvement," IEEE Access, vol.9, pp.132779-132790, 2021. [CrossRef]
  80. A. Realyvásquez Vargas, J. L. García Alcaraz, S. Satapathy, D. A. Coraza, and Y. Báez López, "The PDCA (Plan-Do-Check-Act) Cycle," in Lean Manufacturing in Latin America: Concepts, Methodologies and Applications: Springer, 2024, pp.409-437.
  81. J. Trippner-Hrabi, J. Chądzyński, and A. Kam, "Enhancing Goal Achievement During Remote Work in Public Utility Services: Unveiling the Significance of the PDCA Deming Cycle," in Ethics and Innovation in Public Administration: Springer, 2024, pp.299-311.
  82. M. Gupta, A. Digalwar, A. Gupta, and A. Goyal, "Integrating Theory of Constraints, Lean and Six Sigma: a framework development and its application," Production Planning & Control, vol.35, no.3, pp.238-261, 2024. [CrossRef]
  83. R. Surjit, G. Indu, B. Anusri Mahalakshmi, and M. Shubha Shree, "Six Sigma Approach: A Pathway to Zero Waste Sustainable Apparel Industry," in Zero Waste Sustainable Apparel Industry: Springer, 2024, pp.25-41.
  84. P. Patel and D. Desai, "Implementation of Six Sigma Methodology in Indian Plastic Manufacturing Industry-A Case Study," Journal of The Institution of Engineers (India): Series C, pp.1-23, 2024.
  85. A. Sharma, A. Chouhan, L. Pavithran, U. Chadha, and S. K. Selvaraj, "Implementation of LSS framework in automotive component manufacturing: a review, current scenario, and future directions," Materials Today: Proceedings, vol.46, pp.7815-7824, 2021.
  86. P.-S. Chen, J. C. -M. Chen, W. -T. Huang, and H. -T. Chen, "Using the Six Sigma DMAIC method to improve procurement: a case study," Engineering Management Journal, vol.35, no.1, pp.70-83, 2023.
  87. M. Kharub, S. Kattekola, and S. K. Pendyala, "80/20 your organization using AHP for quantitative decision making," Materials Today: Proceedings, vol.56, pp.2437-2442, 2022.
  88. R. Kumar, K. Singh, and S. K. Jain, "Agile manufacturing: a literature review and Pareto analysis," International Journal of Quality & Reliability Management, vol.37, no.2, pp.207-222, 2020. [CrossRef]
  89. A. Kwilinski and M. Kardas, "Enhancing process stability and quality management: A comprehensive analysis of process capability indices," Virtual Economics, vol.6, no.4, pp.73-92, 2023.
  90. E. K. Saied, A. Y. Besees, A. Wazeer, and A. A. Abd-Eltwab, "Process Performance Analysis In Cement Industry," International Journal of Scientific & Technology Research, vol.9, no.06, pp.844-860, 2020.
  91. Y. Y. Tesfay and Y. Y. Tesfay, "Process capability analysis," Developing structured procedural and methodological engineering designs: applied industrial engineering tools, pp.187-209, 2021.
  92. P. L. Ramos, A. P. Silva Figueiredo, D. Carvalho do Nascimento, F. Moala, and E. Flores, "Beyond Regular SPC: Bridging the C pk Capability Index for (a) Symmetric Data," Annals of Data Science, pp.1-27, 2024. [CrossRef]
  93. T. Agustiady and E. A. Cudney, "TPM and Sigma," in Total Productive Maintenance: CRC Press, 2024, pp.16-49.
  94. N. P. d. Rocha et al. , "Statistical process control of manufacturing tablets for antiretroviral therapy," Brazilian Journal of Pharmaceutical Sciences, vol.59, p. e22099, 2023.
  95. H. U. Pawar, S. K. Bagga, and D. K. Dubey, "Investigation of production parameters for process capability analysis: A case study," Materials Today: Proceedings, vol.43, pp.196-202, 2021.
  96. Q. Xiao and G. Li, "Application and challenges of statistical process control in radiation therapy quality assurance," International Journal of Radiation Oncology* Biology* Physics, vol.118, no.1, pp.295-305, 2024. [CrossRef]
  97. S. Shandilya, J. Arora, and V. Kalluri, "To study the comparison and effect of Six Sigma and Red Bin Analysis in Indian manufacturing industries," The TQM Journal, vol.35, no.7, pp.1658-1685, 2023. [CrossRef]
Disclaimer/Publisher’s Note: The statements, opinions and data contained in all publications are solely those of the individual author(s) and contributor(s) and not of MDPI and/or the editor(s). MDPI and/or the editor(s) disclaim responsibility for any injury to people or property resulting from any ideas, methods, instructions or products referred to in the content.
Copyright: This open access article is published under a Creative Commons CC BY 4.0 license, which permit the free download, distribution, and reuse, provided that the author and preprint are cited in any reuse.
Prerpints.org logo

Preprints.org is a free preprint server supported by MDPI in Basel, Switzerland.

Subscribe

Disclaimer

Terms of Use

Privacy Policy

Privacy Settings

© 2025 MDPI (Basel, Switzerland) unless otherwise stated