
Submitted:
12 March 2025
Posted:
14 March 2025
You are already at the latest version
Abstract
In the past three decades, the city of Addis Ababa has grown significantly in population, facilities, and infrastructure. The area involved in the recent urbanization is prone to slow natural subsidence phenomena that can be accelerated due to anthropogenic factors such as groundwater overexploitation and loading of unconsolidated soils. The main aim of this study is to identify and monitor the areas most affected by subsidence in a context, such as that of many areas of emerging countries, characterized by the lack of geological and technical data. The increasing availability of SAR data acquired by the Sentinel-1 mission around the world and the refinement of processing techniques that have taken place in recent years, allow one to identify and monitor the critical conditions deriving from the impressive recent expansion of mega cities such as Addis Ababa. In this work, the Sentinel-1 SAR images from 2014 to 2021 were processed through the PS-InSAR technique, which allows us to estimate the deformations of the earth's surface with high precision, especially in urbanized areas. The obtained deformation velocity maps and displace-ment time series have been validated using accurate second-order geodetic control points and compared with the recent urbaniza-tion of the territory. The results demonstrate the presence of areas affected by a vertical rate of displacement of up to 21 mm/year. These areas correspond to sectors that are most predisposed to subsidence phenomena due to the presence of recent alluvial deposits and have suffered greater anthropic pressure through the construction of new buildings and the exploitation of groundwater. Satellite interferometry techniques are confirmed to be a reliable tool for monitoring potentially dangerous geologi-cal processes, and in the case examined in this work, they represent the only way to verify the urbanized areas exposed to the risk of damage with great effectiveness and low cost, providing local authorities with crucial information on the priorities of interven-tion.
Keywords:
subsidence
; anthropic pressure
; interferometry
; risk
; Addis Ababa
; East Africa
1. Introduction
Land subsidence refers to the downward displacement of the ground relative to a reference surface, such as the mean sea level or the ellipsoid. It encompasses both gradual down-warping and the sudden sinking of specific segments of the ground surface. Although the displacement is primarily downward, the concomitant horizontal deformation frequently causes severe damage [1]. Land subsidence in urban areas may be caused by excessive groundwater extraction, buildings and construction loads (i.e., settlement of high compressibility soils), natural consolidation of recent deposits, and tectonic activity. Groundwater extraction, which is linked to urbanization and population increase, is the fundamental cause of significant ground subsidence in megacities such as Jakarta, Ho Chi Minh City, Bangkok, and a slew of other coastal agglomerations [2]. The causes of ground deformation in the city of Addis Ababa (AA) are both natural and human-induced, being the groundwater over-extraction, the huge construction and urbanization, and the influence of the Main Ethiopian Rift’s (MER) margin [3,4] the main conditioning factors. Excessive groundwater extraction causes compaction of susceptible aquifer systems [1,5]. Civil buildings such as residential, factories, highways and subways, malls, hotels, and office buildings have sprouted all over the study area, causing unseen land subsidence [6,7]. Dynamic loads resulting from pile base construction and traffic loading frequently affect land subsidence. Moreover, several local faults and earthquakes that occurred in and around AA have potentially influenced the depth, orientation, and elongation of the area’s weak zone.
Satellite-based radar interferometry is a useful tool for detecting and monitoring ground deformation. Numerous studies have used Radar Interferometry in different fields, such as ground instabilities caused by landslides [8,9,10,11] and land subsidence due to groundwater extraction [12,13,14,15], mining [16,17], urban planning [18,19,20], seismology [21,22], volcanology [23,24], glaciology [25,26], ground subsidence and uplift [27,28]. In particular, the evolution and rate of surface subsidence due to various factors were estimated by analyzing multiple space-borne Synthetic Aperture Radar (SAR) datasets with different spatial resolutions, revisiting times and acquisition geometries [29].
Permanent Scatterers-InSAR (PSI) techniques allow measuring the rate of displacements of the Earth’s surface over time with millimetric precision [30]. In the last two decades, the PSI and Differential Interferometric SAR (DInSAR) approaches have improved thanks to the large availability of C-band data acquired by ERS-1/2, RADARSAT-1/2, Envisat, and Sentinel-1 missions [31]. These satellite sensors have collected data over long periods, which is essential for long-term deformation monitoring. The C-band sensor onboard of Sentinel-1 satellite, which was launched on 3rd April 2014, collects interferometric C-band SAR data and has a higher data collection capability than the prior C-band sensors onboard ERS-1/2, Envisat, and RADARSAT satellites. Sentinel-1 acquires images covering 250 by 180 km with a 12-day revisiting cycle (IW Swath) in its regular data-collection mode. The large area coverage and free availability of Sentinel-1 data are important and cost-effective for wide-area monitoring compared to other commercial datasets like COSMO-SkyMed and TerraSAR-X.
The spatial-temporal pattern, rate, and mechanism of land subsidence in AA have not been well studied yet. There are only a few studies that assessed earthquakes in the Afar region [32,33], the landslide in Gidole [34], and land deformation due to magnetic movement in Corbetti, Aluto, Bora, and Haledebi [35] using InSAR data in Ethiopia. The purpose of this research is to assess land subsidence and determine the amplitude displacement in AA, Ethiopia, using the PSI technique. This study is particularly useful for emerging countries like Ethiopia where the use of InSAR for land subsidence assessment is rare and the availability of geological and technical data is very limited. AA is facing exceptional sprawl urbanization with huge infrastructures and constructions, in a dynamic geological and geomorphological context, therefore there is a need for more effective city planning tools.
2. Materials and Methods
2.1. Study Area
The study area is roughly bounded by latitudes 8.830 N and 9.100 N, and longitudes 38.650 E and 38.910 E, with an approximate area of 1,400 km2 (Figure 1a). The elevation of AA ranges from over 3,000 m in Entoto Mountain in the north to 1916 m in the southern periphery around the Akaki-Kality area, with an average elevation of 2,355 m. The area is situated at the crossroads of the Ethiopian plateau and the northern portion of MER. As a result, both the plateau volcanic cover and rift-related volcanic sequences are present. The Oligo-Miocene plateau unit (Tarmaber and Alaji units-basalts, Rhyolites, and Trachytes), Miocene rift shoulder basalts, ignimbrites, rhyolites, and quaternary basalts, as well as alluvial-lacustrine sediments, are the dominant geological units of the area (Figure 1b) [36].
The main soil types of the study area include Pellic Vertisol, Vertic Cambisol, Orthic Solonchaks, Leptosols, Euthric Nitisols, Chromic Vertisols, Chromic Luvisols, and Calcic Xerosols, where Pellic Vertisols are dominant (Figure 2). The thickness of the soil ranges from 1 m in the northern mountainous areas (i.e., Gulele, Yeka, Wechecha, and Furi), to 40 m in the southern part of AA (i.e., Lebu and Jemmo) [37].
The climate in AA is mild and temperate, where the summer receives more substantial rainfall than the winter. The mean annual precipitation of the study area is 1874 mm, while the mean daily temperature is 15.6° C.
2.2. Materials and Methods
2.2.1. Ground and Satellite Data
Currently, SAR satellite data are collected by several missions: COSMO-SkyMed constellation (X-band), TerraSAR-X (X-band), Sentinel-1 A/B (C-band), RADARSAT-2 (C-band), and ALOS-2 (C-and L-bands). Each band has its own characteristics and applications:
- C-band. This band operates at wavelengths around 5.6 cm and is suitable for a wide range of applications due to its balanced performance in terms of spatial resolution and penetration capability. It offers moderate resolution and can penetrate vegetation to some extent, making it useful for monitoring agriculture, forestry, and land cover changes.
- X-band. With shorter wavelengths around 3 cm, X-band SAR data provides high spatial resolution imagery. This band is particularly beneficial for applications requiring fine details, such as urban monitoring, infrastructure analysis, and disaster management. However, X-band SAR has limited penetration capabilities compared to lower frequency bands.
- L-band. L-band SAR data operates at longer wavelengths (around 23.6 cm). It offers excellent penetration capabilities through vegetation and soil, making it valuable for applications like forest monitoring, agriculture, and subsidence monitoring. Although L-band SAR provides coarser spatial resolution compared to X-band, its ability to penetrate through vegetation can be advantageous for certain applications.
In summary, the choice of SAR frequency band depends on the specific application requirements, with C-band offering a balance between resolution and penetration, X-band providing high-resolution imagery, and L-band excelling in penetration through vegetation and soil.
The data-gathering strategies of the missions, such as regular acquisition over a defined area versus on-demand acquisitions, have an impact on data availability, which is highly inconsistent around the world. In the case of AA, Sentinel-1A SAR data are the only freely available data from 2014. Accordingly, in this study, 146 Sentinel-1A images acquired in the C band with vertical co-polarization (VV) and in descending geometry (Path 79), were considered. Sentinel-1A images were acquired from 23rd October 2014 to 31st January 2021, using the interferometric broad-swath mode with a 12-day revisiting period, a look angle of ~39.0°, and a ground resolution of ~15m by using a multi-look of 4 to 1 in range and azimuth directions.
The ground-based data currently available consists of high-precision levelling and Continuous Global Positioning System (CGPS) measurements gathered by the Space Science and Geospatial Institute (SSGI). The positions of the calculated benchmarks and the CGPS stations (Figure 1a) are used as ground control points (GCPs) to validate the InSAR results. The GCPs were established between 16th May and 7th December 2018, they are second-order control points with an accuracy of 10-20 cm and the measurements collected until 2021 indicate that they are placed in stable areas.
2.2.2. PSI Technique
PSI is a powerful remote sensing-based technique able to measure and monitor displacements of the Earth’s surface over time with millimetric precision. Together with SBAS-InSAR [38], PSI represents one of the main multi-temporal interferometric synthetic aperture radar (MT-InSAR) approaches. Proposed by [30], it requires at least 20 SAR images to perform the analysis using the C-band data [39]. The surface deformation over months or years can be estimated by removing the effects of atmosphere, topography, and signal noise. The potential of the PSI technique to assess land subsidence, especially in urban areas, has been reported in numerous studies [40,41,42,43,44].
The performance of PSI in estimating the deformation velocity and displacement time series depends on the number of images. The higher the number of images used, the higher the quality and reliability of the result [45,46]. The PSI technique uses time-series radar images to find possible deformation measurement points in the area of interest. It is a more advanced version of the traditional InSAR and allows us to overcome the issues of temporal and geometrical decorrelations [47]. A primary image is selected based on the geometry of the other images, in order to maintain a high coherence and minimal atmospheric disturbance. The remaining images, known as secondaries, are co-registered with the primary. After the images have been co-registered, a series of interferograms is developed using the most precise orbit information available. Possible persistent scatterer (PS) points are determined by evaluating interferometric phase differences over time. Finally, because of their associated phase activity over time, natural reflectors in SAR images are detected as temporally coherent. The technique then estimates the displacement of each PS point.
The interferogram is the key product generated during the processing of SAR data using InSAR techniques. InSAR involves the comparison of two or more SAR images of the same area acquired at different times to detect ground surface displacements with high precision. To this end, SAR images are co-registered to ensure precise alignment. Then, the phase difference between the corresponding pixels in the two images is calculated. This phase difference is caused by changes in the distance traveled by the radar signal between the two acquisitions, which in turn is influenced by ground surface movements. The phase difference calculated for each pixel is represented as a color-coded or grayscale image, known as an interferogram. Each pixel in the interferogram corresponds to a specific location on the ground, and the phase difference indicates the amount of ground displacement along the radar line-of-sight direction. Interferograms are analyzed to identify areas of ground deformation, such as subsidence, uplift, or lateral movement. By interpreting the fringe patterns in the interferogram, scientists can determine the magnitude and spatial extent of the surface deformation.
All interferograms generated by the PS algorithm are formed on the primary image, which means that for 146 SAR images, 145 interferograms were obtained. To begin the PSI process employed in this study, a collection of 146 images and a redundant network of interferograms were used. The primary processing steps include the estimation and removal of the atmospheric phase screen (APS), the estimation of the deformation rate and residual topographic error (RTE), and the removal of RTE [48].
For the full-resolution datasets, over half a million-point targets were obtained, a fact that poses some difficulties in handling the dataset for post-analysis purposes. The average spatial coherence threshold used was 0.75, which is a quite restrictive value that has been chosen due to the small multi-look factor. The density of the PS is 645 points/km2, which is a relatively good value for the C-band data but is limited to urbanized sectors. No prevalent phase-coherent radar targets were detected in vegetated areas, as coherence is almost completely lost due to temporal decorrelation.
PSI deformation measurements refer to the line-of-sight (LOS) of the SAR sensor, i.e., the line that connects the sensor and the target. Based on the incidence and azimuth angles, the vertical displacement has been calculated from the LOS deformation rate derived by the images acquired in descending orbits. To fully determine the 3D components (vertical, east-to-west, and north-to-south) of the deformation, images acquired both in ascending and descending orbits are required [49]. The SAR satellite image geometry along the descending orbits and the relation between the LOS displacement and vertical deformation are mathematically expressed using Equation 1. For a ground target, the LOS displacement rate D can be represented as a function of the 3D motion rates and the SAR imaging angular parameters:
where dv, de, and dn are the vertical, east-west (E-W), and north-south (N-S) displacements at a target, respectively; θ is the radar incidence angle; φ is the azimuth angle (measured clockwise from the north) of the satellite flight direction along the descending orbit. According to Equation (1), the sensitivities of a SAR system to 3D motion components can be expressed by the partial derivatives, i.e.,
This study determined only the maximum displacement rate in the vertical direction using the two angles and the displacement rate in the LOS direction. The 3D decomposition has not been done because the number of images in ascending orbit is very small and cannot be processed using PSI. In our opinion, investigating subsidence in the vertical component is enough and can be calculated using one orbit.
Vertical PS velocity maps and displacement time series were calculated through the PSI processing. The results were compared with the main geological characteristics of the area and the change in land cover, in order to verify the relationships between subsidence phenomena and the rapid and extensive increase in anthropic pressure over the last 20 years.
2.2.3. PSI Workflow Diagram
A pixel is defined as PS if the phase of the pixel is dominated by a stable scatterer. [30] presented an index called the amplitude dispersion index (ADI) that can be employed as an estimation for the phase stability in scatterers with high values of the Signal-to-Noise ratio (SNR). In this method, a low value of ADI, e.g., 0.4, is selected as the threshold, and pixels with an ADI value higher than the threshold are candidates for PS [30]. The main steps of processing are the following:
- i.
- generation of a connection graph;
- ii.
- definition of the area of interest;
- iii.
- interferometric Workflow: Co-registration, creation and flattening of interferograms, and development of mean power image and amplitude dispersion index (MuSigma) (input: DEM and GCPs);
- iv.
- Inversion First Step: Estimation of coherence, velocity, and residual topography;
- v.
- Second Inversion Step: elimination of atmosphere patterns, estimation of coherence, velocity, and residual topography, and estimation of displacement component, (input: GCPs);
- vi.
- Geocoding: Velocity, precision result geocoding, displacement geocoding (input: DEM).
3. Results
3.1. PS Velocity Map
Figure 3 shows the vertical velocity map derived by the PSI processing of Sentinel 1 images acquired in descending orbit. The result shows that displacement rates range from -21.5 to 2.0 mm/year: the average vertical displacement rate of Addis Ababa is 0.6 mm/year, with a standard deviation of the accumulated vertical displacement rate of 1.7 mm/year. Points with a velocity between -2.00 and 2.00 mm/year are considered stable, positive values indicate upward movement of the land (uplift), and negative values indicate downward movement (subsidence). As can be seen in Figure 3, the GCPs, which have measured no displacements in the period 2018-2021, fall in areas estimated as stable, confirming the correctness of interferometry processing. The higher deformation velocities (i.e., high land subsidence) were observed in Bole-Saris (A), Ayat-Arabsa (B), Akaki-Kality (C), and Atena-Tera (D) districts. Bole-Saris is the largest unstable area, hosting huge buildings and the main commercial district of the city. Various wall and road cracks, as well as small sinkholes, were observed in this area during field observations. The highest displacement was observed in Ayat-Arabsa, located in the eastern part of the city, where agricultural land has been transformed into the city’s newest residential and largest industrial area, hosting large manufacturing plants such as the Bole-Lemi Industrial Park. Akaki-Kality is the city’s oldest area and is undergoing rapid economic growth, featuring large buildings and major factories such as the Kaliti Food Share Company. Atena-Tera is located on the west side of the city and has the highest residential density. In this area, damage to walls and roads was observed during in situ inspections. Interestingly, all these areas are distributed in the central and out-skirt of the city. The remaining unstable areas shown in Figure 3 are smaller and present a slower displacement rate (less than −7.5 mm/year). Most of the old villages such as Kotebe (E) and Kolfe-Keraniyo (F) seem relatively stable, with displacement values ranging between -2 and 2 mm/year. No damages related to land subsidence have been observed in these areas during the field visits, except for a few cracks on the buildings and roads.
The city of AA has expanded at an impressive rate during the last 30 years (Figure 4): the expansion occurred mainly from the east to the southwest directions and was higher in the period between 2010 and 2020. The comparison between Figure 3 and Figure 4 shows that a high rate of subsidence is affecting the high-rise building area of Bole-Saris and the new highly urbanized of Ayat-Arabsa, Akaki-Kality, and Atena-Tera. The old city area (i.e., the Kotebe and Kolfe-Keraniyo districts), which has not experienced the development of new buildings, appears stable.
The rates of subsidence in the Bole-Saris, Ayat-Arabsa and Akaki-Kality areas have increased over time (Figure 3). These areas are associated with highly urbanized areas located in the center of Ayat and Akaki-Kality villages (Figure 4). Particularly, since 2015, these sectors have undergone intense urbanization by the construction of new residential buildings and malls, and most of the subsiding areas are in correspondence of these new settlements and high-rise building zones. However, a small portion of the old city is affected by subsidence mainly due to soil compaction and groundwater exploitation for potable water, in response to urbanization and increasing population. The most affected areas (i.e., A, B, C, and D shown in Figure 3) are characterized by tall buildings, dense road networks, and very thick compressible soil layers. For example, the thickness of the topsoil in the Bole-Saris (A), Ayat-Arabsa (B), Akaki-Kality (C), and Atena Tera (D) areas are 6-18 m, 12-14 m, 6-10 m, and 20-40 m, respectively. On the other hand, the thickness of soil in Kotebe (E) and Kolfe-Keraniyo (F) is very thin (about 1 m); in addition, these areas have been subjected to a lower anthropic pressure increase, as a result they are stable.
Observing changes in land cover over time can offer insights into the primary causes of subsidence in Addis Ababa. Figure 5A-D illustrates the evolution of land cover and displacements from 2014 to 2021 in the most critical areas identified through interferometric analysis.
- - Bole-Saris (A): The Bole-Saris area has experienced intense urbanization since 2015, with the construction of new residential buildings and malls, especially in Bole-Bulbula village, shown in the Figure. The district has become highly urbanized, with tall buildings and dense road networks. The subsidence in this area is likely due to soil compaction caused by the construction activities and the extraction of groundwater for potable water to support the increasing population and urban development. The increased ground deformation in Bole-Saris is primarily attributed to intense urbanization, the construction of tall buildings, and thick soil layers, which have accelerated land subsidence in the area.
- - Ayat-Arabsa (B): The Ayat-Arabsa area has also witnessed significant urbanization, especially in the center of Ayat’s real state and condominium village, shown in the Figure. The construction of new settlements and high-rise buildings has been prominent since 2015. Similar to Bole-Saris, the subsidence in Ayat-Arabsa is likely caused by soil compaction due to the loads imposed by new buildings and excessive groundwater extraction to meet the demands of growing urbanization and population needs. The subsiding areas in Ayat-Arabsa are primarily located in the new settlements and sectors with high-rise buildings.
- - Akaki-Kality (C): The Akaki-Kality areas have experienced significant urban development and high-rise building construction since 2015. The intense urbanization, industrial activity, dense road networks, soil compaction from new buildings, and substantial groundwater exploitation in this area have caused significant subsidence, as seen near landmarks such as the Heineken Brewery SC around Kilinto.
- - Atena Tera (D): In this area, a rapid increase in anthropogenic pressure has also occurred since 2015, such an increase has been accompanied by a rise in surface deformations, as shown in Figure 5D. The land subsidence can be attributed to soil compaction due to urban development and high-rise building construction. The high thickness of surface soils also has contributed to accelerate the subsidence.
3.2. Displacement Time Series
Figure 6 shows vertical displacement time series for selected pixels from highly subsiding areas in Bole-Saris, Ayat-Arabsa, Akaki-Kality, and Atena-Tera and in the stable areas of Kotebe and Kolfe-Keraniyo. The result show that the maximum, minimum, and average accumulated vertical displacements in the unstable areas were -134.6 mm, 27.3 mm, and -12.0 mm, respectively. The average rate of land subsidence at Kotebe (E) and Kolfe-Keraniyo (F) is almost zero (~ ±0.2) with a range of -2 and 2 mm/year, suggesting that these areas have remained relatively stable with minimal subsidence or uplift.
The plots show different rates of displacement, categorized as uncorrelated (stable area), linear (increase or decrease), bilinear (e.g., increase then decrease, both increases, or both decreases), and quadratic (increase or decrease).
- - Uncorrelated (Stable area): In the stable areas (Figure 6E-F), the displacement time series does not show any significant pattern or trend over time. The vertical displacements in these areas are uncorrelated, indicating that the ground remains relatively stable without any significant subsidence or uplift.
- - Linear (Increase or Decrease): In some areas, the displacement time series follows a linear pattern from 2017 up to 2021 (Figure 6A-D), either showing a steady increase or a decrease in vertical displacement over time. A linear trend can be an indication of gradual, constant subsidence or uplift in the region.
- - Bilinear (Increase, Decrease, or Vice Versa): The bilinear pattern indicates two distinct linear trends in the displacement time series, which may be in opposite directions. This could indicate a change in the subsidence or uplift rate during the observation period. For example, the subsidence rate might increase or decrease abruptly at a certain point in time, as in the case of Figures 6C-D between 2016 and 2017.
- - Quadratic (Increase or Decrease): The quadratic pattern suggests a nonlinear trend in the displacement time series. It indicates that the subsidence or uplift is accelerating or decelerating over time. The rate of displacement changes non-linearly, resulting in a quadratic pattern as in Figures 6C-D from 2014 up to 2017.
R-squared values in Figure 6A shows that the quadratic regression is a better fit for the data than the linear regression. The quadratic regression explains 98.29% of the variance in the data, while the linear regression explains 98.06% of the variance in the data. This means that the quadratic regression model perfectly fits the data. Similarly, the values show in Figure 6, B-D indicates that the quadratic regression model fits the data slightly better than the linear regression model. In conclusion, quadratic trend is best model to fit the data than the linear model.
For region E, the quadratic model (R² = 0.0516) marginally outperforms the linear trend (R² = 0.0178), though both demonstrate negligible explanatory power. Similarly, region F exhibits weak model fits (quadratic R² = 0.0400; linear R² = 0.0099), suggesting high variability or noise in the displacement data. These low R² values imply that neither linear nor quadratic trends sufficiently capture the underlying dynamics, necessitating caution in interpreting the reported velocities."
Overall, Figure 6 provides valuable information about the deformation history in the observed areas. It allows to study the kinematics of a given phenomenon (quiescence, activation, and acceleration) and their correlation with potential driving factors. However, it is essential to consider that the displacement time series are a zero-redundancy product, meaning that they contain one deformation estimate per each SAR acquisition. This sensitivity to phase noise can lead to the dominance of the linear deformation model in the time series patterns. Careful data interpretation is required to properly use and interpret the deformation time series.
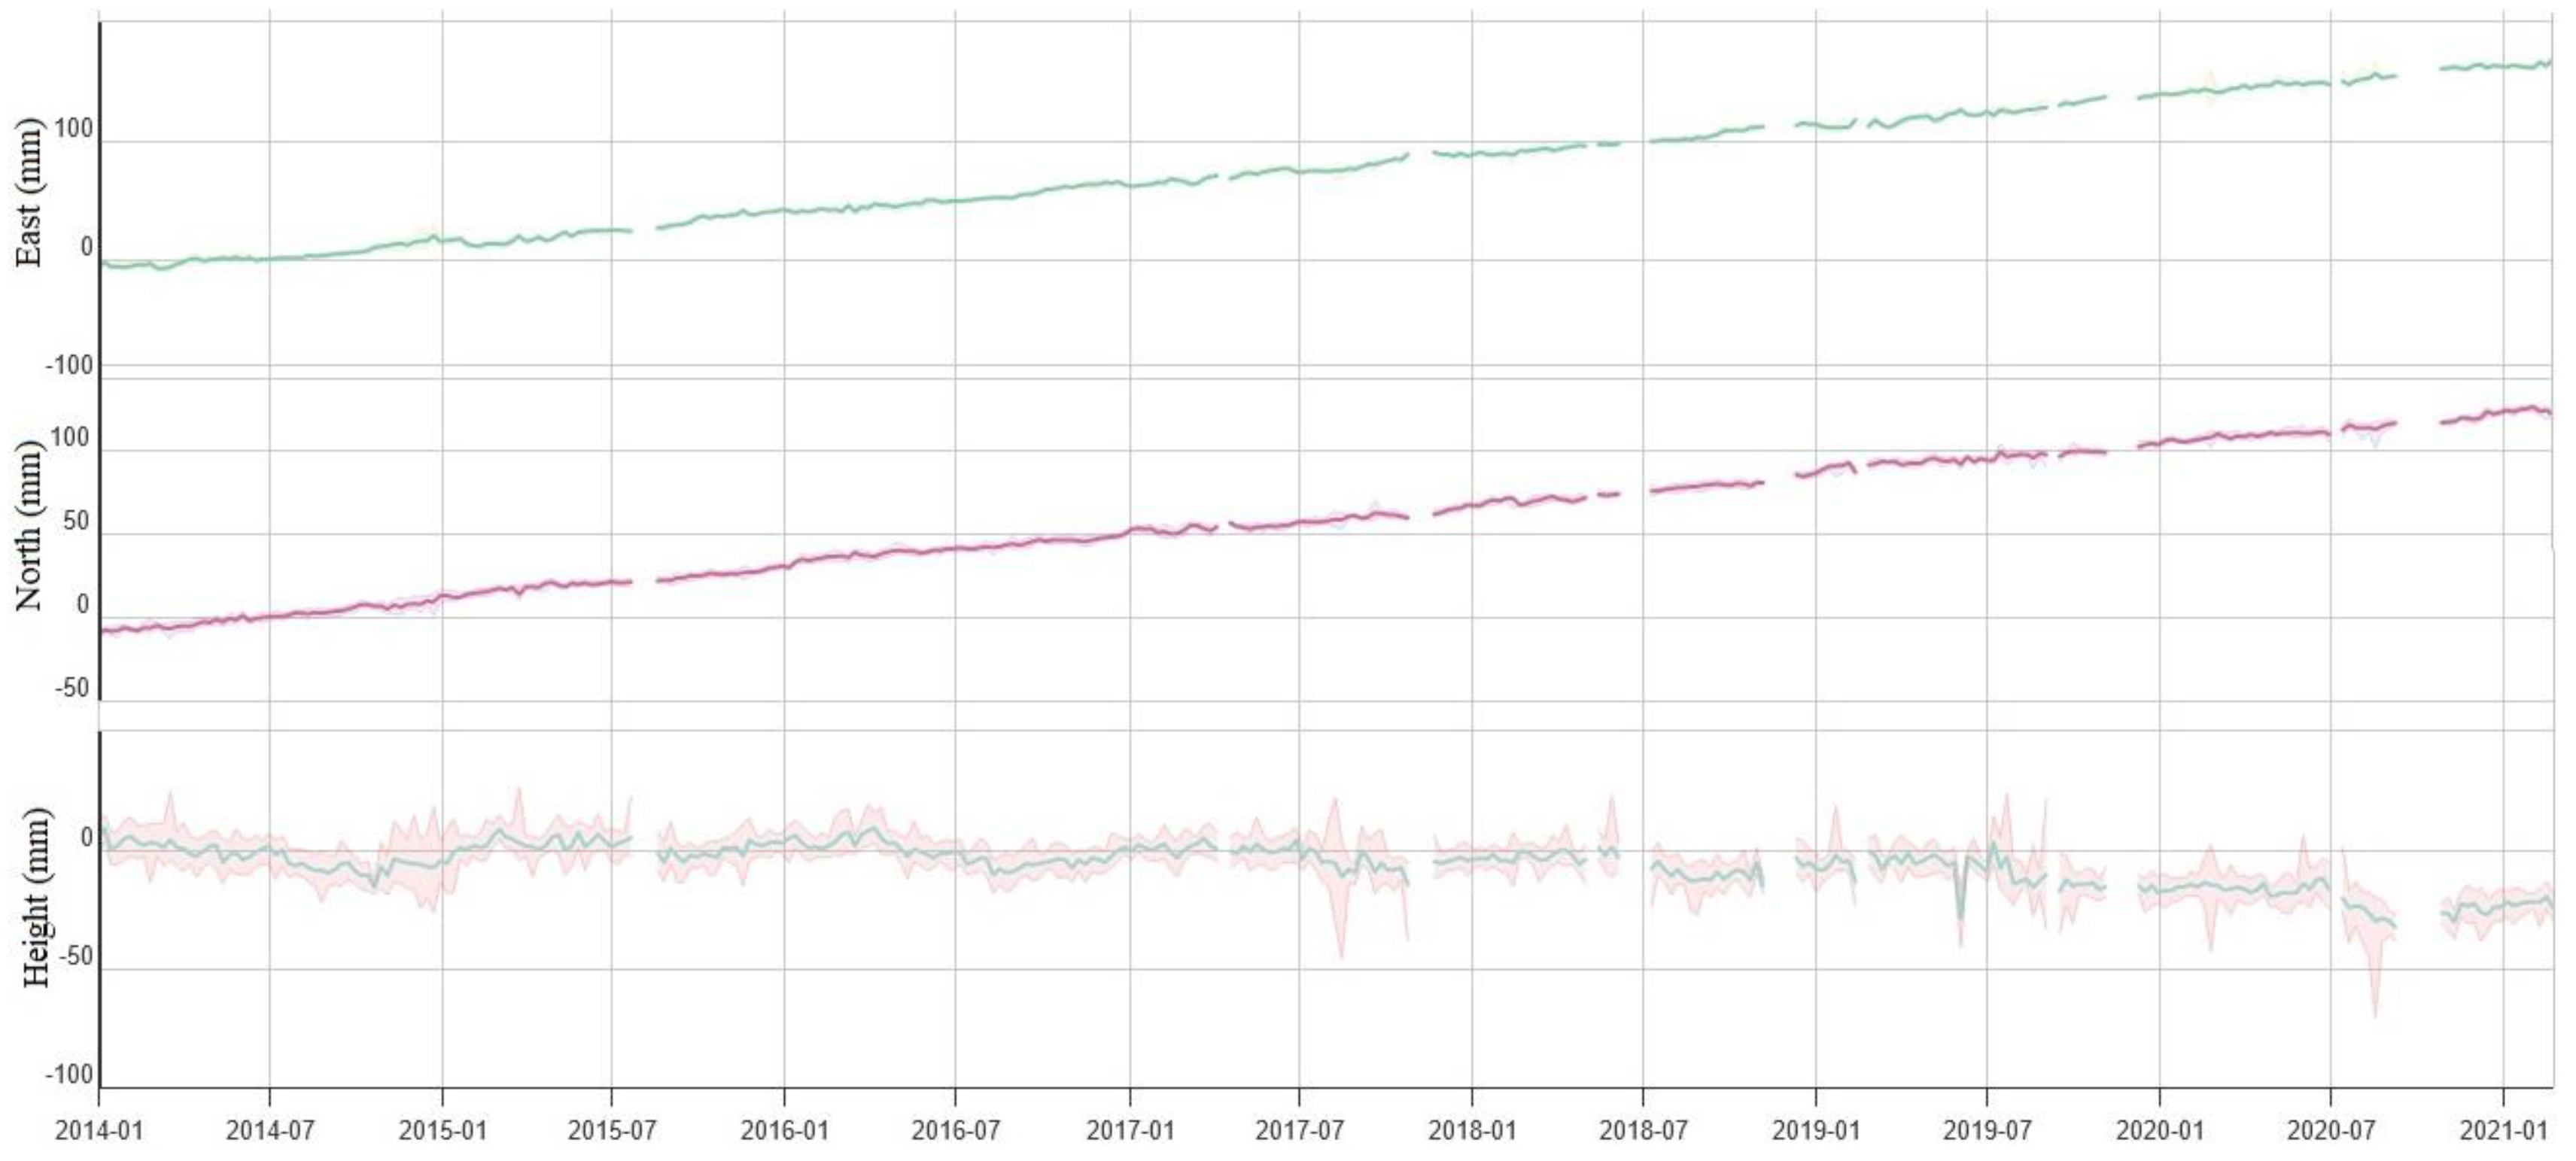
To validate and reinforce the findings obtained, a validation point was established utilizing the ADIS CORS station under the administration of the Institute of Geophysics, Space Science, and Astronomy at Addis Ababa University, as illustrated in Figure 3. Situated within the region identified as stable based on ADIS CORS and InSAR displacement outcomes, the ADIS station consistently depicts a negligible varying time series data pattern. Both datasets exhibit congruent characteristics, showcasing an absence of discernible vertical displacement and a consistent zero rate of displacement.
4. Discussion
The results of this study show that ground subsidence is continuous, particularly in the center of the analyzed area (in front of AA Bole International Airport), with a maximum vertical subsidence rate of -21.5 mm/year for the 2014–2021 period. The extent of the unstable area around the maximum deformation covers a large portion of the city's central core. PSI results show that most of the Bole, Saris, Akaki-Kality, Arabsa, and Ayat-Tafo areas are affected by subsidence rates ranging from -21.5 to -2.0 mm/year. If the regional natural subsidence given by tectonic forces is not considered, because its contribution can be neglected, the non-uniform distribution of the displacements can be attributed mainly to the variation in the loading of infrastructures, groundwater exploitation, and natural consolidation of the soil, after the impressive increase of the anthropic pressure in the last thirty years. The southeastern side of the city, where pellic-vertisols are present, is generally dominated by higher rates of displacement. On the other hand, the land subsidence is more intense on the northeastern side of the city, which is mainly made of chromic vertisols.
The presence of infrastructure built in the last 10 years may further contribute to the local acceleration of the settlement process. PSI detected high rates of subsidence due to the load applied by new constructions over the unconsolidated sediments. The long-time required for the consolidation of soils under the influence of an external load is a factor to consider for the assessment of potential damage to buildings and critical infrastructure [56]. A high rate of land subsidence affects many important communication routes to many villages, and the failure of one of these infrastructures could cause major environmental problems as well as a significant socioeconomic impact due to the interruption of activities and services, property damage, and repair work.
Mitigation measures and continuous monitoring are needed to avoid damages and irreversible consequences in the future. Identifying the cause of subsidence is crucial and it can be achieved by monitoring the groundwater level and the dynamics of land use and determining the thickness and geotechnical properties of soils.
Interferometric data enables the monitoring of the temporal evolution of subsidence and the exploration of its causes, particularly the construction of new buildings, which induces the consolidation of fine deposits [57,58]. This behavior has been observed in urbanization occurring at the border of the incision in Figure 5 and Figure 6. Here, the consolidation caused by the construction of new buildings can be entirely monitored through interferometry. The whole city experienced a great urban expansion 15 years ago. New urban settlements triggered the consolidation of alluvial deposits and became the optimal target for the Sentinel-1 acquisitions, which started on 23rd October 2014. In the following periods, urbanization was largely limited to new residential areas on the outskirts of the city and a few central parts. The development of buildings and maintenance and improvement of the road network has been effectively detected and monitored by the Sentinel-1 SAR sensor. The band and satellite revisiting times could influence the density of PSI points but indeed do not limit the potential to define the evolution of urbanization in the area under investigation.
The technique and analysis utilized in this work have an impact on the scientific contribution of remote sensing for managing land subsidence in the megacities of emerging countries, where there is a huge lack of geological and technical data, helping local administrators to put in place mitigation actions. Future research should continue to apply InSAR techniques by using both ascending and descending data for a reliable and accurate 3D analysis and long displacement time series that, together with in-situ measurements, will help to know the exact causes of the subsidence.
5. Conclusions
This paper determined the land subsidence rate in AA from October 2014 to January 2021 using Sentinel-1-based PSI techniques for the first time in this area. The results demonstrated that the maximum vertical subsidence rate of the study area is -21.5 mm/year. Moreover, some areas experienced severe ground settlement exceeding 134.6 mm, which is the maximum displacement at a point found in the Bole-Saris area. The main factors contributing to land subsidence include excessive groundwater extraction, intense sprawl urbanization, consolidation of alluvial soil, and tectonic activity. In addition, changes in land use and land cover from agricultural and forestland to settlement are other factors for land subsidence. The results revealed that the subsidence was more severe in existing urban areas near AA Bole International Airport and in the new residential areas where buildings and road networks are dense. Moreover, intense land subsidence ranging from -2 to -21 mm/year is observed in the rapidly urbanized areas of the eastern, central, and southern parts of the study area, including Ayat Tafo, Lebu, Torhailoch, Merkato, Saris, and Akaki-Kality. The results were assessed and validated using moderately precise GCPs (second-order geodetic networks), but future research needs to validate the conclusions. At the time of data collection, this study could not find an equal number of ascending (42) and descending (146) images for single-look complex (SLC) Sentinel-1 data. In the studied region, there is only one GNSS CORS, and it also lacks geological and technical data, as well as detailed field studies to assess the impact of land subsidence in the city.
Land subsidence affecting Addis Ababa can result in significant economic losses due to structural damage and high maintenance costs for roads, railways, dikes, pipelines, and other infrastructure. It has direct effects on infrastructure and indirect impacts on environmental and social issues, as seen in other megacities in emerging countries [59,60]. So, it is recommended to gather detailed data on soil thickness and its properties and extraction rate of groundwater, investigate physical and mechanical properties of deposits and geological processes, develop detailed geological, structural, hydrogeological, and tectonic maps, and conduct detailed geotechnical investigation of deep boreholes for a reliable and accurate result. It is also desirable to acquire SAR data through sensors with different wavelengths, covering long periods and collected in both ascending and descending orbits to better define the displacement fields.
Credit authorship contribution statement
Eyasu Alemu: Conceptualization, Formal Analysis, Methodology, Software, Validation, Writing—Original Draft Preparation, Writing—Review and Editing. Mario Floris: Formal Analysis, Software, Data Curation, Supervision, Validation, Writing—Review and Editing.
Declaration of Competing Interest
The authors declare that they have no known competing financial interests or personal relationships that could have appeared to influence the work reported in this paper.
Data availability
Data will be made available on request.
Acknowledgments
The authors thank the Alaska Satellite Facility Data Search Vertex (https://search.asf.alaska.edu/) for providing Sentinel-1A and UNAVCO (https://www.unavco.org/data/gps-gnss/data-access-methods/gnss-data-access-notebook/gnss-data-access-notebook.html) and Institute of Geophysics, Space Science and Astronomy (IGSSA) for archiving and providing GNSS data, respectively.
References
- Galloway, D.L., Burbey, T.J. Review: Regional land subsidence accompanying groundwater extraction. Hydrogeol J 2011, 19, 1459–1486. [CrossRef]
- Land subsidence is one of the world’s underrated problems, 2021, December 24. Deltares. https://www.deltares.nl/en/topdossiers/subsidence/.
- Kurz, T., Gloaguen, R., Ebinger, C., Casey, M., Abebe, B. Deformation distribution and type in the MER: A remote sensing study. J. Afr. Ear. Sci. 2007, 48(2–3), 100–114. [CrossRef]
- Agostini, A., Bonini, M., Corti, G., Sani, F., Manetti, P. Distribution of Quaternary deformation in the central Main Ethiopian Rift, East Africa. Tectonics 2011, 30(4), n/a. [CrossRef]
- Navarro-Hernández, M.I., Tomás, R., Lopez-Sanchez, J.M., Cárdenas-Tristán, A., Mallorquí, J.J. Spatial Analysis of Land Subsidence in the San Luis Potosi Valley Induced by Aquifer Overexploitation Using the Coherent Pixels Technique (CPT) and Sentinel-1 InSAR Observation. Remote Sensing 2020, 12(22), 3822. [CrossRef]
- Crosetto, M., Monserrat, O., Iglesias, R., Crippa, B. Persistent Scatterer Interferometry. Photogrammetric Engineering & Remote Sensing 2010, 79(9), 1061–1069. [CrossRef]
- Bru, G., González, P.J., Mateos, R.M., Roldán, F.J., Herrera, G., Béjar-Pizarro, M., Fernández, J. A-DInSAR Monitoring of Landslide and Subsidence Activity: A Case of Urban Damage in Arcos de la Frontera, Spain. Remote Sensing 2017, 9(8), 787. [CrossRef]
- Bovenga, F., Wasowski, J., Nitti, D.O., Nutricato, R., Chiaradia, M.T.. Using COSMO-SkyMed X-band and ENVISAT C band SAR interferometry for landslides analysis, Remote Sens. Environ. 2012, 119, 272–285.
- García-Davalillo, J.C., Herrera, G., Notti, D., Strozzi, T., Álvarez-Fernández, I. DInSAR analysis of ALOS PALSAR images for the assessment of very slow landslides: the Tena Valley case study. Landslides 2014, 11(2), 225–246.
- Ma, P., Cui, Y., Wang, W., Lin, H., Zhang, Y., & Zheng, Y. Landslide Movement Monitoring with InSAR Technologies. In Y. Zhang, & Q. Cheng (Eds.), Landslides. IntechOpen 2022. [CrossRef]
- Mohsen P., Ali M., Saied P. & Reza D. Monitoring of Maskun landslide and determining its quantitative relationship to different climatic conditions using D-InSAR and PSI techniques, Geomatics, Natural Hazards and Risk 2022, 13:1, 1134-1153. [CrossRef]
- Bell, J.W., Amelung, F., Ferretti, A., Bianchi, M., Novali, F. Permanent scatterer InSAR reveals seasonal and long-term aquifer-system response to groundwater pumping and artificial recharge, Water Resour. Res. 2008, 44, W02407. [CrossRef]
- Heleno, S.I.N., Oliveira, L.G.S., Henriques, M.J., Falcão, A.P., Lima, J.N.P., Cooksley, G., Ferretti, A., Fonseca, A.M., Lobo- Ferreira, J.P., Fonseca, J.F.B.D. Persistent Scatterers Interferometry detects and measures ground subsidence in Lisbon, Remote Sens. Environ. 2011, 115, 2152–2167.
- Rafiei, F., Gharechelou, S., Golian, S., Johnson, B.A. Aquifer and Land Subsidence Interaction Assessment Using Sentinel-1 Data and DInSAR Technique. ISPRS Int. J. Geo-Inf. 2022, 11, 495. [CrossRef]
- Xiao, B., Zhao, J., Li, D., Zhao, Z., Xi, W., Zhou, D. The Monitoring and Analysis of Land Subsidence in Kunming (China) Supported by Time Series InSAR. Sustainability 2022, 14, 12387. [CrossRef]
- Jung, H., Kim, S., Jung, H., Min, K, Won, J. Satellite observation of coal mining subsidence by permanent scatterer analysis, Eng. Geol. 2007, 92, 1–13.
- Escayo, J., Marzan, I., Martí, D., Tornos, F., Farci, A., Schimmel, M., Carbonell, R., Fernández, J. Radar Interferometry as a Monitoring Tool for an Active Mining Area Using Sentinel-1 C-Band Data, Case Study of Riotinto Mine. Remote Sensing 2022, 14, 3061. [CrossRef]
- Vallone, P., Giammarinaro, M.S., Crosetto, M., Agudo, M., Biescas, E. Ground motion phenomena in Caltanissetta (Italy) investigated by InSAR and geological data integration, Eng. Geol. 2008, 98, 144–155.
- Cigna, F., Osmanoglu, B., Cabral-Cano, E., Dixon, T.H., Ávila-Olivera, J.A., Garduño-Monroy, V.H., DeMets, C., Wdowinski, S. Monitoring land subsidence and its induced geological hazard with Synthetic Aperture Radar Interferometry: A case study in Morelia, Mexico, Remote Sens. Environ. 2012, 117, 146–161.
- Reyes-Carmona, C., Herrera, G., Galve, J.P., Solari, L., Mateos, R. M., Azañón, J.M., Béjar-Pizarro, M., López-Vinielles, J., Palamà, R., Crosetto, M., Sarro, R., Cuervas-Mons, J., & Monserrat, O. From satellite interferometry displacements to potential damage maps: A tool for risk reduction and urban planning. Remote Sensing of Environment 2022, 282, 113294. [CrossRef]
- Dalla, Via, G., Crosetto, M., Crippa, B. Resolving vertical and east-west horizontal motion from differential interferometric synthetic aperture radar: the L’Aquila earthquake. J. Geophys. Res.: Solid Earth (1978–2012) 2012, 117(B2).
- Fang, H.; Shao, Y.; Xie, C.; Tian, B.; Zhu, Y.; Guo, Y.; Yang, Q.; Yang, Y. Using Persistent Scatterer Interferometry for Post-Earthquake Landslide Susceptibility Mapping in Jiuzhaigou. Appl. Sci. 2022, 12, 9228. [CrossRef]
- Antonielli, B., Monserrat, O., Bonini, M., Righini, G., Sani, F., Luzi, G., Feyzullayev, A.A., Aliyev, C.S. Pre-eruptive ground deformation of Azerbaijan mud volcanoes detected through satellite radar interferometry (DInSAR). Tectonophysics 2014, 637, 163–177.
- Richter, N., & Froger, J.L. The role of Interferometric Synthetic Aperture Radar in Detecting, Mapping, Monitoring, and Modelling the Volcanic Activity of Piton de la Fournaise, La Réunion: A Review. Remote Sensing 2020, 12(6), 1019. [CrossRef]
- Rignot, E.J., Gogineni, S.P., Krabill, W.B., Ekholm, S. North and northeast Greenland ice discharge from satellite radar interferometry. Science 1997, 276(5314), 934–937.
- Dammann, D.O., Johnson, M.A., Fedders, E.R., Mahoney, A.R., Werner, C.L., Polashenski, C.M., Meyer, F.J., & Hutchings, J.K. Ground-Based Radar Interferometry of Sea Ice. Remote Sensing 2020, 13(1), 43. [CrossRef]
- Amelung, F., Galloway, D.L., Bell, J.W., Zebker, H.A., Laczniak, R.J. Sensing the ups and downs of Las Vegas: InSAR reveals structural control of land subsidence and aquifer-system deformation. Geology 1999, 27(6), 483–486.
- Li, G., Zhao, C., Wang, B., Liu, X., Chen, H. Land Subsidence Monitoring and Dynamic Prediction of Reclaimed Islands with Multi-Temporal InSAR Techniques in Xiamen and Zhangzhou Cities, China. Remote Sensing 2022, 14, 2930. [CrossRef]
- Raspini, F., Caleca, F., Del Soldato, M., Festa, D., Confuorto, P., & Bianchini, S. (2022). Review of satellite radar interferometry for subsidence analysis. Earth-Science Reviews, 235, 104239. [CrossRef]
- Ferretti, A., Prati, C., Rocca, F. Permanent scatterers in SAR interferometry. IEEE Transactions on Geoscience and Remote Sensing 2001, 39(1), 8–20. [CrossRef]
- Crosetto, M., Monserrat, O., Cuevas-González, M., Devanthéry, N. Persistent Scatterer Interferometry: a review. Photogram. Eng. Remote Sensing 2015, 115, 78-89. [CrossRef]
- Hamling, I.J., Wright, T.J., Calais, E., Lewi, E., Fukahata, Y. InSAR observations of post-rifting deformation around the Dabbahu rift segment, Afar, Ethiopia. Geophysical Journal International 2014, 197(1), 33–49. [CrossRef]
- Pagli, C., Wang, H., Wright, T.J., Calais, E., Lewi, E. Current plate boundary deformation of the Afar rift from a 3-D velocity field inversion of InSAR and GPS. Journal of Geophysical Research: Solid Earth 2014, 119(11), 8562–8575. [CrossRef]
- Mengistu, F., Suryabhagavan, K., Raghuvanshi, T.K., Lewi, E. Landslide Hazard Zonation and Slope Instability Assessment using Optical and InSAR Data: A Case Study from Gidole Town and its Surrounding Areas, Southern Ethiopia. Remote Sensing of Land 2019, 3(1), 1–14. [CrossRef]
- Biggs, J., Bastow, I.D., Keir, D., Lewi, E. Pulses of deformation reveal frequently recurring shallow magmatic activity beneath the Main Ethiopian Rift, Geochem. Geophys. Geosyst. 2011, 12, Q0AB10. [CrossRef]
- Kebede, S. Groundwater in Ethiopia. Springer Hydrogeology 2013, Heidelberg. [CrossRef]
- Biruk, 2020. Types of Soil of Addis Ababa for Seismic amplification, Unpublished PhD dissertation, Addis Ababa University, Addis Ababa, Ethiopia.
- Berardino, P., Fornaro, G., Lanari, R., Member, S., Sansosti, E., Member, S., 2002. A New Algorithm for Surface Deformation Monitoring Based on Small Baseline Differential SAR Interferograms, IEEE Trans. Geosci. Remote Sensing 2002, 40, 2375–2383.
- Crosetto, M., Monserrat, O., Devanthéry, N., Cuevas-González, M., Barra, A., and Crippa, B. Persistent Scatterer Interferometry Using Sentinel-1 Data. The International Archives of the Photogrammetry, Remote Sensing and Spatial Information Sciences, 2016, XLI-B7, 835–839. [CrossRef]
- Ng, A.H.M., Ge, L., Li, X., Abidin, H.Z., Andreas, H., and Zhang, K. Mapping land subsidence in Jakarta, Indonesia using persistent scatterer interferometry (PSI) technique with ALOS PALSAR. International Journal of Applied Earth Observation and Geoinformation 2012, 18, 232–242. [CrossRef]
- Yan, D., Zeng, Q., Guo, X., and Ge, D. PSI analyses of land subsidence due to industrial structure near the city of Hangzhou, China. 2012 IEEE International Geoscience and Remote Sensing Symposium. Published. [CrossRef]
- Davila-Hernandez, N., Madrigal, D., Exposito, J.L., and Antonio, X. Multi-Temporal Analysis of Land Subsidence in Toluca Valley (Mexico) through a Combination of Persistent Scatterer Interferometry (PSI) and Historical Piezometric Data. Advances in Remote Sensing 2014, 03(02), 49–60. [CrossRef]
- Khorrami, M., Abrishami, S., Maghsoudi, Y., Alizadeh, B., and Perissin, D. Extreme subsidence in a populated city (Mashhad) detected by PSInSAR considering groundwater withdrawal and geotechnical properties. Scientific Reports 2020, 10(1). [CrossRef]
- Poreh, D., Pirasteh, S., and Cabral-Cano, E. Assessing subsidence of Mexico City from InSAR and LandSat ETM+ with CGPS and SVM. Geoenvironmental Disasters 2021, 8(1). [CrossRef]
- Monserrat, O., Crosetto, M., Cuevas, M., Crippa, B. The thermal expansion component of Persistent Scatterer Interferometry observations. IEEE Geosci. Remote Sens. Lett. 2011, 8,864–868.
- van Leijen, F. Persistent Scatterer Interferometry based on geodetic estimation theory. Doctoral dissertation. TU Delft, Delft University of Technology, 2014.
- Morishita, Yu, and Ramon F. Hanssen. "Temporal decorrelation in L-, C-, and X-band satellite radar interferometry for pasture on drained peat soils." IEEE Transactions on Geoscience and Remote Sensing 2015, 53(2), 1096-1104.
- Devanthéry, N., Crosetto, M., Monserrat, O., Cuevas-González, M., and Crippa, B. An approach to Persistent Scatterer Interferometry, Remote Sensing 2014, 6(7), 6662-6679.
- Ferretti, A., Savio, G., Barzaghi, R., Borghi, A., Musazzi, S., Novali, F., Prati, C., Rocca, F. Submillimeter accuracy of InSAR time series: experimental validation. IEEE TGRS 2007, 45(5), 1142–1153.
- Busho, S.W., Wendimagegn, G.T., Muleta, A.T. Quantifying spatial patterns of urbanization: growth types, rates, and changes in Addis Ababa City from 1990 to 2020. Spatial Information Research 2021, 29(5), 699–713. [CrossRef]
- Casu, F., Manconi, A., Pepe, A., Lanari, R. Deformation time-series generation in areas characterized by large displacement dynamics: the SAR amplitude pixel-offset SBAS technique. IEEE TGRS 2011, 49(7), 2752–2763.
- Bateson, L., Novali, F., Cooksley, G. Terrafirma user guide: a guide to the use and understanding of Persistent Scatterer Interferometry in the detection and monitoring of terrain-motion. Terrafirma project 2010. ESRIN/Contract no. 19366/05/I-E, available on-line at <www.terrafirma.eu.com/users.htm>.
- Ferretti, A., Perissin, D., Prati, C., Rocca, F. On the physical nature of SAR permanent scatterers. In: Proceedings of URSI Commission F Symposium on Microwave Remote Sensing of the Earth, Oceans, Ice and Atmosphere, Ispra, Italy, 2005.
- Perissin, D., Rocca, F. High-accuracy urban DEM using permanent scatterers. IEEE TGRS 2006, 44(11), 3338–3347.
- Crosetto, M., Biescas, E., Duro, J., Closa, J., Arnaud, A. Generation of advanced ERS and Envisat interferometric SAR products using the stable point network technique. Photogram. Eng. Remote Sensing 2008a, 74(4), 443–450.
- Fiaschi, S., Fabris, M., Floris, M., Achilli, V. Estimation of land subsidence in deltaic areas through differential SAR interferometry: the Po River Delta case study (Northeast Italy). International Journal of Remote Sensing 2018, 39(23), 8724–8745. [CrossRef]
- Terzaghi, K., Peck, R.B. Soil Mechanics in Engineering Practice; John Wiley & Sons: New York 1967.
- Lambe, T.W., Whitman, R.V. Soil Mechanics; John Wiley & Sons: New York, NY, USA 1979, pp: 505.
- Abidin, H.Z., Andreas, H., Gumilar, I., Fukuda, Y., Pohan, Y.E., and Deguchi, T. Land subsidence of Jakarta (Indonesia) and its relation with urban development. Natural Hazards 2021, 59(3), 1753–1771. [CrossRef]
- Hasibuan, H.S., Tambunan, R.P., Rukmana, D., Permana, C.T., Elizandri, B.N., Putra, G.A.Y., Wahidah, A.N., Ristya, Y. Policymaking and the spatial characteristics of land subsidence in North Jakarta. City and Environment Interactions 2023, 18:100103. [CrossRef]
Figure 1.
Topographic map and ground control points (red points) (a) [Prepared using Generic Mapping Tools v6]; Simplified Geological and Tectonic sketch of AA (b) [Digitized, Extracted and Modiefied from Ethiopian Geological Institute].
Figure 1.
Topographic map and ground control points (red points) (a) [Prepared using Generic Mapping Tools v6]; Simplified Geological and Tectonic sketch of AA (b) [Digitized, Extracted and Modiefied from Ethiopian Geological Institute].
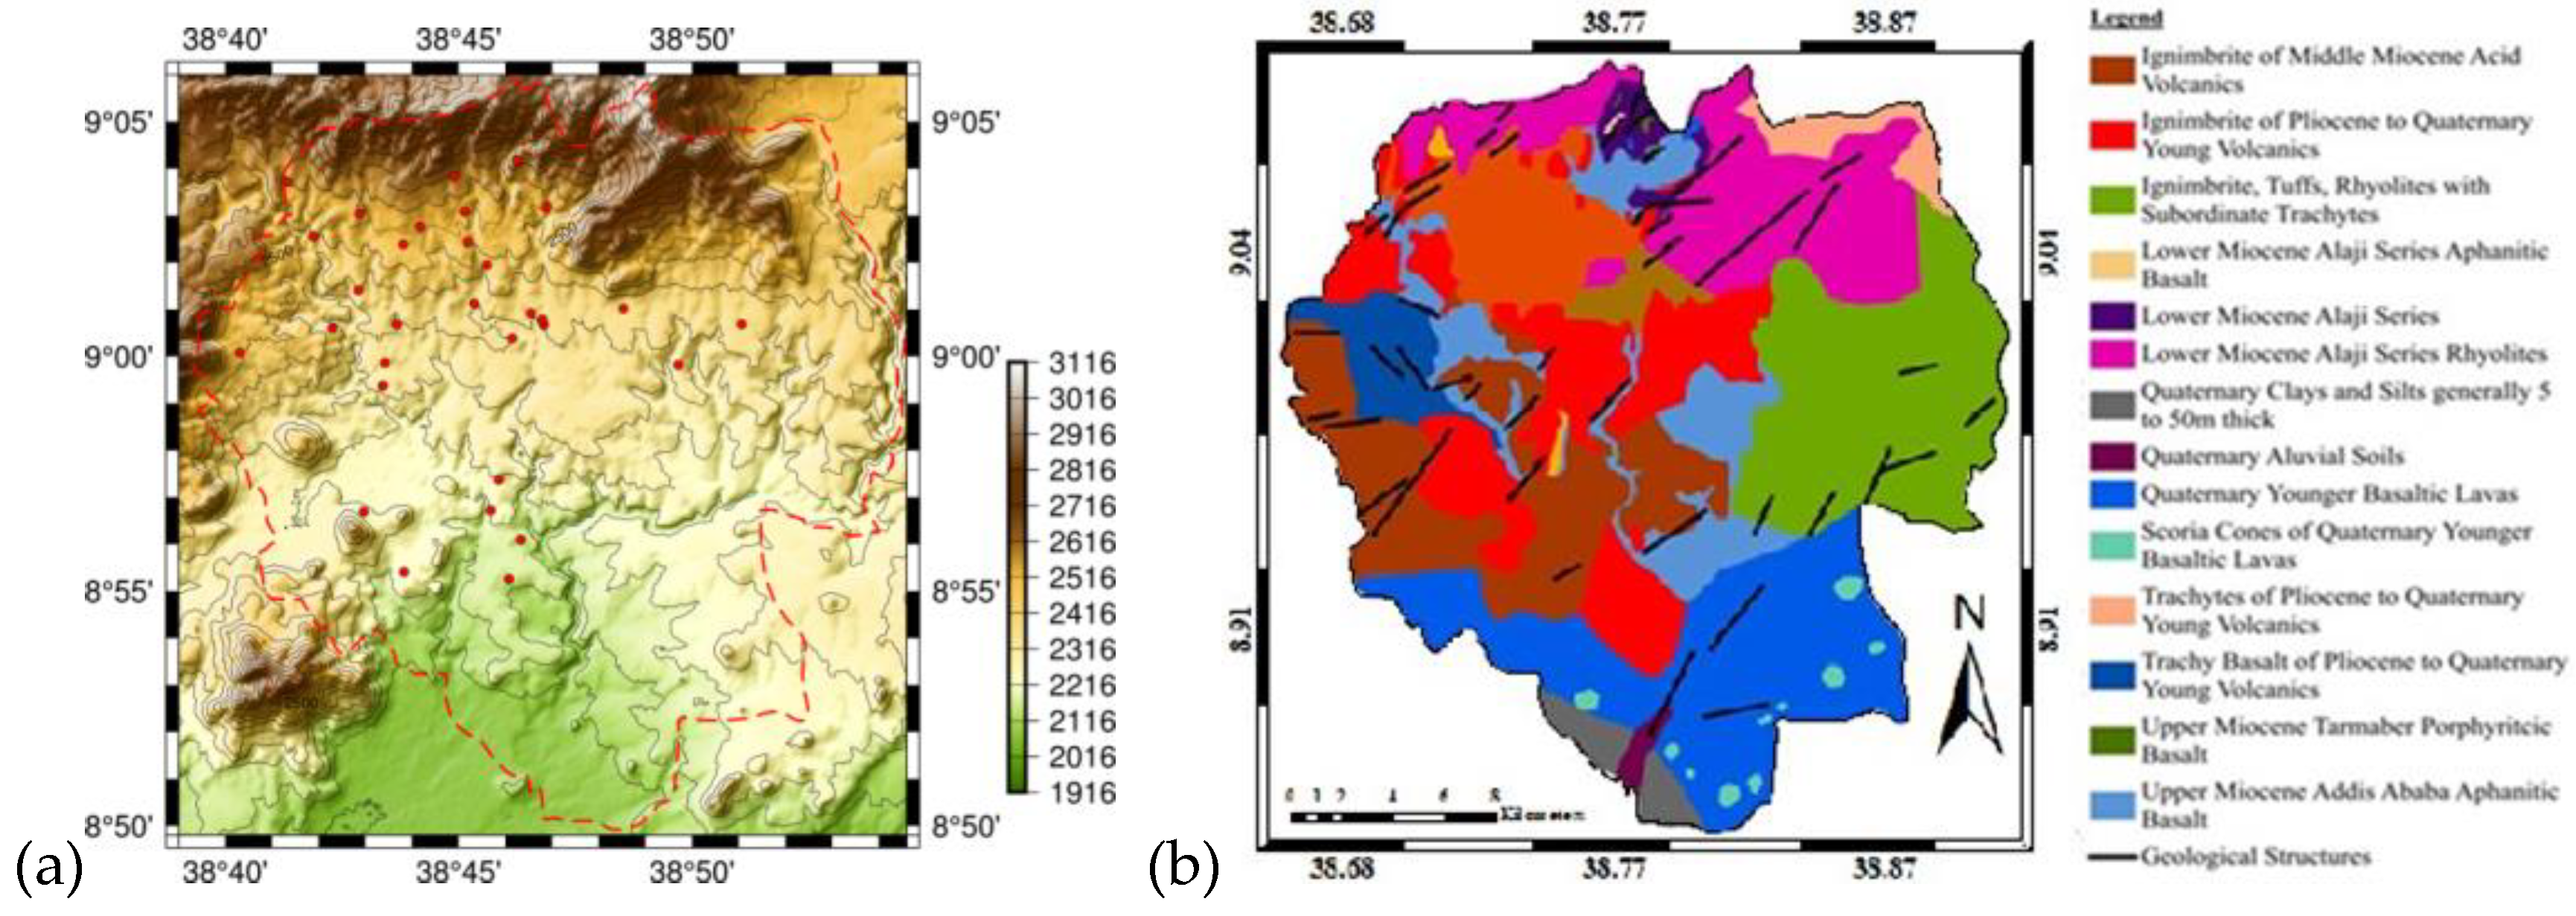
Figure 2.
Digital soil map of AA (extracted from FAO/UNESCO Soil Map of the World).
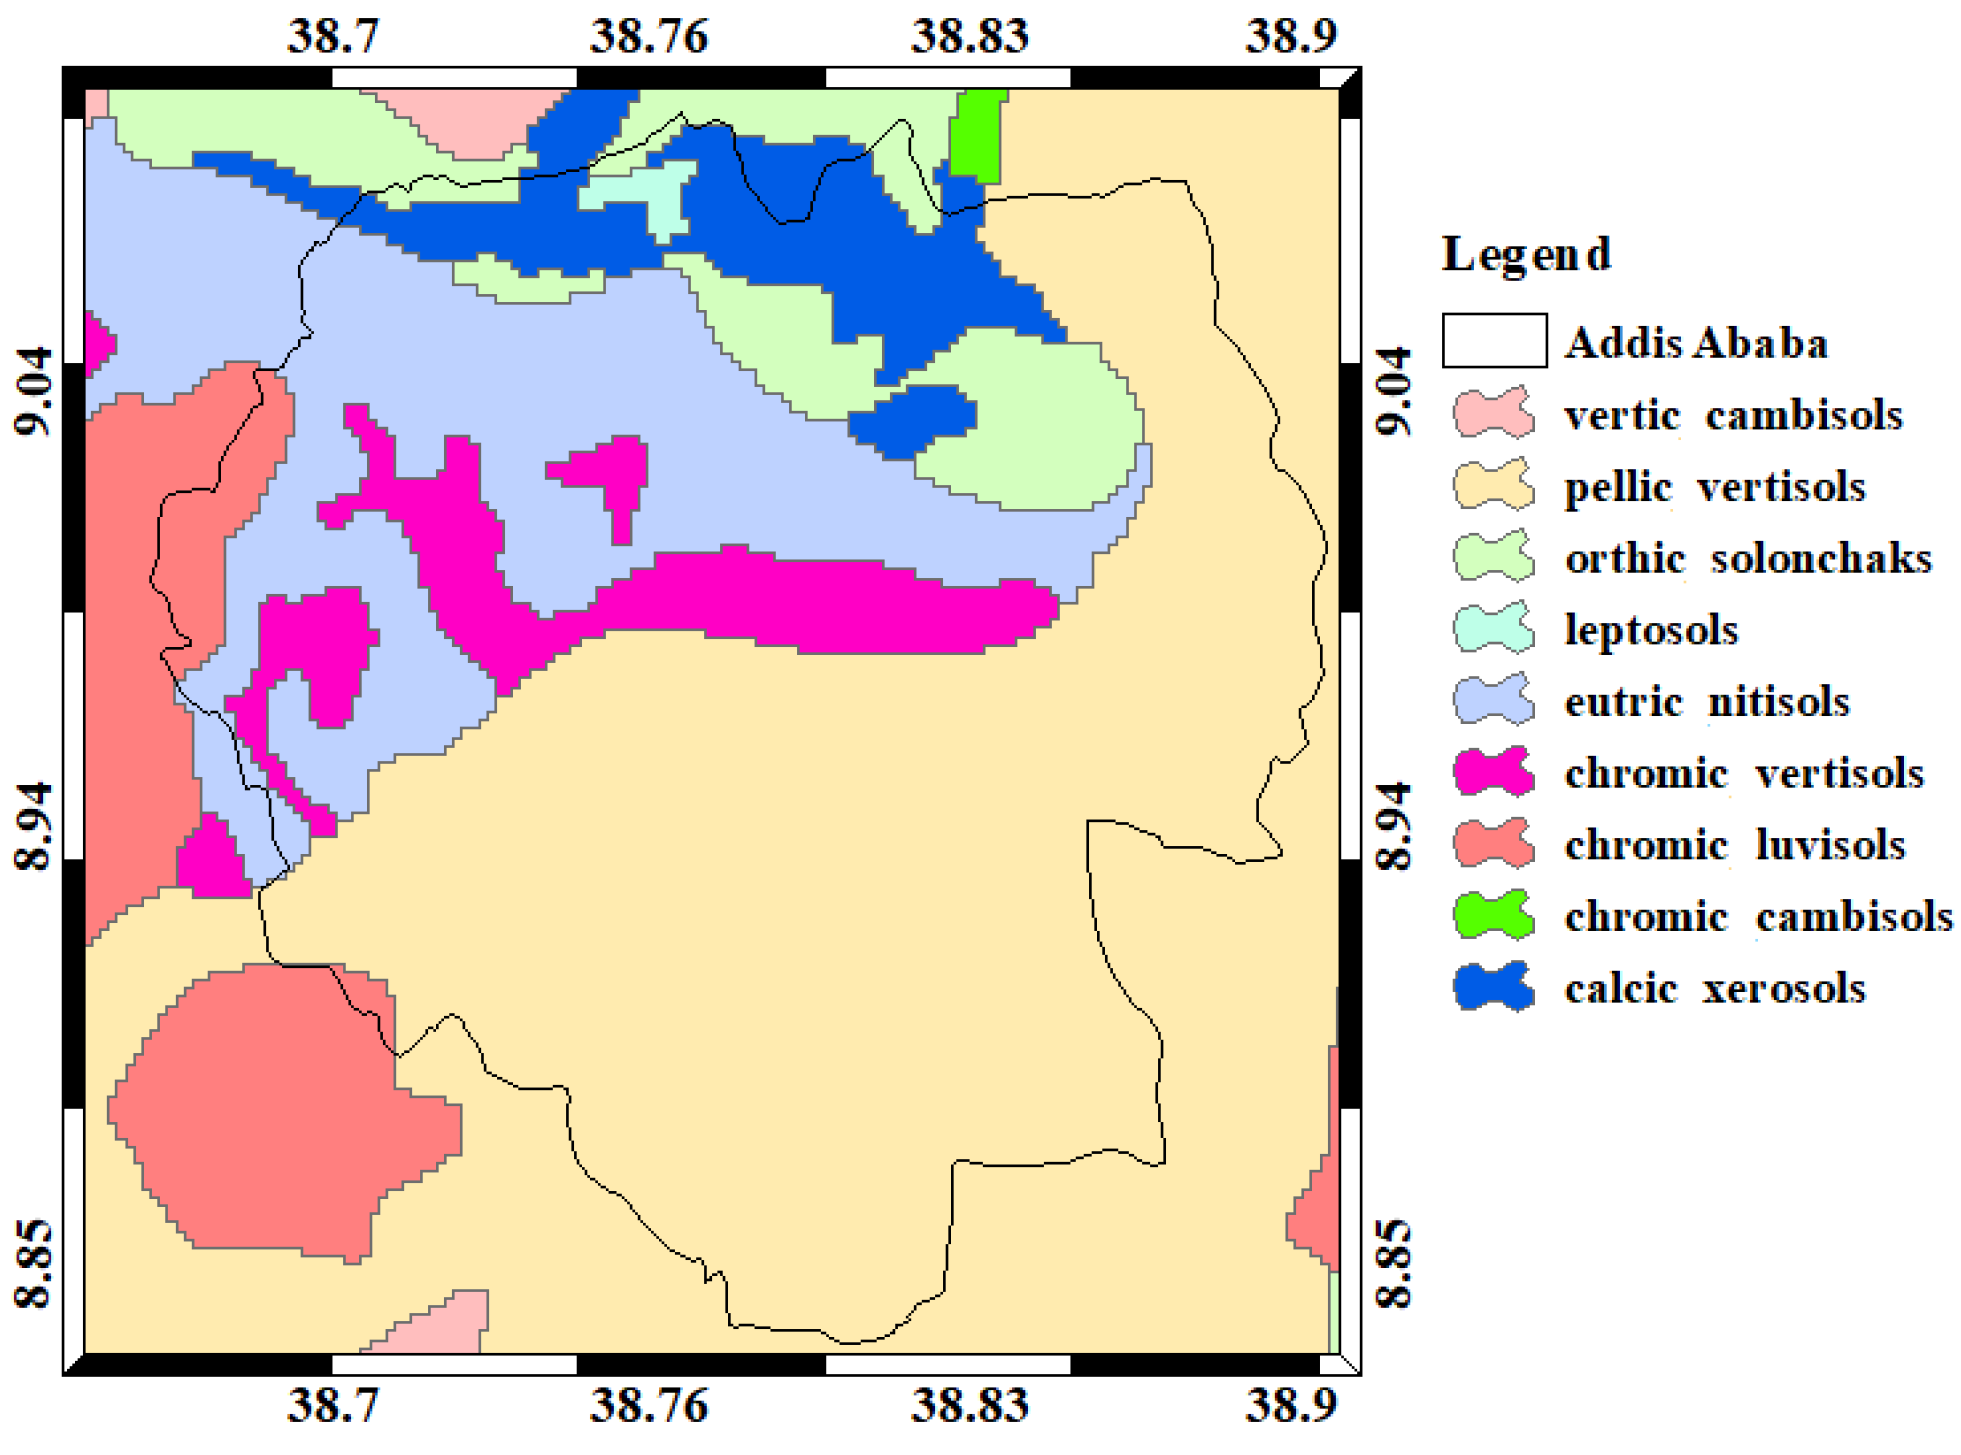
Figure 3.
Vertical velocity map derived by the PSI processing of descending Sentinel-1 images (A = Bole-Saris, B = Ayat-Arabsa, C = Akaki-Kality, D = Atena Tera, E = Kotebe, and F = Kolfe-Keraniyo).
Figure 3.
Vertical velocity map derived by the PSI processing of descending Sentinel-1 images (A = Bole-Saris, B = Ayat-Arabsa, C = Akaki-Kality, D = Atena Tera, E = Kotebe, and F = Kolfe-Keraniyo).
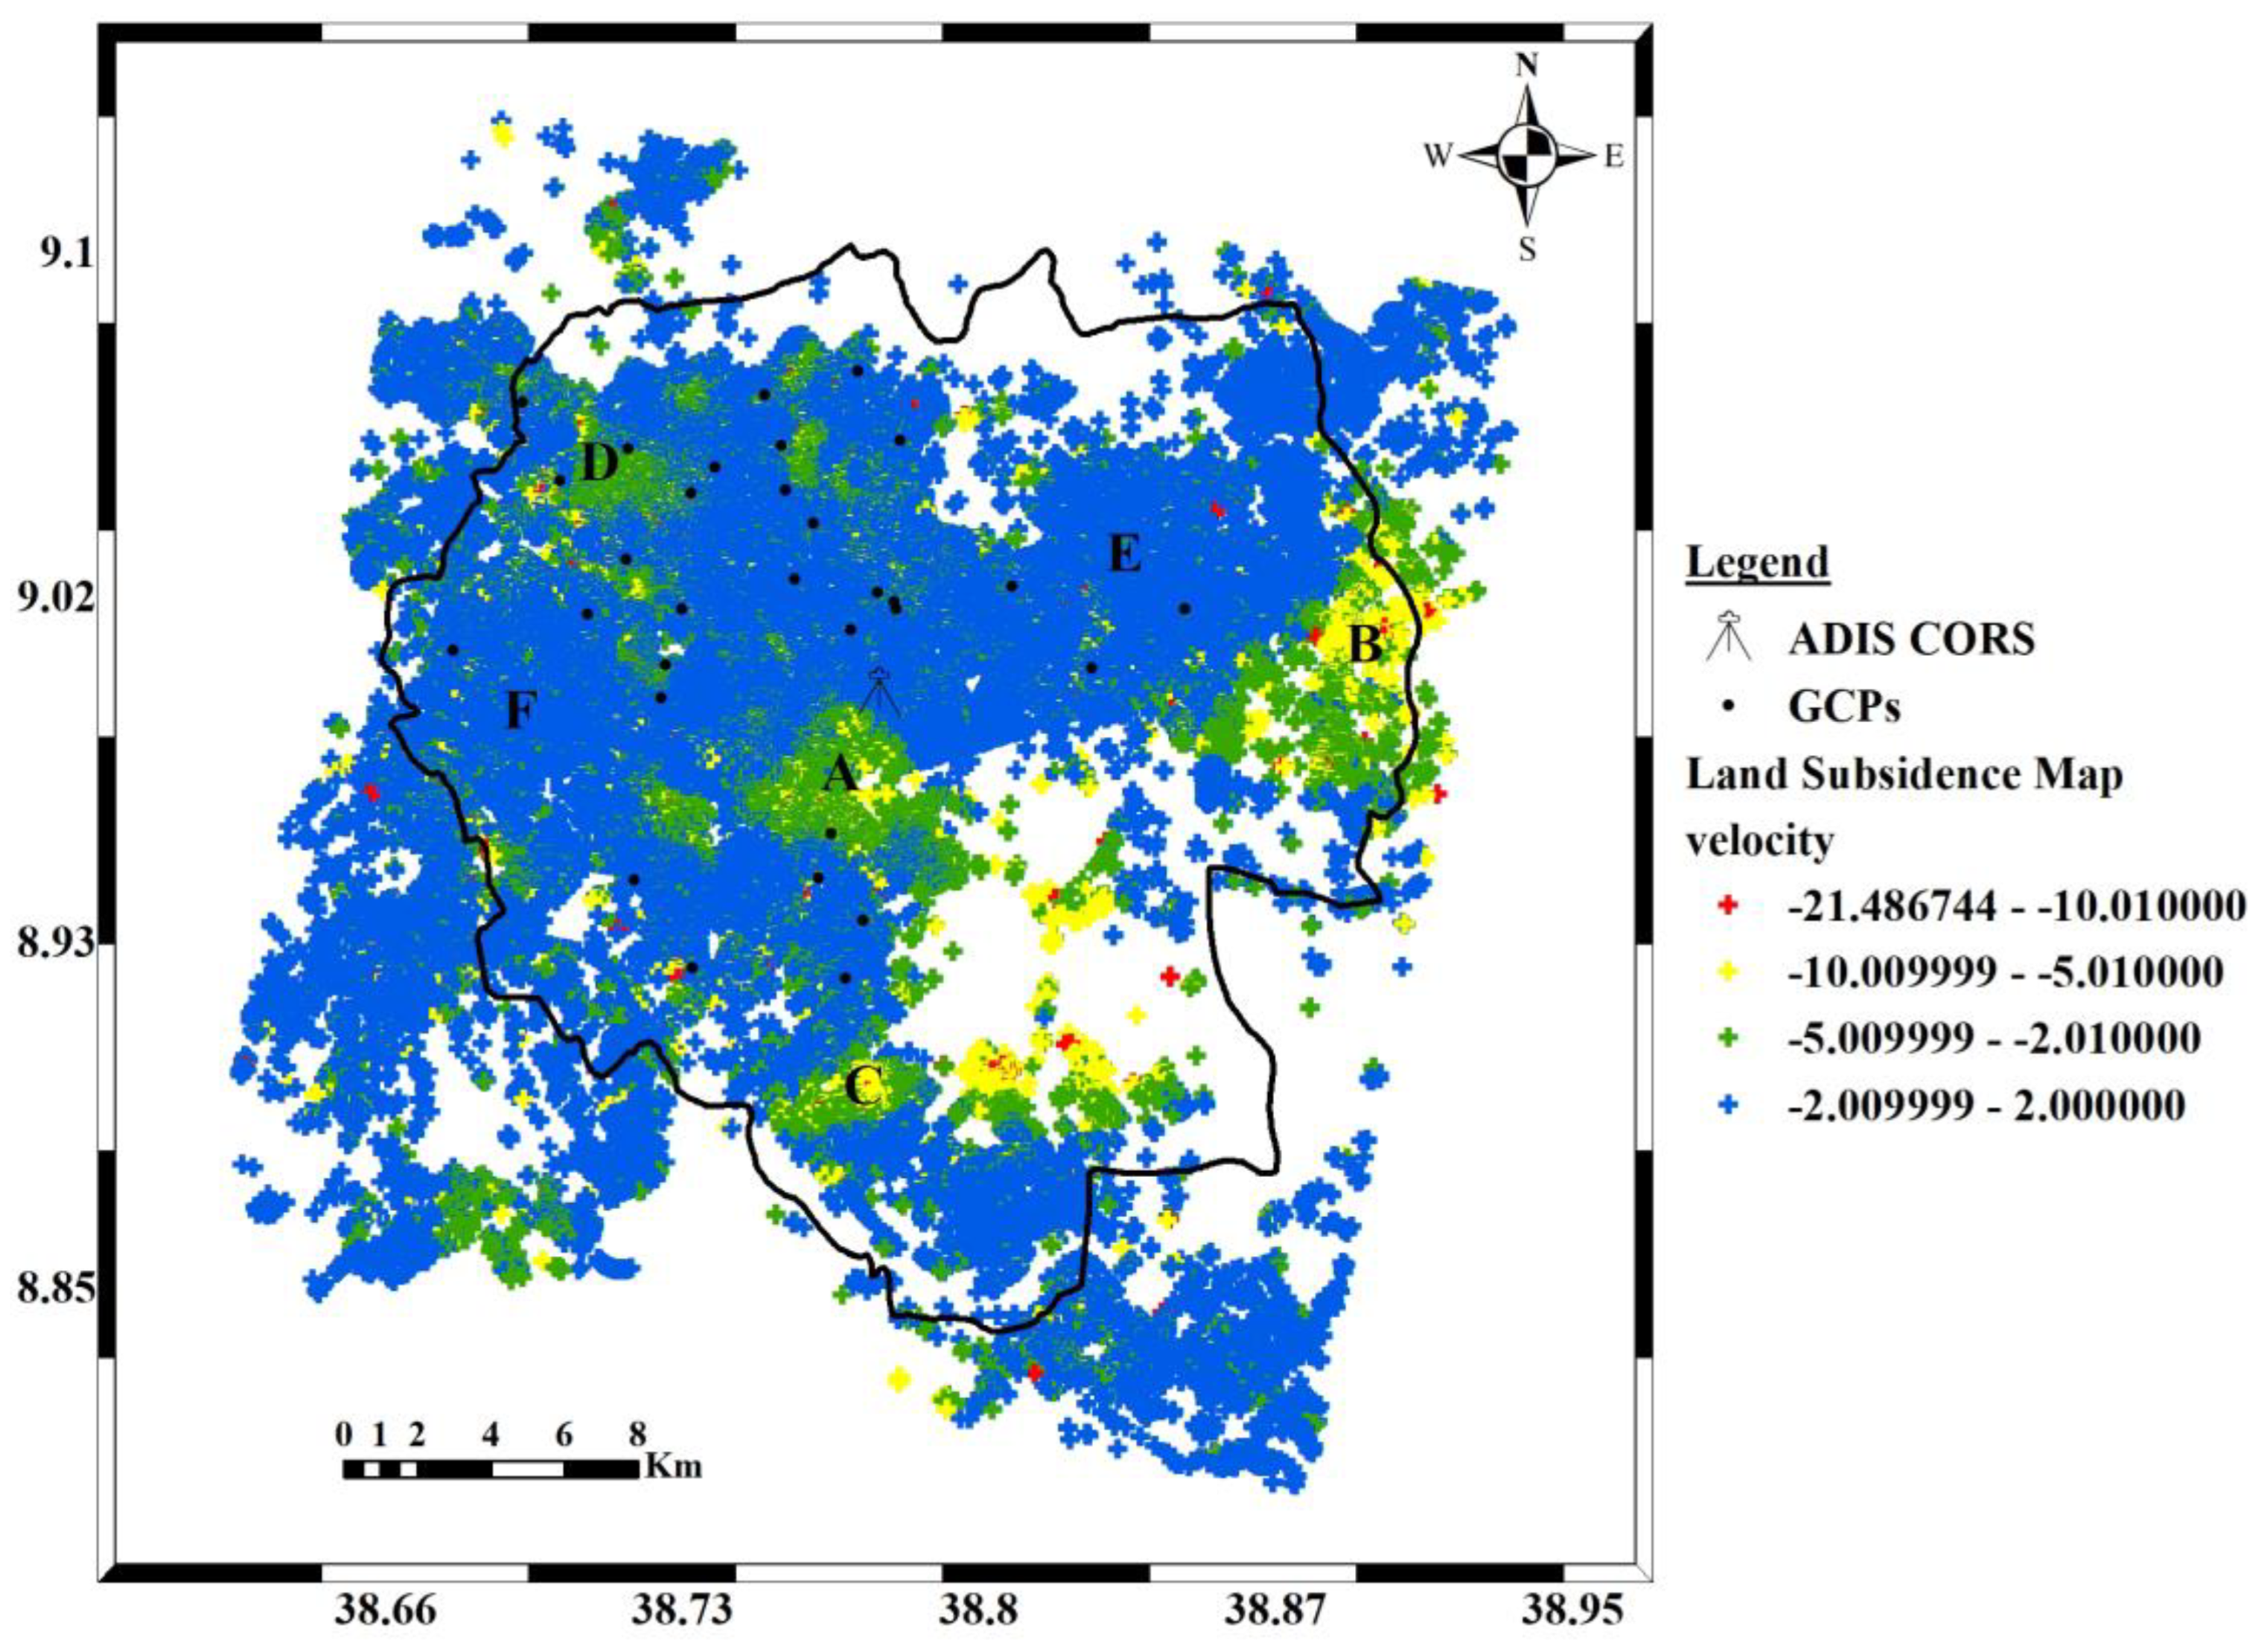
Figure 4.
AA urban expansion in the period 1990-2020 (modified from [50]).
Figure 4.
AA urban expansion in the period 1990-2020 (modified from [50]).
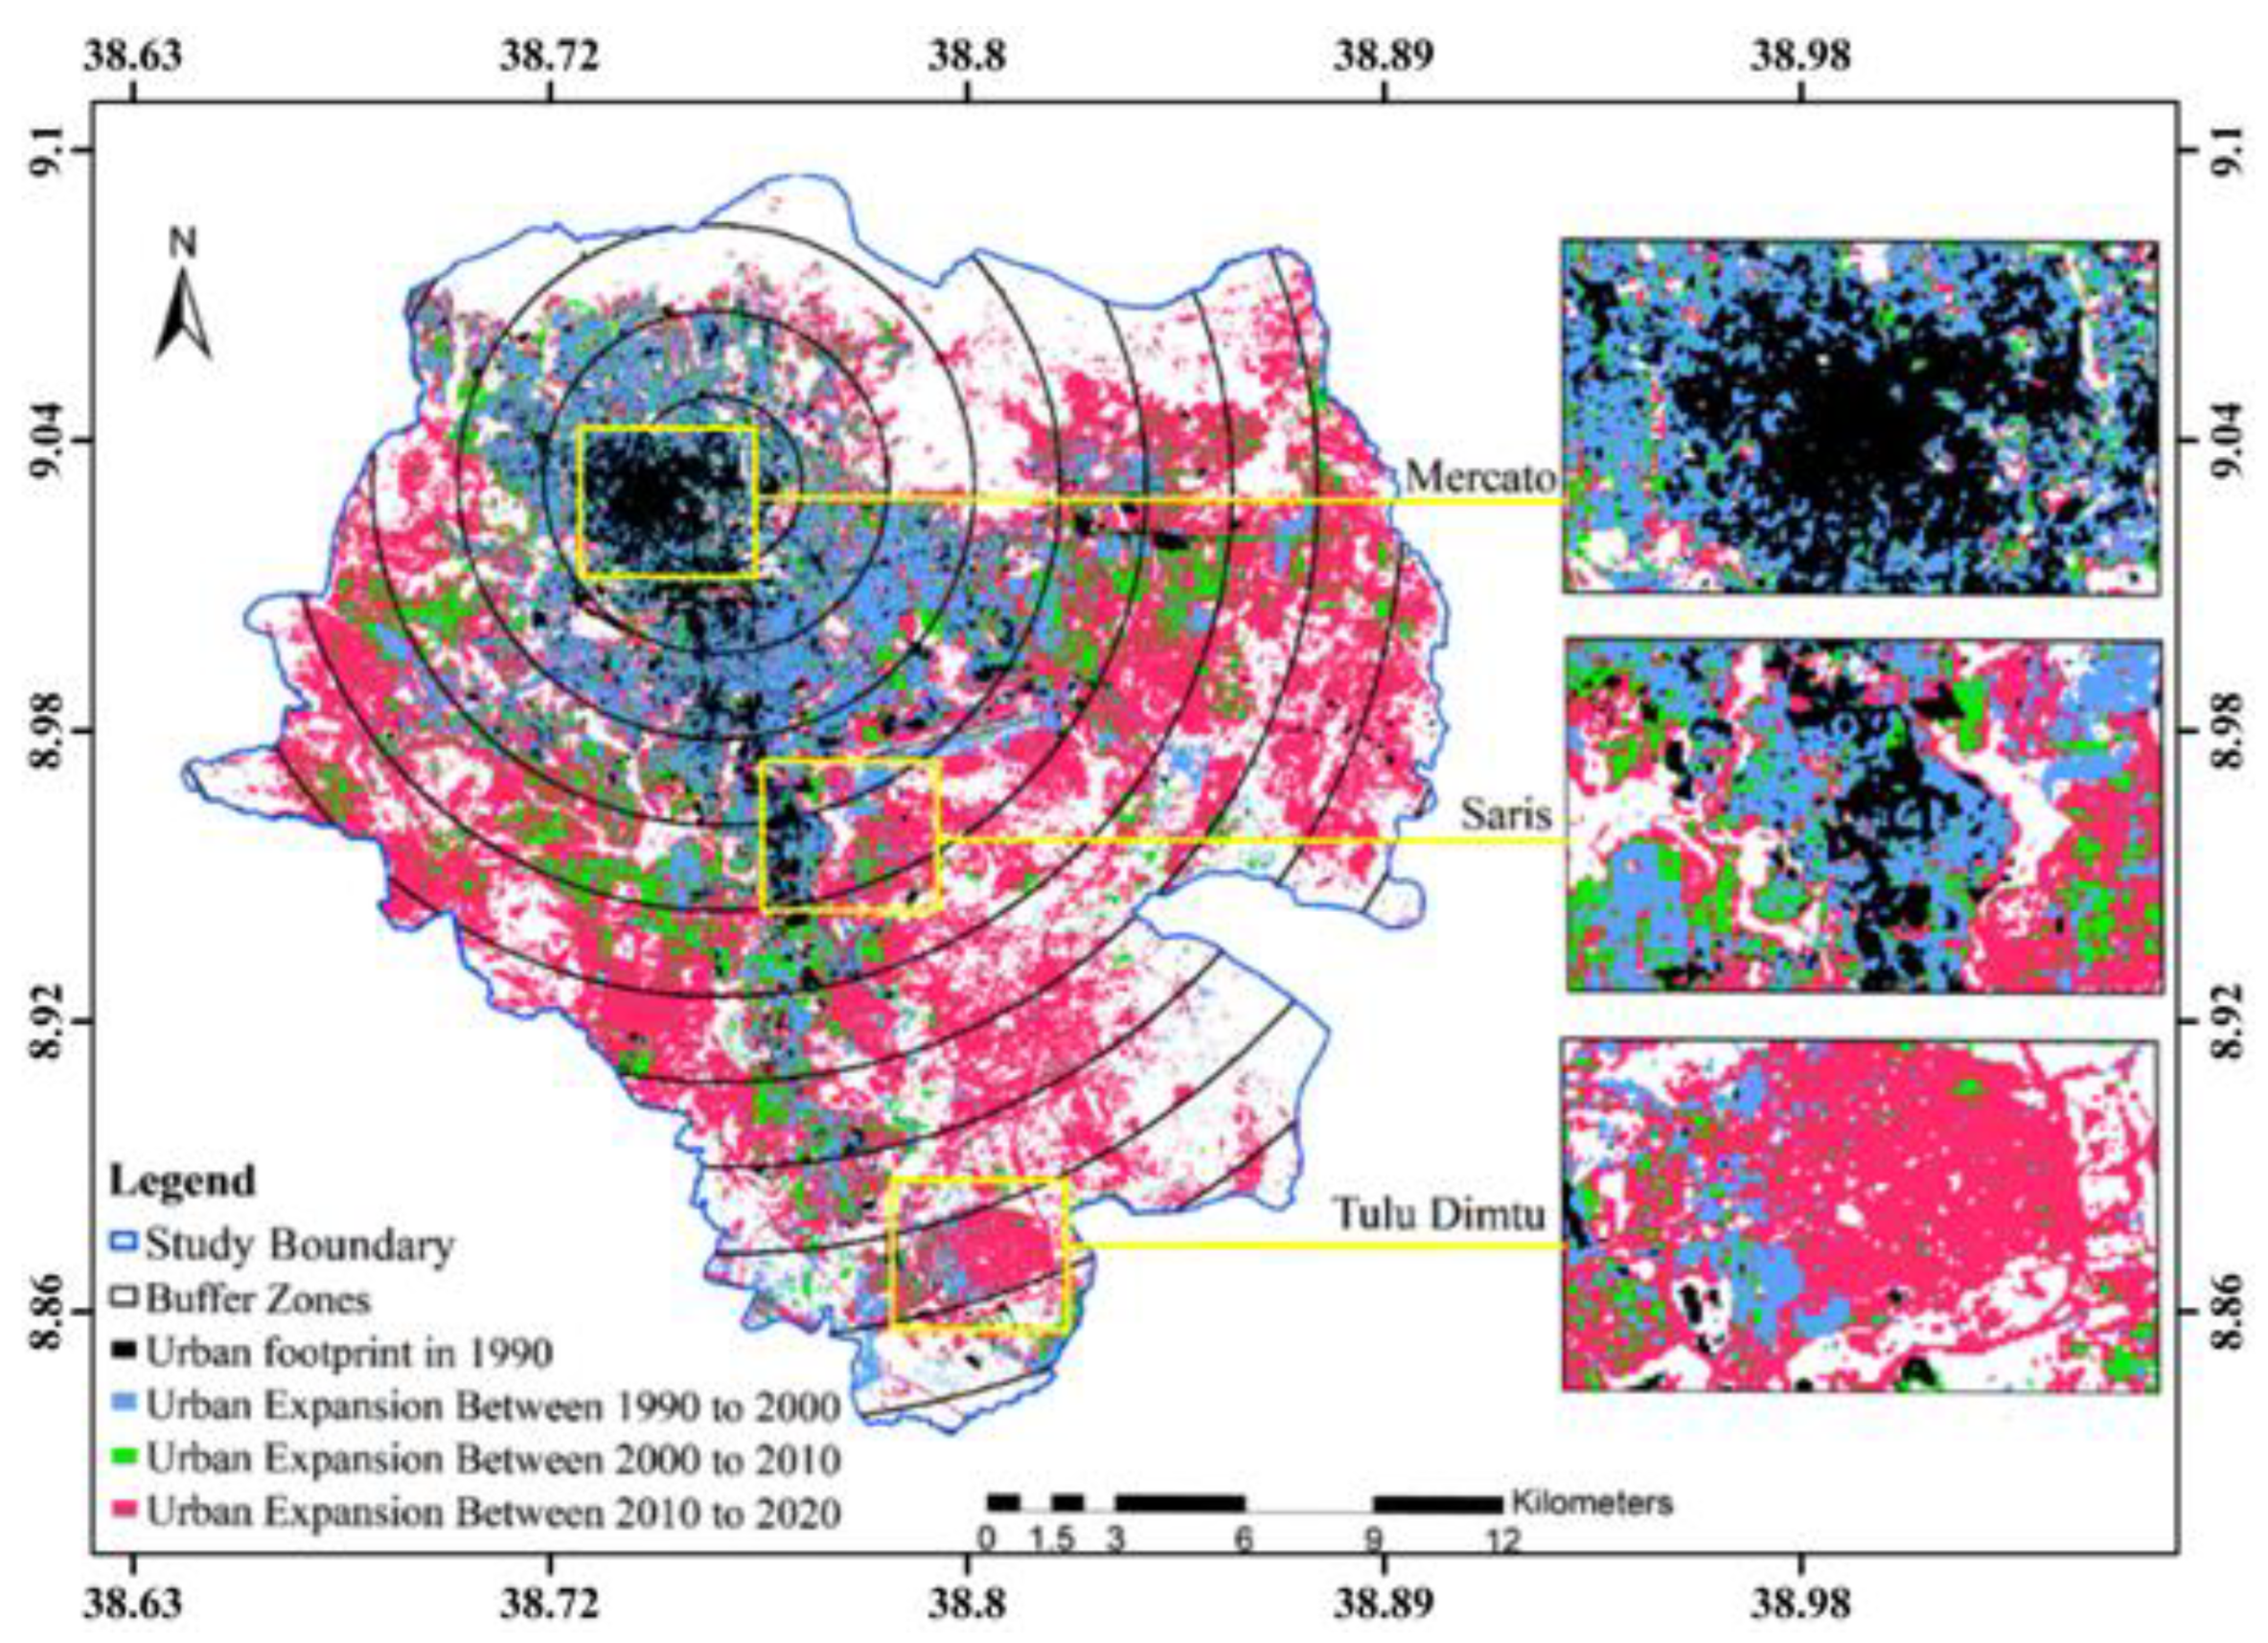
Figure 5.
Evolution of the land cover (i.e., anthropic pressure) in the areas indicated in Figure 3: the aerial views show the land cover and displacement in mm on 2014/12/10 (top left), 2016/12/11 (top right), 2018/12/25 (bottom left), and 2020/10/27 (bottom right).
Figure 5.
Evolution of the land cover (i.e., anthropic pressure) in the areas indicated in Figure 3: the aerial views show the land cover and displacement in mm on 2014/12/10 (top left), 2016/12/11 (top right), 2018/12/25 (bottom left), and 2020/10/27 (bottom right).
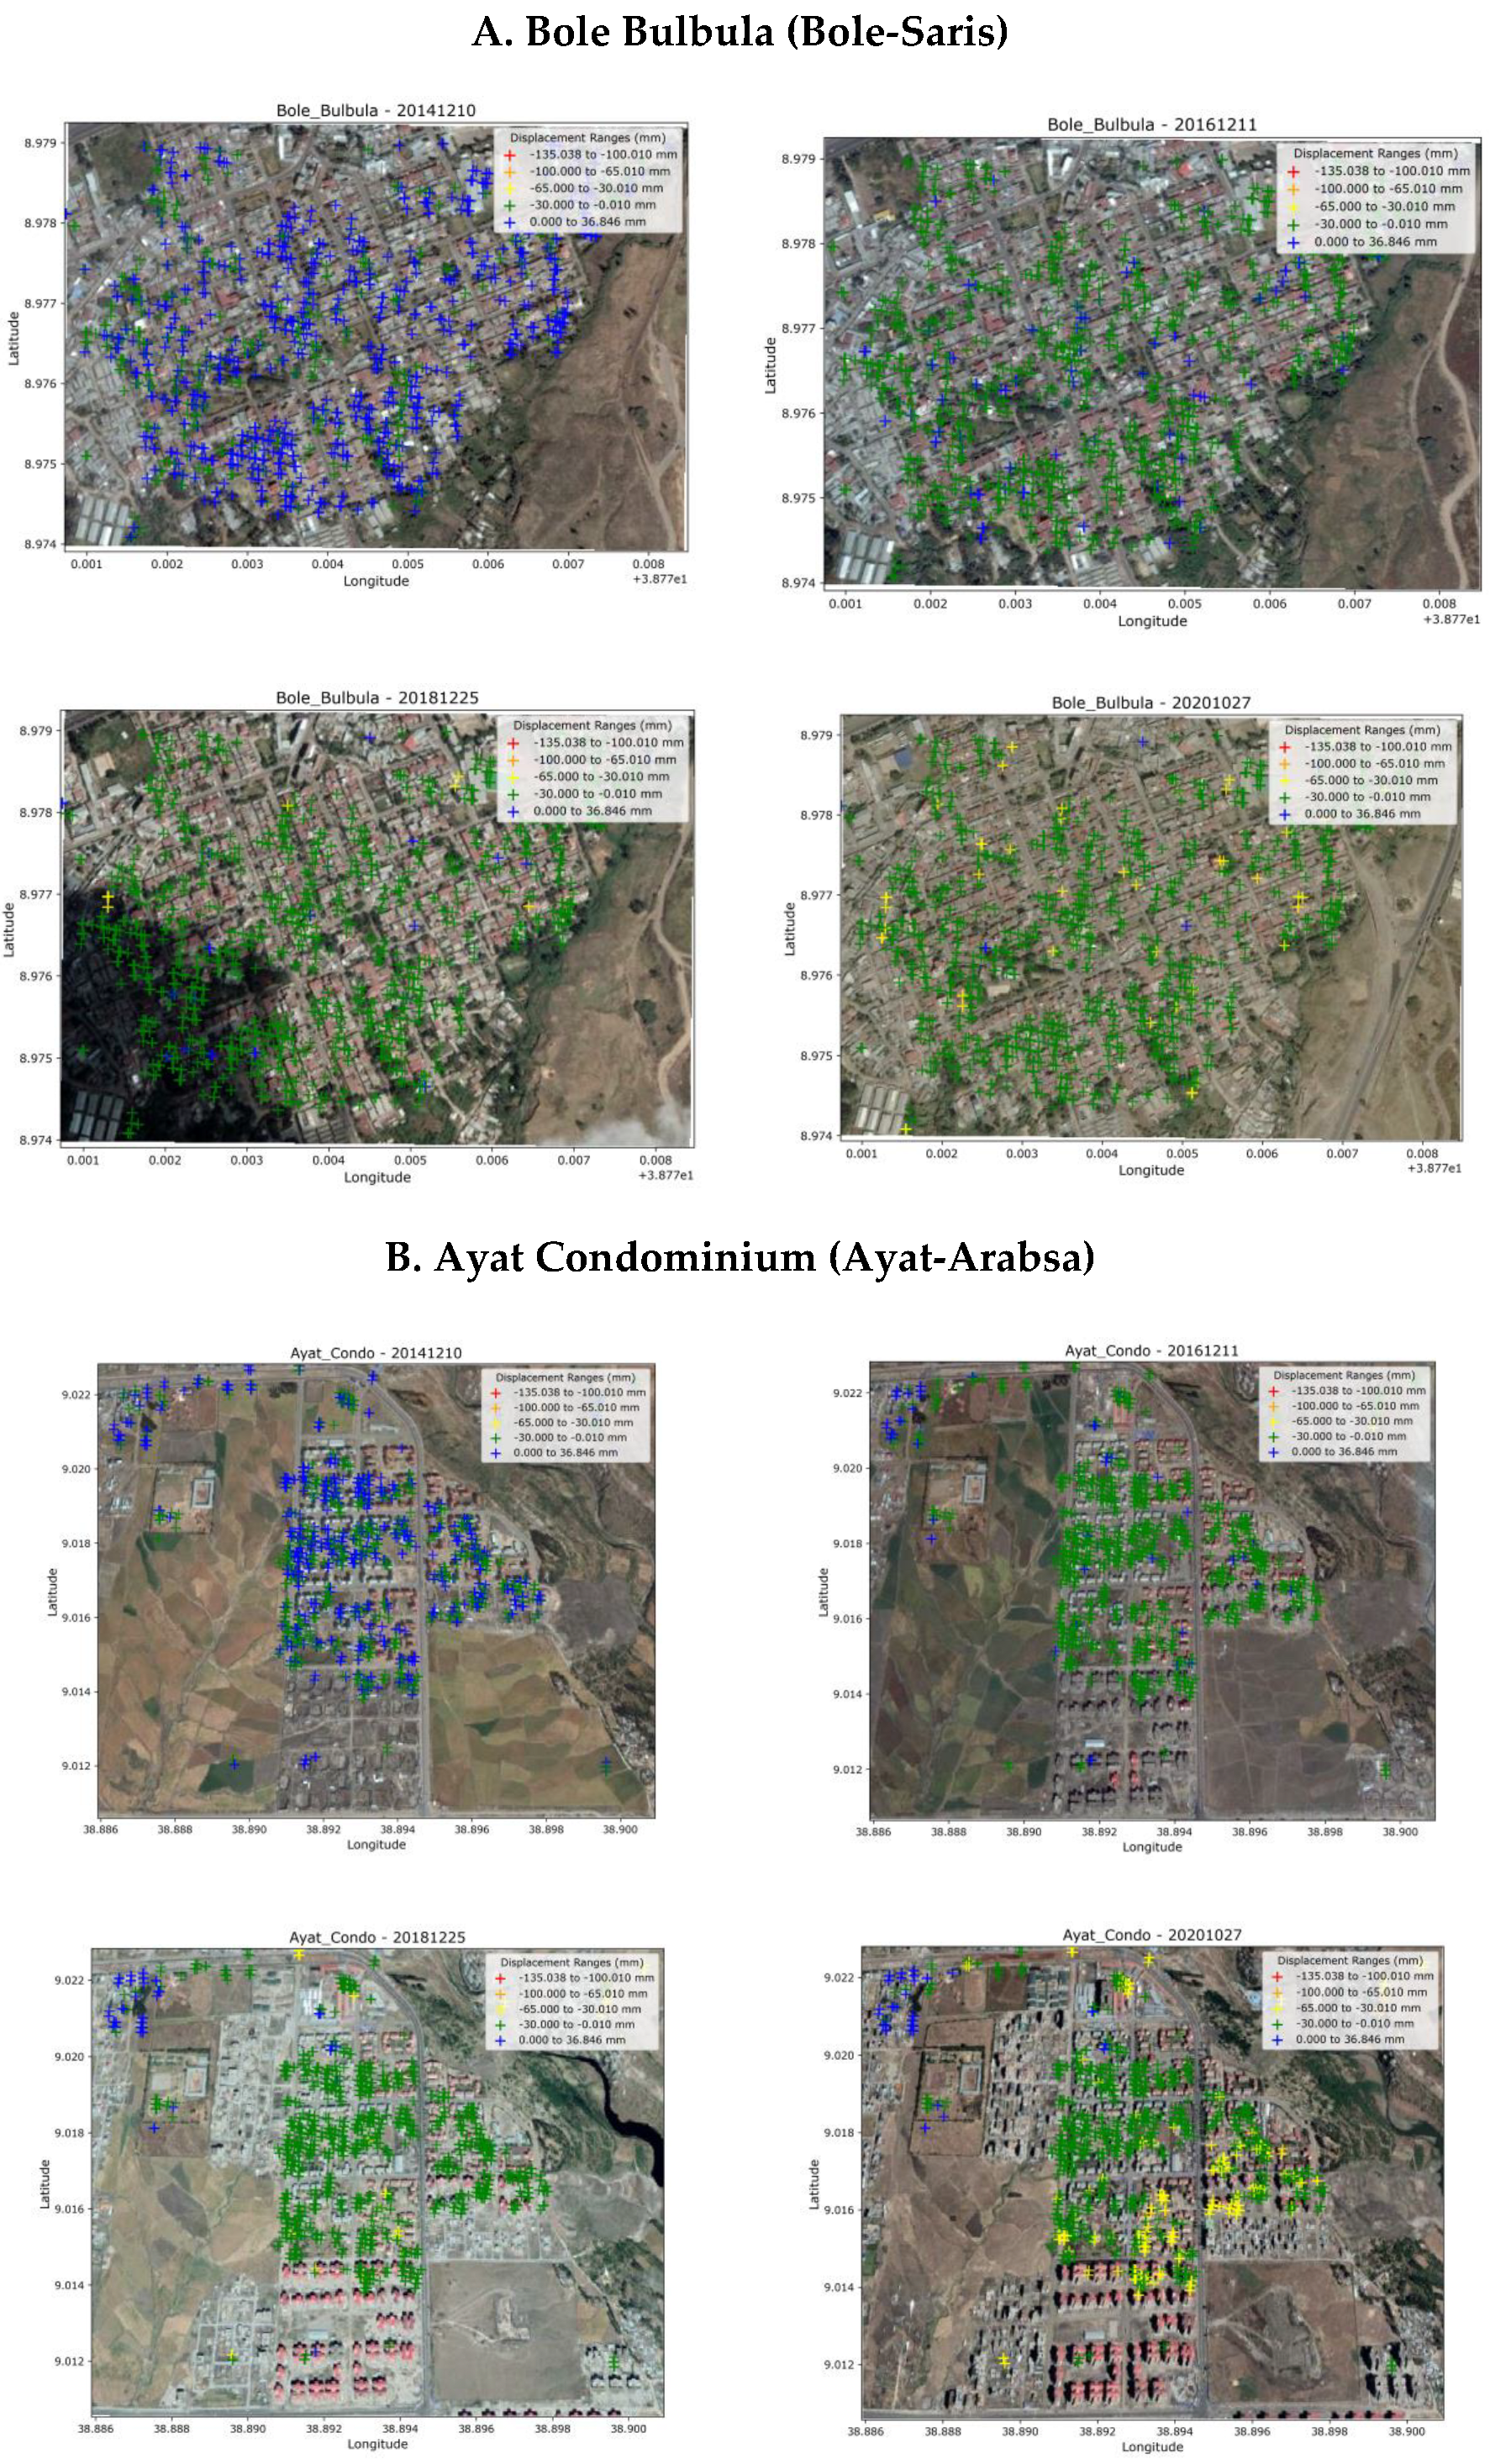
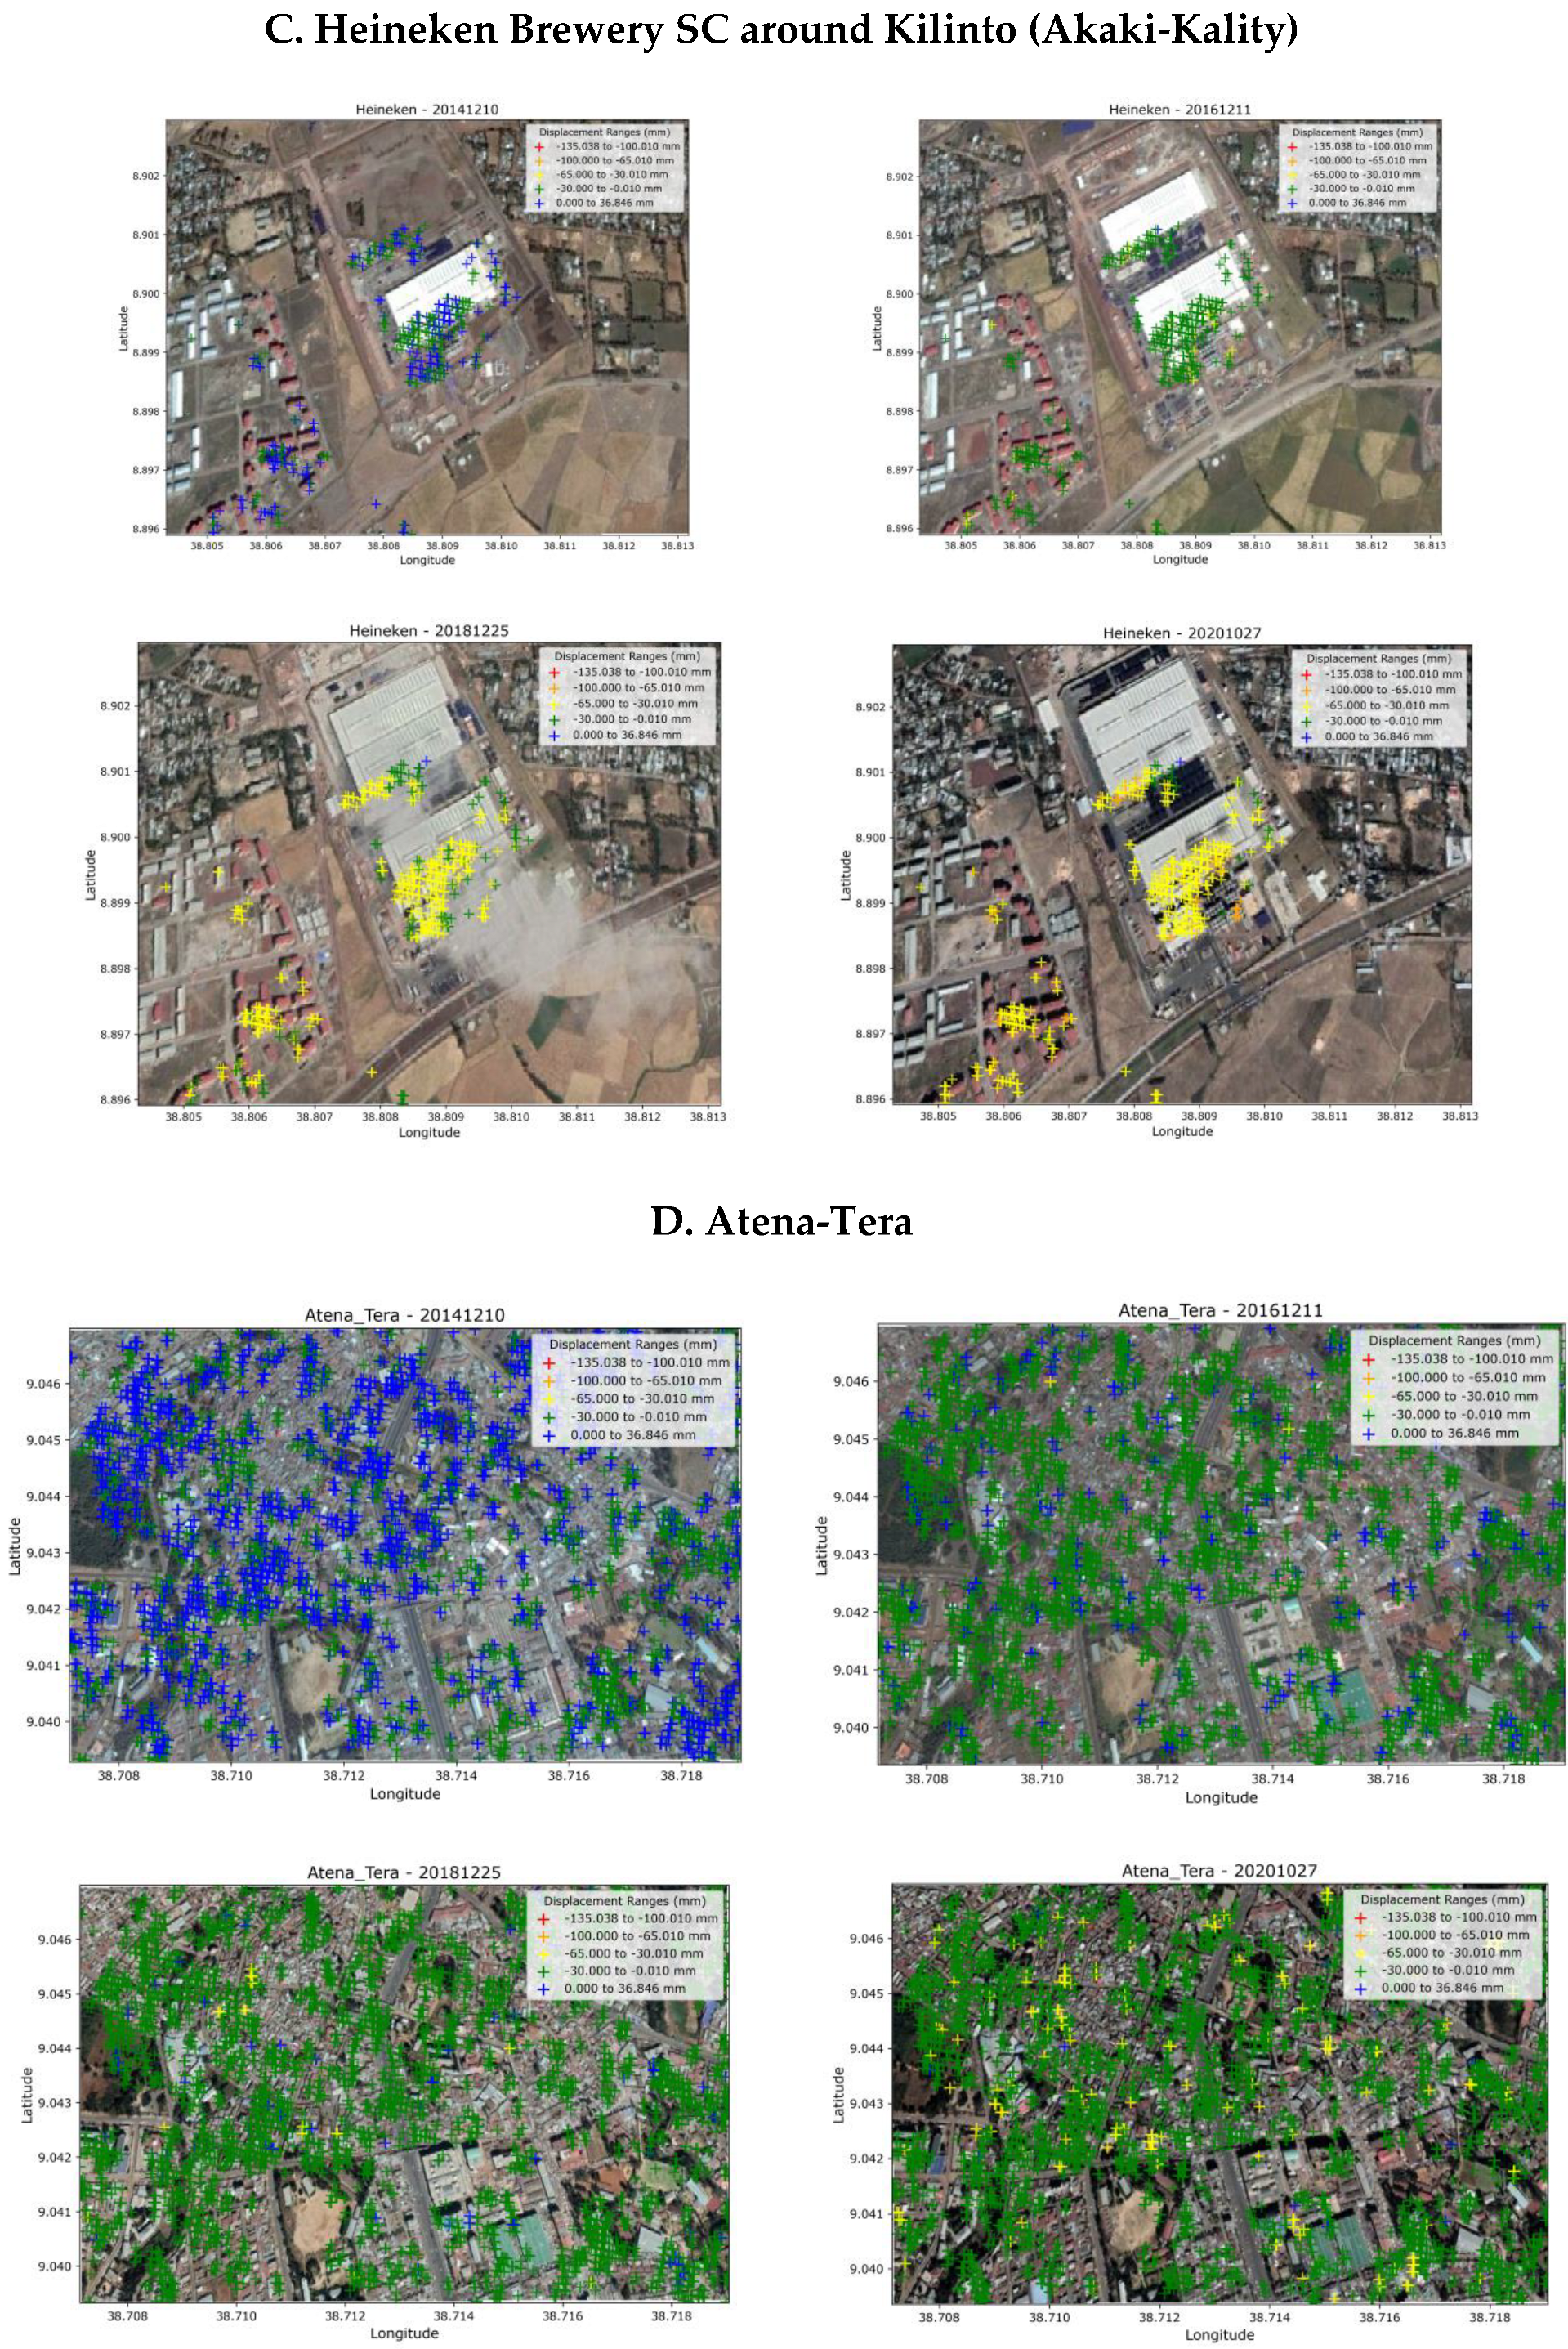
Figure 6.
Time Series Plot of Points A, B, C, D, E, and F as shown in Figure 3.
Figure 6.
Time Series Plot of Points A, B, C, D, E, and F as shown in Figure 3.
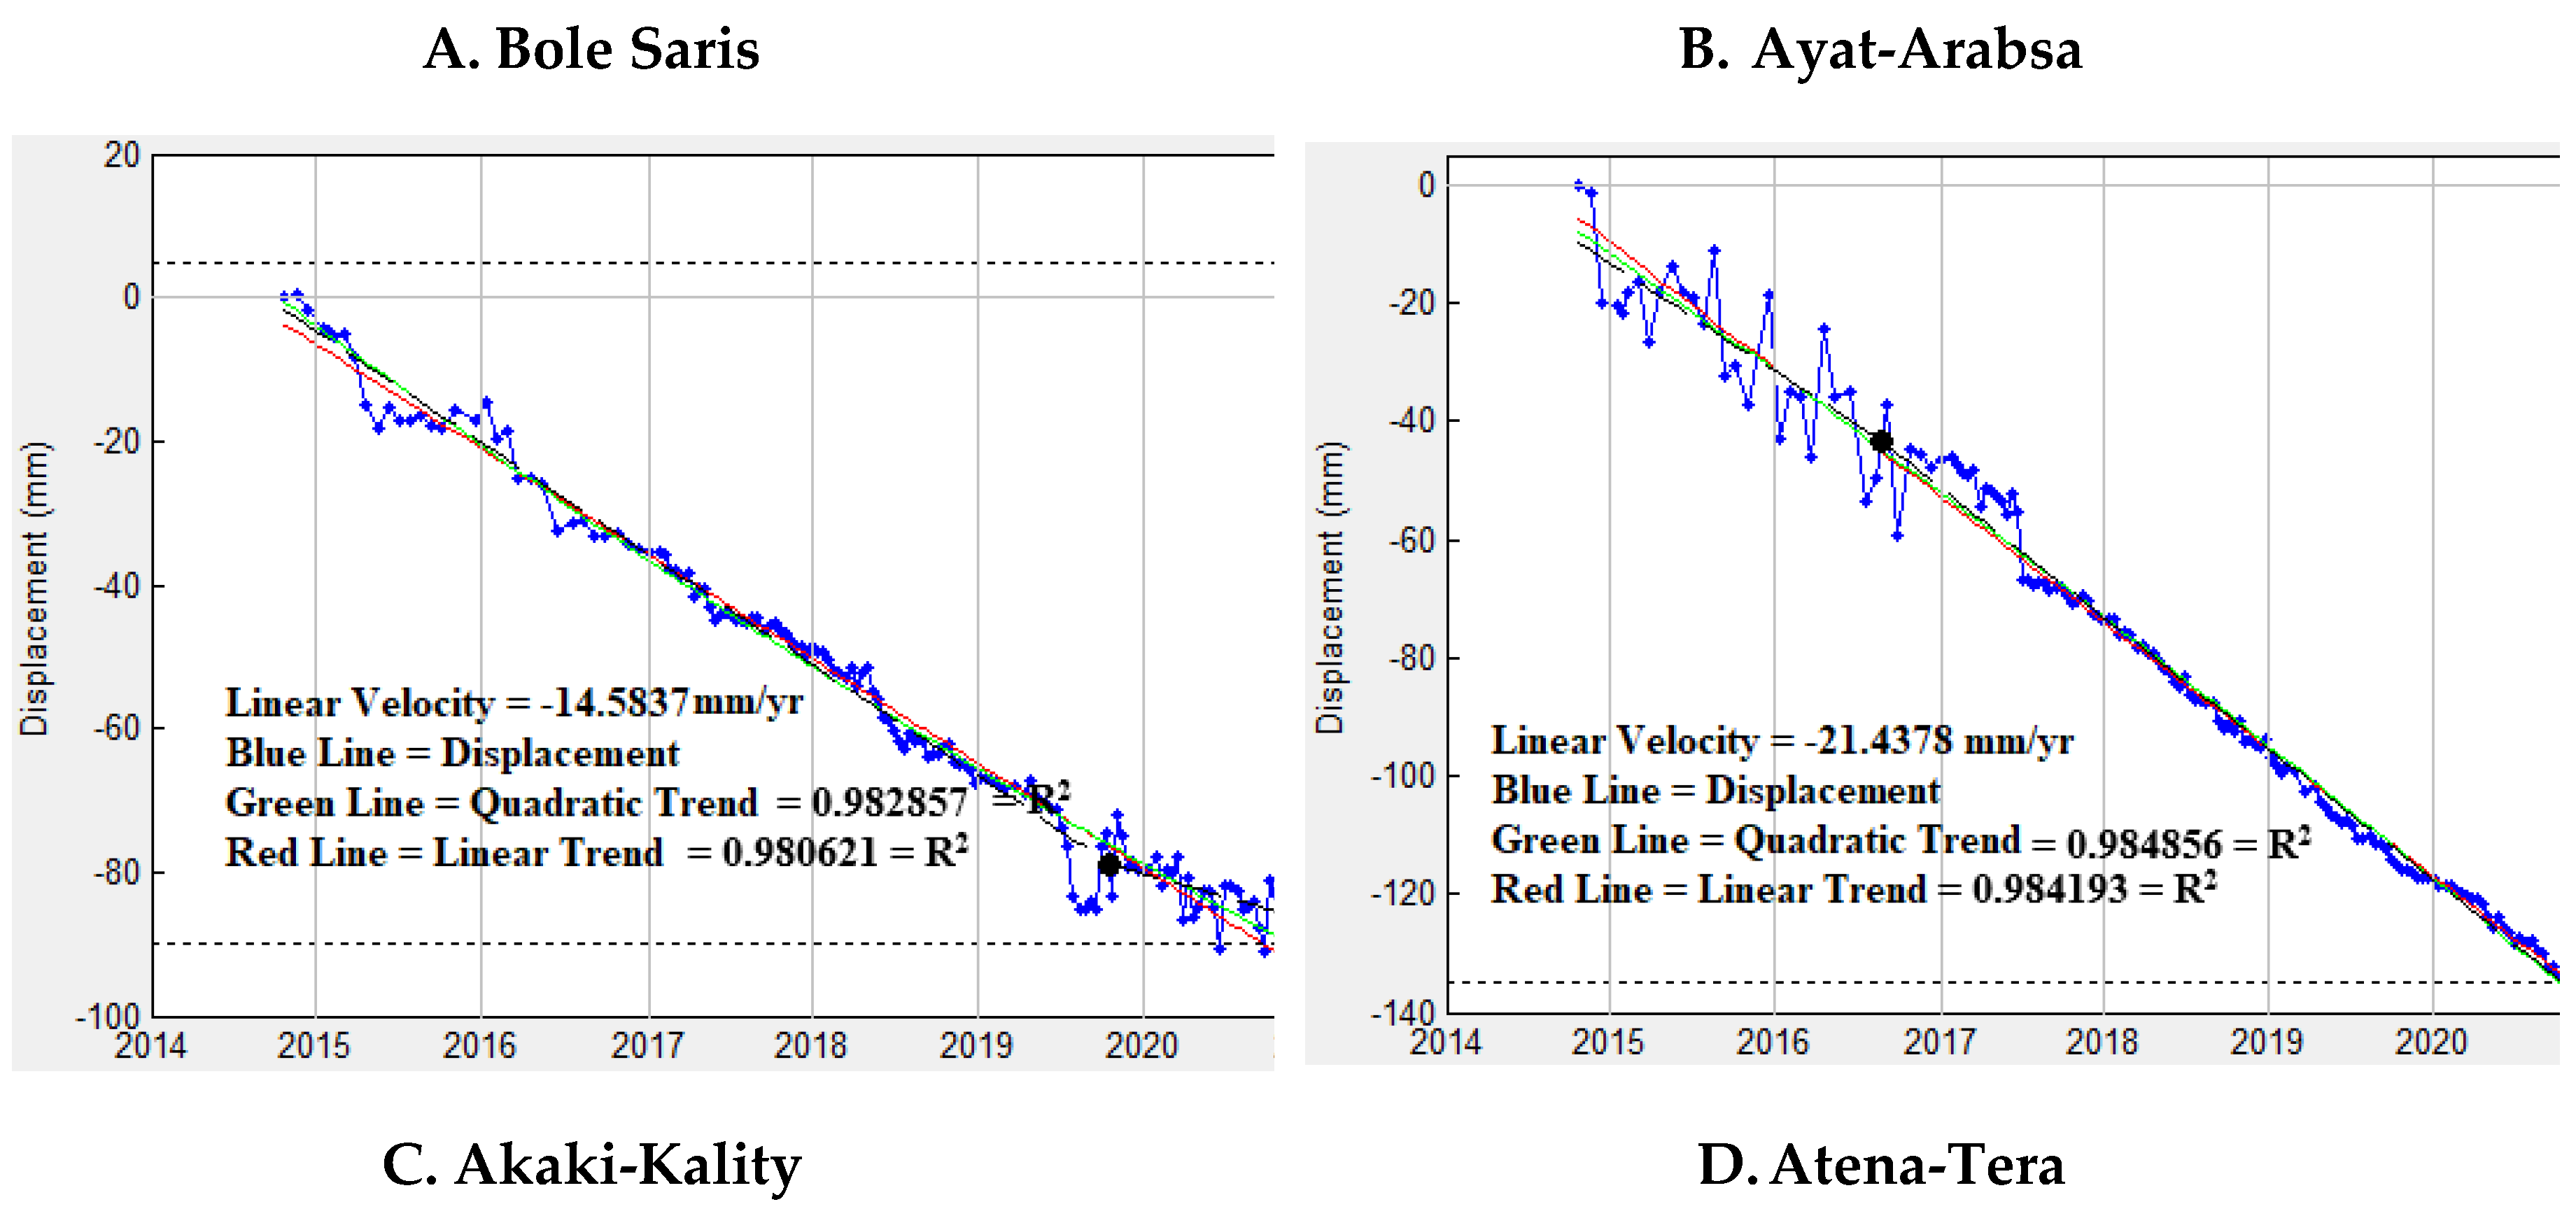
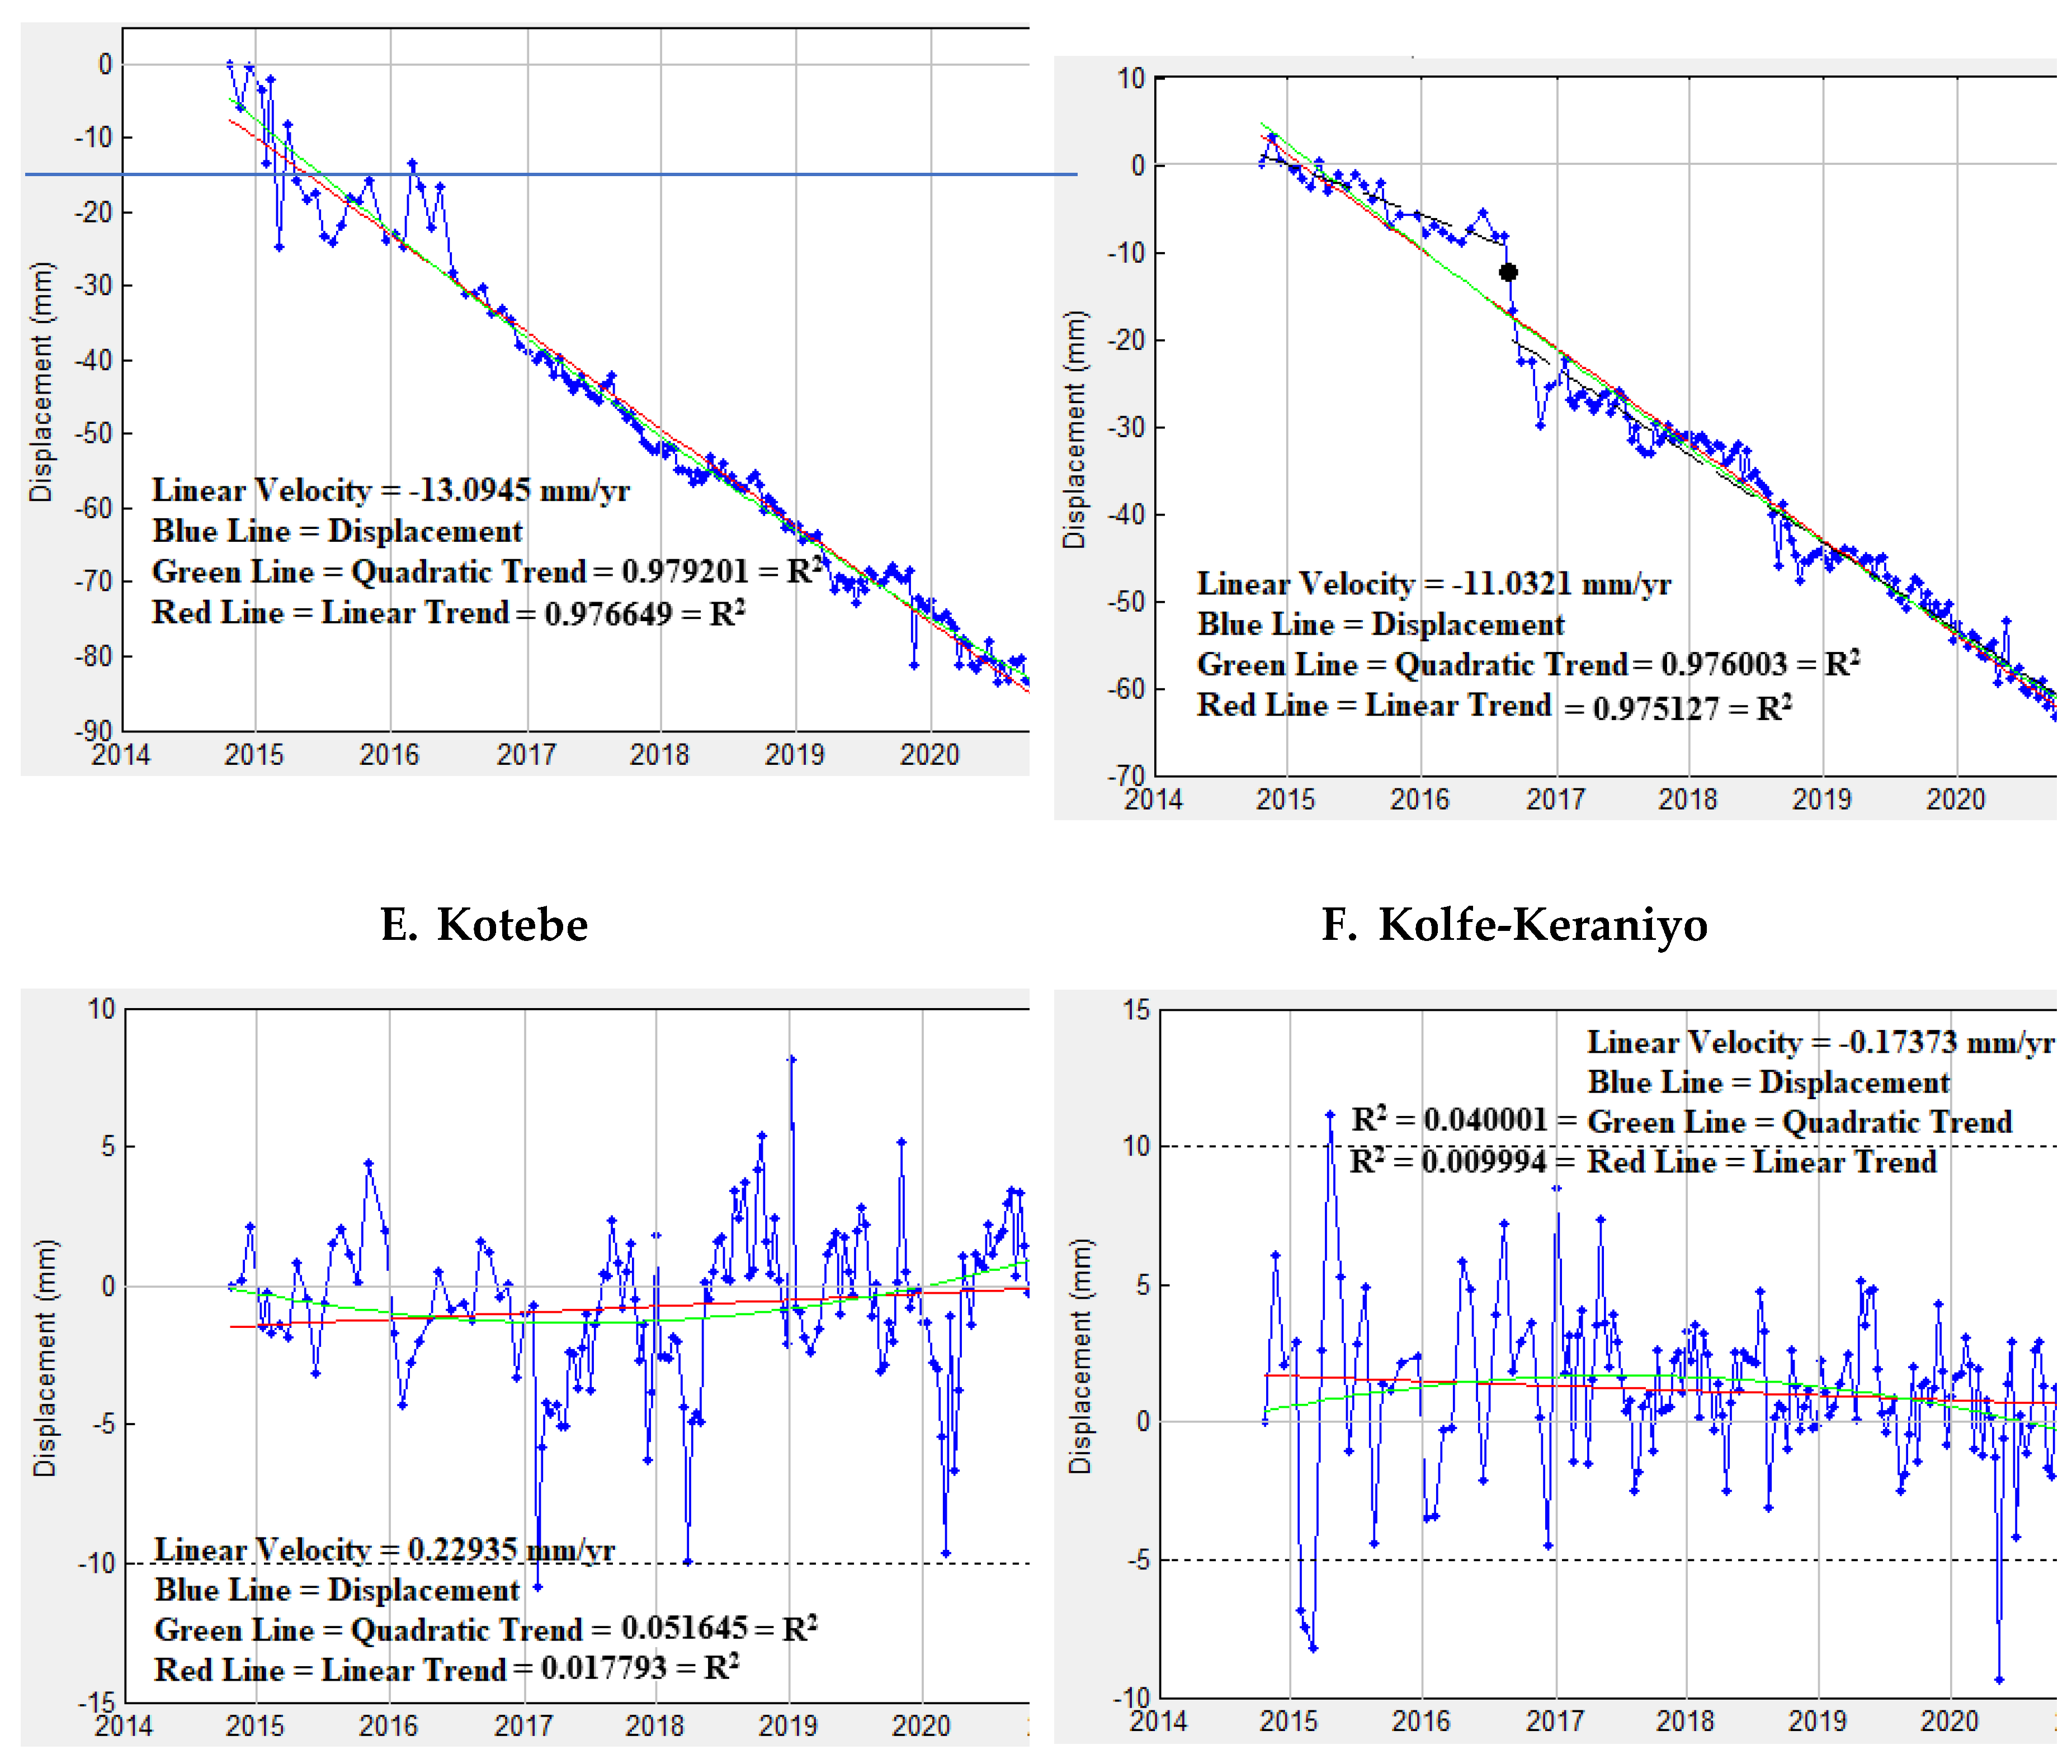
Figure 7.
Time Series Plot of XYZ for ADIS station.
Disclaimer/Publisher’s Note: The statements, opinions and data contained in all publications are solely those of the individual author(s) and contributor(s) and not of MDPI and/or the editor(s). MDPI and/or the editor(s) disclaim responsibility for any injury to people or property resulting from any ideas, methods, instructions or products referred to in the content. |
© 2025 by the authors. Licensee MDPI, Basel, Switzerland. This article is an open access article distributed under the terms and conditions of the Creative Commons Attribution (CC BY) license (http://creativecommons.org/licenses/by/4.0/).
Copyright: This open access article is published under a Creative Commons CC BY 4.0 license, which permit the free download, distribution, and reuse, provided that the author and preprint are cited in any reuse.


