
Submitted:
12 March 2025
Posted:
13 March 2025
You are already at the latest version
Abstract
Scoliosis is a disorder characterised by an abnormal spinal curvature, which can lead to negative effects on patients, affecting their quality of life. Given its progressive nature, the classification of severity requires an accurate diagnosis and effective monitoring. The Cobb angle measurement method has been widely considered as the gold standard for a scoliosis assessment. Commonly, an expert assesses scoliosis severity manually by identifying the most tilted vertebrae of the spine. However, this method is tedious, time-consuming, and presents limitations in measurement accuracy due to the intraobserver and interobserver variability. This highlights the need for a more objective tool less sensitive to manual intervention. Nowadays, advancements in artificial intelligence are transforming the diagnosis of scoliosis. In this study, we propose a fully automated approach to measure the Cobb angle. A small dataset of 98 anterior-posterior full spine X-ray images was labelled and included for evaluation. We assessed the accuracy and performance of the Mask R-CNN architecture for spine detection and segmentation. Beyond the neural network´s performance, a workflow was developed to enable midline identification, detection of the most significantly tilted vertebrae, direct visualization of Cobb angles, and scoliosis severity assessment. The model achieved high segmentation accuracy, with mIoU of 0.8012 and mDSC of 0.8878, while maintaining a mean precision of 0.9145. The mean Cobb angle was 25.43° ± 10.85° (range: 11.50-54.00°) for manual measurements by observer A, 25.89° ± 10.00° (range: 10.00-53.00°) by observer B, and 26.69° ± 12.50° (range: 10.29-59.34°) for automated measurements. We achieved a Mean Absolute Difference of 3.31º ± 2.69º, a Mean Absolute Error of 2.96° ± 2.60°, and an Intraclass Correlation Coefficient (95% CI) of 0.928 between manual and automated measurements. The automated method required an average of 3.3 seconds per radiograph. Although further improvements are needed, these results demonstrate the high potential of the proposed model, which provides experts with improved interpretability and precision in Cobb angle calculation and severity classification by overlaying them onto the original X-ray images.
Keywords:
Scoliosis
; Cobb angle measurement
; Mask R-CNN
; Vertebrae detection and segmentation
1. Introduction
Scoliosis is a condition of side-to-side spinal curves that measure greater than 10 degrees [1,2,3]. As shown in Figure 1, the human spinal cord consists of 33 vertebrae, which are subdivided into five different parts namely, cervical, thoracic, lumbar, sacrum, and coccyx. The scoliosis mainly affects thoracic and lumbar regions consisting of 17 vertebrae (12 in thoracic region and 5 in lumbar region). The spinal curvature ranging between 10 to 20 degrees is considered to be mild scoliosis, between 20 to 40 degrees is considered to be moderate and above 40 degrees is severe scoliosis [2,4]. While this classification provides a general framework for understanding scoliosis, other variations exist depending on the criteria used in different studies, such as differences in curvature degree thresholds. In the treatment of scoliosis there are different levels of severity and approaches to address it. An early and precise diagnosis allows selection and planning the most suitable treatment. In an initial evaluation, doctors rely on clinical methods with no patient radiation exposure. Physical examination methods include torso rotation angle method, Adams forward flexion test, and spine measurement instrument method [5]. Through a physical examination, the specialist looks for asymmetries in the patient´s shoulders, rib cage, or hips. If physical examination suggests an abnormal curvature of the spine, X-ray images are used to measure the deviation degree and classify the severity of scoliosis. The anterior–posterior full spine X-ray in a standing position is a gold standard for evaluating scoliosis [6].
There are several methods for the measurement of internal curvature of the spine, which include Cobb, Diab, Centroid, Greenspan, and Ferguson methods as shown in Figure 2. Cobb method identifies the superior and inferior vertebrae, draws tangential lines along their endplates, and measures the angle where these lines intersect. Diab method locates the four corners of the superior, inferior and apical vertebrae, finds their centres via lines perpendicular to the endplates, and measures the angle by connecting these centres. Centroid method connects the corners of each vertebra to define tangents on the superior and inferior endplates, then calculates the angle from those tangents. Greenspan method determines the centres of the end vertebrae, draws perpendiculars at each centre, and derives the spinal angle from the intersection of those lines. Ferguson method uses the centre of the apical vertebra, connecting it to the centres of the superior and inferior vertebrae; the angle between these two lines indicates the curvature.
The Cobb method, which quantifies the degree of spinal curvature, has been widely considered as the ‘gold standard’ for a scoliosis assessment [4,8,9,10,11,12]. Recently, Wiliński et al. [6] evaluated the repeatability and reliability of three measurement methods, Cobb (CB), Ferguson (FR), and Centroid (CN), when the measurements are made by inexperienced researchers. Their findings demonstrated that the Cobb angle measurement method is the most reliable for assessing spinal curvature in novice researchers.
Traditional methods for the Cobb angle quantification require manual annotation by radiography experts, which is tedious and time-consuming. Moreover, due to the range variety in the scoliotic curve between different patients and measurement errors caused by vertebral rotation, the position of patients, and low image quality, manual measurements suffer large intra- and inter-observer variability [13]. For the Cobb angle measurement, definition of the end vertebra introduces the main source of error [14]. Manual identification of end vertebrae and other anatomical landmarks required for the estimation of spinal curvature causes variability and unreliability at higher rate, thus open opportunities to proposed systems focused on eliminate the subjective error during the identification of end vertebral plates [15]. Manual measurements depend on expert experience and judgment. Errors due to the wrong selection of end-vertebrae and inaccuracies in estimating the slope of the spinal curvature can negatively impact the accuracy and reliability of Cobb angle measurements, thereby affecting the correct diagnosis of scoliosis. Accurate assessment of spinal curvature severity is essential for diagnosing and monitoring scoliosis.
Figure 3.
Scoliosis views: (a) normal versus scoliotic spine. (b) Definition of required anatomical landmarks. (c) Definition: medial axis (MA), central sacral line (CSL) [4].
Figure 3.
Scoliosis views: (a) normal versus scoliotic spine. (b) Definition of required anatomical landmarks. (c) Definition: medial axis (MA), central sacral line (CSL) [4].
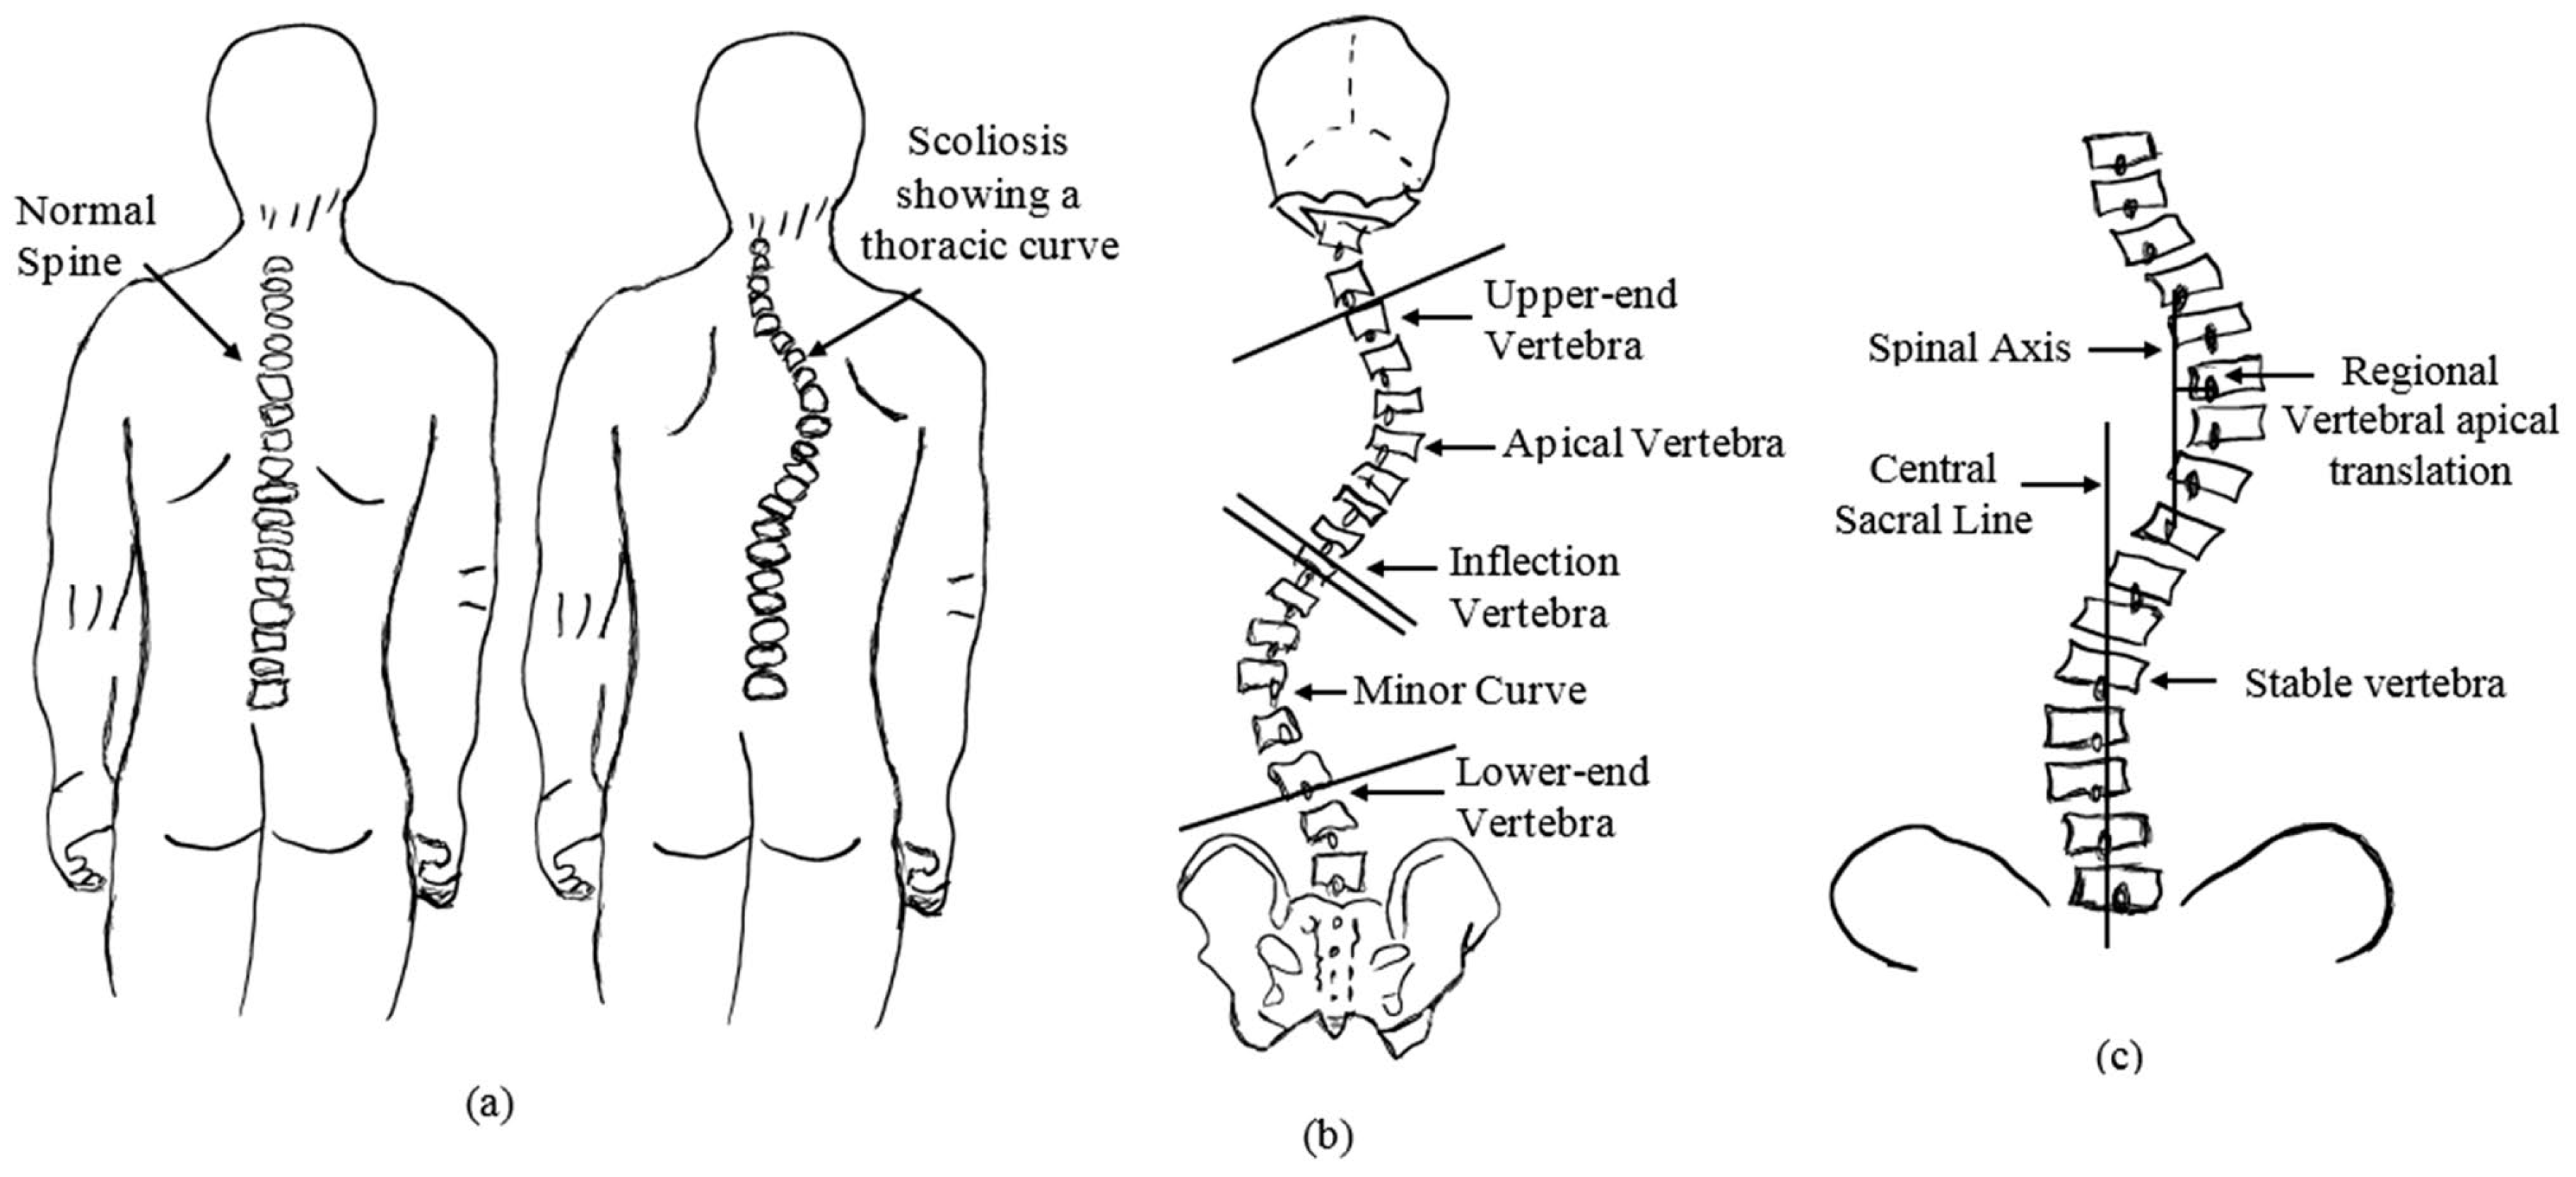
The Cobb angle measurement technique consists of selection of the end vertebrae which tilt more severely toward the concavity of the curve. Lines are drawn one from the upper endplate of the superior vertebrae and the other from the lower endplate of the inferior vertebrae of the curve. As illustrated in Figure 4, the angle formed by the intersection of the two lines is considered to be the Cobb angle, which represents the measurement of lateral curvature [16].

Table 1.
Cobb angle definition [2].
Table 1.
Cobb angle definition [2].
| Cobb angle | Definition |
|---|---|
| 0º - 10º | Spinal curve |
| 10º - 20º | Mild scoliosis |
| 20º - 40º | Moderate scoliosis |
| > 40º | Severe scoliosis |
Mask R-CNN [17] is a simple, flexible, and general framework for object instance segmentation. The method builds upon Faster R-CNN to perform instance segmentation by adding a branch for predicting an object mask for each detected object. A quantization-free, called RoIAlign, preserves exact spatial locations, thereby improving mask accuracy. This approach efficiently detects objects in an image while simultaneously generating a high-quality mask for each instance. Mask R-CNN is easy to generalise to other tasks, e.g., allowing to estimate human poses. This study presents a fully automated approach based on a convolutional neural network to reduce the intra- and inter-observer variability in the scoliosis severity assessment through Cobb angle measurement. To this end, due to its high versatility, we employ Mask R-CNN, for single-instance segmentation of the spine in X-ray images, generating a mask that replicates the scoliotic curvature. This mask is then processed using an algorithm that extracts the midline of the scoliotic curvature by connecting the midpoints derived from the spine´s boundary. The algorithm further identifies key landmarks such as superior and inferior end vertebrae, calculates the Cobb angle, classifies the severity of the curvature. Additionally, it provides a clear visualization of each stage in the measurement process, which can improve the interpretability of the results.
This study is structured as follows: Section 2 provides a review of the state of the art through an analysis of related works. Section 3 details the materials and methodology employed in the study. Experimental analysis and results are presented in Section 4. Section 5 discusses the findings and their implications, while section 6 concludes the study by summarising key insights and future directions.
2. Related Works
Precision in spinal curvature assessment is required to ensure accurate diagnosis. Several parameters directly affect accuracy and repeatability of measurements such as manual intervention, observer expertise, image quality and assessment criteria. Variability in inter-and intra-observer led the development of more objective tools, less sensitive to manual intervention to improve reliability scoliosis evaluation.
In 2009, Vrtovec et al. [18] overviewed existing methods for quantitative evaluation of spinal curvature from medical images highlighting modern imaging techniques help clinicians in making more accurate diagnosis and planning more effective treatment strategies for spinal disorders. The research progress of Cobb angle measurement from the perspective of computer vision and deep learning was recently reviewed by Jin et al. [19]. Although the Cobb angle can be measured effectively, there are also problems, such as calculation time cost and insufficient recognition accuracy.
In the past few years, trends in Cobb angle measurement have been developed by using techniques aiming to improve the visual quality of 2D medical images facilitating their assessment. Despite the good results achieved, several limitations persist, such as feature engineering, high computational cost and lack of robustness in image-enhancement methods. Machine learning-based methods can extract image features automatically [3]. The two most common approaches for estimating Cobb angle are landmark-based and segmentation-based approaches [8]. In this study, we have reviewed the state of the art in vertebral landmark prediction [3,4,5,8,9,10,12,15,20,21,22,23,24,25,26,27,28,29,30,31], and vertebrae segmentation [2,11,32,33,34,35,36,37,38,39,40,41], both widely used for Cobb angle measurement. Those methods that are heavily based on individual vertebrae are not accurate enough [3,42].
In 2007 Gstoettner et al. [14] addressed the reliability assessment on the Cobb angle using Intraclass Correlation Coefficient (ICC) inter and intra cross correlation coefficient ratio (ICCR) through comparison between manual and digital measurement. They concluded that definition of the end vertebra introduces the main source of error. In 2014, Anitha et al. [15] proposed an automated system to extract vertebral endplates using a customized filter addressing the challenge of Cobb angle quantification in noisy X-ray images. In 2017, Sun et al. [21] proposed structured support vector regression (SSVR) to jointly estimate Cobb angles and landmarks of the spine in X-rays images. They addressed nonlinear relationship between image features and quantitative evaluations parameters achieving high correlation coefficient between top, middle and bottom angles predicted by the proposed method and ground truth. A novel spinal landmark estimation framework to automatically assess scoliosis integrating the robust feature extraction capabilities of Convolutional Neural Networks with statistical methodologies to adapt to the variability in X-ray images was introduced by Wu et al. [22]. The same authors employed a fully automated spinal curvature estimation framework using multi-view x-ray to solve the problem of vertebrae occlusion on a dataset consisting of 526 images divided between AP and LAT views.
In 2019, Chen et al. [24] proposed a system which contains two networks for calculating landmarks and Cobb angle separately. Each vertebra is located by four landmarks with respect to four corners, resulting three Cobb angles per spinal image. The system achieved an average mean absolute error (MAE) of 4.9º in Cobb angle detection. Convolutional Neural Network Faster-RCNN are used by Yang et al. [25] for automatically localization of regions of interest (from neck to hip) and Resnet 101 to recognize the characteristic of each group (0–9°; 10°–19°; 20°–44°; ≥45°). Scapular and lumbar regions were identified as critical for the predicted accuracy of the Deep Learning Algorithms (DLAs). A Region Proposal Network (RPN) trained for vertebra detection using Faster-RCNN was proposed by Khanal et al. [8]. They argued that detecting vertebrae as objects before finding landmarks within them was beneficial as it facilitated learning. The automated estimation of the Cobb angle by using an image processing stage and active contour parametric algorithms to identify the spine contour was explored by Cerqueiro et al. [27]. Although the snake model reduces the active shape model´s dependence on the initial setup, the researchers found that, in some areas with blurred boundaries, snakes are prone to losing features, especially when the vertebral bodies obscure each other, Hoblidar and Prabhu [32] and Jin et al. [19]. The deep learning methods based on segmentation and landmark estimation both achieve high performance for automated Cobb angle measurements on X-rays. In 2021, Fu et al. [9] noticed that these methods utilize segmentation and landmark information separately, proposing an automated architecture that used combined segmentation with landmark. Thalengala et al. [4] proposed a new approach which extracted the spinal mid-line (MA) and Central sacral line (CSL) using advanced computerized image understanding system for the decision of the required anatomical landmarks. The authors evaluated the inter observer variation in spinal curvature estimation using different techniques, such as Cobb estimation, Ferguson method, Centroid method and Diab procedure highlighting that to identify the severity of the curve, it is necessary to evaluate the inclination of the vertebral bodies. In 2022, the study conducted by Huang et al. [10] proposed the use of artificial neural networks and oscillograms of end-plate distribution forming an automated framework in the measurement of Cobb angles which provides a fully automated and reliable solution for comprehensive spinal curvature assessment. Although this method measured the measurement of the major curve of the Cobb angle, the sequence of vertebral body, end vertebrae and apical vertebra were unavailable. Sun et al. [28] applied two state-of-the-art deep learning object detection models based on convolutional neural networks used in sequence to segment each vertebra and locate de vertebral corners comparing the outputs of the models to manual measurements. In 2023, Han et al. [5] proposed a machine learning algorithm focused on identifying key points by scanning the image and connecting them. The method innovation of this study lies in the selection of fine tracing points through multiple fitting verifications. The algorithm ensures the accurate positioning of the spine landmarks. A CNN method for automatic vertebrae detection and Cobb angle measurement on X-ray images was proposed by Maeda et al. [29]. The algorithm consisted in three stages: spine ROI identification, detection of the four corners of each vertebra as landmarks, and Cobb angle measurement. Transfer learning with a pretrained ResNet model was used for ROI and vertebra detection. Qiu et al. [30] addressed difficulties such as high noise sensitivity or intricate computational procedures by introducing a novel deep-learning approach that incorporated multiple morphological features, including spine region, centreline, and boundary, to help the network focus on appropriate spine area. The development and application of a region-based neural network architecture capable of measuring Cobb angles even if extensive hardware is present was reported by Suri et al. [31]. In 2024, Chui et al. [12] employed a feedforward neural network (FNN) architecture for Cobb angle prediction and spinal curvature progression analysis. Using a landmark detection algorithm, they identify the centre and corner points of each vertebra to calculate the angles. Maharasi et al. [43] proposed a novel deep-learning approach for vertebrae landmark detection and scoliosis assessment. The U-Net method employed identify the apex, bottom, and top vertebrae. Li et al. [3] presented software that integrates deep neural network-based spine region detection and segmentation, enabling spine´s centreline identification, pinpointing the most significantly tilted vertebrae, and direct visualization of Cobb angles on the original images. They introduced a tolerance range to correct the offset between the vertebral orientation and the spine´s tangent.
Parametric models require and initial segmentation close to the expected boundary as a preliminary phase before the automatic calculation of spinal curvature. Identifying the end vertebral plates is the main source of error and most of the computer assisted method works on the preselected end vertebrae, Hoblidar and Prabhu [32]. These authors proposed an automatic segmentation system of all the vertebrae by using advanced image processing techniques to automate quantification of spinal curvature that helps in deciding the true identification of superior and inferior vertebrae. In 2019, Horng et al. [2] applied three different convolutional neural networks, U-Net, Residual U-Net and Dense U-Net, to segment vertebrae and for comparison segmentation tasks is both important for computer vision and convolutional neural networks. Expert knowledge is still required to choose the right model architecture and training setup, Vuola et al. [34]. These authors compared two popular segmentation methods, U-Net and Mask R-CNN in the nuclei segmentation task to detect strengths and failures. While Mask R-CNN is better detecting objects by predicting bounding boxes, U-Net is more precise at segmentation tasks. An ensemble model to combine both predictions was used aiming for best segmentation performance. Pan et al. [44] employed two Mask R-CNN models as the core of a computer-aided method to separately detect and segment the spine and all vertebral bodies on chest X-rays, enabling the measurement of the Cobb angle from the models' output. The convolutional neural network (CNN) is the main neural net for image classification and image differentiation, Alharbi et al. [35]. In 2020, these authors used a pretrained CNN, Deep Residual Learning for Image Recognition (ResNet50), to detect vertebrae in spine X-ray. In 2021, Zhang et al. [36] provided an efficient and accurate solution for whole-spine vertebra segmentation. They explored CNNs for the simultaneous segmentation of cervical, thoracic, lumbar, and sacral vertebrae by using biplanar radiographs. In 2022, Caesarendra et al. [11] used a CNN for automated spine segmentation to select vertebrae accurately and determine the centre and corner offset of each vertebra. Zhao et al. [37] improved the U-shaped network by incorporating multi-scale features for vertebra segmentation and enhancing feature extraction, size adjustment, and network learning efficiency. In 2023, Wong et al. [38] developed an AI-based algorithm that segmented the spinal column, localized and segmented vertebral bodies, and identified vertebral tilts to measure the Cobb angle automatically. In 2024, Low et al. [45] developed a deep learning model using two-stage approach; an attention-based deep neuronal network to segment and identify individual vertebrae, followed by polynomial curve fitting to the vertebral centroids for Cobb angle calculation. Rahmaniar et al. [41] proposed an architecture based on convolutional neural network (CNN) method, which consisted of a landmark detection network, a prediction module, and landmark decoding process that detected five coordinates, applied corresponding vectors, and grouped the corners into vertebrae.
State-of-the-art technology highlights the current trends in scoliosis assessment, specifically in Cobb angle quantification, which is based on deep learning using convolutional neural networks (CNNs) through two main approaches: landmark identification and vertebrae segmentation. The studies reviewed in the literature show significant progress in scoliosis assessment using different deep learning approaches that provide an angular value. However, they do not offer a record or visualization of the relevant information required by the model to achieve scoliosis agreement. This information can support the model´s prediction, allowing experts to visually observe the entire calculation process and collect data for further comparison. Based on a comprehensive literature review, this study proposes a deep learning model using Mask R-CNN as a single-segmentation approach to identify the spine in X-ray images. The following section provides an in-depth description of the convolutional neural network-based approach developed in this work.
3. Materials and Methods
In this study, the Mask R-CNN method [17] was analysed as a single instance segmentation approach for predicting the spine mask in X-ray images. This deep learning model efficiently detects objects within an image while simultaneously generating a high-quality segmentation mask for each instance, in our case, the spine. Various metrics were employed to validate the network´s reliability and robustness in spine segmentation. Due to the model´s mask accuracy, different algorithms were developed to identify landmarks, enabling Cobb angle measurement and scoliosis severity assessment. Additionally, an interactive interface was created, allowing users to upload X-ray images and follow the entire process for Cobb angle quantification and severity assessment.
3.1. Materials
The collection of spinal images was obtained from the public AASCE MICCAI 2019 dataset [46], which contains 98 anterior–posterior (AP) spine X-ray images, ensuring a standardised source of data. The dataset presents an imbalance classification based on the Cobb angle definition by Horng et al. [47], with 52% of the cases classified as moderate, 28% as mild, 13% as severe, and 7% as spinal curve. These images were divided into training (70%), validation (15%), and testing (15%). All the images were rescaled preserving the aspect ratio, ensuring that their height was set to 2000 pixels. Images were annotated using VGG Image Annotator (VIA) software. Each spine was marked by points during the labelling stage, which define the spine boundary in each radiograph. This boundary comprises the ground truth (GT) of our data and is used to train the model. To train the model, we employed a configuration tailored to the dataset. We optimised hyperparameters through multiple trials using Optuna, with training monitored by callbacks such as EarlyStopping and CSVLogger. The objective was to minimize validation loss, and the best results were recorded for further analysis and fine-tunning. Mask R-CNN was implemented for detection and objects segmentation in a virtual environment using Python 3.12.7, TensorFlow 2.16.2 and Keras 3.7.0. The model was trained locally on a GeForce RTX 4080 Laptop GPU (12GB) with an Intel i9-14900HX processor. Statistical analyses were conducted using the Python libraries Numpy, Pandas and Pingouin. The algorithms were developed in the JupyterLab environment, generating multiple outputs, including Cobb angle calculation, scoliosis severity classification, spine landmarks, and a clear visualization of the results on the original image.
3.2. Method
The method proposed in this study provides a systematic approach for evaluating spinal curvature severity based on vertebral alignment. In this study, we employed Mask R-CNN due to its a simplicity, flexibility, and general applicability for object instance segmentation. The implementation of the Mask R-CNN network was based on the GitHub repositories referenced in [48,49], which were adapted for the single-instance segmentation of the spine. The model was trained to accurately segment and detect the spine in X-ray images, generating a mask that is scaled and placed on the image in the right location. Figure 5 shows the method proposed in this study using Mask R-CNN for fully automated scoliosis assessment.
Various algorithms were developed to identify key anatomical landmarks along the scoliotic curve´s boundary, enabling the estimation of the Cobb angle and the classification of scoliosis severity directly in the original image. Figure 6, illustrated the proposed workflow, which operates as follows:
- Image acquisition and preprocessing is presented in Figure 6(a). The process begins with image acquisition through a user interface that allows the upload of an anterior–posterior (AP) full spine X-ray image.
- Figure 6(b), shows the step corresponding with spinal segmentation using Mask R-CN. A pre-trained Mask R-CNN model is employed to perform instance segmentation of the spine. The model is loaded, and inference is conducted on the input image. To enhance segmentation reliability, only masks with a confidence score above a predefined threshold are retained. Among the detected regions, the mask with the largest segmented area is selected as the spinal region, assuming it corresponds to the spine. This approach ensures higher segmentation accuracy, reduces false positives, and improves spinal contour extraction. The accuracy of the proposed method in Cobb angle quantification and severity classification is highly dependent on the precision of generated mask. The more accurate the mask, the more precise the assessment.
- In Figure 6(c), contour extraction and midpoint detection are illustrated. Once the segmentation mask is obtained, the spinal contour is extracted using OpenCV’s cv2.findContours() function, which is employed for contour detection in binary images. The contour with the largest segmented area is identified and overlaid onto the image for visualisation. To represent the spinal curve, a grid of horizontal lines is drawn in the image with a predefined interval of 50 pixels. This interval was selected as all images have been scaled to a standardised height of 2000 pixels. The interface also provides a widget to adjust the grid interval, offering flexibility in measurement refinement. The grid interval is designed to keep the generated midline within the boundaries of individual vertebrae, which is essential for providing a simplified representation of the spine. At each grid line, two intersection points are detected where the line crosses the spinal mask contour. The distance between these two points is measured, and its mean position is calculated, defining the midpoint in the image. These midpoints serve as a key reference points for spinal curve estimation.
- Figure 6(d), depicts spinal curve estimation and Cobb angle calculation. In this step, the extracted midpoints are used to approximate the spinal curve, with the first and last midpoints identified as upper and lower, respectively. A spline interpolation is applied to refine the connections between midpoints, providing a more accurate approximation of the spinal curvature. At each midpoint, except for upper and lower, a perpendicular line is drawn relative to the tangent of the curve at that point. The inclination angle of these perpendicular lines with respect to the horizontal is then computed and annotated on the corresponding midpoints. These perpendicular lines, referred to as simplified vertebrae, allow for a visual assessment of the spinal curvature trend, facilitating an intuitive evaluation of scoliosis progression and severity. Based on the curvature analysis, key anatomical landmarks are identified, including tilted vertebrae and apex points. Tilted vertebrae are defined as those with the most pronounced inclination angles, representing the regions of greatest spinal deviation. Apex points, on the other hand, correspond to the locations where the spinal curve reaches its maximum deformation, characterised by the greatest lateral displacement relative to the upper reference point. These apex points are critical for scoliosis assessment, as they indicate the peak of the spinal misalignment. The Cobb angle is then computed by isolating perpendicular lines corresponding to the most tilted vertebrae, drawing representative lines that emulate the manual method, identifying the intersection point between these lines, and measuring the angle formed at their intersection.
- Finally, the visualization and data export stage is presented in Figure 6(e). The results are displayed in a multi-panel layout including: the original X-ray image; the segmentation mask; the extracted spinal contour with the computed midpoints, midline, and vertebral inclination; the image showing Cobb angle measurement and severity classification; and finally, the data table containing numerical values including anatomical landmarks such as tilted vertebrae, upper, lower and apex points. Processed images and the data table are exported as structured reports in .png and .csv formats, providing a comprehensive representation of the entire process. This facilitates data-driven monitoring and assessment of scoliosis progression, offering valuable insights for clinical experts.
4. Experimental Analysis and Results
The fully automated approach proposed in this study harnesses the simplicity of single-instance segmentation with the precision of an algorithmic method for deriving clinical measures, thereby reducing computational time and the potential errors associated with more complex models. The reliability and robustness of Mask R-CNN in spine detection and segmentation, as well as the accuracy of Cobb angle quantification, is evaluated using various specific metrics in the following subsections.
4.1. Instance Segmentation
A comprehensive analysis of the training process was conducted to evaluate the performance of the Mask R-CNN model. In this study, we implemented the Mask R-CNN architecture in TensorFlow 2, leveraging the original GitHub repository [48]. As mentioned in the Materials subsection, the dataset consists of 98 AP spine X-ray images, split into 70% training, 15% validation, and 15% testing. We employed transfer learning by applying COCO pre-trained weights and fine-tuning the model for spine segmentation in X-ray images. Preliminary experiments guided a hyperparameter optimization phase, where various fine-tuning strategies were explored. Multiple training sessions were conducted, monitoring training and validation loss curves to refine model performance. No data augmentation techniques were applied during training. The final model was trained for 300 epochs, demonstrating consistent performance throughout the training process, as illustrated in Figure 7.
The segmentation model was evaluated using complementary metrics: Intersection over Union (IoU), also known as the Jaccard similarity coefficient, measures the overlap between the predicted and ground truth segmentation; Dice Similarity Coefficient (DSC) reflects the global similarity between the segmented regions and the reference; Average Precision (AP) serves as an overall performance indicator in terms of detection and precision of segmented regions; Precision represents the proportion of true positives among pixels classified as positive; and Recall exhibits the proportion of true positives among all pixels that are genuinely positive. Finally, over-segmentation occurs when the model predicts a region larger than the actual object, including areas that do not belong to the target, and under-segmentation happens when the predicted region is smaller, missing relevant parts of the target.
The best epoch was determined on the validation loss function, reaching a minimum value of 0.3472 at epoch 287. Additionally, a comparative analysis was performed using different detection confidence thresholds, ranging from 0.70 to 0.90 in increments of 0.05, to identify the optimal segmentation accuracy in terms of mean Intersection over Union (mIoU) and mean Average Precision (mAP). As a result, the highest mIoU metric was achieved at epoch 146, indicating the most accurate segmentation adjustment, while epoch 155 provided a slightly higher value in overall detection accuracy (mAP). Given that our approach focuses on extracting the spine contour from the mask generated by the Mask R-CNN network, we consider the mIoU metric as a key indicator of the agreement between the ground truth and the predicted mask. The analysis also revealed that a minimum detection confidence of 0.85 provided the best segmentation performance. To demonstrate network´s reliability and robustness, even with a limited dataset, we assessed the discrepancies between the predicted masks and the ground truth, which consists of the annotated images in VGG Annotator. We employed Intersection over Union (IoU), to evaluate segmentation accuracy. Figure 8 illustrates the method used to calculate the mean Intersection over Union by processing the original image, the ground-truth mask, the predicted mask, and the corresponding IoU values of several X-ray images.
A summary of the main metrics analysed during the training phase is presented in Table 2, including the mean Intersection over Union (mIoU), mean Dice Similarity Coefficient (mDSC), and mean Average Precision (mAP) (IoU=0.5:0.95). In image segmentation, both IoU and DSC are commonly used to quantify the overlap between predicted and ground-truth regions, while mAP, calculated at multiple IoU thresholds, assesses the model´s precision and robustness across different overlap criteria. We also report over-segmentation and under-segmentation rates, which provide insights into how accurately the model delineates the target region. Epoch 146 achieved a 0.8012 mIoU, 0.8878 mDSC, and 0.6450 mAP, with over-segmentation and under-segmentation values of 0.0855 and 0.1357, respectively, indicating a favourable balance between precision and recall in the model’s spine segmentation performance.
4.2. Cobb Angle Measurement
In this subsection, we present the results comparing the manual with the automated measurements of spinal curvature. The algorithm developed, inspired by the manual Cobb angle measurement method, provides a simple and rapid technique for landmark identification, Cobb angle quantification, and severity classification. This process involves evaluating the inclination of the vertebral bodies that constitute the spine. The manual Cobb angle measurement method is described as follows: (i) Identification of the apex: The first step involves determining the apex of the curve, defined as the vertebra that exhibits the greatest lateral displacement from the central axis of the spine; (ii) Selection of end vertebrae: Once the apex is identified, the upper and lower end vertebrae are determined based on their inclination. These correspond to the most tilted vertebrae. A straight line is drawn along the upper and lower endplates; and (iii) Cobb angle measurement: If the lines drawn along the endplates do not intersect, perpendicular lines are extended from each endplate line until an intersection point is established. The Cobb angle is then measured at this intersection, providing a quantitative assessment of spinal curvature. A goniometer is used to ensure accurate angle measurement. Intraclass correlation coefficients (ICCs) with 95% CIs were used to analyse the reliability; ICC < 0.70, 0.70–0.79, 0.80–0.89, and 0.9–0.99 were considered as poor, fair, good, and excellent reliability, respectively [44].
Two observers, both familiar with the Cobb angle measurement method, independently performed the measurements. The procedure required observers to identify the most tilted vertebral endplates on the X-ray images and then measure the Cobb angles between those vertebrae. The reliability and variability of the manual method, assessed through ICC and MAD ± SD, are presented in Table 3, showing an interobserver agreement of 0.939 (95% CI: 0.868–0.971) and a mean absolute difference of 3.31º ± 1.56º
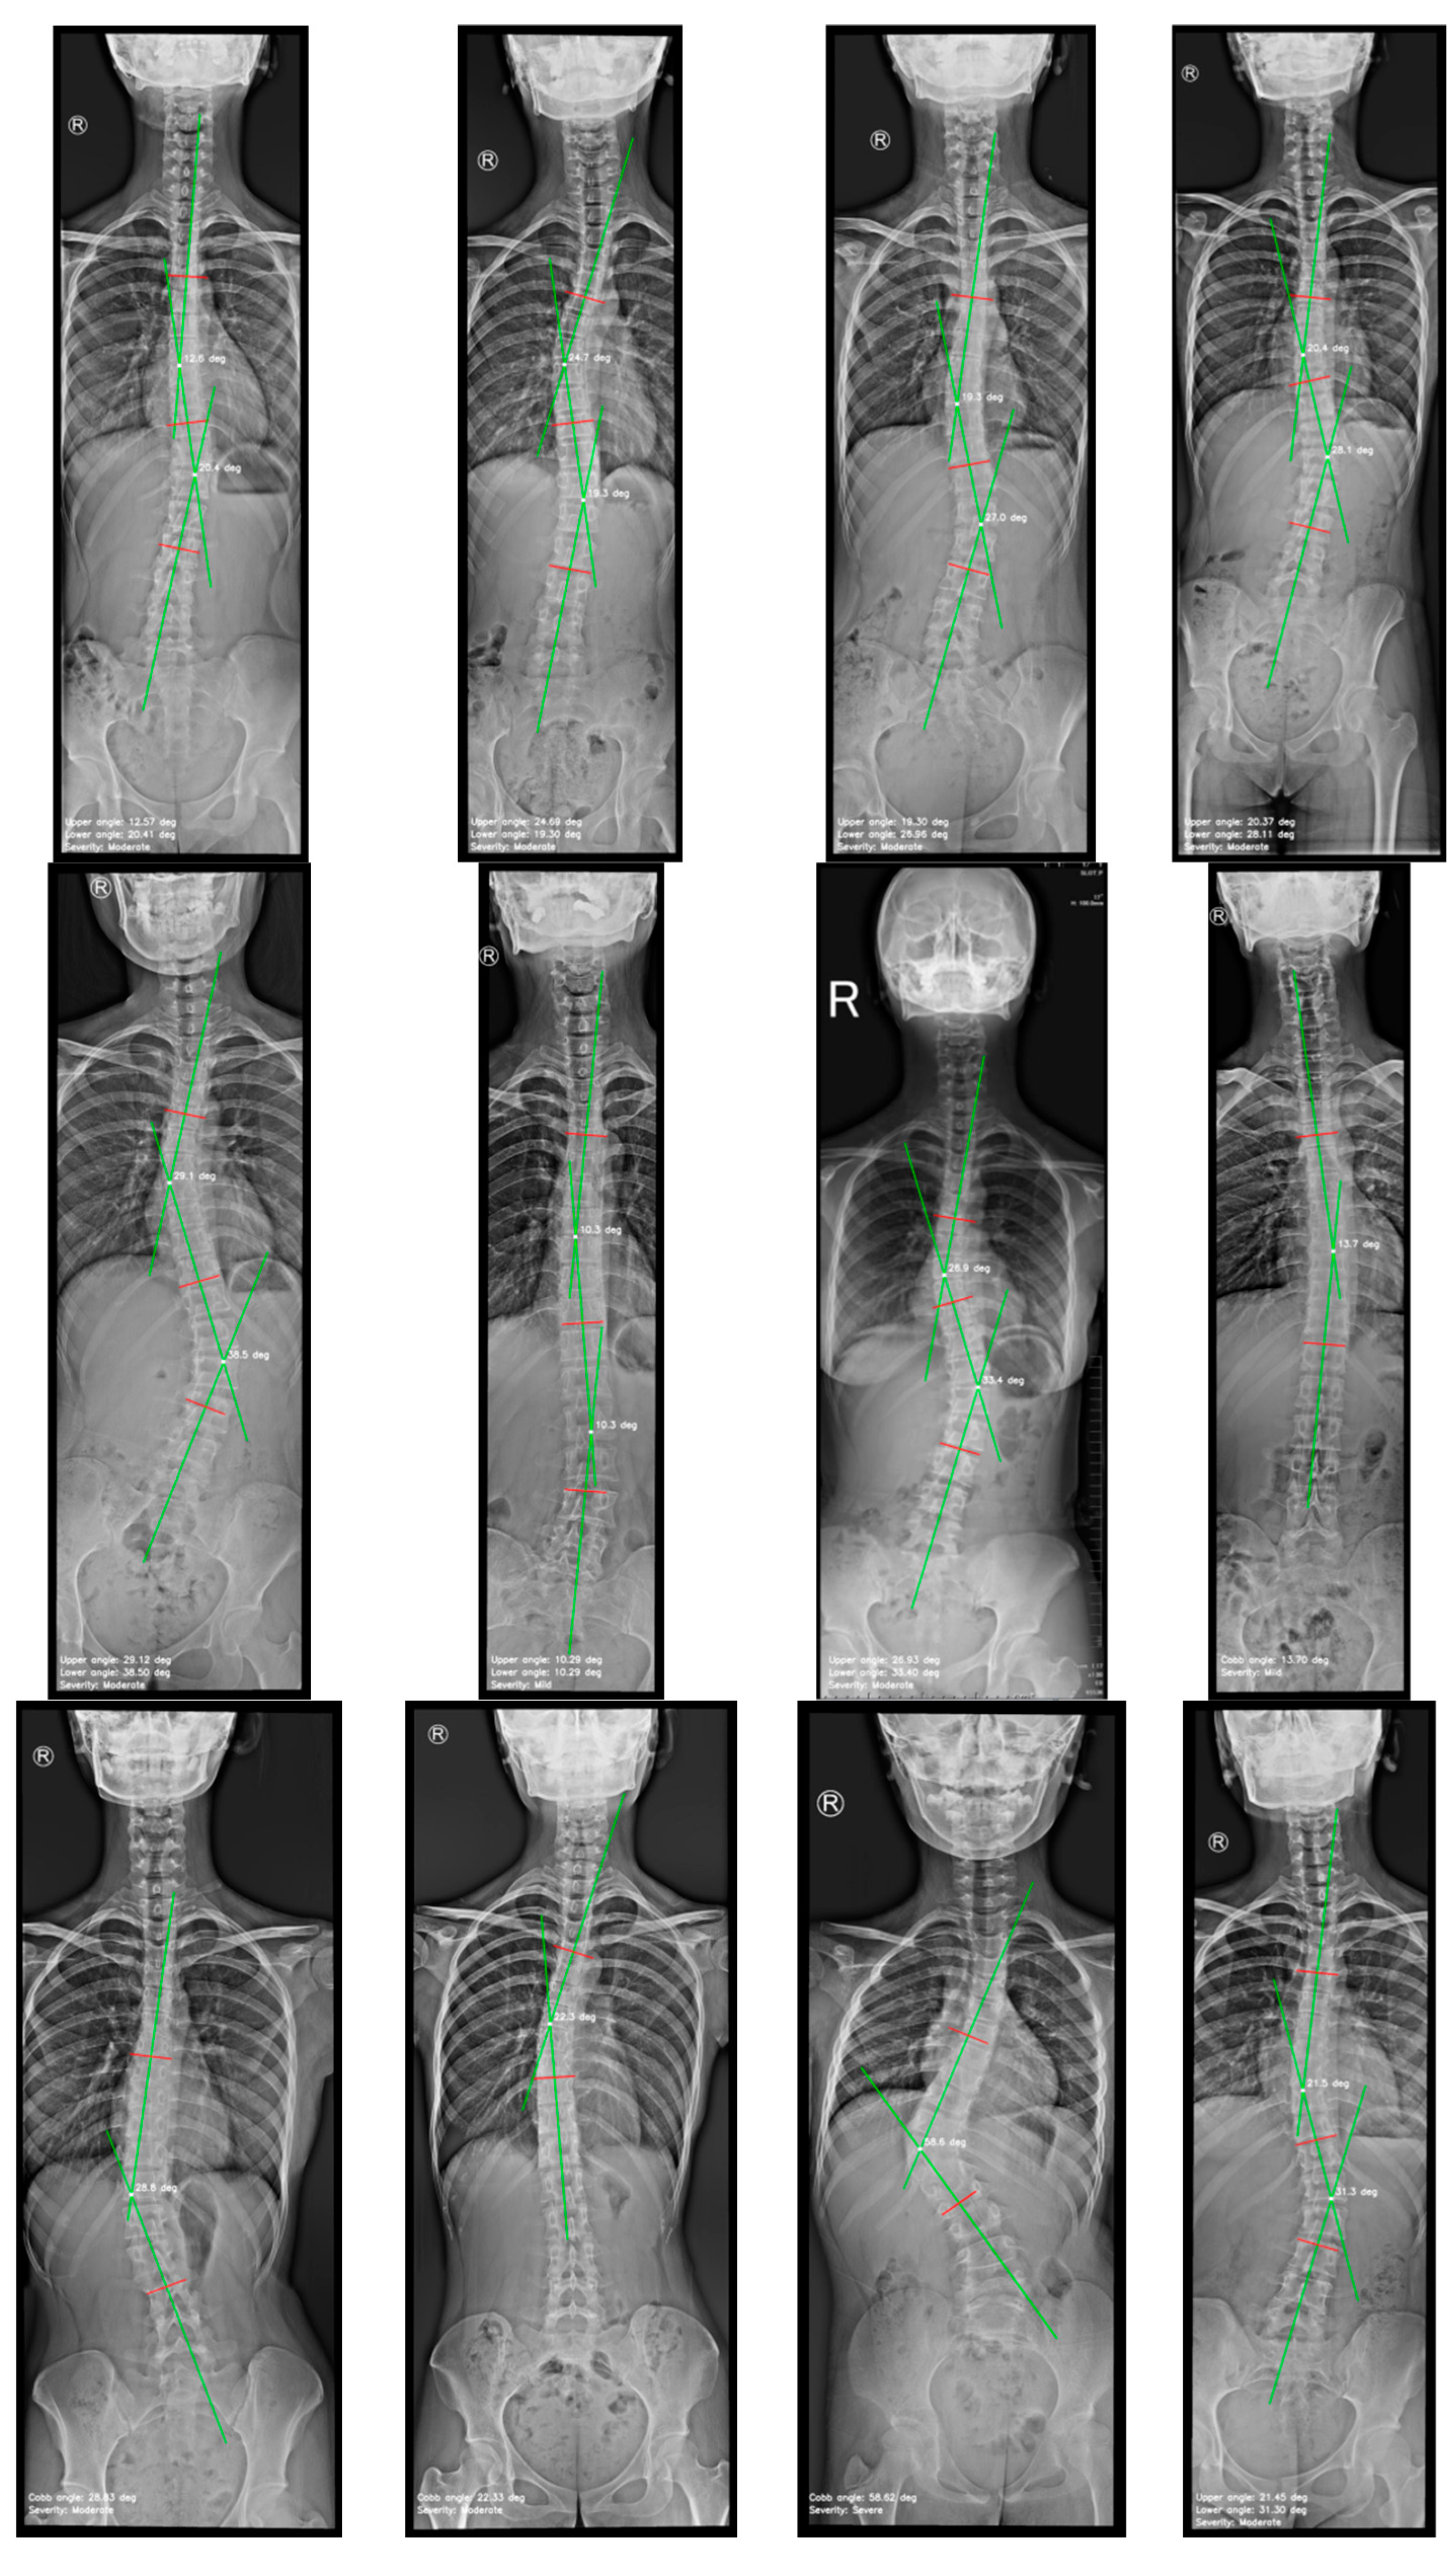
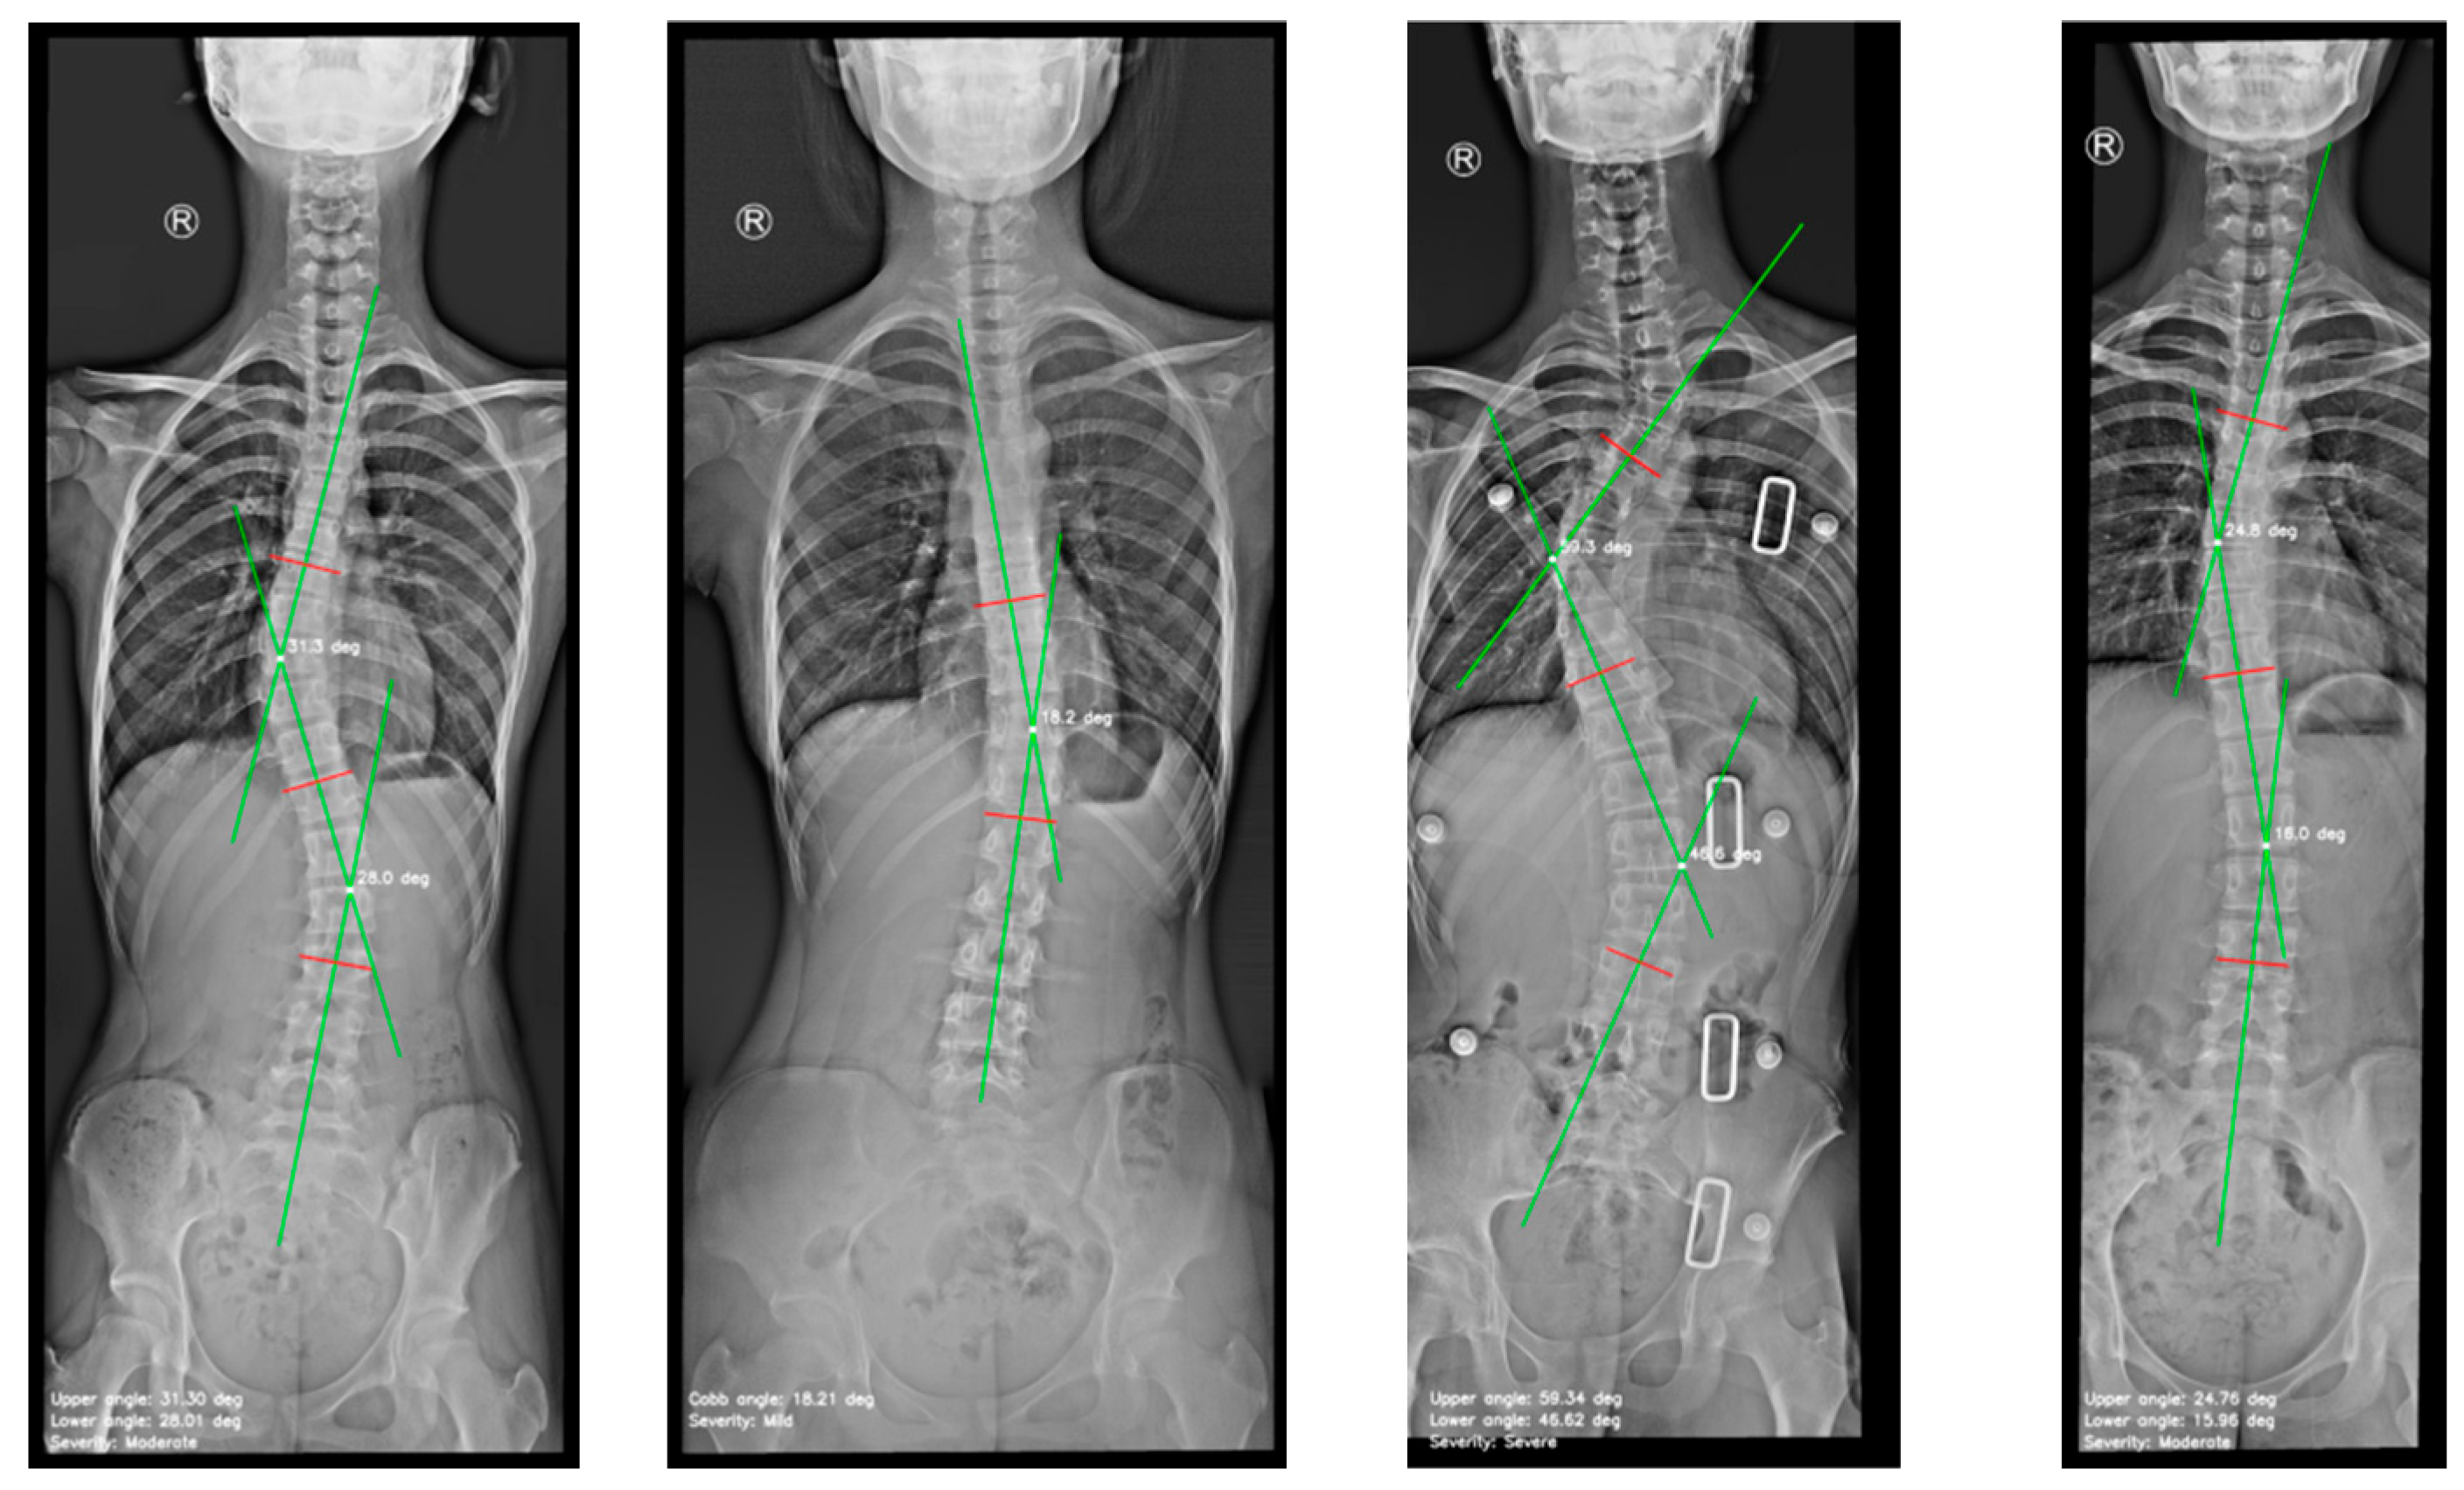
The variability between the results predicted by the model and the ground truth, specifically the manually measured Cobb angles, was compared across multiple X-ray images as shown in Figure 7.
Figure 9.
Images generated by the automated approach displaying the scoliosis assessment.
Bland-Altman analysis and the mean absolute difference (MAD) were used to evaluate the variability between the predicted and ground truth values, assessing the model´s ability to accurately estimate the Cobb angle and its consistency with manual measurements. The method achieves a high MAD, demonstrating strong agreement with manual measurements and highlighting its reliability and accuracy in scoliosis assessment.
Table 4.
Summary of manual and automated Cobb angle measurements on AP X-ray images.
| Cobb angle measurements | Mean ± Standard deviation (range) |
|---|---|
| Manual measurement by observer A | 25.43° ± 10.85° (range 11.50-54.00°) |
| Manual measurement by observer B | 25.89° ± 10.00° (range 10.00-53.00°) |
| Measured by the automated method | 26.69° ± 12.50° (range 10.29-59.34°) |
Table 5.
Summary of the agreement between manual and automated methods.
| Analysis | ICC (95% CI) | MAD ± SD | MAE ± SD |
|---|---|---|---|
| Observer A vs. observer B | 0.939 (0.868, 0.971) | 3.31º ± 1.56º | 3.31° ± 1.53° |
| Observer A vs. automated | 0.961 (0.926, 0.984) | 2.54º ± 2.10º | 2.54° ± 2.06° |
| Observer B vs. automated | 0.895 (0.780, 0.950) | 4.07º ± 3.29º | 4.07° ± 3.22° |
| Overall: Observer A & B vs. automated | 0.928 (0.853, 0.967) | 3.31º ± 2.69º | 2.96° ± 2.60° |
Intraclass Correlation Coefficient (ICC), Confidence Interval (CI), Mean Absolute Difference (MAD), Mean Absolute Error (MAE), and standard deviation (SD).
5. Discussion and Scope
In this paper, we propose a two-stage fully automated approach for scoliosis assessment using a convolutional neural network for spine detection and segmentation. On the one hand, Mask R-CNN network was trained identifying the spine in AP X-ray images and generate the mask, providing the core to apply the method. On the other hand, a set of algorithms were developed to quantify the Cobb angle and classify scoliosis severity. We evaluated the reliability and robustness of Mask R-CNN under a small dataset which comprises 98 images with 52% of the cases classified as moderate, 28% as mild, 13% as severe, and 7% as spinal curve. This imbalance classification may impact the model´s ability to generalise across severity levels. To mitigate this, we applied transfer learning with pre-trained weights, which improved the network´s performance. Validation metrics, including IoU of 0.8012, mDSC of 0.8878, and mAP of 0.6450, confirmed a reliable performance in spine detection and segmentation. Although a larger dataset is advantageous, our results suggest that Mask R-CNN can achieve high accuracy and consistency even when data availability is limited. We assessed the accuracy of the automated method through four indicators: Mean Absolute Difference and Standard Deviation (MAD ± SD); Mean Absolute Error and Standard Deviation (MAE ± SD); Intraclass Correlation Coefficient with 95% Confidence Interval ICC (95% CI); and Bland-Altman plots. The method proposed for Cobb angle quantification and severity classification achieved a MAD ± SD of 3.31º ± 2.69º, and a MAE ± SD of 2.96° ± 2.60°, and an ICC (95% CI) of 0.928 between observers and the automated method. The automated method required an average of 3.33 seconds per radiograph, providing a series of four images detailing the entire workflow and a data table, once the user uploaded the image. The average inter-observer discrepancy is reported as 3.31º ± 1.56º, demonstrating a performance similar to manual measurements. Additionally, it fell within the 95% confidence interval documented in the literature, 2.5 to 8.8 degrees for experienced readers [3], indicating a tighter range of variability compared with the readers in the field. Our approach is based on the simplicity of spinal segmentation when employing the mask generated by the neural network. Using single-instance segmentation to detect the spine as a single object, the training process is streamlined compared to methods in the literature that require more complex labelling. OpenCV’s cv2.findContours() function plays a fundamental role in detecting and extracting the spinal contour from the generated mask. Given that all images are standardised to a height of 2000 pixels, a predefined grid interval of 50 pixels is applied. This interval facilitates the extraction of midpoints along the spinal contour, enabling a precise representation of the spinal midline. A spline interpolation is applied to smooth the trajectory of the midpoints, providing a continuous depiction of the spinal alignment. Key anatomical landmarks, including tilted vertebrae and apex points, are identified based on curvature changes. The Cobb angle is then computed by drawing perpendicular lines at the most tilted vertebrae and measuring the angle formed at their intersection. We believe that providing a complete overview of this workflow enhances the expert’s understanding of the method, supports clinical diagnosis, and allows the storage of results to monitor scoliosis progression in patients.
Although the proposed automated Cobb angle measurement method presents promising results, various aspects require a more critical examination. Firstly, the limited dataset and the pronounced class imbalance, especially among moderate cases, may affect the model´s generalization to broader patient populations. Secondly, the reliance on precise single-instance segmentation implies that small errors in vertebral contour detection could significantly impact the Cobb angle measurement.
High-quality X-ray images requirement restricts the applicability of this approach in more realistic clinical environments, where images with noise or complex projections, such as overlapping anatomical structures or unusual patient rotations may be encountered. Finally, while the fixed grid interval, midpoint technique, and spline interpolation are efficient, the method assumes a relatively standard anatomy. In cases of severe or atypical deformities, the method may not represent the real spinal curvature, and therefore, overlooking key curvature details.
6. Conclusion
The results obtained in this study demonstrate that our approach achieves the primary objective of offering an automated method for Cobb angle quantification and scoliosis severity classification. The Mask R-CNN network under a single-instance segmentation scheme and the midpoint-based method applied in this study enabled the extraction of the scoliotic curve´s midline and the identification of tilted vertebrae necessary for Cobb angle estimation, achieving a strong agreement between automated and manual measurements. The indicators used for accuracy assessment suggest that the model may be acceptable for many clinical scenarios. Nevertheless, given that this study has been made using aa limited sample of 98 images with class imbalance, more extensive external validation is required to verify its robustness. The main advantage of the method is based on the simplicity of its labelling strategy, detecting the spine as a single object, and providing experts with a clear visualization of each stage in the scoliosis assessment. This enhances the interpretability of the results, facilitates monitoring, and enables comparison for improved the analysis of the scoliosis progression.
The absence of large-scale clinical testing constitutes the main limitation. It is likely that increasing the range of patience variability and image conditions such as noise will affect the network´s performance. This could directly impact diagnoses, especially in cases where a few degrees of measurement error in the Cobb angle could alter scoliosis classification. For clinical implementation, a comprehensive validation process is required to evaluate the method´s performance across different patient populations, image qualities, and degrees of deformity, ensuring reliability in daily practice.
References
- ‘Scoliosis | Scoliosis Research Society’. Accessed: Sep. 12, 2024. [Online]. Available: https://www.srs.org/Patients/Conditions/Scoliosis.
- M.-H. Horng, C.-P. Kuok, M.-J. Fu, C.-J. Lin, and Y.-N. Sun, ‘Cobb Angle Measurement of Spine from X-Ray Images Using Convolutional Neural Network’, Computational and Mathematical Methods in Medicine, vol. 2019, no. 1, p. 6357171, 2019. [CrossRef]
- K. Li et al., ‘Deep learning automates Cobb angle measurement compared with multi-expert observers’, arXiv.org. Accessed: Oct. 06, 2024. [Online]. Available: https://arxiv.org/abs/2403.12115v1.
- A. Thalengala, S. N. Bhat, and H. Anitha, ‘Computerized image understanding system for reliable estimation of spinal curvature in idiopathic scoliosis’, Sci Rep, vol. 11, no. 1, p. 7144, Mar. 2021. [CrossRef]
- S. Han et al., ‘Application of machine learning standardized integral area algorithm in measuring the scoliosis’, Sci Rep, vol. 13, no. 1, p. 19255, Nov. 2023. [CrossRef]
- P. Wiliński, A. Piekutin, K. Dmowska, W. Zawieja, and P. Janusz, ‘Which Method of the Radiologic Measurements of the Angle of Curvature in Idiopathic Scoliosis is the Most Reliable for an Inexperienced Researcher?’, Indian J Orthop, vol. 59, no. 2, pp. 140–147, Feb. 2025. [CrossRef]
- ‘Vertebral column | Anatomy & Function | Britannica’. Accessed: Feb. 06, 2025. [Online]. Available: https://www.britannica.com/science/vertebral-column.
- B. Khanal, L. Dahal, P. Adhikari, and B. Khanal, ‘Automatic Cobb Angle Detection Using Vertebra Detector and Vertebra Corners Regression’, in Computational Methods and Clinical Applications for Spine Imaging, Y. Cai, L. Wang, M. Audette, G. Zheng, and S. Li, Eds., Cham: Springer International Publishing, 2020, pp. 81–87. [CrossRef]
- X. Fu, G. Yang, K. Zhang, N. Xu, and J. Wu, ‘An automated estimator for Cobb angle measurement using multi-task networks’, Neural Comput & Applic, vol. 33, no. 10, pp. 4755–4761, May 2021. [CrossRef]
- X. Huang et al., ‘The Comparison of Convolutional Neural Networks and the Manual Measurement of Cobb Angle in Adolescent Idiopathic Scoliosis’, Global Spine Journal, vol. 14, no. 1, pp. 159–168, Jan. 2024. [CrossRef]
- W. Caesarendra, W. Rahmaniar, J. Mathew, and A. Thien, ‘Automated Cobb Angle Measurement for Adolescent Idiopathic Scoliosis Using Convolutional Neural Network’, Diagnostics, vol. 12, no. 2, Art. no. 2, Feb. 2022. [CrossRef]
- C.-S. E. Chui et al., ‘Deep Learning-Based Prediction Model for the Cobb Angle in Adolescent Idiopathic Scoliosis Patients’, Diagnostics (Basel), vol. 14, no. 12, p. 1263, Jun. 2024. [CrossRef]
- ‘Deep learning automates Cobb angle measurement compared with multi-expert observers’. Accessed: Jun. 25, 2024. [Online]. Available: https://arxiv.org/html/2403.12115v1.
- M. Gstoettner, K. Sekyra, N. Walochnik, P. Winter, R. Wachter, and C. M. Bach, ‘Inter- and intraobserver reliability assessment of the Cobb angle: manual versus digital measurement tools’, Eur Spine J, vol. 16, no. 10, pp. 1587–1592, Oct. 2007. [CrossRef]
- H. Anitha, A. K. Karunakar, and K. V. N. Dinesh, ‘Automatic extraction of vertebral endplates from scoliotic radiographs using customized filter’, Biomed. Eng. Lett., vol. 4, no. 2, pp. 158–165, Jun. 2014. [CrossRef]
- R. Kundu, P. Lenka, R. Kumar, and A. Chakrabarti, ‘Cobb Angle Quantification for Scoliosis Using Image Processing Techniques’.
- K. He, G. Gkioxari, P. Dollár, and R. Girshick, ‘Mask R-CNN’, Jan. 24, 2018, arXiv: arXiv:1703.06870. [CrossRef]
- T. Vrtovec, F. Pernuš, and B. Likar, ‘A review of methods for quantitative evaluation of spinal curvature’, Eur Spine J, vol. 18, no. 5, pp. 593–607, May 2009. [CrossRef]
- C. Jin, S. Wang, G. Yang, E. Li, and Z. Liang, ‘A Review of the Methods on Cobb Angle Measurements for Spinal Curvature’, Sensors, vol. 22, no. 9, Art. no. 9, Jan. 2022. [CrossRef]
- M. Gstoettner, K. Sekyra, N. Walochnik, P. Winter, R. Wachter, and C. M. Bach, ‘Inter- and intraobserver reliability assessment of the Cobb angle: manual versus digital measurement tools’, Eur Spine J, vol. 16, no. 10, pp. 1587–1592, Oct. 2007. [CrossRef]
- H. Sun, X. Zhen, C. Bailey, P. Rasoulinejad, Y. Yin, and S. Li, Direct Estimation of Spinal Cobb Angles by Structured Multi-Output Regression, vol. 10265. 2017. [CrossRef]
- H. Wu, C. Bailey, P. Rasoulinejad, and S. Li, ‘Automatic Landmark Estimation for Adolescent Idiopathic Scoliosis Assessment Using BoostNet’, in Medical Image Computing and Computer Assisted Intervention − MICCAI 2017, M. Descoteaux, L. Maier-Hein, A. Franz, P. Jannin, D. L. Collins, and S. Duchesne, Eds., Cham: Springer International Publishing, 2017, pp. 127–135. [CrossRef]
- H. Wu, C. Bailey, P. Rasoulinejad, and S. Li, ‘Automated comprehensive Adolescent Idiopathic Scoliosis assessment using MVC-Net’, Medical Image Analysis, vol. 48, pp. 1–11, Aug. 2018. [CrossRef]
- B. Chen, Q. Xu, L. Wang, S. Leung, J. Chung, and S. Li, ‘An Automated and Accurate Spine Curve Analysis System’, IEEE Access, vol. 7, pp. 124596–124605, 2019. [CrossRef]
- J. Yang et al., ‘Development and validation of deep learning algorithms for scoliosis screening using back images’, Commun Biol, vol. 2, no. 1, pp. 1–8, Oct. 2019. [CrossRef]
- J. Yi, P. Wu, Q. Huang, H. Qu, and D. N. Metaxas, ‘Vertebra-Focused Landmark Detection for Scoliosis Assessment’, in 2020 IEEE 17th International Symposium on Biomedical Imaging (ISBI), Apr. 2020, pp. 736–740. [CrossRef]
- J. Cerqueiro, A. Comesaña-Campos, M. Casal-Guisande, and J. Bouza-Rodríguez, A proposal for using active contour parametrical models in Cobb angle determination. 2021. [CrossRef]
- Y. Sun, Y. Xing, Z. Zhao, X. Meng, G. Xu, and Y. Hai, ‘Comparison of manual versus automated measurement of Cobb angle in idiopathic scoliosis based on a deep learning keypoint detection technology’, Eur Spine J, vol. 31, no. 8, pp. 1969–1978, Aug. 2022. [CrossRef]
- Y. Maeda, T. Nagura, M. Nakamura, and K. Watanabe, ‘Automatic measurement of the Cobb angle for adolescent idiopathic scoliosis using convolutional neural network’, Sci Rep, vol. 13, no. 1, p. 14576, Sep. 2023. [CrossRef]
- Z. Qiu, J. Yang, and J. Wang, ‘MMA-Net: Multiple Morphology-Aware Network for Automated Cobb Angle Measurement’, Sep. 24, 2023, arXiv: arXiv:2309.13817. [CrossRef]
- A. Suri et al., ‘Conquering the Cobb Angle: A Deep Learning Algorithm for Automated, Hardware-Invariant Measurement of Cobb Angle on Radiographs in Patients with Scoliosis’, Radiology: Artificial Intelligence, vol. 5, no. 4, p. e220158, Jul. 2023. [CrossRef]
- A. Hoblidar and G. Prabhu, ‘Automatic Quantification of Spinal Curvature in Scoliotic Radiograph using Image Processing’, Journal of medical systems, vol. 36, pp. 1943–51, Jun. 2011. [CrossRef]
- O. Ronneberger, P. Fischer, and T. Brox, ‘U-Net: Convolutional Networks for Biomedical Image Segmentation’, May 18, 2015, arXiv: arXiv:1505.04597. [CrossRef]
- A. O. Vuola, S. U. Akram, and J. Kannala, ‘Mask-RCNN and U-net Ensembled for Nuclei Segmentation’, Jan. 29, 2019, arXiv: arXiv:1901.10170. [CrossRef]
- R. H. Alharbi, M. B. Alshaye, M. M. Alkanhal, N. M. Alharbi, M. A. Alzahrani, and O. A. Alrehaili, ‘Deep Learning Based Algorithm For Automatic Scoliosis Angle Measurement’, in 2020 3rd International Conference on Computer Applications & Information Security (ICCAIS), Mar. 2020, pp. 1–5. [CrossRef]
- L. Zhang, L. Shi, J. C.-Y. Cheng, W. C.-W. Chu, and S. C.-H. Yu, ‘LPAQR-Net: Efficient Vertebra Segmentation From Biplanar Whole-Spine Radiographs’, IEEE Journal of Biomedical and Health Informatics, vol. 25, no. 7, pp. 2710–2721, Jul. 2021. [CrossRef]
- Y. Zhao, J. Zhang, H. Li, X. Gu, Z. Li, and S. Zhang, ‘Automatic Cobb angle measurement method based on vertebra segmentation by deep learning’, Medical & Biological Engineering & Computing, vol. 60, Jun. 2022. [CrossRef]
- J. C. WONG, M. Z. REFORMAT, E. C. PARENT, K. P. STAMPE, S. C. SOUTHON HRYNIUK, and E. H. LOU, ‘Validation of an artificial intelligence-based method to automate Cobb angle measurement on spinal radiographs of children with adolescent idiopathic scoliosis’, Eur J Phys Rehabil Med, vol. 54, no. 4, pp. 535–542, Sep. 2023. [CrossRef]
- N. Johari, ‘Automated Cobb angle measurement in scoliosis radiographs: A deep learning approach for screening - Annals Singapore’. Accessed: Jan. 21, 2025. [Online]. Available: https://annals.edu.sg/automated-cobb-angle-measurement-in-scoliosis-radiographs-a-deep-learning-approach-for-screening/.
- Z. Liang et al., ‘From 2D to 3D: Automatic measurement of the Cobb angle in adolescent idiopathic scoliosis with the weight-bearing 3D imaging’, The Spine Journal, Apr. 2024. [CrossRef]
- W. Rahmaniar, K. Suzuki, and T.-L. Lin, ‘Auto-CA: Automated Cobb Angle Measurement Based on Vertebrae Detection for Assessment of Spinal Curvature Deformity’, IEEE Transactions on Biomedical Engineering, vol. 71, no. 2, pp. 640–649, Feb. 2024. [CrossRef]
- D. K. I. Kassab, I. G. Kamyshanskaya, and A. A. Pershin, ‘Automatic scoliosis angle measurement using deep learning methods, how far we are from clinical application: A narrative review’.
- M. Maharasi, N. Senthilnayaki, and K. Snehaprabha, ‘Vertebrae Landmark Detection and Scoliosis Assessment Using Deep Learning’, 2024 International Conference on Communication, Computing and Internet of Things (IC3IoT), pp. 1–6, Apr. 2024. [CrossRef]
- Y. Pan et al., ‘Evaluation of a computer-aided method for measuring the Cobb angle on chest X-rays’, Eur Spine J, vol. 28, no. 12, pp. 3035–3043, Dec. 2019. [CrossRef]
- X. Z. Low et al., ‘Automated Cobb angle measurement in scoliosis radiographs: A deep learning approach for screening’, Ann Acad Med Singap, vol. 53, no. 10, pp. 635–637, Oct. 2024. [CrossRef]
- ‘AASCE | AASCE - MICCAI 2019 Challenge: Accurate Automated Spinal Curvature Estimation’. Accessed: Feb. 01, 2025. [Online]. Available: https://aasce19.github.io/.
- M.-H. Horng, C.-P. Kuok, M.-J. Fu, C.-J. Lin, and Y.-N. Sun, ‘Cobb Angle Measurement of Spine from X-Ray Images Using Convolutional Neural Network’, Comput Math Methods Med, vol. 2019, p. 6357171, Feb. 2019. [CrossRef]
- A. Singla, AarohiSingla/Mask-R-CNN-using-Tensorflow2. (Dec. 20, 2024). Jupyter Notebook. Accessed: Jan. 30, 2025. [Online]. Available: https://github.com/AarohiSingla/Mask-R-CNN-using-Tensorflow2.
- A. Gad, ahmedfgad/Mask-RCNN-TF2. (Feb. 04, 2025). Python. Accessed: Feb. 08, 2025. [Online]. Available: https://github.com/ahmedfgad/Mask-RCNN-TF2.
Figure 1.
The vertebral column [7].
Figure 1.
The vertebral column [7].
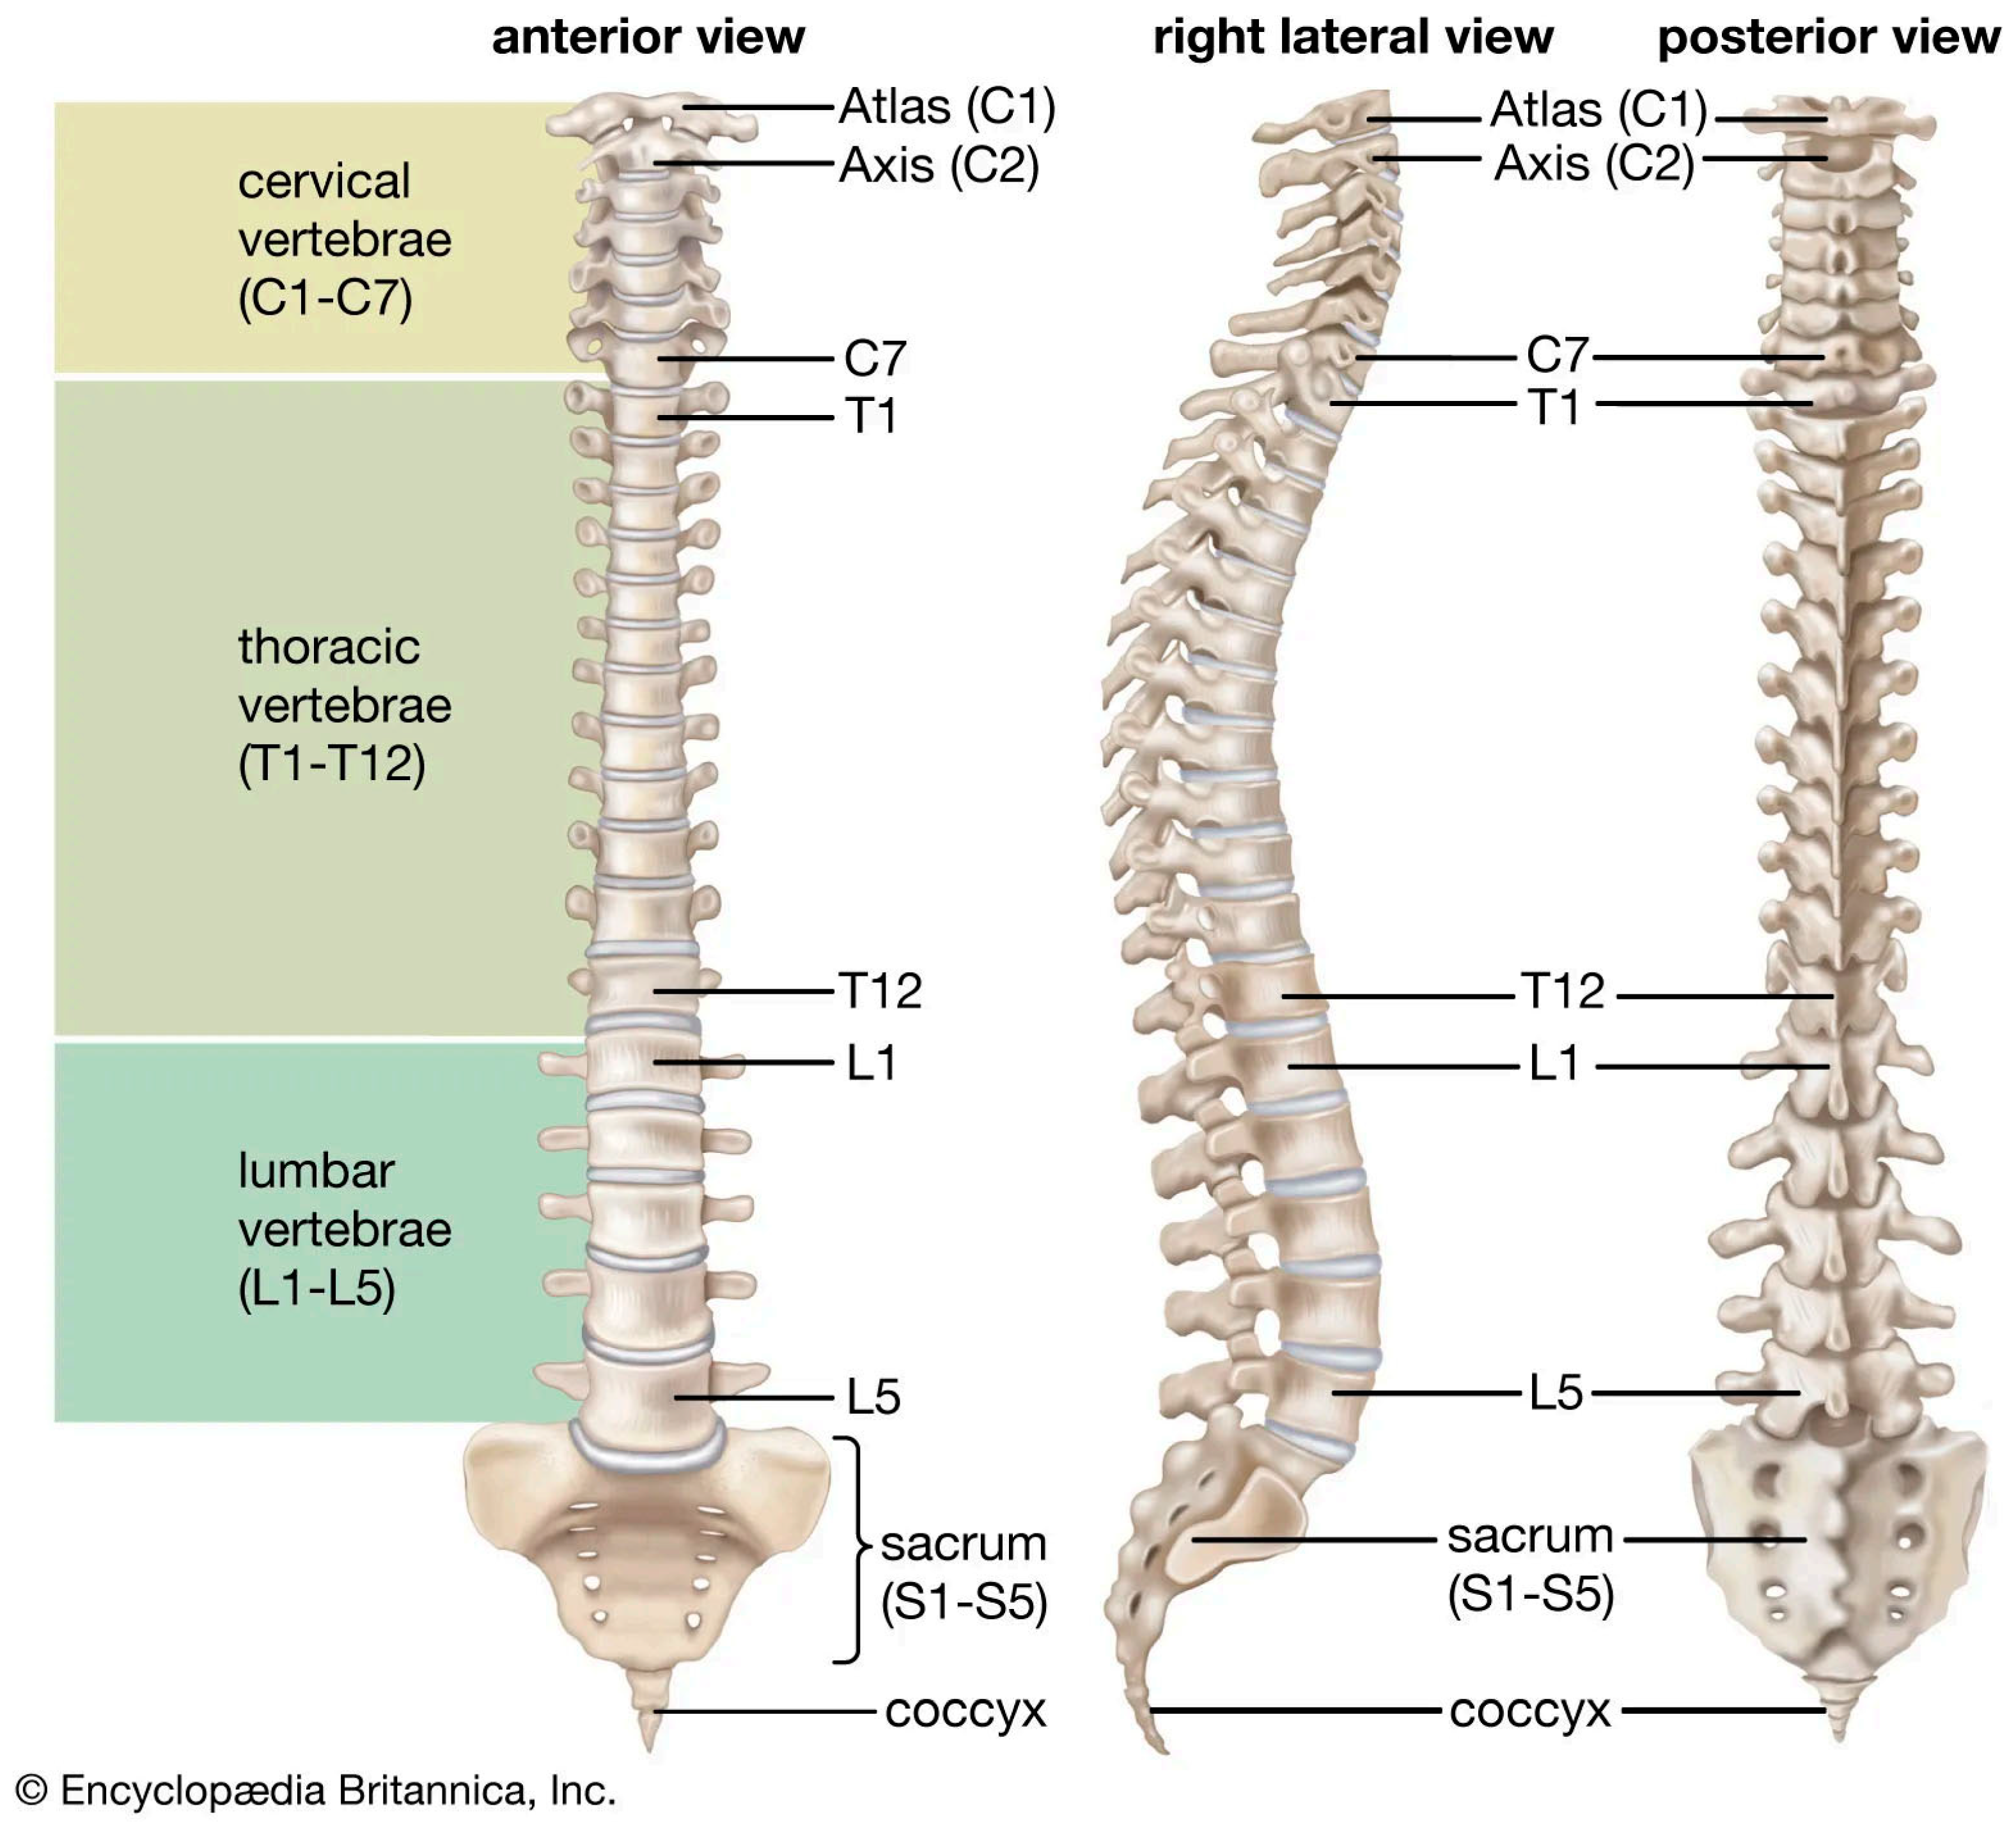
Figure 2.
Evaluation of coronal spinal curvature in 2D images. (a) Ferguson method, (b) Cobb method, (c) Greenspan index, (d) Diab method and (e) Centroid method [4].
Figure 2.
Evaluation of coronal spinal curvature in 2D images. (a) Ferguson method, (b) Cobb method, (c) Greenspan index, (d) Diab method and (e) Centroid method [4].
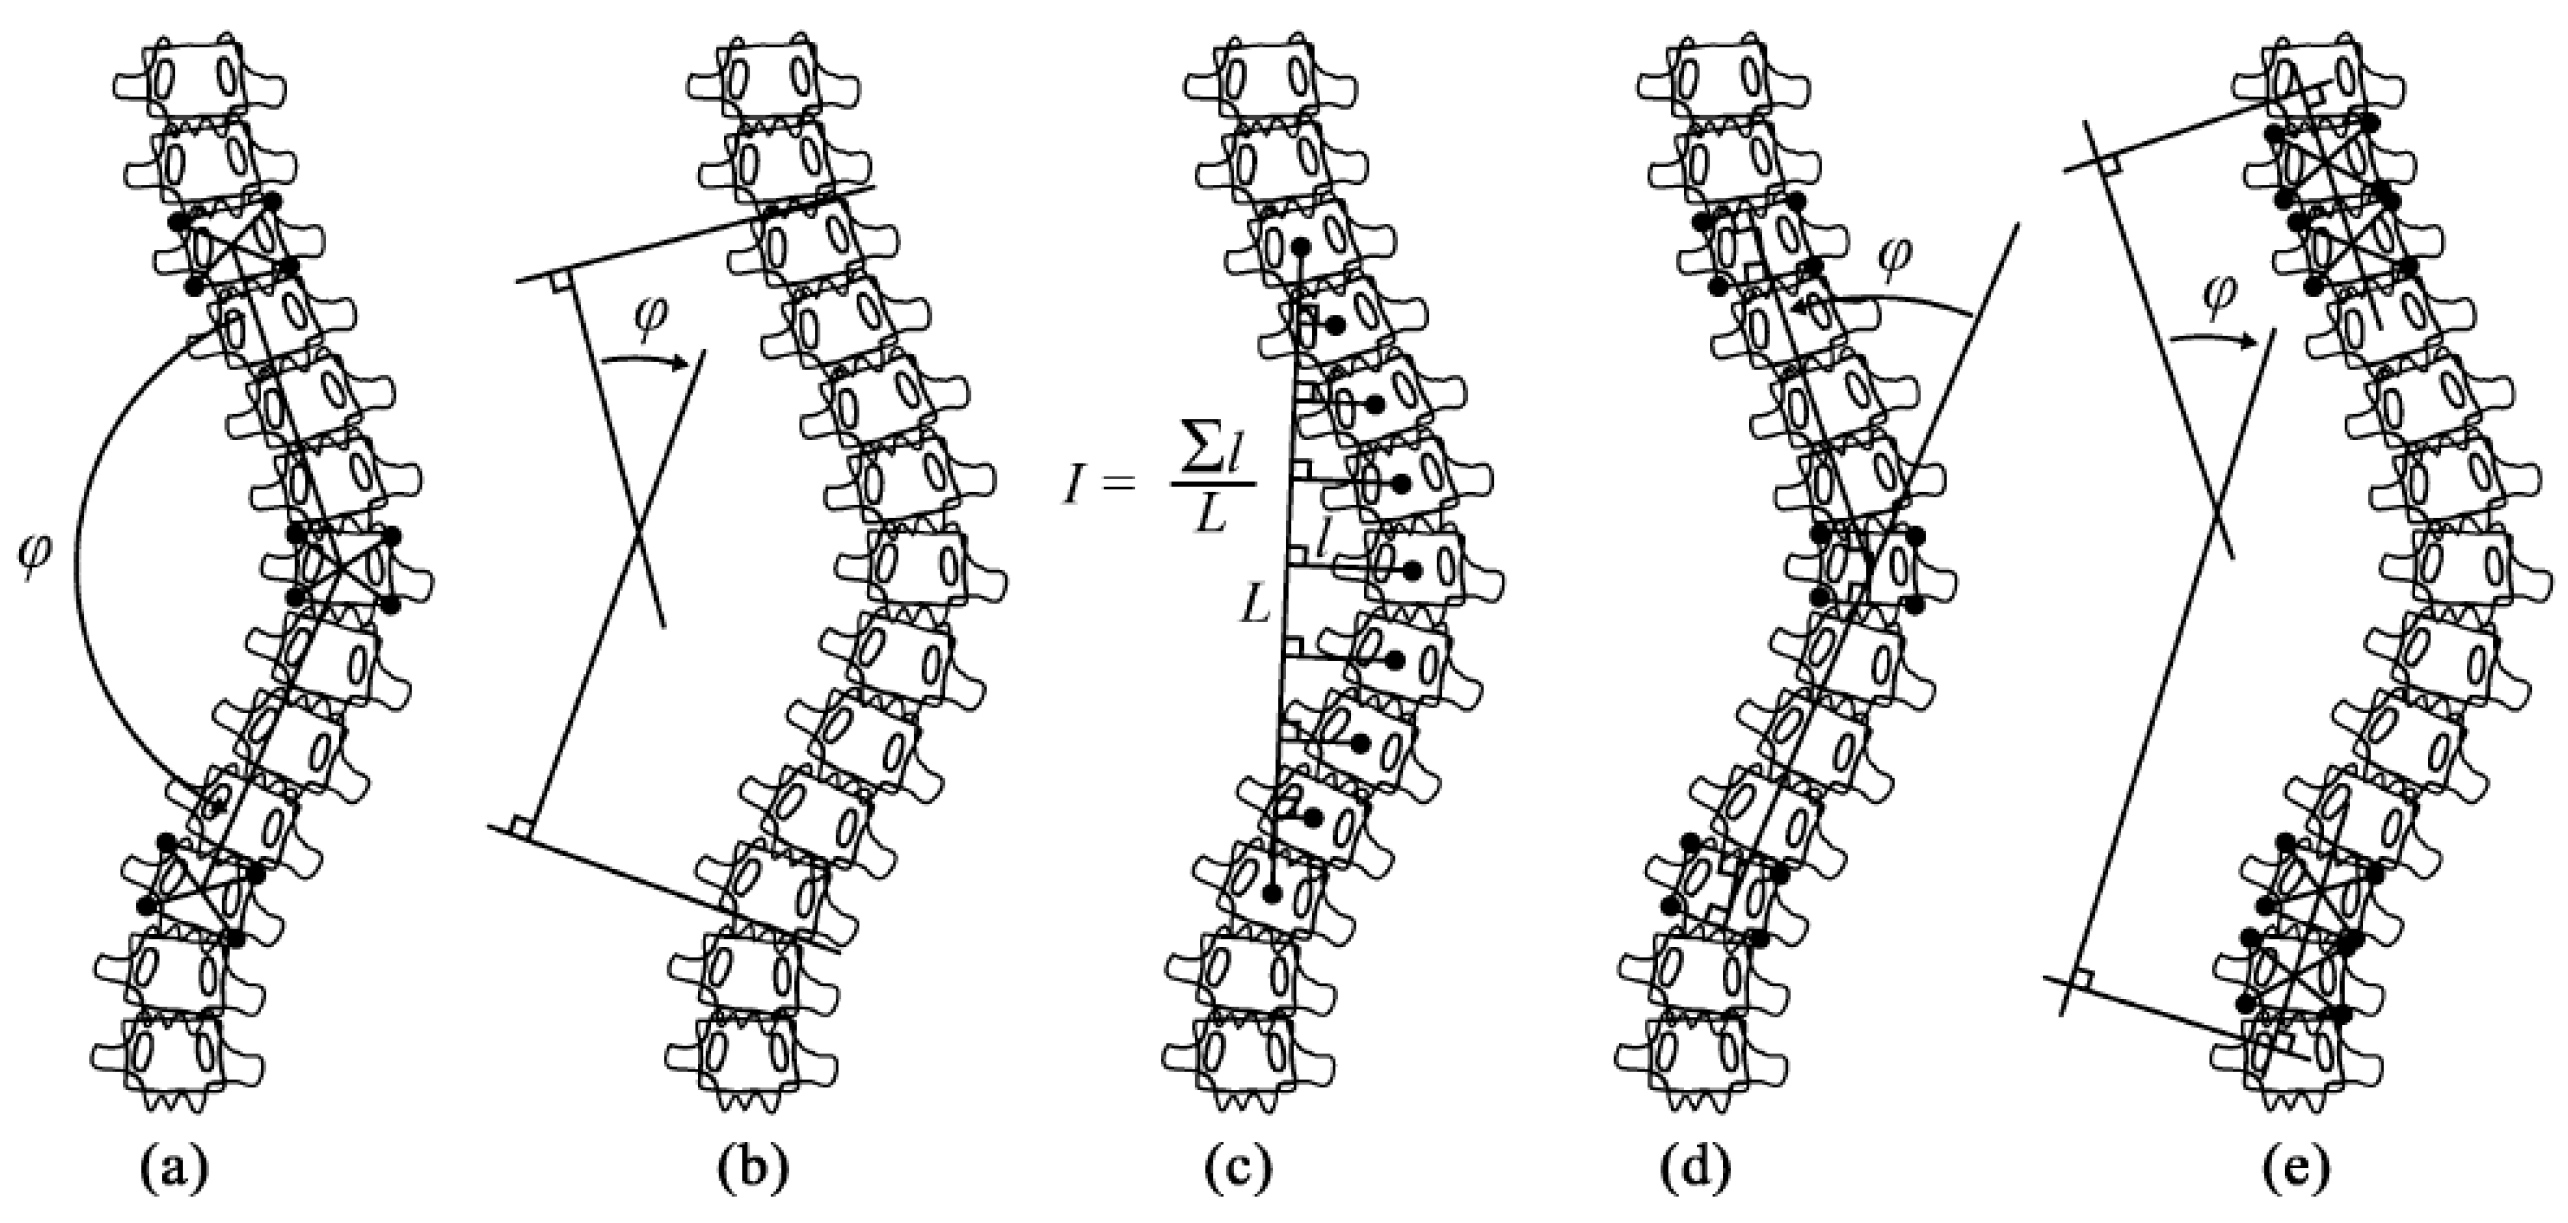
Figure 4.
Measurement using the Cobb method [2].
Figure 4.
Measurement using the Cobb method [2].
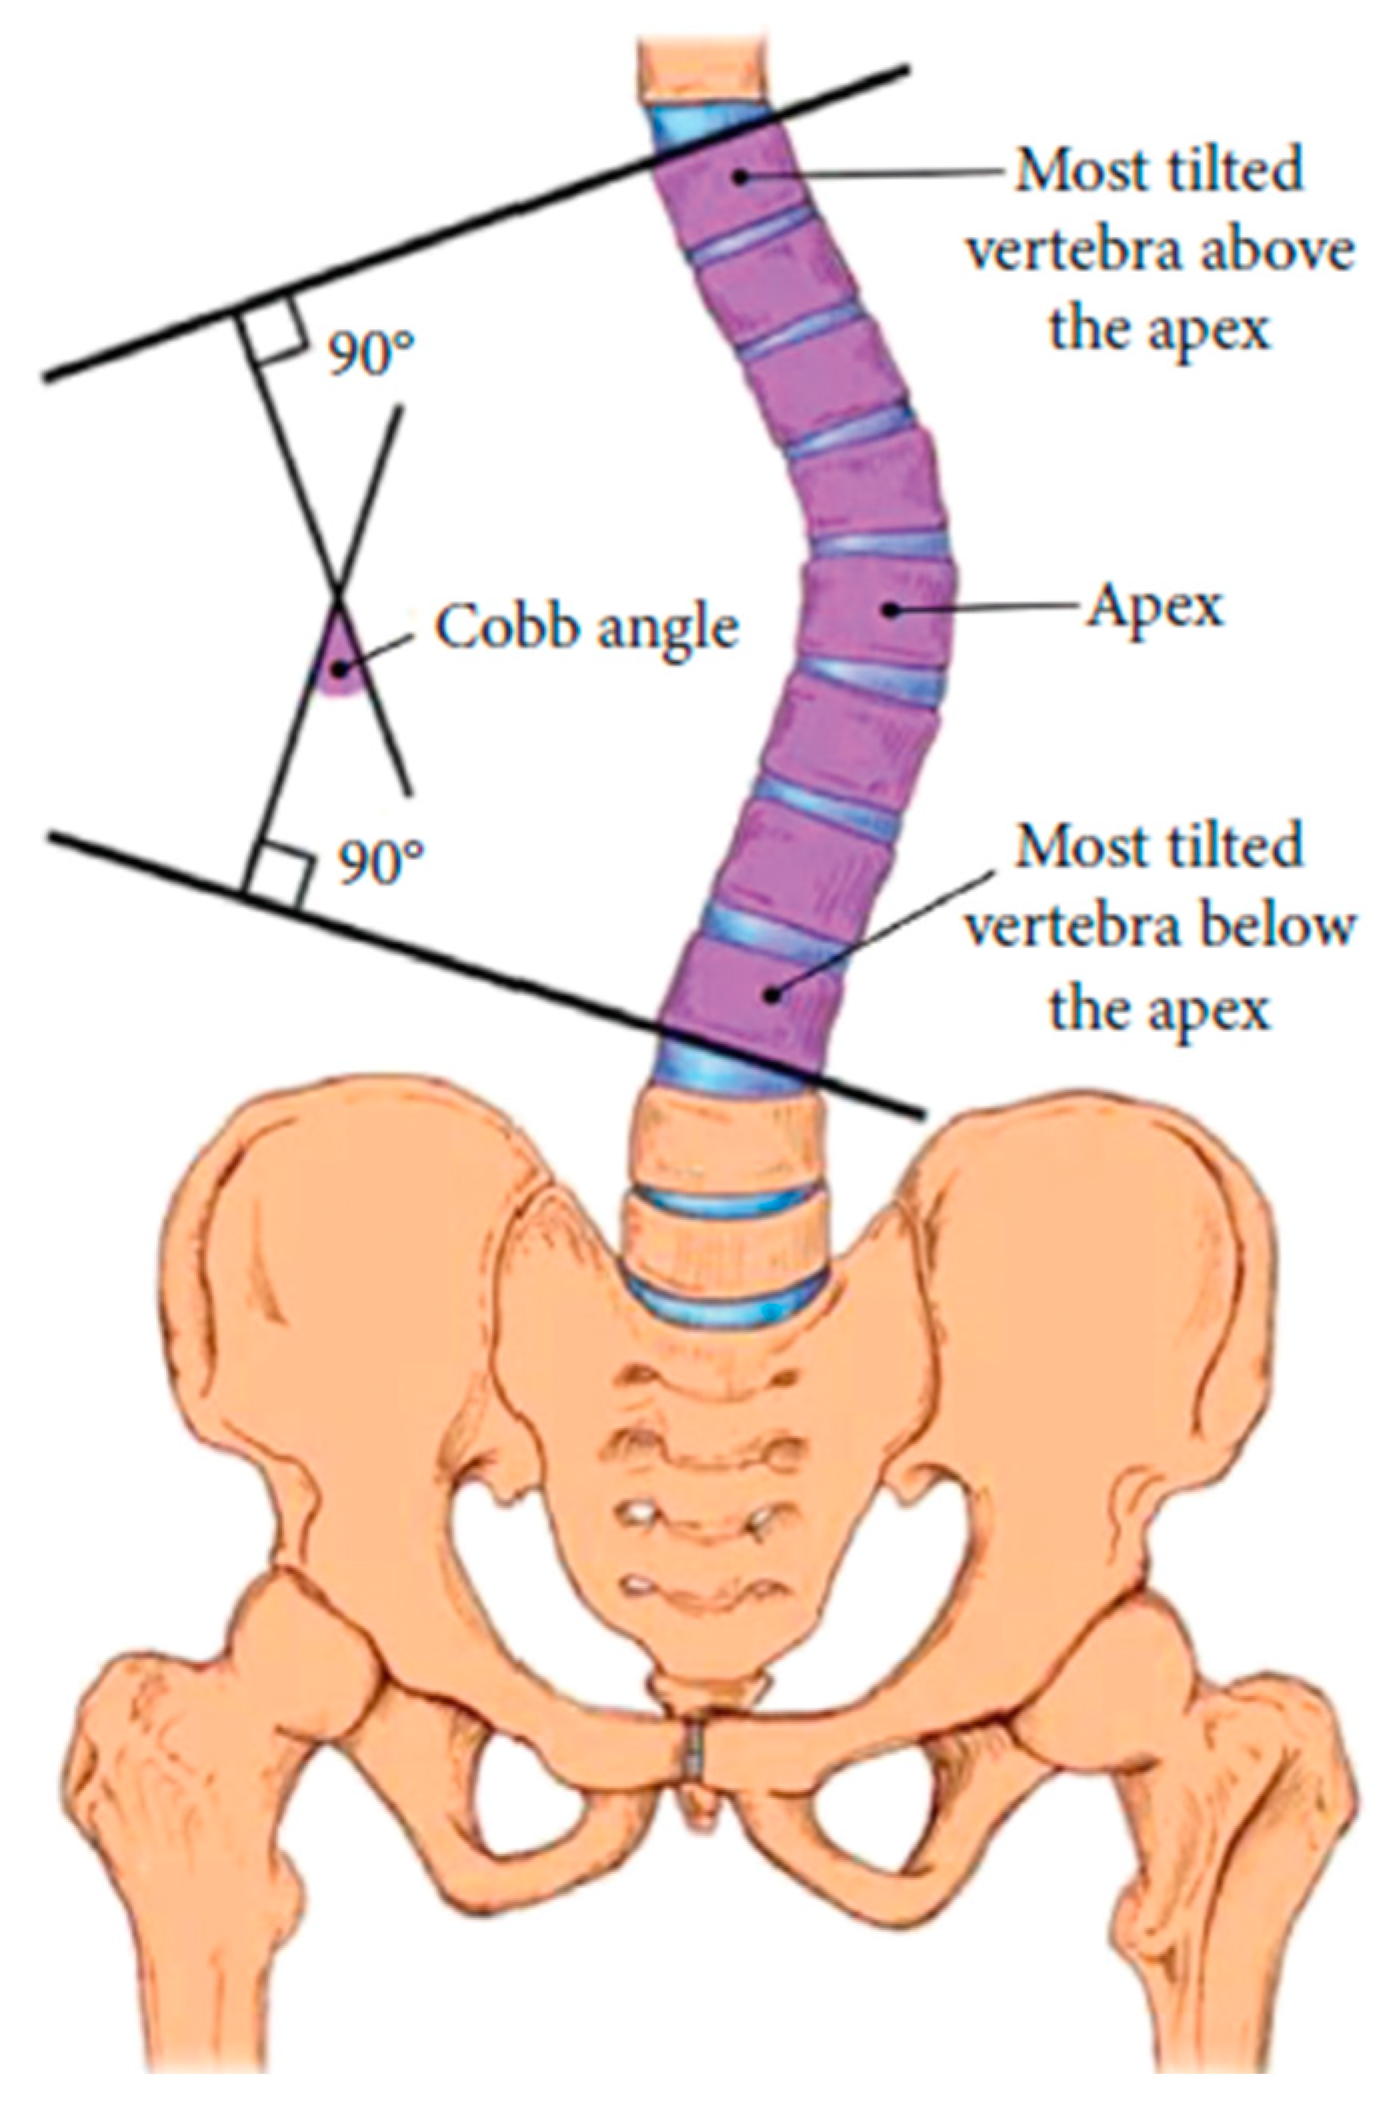
Figure 5.
End-to-end workflow for comprehensive spinal curvature assessment using Mask R-CNN and our automated method.
Figure 5.
End-to-end workflow for comprehensive spinal curvature assessment using Mask R-CNN and our automated method.
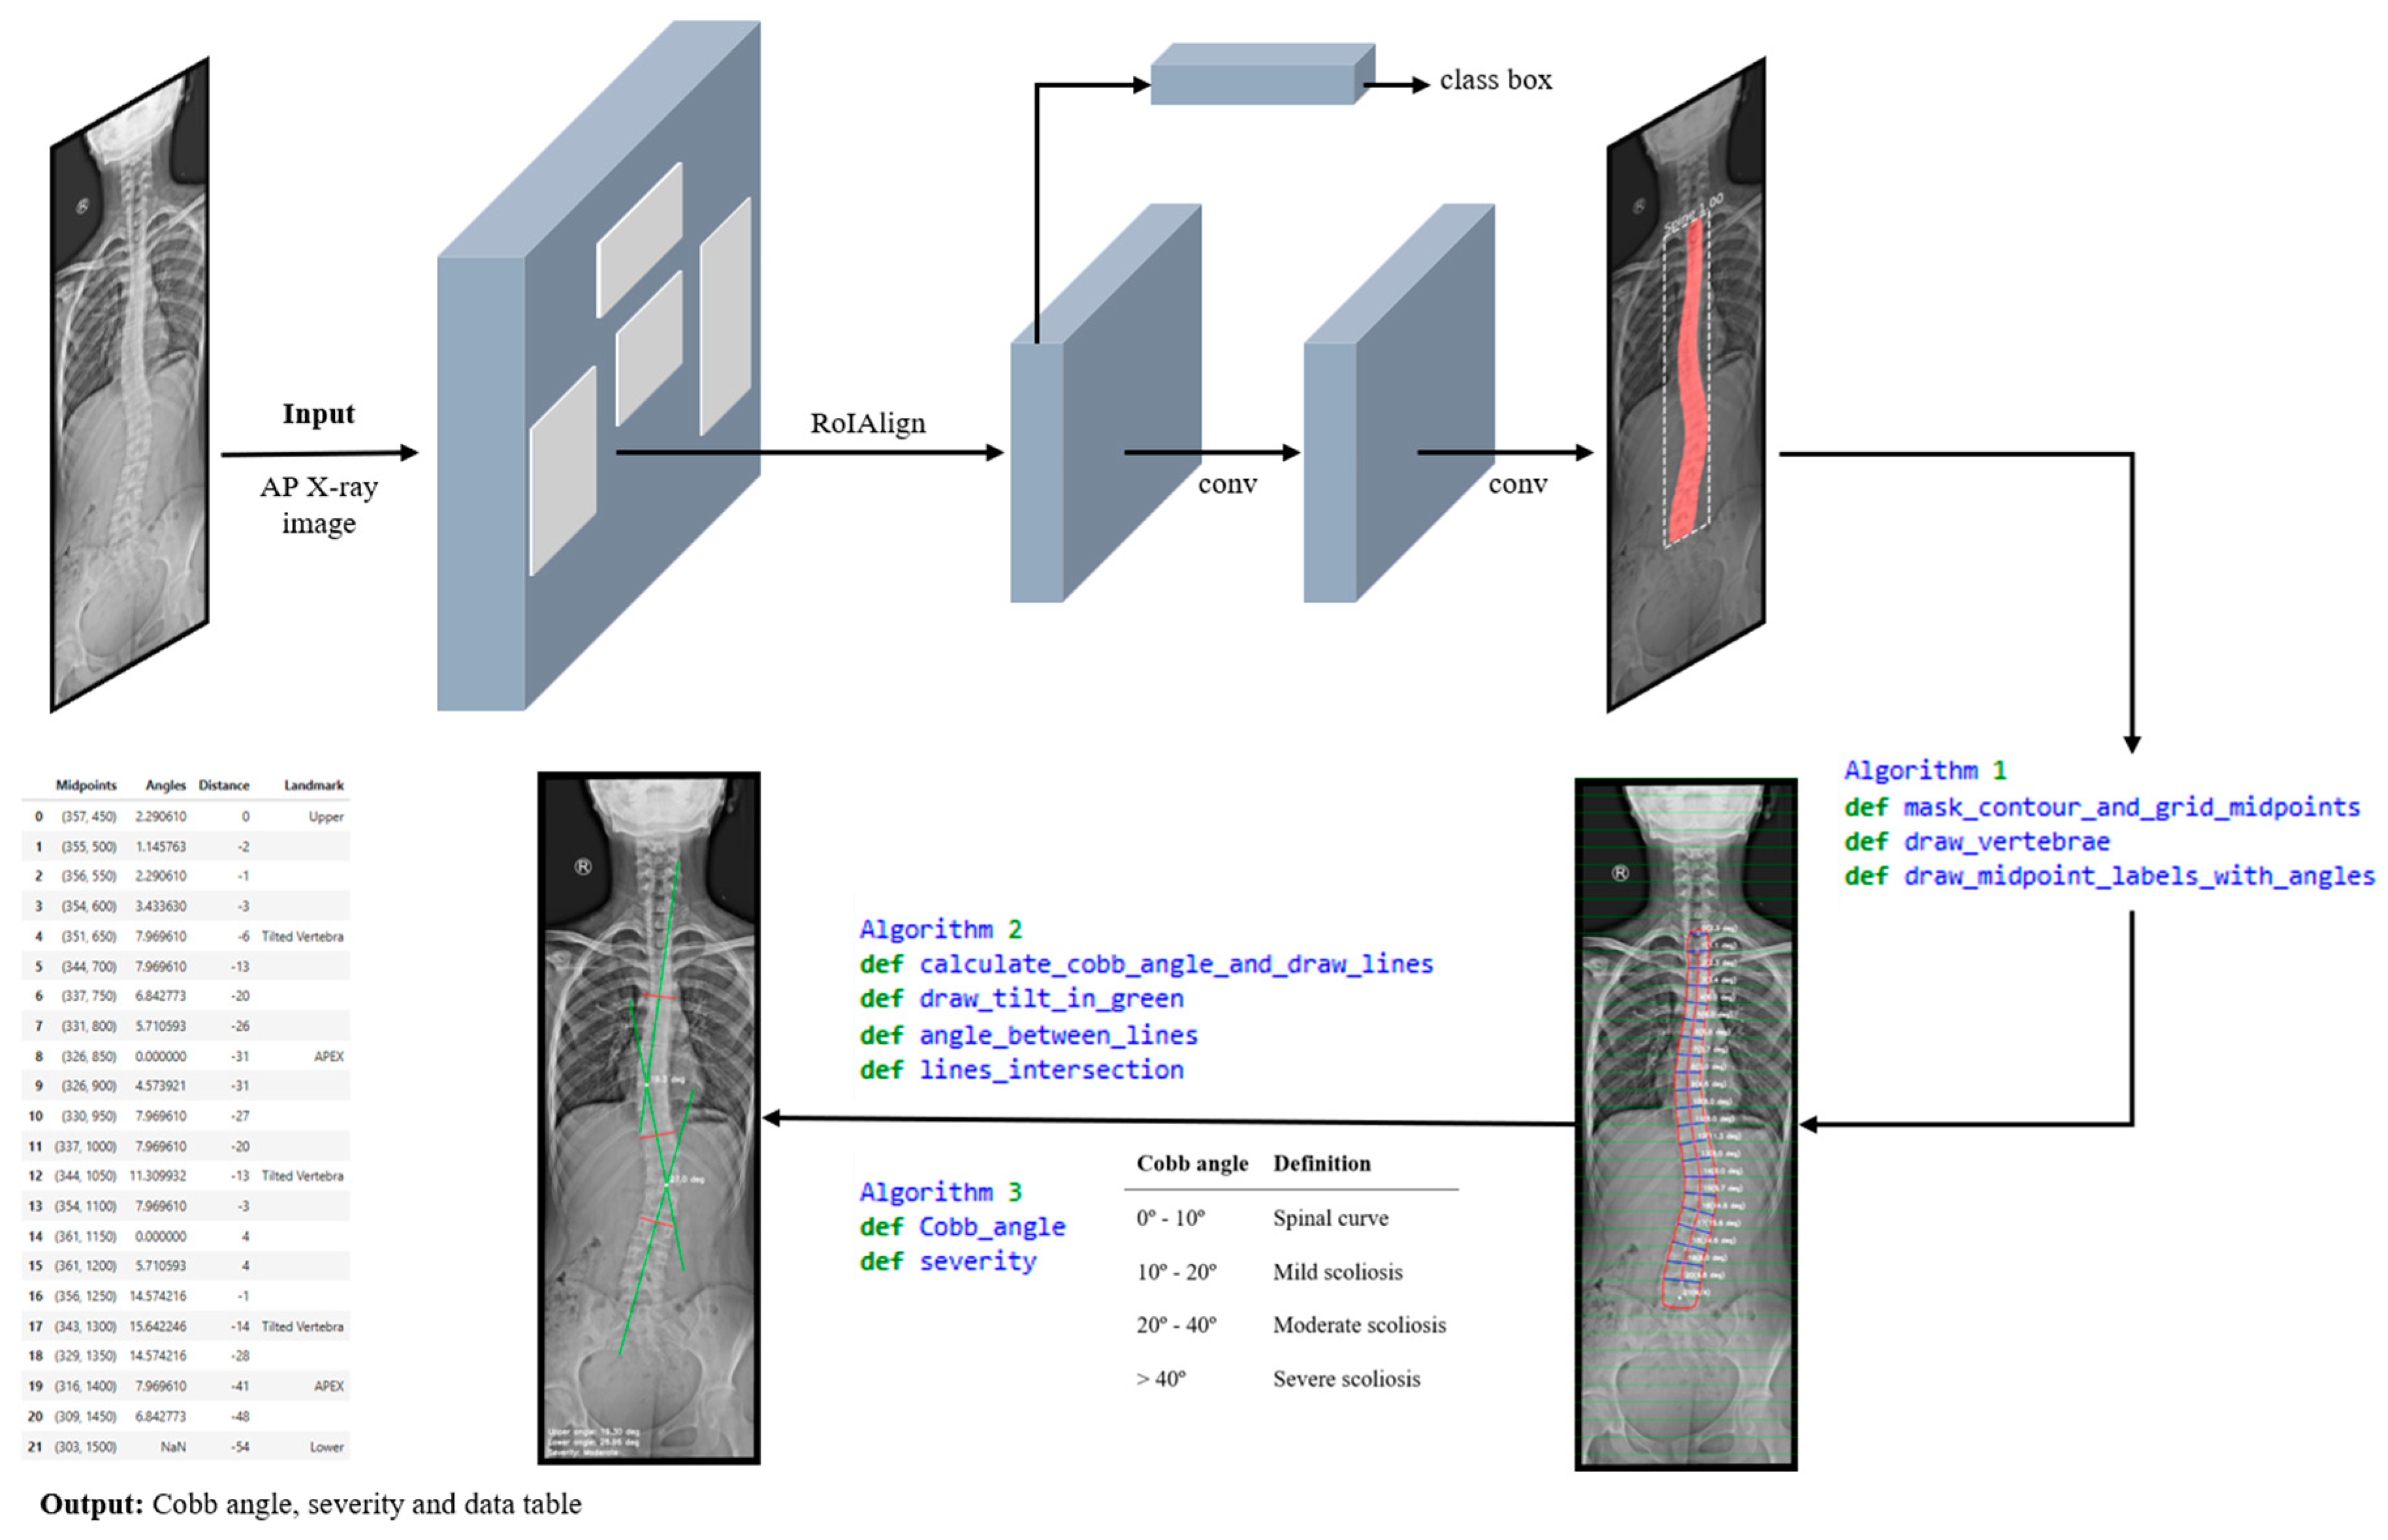
Figure 6.
Visualization of the results in JupyterLab: (a) Original AP full spine X-ray image; (b) Mask R-CNN spine segmentation; (c) Mask contour and vertebrae´s angles; (d) Computed Cobb angle, and severity classification; (e) Data table displaying numerical values and anatomical landmarks.
Figure 6.
Visualization of the results in JupyterLab: (a) Original AP full spine X-ray image; (b) Mask R-CNN spine segmentation; (c) Mask contour and vertebrae´s angles; (d) Computed Cobb angle, and severity classification; (e) Data table displaying numerical values and anatomical landmarks.
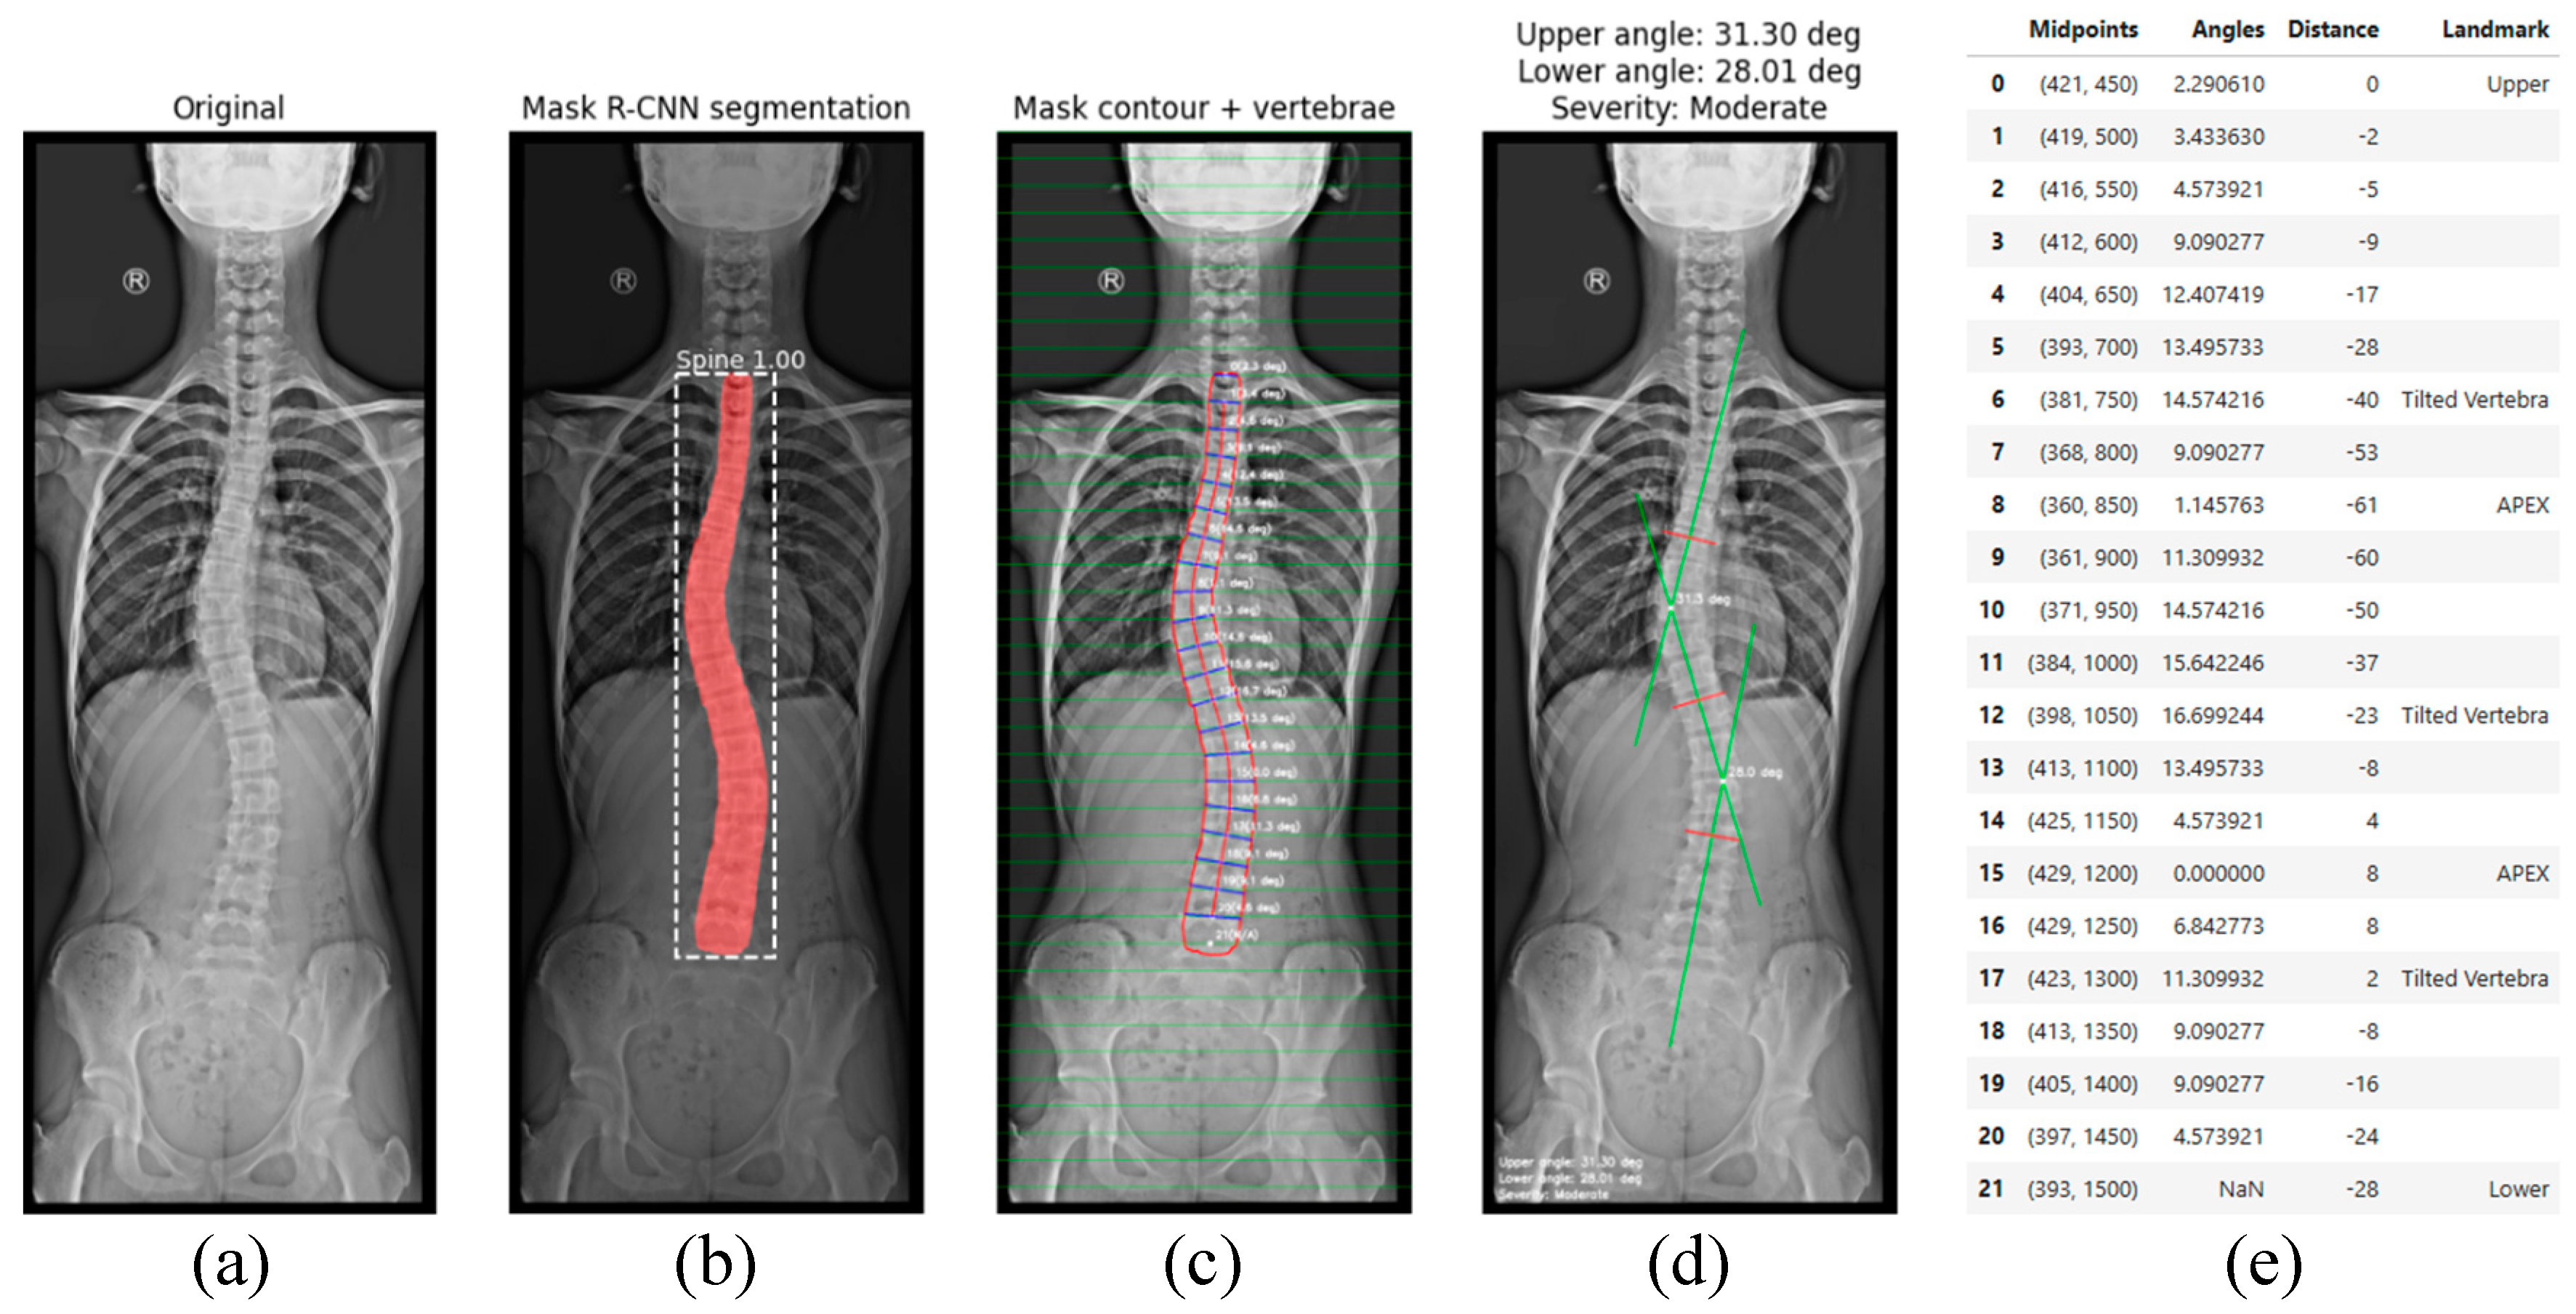
Figure 7.
Training and validation loss function over epochs.
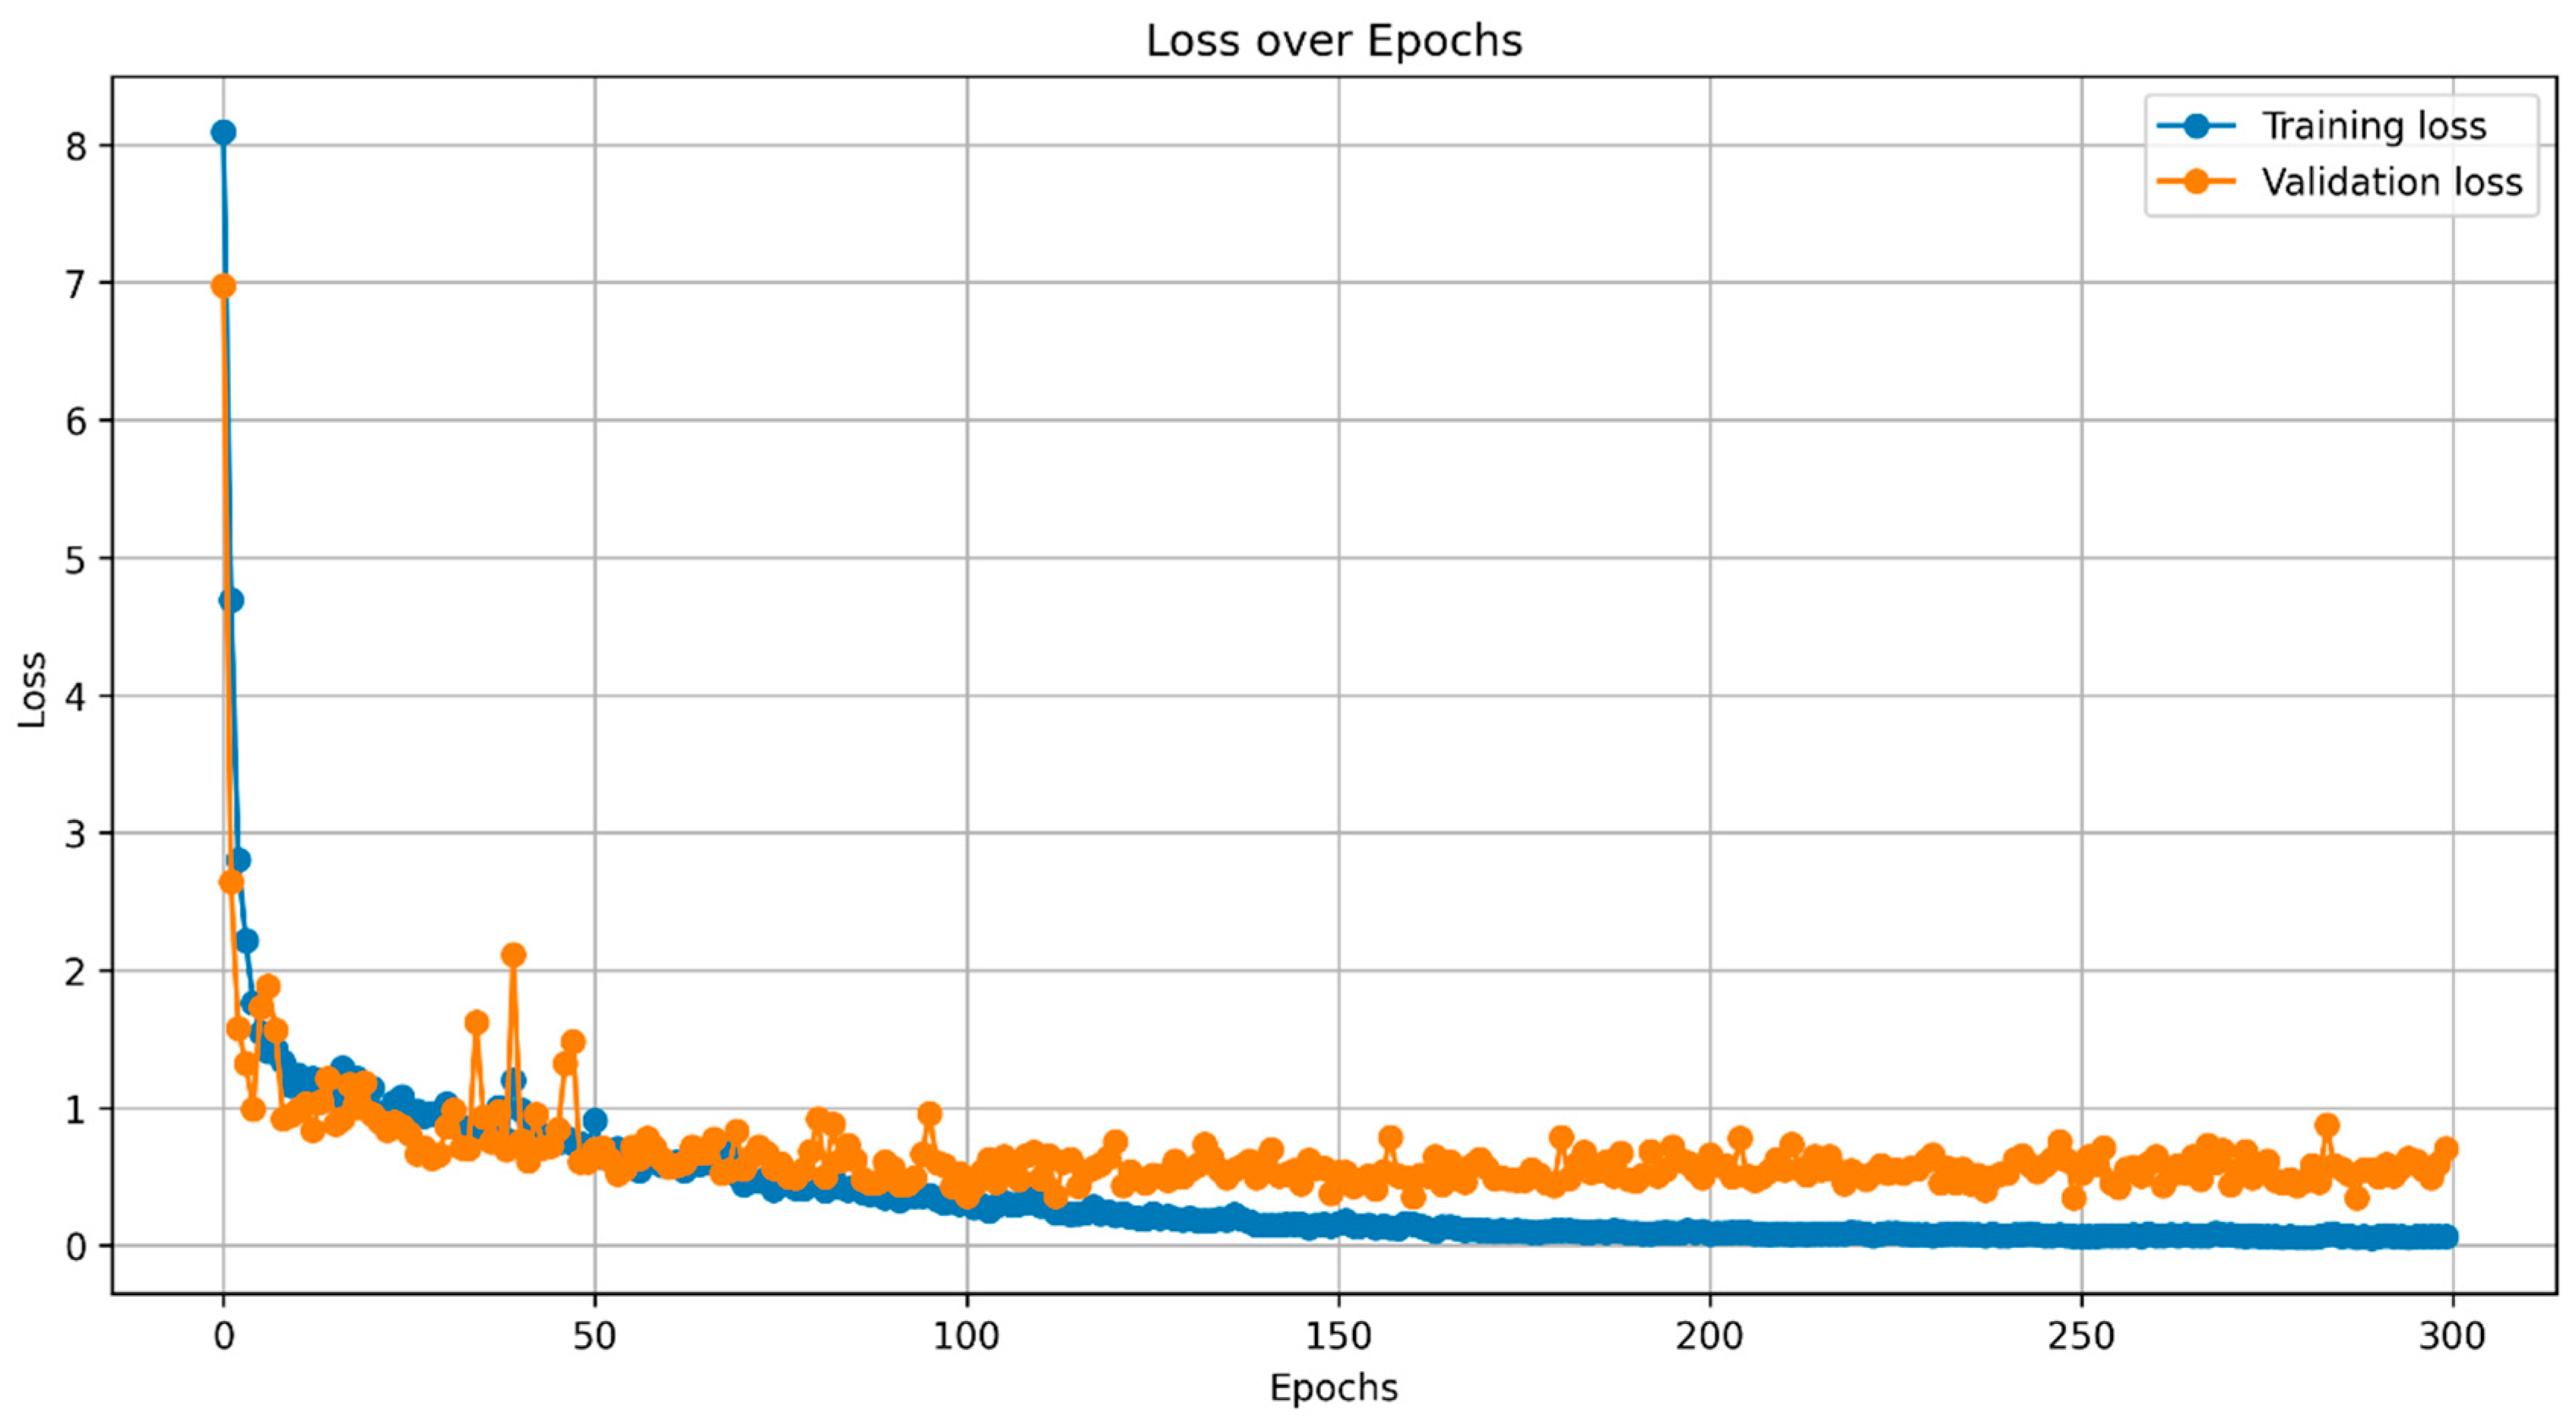
Figure 8.
Images for (a) original image, (b) ground truth mask, (c) predicted mask, and (d) IoU.
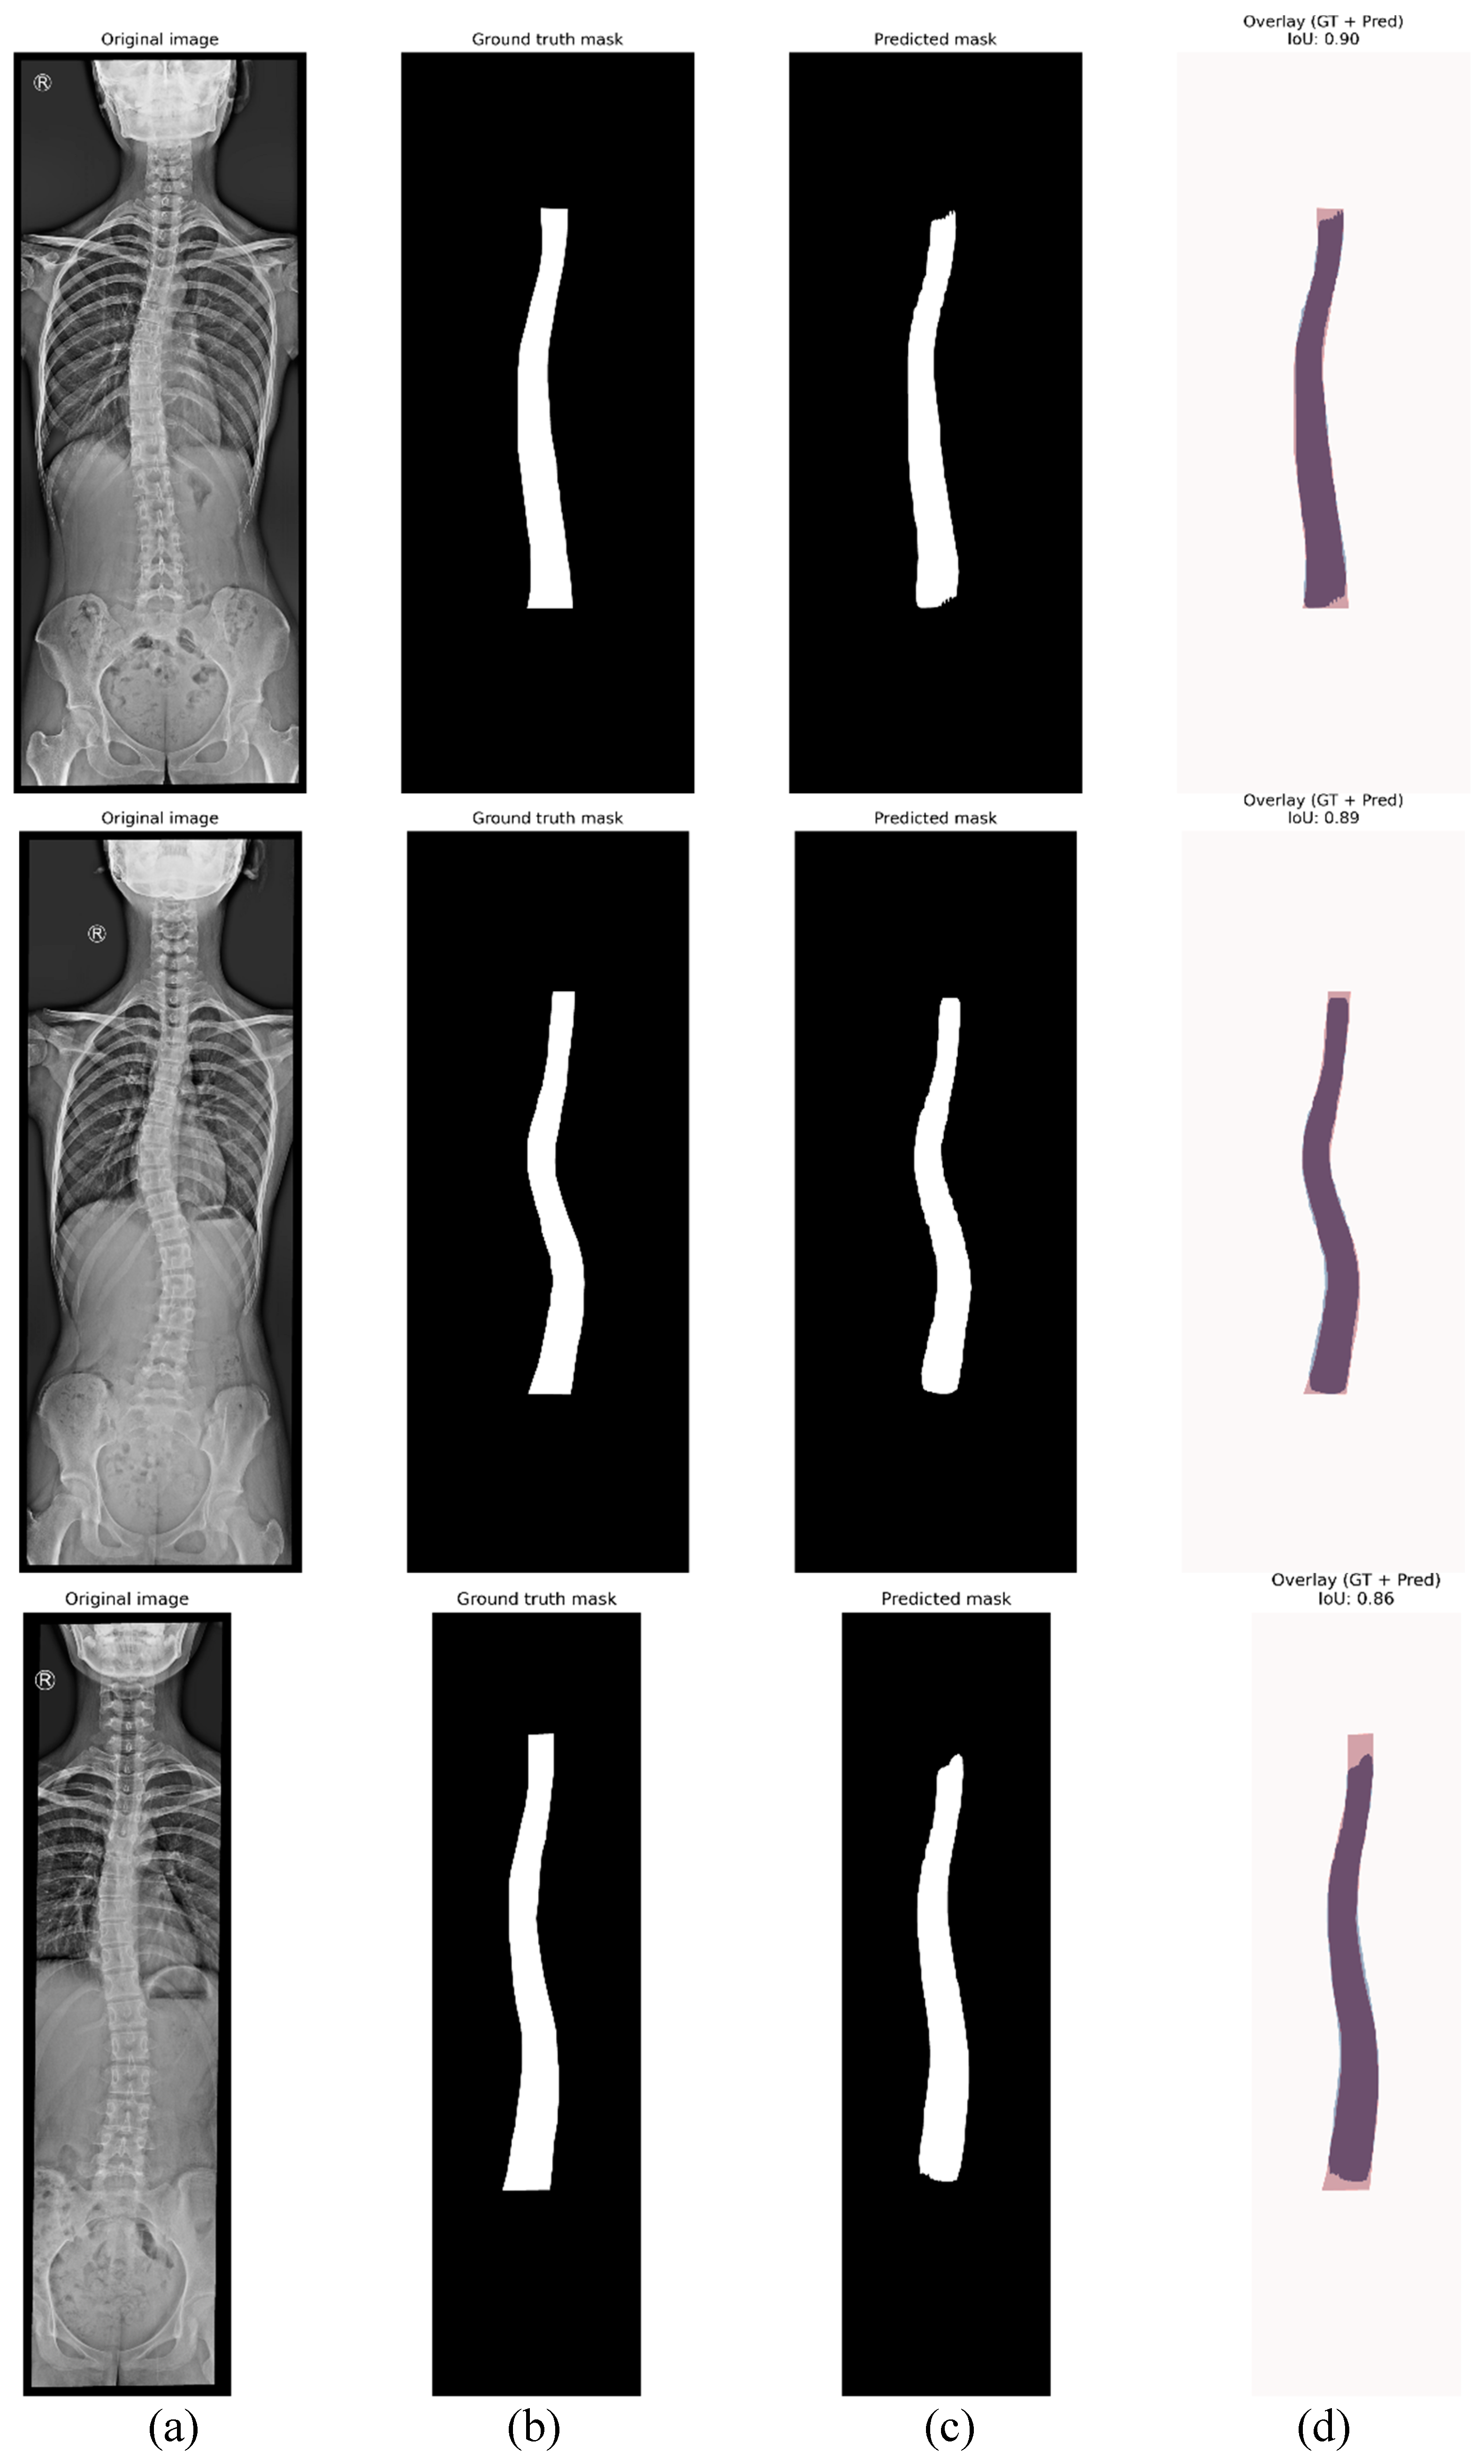
Figure 10.
Bland-Altman plot comparing Cobb angle measurements from Observer A and Observer B.
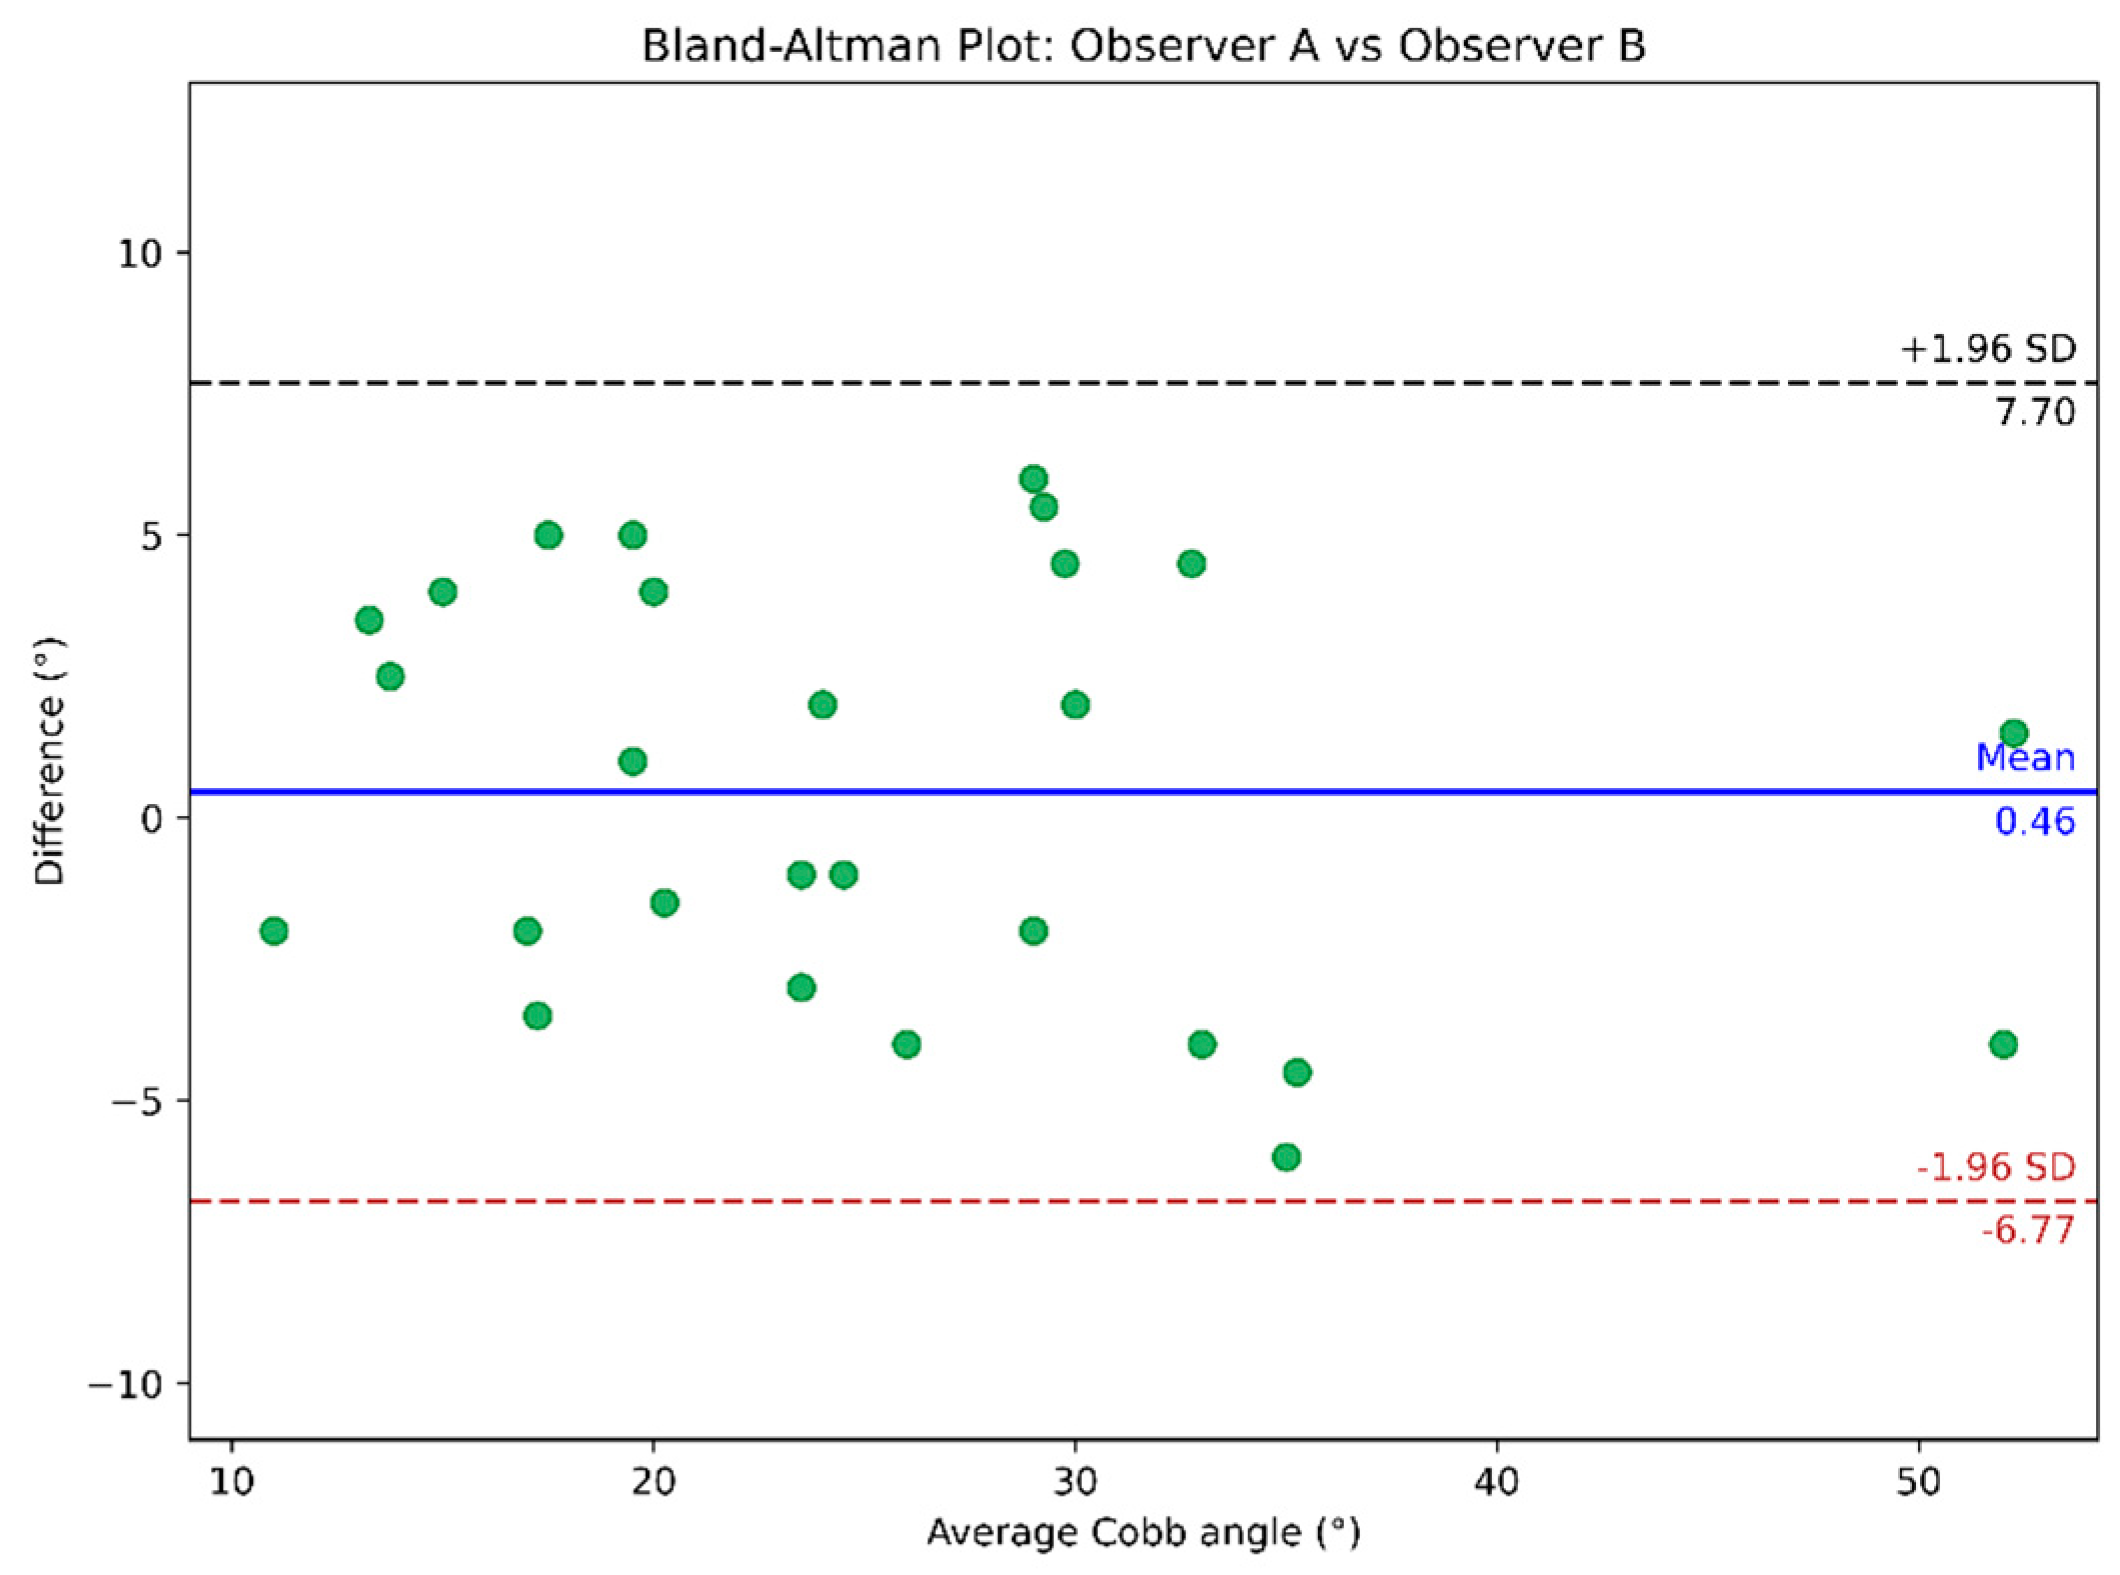
Figure 11.
Bland-Altman plot comparing the automated vs. Observer A’s Cobb angle measurements.
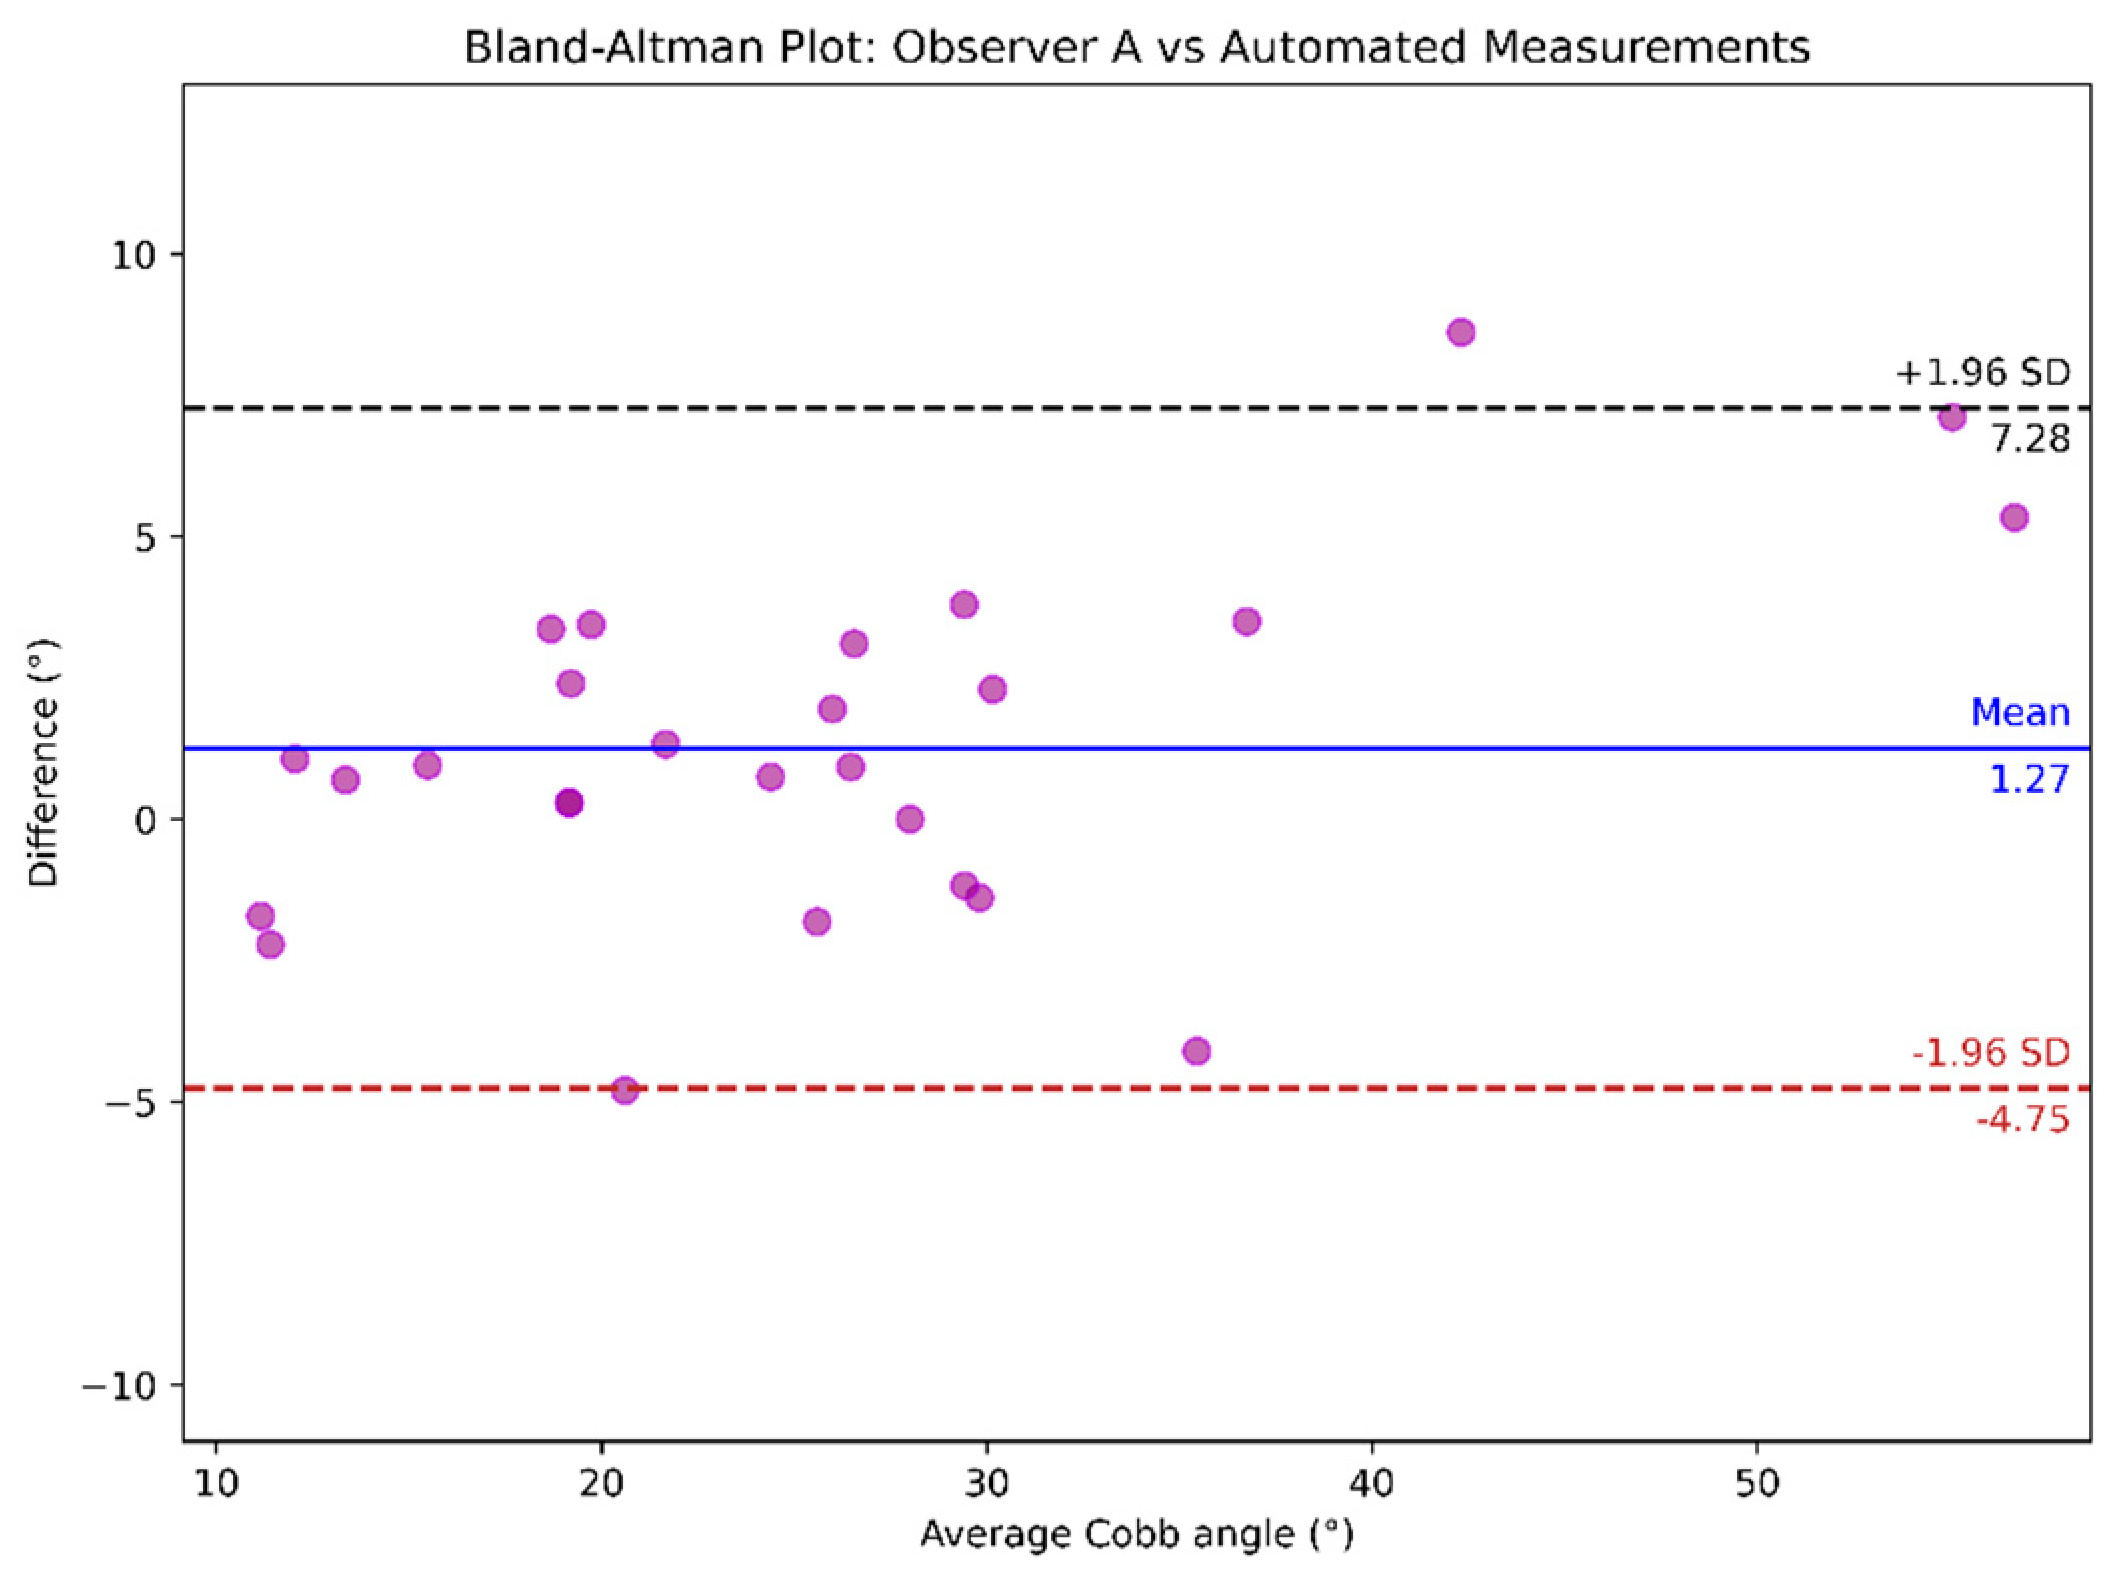
Figure 12.
Bland-Altman plot comparing the automated vs. Observer B’s Cobb angle measurements.
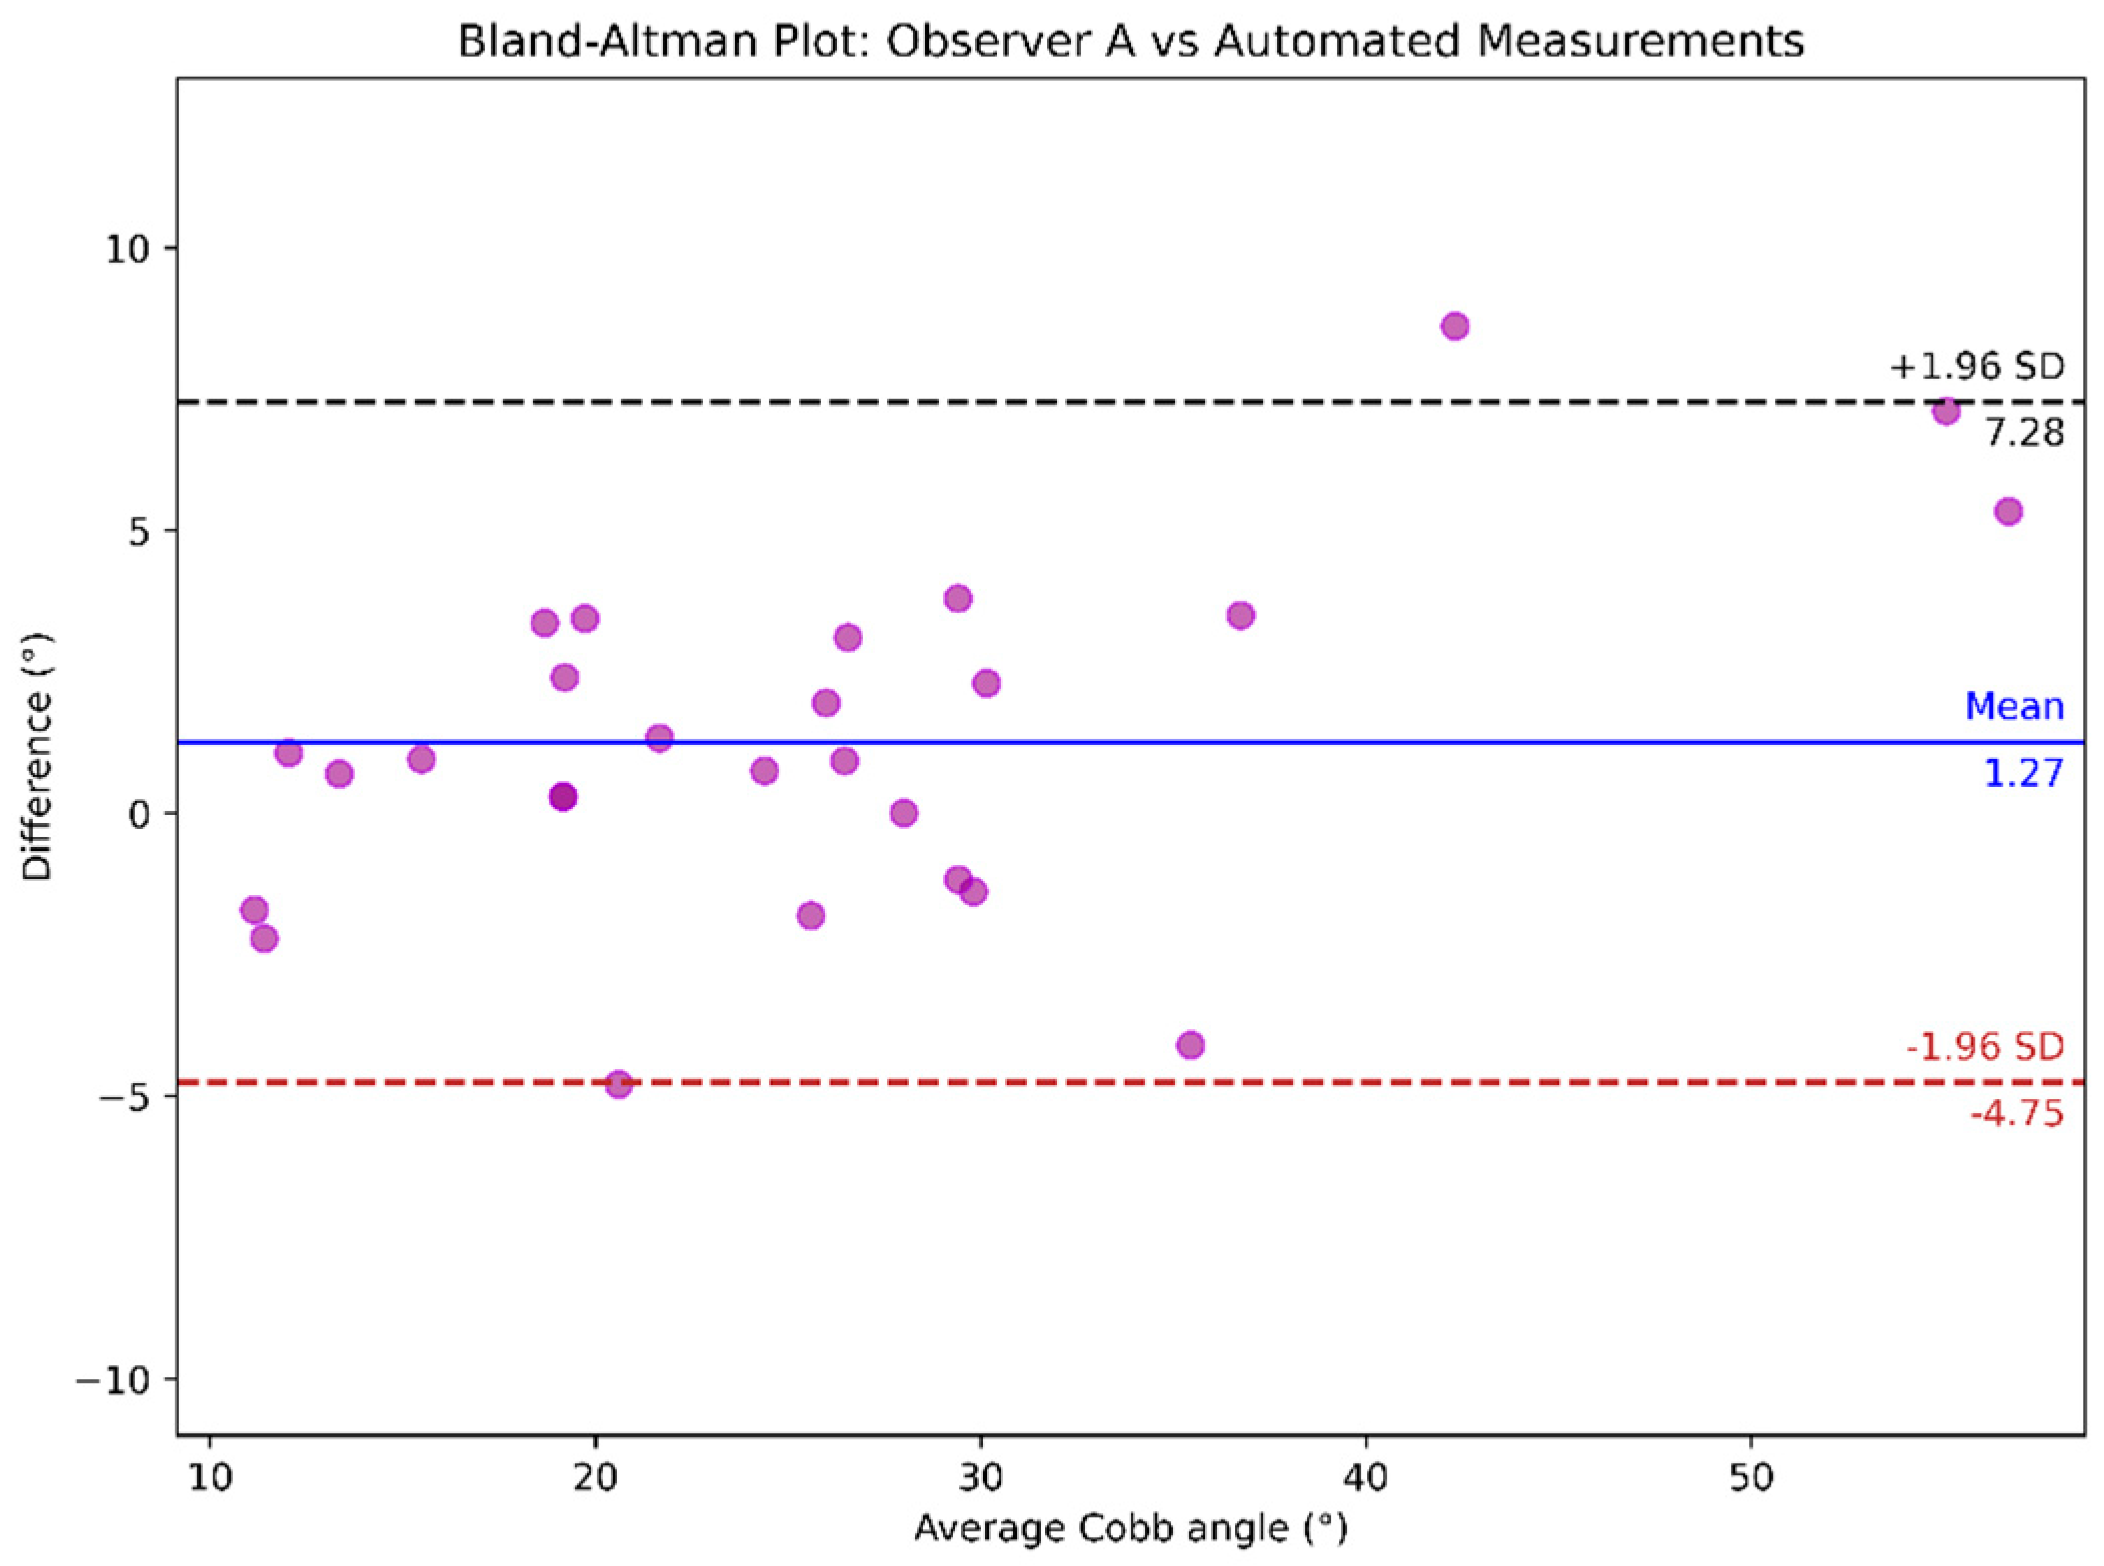
Table 2.
Summary: Mean IoU (mIoU); Mean Dice Similarity Coefficient (mDSC); Mean Average Precision (mAP, IoU=0.5:0.95); Mean Precision; Mean Recall; Over-segmentation; Under-segmentation.
Table 2.
Summary: Mean IoU (mIoU); Mean Dice Similarity Coefficient (mDSC); Mean Average Precision (mAP, IoU=0.5:0.95); Mean Precision; Mean Recall; Over-segmentation; Under-segmentation.
| Threshold | mIoU | mDSC | mAP | Mean precision |
Mean recall |
Over-seg | Under-seg |
|---|---|---|---|---|---|---|---|
| 0.85 (epoch 146) | 0.8012 | 0.8878 | 0.645 | 0.9145 | 0.8643 | 0.0855 | 0.1357 |
| 0.85 (epoch 155) | 0.7980 | 0.8857 | 0.655 | 0.9150 | 0.8599 | 0.0850 | 0.1401 |
| 0.85 (epoch 287) | 0.7818 | 0.8750 | 0.625 | 0.9313 | 0.8268 | 0.0687 | 0.1732 |
Notably, the highest mIoU metric was achieved at epoch 146 with a minimum detection confidence of 0.85. This mean IoU score indicates strong segmentation performance, although there remains ample scope for further improvement.
Table 3.
Interobserver reliability and variability of the manual Cobb angle measurement method.
| Analysis | ICC (95% CI) | MAD ± SD | MAE ± SD |
|---|---|---|---|
| Observer A vs. Observer B | 0.939 (0.868, 0.971) | 3.31º ± 1.56º | 3.31° ± 1.53° |
Disclaimer/Publisher’s Note: The statements, opinions and data contained in all publications are solely those of the individual author(s) and contributor(s) and not of MDPI and/or the editor(s). MDPI and/or the editor(s) disclaim responsibility for any injury to people or property resulting from any ideas, methods, instructions or products referred to in the content. |
© 2025 by the authors. Licensee MDPI, Basel, Switzerland. This article is an open access article distributed under the terms and conditions of the Creative Commons Attribution (CC BY) license (http://creativecommons.org/licenses/by/4.0/).
Copyright: This open access article is published under a Creative Commons CC BY 4.0 license, which permit the free download, distribution, and reuse, provided that the author and preprint are cited in any reuse.


