Submitted:
16 January 2026
Posted:
19 January 2026
You are already at the latest version
Abstract
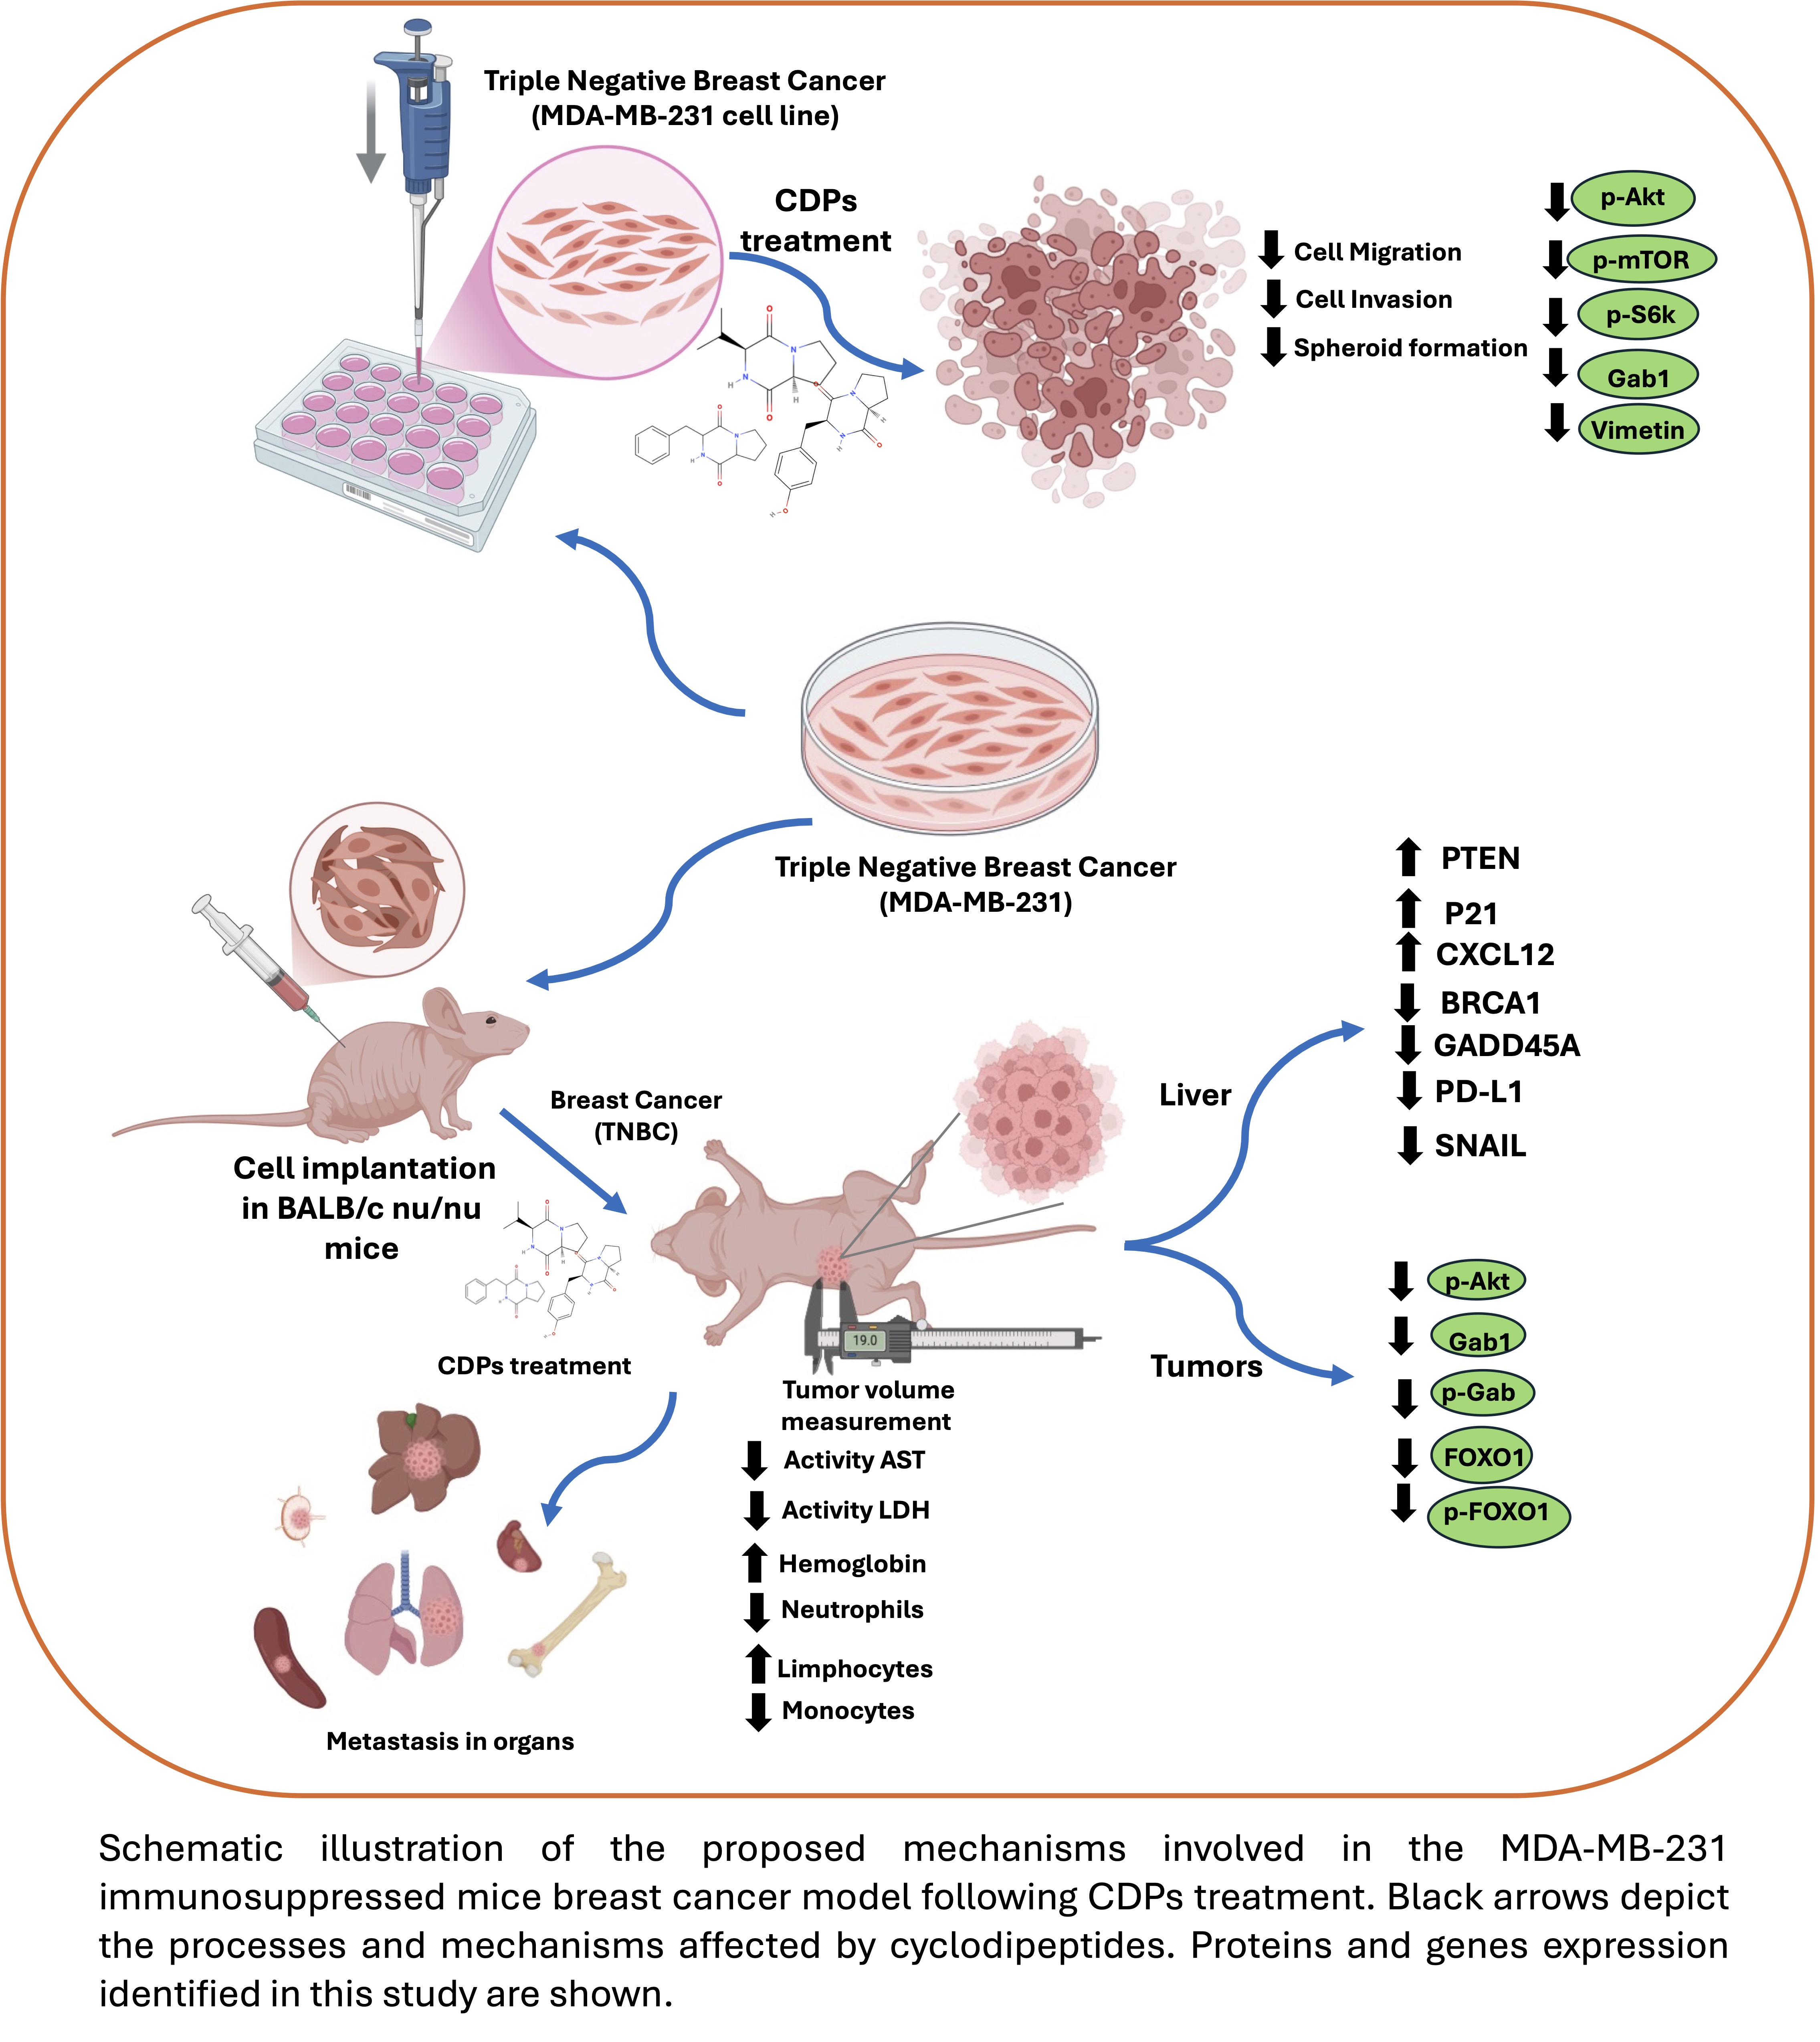
Background: Triple-negative breast cancer (TNBC) is an aggressive subtype associated with a high metastatic rate and low survival worldwide. Bacterial cyclodipeptides (CDPs) exhibit anticancer properties by targeting multiple signaling pathways. Methods: The effect of CDPs on the metastasis of the TNBC MDA-MB-231 cell line was evaluated both in vitro and in advanced-stage tumors in immunosuppressed female mice. Results: CDPs more effectively reduced the migratory and invasive abilities of the MDA-MB-231 cell line than methotrexate (MTX). The anti-metastatic effect correlated with inhibition of the Akt/mTOR/S6K pathway, evidenced by decreased expression of markers such as Gab1, Vimentin, and FOXO1. Mice with MDA-MB-231 xenografts treated with CDPs, alone or in combination with MTX, showed near-complete suppression of primary tumor growth and metastatic foci in tumor and organ tissues. Key proteins involved in signaling pathways associated with tumor progression and metastasis such as p-Akt, p-Gab1, and FOXO1 were markedly reduced expression in tumor tissues following xenografted mice CDPs treated. Notably, genes involved in EMT, invasiveness, and metastasis—including PTEN, SNAIL, CXCL1, BRCA1, GADD45A, and PD-L1—were dysregulated in the livers of animals with TNBC, but CDPs treatment restored them to healthy levels more effectively than MTX. Conclusions: The anti-metastatic effects of CDPs in the MDA-MB-231 line involve inhibiting phosphorylation of components of the Akt/mTOR/S6K pathway and reducing metastasis markers and proliferation regulators, as demonstrated in cultures of the MDA-MB-231 line and in tumor and liver tissues from the TNBC xenograft mouse model. The anti-metastatic activity of CDPs was more effective than MTX alone; however, combined treatment produced a synergistic effect, increasing efficacy. These findings offer new insights into the mechanism of action of CDPs and their potential as candidates for further preclinical development.
Keywords:
cyclodipeptides
; anti-metastatic
; triple-negative breast cancer
; invasiveness
; immunosuppression mouse model
; Akt/mTOR/S6K pathway
1. Introduction
Breast cancer is one of the leading causes of cancer-related mortality among women worldwide and represents a clinically heterogeneous disease. Approximately 10-15% of patients develop highly aggressive tumors with an increased propensity for metastasis [1]. Triple-negative breast cancer (TNBC) comprises a heterogeneous group of tumors with distinct histological, genomic, and immunological characteristics and is defined by the absence of estrogen and progesterone hormone receptors, as well as human epidermal growth factor receptor 2 (HER2). Several risk factors, including obesity, are associated with poor prognosis, as the interaction between adipocytes and tumor cells creates a permissive tumor microenvironment that promotes cancer cell proliferation, invasion, metastatic dissemination, and resistance to cell death. [2].
In the cancer context, liver metastasis represents one of the most challenging com-plications in TNBC and is associated to high rates of morbidity and mortality. The liver is among the most frequent sites of breast cancer dissemination and constitutes the initial metastatic organ in approximately 30% of individuals with metastatic breast cancer. The development of liver metastases is associated with an unfavorable prognosis and reduced overall survival, even in the context of advances in diagnostic and therapeutic strategies achieved in recent decades. Notably, TNBC patients with liver involvement exhibit a poorer clinical outcome compared with those affected by other breast cancer subtypes. Consequently, the identification of novel therapeutic strategies capable of improving outcomes in patients with metastatic breast cancer remains a critical unmet clinical need.
The FDA has approved several drugs with therapeutic uses targeting members of the protein kinase superfamily (PKs) associated with various diseases. Because the ATP-binding site is conserved across the human kinome, ATP-mimicking compounds often interact with multiple kinases. Drugs such as Abemaciclib, Palbociclib, Ribociclib, and Trilaciclib target the CDK4/6 proteins at the ATP-binding site; therefore, kinase-like proteins such as CDK4/6, AKT, HER2, ErbB1/2/4, and FKBP12/mTOR are considered therapeutic targets for breast cancer treatment [3]. In contrast, inhibitors designed for a single target, like the kinase inhibitor Capivasertib, which targets the AKT oncogene—a member of the PI3K/Akt/mTOR signaling pathway—have become key in treating cancer, diabetes, obesity, neurodegenerative diseases, aging, and autoimmunity [3]. Among the primary treatment options for metastatic breast cancer are taxanes, anthracyclines, methotrexate (MTX), carboplatin, immune checkpoint inhibitors targeting PD-1 or PD-L1, PARP inhibitors, and combinations of these agents with immunotherapy, radiotherapy, or surgery [4]. However, a significant number of patients respond poorly to these treatments, leading to low survival rates and a reduced quality of life. As a result, the pursuit of new therapeutic strategies that can improve the prognosis for patients with metastatic breast cancer remains a vital priority.
Cyclodipeptides (CDPs) are a class of molecules of the diketopiperazine family, produced by a wide range of organisms that exhibit notable biological activities, in-cluding cytotoxic effects against multiple cancer cell lines [5,6,7,8]. Previously, we reported that CDPs, such as cyclo(L-Pro-L-Tyr), cyclo(L-Pro-L-Val), cyclo(L-Pro-L-Leu), and cy-clo(L-Pro-L-Phe), isolated from the Pseudomonas aeruginosa PAO1 bacterium, induce apoptosis in cervical, colon, leukemia, and melanoma cancer cells. In HeLa cells, CDPs inhibit cell proliferation, including arresting cells at the G0–G1 stage, and induce apoptosis via an intrinsic pathway that relies on caspase-9 and -3 activation. Mechanis-tically, the antiproliferative effects of CDPs involve modulation of multiple signaling networks associated with tumor growth, survival, and plasticity, including the PI3K/Akt/mTOR, Ras/Raf/MEK/ERK1/2, PI3K/JNK/PKA, p27Kip1/CDK1/survivin, MAPK, HIF-1, Wnt/β-catenin, HSP27, epithelial–mesenchymal transition (EMT), and cancer stem cell (CSCs) pathways [3,6,7]. Transcriptomic profiling of HeLa cells treated with CDPs revealed 151 differentially expressed genes distributed across 15 major bio-logical processes, including regulation, signaling, development, locomotion, adhesion, metabolism, growth, proliferation, and immune response. Pathway enrichment analysis suggested that CDPs modulate multiple signaling networks, encompassing the insu-lin/IGF/MAP kinase cascade, P38/MAPK signaling, interleukin-mediated pathways, epidermal growth factor receptor (EGFR), PI3K signaling, platelet-derived growth factor (PDGF), Notch, cadherin, p53, Hedgehog, transforming growth factor-β (TGF-β), fibro-blast growth factor (FGF), FAS-mediated signaling, angiogenesis, cholesterol biosyn-thesis, and pathways associated with inflammation, oxidative stress responses, apoptosis, cytoskeletal organization, and T- and B-cell activation [9]. In a murine melanoma model, CDPs treatment reduced tumor growth by decreasing the expression of proteins that mediate pathways involved in energy metabolism, lipid synthesis, EMT, invasion, and metastasis [10]. In this context, cyclic peptides have emerged as promising therapeutic agents for kinase inhibition, as dysregulated kinases play central roles in cancer cell survival, proliferation, metastasis, and drug resistance. Given this background, we sought to determine whether bacterial CDPs have a promising effect on metastatic breast cancer, including advanced stages of tumorigenesis using a xenograft model of tri-ple-negative breast cancer established with MDA-MB-231 (ER-, PR-, HER2-) cells.
2. Results
2.1. Bacterial CDPs Reduce Migration and Invasiveness in the MDA-MB-231 Breast Cancer Cell Line
Previously, the cytotoxic and apoptotic properties of the CDPs have been shown in HeLa and CaCo-2 [8] and murine melanoma lines [10]; however, their anti-metastatic potential remains unknown. Therefore, the MDA-MB-231 cell line was used as a model to study triple-negative breast cancer and assess the anti-metastatic properties of CDPs.
In wound-healing assays, untreated MDA-MB-231 monolayers recovered about 90% of the initial wond area after 48 hours. In contrast, CDPs treatment (0.01 mg/mL) significantly inhibited cell migration, with nearly 10% of the wound area remaining unclosed after 48 h (Figure 1a). Additionally, the chemoterapeutic compound, methotrexate (MTX; 0.05 mg/mL) used as a reference control, resulted in ~60% wound closure over the same period. Notably, combined treatment with CDPs and MTX further enhanced the inhibitory effect, leaving approximately 20% of the wound area unhealed (Figure 1a). On the other hand, given the role of chemokine-mediated macrophage signaling in promoting tumor invasiveness, the invasive capacity of MDA-MB-231 cells was evaluated using a transwell assay. Co-culture with RAW macrophages increased the number of invading cancer cells, confirming the pro-invasive influence of the macrophage microenvironment (Figure 1b). CDPs treatment significantly reduced invasion, decreasing the number of invading cells by ~75% in monoculture and ~60% in macrophage co-culture conditions. In comparison, the invasiveness under MTX (0.05 mg/mL) treatment was less suppressed than with CDPs alone (0.01 mg/mL) but was most effectively inhibited when CDPs were combined with MTX, reaching up to a 90% reduction in invasiveness (Figure 1b).
Additionally, spheroids are cellular aggregates that represent three-dimensional cultures of cancer cells and serve as models of tumorigenesis. Therefore, the effect of CDPs on the spheroid viability and integrity of the MDA-MB-231 cell line was evaluated (Figure 1c-d). Cyclodextrins suspension as the delivery vehicle, consistent with prior in vivo findings was used [10]. The results showed a significant reduction in the number and size of spheroids in the MDA-MB-231 line when treated with CDPs alone (0.1 mg/mL), as well as when combined with cyclodextrins (CDPs-cd), the CDPs (0.1 mg/mL) demonstrated a strong capacity to disrupt spheroid formation as the MTX (0.05 mg/mL); interestingly, the most effective effect was obtained with the combination of CDPs with the anti-neoplastic drug MTX (CDPs-cd + MTX (Figure 1c-e). Spheroid viability and apoptosis induction were further assessed using MTT assays and flow cytometry, respectively. These analyses revealed a lethal dose (LD50) of 0.25 mg/mL and an effective dose for apoptosis induction (ED50) of 0.02 mg/mL for CDPs following 4 h of treatment (Figure 1e–f).
2.2. Effect of Bacterial CDPs on the Akt/mTOR/S6K Signaling Pathway in the MDA-MB-231 Cell Line
The signaling pathways associated with cell survival and growth were analyzed to investigate the anti-neoplastic effects of bacterial CDPs in the MDA-MB-231 cell line. Results indicated that CDPs treatment (0.01 mg/mL) did not alter the total levels of Akt, mTOR, and S6K proteins and had no time-dependent effects on their expression; however, their phosphorylation states—p-Akt, p-mTOR, and p-S6K—were significantly reduced over time following CDPs treatment (Figure 2). Additionally, phosphorylation of p-Gab1 and the expression of Vimentin were also notably decreased in the MDA-MB-231 cells after CDPs treatment (Figure 2).
2.3. Effect of Bacterial CDPs in a Breast Cancer Mouse Model Through Implantation of the MDA-MB-231 Cell Line
An orthotopic TNBC xenograft model with metastatic dissemination was established by implantation of MDA-MB-231 cells into the mammary fat pad of immunosuppressed female mice, achieved 100% mammary tumor formation. Healthy mouse groups (procedure 1, Figure 3) and two treatment conditions were tested. In the second treatment regimen (procedure 2, Figure 3), mice were inoculated with MDA-MB-231 cells and simultaneously treated with CDPs, followed by a total nine doses of CDPs (0.25 mg/kg) over a 35-day therapeutic period. In the third regimen (procedure 3, Figure 3), tumors were allowed to develop for 35 days after implanting MDA-MB-231 cells; after that, treatment with CDPs or MTX (0.05 mg/kg) was initiated and continued for an additional 35 days.
Results of body weight monitoring showed that weight gain was similar across all mouse groups, except for the TNBC groups treated with CDPs (TNBC+CDPs) or with the combination of CDPs and MTX (TNBC+CDPs+MTX), which exhibited lower body weight gain slopes compared to untreated TNBC mice (Figure S1).
After euthanasia, primary tumors and organs were dissected for detailed analysis (Figure 4b-c). Tumors from untreated TNBC group weighed approximately 0.9 g on average. In contrast, the TNBC mice treated with CDPs showed significantly lower tumor weights, averaging about 0.15 g in the preventive treatment regimen (procedure 2) and approximately 0.05 g in the therapeutic regimen (procedure 3) (Figure 4b). Similarly, in the MTX-treated group, the mean tumor weight was around 0.15 g. Notably, in the TNBC+CDPs and TNBC+CDPs+MTX groups, tumor weights were greatly reduced to around 0.05 g, and in 40-60% of these groups, no tumors were detected (Figure 4b and 4d).
In the orthotopic xenograftd TNBC model, the group of mice with mammary tumors that received no treatment (TNBC) showed a significant increase in the weight of the lungs, kidneys, liver, and spleen (Figure 4c-d), along with metastatic foci in the lungs and liver. In contrast, the groups treated with CDPs and the combination of CDPs plus MTX showed normalization of organ weights and no observable metastatic foci (Figure 4c-d).
2.4. Effect of Bacterial CDPs on Biochemical and Hematological Parameters in the Breast Cancer Mouse Model with MDA-MB-231 Cell Line Implantation
The enzymes alanine transaminase (ALT), aspartate transaminase (AST), and lactate dehydrogenase (LDH), used as markers of hepatocellular injury and systemic tissue damage were measured in the blood serum of animals implanted with breast tumors. The untreated TNBC mice group showed a significant increase in AST and LDH enzyme activities compared with healty controls (Figure 5a), which was reversed by treatment with CDPs, MTX, or their combination. Importantly, treatment with CDPs in the healthy control mice group (C+CDPs) did not affect AST or LDH levels, as seen in the control group. The hematological analysis revealed that the blood hemoglobin levels were significantly reduced in the groups of mice with TNBC tumors and in TNBC+MTX; however, hemoglobin levels were restored in mice with tumors treated with CDPs, nearly reaching the levels of the healthy control group (Figure 5b). Additionally, leukocyte profiling revealed alterations in neutrophil, lymphocyte, and monocyte counts in the TNBC and TNBC+MTX groups (Figure 5c). These changes were normalized in the CDPs-treated groups, which showed leukocyte ditributions comparable to healthy controls. Furthermore, healthy mice treated with CDPs did not show any changes in these hematological parameters (Figure 5c).
2.5. Histological and Protein Expression in Tumors from the Xenografted TNBC MDA-MB-231 Line Treated with Bacterial CDPs
Histological analyses of tumors was performed using hematoxylin and eosin (H&E) staining. Tumors from untreated TNBC mouse group showed nuclear hyperchromasia and infiltration of inflammatory cells (Figure 6). Notably, tumors from TNBC mouse groups treated with MTX or CDPs, nuclear hyperchromasia was reduced. In these treated groups, focal areas of necrosis and inflammatory cell infiltration were observed, indicating treatment-associated histopathological changes (Figure 6).
Protein immunodetection analysis was conducted on crude tumor extracts from the xenograft model. Results indicated that total Akt protein levels were not significantly affected by the treatments, except in the TNBC+CDPs(3) group (Figure 7). In contrast, both CDPs and MTX treatments markedly reduced Akt phosphorylation. Gab1 protein expression was significantly decreased in the TNBC+MTX(3) and TNBC+CDPs+MTX(3) groups, which aligns with the results for p-Gab1 protein. Similarly, the expression of FOXO1 and its phosphorylated FOXO1 form (p-FOXO1) were markedly reduced in tumors from mice treated with CDPs, MTX, or the combination of CDPs+MTX (Figure 7).
2.6. Histological of Organs from Xenografted TNBC MDA-MB-231 Mice Treated with Bacterial CDPs
Histological examination of the liver sections revealed reduced nuclear hyperchromasia in mice treated with CDPs, either alone or in combination with methotrexate (MTX), compared with untreated TNBC mice, without evidence of hepatocellular or tissue hypertrophy (Figure 8). In lung sections, untreated TNBC mice displayed marked disruption of normal alveolar architecture, whereas healthy control mice (C) and healthy mice treated with CDPs (C+CDPs) exhibited well-preserved alveolar structures. Interestingly, in the tumor mouse groups treated with CDPs and MTX, the alveolar structure was restored to resemble the healthy groups (see yellow arrows in Figure 8). In this regard, spleen histology showed disintegration of structural features in the tumor-bearing animals (TNBC), which was reversed in the TNBC groups treated with CDPs, MTX, or their combination (see dashed circles in Figure 8).
2.7. Gene Expression in the Liver of Xenografted TNBC MDA-MB-231 Line Treated with Bacterial CDPs
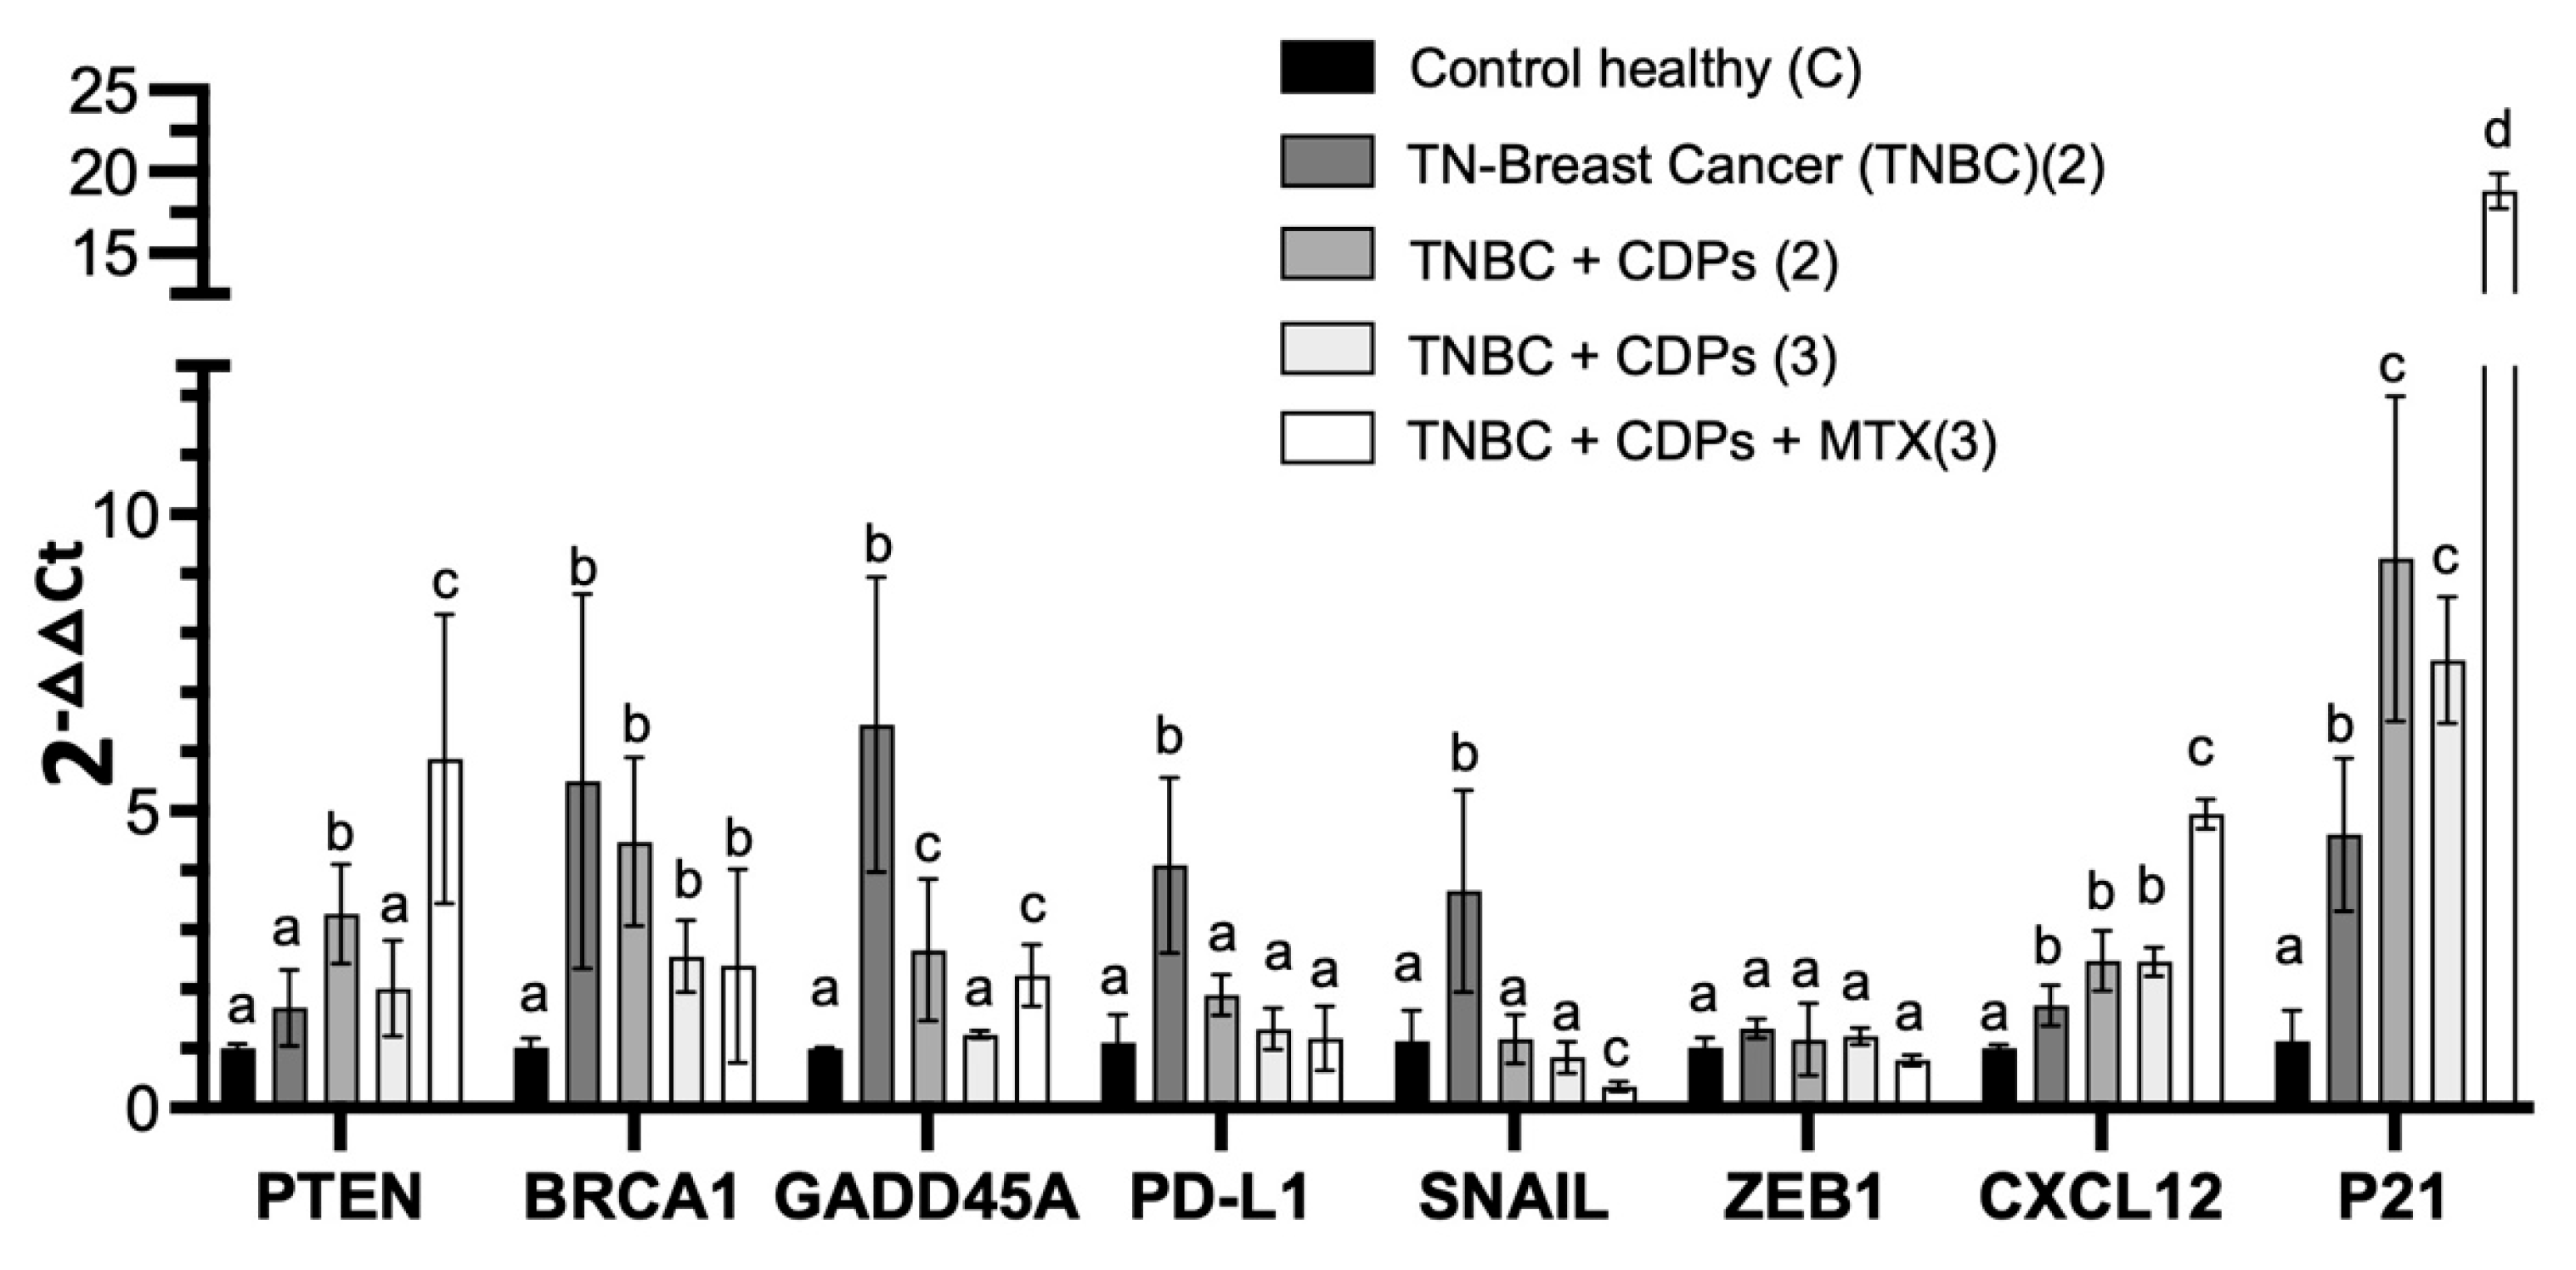
The PI3K/Akt/mTOR and FOXO1 signaling pathways are associated with fundamental cellular processes such development, metabolism, and cell survival, and their dysregulation conributes to tumor-associated sytemic alterations. Based on our in vitro and in vivo results indicating modulation of Akt, Gab1, and FOXO1 by the treatment with CDPs in the orthotopic TNBC xenograft mouse model, we sought to further investigate how the molecular mechanism underlying CDPs-mediateed tumor inhibition works. To this finality, we investigated the regulation of genes involved in pathways like cell proliferation, metastasis, apoptosis, immune response, and drug resistance. Gene expression analysis was performed by RT-qPCR in liver tissues from healthy mice, untreated TNBC mice, and TNBC mice treated with CDPs, methotrexate (MTX), or their combination (Figure 9). The tumor supresor genes PTEN and CDKN1A (p21), together with the chemokine CXCL12 were significantly upregulated in the livers of TNBC-bearing mice compared with healthy controls. Notably, with CDPs, especially when combined with MTX, their expression was markedly higher (Figure 9). In contrast, the expression of ZEB1 did not show significant differences among experimental groups. Interestingly, genes such as BRCA1, GADD45A, PD-L1, and SNAIL were significantly increased in the livers of TNBC mice compared to healthy controls. Still, their expression was notably decreased in groups treated with CDPs and MTX, sometimes reaching levels similar to those in healthy mice (Figure 9).
3. Discussion
CDPs have become promising options for cancer treatment because of their stability, high selectivity, and capacity to block important cancer signaling pathways [11]. Their cytotoxic and pro-apoptotic effects have been shown in multiple cancer cell lines [3,5,6,7,8]. Beyond their direct anti-proliferative activity, several diketopiperazines have been shown to interfere with mechanisms associated with tumor aggressiveness and therapeutic resistance. For example, fumitremorgin C analogs can overcome multidrug resistance by inhibiting the breast cancer resistance protein (BCRP), a key efflux transporter that limits intracellular drug accumulation. Similarly, the HLY838 diketopiperazine functions as an O-GlcNAc transferase (OGT) inhibitor, enhancing the anti-tumor effects of CDK9 inhibitors by downregulating c-Myc and E2F1 [12]. Additionally, Verticillin A inhibits c-Met phosphorylation and downstream Ras/Raf/MEK/ERK signaling, leading to decreased metastatic potential in colon cancer models [13]. Together, these studies emphasize the potential of CDPs and related diketopiperazines to act as multitarget anticancer and anti-metastatic agents. In line with this idea, earlier research in mouse melanoma showed that CDPs from Pseudomonas aeruginosa significantly reduced key EMT markers, including MMP-1, E-cadherin, N-cadherin, HIF-1α, Vimentin, and CK-1, supporting their capacity to disrupt tumor cell migration and invasion [6,10]. These observations support exploring the anti-invasive and metastasis-associated effects of bacterial CDPs in aggressive breast cancer subtypes such as triple-negative breast cancer.
In this study, functional assays further confirm the ability of bacterial CDPs to suppress invasion and metastasis-associated behaviors in the TNBC model. Wound-healing assays demonstrated that CDPs inhibited the migratory capacity of MDA-MB-231 cells more effectively than methotrexate (MTX) (Figure 1a). Similarly, transwell invasion assays show that CDPs significantly reduce the invasive capacity of MDA-MB-231 cells under both monoculture and macrophage co-culture conditions compared to MTX, with their combination being even more effective. Tumor-associated macrophages (TAMs) play a key role in tumor progression by secreting chemokines and growth factors that enhance cancer cell proliferation, migration, and invasiveness [14]. Our data suggest that CDPs disrupt TAM–cancer cell interactions in the MDA-MB-231 cell line, emphasizing their dual role in promoting apoptosis and inhibiting metastasis-related processes, thereby supporting their function as inhibitors of tumor cell migration and invasiveness. This data is highly relevant because the interaction between cancer cells and macrophages, along with the release of chemokines, stimulates malignancy and the invasive capacity of cancer cells. The superior inhibition observed with the combination of CDPs and MTX (up to 90% inhibition of invasiveness) indicates synergy between these agents.
Three-dimensional spheroid models further demonstrated the anti-metastatic and anti-tumor effects of CDPs. Spheroid cultures are enriched with cancer stem cell (CSC)-like populations that show increased self-renewal and resistance to therapy [14]. Therefore, the spheroid structure in the MDA-MB-231 lines promotes resistance to cytotoxic compounds. Our results showed that CDPs significantly reduced spheroid size and number, lowered cell viability, and increased apoptosis in the MDA-MB-231 spheroids compared to MTX-treated cultures. The effects were more pronounced when using the CDPs+MTX combination or cyclodextrins (Figure 1c–e). Additionally, the spheroid integration assay, which mimics three-dimensional tumor growth and plasticity, supports the ability of CDPs as agents that can disrupt key stages of tumor progression and stemness-related properties. These findings emphasize the potential of CDPs to combat CSC-associated resistance mechanisms in aggressive breast cancer models.
Mechanistically, our results further support previous findings that indicate CDPs act through the PI3K/Akt/mTOR pathway [3,5,6,10]. In MDA-MB-231 cells, CDPs significantly decreased phosphorylation of Akt, mTOR, and S6K (Figure 2), as well as reducing levels of Vimentin and Gab1—two proteins closely linked to EMT-related and metastasis-associated signaling [15]. Thus, CDPs effectively target the PI3K/Akt/mTOR signaling pathway, a key regulator of cell survival, proliferation, and growth. This aligns with the observed suppression of p-S6K phosphorylation and the decrease in Vimentin and p-Gab1 expression. Vimentin is an essential marker of EMT, a process crucial for invasiveness and metastasis. Therefore, the downregulation of Vimentin and inhibition of the PI3K/Akt/mTOR pathway are primary molecular mechanisms responsible for the reduced migration and invasiveness seen in vitro in MDA-MB-231 cells.
In the orthotopic TNBC xenograft model, implanting MDA-MB-231 cells directly into the mammary gland of animals creates a tumor microenvironment that exhibits key features of aggressive breast cancer progression. Treatment with CDPs significantly reduced tumor volume and weight, especially when given after the tumor was established, and a large portion of treated animals showed no detectable tumors at the end of the experiment (Figure 4). Besides suppressing primary tumor growth, CDPs treatment also reduced tumor-related systemic changes. Untreated TNBC-bearing mice had increased weights of the lungs, kidneys, liver, and spleen, along with histological changes such as metastatic foci indicating organ damage caused by the tumor (Figure 4). Conversely, groups treated with CDPs and the combination of CDPs plus MTX showed normalization of organ weights and no visible metastatic foci. Histopathological analysis of primary tumors indicated that untreated TNBC displayed extensive hyperchromasia. In contrast, CDP-treated tumors exhibited less hyperchromasia, with areas of cell aggregation observed (Figure 6). These findings suggest that in tumors from animals treated with CDPs and MTX, cell proliferation is inhibited, as reflected by the size and weight of the tumors dissected from each group (Figure 4).
Metastatic progression in breast cancer patients is often associated with systemic alterations, including elevated levels of serum ALT, AST, gamma-glutamyl transferase (GGT), alkaline phosphatase (ALP), and LDH [16]. In our TNBC model, untreated mice showed significant increases in AST and LDH (Figure 5). Treatment with CDPs normalized these enzyme levels and reduced organ weight increases. Changes in leukocyte profiles, especially a higher neutrophil-to-lymphocyte ratio (NLR), are known markers of poor prognosis in breast cancer [17]. In our study, TNBC mice showed the highest NLR, which was reduced in the CDP-treated groups, nearing control levels (Figure 5c), indicating decreased tumor aggressiveness. Anemia, another common cancer complication, was also improved with CDP treatment. These findings suggest that CDPs alleviate tumor-related systemic and liver dysfunction, supporting a decrease in tumor aggressiveness and metastatic potential.
It is important to highlight the safety profile and systemic benefits. CDPs treatment did not alter the activity of liver enzymes ALT, AST, and LDH in healthy control mice (C+CDPs). Conversely, CDPs reversed the significant increase in AST and LDH activity observed in the TNBC group. These results, along with the restoration of histological structures in the lung and spleen, indicate that CDPs not only target the tumor locally but also help normalize tumor-related systemic changes. Histological analysis showed a clear reduction in vascular structures in the liver of the TNBC group. In contrast, structural damage was observed in the lung and spleen tissues, which was significantly lessened after CDPs treatment (Figure 8). These findings further suggest that, in our model, metastasis of the MDA-MB-231 line occurred in the animals following implantation into target organs such as the liver, lungs, and spleen. The ability of CDPs to restore normal tissue architecture supports their role in reducing tumor-related organ dysfunction and lowering metastatic risk.
At the molecular level, protein and gene expression analyses revealed coordinated modulation of signaling pathways associated with metastasis, immune evasion, and DNA damage response. To further investigate tumor-associated signaling in TNBC, we evaluate metastasis in the tumor of the xenografted TNBC model. Molecular analyses also showed reduced p-Akt levels in tumors from CDPs-treated animals, along with decreased total Akt expression (Figure 7), indicating inhibition of the PI3K/Akt/mTOR signaling pathway. FOXO1, a forkhead transcription factor that regulates apoptosis, autophagy, and cell cycle arrest, is negatively regulated by Akt-mediated phosphorylation [18]. In our study, CDP-treated animals showed decreased FOXO1 phosphorylation. Although total FOXO1 protein levels were reduced, the decrease in FOXO1 phosphorylation aligns with enhanced FOXO1 activity, enabling its nuclear functions and the activation of growth-suppressive and stress-response pathways [19]. This activation aligns with the induction of apoptotic pathways. These findings match our previous transcriptomic data in HeLa cells, showing CDPs-mediated upregulation of FOXO1-related genes such as GADD45A and SGK1 [9].
Gab1, an adaptor protein that integrates signals for proliferation, angiogenesis, and invasion [20], was overexpressed and phosphorylated in TNBC tumors but was downregulated by CDPs, especially when combined with MTX (Figure 7). This suggests that inhibiting Gab1 is a key mechanism behind the suppression of invasion- and metastasis-related processes by the effect of CDPs. Protein analysis in the xenografted tumors confirmed the inhibition of the Akt pathway. Consistent with the in vitro results, the expression of phosphorylated Akt protein was reduced in the CDPs-treated groups, as Gab1, p-Gab1, FOXO1, and its phosphorylated form p-FOXO1 were markedly decreased in tumors from mice treated with CDPs, MTX, or the combination of CDPs+MTX.
The study of gene expression in the liver provided essential data on tumor-associated systemic alterations modulated by the CDPs. To further investigate the metastasis-related signaling pathways targeted by the CDPs, we examined the hepatic expression of related gene markers linked to several pathways involved in tumor progression, immune regulation, and cellular plasticity (Figure 9). RT-qPCR analysis revealed that CDPs treatment significantly reversed the overexpression of key genes seen in the TNBC group, including SNAIL and ZEB1, which are associated with promoting EMT, invasiveness, metastasis, and drug resistance. Among immune checkpoint components, such as PD-L1, which plays a role in immune evasion, overexpression was observed in the TNBC group and returned to normal levels following CDPs treatment, approaching expression levels seen in healthy controls. Regarding genes involved in DNA damage/repair and the cell cycle—such as BRCA1 and GADD45A, which showed a marked increase in the TNBC group consistent with tumor-induced systemic stress and genomic instability—these were normalized by CDPs treatment. Conversely, genes like PTEN, CXCL12, and CDKN1A (p21) were overexpressed in the livers of animals treated with both CDPs and MTX compared to untreated healthy mice, indicating activation of compensatory tumor-suppressive and cell cycle–regulatory mechanisms linked to EMT, invasiveness, metastasis, and drug resistance, reflecting an adaptive hepatic response to reinforce immune regulation, growth suppression, and homeostasis in the presence of tumor burden. Taken together, these findings suggest that bacterial CDPs in the TNBC model modulate tumor-associated systemic gene expression programs related to DNA damage responses, immune regulation, and cellular stress, thereby influencing molecular mechanisms associated with tumor aggressiveness and metastatic progression. This modulation targets both tumor cell–intrinsic signaling pathways and tumor-associated systemic responses. The inhibition of Akt/mTOR/S6K signaling, suppression of EMT markers, modulation of immune-related genes, and favorable safety profile collectively position CDPs as promising therapeutic agents. Moreover, the enhanced efficacy observed when CDPs are combined with MTX supports the potential of combination strategies to improve treatment outcomes in aggressive breast cancer subtypes.
In summary, in the TNBC mouse model, CDPs administration significantly reversed primary tumor growth in the mammary glands, with greater effectiveness when com-bined with MTX. Beyond local tumor control, CDPs treatment reduced tumor-associated systemic changes in distant organs, like liver, which are commonly involved in metastatic progression. The treatment with CDPs lowered metastatic foci in organs such as the liver. At the molecular level, CDPs modulated the expression of genes linked to tumor ag-gressiveness, immune regulation, and stress responses, such as SNAIL, GADD45A, and PD-L1, while increasing the expression of growth-suppressing and homeostatic regulators including PTEN, CXCL12, and CDKN1A (p21). The data provide new insights into the molecular mechanisms behind the anti-metastatic and anti-invasive effects of CDPs, showing that these effects are connected to genes involved in EMT, invasiveness, and metastasis. This indicates that the signal transduction mechanism involves inhibition of phosphorylation in the Akt/mTOR/S6K pathway and of metastasis markers like Vimentin, Gab1, and FOXO1. The findings suggest that combining CDPs with MTX amplifies the anti-metastatic effect in a TNBC xenograft model using the MDA-MB-231 line, indicating that bacterial CDPs could be a promising therapeutic agent. In conclusion, bacterial cyclic peptides represent a promising multi-target therapy for TNBC, showing greater efficacy than MTX in vivo. Their mechanism involves blocking the PI3K/Akt/mTOR/FOXO1 pathway and suppressing EMT, resulting in strong anti-tumor and anti-metastatic effects with a good safety profile.
4. Materials and Methods
4.1. Chemicals, Reagents, and Cell Culture
The chemicals and reagents used include Dulbecco's Modified Eagle Medium (DMEM; Sigma-Aldrich), fetal bovine serum (FBS; Gibco Life Technologies), and trypsin solution (Sigma-Aldrich). A mixture mainly composed of cyclo(L-Pro-L-Tyr), cy-clo(L-Pro-L-Val), cyclo(L-Pro-L-Leu), and cyclo(L-Pro-L-Phe) is isolated from the cell-free supernatant of Pseudomonas aeruginosa PAO1 bacteria, with a purity of over 95% [21,22]. This mixture is dissolved in a DMSO-water ratio of 1:3 to prepare stock solutions (100 mg/mL). The MDA-MB-231 breast tumor cell line was obtained from invasive ductal carcinoma (ATCC, Manassas, VA, USA) and cultured in complete media [DMEM sup-plemented with 10% (v/v) FBS, 100 units/mL penicillin, 40 µg/mL streptomycin, and 1 µg/mL amphotericin B (Sigma-Aldrich)], with 1.6 g/L glucose added. Cell culture media were changed twice a week, with cells incubated at 37°C, 80% humidity, and 5% CO2. Cells were then trypsinized and counted using a hemocytometer. All cell cultures and procedures were performed in class II biological safety cabinets.
4.2. Cell Viability and Apoptosis Determination
Cell viability was determined with the MTT method. Briefly, cell cultures were grown in 96-well flat-bottomed plates in DMEM medium containing FBS for 24 h, then incubated with CDPs for 24 h at 37°C with 5% CO2. MTT (50 mg/mL) in PBS was added to each well, and the mixture was incubated for 4 h at 37°C. Finally, 100 μL of 2-propanol/1M HCl (19:1, v/v) was added to dissolve the formazan crystals, and the absorbance was measured at 595 nm using a microplate reader (BioTek Instruments).
Necrosis and apoptosis were evaluated in cell cultures incubated in DMEM medium with FBS for 4 h with CDPs treatment. Following incubation, cells were collected by centrifugation at 2,000 × g for 10 min. The pellet was suspended in 20 μL and incubated with annexin V and propidium iodide (PI) (Molecular Probes, Invitrogen). Fluorescence was immediately quantified by FACS using an Accuri-C6 Flow Cytometer (BD Biosci-ences). At least 20,000 cellular events were used for calculations.
4.3. Wound Closure Migration Assay
The MDA-MB-231 cell line was grown to 95% confluence, and three wounds were created per plate using a sterile pipette tip. All assays were performed in triplicate. After wounding, plates were washed twice with phosphate-buffered saline (PBS) and replen-ished with fresh complete medium. Cells were then treated with CDPs (0.01 mg/mL), methotrexate (MTX; 0.05 mg/mL), or their combination for 48 h. Representative images were taken every 24 h, and wound dimensions were quantified using ImageJ software (NIH).
4.4. Invasion Assay
The invasive capacity of the MDA-MB-231 cell line was evaluated using a transwell chamber pre-coated with Matrigel (Corning Life Sciences). Cells were seeded in the upper chamber in complete DMEM medium. For co-culture experiments, RAW 264.7 macro-phages were seeded in the lower chamber containing complete DMEM medium. Cells were treated with CDPs (0.01 mg/mL) or methotrexate (MTX; 0.05 mg/mL) incubated by 24 h at 37°C with 5% CO2. Inserts were then briefly washed with PBS, and cells that had invaded through the Matrigel and adhered to the lower surface of the membrane were fixed with 70% ethanol for 15 min at room temperature. Fixed cells were stained with 0.2% (w/v) crystal violet for 5 min, washed thoroughly with PBS to remove excess dye, and air-dried. Invaded cells were visualized by optical microscopy [23].
4.5. Multicellular Spheroids
MDA-MB-231 cell line (2 x10⁵ cells) was cultured under non-adherent conditions using 0.6% agarose in complete DMEM medium to generate multicellular spheroids. Cultures were maintained for 14 days with periodic medium replacement until the spheroids reached a diameter of 40-50 µm [14]. Spheroids were then treated with CDPs (0.1 mg/mL) or methotrexate (MTX; 0.05 mg/mL) and incubated for 4 h, a time point selected to cor-respond with the determination of lethal (LD₅₀) and apoptotic effective (ED₅₀) doses. Following treatment, spheroids were visualized by optical microscopy, and cell viability was assessed using the MTT assay.
4.6. Western Blot Assays
Confluent MDA-MB-231 cells were treated with CDPs (0.1 mg/mL) and incubated for 15 min, 1 h, and 4 h. Cells were then harvested by trypsinization, washed twice with PBS, and centrifuged at 5000 × g for 10 min at 4 °C. Cells pellets or tumor tissue were resus-pended in RIPA lysis buffer, and lysed by three cycles of low- intensity sonication (20 kHz, 5 W, 30 s each) at 4 °C using an Hielscher LS24 ultrasonic processor. The protein extract free of cellular debris was obtained by centrifugation at 7500 × g for 15 min, and the protein concentration was determined by the Bradford method (BioRad). Equal amounts of protein were separated by 10% SDS-PAGE and transferred onto PVDF membranes (Millipore) using a Bio-Rad transfer system at 15 volts for 45 min. Membranes were blocked with TBS-T (Tris-HCL 10 mM; NaCl 0.9%; tween-20 0.1%, dry milk 5%, pH 7.8), washed three times for 6 min each, and incubated overnight at 4 °C with primary antibodies diluted in TBS-T (1:5,000). The following primary antibodies were used: anti-Akt (cat. 2938), an-ti-p-Akt (cat. 4060), anti-mTOR (cat. 2983), anti-p-mTOR (cat. 5536), anti-S6K (cat. 2708), anti-p-S6K (cat. 9234), anti-Vimentin (cat. 3932); anti-Gab1 (cat. 3232), anti-p-Gab1 (cat. 3234), anti-FOXO1 (cat. 2880), anti-p-FOXO1 (cat. 9464), and anti--actin (cat. 4967) (Cell Signaling Technology and Santa Cruz Biotechnology). After three washes with TBS-T (6 min each), membranes were incubated with HRP-conjugated secondary antibody (Bio-Rad) diluted 1:10,000 in TBS-T for 2 h at room temperature. Immunoreactive bands were detected using SuperSignal™ West Pico chemiluminescent substrate (Pierce; Thermo Fisher Scientific) and visualized with a ChemiDoc™ MP imaging system (Bio-Rad). As-says were conducted at least three times, and representative images are shown. ImageJ (NIH) was used to quantify image band intensities.
4.7. Xenografted Metastatic Breast Cancer Model
Immunosuppressed female BALB/c nu/nu mice (8 weeks old) were acclimated for 15 days in a pathogen-free environment with a standard diet and water provided ad libitum. All animal procedures were approved by the Institutional Animal Care and Use Com-mittee (IACUC) from the Universidad Michoacana de San Nicolás de Hidalgo (IIIQB-UMSNH-IACUC-2022-35). Experiments complied with standard guidelines for the welfare of animals following the Institutional Committee and recommendations of the Mexican Official Regulations for the Use and Care of Animals (NOM 062-ZOO-1999; Ministry of Agriculture, Mexico).
Once the acclimation period concluded with 100% of animals survival, mice were orthotopically implanted with 1 × 10⁵ MDA-MB-231 metastatic breast cancer cells sus-pended in Matrigel and injected into the mammary fat pad adjacent to the right axillary region. Animals were anesthetized by intraperitoneal administration of ketamine (80 mg/kg) and xylazine (10–15 mg/kg). Body weight was monitored throughout the ex-periment, and tumor dimensions were measured with a caliper. Tumor volume (TV) was calculated using the formula TV = (0.4) (ab²), where "a" represents the longest tumor diameter and “b”the shortest diameter. In addition, a pilot study was carried out to select the doses of CDPs to be tested in the TNBC mice model; thus, we decided to use 0.25 mg/kg of mouse body weight. Treatments were administered intraperitoneally and consisted of CDPs (0.25 mg/kg), methotrexate (MTX; 0.05 mg/kg), or a combination of CDPs and MTX (0.25 mg/kg CDPs + 0.05 mg/kg MTX). The CDPs treatments involved three rounds of administration, each consisting of three doses given every 3 days (with a 2-day rest between doses), and a week of rest between rounds, totaling 9 doses per mouse. The animal groups, each consisting of five mice (n=5) as follows (Figure 3): healthy mice without treatment (C) – procedure 1; healthy mice treated with CDPs (C+CDPs) – pro-cedure 1; mice with TNBC tumors without treatment (TNBC) – procedure 2; mice with tumors treated with CDPs starting from cell inoculation in early stage (TNBC+CDPs (2)) – procedure 2; mice with tumors treated with CDPs at the 35th day post-inoculation in advanced stage (TNBC+CDPs (3)) – procedure 3; mice with advanced-stage tumors treated with MTX (TNBC+MTX (3)) – procedure 3; and mice with tumors treated with a combi-nation of CDPs and MTX (TNBC+CDPs+MTX (3)) – procedure 3.
4.8. Animal Euthanasia and Biological Sample Collection
All mice were euthanized by intraperitoneal administration of a lethal dose of sodium pentobarbital (100-150 mg/Kg body weight), as recommended by IIQB/UMSNH/-IACUC and NOM 062-ZOO-1999. Following confirmation of death, tumors were excised, and whole blood was collected by cardiac puncture into microtubes containing EDTA as an anticoagulant. Major organs were subsequently harvested and weighed.
Blood hemoglobin was determined using heparinized capillary tubes by centrifu-gation at 3,500 rpm for 5 min to separate red blood cells from plasma. Subsequently, serum biochemical parameters, including aspartate aminotransferase (AST), alanine ami-notransferase (ALT), and lactate dehydrogenase (LDH), were quantified using a Fuji Dry-Chem NX700 (Fujifilm).
4.9. Histological Analysis of Tissues
After euthanasia, tumors, liver, lungs, and spleen were excised and processed for histological evaluation. Tissues were fixed in 4% paraformaldehyde and remained until dehydration. The samples were subjected to a 4 h dehydration process at varying ethanol and xylene concentrations, then embedded in paraffin. Paraffin-embedded tissues were sectioned at a thickness of 4 µm, mounted on glass slides, and stained with hematoxylin and eosin (H&E). Photographs were taken under an optical microscope and recorded using an Accu-Scope EXC-120 LED microscope camera at magnifications of 4x, 10x, and 40x.
4.10. RNA Extraction and RT-qPCR
Total RNA from liver samples of each animal group was pooled, homogenized using a tissue homogenizer (Biospec Products), and extracted using TRIzol reagent (Invitrogen; Thermo Fisher Scientific) according to the manufacturer's protocol. The RNA concentration and quality were assessed using a spectrophotometer (NanoDrop 2000; Thermo Fisher Scientific). According to the manufacturer's instructions, complementary DNA (cDNA) was synthesized using a QuantiNova Reverse Transcription Kit (Bio-Rad). Quantitative PCR (qPCR) was performed using the Quantinova SYBR Green PCR Kit (Bio-Rad) in a reaction volume of 10 µl. The thermocycling conditions were set as follows: initial de-naturation at 95°C for 10 minutes, followed by 40 cycles of denaturation at 95°C for 5 seconds and annealing/extension at 60°C for 30 seconds and extension to 68°C for 30 seconds using a thermocycler (QuantStudio 3; Applied Biosystems by Thermo Fisher Scientific). Relative gene expression levels was calculated using the comparative 2-ΔΔCt method, normalizing to the internal reference gene ACTB (-actin). All experiments were conducted in triplicate. The sequences of the gene-specific primers are provided in Table S1.
4.11. Statistical Analysis
All data were evaluated using analysis of variance (ANOVA), and significant dif-ferences (p< 0.05) were determined using Tukey's or Bonferroni post hoc tests in GraphPad Prism 6.0.
Supplementary Materials
The following supporting information can be downloaded at the website of this paper posted on Preprints.org.
Author Contributions
Conceptualization, J. Campos-García; Data curation, L. Mar-tínez-Alcantar; Formal analysis, L. Martínez-Alcantar; Funding acquisition, J. Campos-García; Investigation, M. Durán-Maldonado, X. Hernandez-Ramos, and L. Martínez-Alcantar; Method-ology, M. Durán-Maldonado, X. Hernandez-Ramos, and M. Campos-Morales; Supervision, L. Hernández-Padilla and J. Campos-García; Writing – original draft, L. Martínez-Alcantar and L. Hernández-Padilla; Writing – review & editing, L. Martínez-Alcantar and J. Campos-García.
Funding
This research was funded by Secretaría de Ciencia, Humanidades, Tecnología e In-navación (SECIHTI, before CONAHCYT) of Mexico (grant number 256119) and by a grant from the Universidad Michoacana de San Nicolás de Hidalgo/C.I.C.2.14.
Institutional Review Board Statement
All procedures performed in animal studies followed the ethical standards of the institution or practice at which the studies were conducted. The Insti-tutional Animal and Use Committee (IACUC) approved the study from the Universidad Micho-acana de San Nicolás de Hidalgo (protocol: IIIQB-UMSNH-IACUC-2022-33). The experiments followed the Institutional Committee and recommendations of the Mexican Official Regulations for the Use and Care of Animals (NOM 062-ZOO-1999; Ministry of Agriculture, Mexico).
Informed Consent Statement
Not applicable.
Data Availability Statement
The data supporting the findings of this study are available from the corresponding author upon request.
Acknowledgments
Thanks to the Secretaría de Ciencia, Humanidades, Tecnología e Innovación (SECIHTI, before CONAHCYT) of Mexico and the Universidad Michoacana de San Nicolás de Hidalgo for scholarship grants to M.X.D.M., M. C.M., X. H.R., and L.H.P.
Conflicts of Interest
The authors declare no conflicts of interest. The funders had no role in the study's design, data collection, analysis, or interpretation, the writing of the manuscript, or the decision to publish the results.
References
- Sung, H.; et al. Global Cancer Statistics 2020: GLOBOCAN Estimates of Incidence and Mortality Worldwide for 36 Cancers in 185 Countries. CA Cancer J Clin 2021, 71, 209–249. [Google Scholar] [CrossRef] [PubMed]
- Derakhshan, F.; Reis-Filho, J.S. Pathogenesis of Triple-Negative Breast Cancer. Annu Rev Pathol 2022, 17, 181–204. [Google Scholar] [CrossRef] [PubMed]
- Martínez-Alcantar, L.; et al. Cyclic Peptides as Protein Kinase Modulators and Their Involvement in the Treatment of Diverse Human Diseases. Kinases and Phosphatases 2024, 2, 346–378. [Google Scholar] [CrossRef]
- Xie, Y.; et al. Mammary adipocytes protect triple-negative breast cancer cells from ferroptosis. Journal of Hematology & Oncology 2022, 15, 72. [Google Scholar] [CrossRef]
- Hernández-Padilla, L.; et al. The Antiproliferative Effect of Cyclodipeptides from Pseudomonas aeruginosa PAO1 on HeLa Cells Involves Inhibition of Phosphorylation of Akt and S6k Kinases. Molecules 2017, 22, 1024. [Google Scholar] [CrossRef]
- Hernández-Padilla, L.; Reyes de la Cruz, H.; Campos-García, J. Antiproliferative effect of bacterial cyclodipeptides in the HeLa line of human cervical cancer reveals multiple protein kinase targeting, including mTORC1/C2 complex inhibition in a TSC1/2-dependent manner. Apoptosis 2020, 25, 632–647. [Google Scholar] [CrossRef]
- Hernández-Padilla, L.; et al. The HGF/Met Receptor Mediates Cytotoxic Effect of Bacterial Cyclodipeptides in Human Cervical Cancer Cells. Current Cancer Drug Targets 2025, 25, 230–243. [Google Scholar] [CrossRef]
- Vázquez-Rivera, D.; et al. Cytotoxicity of cyclodipeptides from Pseudomonas aeruginosa PAO1 leads to apoptosis in human cancer cell lines. BioMed research international 2015, 2015. [Google Scholar]
- Lázaro-Mixteco, P.E.; et al. Transcriptomics Reveals the Mevalonate and Cholesterol Pathways Blocking as Part of the Bacterial Cyclodipeptides Cytotoxic Effects in HeLa Cells of Human Cervix Adenocarcinoma. Front Oncol 2022, 12, 790537. [Google Scholar] [CrossRef]
- Durán-Maldonado, M.X.; et al. Bacterial Cyclodipeptides Target Signal Pathways Involved in Malignant Melanoma. Front Oncol 2020, 10, 1111. [Google Scholar] [CrossRef]
- Hasan, M.M.; et al. Cyclic peptides as an inhibitor of metastasis in breast cancer targeting MMP-1: Computational approach. Informatics in Medicine Unlocked 2022, 35, 101128. [Google Scholar] [CrossRef]
- Wauters, I.; et al. Beyond the Diketopiperazine Family with Alternatively Bridged Brevianamide F Analogues. J Org Chem 2015, 80, 8046–54. [Google Scholar] [CrossRef] [PubMed]
- Liu, Q.Q.; et al. Verticillin A inhibits colon cancer cell migration and invasion by targeting c-Met. J Zhejiang Univ Sci B 2020, 21, 779–795. [Google Scholar] [CrossRef] [PubMed]
- Reynolds, D.S.; et al. Breast Cancer Spheroids Reveal a Differential Cancer Stem Cell Response to Chemotherapeutic Treatment. Sci Rep 2017, 7, 10382. [Google Scholar] [CrossRef] [PubMed]
- Usman, S.; et al. Vimentin Is at the Heart of Epithelial Mesenchymal Transition (EMT) Mediated Metastasis. Cancers (Basel) 2021, 13(19). [Google Scholar] [CrossRef]
- Leser, C.; et al. Liver function indicators in patients with breast cancer before and after detection of hepatic metastases-a retrospective study. PLoS One 2023, 18, e0278454. [Google Scholar] [CrossRef]
- Chen, J.; et al. Prognostic value of neutrophil-to-lymphocyte ratio in breast cancer. FEBS Open Bio 2015, 5, 502–7. [Google Scholar] [CrossRef]
- Jiramongkol, Y.; Lam, E.W. FOXO transcription factor family in cancer and metastasis. Cancer Metastasis Rev 2020, 39, 681–709. [Google Scholar] [CrossRef]
- Saline, M.; et al. AMPK and AKT protein kinases hierarchically phosphorylate the N-terminus of the FOXO1 transcription factor, modulating interactions with 14-3-3 proteins. J Biol Chem 2019, 294, 13106–13116. [Google Scholar] [CrossRef]
- Pérez-Baena, M.J.; et al. The Role of GAB1 in Cancer. Cancers (Basel) 2023, 15. [Google Scholar] [CrossRef]
- Ortiz-Castro, R.; et al. Transkingdom signaling based on bacterial cyclodipeptides with auxin activity in plants. Proc Natl Acad Sci U S A 2011, 108, 7253–8. [Google Scholar] [CrossRef]
- González, O.; et al. Non-ribosomal Peptide Synthases from Pseudomonas aeruginosa Play a Role in Cyclodipeptide Biosynthesis, Quorum-Sensing Regulation, and Root Development in a Plant Host. Microb Ecol 2017, 73, 616–629. [Google Scholar] [CrossRef]
- Justus, C.R.; et al. Transwell In Vitro Cell Migration and Invasion Assays. Methods Mol Biol 2023, 2644, 349–359. [Google Scholar]
Figure 1.
Effects of bacterial CDPs on the migratory and invasive properties of MDA-MB-231 breast cancer cells. a) Representative photographs of wound closure migration assays taken at zero h and 48 h in MDA-MB-231 cell cultures treated with the saline solution (CTRL), CDPs (0.01 mg/mL), MTX (0.05 mg/mL), or combined CDPs+MTX treatment (0.01 mg/mL + 0.05 mg/mL, re-spectively) b) Representative photographs of the cancer cells that managed to invade the Mat-rigel-covered membrane, stained with crystal violet. The monoculture conditions and co-culture with RAW 264.7 macrophages are shown. Treatment were CDPs (0.01 mg/mL), MTX (0.05 mg/mL), or combined CDPs+MTX treatment (0.01 mg/mL + 0.05 mg/mL, respectively) by 24 h. Below, the quantification of the wound dimension expressed in percentage (a) and the number of invasive cells (b) is done using ImageJ Software. c-d) Representative photographs of multicellular spheroids of the MDA-MB-231 line. e) Cell viability of the spheroids treated with CDPs (0.1 mg/mL) plus MTX (0.05 mg/mL) determined by the MTT method after 24 h of incubation. f) Cell viability and apoptosis induction of the MDA-MB-231 cell cultures submitted to CDPs treatments for 4 h, determined by FACS. Bars represent means ± SE, n=3. Statistical analysis was performed using one-way ANOVA and Tukey's post hoc test. SE values are shown as bars, and significant differences are indicated with different lowercase letters (p˂0.05). CDPs, cyclodipeptides; MTX, methotrexate; CDPs-cd, CDPs dissolved in β-cyclodextrins; CDPs-cd+MTX, combined treatment.
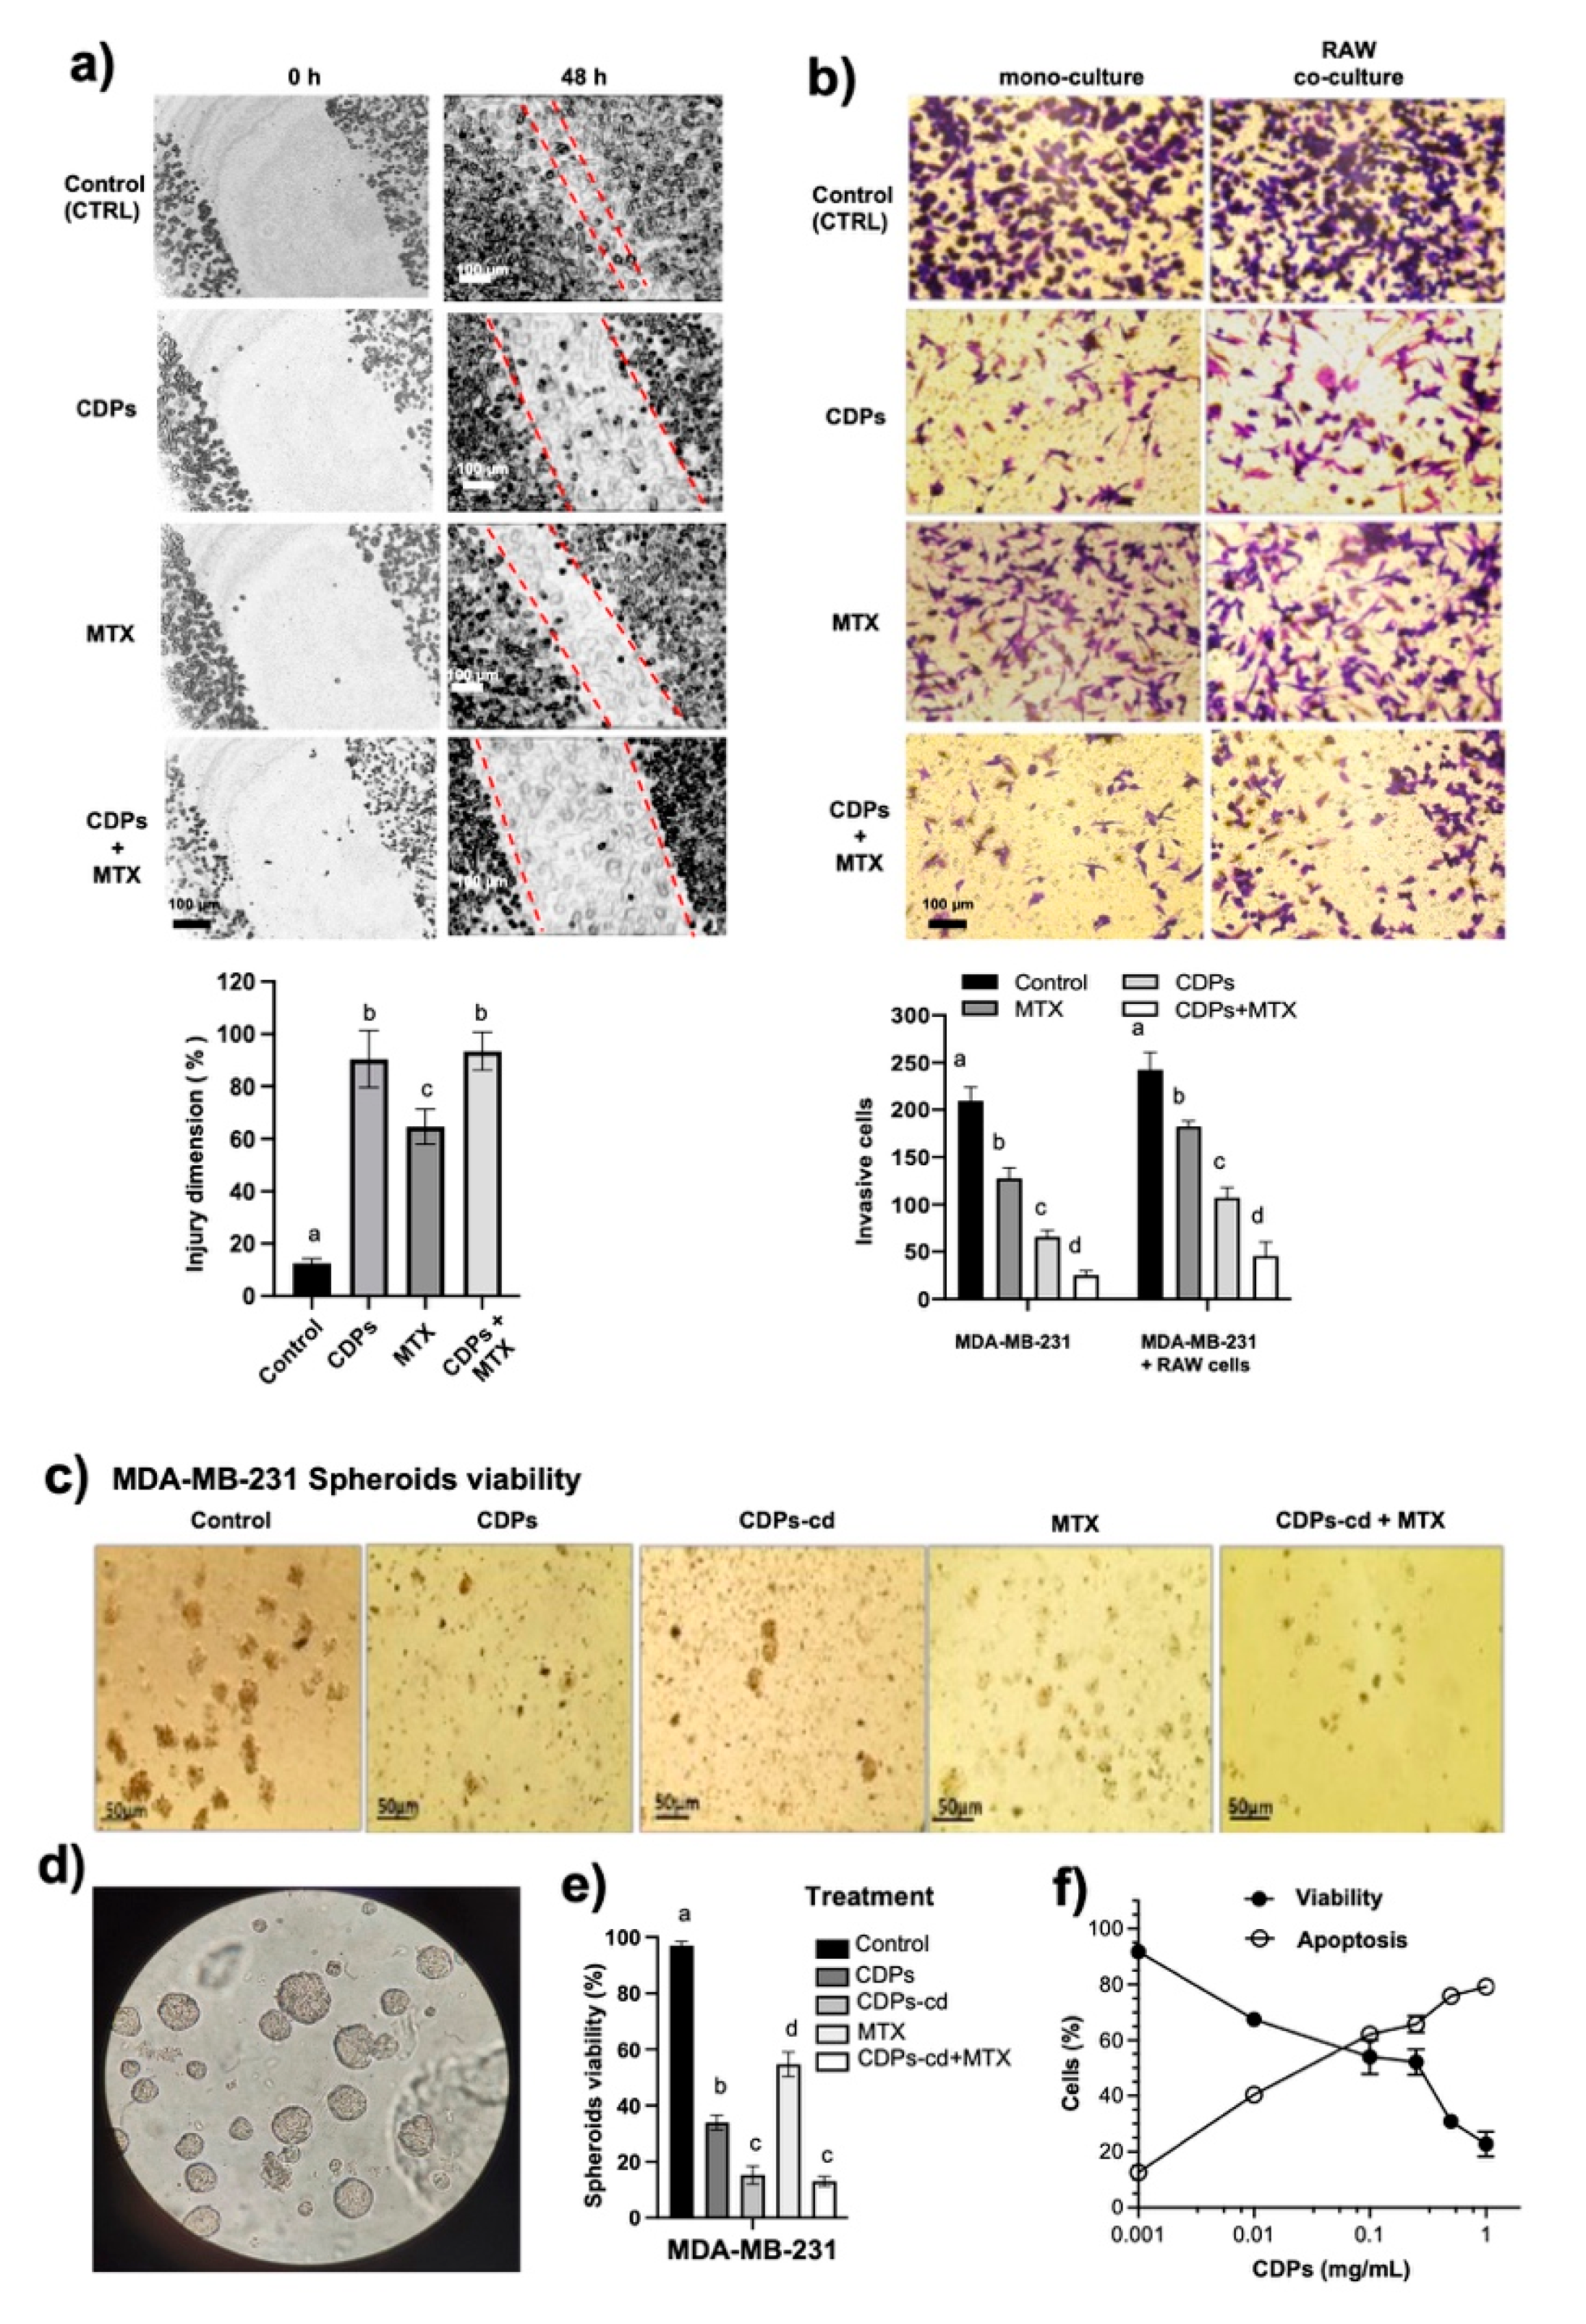
Figure 2.
Effect of bacterial CDPs on proteins involved in proliferation, invasion, and metastasis in MDA-MB-231 triple-negative breast cancer cells. Protein extracts obtained from cell cultures treated with CDPs (0.1 mg/mL) over time were subjected to immunodetection. Protein expression for the total Akt, phosphorylated Akt, total mTOR, phosphorylated mTOR, total S6K, phosphor-ylated S6K, Vimentin, phosphorylated Gab1, and β-actin is shown. Densitometric analyses of the protein immunodetection results are presented on the right. The bars represent the means ± SE; n = 3 per group. Statistical analysis was performed using one-way ANOVA, followed by Tukey's post hoc test; SE values are shown as bars, and significant differences are indicated with different lowercase letters (p <0.05).
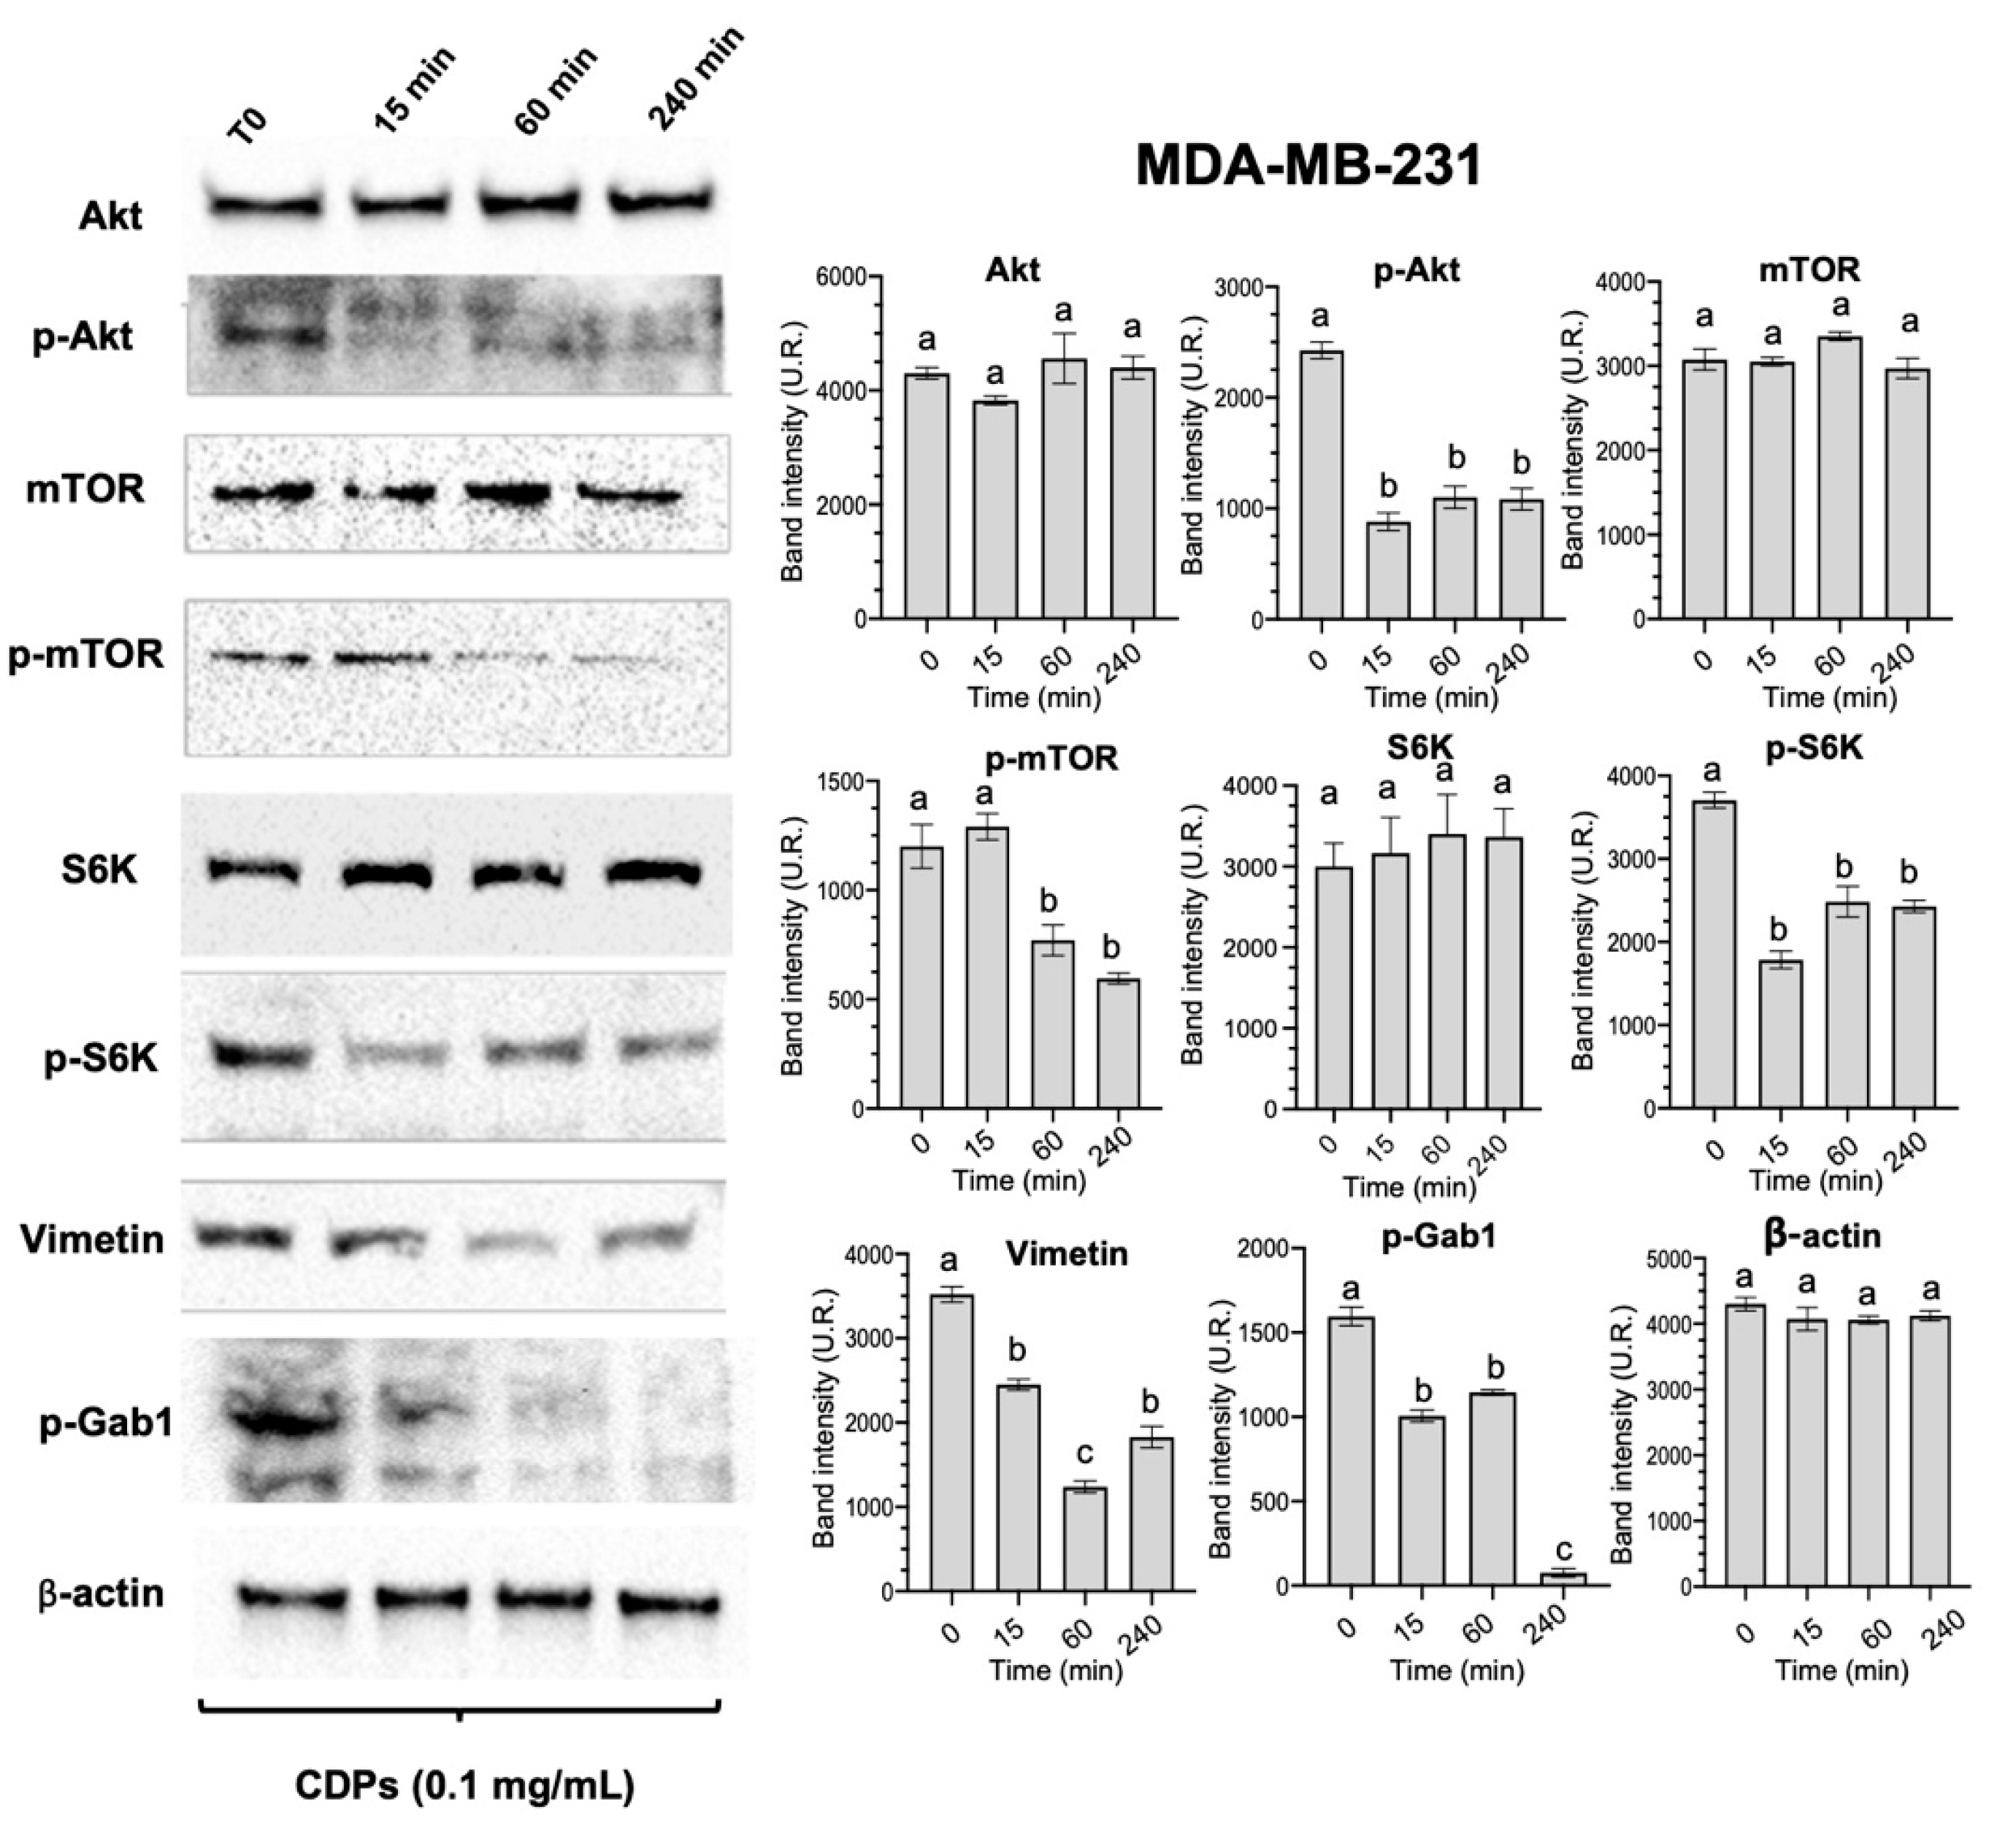
Figure 3.
Therapeutic procedures in the MDA-MB-231 immunosuppressed mouse model of triple-negative breast cancer treated with bacterial CDPs. Female BALB/c nu/nu mice (8 weeks old) were used to establish an orthotopic triple negative breast cancer xenograft model. Three experimental treatment protocols were tested: 1) Healthy animals were treated or not with CDPs at 35 days after the start of the procedure (indicated by arrows), followed by nine doses of CDPs (0.25 mg/kg) over 35 days. 2) Mice were orthotopically inoculated with MDA-MB-231 cells and simultaneously treated with CDPs, followed by nine doses of CDPs (0.25 mg/kg) during 35 days (indicated by arrows). Treatment was then continued for an additional 35 days in the corresponding groups. 3) The third treatment protocol, mammary tumors were allowed to develop for 35 days following MDA-MB-231 cell implantation. After that, nine doses of CDPs (0.25 mg/kg), MTX (0.05 mg/kg), or both CDPs and MTX were administered during 35 days (arrows). Finally, at 70 days from the start of treatment, all animals were ethically euthanized. The tumor volume was monitored in all mouse groups during the therapeutic experimental outline. At day 70, tumors in untreated TNBC group reached an average volume of ~300 mm3 (Figure 4a). In contrast, TNBC mice treated with CDPs exhibited a marked reduction in tumor volume, either from the time of MDA-MB-231 cell implantation or after the tumor establishment phase (procedures 2 and 3, respectively), showed a significant reduction in tumor volume of ~10 mm3 and ~3 mm3, respectively. This demonstrates that both CDPs treatment regimens were more effective than MTX, in which tumors reached an average volume of ~90 mm³ (Figure 4a).
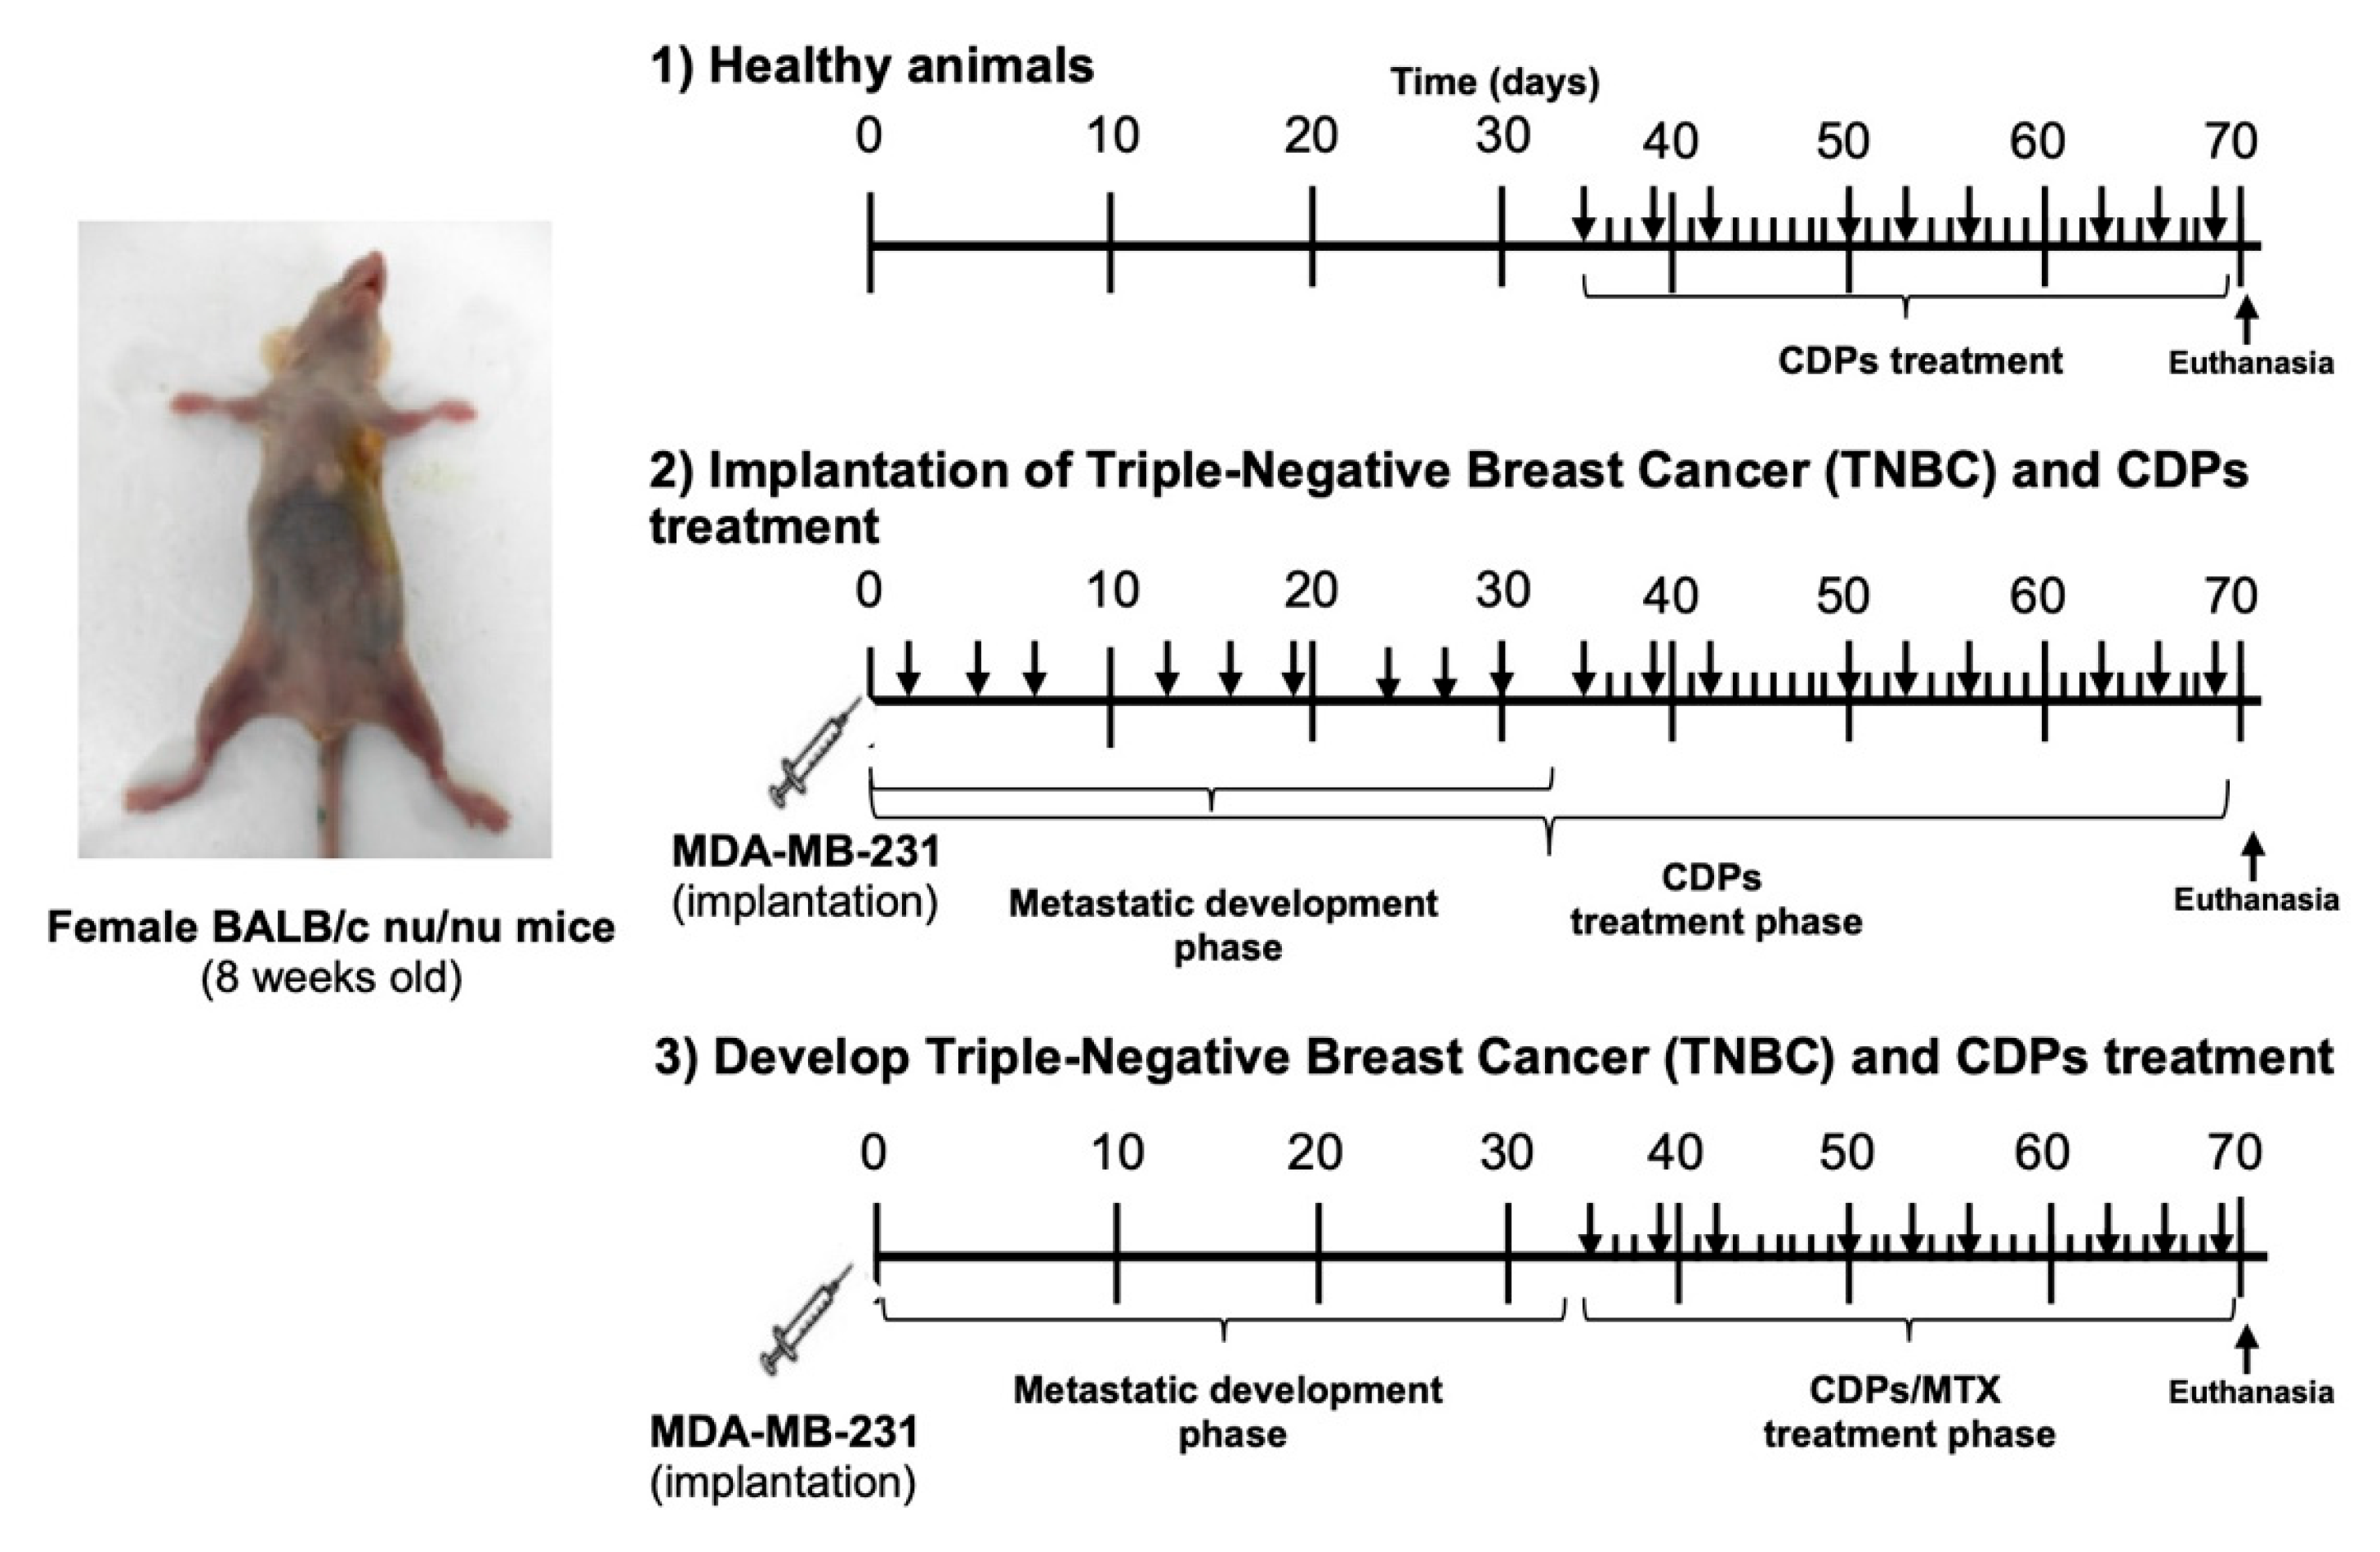
Figure 4.
Antitumor effects of bacterial CDPs in an MDA-MB-231 xenograft mouse model of tri-ple-negative breast cancer. a) Tumor volume expressed in mm3 monitored during the 70 days of the therapeutic procedure. b) Tumor weight expressed in grams. c) Weight of organs in grams. d) Representative photographs of animals, tumors, and organs from each mouse group are shown, n=5 per group. Arrows indicate metastatic foci in organs. Mouse groups: (CTRL), control healthy animals without treatment (procedure 1); CTRL+CDPs, healthy animals administered with CDPs (procedure 1); TNBC, animals that developed breast cancer without treatment (procedure 2); TNBC+CDPs (2), TNBC animals administered with CDPs (procedure 2); TNBC+CDPs (3), TNBC animals administered with CDPs (procedure 3); TNBC+MTX (3), TNBC animals administered with methotrexate (MTX) as procedure 3; TNBC+CDPs+MTX (3), TNBC animals co-administered with CDPs + MTX as procedure 3. Graphs show means ± SE; n = 5. Statistical analysis was performed using one-way ANOVA, followed by Tukey's post hoc test; SE values are shown as bars, and significant differences are indicated with different lowercase letters (p <0.05).
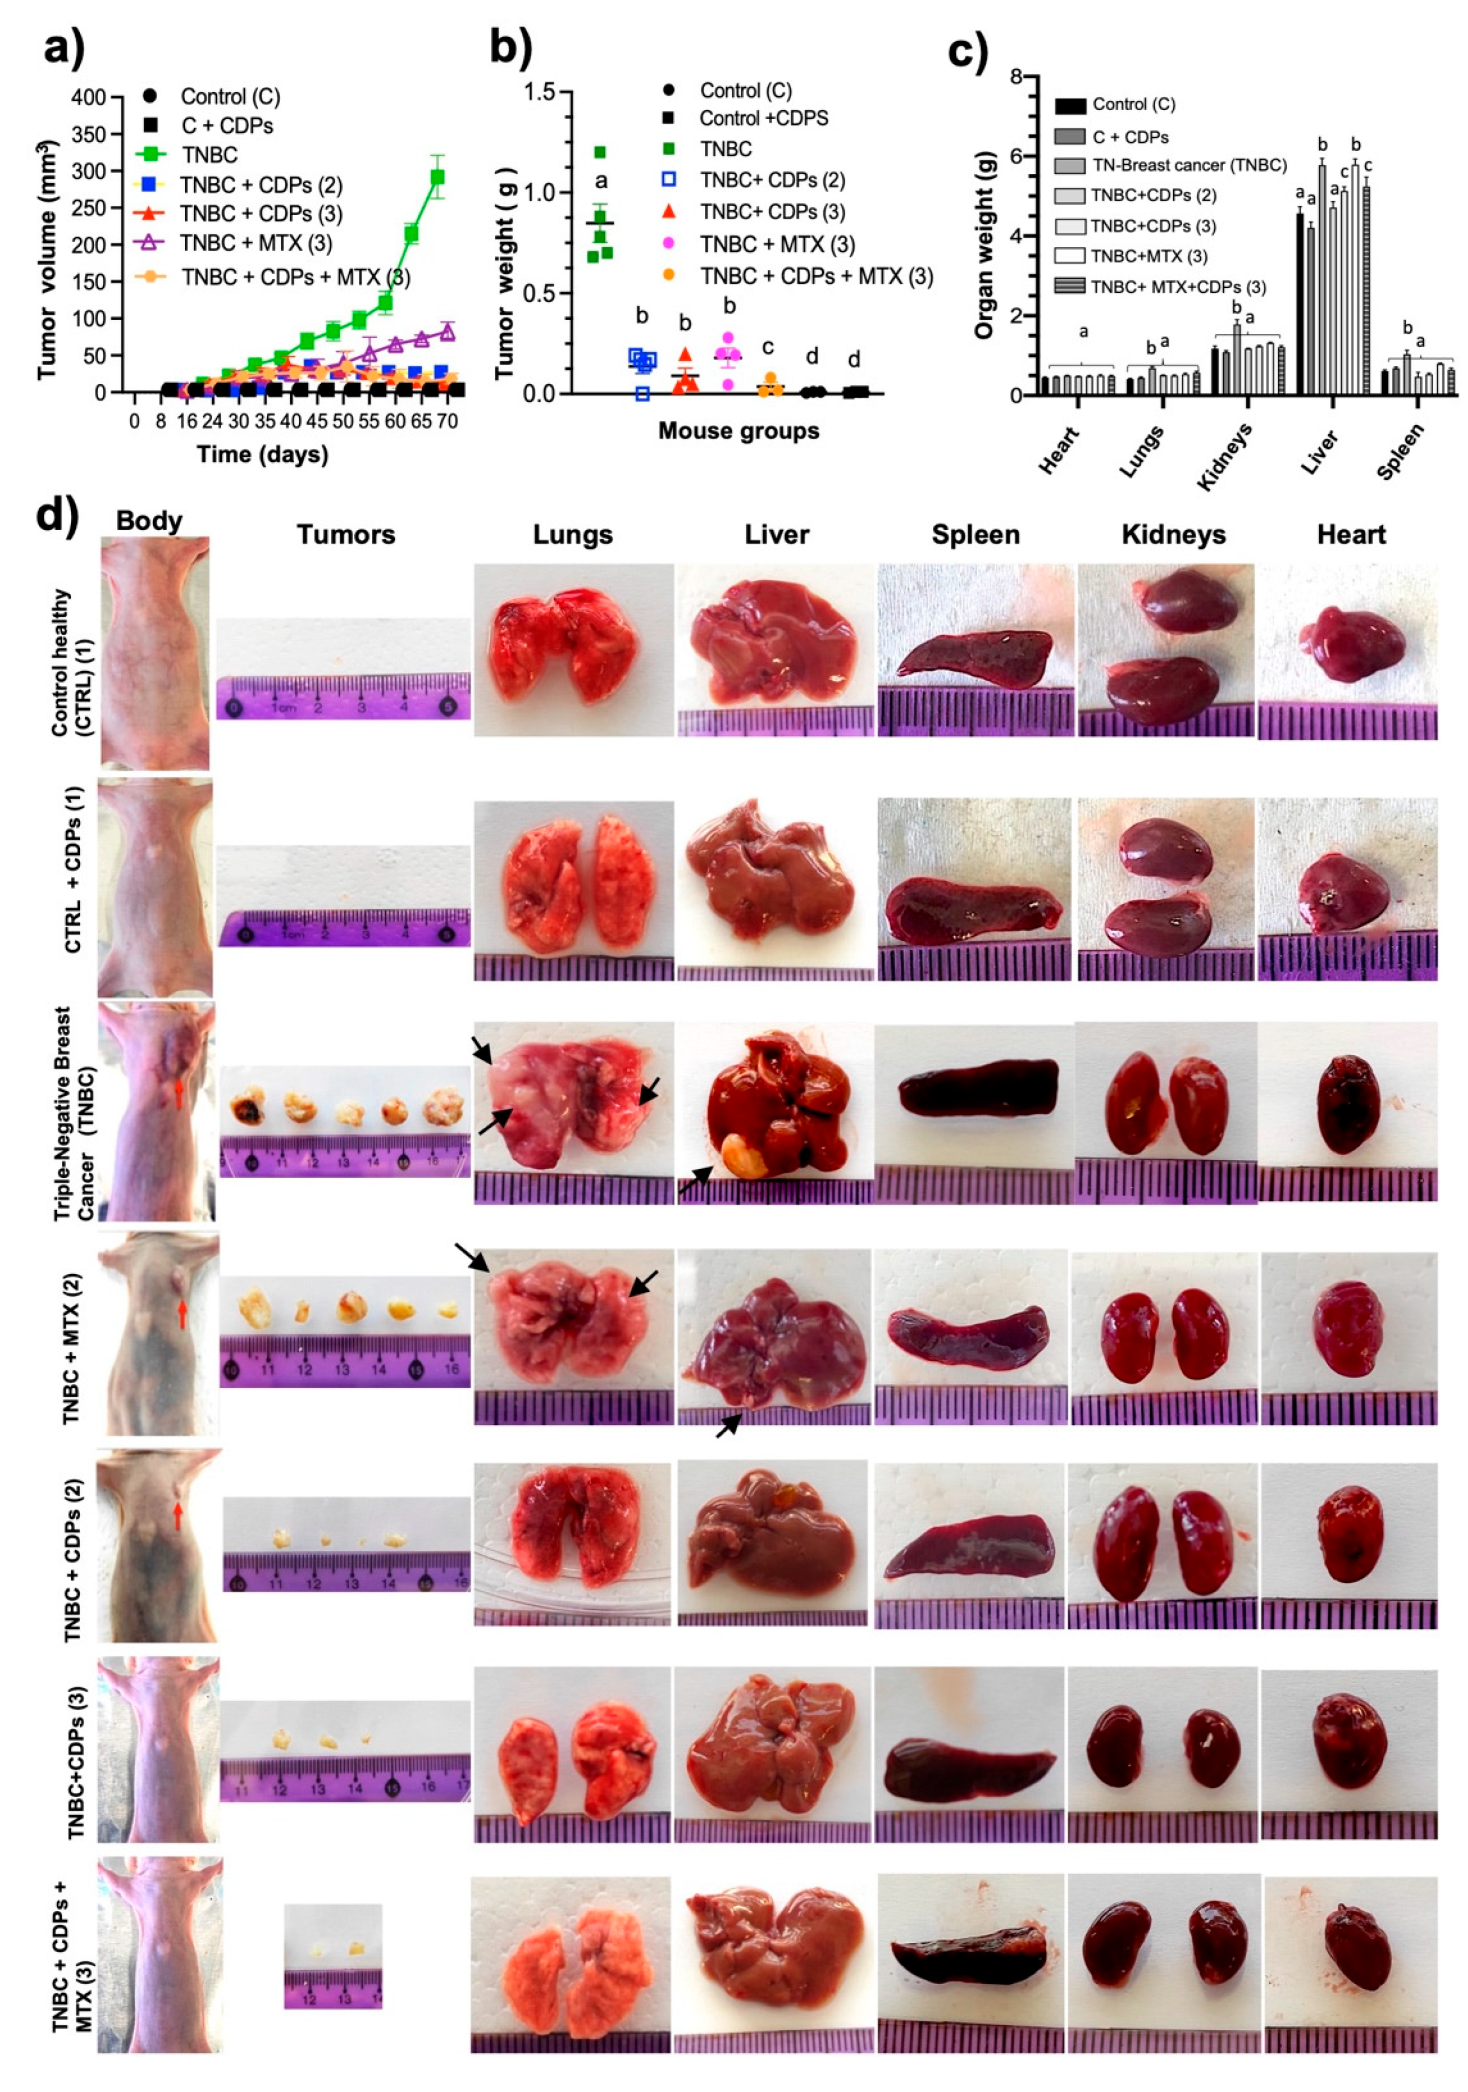
Figure 5.
Hematological parameters in xenografted triple-negative breast cancer MDA-MB-231 cells in immunosuppressed mice treated with bacterial CDPs. a) Measurement of enzyme activity of AST, ALT, and LDH in the serum of the mouse groups. b) Hemoglobin levels. c) Hematological profile of leukocyte counts. Group nomenclature is consistent with that described in Figure 4. Graphs display means ± SE; n = 5. Statistical analysis was conducted using one-way ANOVA, followed by Tukey's post hoc test; SE values are represented by bars, and significant differences are marked with different lowercase letters (p <0.05).
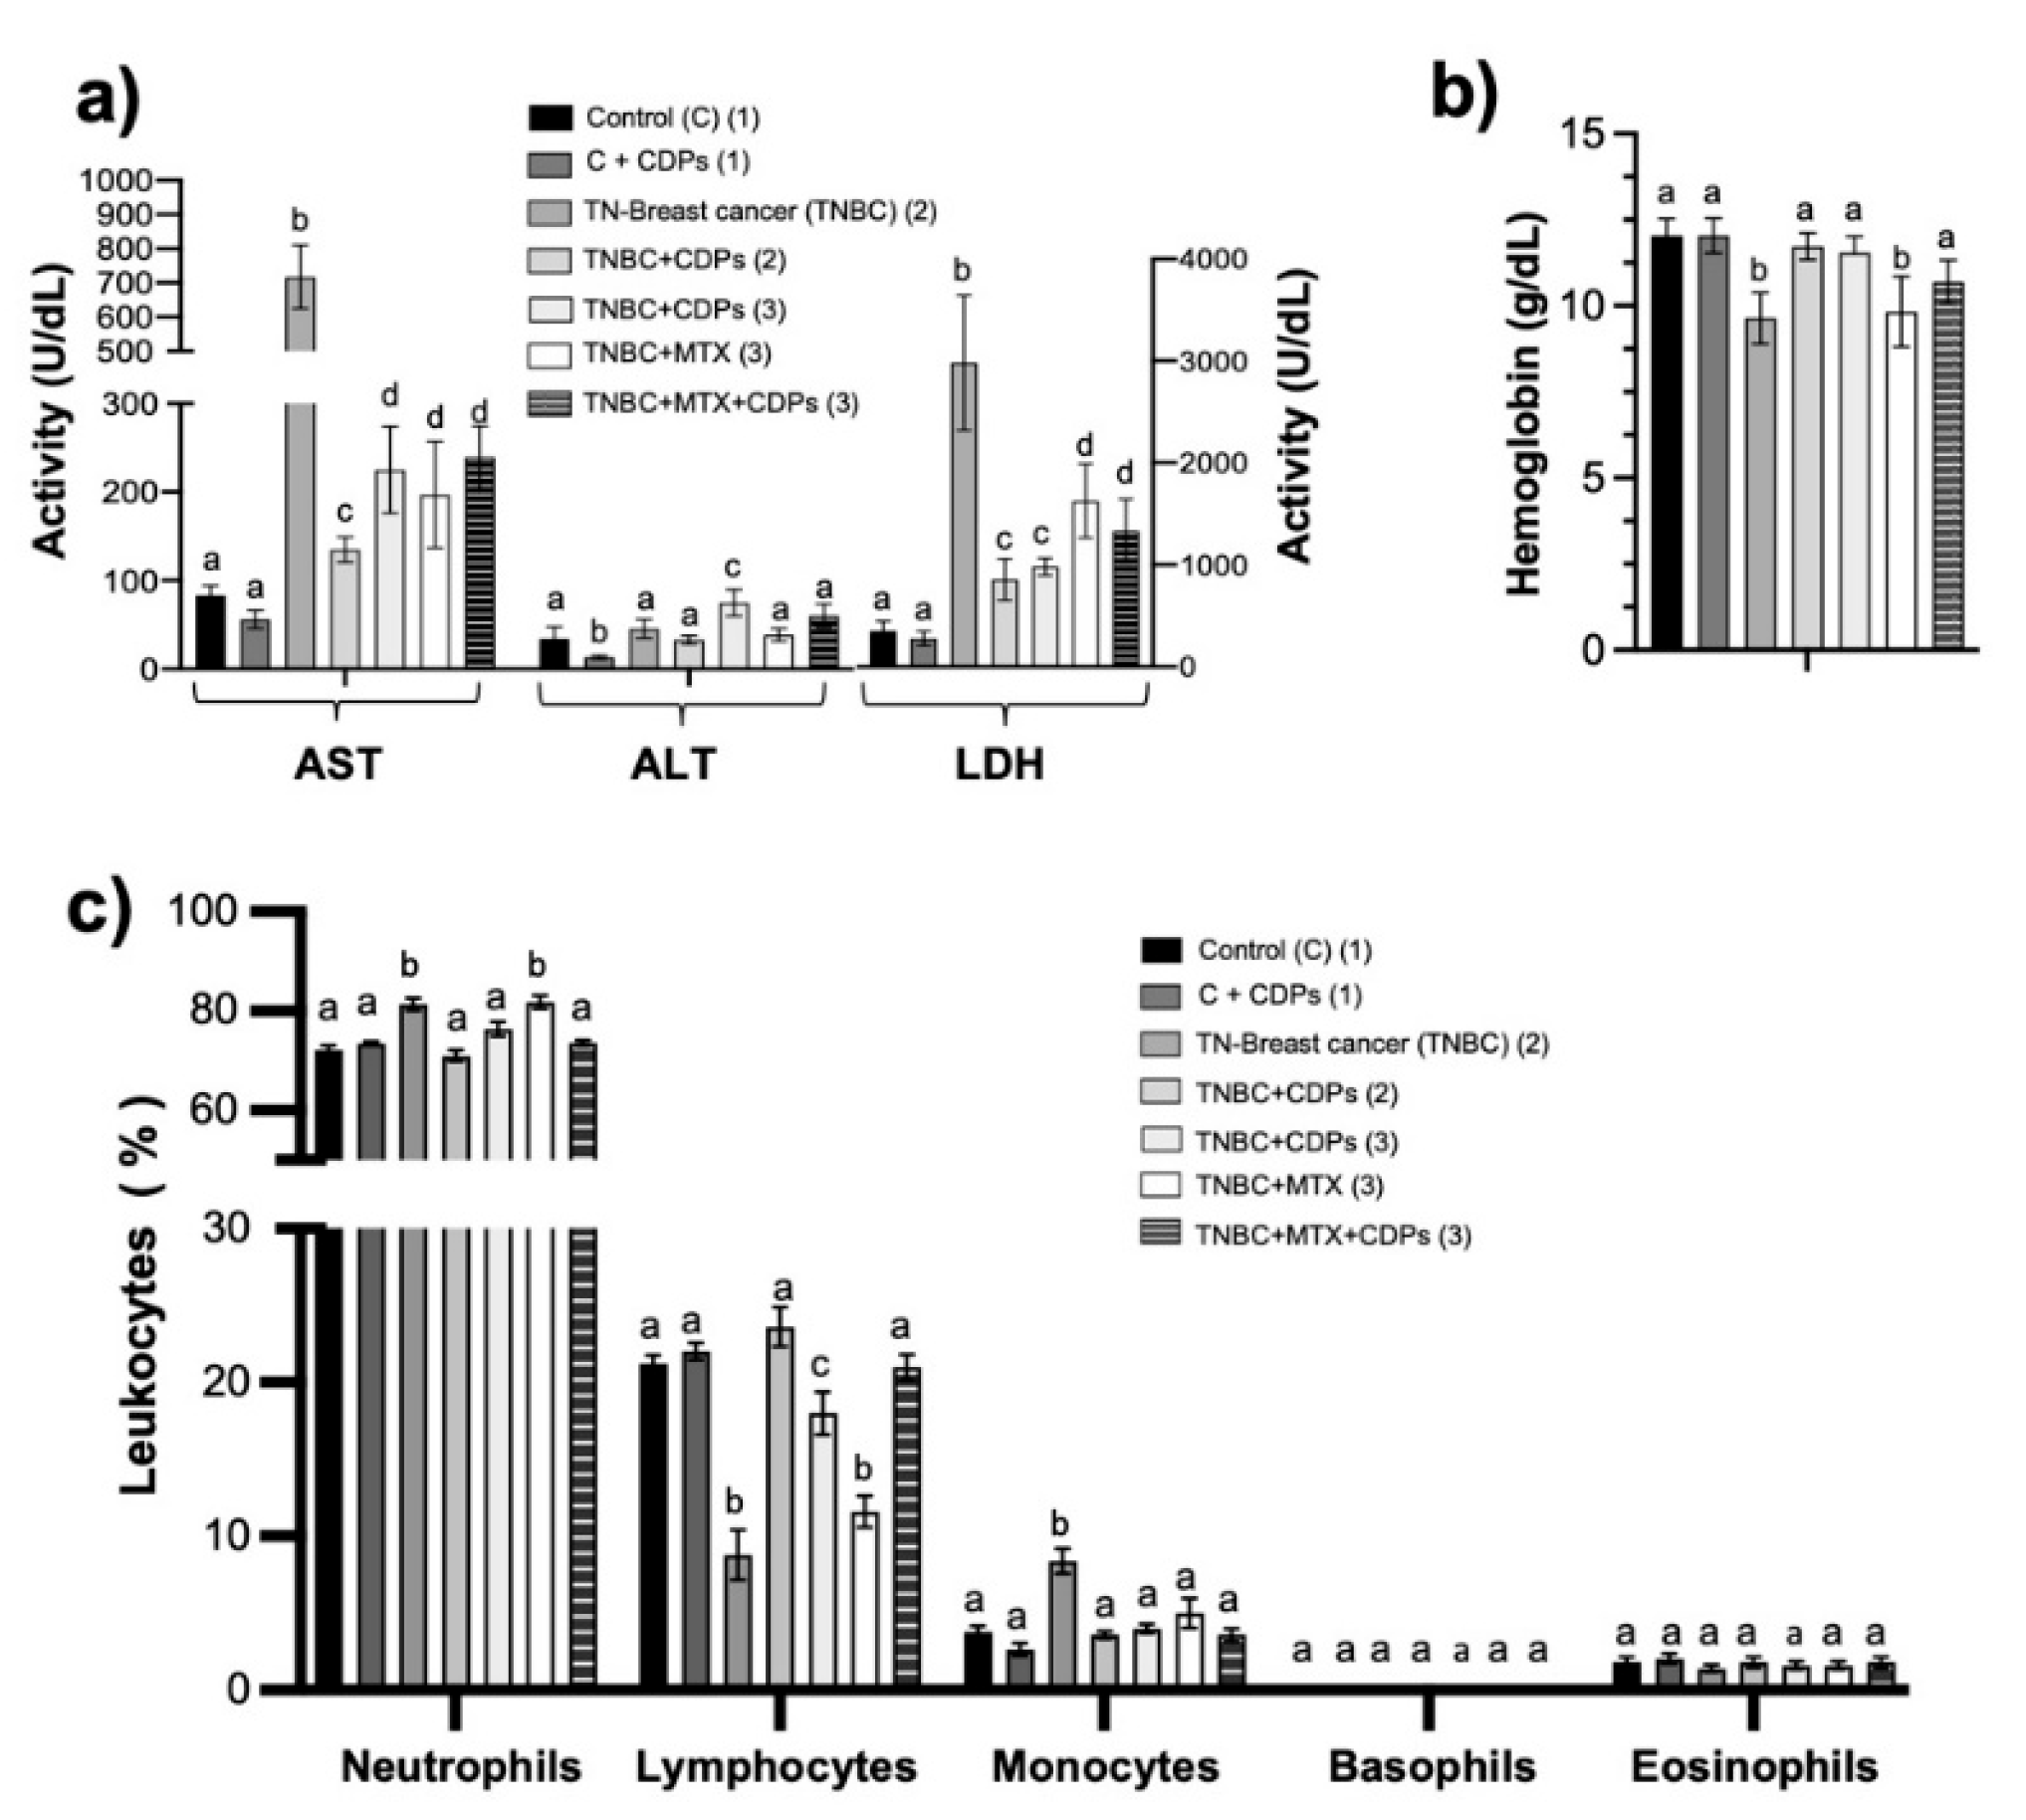
Figure 6.
Histopathological features of tumors in an MDA-MB-231 xenograft mouse model of triple-negative breast cancer treated with bacterial CDPs. Female BALB/c nu/nu mice (8 weeks old) were subjected to antitumor treatments and analyzed at experimental endpoints corresponding to 35 or 70 days (n=5 per group). Tumor sections were stained with hematoxylin and eosin (H&E) and examined by light microscopy. Representative images of tissues from the animal groups are shown. Regions of tumor necrosis and inflammatory cell infiltration are indicated by red arrows.
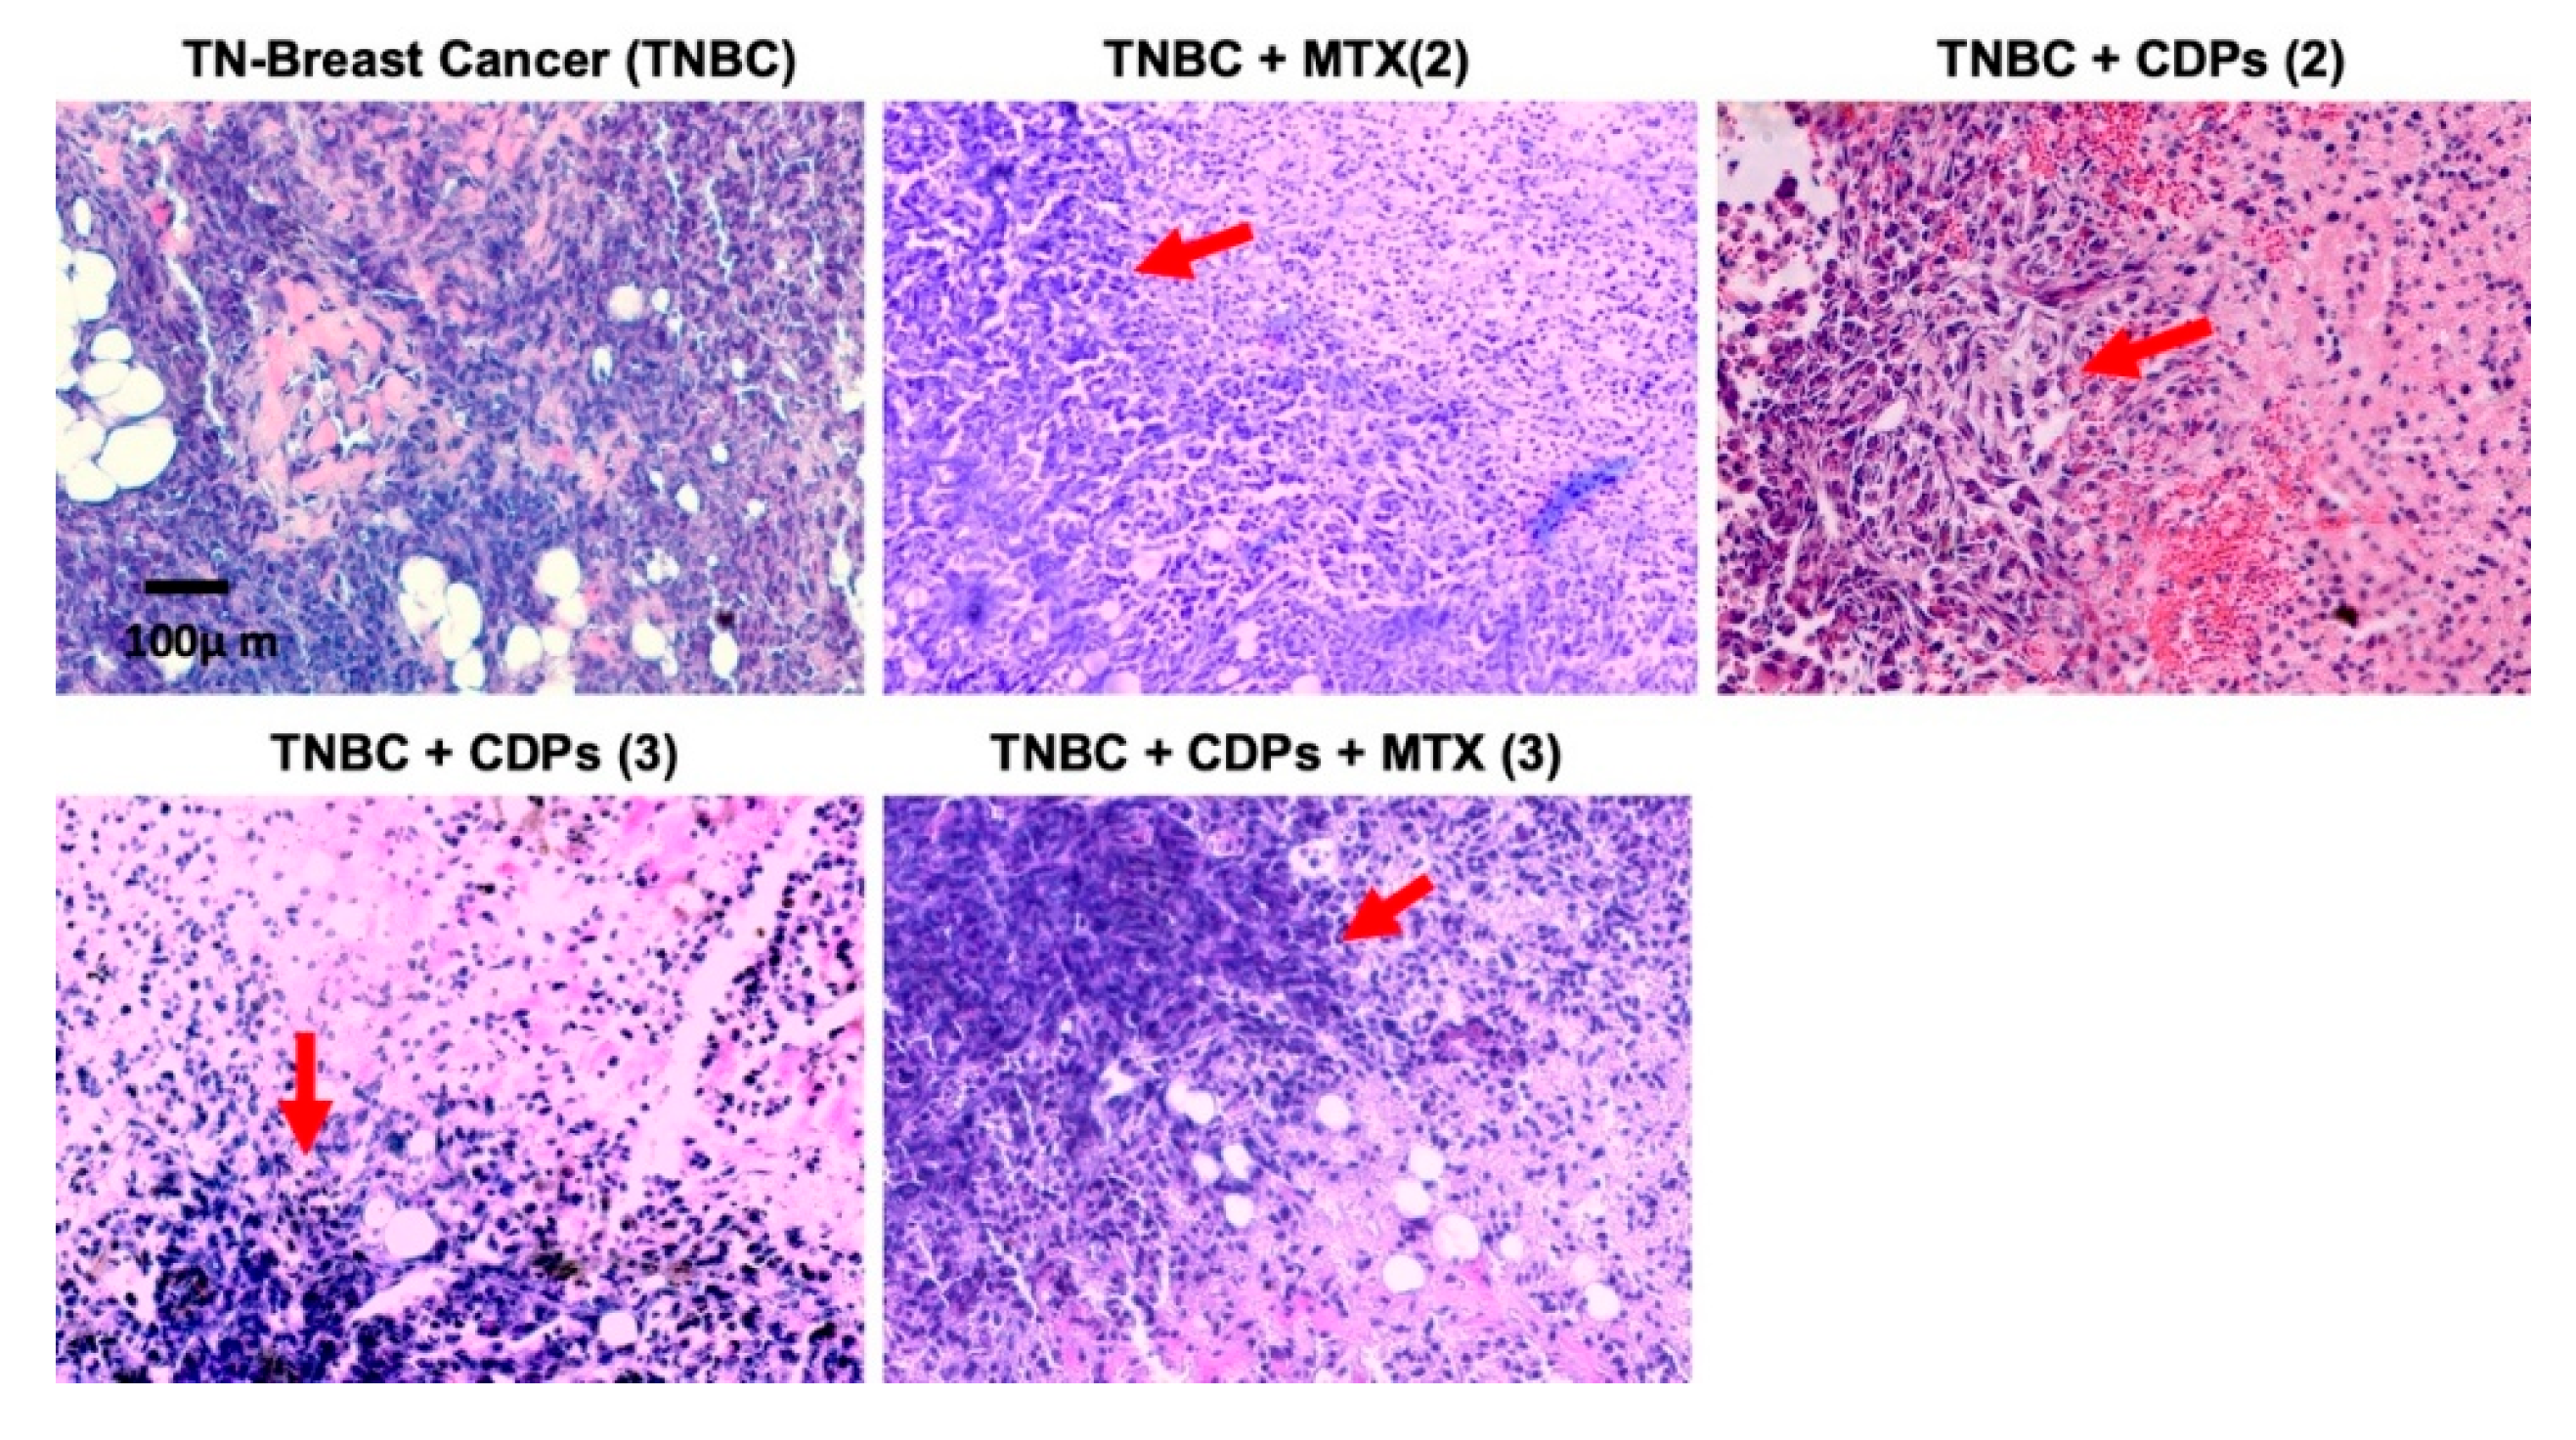
Figure 7.
Effects of bacterial CDPs on signaling proteins in tumors grafted with MDA-MB-231 triple-negative breast cancer cells in immunosuppressed mice. Protein extracts from the tumors excised from the mouse groups (administered with CDPs, MTX, and co-administered CDPs+MTX) were subjected to immunodetection. Group nomenclature is consistent with that described in Figure 4. Representative immunoblots show total and phosphorylated forms of Akt, Gab1, and FOXO1. Densitometric analyses of the immunodetection results are presented below. The bars represent the means ± SE; n = 3 per group. Statistical analysis was performed using one-way ANOVA followed by Tukey's post hoc test; significant differences are indicated by different lowercase letters (p < 0.05).
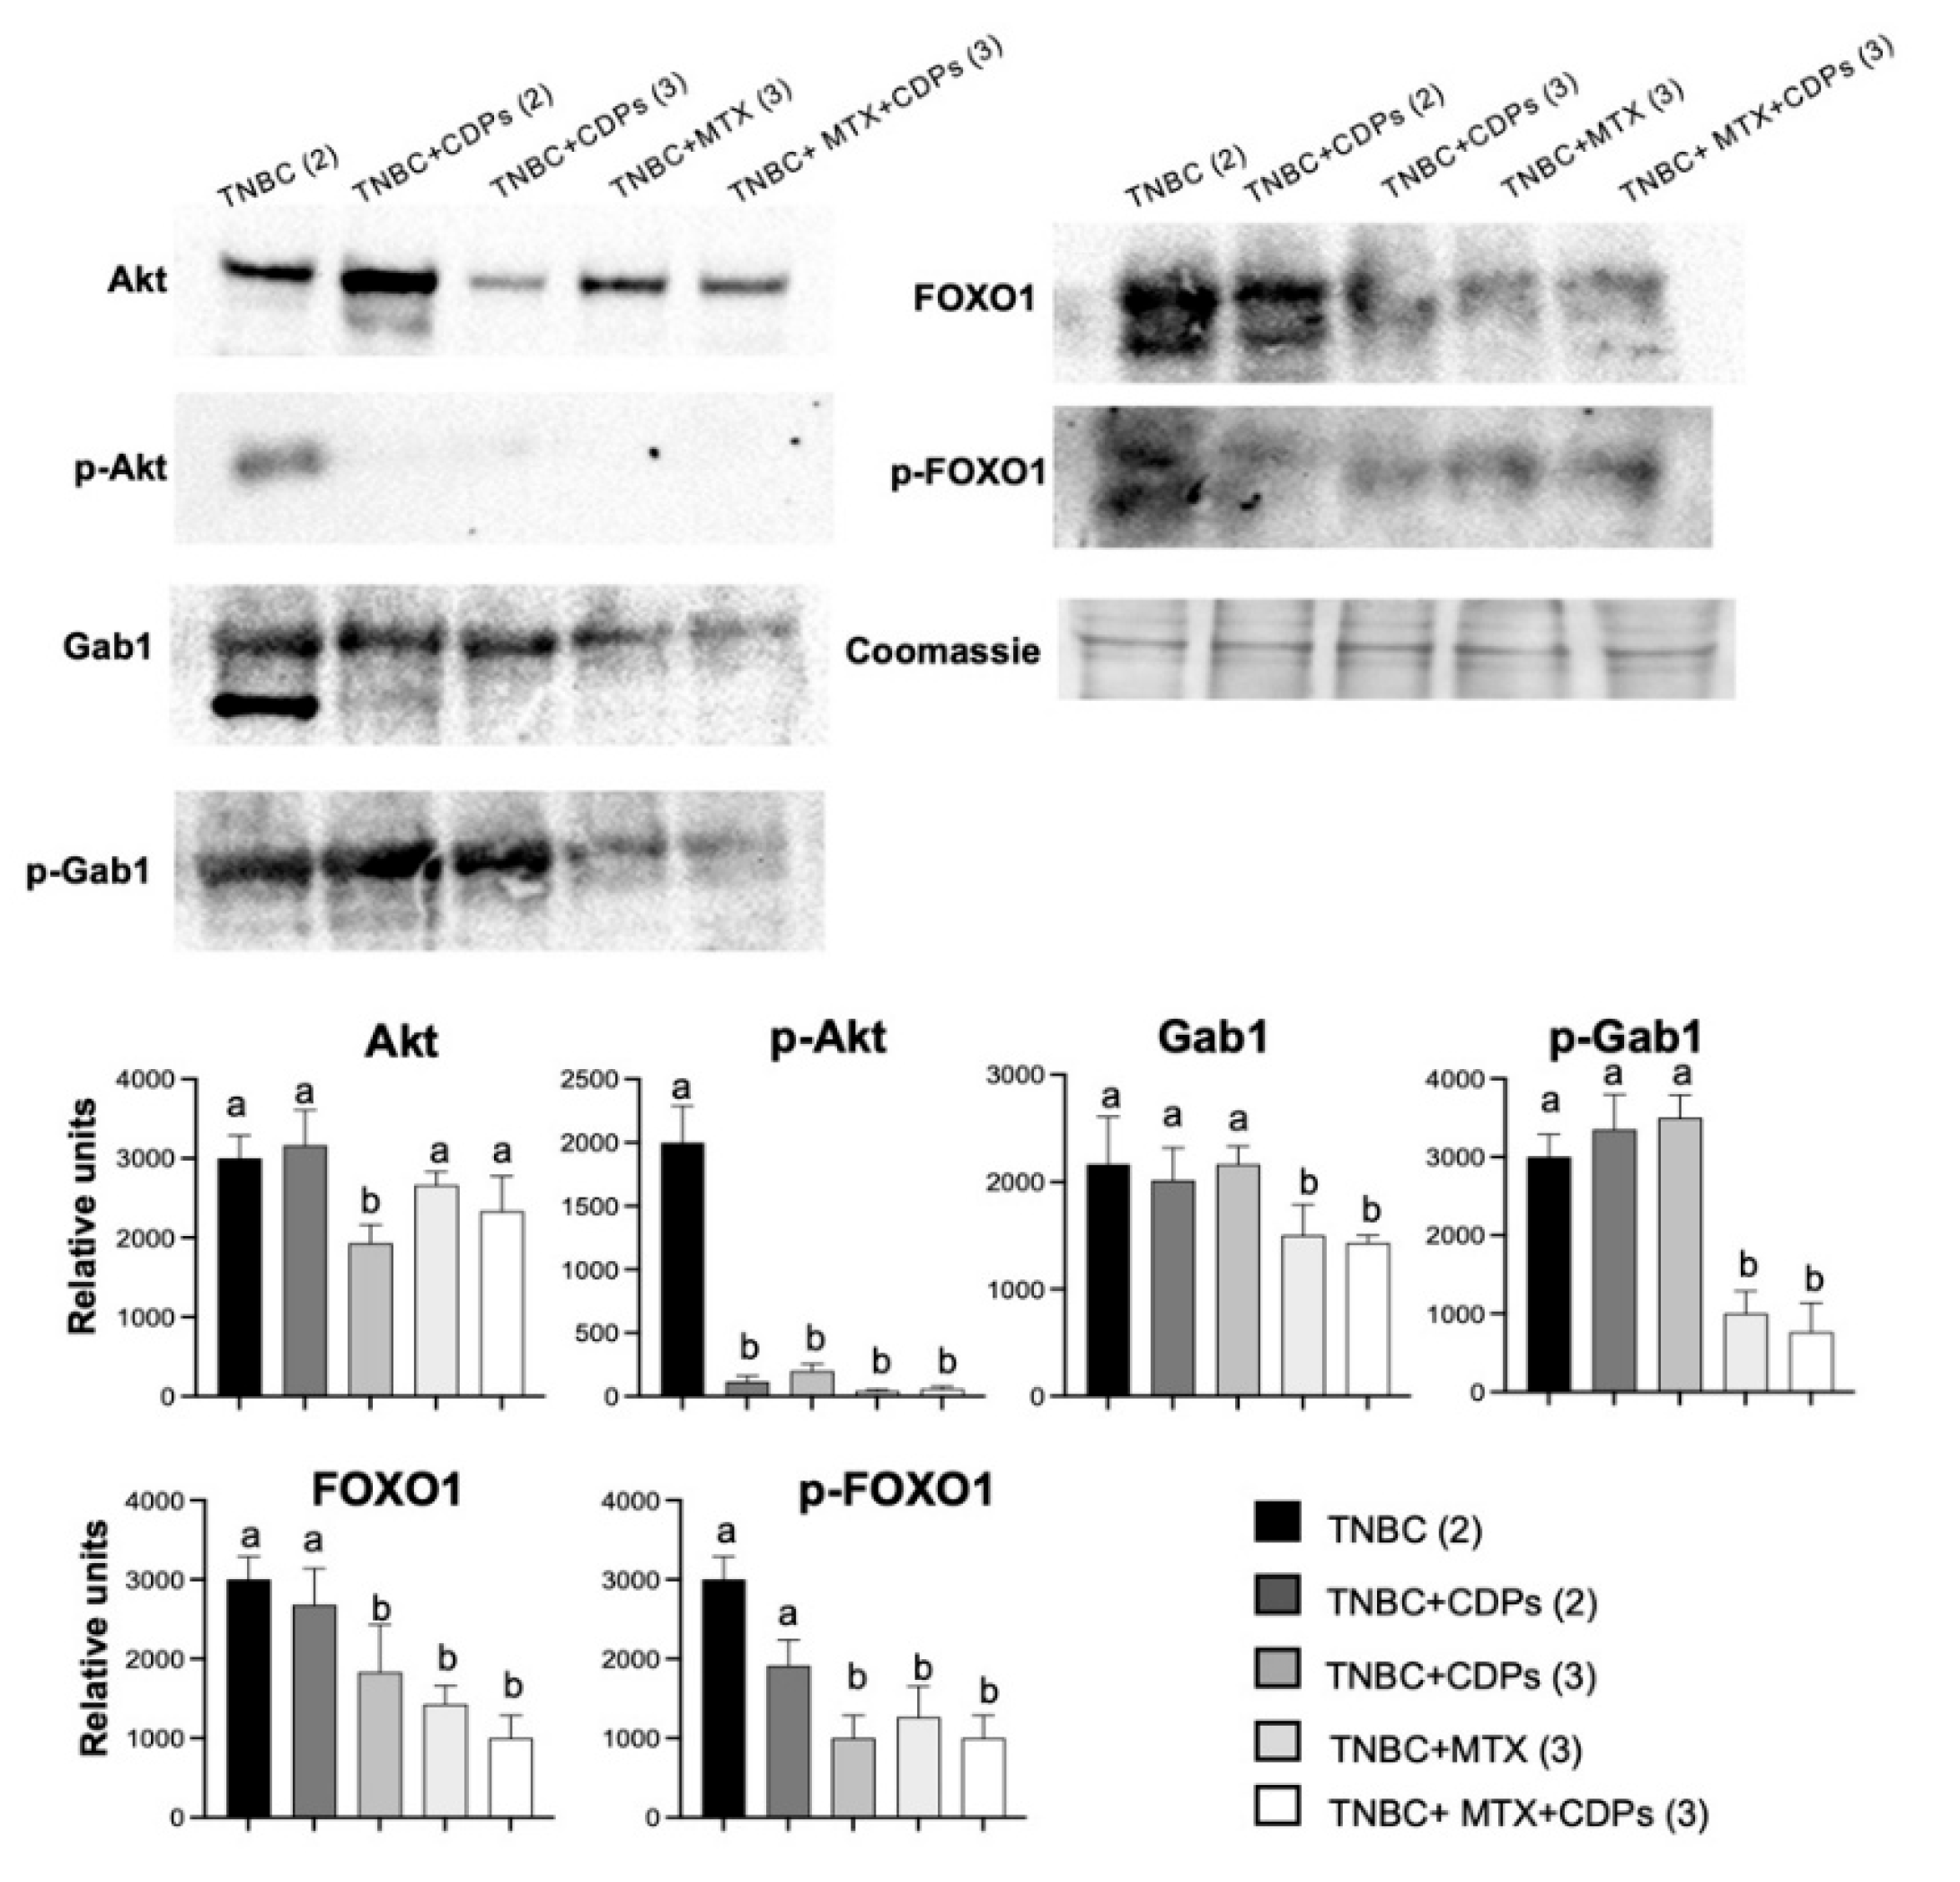
Figure 8.
Histological features of the liver, lungs, and spleen of xenografted triple-negative breast cancer MDA-MB-231 cells in immunosuppressed mice treated with bacterial CDPs. Female BALB/c nu/nu mice (8 weeks old) were subjected to an anti-tumor study and analyzed at experimental endpoints of 35 or 70 days (n = 5 per group). Organ tissue sections were stained with hematoxylin and eosin (H&E) and examined by light microscopy. Representative images of tissues dissected from the animal groups are shown. The blood conductors (red arrows), alveolar structures (yellow arrows), and splenic cellular structures (dashed circles) are indicated in the histology images.
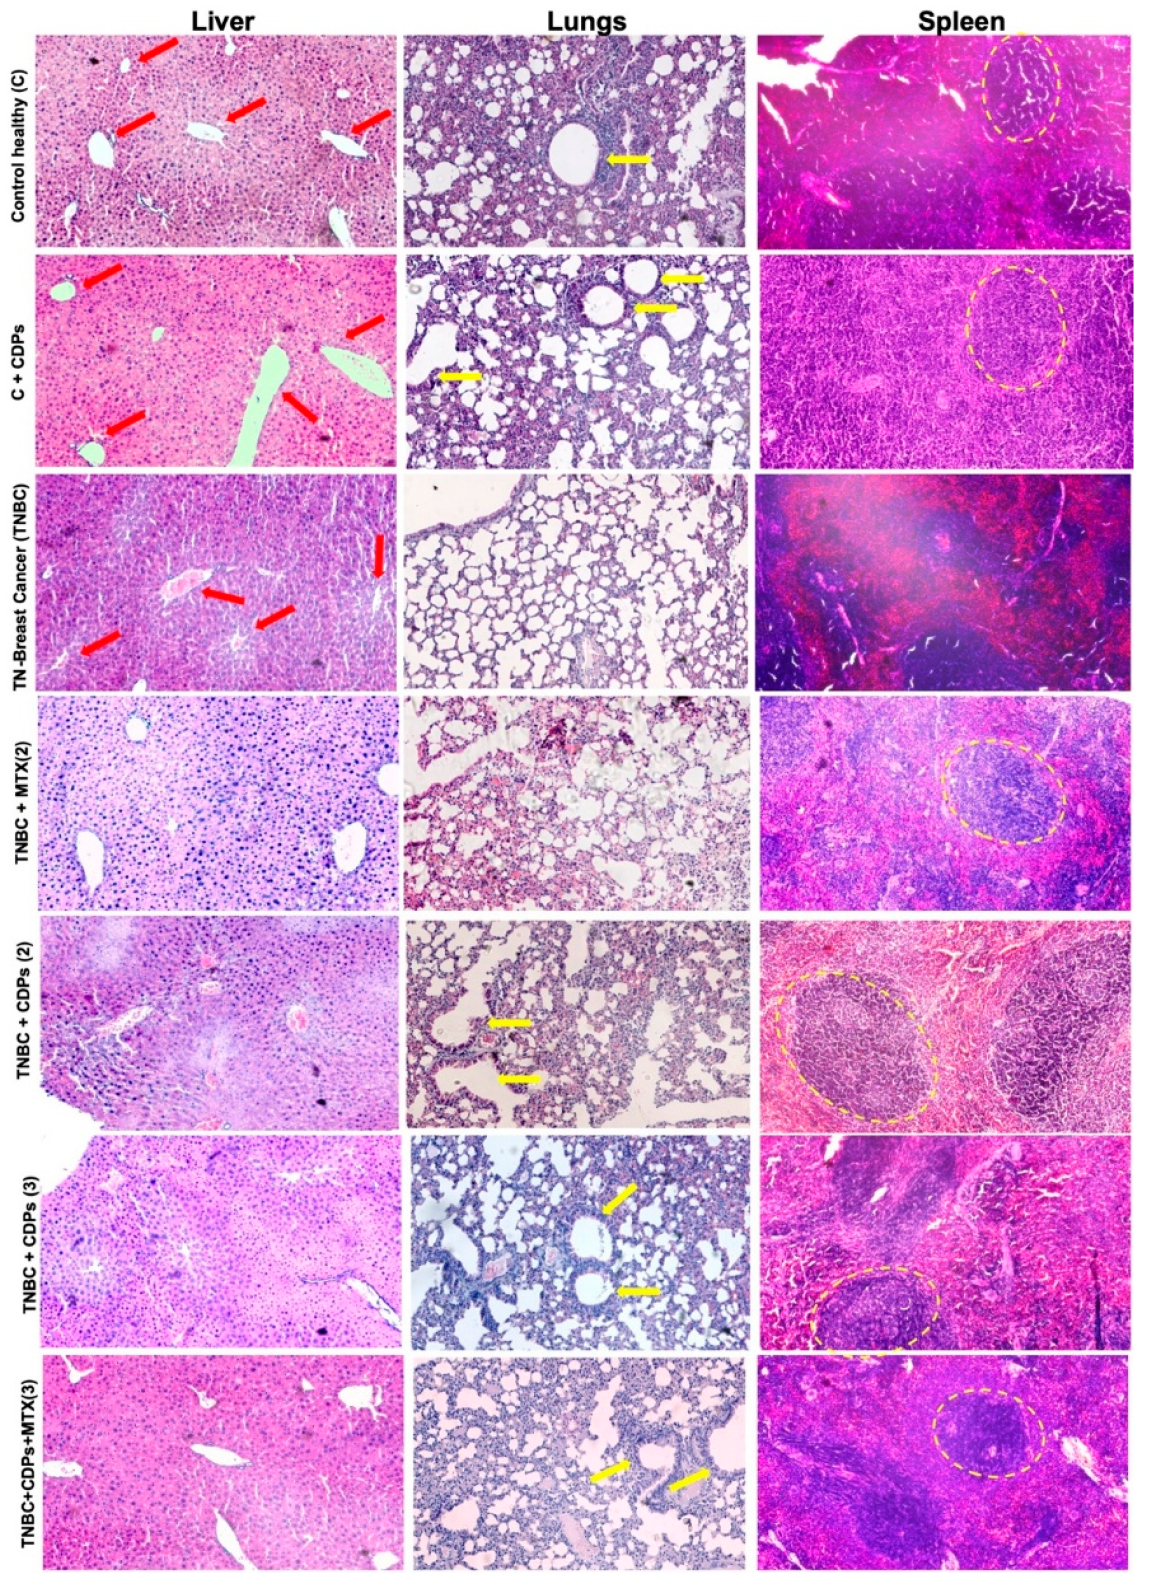
Figure 9.
Hepatic gene expression analysis in an MDA-MB-231 xenograft mouse model of triple-negative breast cancer treated with bacterial CDPs. a) Relative expression levels of PTEN, BRCA1, GADD45A, PD-L1, SNAIL, ZEB1, CXCL12, and CDKN1A (p21) were determined in liver tissue by RT-qPCR. Gene expression was normalized to the housekeeping gene ACTB (β-actin), and relative expression levels were calculated using the 2⁻ΔΔCt method. Experimental groups are defined as described in Figure 4. The bars indicate the means ± SE; n = 3 per group. Statistical analysis was performed using one-way ANOVA followed by Tukey's post hoc test; SE values are represented by bars, and significant differences (p<0.05) are indicated with different lowercase letters for each gene.
Disclaimer/Publisher’s Note: The statements, opinions and data contained in all publications are solely those of the individual author(s) and contributor(s) and not of MDPI and/or the editor(s). MDPI and/or the editor(s) disclaim responsibility for any injury to people or property resulting from any ideas, methods, instructions or products referred to in the content. |
© 2026 by the authors. Licensee MDPI, Basel, Switzerland. This article is an open access article distributed under the terms and conditions of the Creative Commons Attribution (CC BY) license (http://creativecommons.org/licenses/by/4.0/).
Copyright: This open access article is published under a Creative Commons CC BY 4.0 license, which permit the free download, distribution, and reuse, provided that the author and preprint are cited in any reuse.


