
Submitted:
11 March 2025
Posted:
12 March 2025
You are already at the latest version
Abstract
In this work, we propose a multi-modal Speaker Change Detection (SCD) approach with focal loss that integrates both audio and text features to enhance detection performance.
%
The proposed approach utilizes pre-trained large-scale models for feature extraction and incorporates a self-attention mechanism to optimize the useful features related to speaker change.
%
The extracted features are fused and processed through a fully connected classification network, with layer normalization and dropout for stability and generalization.
%
To address class imbalance, we apply focal loss, which reduces errors for the difficult samples, leading to better balanced performance.
Extensive experiments on a multi-talker meeting dataset demonstrate that the proposed multi-modal approach consistently outperforms single-modal models, proving the complementary nature of audio and text for SCD.
%
Fine-tuning pre-trained models (Wav2Vec2 and Bert) for audio and text significantly boosts accuracy, achieving a 21\% improvement over frozen models.
%
The self-attention mechanism further improves performance by 2\%, highlighting its ability to capture speaker transition cues effectively.
%
Additionally, focal loss enhances model's performance, making it more robust to imbalanced data.
Keywords:
Speaker change detection
; Pre-trained model
; Multi-modal
1. Introduction
Speaker change detection (SCD) is an important task in audio processing, particularly for applications such as speech segmentation, speaker diarization, and automatic transcription. Accurate detection of speaker transitions is critical in multi-person conversations, especially in meeting scenarios, where challenges such as overlapping speech and background noise can make correct detection difficult.
Traditional SCD methods rely on audio features, including pitch, Mel Frequency Cepstral Coefficient (MFCC), and cepstral coefficients, with various approaches such as metric-based and neural network-based methods. However, these approaches often under-perform in complex acoustic environments, such as those with low signal-to-noise ratios or simultaneous speech. Other multi-modal approaches to SCD have been explored, but they face practical limitations. Their approaches rely on ground-truth transcripts, which are often impractical in real-world scenarios due to transcription errors and limited availability. Another issue is that binary cross entry loss (BCE loss) is used as main objective function, which make model fails to learn useful features from imbalanced data. Usually SCD dataset contains many negative samples (no change points) and less positive samples (change points), it has imbalanced features.
To address these challenges, we propose an end-to-end multi-modal SCD model with a self-attention layer, based on large pre-trained models, and enhance it with focal loss to mitigate the issue of imbalanced data. The model employs a pre-trained large audio model to extract acoustic features from raw audio and a large language model (LLM) to derive semantic and contextual information from transcripts generated by an automatic speech recognition (ASR) system. By leveraging both modalities in a practical, real-world setting, this approach enhances detection accuracy in challenging acoustic conditions while avoiding the reliance on manually annotated transcripts. Furthermore, this study investigates the impact of different configurations, including audio-only, text-only, and multi-modal setups, to evaluate their effectiveness in SCD. A comparison between BCE loss and different focal loss configurations is carried out. Additionally, we explore different fine-tuning strategies, examining the impact of updating the pre-trained models to optimize performance while balancing computational efficiency. The evaluation is conducted using the multi-talker meeting corpus [1], a widely recognized dataset in speech and audio processing research. Experimental results showed that the updating the pre-trained model’s parameters during the training outperform significantly than freezing them for all modalities. Compared to the text-only model, the audio-only model outperforms it in various settings, and the multi-modal configuration surpasses both. Self-attention layer introduced in the approach effectively improve the F1 score compared to the model without using it for various modalities. The proposed approach outperforms the baselines and also outperforms comparable results to the previous model enhanced with multi-modal.
The rest of the work is organized as follows: (i) Section 2 reviews related studies on SCD, including multi-modal approaches. (ii) Section 3 presents the approach, including task formalization and the proposed model. (iii) Section 4 provides details on the experiments, including model setup, data statistics, baselines, and a discussion of the results. (iv) Section 5 discusses the limitations of the approach and potential future directions. (v) Section 6 concludes the work with a summary of the key findings.
2. Related Work
Existing approaches to SCD problems can be categorized into two groups: i) unsupervised and ii) supervised approaches.
Most unsupervised approaches are considered metric-based methods that calculate the discrepancy between two consecutive frames or segments. A change point is detected if the distance between the two segments exceeds a predefined threshold, otherwise, it is considered that no change point exists. In this direction, one of the simplest metric-based approaches [2] is to use a distance function, such as Kullback-Leibler (KL) divergence [3], to measure the similarity between two consecutive segments modeled with Gaussian mixture models (GMMs). It is very sensitive to a predefined threshold, difficult to generalize to unseen audio data. Early methods to SCD are the combination of GMMs with Bayesian information criterion (BIC) [4,5,6]. Specifically, each segment will be modeled with separate GMMs (referred to as two speaker models), and two consecutive segments will be modeled with a GMM (refers as single speaker model). BIC is used to calculate a score that estimates how well these GMMs will predict the given segments. Generalized Likelihood Ratio (GLR) [7] can also be applied with GMMs. It measures the likelihood ratio between two distributions of these segments. Studies have shown that using neural network-based speaker embeddings [8,9] outperforms traditional audio features such as mel-frequency cepstral coefficients (MFCCs), pitch, and filter banks in SCD. In the work [10], the authors applied a neural network to calculate speaker embeddings at the frame level such as d-vector, and used it with metric-based segmentation to detect speaker changes. It achieved a fast and effective SCD model using deep speaker vectors.
In supervised direction, many machine learning methods have been applied to SCD, such as conditional random field (CRF)
3.2. Multi-Modal SCD Model
Speaker change detection in audio streams can be addressed using a multi-modal approach that integrates audio and text data. This model employs two pre-trained large models: i) large audio models to extract acoustic features from raw audio and ii) large language model to derive semantic information from the transcript. The combination of these modalities enhances the accuracy of detecting speaker transitions.
Audio Feature Extraction.
To extract robust audio representations, we leverage a pre-trained model that transforms raw waveforms into sequences of latent acoustic representations. This model encodes segment-level hidden states that capture meaningful speech features. To refine these representations, we apply self-attention to enhance contextual dependencies, followed by a pooling operation to obtain fixed-size feature vectors.
The raw input waveform X is processed into frame-wise hidden states Z generated by a pre-trained model, where each frame contains a high-dimensional vector. These representations are then refined through a self-attention mechanism, producing updated embeddings. To obtain a compact representation, temporal mean pooling is applied, resulting in a fixed-size vector .
Text Feature Extraction.
The audio is segmented into 1-second intervals, and an automatic speech recognition (ASR) system is applied to generate transcripts for each segment, rather than relying on ground truth transcriptions which are impractical for real-world applications. The text processing leverages a pre-trained large language model, Bert [18], its contextual embeddings. The transcript is tokenized and input into Bert, producing embeddings for each token. The embedding of the [CLS] token is selected to represent the sentence’s semantic content:
where encapsulates the overall meaning of the text.
Feature Fusion and Classification.
To integrate audio and text modalities, a simple concatenation is performed between the two. The resulting audio and text embeddings are then concatenated:
where indicates concatenation.
The final audio representation serves as input to a fully connected neural network for classification. The classifier consists of three linear layers with decreasing dimensions. Each linear transformation is followed by layer normalization to stabilize training and improve generalization. Non-linearity is introduced using the ReLU activation function, and dropout regularization is applied after each hidden layer to mitigate overfitting. The final output is passed through a sigmoid activation function to produce a probability score for the classification task.
To optimize the model, we employ focal loss, which is designed to address class imbalance by down-weighting well-classified examples and focusing more on hard-to-classify instances. Given the predicted probability and the ground-truth label, the focal loss is computed as:
where is the binary cross-entropy loss, represents the predicted probability for the true class, is a weighting factor that balances the contribution of positive and negative samples, and controls the down-weighting of easy examples.
By combining structured feature extraction with a robust classification strategy, the model effectively learns meaningful audio representations while addressing class imbalance in the dataset.
4. Experiments
4.1. Model Setup
The model utilizes pre-trained Wav2Vec2 and Bert, specifically "wav2vec2-base" and "bert-base-cased" variants. Training employs the AdamW optimizer with a learning rate scheduler, ensuring stable updates and effective convergence. The base model components (Wav2Vec2 and Bert) use a learning rate of , while the classifier has a higher learning rate of . A weight decay of is applied for regularization. To enhance stability, a warmup ratio of is used, meaning the learning rate gradually increases during the first 10% of total training steps before following a linear decay. Training is conducted for 10 epochs, with the total number of training steps computed as the product of the number of epochs and the length of the training dataloader. Additionally, a random seed is set to ensure reproducibility across experiments.
The classifier is designed to process the features, with a hidden size of 768. The head of self-attention is set to 8. The classifier consists of three fully connected layers with 512 and 256 hidden units, each followed by layer normalization, ReLU activation, and dropout (0.4), leading to a final output layer for classification.
Each of the three configurations: multi-modal, text-only, and audio-only supports two training modes: i) a freeze mode (F) and ii) a non-freeze mode (NF). In freeze mode, all Wav2Vec2 and Bert parameters are fixed, and only the classification layers are trained. In non-freeze mode, the configurations differ as follows: the both base models with its classification layers are trained. For focal loss of the model, is set to 0.31, and is set to 2.0. For convenience in naming, we use eMD to refer to the proposed approach. Using the different settings described above, we define two versions of eMD: i) A multi-modal model without self-attention and cross-attention layers, which consists only of the three fully connected layers mentioned earlier for classification. This model is denoted as eMD. ii) A model with self-attention layers, which enhances feature interaction. This version is denoted as eMD
4.2. Baselines
To check how well the proposed models work, we compare them with these baselines:
i) Neural Network (NN) Baseline: This model takes a flattened vector of 13-dimensional MFCC features as input. It has fully connected layers with non-linear activation functions. Then, a sigmoid output layer predicts the chance of a speaker change. This baseline captures feature patterns in each segment but does not model time relations between segments.
ii) Bidirectional Long Short-Term Memory (BiLSTM): This model takes sequences of 13-dimensional MFCC feature vectors. Its bidirectional structure helps capture both past and future time relations. BiLSTM outputs are pooled over time to form a fixed-size representation. Then, a fully connected layer with a sigmoid activation is used for classification.
iii) Fine-Tuned Approach with Multilayer Perceptron (MLP): This model is a strong baseline similar to this work. It uses only audio and has a single linear classification layer. It refers as to Wav2Vec2-MLP.
4.3. Dataset Statistics
Experiments were conducted using the AMI meeting corpus [1], a well-established audio dataset commonly utilized in speech and audio processing research. The AMI corpus provides a diverse collection of meeting recordings with noisy, interrupt etc, allowing for the evaluation of the model under a variety of conditions and scenarios. The dataset used for training and evaluating the multi-modal speaker change detection model is detailed in two tables.
Table 1 presents the overall statistics of the training dataset, which includes 137 meetings with an average of 790.99 change points per meeting. The dataset exhibits an average of 306.61 overlap points, indicating instances of simultaneous speech, and an average of 3.99 speakers per meeting. The average length of each meeting is 34.11 minutes, with a total duration of 4673.69 minutes. The class distribution shows that 30.85% of the data are positive instances (indicating speaker changes), while 69.15% are negative instances (no speaker changes).
Table 2 provides statistics for the test set, covering eight meetings identified by specific IDs (e.g., EN2002a, EN2002b, etc.). It reports the total number of change points, overlap points, and speakers per meeting, as well as the audio length in minutes. For example, the EN2002a meeting has 1366 change points, 678 overlaps, 4 speakers, and a duration of 43.90 minutes. The test set averages 821.31 change points, 328.19 overlaps, 3.94 speakers, and 33.38 minutes per meeting. Additionally, the class distribution for each meeting is provided, with percentages for positive (P) and negative (N) classes. On average, 31.40% of the test set instances are positive, and 68.60% are negative, reflecting a similar imbalance to the training set. These statistics highlight the complexity and variability of the dataset, particularly due to overlapping speech and the distribution of speaker changes.
4.4. Evaluation Metrics
To assess the performance of the baseline and proposed methods, several metrics are employed. The false alarm rate (FAR) measures the proportion of incorrect speaker change detections, calculated as the ratio of false positives to all non-change points:
The missed detection rate (MDR) evaluates the frequency of undetected speaker changes, determined as the ratio of false negatives to all true change points:
The Hit rate measures how well the model correctly identifies actual speaker change points.
Additionally, precision is used to indicate the accuracy of detected speaker changes, recall assesses the ability to identify all true speaker changes, and the F1 score provides a balanced measure of precision and recall. These metrics collectively offer a comprehensive evaluation of the model’s effectiveness in speaker change detection. It should be noted that the average results (Precision, Recall, F1-score, FAR and MDR) reported below are calculated using the Macro method.
4.5. Results
4.5.1. Results of eMD Model
Table 3 and Table 4 detail the performance of eMD model for SCD using freeze and non-freeze models across three modalities: Text, Audio, and Multi-modal.
The Multi-modal approach consistently outperformed single modalitie configurations in both Freeze and Non-Freeze settings. For instance, in the Freeze models, the Multi-modal modality achieved a Hit Rate of 79.88% in meeting EN2002a (45.51% P, 54.49% N), compared to 72.28% for Text and 78.34% for Audio. In Non-Freeze models, the Multi-modal Hit Rate reached 82.98% in EN2002d (40.20% P, 59.80% N), surpassing Text (70.43%) and Audio (82.26%) modalities. Non-Freeze models exhibited marked improvements over Freeze models, particularly in Audio and Multi-modal settings. The FAR in Audio modality decreased from a range of 19.08%–40.48% in Freeze models to 8.32%–25.99% in Non-Freeze models. Similarly, the Multi-modal MDR reduced from 20.12%–30.53% (Freeze) to 17.02%–33.33% (Non-Freeze), indicating enhanced detection accuracy.
The class imbalance significantly impacted the Text modality in Freeze models, resulting in elevated MDR and reduced Hit Rates. For example, in meeting ES2004b (25.46% P, 74.54% N), the Text modality recorded an MDR of 43.72% and a Hit Rate of 56.28%, reflecting a bias toward the majority negative class. This imbalance compromised the detection of speaker changes. Non-Freeze models, particularly Multi-modal, effectively addressed these challenges. In ES2004b, the Multi-modal Non-Freeze model improved the Hit Rate to 72.53% and reduced the MDR to 27.47%, demonstrating the advantage of adaptive learning and multi-modal integration in handling imbalanced distributions.
Figure 2 compares the performance of Freeze (F) and Non-Freeze (NF) models across three setups of eMD model: text-only, audio-only, and multi-modal. In part Figure 2, the stacked bar chart shows the average FAR and MDR. The hatched bars represent FAR, while the solid bars represent MDR. The light blue bars correspond to Freeze mode, and the red bars correspond to Non-Freeze mode. Generally, the multi-modal configuration shows a lower FAR and MDR compared to the text-only and audio-only setups. All Non-Freeze models outperform the Freeze models in all three settings. In the audio-only mode, it can be seen that the FAR decreases significantly from 31.49% to 25.98%, while the MDR drops from 25.24% to 16.93%.
Part Figure 2 shows the averaged results of F1 scores. The text-only configuration achieves an F1-score of 54.22% with Freeze and 55.26% with Non-Freeze. The audio-only configuration records an F1-score of 60.51% under Freeze and 62.58% under Non-Freeze. The multi-modal configuration performs best, with an F1-score of 70.54% for Freeze and 70.91% for Non-Freeze. The results demonstrates that the multi-modal approach outperforms both text-only and audio-only configurations, with a slight improvement in Non-Freeze mode.
4.5.2. Results of eMD Model
Table 5 and Table 6 shows the results of eMD model. It applies a self-attention layer only to the multimodal and audio-only configuration, as previous experiments showed that adding self-attention to the text-only models did not improve performance. In the Freeze (F) mode (Table 5), where feature extraction layers remain unchanged, the audio-only setup outperforms the text-only setup. This suggests that audio inherently provides more informative cues for speaker change detection than text. The multi-modal setup performs best, leveraging both modalities to achieve the highest Hit Rates across all meetings.
In the Non-Freeze (NF) mode Table 6, where feature extraction layers are fine-tuned, overall performance improves. The text-only model sees a reduction in FAR from 87-92% to 77-87%, and MDR drops to 9.07% in the best case. The audio-only model continues to outperform text-only, with FAR decreasing to 16.80% (IS1009c) and 17.23% (IS1009b), and MDR remaining below 14%. The multi-modal approach remains the most effective, maintaining FAR around 20% and MDR between 9–16%. The multi-modal setup achieves the most significant improvements across the most imbalanced meetings (TS3003c, IS1009c, ES2004b). Fine-tuning substantially reduces FAR, dropping from 57.93% to 21.06% in TS3003c, from 76.07% to 14.04% in IS1009c, and from 78.26% to 21.97% in ES2004b. These results suggests that utilizing both text and audio in a fine-tuned model can help reduce the impact of class imbalance, making multimodal processing a promising approach for speaker change detection in imbalanced scenarios.
The precision, recall and F1 score for eMD and eMD model reported in the Appendix A.
Figure 3 compares the performance of Freeze (F) and Non-Freeze (NF) models across three setups of eMD model: text-only, audio-only, and multi-modal. In part Figure 3, the stacked bar chart shows the average FAR and MDR. The hatched bars represent FAR, while the solid bars represent MDR. The light blue bars correspond to Freeze mode, and the red bars correspond to Non-Freeze mode. It is clearly shown that eMD using attention layer the fine-tuned model (NF) reduce both FAR and MDR significantly compared to Freeze model. For example, the multimodal with Freeze mode achieves high FAR of 69.81% and a low MDR of 10.54, however, fine-tuned (the red bar) trade-off between these two rates and reduce false alarm from 69.81% to 21.78%. Part Figure 3 reports the F1-score for these models, and it shows that the highest F1 score 73.39% was obtained by multi-modal with NF.
4.5.3. Optimization Parameters for Focal Loss
In order to test how focal loss [19] influence the model’s performance in SCD imbalanced situation, we predefine various value of parameters of focal loss, such as and . The former is weighting factor that balances class importance in imbalanced datasets. A lower (< 0.5) gives more weight to the majority class (non-change points), while a higher (> 0.5) gives more weight to the minority class (speaker change points). is a focusing parameter that reduces the weight of easy samples, making the model focus more on hard-to-classify examples. A higher increases this effect, but too high a value can cause training instability.
We selected a highly imbalanced meeting from the training set to analyze different parameter combinations and reduce training time. Figure 4 presents the curves for different combinations of values of and . Traditional Binary Cross-Entropy (BCE) loss is also included for comparison and is denoted as BCEloss. Figure 4 and Figure 4 illustrate how the FAR and MDR change with different values of and . It can be observed that and , when using BCEloss, achieve comparably low FAR scores. Among them, when , the loss function becomes weighted BCE loss, which performs slightly better than the others. From Figure 4, it can be seen that with BCEloss results in a higher MDR compared to other settings. Figure 4 displays F1 scores across different settings, clearly showing that focal Loss outperforms BCEloss. When (orange curve) and , the model achieves the highest F1 score. These values are chosen for focal Loss, and the final model is trained using this configuration, denoted as eMD.
4.5.4. Comparison with Baselines
The performance of eMD and eMD models is evaluated in Table 7, achieving improvements of up to 2.73% in F1-Score over the baseline Wav2vec-MLP. The comparison includes baseline models: Neural Network (NN), Long Short-Term Memory (LSTM), and Wav2vec-MLP. The NN struggles with a high missed detection rate, while LSTM shows improvement but remains weak in detecting speaker changes. Wav2vec-MLP provides a stronger baseline with higher precision, though it still misses some detections.
eMD model, tested in audio-only and multi-modal modes, improves recall compared to Wav2vec-MLP, but its false alarm rate increases. The multi-modal setup of eMD offers a slight recall boost over the audio-only version, with similar false alarm rates, suggesting limited additional benefit. eMD model, incorporating attention, further enhances recall in both audio-only and multi-modal modes, reducing missed detections despite a higher false alarm rate. The multi-modal eMD configuration performs best, achieving the lowest missed detection rate (14.15%) and highest recall (85.85%) among all models, with an F1-Score of 73.39%, surpassing Wav2vec-MLP’s overall score.
Compared to baselines, eMD multi-modal approach stands out, leveraging attention and multi-modal data to outperform Wav2vec-MLP, with notable improvements in recall (its is similar to hit rate, an important metric for SCD, because it measures how well the model captures actual speaker change points) and reduced missed detections.
4.5.5. Comparison with Previous Work
Table 8 compares the proposed approach with previous multi-modal methods and a pitch-based approach. However, a direct comparison is not possible due to differences in experimental settings. For instance, Zhao et al. [17] use a custom definition of precision and recall, making the task easier. Other studies apply forgiveness collars when identifying change points. Despite these differences, Table 8 shows that the proposed approach performs competitively and achieves better results than previous multi-modal methods.
5. Limitations
Despite the effectiveness of our approach, there are several limitations that could impact performance. First, we rely on a hard alignment between text and audio, which may introduce errors when transcription and audio segmentation are not perfectly synchronized. This can lead to misaligned speaker change points, affecting downstream processing. Second, the pre-trained Bert model used in our approach does not inherently contain speaker information. As a result, the textual representation lacks explicit speaker cues, which could otherwise improve the detection of speaker transitions.
A more effective approach would involve a joint model that simultaneously performs automatic speech recognition and speaker change detection, reducing alignment errors. Alternatively, a stacked model architecture, where ASR is followed by SCD in a sequential manner, could improve robustness by leveraging intermediate speech representations. These models can be integrated with audio pre-trained models to further improve performance. Future research should investigate joint modeling of automatic speech recognition and speaker change detection to improve alignments between text and audios or use hidden embeddings from pre-trained ASR model to improve SCD performance.
6. Conclusions
In this work, we proposed a multi-modal Speaker Change Detection (SCD) approach that integrates audio and text information to improve detection. The proposed method leverages pre-trained large-scale models for feature extraction and incorporates a self-attention mechanism to refine contextual representations. The features are combined and passed through a fully connected classification network with layer normalization and dropout to make the model more stable. The model also uses focal loss to handle class imbalance of the data.
We tested the model on a speaker change detection task using audio-text pairs from a multi-talker meeting dataset. The experiments included comparing multi-modal and single-modal models, checking the effect of fine-tuning pre-trained models, and testing the impact of self-attention layers. The results show important findings. The multi-modal approach works better than single-modality models, which shows that audio and text together help detect speaker changes. Fine-tuning pre-trained models makes the model much better than freezing them. Updating the pre-trained model’s parameters during training gives a 21% improvement in the multi-modal setting. Adding a self-attention layer improves feature learning, which boosts performance by about 2% compared to a model without it. Despite these improvements, the approach has certain limitations. The reliance on hard alignment between ASR-generated text and audio segments, and the text information is used as symbolic first, then turn it to embeddings which lack speaker-specific information, reducing their effectiveness in capturing speaker transitions based solely on textual cues. To address these limitations, future research should explore jointly performing automatic speech recognition and speaker change detection to reduce alignment errors. Alternatively, a stacked ASR-to-SCD pipeline could leverage intermediate ASR representations for better speaker change detection.
Acknowledgments
The research was funded by the Committee of Science of the Ministry of Science and Higher Education of the Republic of Kazakhstan under grant number AP19676744.
Appendix A
Table A1 and Table A2 report the precision, recall, F1-score for eMD for different modalities. Table A3 and Table A4 report the precision, recall, F1-score for eMD for various modalities.

Table A1.
The results of eMD model for per-meeting Precision, Recall, and F1-Score (%) for SCD: Freeze (F) models.
Table A1.
The results of eMD model for per-meeting Precision, Recall, and F1-Score (%) for SCD: Freeze (F) models.
| Meeting ID | Text | Audio | Multi-modal | ||||||
|---|---|---|---|---|---|---|---|---|---|
| Prec | Rec | F1 | Prec | Rec | F1 | Prec | Rec | F1 | |
| EN2002a | 58.91 | 72.28 | 64.91 | 61.78 | 78.34 | 69.08 | 62.94 | 79.88 | 70.41 |
| EN2002b | 54.88 | 69.54 | 61.35 | 60.39 | 72.32 | 65.82 | 62.27 | 76.22 | 68.54 |
| EN2002c | 55.35 | 69.79 | 61.74 | 60.25 | 73.67 | 66.29 | 61.85 | 75.78 | 68.11 |
| EN2002d | 56.92 | 71.25 | 63.29 | 63.63 | 77.57 | 69.91 | 63.63 | 79.71 | 70.77 |
| ES2004a | 43.16 | 61.62 | 50.76 | 49.52 | 70.03 | 58.02 | 51.23 | 70.37 | 59.29 |
| ES2004b | 37.63 | 56.28 | 45.10 | 45.39 | 69.35 | 54.87 | 46.15 | 70.18 | 55.68 |
| ES2004c | 42.30 | 64.16 | 50.99 | 49.88 | 64.00 | 56.06 | 50.94 | 69.60 | 58.82 |
| ES2004d | 50.53 | 64.45 | 56.65 | 59.95 | 63.36 | 61.61 | 59.53 | 69.47 | 64.12 |
| IS1009a | 45.33 | 69.62 | 54.91 | 57.74 | 64.56 | 60.96 | 54.52 | 71.31 | 61.79 |
| IS1009b | 40.94 | 61.81 | 49.25 | 50.62 | 64.37 | 56.67 | 52.84 | 69.69 | 60.10 |
| IS1009c | 39.88 | 61.50 | 48.38 | 47.23 | 61.97 | 53.60 | 49.65 | 67.37 | 57.17 |
| IS1009d | 45.62 | 67.62 | 54.48 | 53.62 | 68.51 | 60.16 | 54.16 | 69.57 | 60.90 |
| TS3003a | 42.42 | 60.71 | 49.94 | 54.17 | 67.86 | 60.24 | 55.81 | 72.53 | 63.08 |
| TS3003b | 40.69 | 62.25 | 49.21 | 51.20 | 65.88 | 57.62 | 51.80 | 70.60 | 59.75 |
| TS3003c | 37.39 | 60.57 | 46.24 | 44.30 | 65.41 | 52.82 | 44.48 | 70.07 | 54.42 |
| TS3003d | 53.21 | 69.46 | 60.26 | 60.61 | 68.89 | 64.48 | 62.01 | 75.89 | 68.25 |
Table A2.
The results of eMD model for per-meeting Precision, Recall, and F1-Score (%) for SCD: Non-Freeze (NF) models.
Table A2.
The results of eMD model for per-meeting Precision, Recall, and F1-Score (%) for SCD: Non-Freeze (NF) models.
| Meeting ID | Text | Audio | Multi-modal | ||||||
|---|---|---|---|---|---|---|---|---|---|
| Prec | Rec | F1 | Prec | Rec | F1 | Prec | Rec | F1 | |
| EN2002a | 59.65 | 70.43 | 64.60 | 72.33 | 81.31 | 76.56 | 73.41 | 82.75 | 77.80 |
| EN2002b | 57.42 | 66.76 | 61.74 | 69.22 | 80.39 | 74.39 | 69.36 | 79.97 | 74.29 |
| EN2002c | 57.11 | 66.08 | 61.27 | 71.42 | 79.92 | 75.43 | 71.18 | 80.25 | 75.45 |
| EN2002d | 58.53 | 69.22 | 63.43 | 72.12 | 82.26 | 76.86 | 71.84 | 82.98 | 77.01 |
| ES2004a | 45.57 | 62.29 | 52.63 | 60.91 | 72.39 | 66.15 | 61.10 | 75.08 | 67.37 |
| ES2004b | 40.51 | 56.11 | 47.05 | 59.07 | 72.53 | 65.11 | 58.04 | 72.53 | 64.48 |
| ES2004c | 45.22 | 63.52 | 52.83 | 62.17 | 71.52 | 66.52 | 61.54 | 72.96 | 67.76 |
| ES2004d | 52.97 | 61.74 | 57.02 | 71.37 | 71.37 | 71.37 | 69.99 | 72.46 | 71.20 |
| IS1009a | 46.85 | 72.15 | 56.81 | 68.75 | 69.62 | 69.18 | 68.55 | 71.73 | 70.10 |
| IS1009b | 44.49 | 62.01 | 51.81 | 74.28 | 71.06 | 72.64 | 72.33 | 72.05 | 72.19 |
| IS1009c | 40.76 | 60.56 | 48.73 | 69.90 | 65.96 | 67.87 | 69.61 | 66.67 | 68.11 |
| IS1009d | 46.38 | 66.19 | 54.55 | 71.53 | 72.42 | 71.97 | 70.54 | 72.42 | 71.47 |
| TS3003a | 44.16 | 62.36 | 51.71 | 62.98 | 76.65 | 69.14 | 63.76 | 76.37 | 69.50 |
| TS3003b | 44.11 | 63.16 | 51.94 | 64.10 | 75.50 | 69.33 | 64.25 | 75.68 | 69.50 |
| TS3003c | 39.86 | 62.01 | 48.53 | 54.45 | 74.55 | 62.93 | 56.85 | 75.81 | 64.98 |
| TS3003d | 53.32 | 67.39 | 59.53 | 68.30 | 78.65 | 73.11 | 69.90 | 79.45 | 74.37 |
Table A3.
The results of eMD model for per-meeting Precision, Recall, and F1-Score (%) for SCD: Freeze (F) models.
Table A3.
The results of eMD model for per-meeting Precision, Recall, and F1-Score (%) for SCD: Freeze (F) models.
| Meeting ID | Text | Audio | Multimodal | ||||||
|---|---|---|---|---|---|---|---|---|---|
| Prec | Rec | F1 | Prec | Rec | F1 | Prec | Rec | F1 | |
| EN2002a | 40.25 | 70.33 | 51.20 | 56.15 | 88.09 | 68.59 | 49.16 | 92.92 | 64.30 |
| EN2002b | 36.13 | 73.02 | 48.34 | 55.18 | 84.42 | 66.74 | 47.28 | 90.82 | 62.19 |
| EN2002c | 35.29 | 73.08 | 47.60 | 54.32 | 84.30 | 66.07 | 45.68 | 92.91 | 61.25 |
| EN2002d | 39.84 | 72.38 | 51.39 | 57.11 | 87.56 | 69.13 | 49.67 | 92.56 | 64.65 |
| ES2004a | 25.03 | 76.09 | 37.67 | 44.77 | 86.53 | 59.01 | 34.90 | 90.24 | 50.33 |
| ES2004b | 23.10 | 79.73 | 35.82 | 38.33 | 83.92 | 52.63 | 28.60 | 91.79 | 43.61 |
| ES2004c | 23.53 | 75.68 | 35.90 | 42.55 | 78.08 | 55.08 | 30.49 | 90.40 | 45.60 |
| ES2004d | 30.36 | 75.71 | 43.34 | 51.85 | 77.88 | 62.26 | 40.19 | 85.89 | 54.76 |
| IS1009a | 24.72 | 74.26 | 37.09 | 45.61 | 81.01 | 58.36 | 35.30 | 90.72 | 50.83 |
| IS1009b | 22.64 | 79.92 | 35.29 | 40.80 | 82.48 | 54.59 | 27.70 | 89.96 | 42.35 |
| IS1009c | 20.87 | 77.00 | 32.83 | 36.23 | 83.10 | 50.46 | 26.34 | 87.79 | 40.52 |
| IS1009d | 25.79 | 75.98 | 38.50 | 44.56 | 84.52 | 58.35 | 33.40 | 88.97 | 48.57 |
| TS3003a | 21.79 | 76.37 | 33.90 | 45.89 | 79.67 | 58.23 | 34.35 | 83.52 | 48.68 |
| TS3003b | 22.64 | 78.95 | 35.19 | 45.12 | 76.41 | 56.74 | 30.30 | 85.84 | 44.79 |
| TS3003c | 19.08 | 75.45 | 30.46 | 37.30 | 78.14 | 50.49 | 29.82 | 88.17 | 44.57 |
| TS3003d | 29.64 | 75.77 | 42.61 | 53.03 | 82.32 | 64.51 | 43.80 | 88.86 | 58.68 |
Table A4.
The results of the eMD model for per-meeting Precision, Recall, and F1-Score (%) for SCD: Non-Freeze (NF) models.
Table A4.
The results of the eMD model for per-meeting Precision, Recall, and F1-Score (%) for SCD: Non-Freeze (NF) models.
| Meeting ID | Text | Audio | Multimodal | ||||||
|---|---|---|---|---|---|---|---|---|---|
| Prec | Rec | F1 | Prec | Rec | F1 | Prec | Rec | F1 | |
| EN2002a | 47.87 | 90.04 | 62.51 | 68.65 | 92.61 | 78.85 | 71.08 | 89.32 | 79.16 |
| EN2002b | 42.18 | 88.18 | 57.07 | 63.40 | 90.82 | 74.67 | 65.09 | 86.37 | 74.24 |
| EN2002c | 42.22 | 87.51 | 56.96 | 65.22 | 90.21 | 75.71 | 68.33 | 87.76 | 76.84 |
| EN2002d | 45.92 | 88.89 | 60.56 | 67.06 | 93.58 | 78.13 | 68.91 | 90.83 | 78.36 |
| ES2004a | 29.06 | 88.55 | 43.76 | 57.78 | 87.54 | 69.61 | 61.47 | 87.54 | 72.22 |
| ES2004b | 26.98 | 84.42 | 40.89 | 54.71 | 86.60 | 67.06 | 56.31 | 82.91 | 67.07 |
| ES2004c | 29.25 | 89.76 | 44.12 | 56.71 | 87.20 | 68.73 | 59.67 | 86.40 | 70.59 |
| ES2004d | 35.94 | 88.06 | 51.04 | 65.33 | 86.16 | 74.31 | 67.96 | 83.18 | 74.80 |
| IS1009a | 29.61 | 89.45 | 44.49 | 62.92 | 87.34 | 73.14 | 69.18 | 81.43 | 74.81 |
| IS1009b | 27.53 | 87.40 | 41.87 | 63.11 | 87.20 | 73.22 | 68.53 | 84.45 | 75.66 |
| IS1009c | 26.02 | 88.26 | 40.19 | 61.56 | 86.85 | 72.05 | 64.65 | 82.86 | 72.63 |
| IS1009d | 31.09 | 88.08 | 45.96 | 67.03 | 87.19 | 75.79 | 70.61 | 83.81 | 76.65 |
| TS3003a | 25.48 | 90.93 | 39.81 | 55.99 | 91.21 | 69.38 | 58.99 | 86.54 | 70.16 |
| TS3003b | 27.56 | 90.38 | 42.24 | 55.13 | 88.75 | 68.01 | 58.71 | 86.21 | 69.85 |
| TS3003c | 22.69 | 87.28 | 36.02 | 50.00 | 89.43 | 64.14 | 52.91 | 84.77 | 65.15 |
| TS3003d | 34.32 | 87.60 | 49.32 | 63.59 | 92.65 | 75.42 | 66.35 | 89.21 | 76.10 |
References
- Carletta, J.; Ashby, S.; Bourban, S.; Flynn, M.; Guillemot, M.; Hain, T.; Kadlec, J.; Karaiskos, V.; Kraaij, W.; Kronenthal, M.; et al. The AMI Meeting Corpus: A Pre-announcement. In Proceedings of the Machine Learning for Multimodal Interaction. Springer, Berlin, Heidelberg; 2005; pp. 25–29. [Google Scholar]
- Toleu, A.; Tolegen, G.; Mussabayev, R.; Zhumazhanov, B.; Krassovitskiy, A. Comparative Analysis of Distance Measures for Unsupervised Speaker Change Detection. In Proceedings of the 2024 20th International Asian School-Seminar on Optimization Problems of Complex Systems (OPCS); 2024; pp. 28–32. [Google Scholar] [CrossRef]
- Joyce, J.M., Kullback-Leibler Divergence. In International Encyclopedia of Statistical Science; Lovric, M., Ed.; Springer Berlin Heidelberg: Berlin, Heidelberg, 2011; pp. 720–722. [CrossRef]
- Chen, S.; Gopalakrishnan, P.S.; Watson, I.T.J. Speaker, Environment and Channel Change Detection and Clustering via the Bayesian Information Criterion. 1998.
- Sivakumaran, P.; Fortuna, J.; Ariyaeeinia, A.M. On the use of the Bayesian information criterion in multiple speaker detection. In Proceedings of the Interspeech; 2001. [Google Scholar]
- Toleu, A.; Tolegen, G.; Mussabayev, R.; Krassovitskiy, A.; Zhumazhanov, B. Comparative Analysis of Audio Features for Unsupervised Speaker Change Detection. Appl. Sci. 2024, 14. [Google Scholar] [CrossRef]
- Gish, H.; Siu, M.H.; Rohlicek, R. Segregation of speakers for speech recognition and speaker identification. In Proceedings of the [Proceedings] ICASSP 91: 1991 International Conference on Acoustics, Speech, and Signal Processing; 1991; pp. 873–876. [Google Scholar] [CrossRef]
- Bredin, H. TristouNet: Triplet loss for speaker turn embedding. In Proceedings of the 2017 IEEE International Conference on Acoustics, Speech and Signal Processing (ICASSP); 2017; pp. 5430–5434. [Google Scholar] [CrossRef]
- Jati, A.; Georgiou, P. An Unsupervised Neural Prediction Framework for Learning Speaker Embeddings Using Recurrent Neural Networks. In Proceedings of the Interspeech 2018, 2018, pp. 1131–1135. [Google Scholar] [CrossRef]
- Wang, R.; Gu, M.; Li, L.; Xu, M.; Zheng, T.F. Speaker segmentation using deep speaker vectors for fast speaker change scenarios. In Proceedings of the 2017 IEEE International Conference on Acoustics, Speech and Signal Processing (ICASSP); 2017; pp. 5420–5424. [Google Scholar] [CrossRef]
- Bredin, H.; Laurent, A. End-to-end speaker segmentation for overlap-aware resegmentation. In Proceedings of the Interspeech 2021, Brno, Czech Republic, 2021. [Google Scholar]
- Sarı, L.; Thomas, S.; Hasegawa-Johnson, M.; Picheny, M. Pre-training of Speaker Embeddings for Low-latency Speaker Change Detection in Broadcast News. In Proceedings of the ICASSP 2019 - 2019 IEEE International Conference on Acoustics, Speech and Signal Processing (ICASSP); 2019; pp. 6286–6290. [Google Scholar] [CrossRef]
- Ravanelli, M.; Bengio, Y. Speaker Recognition from Raw Waveform with SincNet. In Proceedings of the 2018 IEEE Spoken Language Technology Workshop (SLT); 2018; pp. 1021–1028. [Google Scholar] [CrossRef]
- Anidjar, O.H.; Lapidot, I.; Hajaj, C.; Dvir, A.; Gilad, I. Hybrid Speech and Text Analysis Methods for Speaker Change Detection. IEEE/ACM Trans. Audio, Speech, Lang. Process. 2021, 29, 2324–2338. [Google Scholar] [CrossRef]
- Meng, Z.; Mou, L.; Jin, Z. Hierarchical RNN with Static Sentence-Level Attention for Text-Based Speaker Change Detection. In Proceedings of the Proceedings of the 2017 ACM on Conference on Information and Knowledge Management, New York, NY, USA, 2017. [CrossRef]
- Anidjar, O.H.; Lapidot, I.; Hajaj, C.; Dvir, A. A Thousand Words are Worth More Than One Recording: Word-Embedding Based Speaker Change Detection. In Proceedings of the Interspeech 2021, 2021, pp. 3121–3125. [Google Scholar] [CrossRef]
- Zhao, G.; Wang, Q.; Lu, H.; Huang, Y.; Moreno, I.L. Augmenting Transformer-Transducer Based Speaker Change Detection with Token-Level Training Loss. In Proceedings of the ICASSP 2023 - 2023 IEEE International Conference on Acoustics, Speech and Signal Processing (ICASSP); 2023; pp. 1–5. [Google Scholar] [CrossRef]
- Devlin, J.; Chang, M.W.; Lee, K.; Toutanova, K. BERT: Pre-training of Deep Bidirectional Transformers for Language Understanding. In Proceedings of the Proceedings of the 2019 Conference of the North American Chapter of the Association for Computational Linguistics: Human Language Technologies, Volume 1 (Long and Short Papers). [CrossRef]
- Lin, T.Y.; Goyal, P.; Girshick, R.; He, K.; Dollár, P. Focal Loss for Dense Object Detection. IEEE Trans. Pattern Anal. Mach. Intell. 2020, 42, 318–327. [Google Scholar] [CrossRef] [PubMed]
- Hogg, A.O.T.; Evers, C.; Naylor, P.A. Speaker Change Detection Using Fundamental Frequency with Application to Multi-talker Segmentation. In Proceedings of the ICASSP 2019 - 2019 IEEE International Conference on Acoustics, Speech and Signal Processing (ICASSP); 2019; pp. 5826–5830. [Google Scholar] [CrossRef]
- weon Jung, J.; Seo, S.; Heo, H.S.; Kim, G.; Kim, Y.J.; ki Kwon, Y.; Lee, M.; Lee, B.J. Encoder-decoder Multimodal Speaker Change Detection. In Proceedings of the Interspeech 2023, 2023, pp. 5311–5315. [Google Scholar] [CrossRef]
Figure 2.
Comparison of Freeze (F) and Non-Freeze (NF) models across text-only, audio-only, and multimodal configurations of eMD model.
Figure 2.
Comparison of Freeze (F) and Non-Freeze (NF) models across text-only, audio-only, and multimodal configurations of eMD model.
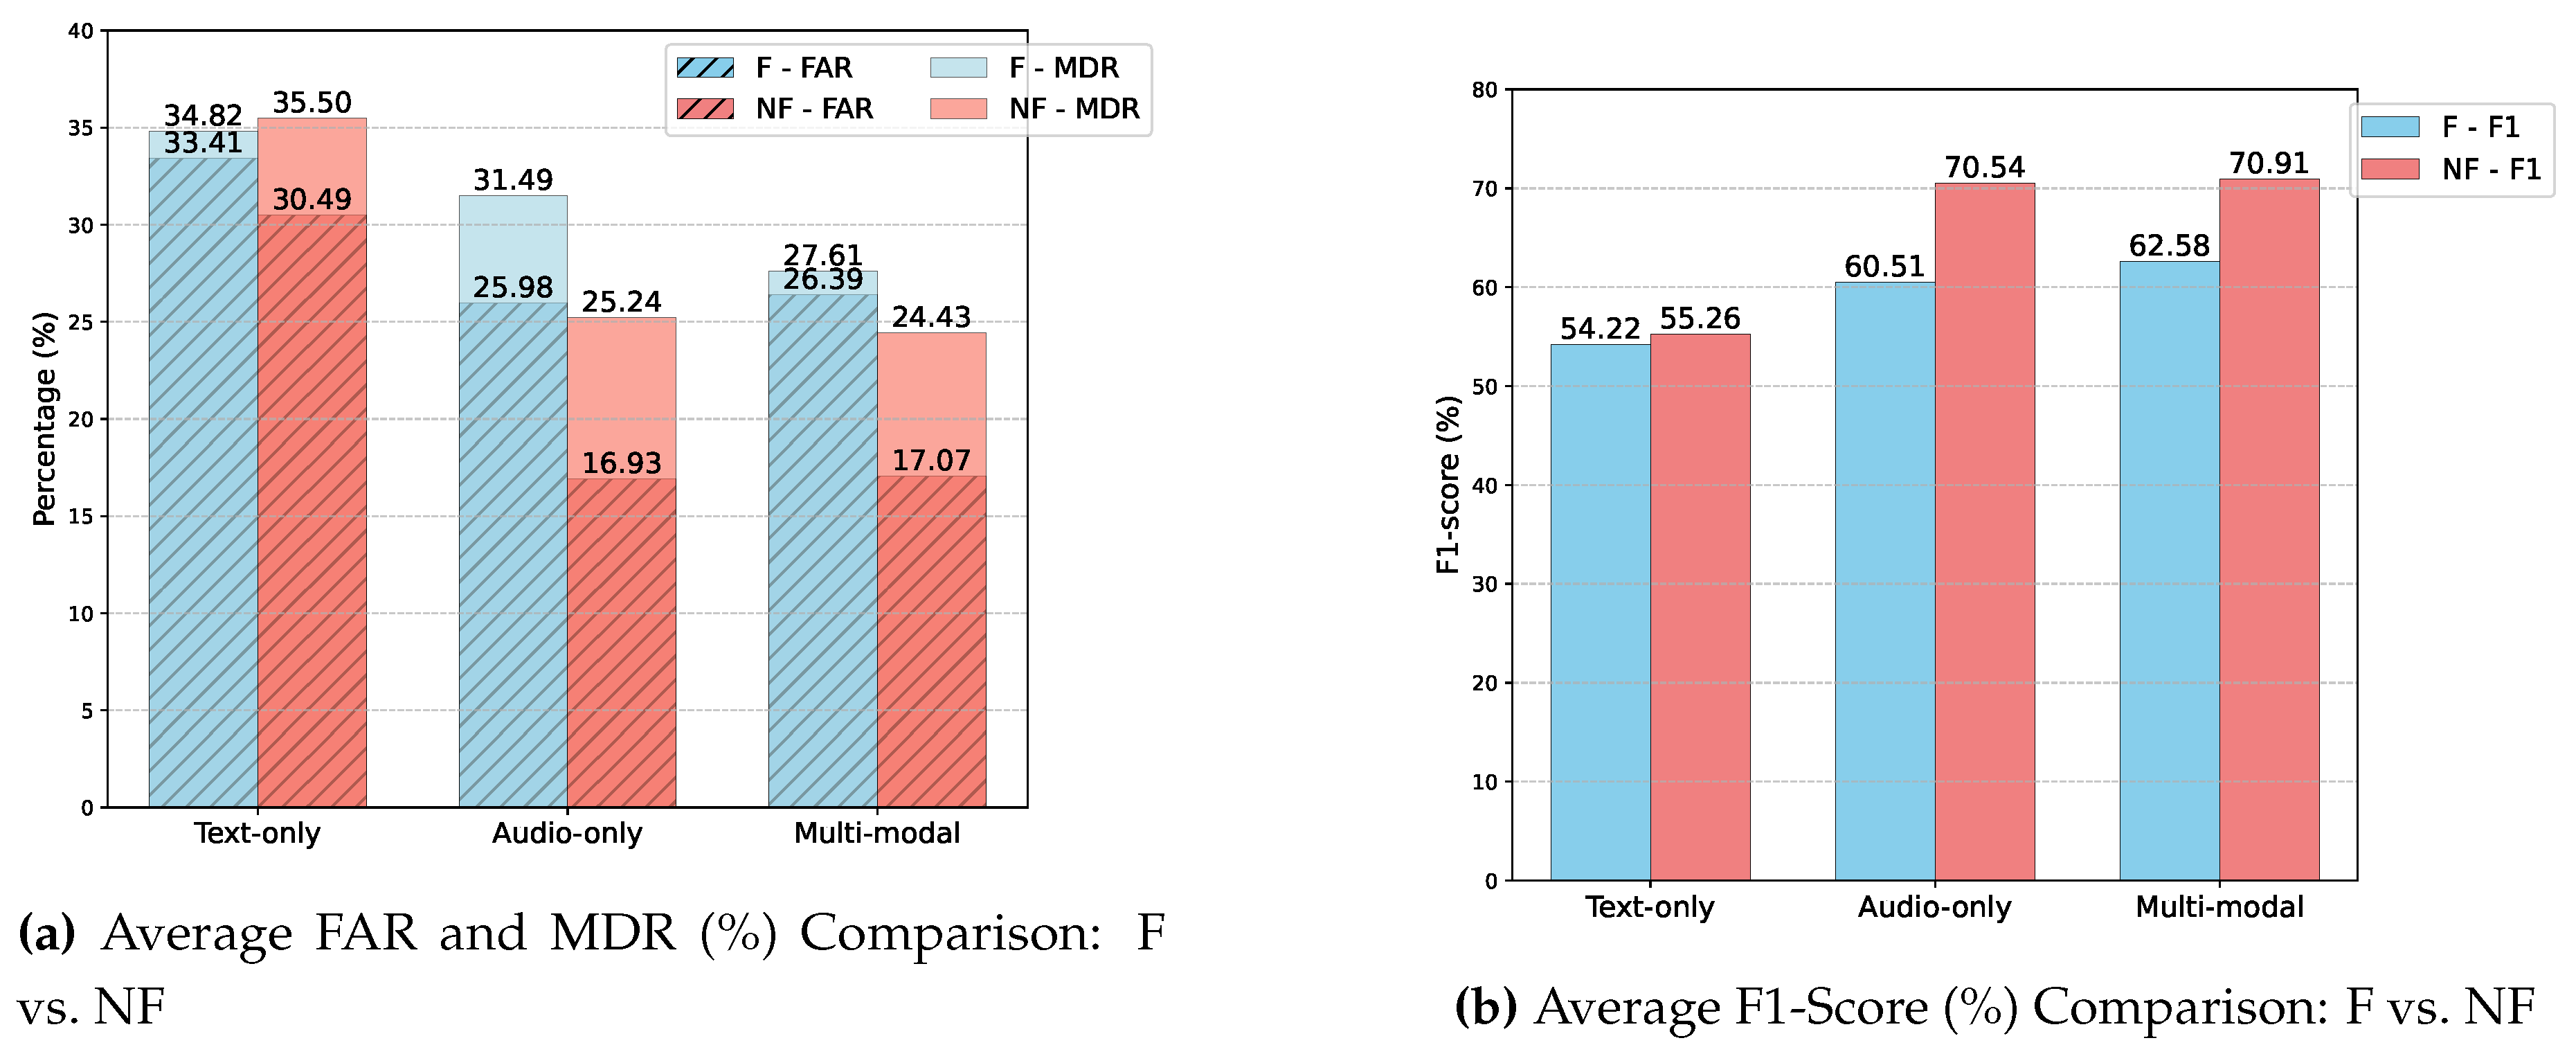
Figure 3.
Comparison of Freeze (F) and Non-Freeze (NF) models across text-only, audio-only, and multimodal configurations of eMD model.
Figure 3.
Comparison of Freeze (F) and Non-Freeze (NF) models across text-only, audio-only, and multimodal configurations of eMD model.
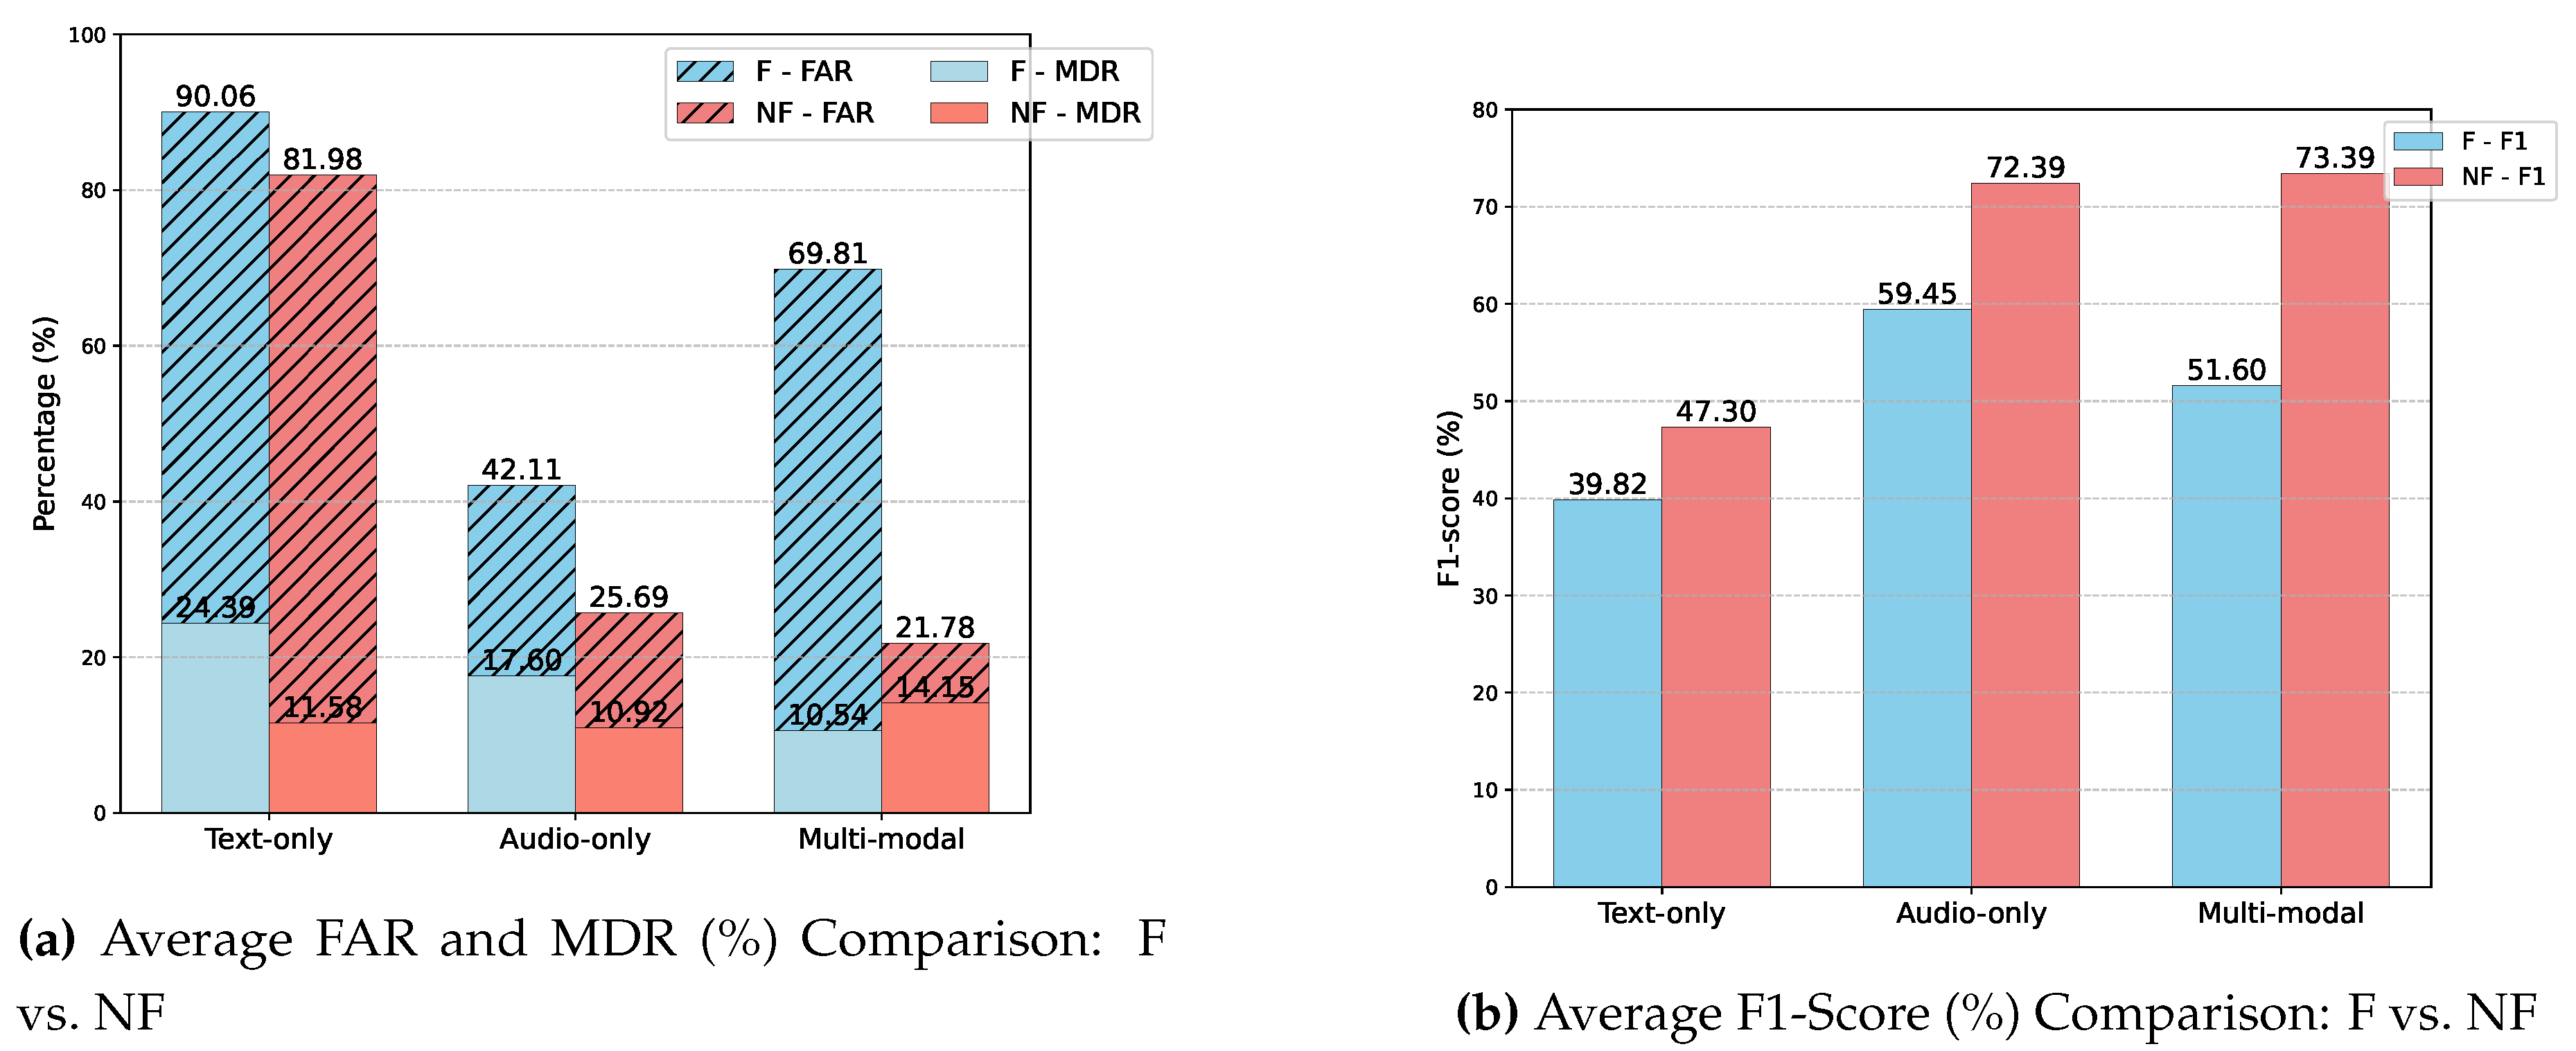
Figure 4.
Performance metrics (F1 Score, False Alarm Rate, and Miss Detection Rate) as a function of for different values.
Figure 4.
Performance metrics (F1 Score, False Alarm Rate, and Miss Detection Rate) as a function of for different values.
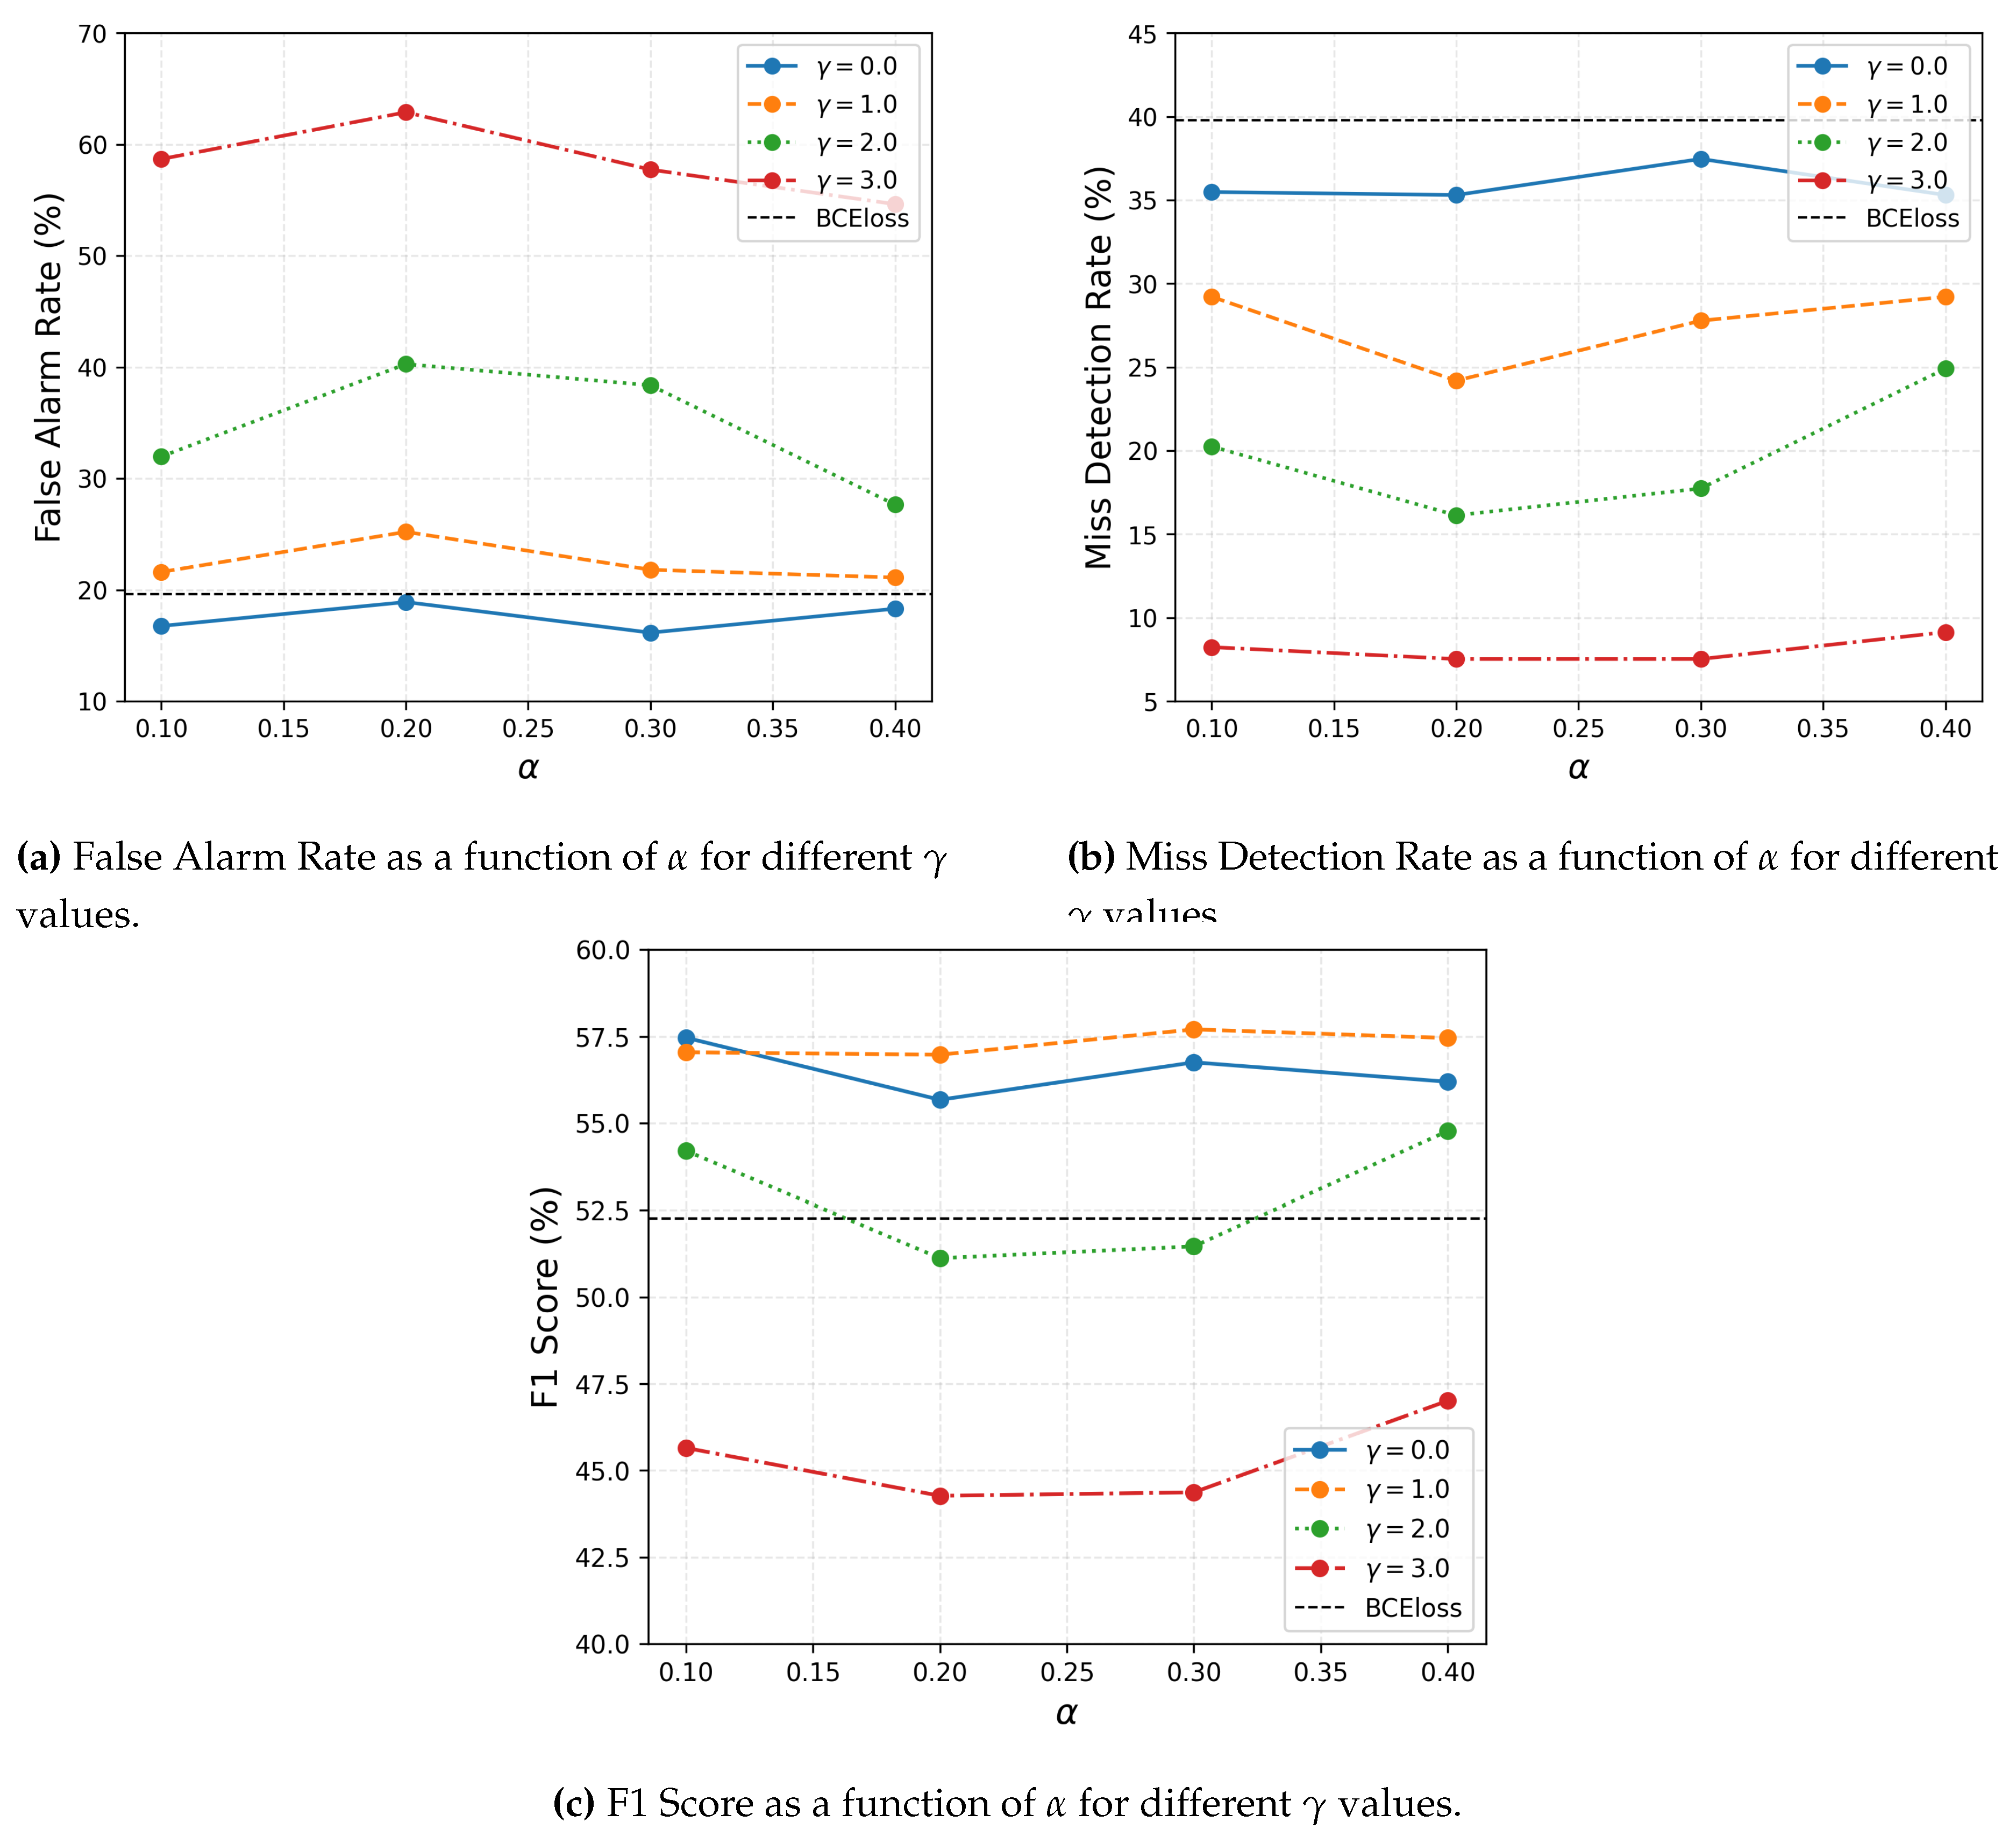
Table 1.
Statistics of the training dataset.
| Metric | Value |
|---|---|
| Total Meetings | 137 |
| Average change points | 790.99 |
| Average overlaps points | 306.61 |
| Average Speaker | 3.99 |
| Average Length | 34.11 minutes |
| Total Length | 4673.69 minutes |
| Positive samples | 30.85% |
| Negative samples | 69.15% |
Table 2.
Test set statistics: total change points, overlaps, speakers, audio length, and class distribution. Percentages are shown for positive (P) and negative (N) classes.
Table 2.
Test set statistics: total change points, overlaps, speakers, audio length, and class distribution. Percentages are shown for positive (P) and negative (N) classes.
| Meeting ID | Change Points | Overlaps | Speakers | Length (min) | P (%) | N (%) |
|---|---|---|---|---|---|---|
| EN2002a | 1366 | 678 | 4 | 43.90 | 45.51 | 54.49 |
| EN2002b | 954 | 444 | 4 | 33.52 | 41.18 | 58.82 |
| EN2002c | 1468 | 681 | 3 | 56.46 | 40.20 | 59.80 |
| EN2002d | 1331 | 662 | 4 | 46.02 | 44.45 | 55.55 |
| ES2004a | 360 | 145 | 4 | 15.71 | 28.31 | 71.69 |
| ES2004b | 687 | 257 | 4 | 37.48 | 25.46 | 74.54 |
| ES2004c | 722 | 262 | 4 | 37.71 | 27.02 | 72.98 |
| ES2004d | 893 | 351 | 4 | 34.02 | 34.38 | 65.62 |
| IS1009a | 290 | 122 | 4 | 11.91 | 28.76 | 71.24 |
| IS1009b | 602 | 251 | 4 | 33.24 | 25.26 | 74.74 |
| IS1009c | 494 | 142 | 4 | 26.51 | 23.65 | 76.35 |
| IS1009d | 688 | 245 | 4 | 29.27 | 29.04 | 70.96 |
| TS3003a | 424 | 95 | 4 | 17.54 | 24.81 | 75.19 |
| TS3003b | 658 | 157 | 4 | 30.63 | 25.00 | 75.00 |
| TS3003c | 629 | 160 | 4 | 31.83 | 21.82 | 78.18 |
| TS3003d | 1061 | 345 | 4 | 35.16 | 33.31 | 66.69 |
| Total | 13,127 | 5253 | - | 548.70 | - | - |
| Average | 821.31 | 328.19 | 3.94 | 33.38 | 31.40 | 68.60 |
Table 3.
The results of eMD model for per-meeting FAR, MDR, and Hit (%) for SCD: Freeze (F) models.
| Meeting ID | Text | Audio | Both | ||||||
|---|---|---|---|---|---|---|---|---|---|
| FAR | MDR | Hit | FAR | MDR | Hit | FAR | MDR | Hit | |
| EN2002a | 42.11 | 27.72 | 72.28 | 40.48 | 21.66 | 78.34 | 39.28 | 20.12 | 79.88 |
| EN2002b | 40.02 | 30.46 | 69.54 | 33.20 | 27.68 | 72.32 | 32.33 | 23.78 | 76.22 |
| EN2002c | 37.83 | 30.21 | 69.79 | 32.67 | 26.33 | 73.67 | 31.42 | 24.22 | 75.78 |
| EN2002d | 43.15 | 28.75 | 71.25 | 35.48 | 22.43 | 77.57 | 36.46 | 20.29 | 79.71 |
| ES2004a | 32.05 | 38.38 | 61.62 | 28.19 | 29.97 | 70.03 | 26.46 | 29.63 | 70.37 |
| ES2004b | 31.86 | 43.72 | 56.28 | 28.49 | 30.65 | 69.35 | 27.97 | 29.82 | 70.18 |
| ES2004c | 32.41 | 35.84 | 64.16 | 23.82 | 36.00 | 64.00 | 24.82 | 30.40 | 69.60 |
| ES2004d | 33.05 | 35.55 | 64.45 | 22.17 | 36.64 | 63.36 | 24.73 | 30.53 | 69.47 |
| IS1009a | 33.90 | 30.38 | 69.62 | 19.08 | 35.44 | 64.56 | 24.02 | 28.69 | 71.31 |
| IS1009b | 30.14 | 38.19 | 61.81 | 21.22 | 35.63 | 64.37 | 21.02 | 30.31 | 69.69 |
| IS1009c | 28.73 | 38.50 | 61.50 | 21.45 | 38.03 | 61.97 | 21.16 | 32.63 | 67.37 |
| IS1009d | 32.99 | 32.38 | 67.62 | 24.25 | 31.49 | 68.51 | 24.11 | 30.43 | 69.57 |
| TS3003a | 27.20 | 39.29 | 60.71 | 18.95 | 32.14 | 67.86 | 18.95 | 27.47 | 72.53 |
| TS3003b | 30.25 | 37.75 | 62.25 | 20.93 | 34.12 | 65.88 | 21.90 | 29.40 | 70.60 |
| TS3003c | 28.31 | 39.43 | 60.57 | 22.96 | 34.59 | 65.41 | 24.41 | 29.93 | 70.07 |
| TS3003d | 30.50 | 30.54 | 69.46 | 22.36 | 31.11 | 68.89 | 23.22 | 24.11 | 75.89 |
Table 4.
The results of eMD model for per-meeting FAR, MDR, and Hit Rate (%) for SCD: Non-Freeze (NF) models.
Table 4.
The results of eMD model for per-meeting FAR, MDR, and Hit Rate (%) for SCD: Non-Freeze (NF) models.
| Meeting ID | Text | Audio | Multi-modal | ||||||
|---|---|---|---|---|---|---|---|---|---|
| FAR | MDR | Hit | FAR | MDR | Hit | FAR | MDR | Hit | |
| EN2002a | 39.79 | 29.57 | 70.43 | 25.99 | 18.69 | 81.31 | 25.04 | 17.25 | 82.75 |
| EN2002b | 34.66 | 33.24 | 66.76 | 25.02 | 19.61 | 80.39 | 24.73 | 20.03 | 79.97 |
| EN2002c | 33.35 | 33.92 | 66.08 | 21.50 | 20.08 | 79.92 | 21.84 | 19.75 | 80.25 |
| EN2002d | 39.23 | 30.78 | 69.22 | 25.45 | 17.74 | 82.26 | 26.02 | 17.02 | 82.98 |
| ES2004a | 29.39 | 37.71 | 62.29 | 18.35 | 27.61 | 72.39 | 18.88 | 24.92 | 75.08 |
| ES2004b | 28.15 | 43.89 | 56.11 | 17.16 | 27.47 | 72.53 | 17.91 | 27.47 | 72.53 |
| ES2004c | 28.50 | 36.48 | 63.52 | 16.11 | 28.48 | 71.52 | 16.88 | 27.04 | 72.96 |
| ES2004d | 28.71 | 38.26 | 61.74 | 15.00 | 28.63 | 71.37 | 16.28 | 27.54 | 72.46 |
| IS1009a | 33.05 | 27.85 | 72.15 | 12.78 | 30.38 | 69.62 | 13.29 | 28.27 | 71.73 |
| IS1009b | 26.15 | 37.99 | 62.01 | 8.32 | 28.94 | 71.06 | 9.31 | 27.95 | 72.05 |
| IS1009c | 27.27 | 39.44 | 60.56 | 8.80 | 34.04 | 65.96 | 9.02 | 33.33 | 66.67 |
| IS1009d | 31.32 | 33.81 | 66.19 | 11.80 | 27.58 | 72.42 | 12.38 | 27.58 | 72.42 |
| TS3003a | 26.02 | 37.64 | 62.36 | 14.87 | 23.35 | 76.65 | 14.32 | 23.63 | 76.37 |
| TS3003b | 26.68 | 36.84 | 63.16 | 14.10 | 24.50 | 75.50 | 14.04 | 24.32 | 75.68 |
| TS3003c | 26.11 | 37.99 | 62.01 | 17.41 | 25.45 | 74.55 | 16.06 | 24.19 | 75.81 |
| TS3003d | 29.47 | 32.61 | 67.39 | 18.23 | 21.35 | 78.65 | 17.09 | 20.55 | 79.45 |
Table 5.
The results of eMD model for per-meeting FAR, MDR, and Hit (%) for SCD: Freeze (F) models.
| Meeting ID | Text | Audio | Multimodal | ||||||
|---|---|---|---|---|---|---|---|---|---|
| FAR | MDR | Hit | FAR | MDR | Hit | FAR | MDR | Hit | |
| EN2002a | 87.22 | 29.67 | 70.33 | 57.46 | 11.91 | 88.09 | 80.27 | 7.08 | 92.92 |
| EN2002b | 90.36 | 26.98 | 73.02 | 48.00 | 15.58 | 84.42 | 70.89 | 9.18 | 90.82 |
| EN2002c | 90.07 | 26.92 | 73.08 | 47.65 | 15.70 | 84.30 | 74.25 | 7.09 | 92.91 |
| EN2002d | 87.44 | 27.62 | 72.38 | 52.61 | 12.44 | 87.56 | 75.04 | 7.44 | 92.56 |
| ES2004a | 90.03 | 23.91 | 76.09 | 42.15 | 13.47 | 86.53 | 66.49 | 9.76 | 90.24 |
| ES2004b | 90.68 | 20.27 | 79.73 | 46.11 | 16.08 | 83.92 | 78.26 | 8.21 | 91.79 |
| ES2004c | 91.05 | 24.32 | 75.68 | 39.04 | 21.92 | 78.08 | 76.30 | 9.60 | 90.40 |
| ES2004d | 90.97 | 24.29 | 75.71 | 37.88 | 22.12 | 77.88 | 66.95 | 14.11 | 85.89 |
| IS1009a | 91.31 | 25.74 | 74.26 | 39.01 | 18.99 | 81.01 | 67.12 | 9.28 | 90.72 |
| IS1009b | 92.28 | 20.08 | 79.92 | 40.45 | 17.52 | 82.48 | 79.37 | 10.04 | 89.96 |
| IS1009c | 90.47 | 23.00 | 77.00 | 45.31 | 16.90 | 83.10 | 76.07 | 12.21 | 87.79 |
| IS1009d | 89.51 | 24.02 | 75.98 | 43.04 | 15.48 | 84.52 | 72.61 | 11.03 | 88.97 |
| TS3003a | 90.48 | 23.63 | 76.37 | 31.01 | 20.33 | 79.67 | 52.67 | 16.48 | 83.52 |
| TS3003b | 89.90 | 21.05 | 78.95 | 30.97 | 23.59 | 76.41 | 65.82 | 14.16 | 85.84 |
| TS3003c | 89.29 | 24.55 | 75.45 | 36.67 | 21.86 | 78.14 | 57.93 | 11.83 | 88.17 |
| TS3003d | 89.85 | 24.23 | 75.77 | 36.41 | 17.68 | 82.32 | 56.94 | 11.14 | 88.86 |
Table 6.
The results of eMD model for per-meeting FAR, MDR, and Hit (%) for SCD: Non-Freeze (NF) models.
Table 6.
The results of eMD model for per-meeting FAR, MDR, and Hit (%) for SCD: Non-Freeze (NF) models.
| Meeting ID | Text | Audio | Multimodal | ||||||
|---|---|---|---|---|---|---|---|---|---|
| FAR | MDR | Hit | FAR | MDR | Hit | FAR | MDR | Hit | |
| EN2002a | 81.90 | 9.96 | 90.04 | 35.33 | 7.39 | 92.61 | 30.36 | 10.68 | 89.32 |
| EN2002b | 84.62 | 11.82 | 88.18 | 36.71 | 9.18 | 90.82 | 32.42 | 13.63 | 86.37 |
| EN2002c | 80.49 | 12.49 | 87.51 | 32.33 | 9.79 | 90.21 | 27.34 | 12.24 | 87.76 |
| EN2002d | 83.77 | 11.11 | 88.89 | 36.79 | 6.42 | 93.58 | 32.79 | 9.17 | 90.83 |
| ES2004a | 85.37 | 11.45 | 88.55 | 25.27 | 12.46 | 87.54 | 21.68 | 12.46 | 87.54 |
| ES2004b | 78.03 | 15.58 | 84.42 | 24.49 | 13.40 | 86.60 | 21.97 | 17.09 | 82.91 |
| ES2004c | 80.39 | 10.24 | 89.76 | 24.64 | 12.80 | 87.20 | 21.62 | 13.60 | 86.40 |
| ES2004d | 82.23 | 11.94 | 88.06 | 23.95 | 13.84 | 86.16 | 20.54 | 16.82 | 83.18 |
| IS1009a | 85.86 | 10.55 | 89.45 | 20.78 | 12.66 | 87.34 | 14.65 | 18.57 | 81.43 |
| IS1009b | 77.78 | 12.60 | 87.40 | 17.23 | 12.80 | 87.20 | 13.11 | 15.55 | 84.45 |
| IS1009c | 77.75 | 11.74 | 88.26 | 16.80 | 13.15 | 86.85 | 14.04 | 17.14 | 82.86 |
| IS1009d | 79.90 | 11.92 | 88.08 | 17.55 | 12.81 | 87.19 | 14.28 | 16.19 | 83.81 |
| TS3003a | 87.76 | 9.07 | 90.93 | 23.66 | 8.79 | 91.21 | 19.85 | 13.46 | 86.54 |
| TS3003b | 79.19 | 9.62 | 90.38 | 24.08 | 11.25 | 88.75 | 20.21 | 13.79 | 86.21 |
| TS3003c | 82.99 | 12.72 | 87.28 | 24.96 | 10.57 | 89.43 | 21.06 | 15.23 | 84.77 |
| TS3003d | 83.72 | 12.40 | 87.60 | 26.49 | 7.35 | 92.65 | 22.59 | 10.79 | 89.21 |
Table 7.
Averaged results of eMD, eMD, and eMD comparing with baselines. The asterisk (*) asterisk denotes the model optimized with focal loss parameters.
Table 7.
Averaged results of eMD, eMD, and eMD comparing with baselines. The asterisk (*) asterisk denotes the model optimized with focal loss parameters.
| Models | FAR | MDR | Precision | Recall | F1 |
|---|---|---|---|---|---|
| NN | 7.66 | 71.11 | 62.74 | 28.89 | 38.16 |
| LSTM | 10.21 | 56.65 | 65.97 | 43.35 | 50.99 |
| Wav2vec2-MLP | 8.25 | 35.03 | 78.47 | 64.97 | 70.66 |
| eMD (audio-only) | 16.93 | 25.24 | 67.06 | 74.76 | 70.54 |
| eMD (multi-modal) | 17.07 | 24.43 | 67.02 | 75.57 | 70.91 |
| eMD (audio-only) | 25.69 | 10.92 | 61.14 | 89.08 | 72.39 |
| eMD (multi-modal) | 21.78 | 14.15 | 64.30 | 85.85 | 73.39 |
| eMD (multi-modal) | 15.88 | 20.77 | 69.61 | 79.23 | 74.01 |
Table 8.
Comparison with the previous work with multi-modal approaches.
| Previous work | P | R | F1 | FAR | MDR |
|---|---|---|---|---|---|
| Aidan et al [20] (2019) | - | - | - | 70.46 | 19.62 |
| Jung et al. [21] (2023) | 66.73 | 80.49 | 73.61 | - | - |
| Zhao et al [17] (2023) | 79.40 | 68.1 | 73.30 | - | - |
| eMD (audio-only) | 61.14 | 89.08 | 72.39 | 25.69 | 10.92 |
| eMD (multi-modal) | 64.30 | 85.85 | 73.39 | 21.78 | 14.15 |
| eMD (multi-modal) | 69.61 | 79.23 | 74.01 | 15.88 | 20.77 |
Disclaimer/Publisher’s Note: The statements, opinions and data contained in all publications are solely those of the individual author(s) and contributor(s) and not of MDPI and/or the editor(s). MDPI and/or the editor(s) disclaim responsibility for any injury to people or property resulting from any ideas, methods, instructions or products referred to in the content. |
© 2025 by the authors. Licensee MDPI, Basel, Switzerland. This article is an open access article distributed under the terms and conditions of the Creative Commons Attribution (CC BY) license (https://creativecommons.org/licenses/by/4.0/).
Copyright: This open access article is published under a Creative Commons CC BY 4.0 license, which permit the free download, distribution, and reuse, provided that the author and preprint are cited in any reuse.


