
Submitted:
11 March 2025
Posted:
12 March 2025
You are already at the latest version
Abstract
Aging experiments are pivotal for car manufacturers to ensure the reliability of their battery cells. However, realistic aging methods are time-consuming and resource-intensive, necessitating accelerated aging techniques. While these techniques reduce testing time, they can also lead to distorted results due to the partially reversible nature of cell behavior, which stems from the inhomogenization and rehomogenization of conducting salt and lithium distribution in the electrode. To accurately capture these phenomena, cell relaxation must be incorporated into the test design. This work investigates the impact of the test procedure and several stress factors, namely depth of discharge and C-rate, on the formation and rehomogenization of cell inhomogeneities. The experimental results reveal increasing cell inhomogenization, leading to growing reversible capacity losses, particularly under conditions with shorter cycling interruptions (check ups and rest phases). These reversible capacity losses are associated with a significant reduction in cycle life performance of up to 400 under identical cycling conditions but shorter cycling interruptions. Similar trends are observed for increasing cycle depths and C-rates. Optimized recovery cycles effectively mitigate cell inhomogenization, doubling cycle stability without requiring considerable additional testing time. Furthermore, a clear correlation is found between increasing inhomogenization and cell failure, with lithium stripping confirming the occurrence of lithium plating shortly before failure. These findings emphasize the critical importance of considering cell relaxation in cycle aging studies to ensure reliable and accurate lifetime predictions. Under realistic conditions, a substantially enhanced cycle stability is expected.
Keywords:
lithium-ion battery
; aging characterization
; accelerated aging
; cell inhomogeneity
; reversible degradation
; capacity recovery
1. Introduction
LIB cells for automotive applications require high cycle stability and long calendar lifetimes to compete with conventional internal combustion engines. Due to limited time scales of several months during battery and vehicle development [1,2], aging tests need to be accelerated compared to the real-world application. One common approach for this is the omission of intermediate rest phases [3,4], as they account for up to of the vehicles’ lifetime [5,6].
The lack of regularly repeated rest phases during accelerated laboratory tests impedes the compensation of reversible effects [7,8]. In the long term, the aging behavior is permanently manipulated, and premature cell failure can be triggered. Morales Torricos et al. [9] state that continuous cycling potentially promotes lithium plating due to the persistent inhomogenization of the lithium distribution within the negative electrode and, thus, can ultimately lead to cell failure. Therefore, lifetime predictions based on accelerated aging tests might be inaccurate or even falsified, underestimating the realistic lifetime.
During operation, irreversible degradation effects occur, called calendar and cycle aging. These effects cause an inevitable fade of capacity due to the loss of active material and lithium, as well as a growth of resistance resulting from contact loss between particles and the current collector and from thickening cover layers on the electrodes [10,11]. This cell deterioration is commonly measured by regularly repeated CU throughout the aging study. From diverse measurements, the current cell conditions can be captured, and by comparing these to the pristine state, the changes in the cell condition are quantifiable. Usually, these changes are directly interpreted as irreversible degradation. However, several studies have recently shown pronounced cell recovery during cycle aging tests [9,12,13,14]. The authors have attributed these recovery phenomena to diverse reversible mechanisms during cycle aging tests. These include the impact of the negative electrode’s overhang, the inhomogeneity of conducting salt induced by electrolyte motion, and the inhomogeneous lithium distribution within the active material.
1.1. Fundamental Electrochemical and Physical Processes Impacting Cycle Life
These reversible mechanisms cause temporary capacity loss in the short term, which is partially recovered during idle periods or CU when the cell is unstressed or only slightly loaded, and thus, equalization processes can take place [15,16]. However, if cycling continues, the effects of these mechanisms become irreversible in the long term and ultimately cause rapid cell failure. This is especially noticeable when cycle aging tests are performed in an accelerated manner, meaning at elevated stress levels and omitted rest phases.
Passive electrode effect or overhang of the negative electrode – The overhang denotes the geometric oversizing of the negative electrode [17], designed to prevent lithium plating at the electrode edges [4]. Consequently, this part has no positive counter-electrode and, therefore, takes part in de-/intercalation processes only by means of in-plane solid-state diffusion. Depending on its SOC in relation to the SOC of the active part of the electrode, the overhang acts as a source or sink for lithium and can cause reversible capacity gains or losses [18]. This is commonly observed in the initial stage of an aging test until a dynamic equilibrium between storage or cycling conditions and the intermediate CU is established. The measurable impact varies between hours and several days [4]. Due to its dependency on the operating conditions, an ultimate equalization of the overhang is not possible. Changes in the acting stresses or unintended rest phases impact the state of the overhang and can manipulate the measurement data by steps in the capacity progression.
Electrolyte motion induced salt inhomogeneity – The EMSI effect describes the inhomogenization of the conducting salt distribution within the jelly roll caused by the motion of the electrolyte [19]. This motion is induced by volume changes of the negative electrode due to de-/intercalation processes and therefore enhances with increasing DOD. As a result, the active material acts as a pump, displacing electrolyte from the jelly roll during charging and drawing it back in while discharging. The polarization due to the applied electrical load superimposes this electrolyte movement. The polarization leads to the formation of through-plane conducting salt gradients between the electrodes. During charging, lithium is transported from the positive to the negative electrode, leading to the enrichment of conducting salt in the positive electrode and the depletion in the negative. The simultaneous pump effect causes a movement of inhomogeneously distributed conducting salt and therefore evokes in-plane gradients. This effect is more pronounced for silicon-graphite composites, as the volume change of silicon is three times higher than that of pure graphite [20]. Through-plane concentration gradients in the range of a few hundred micrometers typically equalize within minutes to hours, while in-plane gradients require weeks to months of relaxation time [19].
Inhomogeneous lithium distribution – Apart from conducting salt gradients in the electrolyte, also lithiation gradients of the active material have been reported in the literature [7,9,16,17,21,22,23]. Like the conducting salt gradients, these lithiation gradients form across the electrode thickness as the active material is de-/lithiated from the surface towards the current collector [24,25]. Moreover, in-plane gradients have been observed and identified as a result of the EMSI effect described above [19]. However, Berhaut et al. [26] found very similar lithiation distributions during the first and second cycle, concluding that cell manufacturing could lead to preferential lithiation pathways due to non-uniform electrode morphology, varying diffusion paths, local electronic and ionic conductivities, and path lengths. Since through-plane conducting salt gradients require at least one complete charge-discharge cycle to form, the EMSI effect does not explain the inhomogeneous lithiation observed in the first cycle. For this reason, we assume that electrode-related characteristics, such as the aforementioned morphology, together with cell-related properties like local pressure distribution and winding radii, constitute another cause of inhomogeneous electrode lithiation, as they influence local tortuosity and porosity. The EMSI effect further exacerbates this inhomogeneity.
Lithiation inhomogeneities cause an inhomogeneous and incomplete utilization of the active material of the negative electrode and lead to the earlier reaching of the cut-off potentials [16]. Due to local lithiation variations within the negative electrode, the local electrode potential fluctuates. During charging and discharging, the areas of maximum and minimum potential terminate the de-/lithiation process of the entire cell. This is amplified by increasing DOD and C-rates [9]. As inhomogeneous lithiation aggravates, these potential fluctuations also increase, leading to the earlier reaching of the cut-off voltage. Consequently, the extractable capacity declines, which appears as cell degradation. This effect increases with progressive cycling [7,14].
Equalization of lithiation inhomogeneities – The equalization of inhomogeneous lithiation can be categorized into three mechanisms [27,28]: (i) inter-particle equalization, occurring within a particle between the surface and bulk on the m scale and below (dominant in the first few minutes); (ii) through-plane equalization, taking place between the current collector and separator on the m scale, where transport in the liquid phase is assumed to be dominant; and (iii) in-plane equalization, occurring across the electrode sheet on the cm scale. The latter is particularly relevant for wound cylindrical cells with small tab dimensions, as it leads to inhomogeneities over very long distances. Again, the transport across these regions is assumed to be dominant in the liquid phase [27]. Simulations by the authors indicate that even small inhomogeneities, with local deviations of approximately from the average concentration, remain unbalanced even after 6 . This highlights the sensitivity of the negative electrode to inhomogeneities and their long-term impact on cell behavior if not accounted for.
Two cell-internal factors impact the relaxation behavior. Firstly, gradients in the local electrode potential drive the equalization of adjacent, inhomogeneous areas [7,16,29]. These gradients are particularly high in the low full-cell SOC range as well as around the intercalation steps of the graphite at 15- 25 and 55- 60 full-cell SOC. Elevated temperature accelerates these compensation effects by increasing conductivity, diffusivity, and reaction rates [7,30]. Secondly, mechanical pressure gradients within the cell promote the formation of inhomogeneities during cycling and presumably impede their potential-driven compensation [8,15]. This is due to the higher volume expansion of areas with a higher lithiation state and vice versa. Thus, equalizing such areas would counteract the mechanical volume changes and, therefore, cannot take place on its own.
A distinct effect has been reported for silicon-graphite composites, where the de-/lithi- ation of the different materials is assumed to occur in a staggered manner [24,31]. This behavior results from the differing open-circuit potentials of the materials, which drive the de-/lithiation reactions. Since silicon exhibits a higher open-circuit potential up to approximately 50 SOC, the lithiation of the graphite fraction is delayed during charging, while it is primarily delithiated first during discharging [24,31]. This non-uniform lithiation is further amplified at higher C-rates and temperatures, as kinetic and transport limitations in silicon promote the preferential lithiation of graphite [32,33]. Besides the equalization of lithiation gradients between graphite particles explained above, lithium redistribution from graphite to silicon occurs during relaxation [24,26,32]. This so-called buffer effect has been particularly observed after charging pulses and intensifies with increasing C-rates, as the two materials exhibit increasingly different lithiation levels, which enhances the driving force for redistribution. The first 4 are the most dominant phase of this effect [24,28].
1.2. Contributions and Layout
Summarizing the presented fundamentals reveals a substantial impact of reversible phenomena on the long-term operating and degradation behavior of LIB. Moreover, it highlights the required diligence for the interpretation of measurement data, particularly for data obtained from accelerated aging tests, since both the magnitude of these effects, as well as their equalization, strongly depend on the acting operating conditions. However, recapitulating the state of the art indicates that such effects are largely overlooked, leading to incorrect conclusions in certain applications. This particularly applies to applications with frequent and extended rest phases, such as many automotive use cases.
This work studies the influence of the test procedure and several stress factors on the homogeneity of lithium distribution and the relaxation behavior to better understand the impacts on lifetime predictions and the battery performance during operation. Section 2 describes the methodology and experimental setup. In Section 3, the results are presented and discussed with a particular focus on reversible and irreversible aging. The first part illustrates the formation of inhomogeneities and their impact on aging characterization (Section 3.1). Based on these findings, Section 3.2 focuses on the effects of the test procedure, followed by the impact of the DOD and C-rates in Section 3.3. Subsequently, methods to promote the intermediate equalization of inhomogeneities are assessed in Section 3.4. Finally, Section 4 summarizes the key findings and provides a brief outlook. The main contributions are as follows:
- (1)
-
Understanding the impact of the test procedure on cell inhomogeneity.We address how the test procedure induces cell inhomogeneity, how it manifests, and how it affects both short- and long-term cell behavior as well as cycle stability. For this purpose, cell conditions before and after regular rest phases in the cycle aging tests are captured, and capacity differences, indicating equalization processes, are analyzed.
- (2)
-
Investigating the impact of various stress factors on cell inhomogeneity.The impact of DOD and C-rate during cycling is assessed. We investigate the correlation between stress levels, the degree of inhomogenization and equalization, and the occurrence of lithium plating.
- (3)
-
Supporting cell relaxation and rehomogenization during cycling.Based on these findings, we focus on rehomogenization behavior. We investigate static and dynamic methods to actively promote the equalization of inhomogeneities during accelerated cycle aging tests, aiming to minimize their impact on cell performance and degradation.
2. Materials and Methods
The subsequent sections provide a detailed description of the investigated battery cell and measurement equipment, the methodology and experimental framework, as well as the analytical methods utilized in this work, based on our earlier publication [34].
2.1. Cell Specifications
This study was conducted with the INR21700-50G (Samsung SDI, South Korea), an automotive-grade 21700 cylindrical cell from the mass-production vehicle Lucid Air (Lucid Motors, USA). Silicon-graphite is used for the negative and NCA for the positive electrode. The cells were extracted from a benchmarking vehicle during a teardown process in an almost new condition. The SOP of the respective vehicle model was in September 2021. Based on the cell code, the production date of the tested cells can be traced back to the beginning of May 2021. Before our aging tests, the cells underwent about two years of storage after sporadic cyclic loading in the vehicle.
2.2. Measurement Equipment
The cell tests were performed using a CTS and XCTS battery test system (BaSyTec GmbH, Germany). Test cases involving currents higher than 5 were performed with the XCTS test system, whereas all other test cases, as well as all CU, were carried out using the CTS test system, due to its higher measurement precision. The cells were electrically connected with Arbin single-cell battery holders (Arbin Instruments, USA) with 4-wire sensing in a horizontal orientation inside an IPP110eco climate chamber (Memmert GmbH + Co.KG, Germany) and a BINDER KB115 E4 climate chamber (BINDER GmbH, Germany) at a constant ambient temperature of 25 °C without additional active temperature control. For safety reasons, the cells’ surface temperatures were observed with a negative temperature coefficient thermistor.
2.3. Test Design and Measurement Procedures
A specific test design has been created to examine the impact of cell relaxation, with one cell tested per condition. Typical cycle aging studies consist of an alternating pattern of CU and cycling sequences without prolonged rest phases. In this way, cycle aging tests can be performed in a time-efficient manner. However, this concept does not account for intermediate rest phases, which are a key characteristic of vehicle applications and make up the majority of the lifetime. For this reason, we propose a test design incorporating an additional dedicated rest phase after every cycle interval.
A shortened pre-rest CU is performed right after the last cycle to directly assess the cell behavior after cycling. The influences of the idle period and the associated relaxation processes after cycling are captured by the post-rest CU. Figure 1 visualizes the general testing scheme and organizes the four experimental substudies presented in this work.
2.3.1. Check-Up Procedures
To continuously assess the cells’ condition alongside the inhomogenization and relaxation behavior throughout the aging study, CUs are performed on a regular basis every 100 cycles directly after cycling (pre-rest) and after the subsequent ten-hour rest (post-rest). This rest phase represents common periods of vehicle standstill during the day or night. The CU procedure contains three primary sequences: first, the C/3 discharge capacity is measured, followed by a low current discharge and charge at C/15. Finally, the DC resistance is determined using a HPPC with several C-rates at various SOC levels. The pre-rest CU is a shortened version of the general CU, including only the C/3 discharge capacity and the C/15 discharge pOCV measurement. This minimizes incipient relaxation effects, which are prone to occur during the CU due to the low electric load. Hence, those effects would impact the measurement after cycling and, thus, distort the assessment of the dedicated rest phase.
2.3.2. Cycle Aging Test Procedures
The cycle aging tests performed in this work include four consecutive substudies investigating the inhomogenization behavior during cycling and the rehomogenization behavior during relaxation.
Substudy 1: Impact of cycling interruption due to CUs and rest on cell inhomogenization.
Substudy 1 focuses on the inhomogenization behavior due to continuous cycling impacted by intermediate cycling interruptions due to CU and rest phases. For this purpose, the reference test procedure is reduced stepwise by individual measurement and/or resting sequences, as illustrated in Figure 2. The reference case follows the general testing scheme depicted in Figure 1, including cycling, pre-rest CU, rest, and post-rest CU. Cycling is performed at 1C/1C in the 20 to 100 SOC range.
Substudy 2: Impact of the DOD on cell inhomogenization.
In this substudy, cycling is performed in various SOC ranges. These are depicted in Figure 3 in relation to the cell’s DV, as this parameter is, besides the internal pressure, a substantial characteristic linked to the SOC and affects the lithium intercalation into the silicon and graphite particles. Thus, the in- and rehomogenization are influenced differently in diverse SOC ranges. To minimize the impact of the negative electrode’s overhang during the rest phase, the cells are stored at the average SOC of the preceding cycling sequence. C-rates are kept uniform at 1C/1C for all test cases to eliminate impacts from this stress factor.
Substudy 3: Impact of the current rate on cell inhomogenization.
In analogy with Substudy 2, in this substudy the impact of the current rate during charging and discharging is assessed. For this purpose, cycling is performed between 0 and 100 SOC at varying charge and discharge rates, summarized in Figure 3.
Substudy 4: Relaxation methods promoting cell rehomogenization.
Based on the findings regarding cell inhomogenization during cycling, substudy 4 investigates relaxation methods to actively promote cell rehomgenization. The test procedure is built upon the reference case for comparability, including cycling, pre-rest CU, relaxation, and post-rest CU. Cycling is performed at 1C/1C in the 0 to 100 SOC range. In contrast to the reference case, cell relaxation is carried out in diverse static and dynamic manners. In the static cases, the cells idle in open circuit condition like in the reference case but at differing SOC levels. As depicted in Figure 3, three rest SOC in the area of characteristic stage transitions of the negative electrode have been chosen. The corresponding voltages were approached by CCCV charging until the cut-off current of C/20 was reached. For dynamic relaxation, the resting phase is substituted by a low current charge with a C-rate of C/15.
2.4. Analysis Methods
Several analysis methods are performed based on the gathered data in the pre-rest and post-rest CU. The cell capacity is extracted from the C/3 CC discharge measurement. is calculated from the 20 s 1C current pulses in charge direction at 50 SOC. The CDA introduced by Lewerenz et al. [21] is used as a measure for the lithiation inhomogeneity. We further denote this parameter as because it is defined as the difference between a low and high current discharge, in our case, C/15 and C/3:
Due to different discharging durations, inhomogeneities have varying periods to equalize, resulting in a higher extractable capacity at lower C-rates. We emphasize that overpotentials due to increased cell resistance have a negligible impact on this capacity difference, as the voltage curves are very steep towards the end of discharge. In analogy to this parameter, we define the capacity difference , which quantifies the deviation between the C/3 discharge capacities during post-rest and pre-rest CU:
This characteristic is an indicator of cell relaxation during rest and gives insights into capacity recovery. Low respectively constant values indicate a minor extent of relaxation effects and, thus, a dynamic equilibrium state, while high respectively increasing values imply pronounced and growing relaxation as a consequence of aggravating inhomogeneity.
In addition, the cell inhomogenization behavior during cycling is evaluated either by means of the EODC voltage or the extractable amount of charge in every single cycle. Both values provide information about the homogeneity of the negative electrode’s lithiation degree, as higher inhomogeneity leads to a widening of the traversed voltage window, thus reaching the cut-off voltage earlier [16]. The is utilized in case of partial cycles if cycling is terminated above after a fixed amount of charge has been extracted. For this purpose, the last voltage value of every cycle is captured. It has to be noted that this is also impacted by decreasing capacity due to cell aging. The presented values should, therefore, rather be understood as trends instead of a precise quantification of the respective effect. , in contrast, is assessed when cycling is performed across the entire voltage range from 4.2 to , ensuring that remains unchanged. The relaxation behavior is analyzed based on these two parameters. Therefore, we quantify the alterations and during CUs and rest between every 100th cycle and the first cycle of the subsequent cycle interval.
Finally, the stripping behavior serves as an indicator of preceding lithium plating, as it reveals the dissolution of previously deposited metallic lithium. This metallic lithium returns to its ionized state and re-participates in the de-/intercalation reactions [28,32]. To analyze this effect, the differential voltage during the resting phase immediately after a CC charge is examined.
3. Results and Discussion
In the following, we evaluate and discuss the results of the conducted cycle aging studies. First, the formation of cell inhomogeneities during cycling is outlined, followed by the impact of the test procedure and cycling interruptions due to CU and rest phases. Based on these findings, the influence of DOD and current rate on in- and rehomogenization behavior is presented. Finally, methods to actively support intermediate cell rehomogenization are analyzed.
3.1. Formation of Cell Inhomogeneities During Cycling
Several studies have reported inhomogeneous cell conditions in terms of negative electrode lithiation [9,12,15] and conducting salt distribution [37]. These inhomogeneities result from cell cycling, which triggers the formation of concentration gradients. Electrolyte motion due to volume changes of the jelly roll further enhances these gradients [19]. As a result, the kinetic overpotentials increase, leading to the earlier reaching of the cut-off voltage and consequently reducing the extractable capacity [21]. These effects are reversible as long as a critical cell condition has not been exceeded. However, they lead to an increasingly uneven distribution of the locally acting stresses, promoting localized degradation spots, e.g., due to lithium plating.
To show these effects and the underlying cell behavior, the 20 to 100 SOC test case is considered exemplary because it shows the most pronounced effects and allows for the analysis of , in contrast to the full DOD test case. For the latter, discharging is always terminated at , and therefore, no alterations occur. The reversibility mentioned above becomes evident in Figure 4 (a), illustrating the relative capacity during the cycle aging study. The dashed line represents the capacity measured in the pre-rest CU directly after cycling, while the solid line depicts the capacity extracted from the post-rest CU after the subsequent ten-hour rest. Both measurements follow the same procedure, though they reveal a clear discrepancy in the extractable capacity, as shown by the red curve in Figure 4 (b). In addition, the capacity differences between low (C/15) and high current (C/3) discharge, obtained from the pre-rest (blue curve) and the post-rest CU (black curve), are depicted, also revealing a discrepancy, as presented in our earlier publication [34].
Since measurement impacts can be precluded, these differences must result from effects occurring during the rest phase and the CU. After cycling, the cell exhibits the inhomogeneities in terms of lithiation and conducting salt distribution mentioned above to a certain degree. As a consequence, shares of the active lithium are inaccessible. During the rest phase and the CU, which are characterized by predominantly low-current charge and discharge sequences as well as several additional rest phases, these inhomogeneities can partly equalize, leading to a redistribution of lithium within the negative electrode and increasing the lithium accessibility. Therefore, the capacity increases. An inverse correlation with the () is evident, revealing a reduced capacity difference after relaxation. Moreover, both capacity differences, and exhibit a high similarity, supporting the explanation of Lewerenz et al. [21]. They emphasize that the capacity difference mainly results from inhomogeneous lithium distribution, which strongly limits the extractable capacity. Due to the different time scales during discharging at low and high current rates, these inhomogeneities equalize to varying degrees, explaining the capacity difference. While increased overpotentials due to a grown internal resistance also reduce the extractable capacity as the cut-off voltage is reached earlier depending on the C-rate, this impact is minor since the voltage curves are very steep at the end of discharge. Impacts of the negative electrode’s overhang during the rest phase are assumed negligible since the rest SOC matches the average SOC during cycling. Hence, no considerable lithiation differences should occur between the active and passive areas of the negative electrode.
It becomes evident that the capacity differences grow with progressing cycling. This suggests that as the cell is stressed, it becomes increasingly inhomogeneous, leading to growing capacity recovery during CU and rest. Starting at around 500 EFC, the previously observed high similarity ceases, and the capacity differences begin to diverge. One EFC represents a complete charge and discharge cycle, normalized to the nominal cell capacity. While further increases, reaches a maximum and subsequently drops significantly. This could either indicate the establishment of a dynamic equilibrium between inhomogenization and rehomogenization or the progressively increasing incompleteness of the rehomogenization process. Moreover, this further implies changes in degradation behavior and the dominant mechanism, which will be further discussed in Section 3.5.
The further supports this interpretation by its characteristic sawtooth pattern, as can be seen in Figure 5 (a). Herein, one continuous cycle interval corresponds to one sawtooth, presented for an early aging state during the first 100 cycles in Figure 5 (c) and for an advanced aging state in the cycle interval between 901 and 1000 in Figure 5 (d). These observations give further insights into the ongoing phenomena, revealing two interlinked effects: Firstly, descends towards lower values within one cycle interval as cycling progresses. This results from increasing inhomogeneities in conducting salt distribution and lithiation degree within the negative electrode, leading to local SOC variations in the active material. Consequently, areas with decreased SOC are discharged to a lower voltage when extracting the same amount of charge, shifting to lower values. In addition, increasing cell polarization due to growing conducting salt gradients causes the overpotentials to increase, specifically the concentration overpotential. During cycling, concentration gradients form within the cell, which aggravate with progressive, continuous cycling. Electrolyte motion due to volume changes leads to a local conducting salt enrichment in the center of the jelly roll, while salt depletes at the edges [19,37]. It needs to be considered that such characteristic behavior can also result from a drift of the SOC window caused by small deviations between the discharged and recharged amount of charge. In our tests, however, this can be excluded because both charging and discharging were terminated charge-based, and therefore, this impact is negligible.
Secondly, the spike after the 100th cycle reveals cell relaxation during resting and CU. During the rest, the lithium distribution in the negative electrode rehomogenizes, and concentration gradients of the conducting salt equalize, leading to a more uniform lithiation. This manifests itself in the observable reset of the and is illustrated in Figure 5 (b).
Comparing the cell behavior in the two highlighted cycle intervals provides insights into the long-term behavior. The intensity of both the inhomogenization during cycling and the rehomogenization during resting amplifies with progressing cycling. This is evident from the increasingly steep decline of during cycling and the subsequently more pronounced voltage spike. However, the inhomogenization effects grow disproportionally compared to the rehomogenization. Despite intensified relaxation effects over the course of the experiment, Figure 5 (d) reveals a significantly more incomplete and prolonged cell relaxation compared to the early aging state. This effect, indicated by the peak during the first cycles, is temperature-induced, as the cell cools down during CU and rest and heats up during the first cycles. The rising temperature supports equalization processes and reduces overpotentials, ultimately leading to an increased . This increasingly incomplete relaxation aligns with our previous findings regarding the growing capacity difference and the declining capacity recovery rate. In addition, Figure 5 (b) illustrates the progressions of , representing the regained capacity during relaxation, and the voltage relaxations during CU and rest, proofing a strong correlation of both. The values of the voltage relaxation represent the difference of between every 100th cycle (indicated by the diamond marker) and every first cycle of the subsequent cycle sequence (indicated by the circle marker). Consequently, serves as a measure for the voltage relaxation, such as represents the charge regain. This behavior seems plausible, as the redistribution of lithium during the rest leads to a more homogeneous SOC distribution throughout the negative electrode, and the polarization declines due to the equalization of concentration gradients. Therefore, the voltage window tightens.
It has to be noted that the reversible capacity losses are inherently superimposed by irreversible ones due to unavoidable degradation mechanisms, including, e.g., SEI growth consuming active lithium or loss of active electrode material, e.g., due to particle cracking as a result of volume changes [10]. This irreversible capacity loss also causes a widening of the traversed voltage window. However, a sole irreversible degradation would not exhibit the observed voltage reset during the rest.
3.2. Impact of the Test Procedure on Cell Inhomogeneities
The observed behavior during cycling and the subsequent CUs and rest phase emphasizes considerable reversible effects triggered by continuous cycling. To further investigate how these effects are influenced by the test design and how they manipulate long-term cell behavior, we now focus on the impact of cycling interruptions through CU procedures and rest phases. For this purpose, we stepwise reduced the cycling interruption and sequentially removed specific CU elements and the rest phase. The associated degradation behavior is visualized in Figure 6. While the reference case (dark blue curve) as one edge case contains the entire pre-rest CU, the ten-hour rest, and the complete post-rest CU every 100 cycles, in the opposite edge case (dark red curve), the cell is continuously cycled and CU are performed only at BOL and EOL. The cycling procedure and the associated stress factors, however, are identical in all cases.
The relative capacities of the cells show a clear trend: shorter cycling interruptions trigger significantly higher degradation rates, as shown in Figure 6 (a). The best-performing cell completes four times as many cycles as the worst-performing cell before reaching 80 of the initial capacity. Unexpectedly, the BOL-EOL cell (dark red curve) exhibits a longer cycle life than the cell with intermediate capacity measurements every 100 cycles (orange curve). We assume that these capacity measurements, which were performed in the entire voltage range between and , cause additional cell inhomogenization and degradation in contrast to the sole cycling between 20 and 100 SOC. Particularly in the low SOC range, where silicon particles are primarily de-/lithiated [31] and pronounced volume changes occur in the graphite, mechanical stresses are induced in the jelly roll. These stresses promote electrode degradation and electrolyte motion. Despite a noticeable cell relaxation during these capacity measurements, which are evident in the peaks of the in Figure 6 (b), the damaging impact is expected to dominate. However, it should also be noted that already the first cycle interval of this particular cell (orange curve) deviates from the others, as declines significantly stronger during the first 100 cycles. This is suspicious since cell preparation, BOL CU, and cycling were identical in all test cases and, therefore, do not explain this behavior. We cannot preclude an outlier behavior of this specific cell.
In good agreement with the relative capacity, shows a faster decline for test cases with shorter cycling interruptions. The ten-hour rest seems to be especially beneficial for the degradation behavior, as highlighted by the comparison between the blue and green curves. Moreover, voltage relaxation in the test case with only capacity measurements is significantly lower compared to the test cases with extended CU and rest. This is caused by the considerably shorter relaxation time. Consequently, equalization processes can only take place to a minor extent. Unintended intermediate voltage relaxation is observable for the test case without pre-rest CU (light blue curve) at 336 cycles and the test case without rest (green curve) at 411 cycles, highlighted by asterisk markers. In both cases, a power outage led to a test interruption followed by an unintended resting period of several hours. The relaxation is particularly pronounced for the latter because restarting the test caused several further interruptions shortly after the restart. We assume that the combination of this resting phase and current pulses promoted cell relaxation, explaining this significant voltage setback.
The capacity difference depicted in Figure 6 (c) shows the inverse behavior of the capacity loss while revealing a high correlation. With decreasing cycling interruptions, the capacity differences increase faster, indicating a faster inhomogenization of the conducting salt and lithium distribution. This coincides with less pronounced voltage relaxation for shorter cycling interruption, as illustrated in Figure 6 (d). Due to these shorter interruptions, less time is available during which inhomogeneities can equalize. In addition, three of the cells show a prominent drop in directly before reaching EOL.
3.3. Impact of Stress Factors During Cycling
After demonstrating how the test procedure, especially the resting phase, impacts the cell behavior by partially reversing capacity fade during CU and rest phases, we now focus on the influences of different stress factors during cycling. For this purpose, we investigate the cell behavior during cycling and relaxation during rest phases. In contrast to the results presented above, the cells of the subsequent two substudies were all subjected to the identical pre- and post-rest CU procedure, as well as the intermediate ten-hour rest. Instead of 1C/1C cycling in the 20 to 100 SOC window, in the first substudy, the DOD and SOC range was varied, while the current rates remained fixed at 1C/1C. In the second substudy, the DOD was set to 100 , and the current rates were modulated.
3.3.1. Depth of Discharge
At first glance, the cells exhibit a typical degradation behavior, revealing well-established dependencies on the DOD as a stress factor, as plotted in Figure 7. These dependencies are reported as increasing degradation rates with higher DOD [38,39] and average cell SOC [39,40]. Stronger degradation at higher DOD is commonly attributed to intensified volumetric changes and, thus, increased mechanical stress, notably in the negative electrode [41]. This is further aggravated for silicon-containing cells when cycling in low SOC areas due to even higher volumetric changes because of the de-/intercalation of the silicon particles [38]. The influence of increasing average SOC on higher capacity fade is often linked to the enhanced dissolution of nickel-rich materials [39,40,41,42], caused by elevated cell voltage, with subsequent deposition of the oxidation products in cover layers on the negative electrode [41,42,43,44]. In this regard, it should be considered that the CU are carried out after an equal number of 100 partial cycles across all test cases. As a result, for decreasing DOD, the CU frequency increases with respect to testing time and charge throughput. This leads to a higher cell exposure due to the full cycles performed in the CU. For this reason, we expect a superimposing impact, falsifying the observable SOC dependency. Moreover, it has to be noted that these results represent the cell behavior directly after cycling, thus not incorporating any relaxation effects.
However, what is commonly not considered is the occurrence of reversible capacity loss [34]. Hence, a different picture emerges when looking deeper into the cell behavior during cycling. The capacity difference under various DOD enables the assessment of the DOD’s impact on reversible capacity loss. Corresponding to Figure 8 (a), the cells follow a logarithmic increase. A trend consistent with the one observed for shortened cycling interruptions is evident, with higher DOD causing more severe capacity differences and a faster growth rate in the early cycles. This suggests that inhomogenziation effects are more pronounced at higher cycle depths, which is in alignment with findings from the literature [9,15] and explained by the more pronounced EMSI effect due to stronger volume changes [19]. As the electrolyte motion is intensified, this leads to more severe conducting salt gradients and aggravates cell inhomogenization. These enhanced gradients could explain the higher capacity differences and the higher observable capacity loss when cycling at higher cycle depths. Cells cycled at DOD of 40 and less show the identical increase in capacity difference. In contrast, 60 , 80 , and 100 DOD lead to a pronounced drop in the capacity difference shortly before transitioning into an accelerated capacity loss and the subsequent cell failure, commonly denoted as knee point. Consequently, the measurable capacity loss is superimposed by growing shares of reversible capacity losses. It is assumed that DOD around 40 located around the 50 average cycling SOC represent a threshold, and lower DODs do not reduce the impact on cell inhomogenization.
In good agreement with these results, the impact on is enhanced by increasing DOD, revealing the same trend and consequently indicating stronger cell inhomogenization when applying larger cycle depths [34]. This becomes evident in Figure 8 (b) and (c), showing the progressions of the end of discharge voltages as well as the voltage relaxations during CU and rest. As observed earlier, the intensity of inhomogenization, as well as incomplete relaxation during rest, amplifies with progressive cycling, suggesting a self-reinforcing behavior [14]. In this regard, it should be recapitulated that the number of cycle repetitions between two subsequent CU is the same for all test cases. Thus, cells with a larger DOD experience a higher charge throughput during cycling between two subsequent CU than cells with a lower DOD. This higher charge throughput causes even stronger inhomogenization during cycling, supporting the self-reinforcing behavior. In addition, a lower CU frequency related to the charge throughput allows for less frequent cell relaxation and, thus, rehomogenization, limiting the comparability of the observed magnitudes of inhomogenization between the different DOD test cases.
A specific behavior is observable in Figure 8 (c) for cells with a DOD of 40 or less. For these cells, ranges around or below 0 , indicating a decrease of during CU and rest, while it increases during the first cycles of each cycling sequence. This is traced back to temperature influences. During CU and rest, the cells are allowed for thermal relaxation because of the low cyclic stresses and the extended rest phases, enabling the cells to approach the ambient climate chamber temperature. As cycling restarts, the cells heat up again due to internal resistive effects. This cell heating follows a logarithmic progression and takes several cycles to fully establish and approach its dynamic equilibrium point.
Moreover, all three cells that failed during the aging experiment, namely 60 DOD, 80 , and 100 , show a pronounced drop in capacity difference before the last CU. This coincides with a significant resistance rise, as well as plateaus in the stripping potential, depicted in Figure 8 (d). Again, a clear dependency on the DOD can be seen, with higher capacity differences, higher internal resistance growth, more pronounced lithium stripping, and earlier occurrence of cell failure linked to higher DOD. These symptoms of accelerated capacity loss accompanied by increased resistance growth, as well as the occurrence of lithium stripping, are often associated with lithium plating [28,32,41]. This interpretation aligns with the expected degradation behavior of severely inhomogenized battery cells [9,14,45] and seems plausible, considering the underlying mechanisms. Due to the metallic deposition of lithium on the surface of the negative electrode caused by the plating reaction, active lithium is consumed, which explains the capacity loss. Moreover, due to the cover layers formed of plated lithium, the active surface of the negative electrode decreases, resulting in a significant resistance increase [41]. Finally, the initially localized plating spots rapidly spread across the entire negative electrode surface, explaining the degradation dynamics manifesting in the capacity knee point and the sudden exponential resistance increase.
Consequently, once a critical point is surpassed, the reversible behavior becomes irreversible, causing rapid cell degradation, ultimately leading to cell failure. Therefore, according to our results, sufficiently long and repeated rest periods should be provided, especially for large DODs.
3.3.2. Current Rate
The same trend becomes evident for the current rate, with increasing currents causing more severe apparent capacity loss and resistance growth, as depicted in Figure 9. Such measurement data represents common observations presented in the literature and is often explained by increased negative electrode degradation as a consequence of high currents or electrode surface passivation and lithium loss due to lithium plating [41,46].
However, increasing the current rates not only aggravates the observable capacity loss but also intensifies cell inhomogenization. This coincides with increasingly declining charge throughput during cycling and more pronounced resets during CU and rest. Like for the DOD, the capacity differences prove an intensifying and faster-growing lateral lithium-ion flow with increasing current rates and progressive cycling, which is shown in Figure 10 (a) and (b). Overall, these findings agree with the results presented in the literature [9,19].
As evident from Figure 10 (b), cycling at C/2, which is the lowest C-rate investigated in this study, exhibits an almost constant capacity difference until approximately 900 cycles. Afterwards, the knee point is reached and the cell fails shortly thereafter. At the same time, an approximately linear progression of the extractable charge during cycling occurs with no peaks around the CU and rest phases, as shown in Figure 10 (a). Since the cells are cycled in the entire SOC range in this substudy, the discharging is terminated uniformly at . Consequently, no alterations in can be used to indicate cell inhomogeneity. However, as the DOD remains identical, changes in the extractable charge in every single cycle give insight into cell homogeneity. This suggests that no considerable rehomogenization and therefore no capacity recovery occurs in this test case, which is visualized in Figure 10 (c). As an equivalent indicator to , is analyzed in this case. It represents the amount of regained capacity during CU and rest and is calculated as the difference between the discharge capacity of the first cycle in a cycle interval directly after a CU and the last cycle of the preceding cycle interval before a CU. This parameter is not equivalent to the capacity difference between pre-rest and post-rest CU mentioned earlier. Unlike the capacity difference, is derived from cycling data rather than CU measurements. Nevertheless, it reflects the same cell behavior.
In contrast, for the 2C/2C test case, marking the other edge case in this substudy, significant capacity recovery during CUs and rest is found. However, this effect sets in at 300 cycles, while until 200 cycles, no signs of recovery are observable. This coincides with the initial linear decline in discharge capacity during the first 200 cycles and the missing indicators for cell relaxation during rest and CU. Temperature effects can partly explain the behavior before this point. Due to the significantly higher C-rates during cycling than in the other test cases, the cell heats up considerably more. This is assumed to reduce cell inhomogenization during the initial phase of cycling. As this self-heating takes a few cycles and the cell cools down during CU and rest, the extractable capacity during the first cycles of every sequence is lower. Consequently, recovery and temperature effects are superimposed and conceal each other. In addition, the self-heating impacts the pre-rest CU, which is performed directly after cycling, while the cell cools down during the pre-rest CU and rest phase. As a result, the extractable capacities in the pre-rest CU are higher due to the supporting effect of the elevated temperature, which manipulates the capacity difference calculation with the post-rest CU.
The capacity regained during CU and rest, depicted in Figure 10 (c), indicates the approaching EOL, as already observed in the first substudy. The 0.5C/0.5C, 1C/0.37C, and 1C/1C test cases demonstrate a prominent decline shortly before reaching EOL, implying that the earlier reversible behavior turns irreversible. This is expected to result from severe lithium plating triggered by the highly inhomogeneous cell condition, causing pronounced, rapid, irreversible lithium loss. The stripping behavior of these cells, provided in Figure 10 (d), supports this theory, as distinct plateaus are evident for the 1C/0.37C and 1C/1C test cases shortly before reaching the knee point. Thus, it proves the earlier occurrence of lithium plating [28]. Such plateaus are not observable for the 2C/2C test case. However, this does not prove the absence of lithium plating; it only shows the missing recovery of earlier plated lithium. Considering the test termination in cycle 406 (approx. 350 EFC) due to the activation of the CID in conjunction with the other analysis of this particular cell, we still expect lithium plating due to the high charging current and the severe inhomogeneity causing cell failure.
3.4. Supporting Cell Recovery During Cycling
In this section, we focus on methods to actively support cell relaxation during cycling in order to compensate for the triggered inhomogenization effects. For this purpose, we investigate two approaches based on the above findings, further denoted as static and dynamic relaxation. As shown in Figure 11, both methods (green curves) positively impact cell behavior in terms of capacity loss and resistance increase, significantly enhancing the cycle life performance. This becomes particularly clear when comparing them to the 1C/1C case from substudy 2 (red curve), with more than double the completed equivalent full cycles in the best-performing case until a relative capacity of 70 . All test cases exhibit identical cycling procedures and only differ in the relaxation conditions. While the relaxation in the 1C/1C test case was performed at 50 SOC representing the average SOC during cycling, the rest conditions in the recovery cycles were explicitly designed to support cell relaxation.
The first approach focuses on optimizing static relaxation, which has been shown to positively impact cell homogenization and degradation, as presented in Section 3.2. In contrast to the 1C/1C test case, the rest SOC are located in ranges of high potential gradients in the negative electrode to trigger equalization processes in case of local lithiation differences. As evident in Figure 11, the rest SOC at 6 and 56 have a higher beneficial impact on cell behavior than the rest SOC at 23 . This is consistent with all analysis techniques applied in this work. However, the electro-chemical reason for this behavior remains unclear from the data presented and requires further analysis.
The second approach, denoted as dynamic relaxation, is based on a low-current charging sequence instead of resting at a specific SOC, which seems to obtain better results. The idea behind the dynamic relaxation cycle is to pass through different potential regions of the negative electrode in order to provide states with sufficient potential gradients, which trigger lithium redistribution processes in the case of local SOC inhomogeneities. In contrast to the static approach, this is not as sensitive to the precise storage SOC level, which might shift throughout the cycle aging test due to reversible and irreversible capacity loss.
The capacity difference between low and high current discharge, shown in Figure 12 (b), accurately reflects the observed aging behavior. More severely degraded cells exhibit earlier and faster-growing capacity differences. This is in agreement with the extractable charge during cycling, depicted in Figure 12 (a). For the test cases with optimized relaxation, it remains considerably higher throughout the entire test, while it significantly declines in the 1C/1C case without optimized relaxation. This observation suggests that the relaxation cycles effectively suppress the earlier discussed cell inhomogenization, which reduces the lateral lithium flow and better preserves the extractable amount of charge. The behavior of the cell with dynamic relaxation is particularly noteworthy, as it exhibits a negligible capacity difference until approximately 800 EFC and almost no signs of recovered charge during CU and rest up to this test progress, indicating a highly beneficial impact of this method.
As shown in Figure 12 (c), the recovered amounts of charge confirm the previously observed trend. The faster the capacity fades, the faster and more pronounced the recovered charge increases. Once a critical cell condition is reached, the recovered capacity surpasses its peak and rapidly drops. This behavior coincides with the occurrence of the knee point, thus suggesting that reversible effects intensify with progressive cycling and rehomogenization during cycling becomes increasingly incomplete. At this tipping point, the reversible behavior seems to become irreversible and cause subsequent rapid cell failure. The stripping potential analysis, visualized in Figure 12 (d), reveals characteristic plateaus at the end of the cycle aging test, indicating the occurrence of lithium plating in all test cases, which is in alignment with the other substudies. Overall, the analysis demonstrates that the applied recovery cycles effectively reduce the inhomogenization rate and delay the critical tipping point.
3.5. Implications of Cell Inhomogenization and Relaxation on Cycle Life
Summarizing and connecting the findings from the four substudies under diverse impacting factors presented above reveals a characteristic cell behavior and suggests a common specific mechanism influencing cycle life performance. Figure 13 visualizes the correlation of capacity fade, capacity difference, and the amount of recovered capacity during CU and rest. This behavior is evident in nearly all test cases, with variations only in the timing of characteristic events.
Firstly, a high correlation between the capacity loss and the increasing capacity difference is evident from Figure 13 (a) and (b). The capacity difference results from inhomogeneous electrode lithiation and represents a reversible loss of lithium. Consequently, this correlation indicates the strong superimposition of reversible losses and the measured capacity fade. A growing share of reversible losses becomes evident, especially towards the end of the tests, where the capacity difference significantly increases. This implies an aggravating inhomogenization of the negative electrode and is in line with the literature, where increasing inhomogeneity with progressive cycling has been reported [9,21].
Secondly, the capacity differences coincide with the progression of the recovered charge and the relaxed end of discharge voltage during CUs and rest. The aggravated inhomogeneities mentioned above lead to increasing equalization intensities of concentration gradients and the redistribution of lithium within the negative electrode during CUs and rest. This manifests in growing amounts of recovered charge during low-current operation and rest. As the comparison of Figure 13 (b) and (c) shows, the significant increase in the capacity difference occurs around the peak values of this recovered charge, indicating a change in the underlying cell behavior.
Finally, the first capturable signs of lithium stripping occur two or three CU before the last data point. This coincides with the peak in the recovered capacity or shortly before, suggesting lithium plating is triggered once a critical degree of inhomogeneity is surpassed. However, based on the data, only the earliest occurrence of lithium stripping can be identified, proving that lithium plating must have occurred beforehand. The onset of lithium plating, in contrast, cannot be determined.
The 2C/2C test case differs from this characteristic behavior, not showing a drop in and any signs of lithium stripping. Nevertheless, severe lithium plating is assumed in this cell, which would explain the early cell failure after approximately 350 EFC and is in alignment with the high currents applied. Moreover, the DOD test cases of 40 and below don’t evince significant capacity differences, , and indicators of lithium stripping. This supports the previously outlined theory, as it demonstrates that inhomogeneous cell conditions correlate with and precede lithium stripping. However, in these test cases, the cyclic stresses appear to be mild enough to prevent significant inhomogenization, which aligns with earlier findings in the literature [9,16].
This leads to the question of which stress factor influences cell inhomogenization the most. From the data presented in this study, C-rates appear to have the highest impact. However, the data suggests a certain minimum DOD is required to trigger the observed mechanism. This is plausible, as one key process is the EMSI effect, which results from volume changes of the negative electrode and, therefore, is enhanced by increasing cycle depths. However, the data presented is obtained from only a few test cases, which allows for deriving only generic high-level trends. Revealing detailed stress factor impacts and analyzing respective trends, in contrast, requires a comprehensive parameter study, particularly considering various C-rate and DOD combinations. Moreover, further stress factors need to be considered.
Evaluating the investigated recovery methods emphasizes an overall positive impact on cycle life performance and cell homogeneity, particularly with the dynamic strategy. An additional advantage of this procedure is that intermediate low-current charge cycles can easily be integrated into the cycle aging test and provide valuable measurement data, which gives further insights into the cell behavior, e.g., through DVA. Apart from that, resting in the very low SOC range or around the graphite stage II phase transition proves effective. Analogous to the influence of stress factors, it needs to be considered that the data presented is not the result of a parameter study or optimization. The static method could yield better outcomes under optimized conditions, e.g., rest SOC, duration, and temperature. As diffusion and equalization effects follow the Arrhenius correlation, better and faster results could be obtained at elevated temperatures. Consequently, relaxation cycles could be carried out at higher temperatures. Moreover, intermediate charging pulses have been reported to positively impact equalization processes [14,47] and therefore could offer further potential for intermediate cell rehomogenization.
4. Summary and Conclusions
In this study, we assessed the aging characteristics of LIB, particularly focusing on the inhomogenization of the cell during cycling as well as relaxation during CUs and rest. Several cycle aging studies have been conducted, investigating the impact of the test procedure, diverse stress factors, and dedicated recovery cycles. The following key takeaways can be summarized:
- (1)
-
Impact of the test procedure and stress factors on cell inhomogeneities.Continuous cycling leads to the inhomogenization of the lithium distribution within the negative electrode. During CUs, which are commonly performed at low current rates, as well as rest phases, these inhomogeneities partly equalize. Consequently, shortening these cycling interruptions by reducing the CU procedures or eliminating the rest period accelerates cell inhomogenization. This is furthermore influenced by the stress factors applied during cycling, with increasing stress levels supporting cell inhomogenization. High current rates have been found particularly detrimental. No dependency on the cycle depth was observed below 40 DOD. While initially reversible, this inhomogenization progressively promotes permanent degradation in the form of lithium plating. A correlation between increasing cell inhomogeneity, reduced equalization intensity, and lithium plating has been proven shortly before the knee point, followed by immediate cell failure.
- (2)
-
Implications for aging characterization in vehicle applications.A distinctive feature of vehicle applications is the prevalence of frequent and extended intermediate rest phases, combined with relatively short sequences of continuous cycling compared to laboratory tests. This characteristic, on the one hand, leads to marginal cell inhomogenization during operation, as well as to frequent relaxation and equalization during the pauses on the other. Neglecting such conditions in aging tests unintentionally intensifies cell aging, resulting in manipulation and superelevation of cell degradation compared to real-world usage and, consequently, a high likelihood of underestimating the real battery lifetime.
- (3)
-
Dedicated strategies for cell relaxation as a countermeasure.Moreover, our study provides viable insights for optimizing LIB performance for vehicle applications. Regular pauses during operation emerge as a beneficial strategy for preserving cycle life performance over the long term and extending battery lifespan. Even better results were achieved with intermediate low-current charge cycles, which promoted cell homogeneity and doubled the cycle life. Implementing these insights into the design of cycle aging tests holds the potential to enhance their overall reliability by maintaining short test periods.
Looking ahead, future research should focus on a comprehensive understanding of the occurring inhomogenization and relaxation mechanisms. Exploring acceleration methods for intermediate cell relaxation could pave the way for a more realistic and reliable lifetime prognosis. These advancements are pivotal for the ongoing development of battery technology, ensuring sustainable and efficient electric vehicle batteries in the long run.
Author Contributions
Conceptualization, M.S.; methodology, M.S., T.S., J.K., B.S.; software, M.S., T.S., J.K., B.S.; validation, M.S.; formal analysis, M.S.; investigation, M.S., T.S., J.K., B.S.; resources, M.L.; data curation, M.S.; writing—original draft preparation, M.S.; writing—review and editing, M.S., T.S., J.K., B.S., C.G., M.L.; visualization, M.S., C.G.; supervision, C.G., M.L.; project administration, M.S.; funding acquisition, M.L. All authors have read and agreed to the published version of the manuscript. This article is a revised and expanded version of a paper entitled Cell Relaxation during Accelerated Aging Characterization: Impact of Depth of Discharge on the Aging Behavior, which was presented at the 37th International Electric Vehicle Symposium & Exhibition in Seoul, Republic of Korea, April 23 - 26, 2024.
Funding
The authors greatly acknowledge the funding the German Federal Ministry of Education and Research (BMBF) provided within the project “BALd” under grant number 03XP0320B.
Data Availability Statement
We grant everyone unrestricted access to our measurement data presented in the article without any limits. Around 3 GB of measurement data are provided as an open-source, accessible via mediaTUM: https://mediatum.ub.tum.de/1772888
Acknowledgments
We thank Florian Biechl and the staff of the electric lab of the Institute of Automotive Technology for their support in preparing the test setup. Furthermore, we thank Lukas Köning for his support with the measurement data post-processing.
Conflicts of Interest
The authors declare no conflicts of interest.
References
- Braess, H.H.; Seiffert, U. Vieweg Handbuch Kraftfahrzeugtechnik, 7. auflage ed.; Springer Fachmedien Wiesbaden: Wiesbaden, 2021. [Google Scholar] [CrossRef]
- Masias, A.; Marcicki, J.; Paxton, W.A. Opportunities and Challenges of Lithium Ion Batteries in Automotive Applications. ACS Energy Letters 2021, 6, 621–630. [Google Scholar] [CrossRef]
- Gewald, T.; Lienkamp, M. A systematic method for accelerated aging characterization of lithium-Ion cells in automotive applications. Forschung im Ingenieurwesen 2019, 83, 831–841. [Google Scholar] [CrossRef]
- Epding, B.; Rumberg, B.; Jahnke, H.; Stradtmann, I.; Kwade, A. Investigation of significant capacity recovery effects due to long rest periods during high current cyclic aging tests in automotive lithium ion cells and their influence on lifetime. Journal of Energy Storage 2019, 22, 249–256. [Google Scholar] [CrossRef]
- Nobis, C.; Kuhnimhof, T. Mobilität in Deutschland - MiD Ergebnisbericht.
- Kondor, D.; Zhang, H.; Tachet, R.; Santi, P.; Ratti, C. Estimating Savings in Parking Demand Using Shared Vehicles for Home–Work Commuting. IEEE Transactions on Intelligent Transportation Systems 2019, 20, 2903–2912. [Google Scholar] [CrossRef]
- Reichert, M.; Andre, D.; Rösmann, A.; Janssen, P.; Bremes, H.G.; Sauer, D.U.; Passerini, S.; Winter, M. Influence of relaxation time on the lifetime of commercial lithium-ion cells. Journal of Power Sources 2013, 239, 45–53. [Google Scholar] [CrossRef]
- de Hoog, J.; Timmermans, J.M.; Ioan-Stroe, D.; Swierczynski, M.; Jaguemont, J.; Goutam, S.; Omar, N.; van Mierlo, J.; van den Bossche, P. Combined cycling and calendar capacity fade modeling of a Nickel-Manganese-Cobalt Oxide Cell with real-life profile validation. Applied Energy 2017, 200, 47–61. [Google Scholar] [CrossRef]
- Morales Torricos, P.; Endisch, C.; Lewerenz, M. Apparent Aging during Accelerated Cycling Aging Test of Cylindrical Silicon Containing Li-Ion Cells. Batteries 2023, 9. [Google Scholar] [CrossRef]
- Vetter, J.; Novák, P.; Wagner, M.R.; Veit, C.; Möller, K.C.; Besenhard, J.O.; Winter, M.; Wohlfahrt-Mehrens, M.; Vogler, C.; Hammouche, A. Ageing mechanisms in lithium-ion batteries. Journal of Power Sources 2005, 147, 269–281. [Google Scholar] [CrossRef]
- Paarmann, S.; Schreiber, M.; Chahbaz, A.; Hildenbrand, F.; Stahl, G.; Rogge, M.; Dechent, P.; Queisser, O.; Frankl, S.D.; Morales Torricos, P.; et al. Short–Term Tests, Long–Term Predictions – Accelerating Ageing Characterisation of Lithium–Ion Batteries. Batteries & Supercaps 2024, 7. [Google Scholar] [CrossRef]
- Rogge, M.; Jossen, A. Path–Dependent Ageing of Li–Ion Batteries and Implications on the Ageing Assessment of Accelerated Ageing Tests. Batteries & Supercaps. [CrossRef]
- Chahbaz, A.; Luo, Y.; Stahl, G.; Ditler, H.; Jaumann, T.; Glinka, M.; Lingen, C.; Sauer, D.U.; Li, W. Pressure–Induced Capacity Recovery and Performance Enhancements in LTO/NMC–LCO Batteries. Advanced Functional Materials 2024. [Google Scholar] [CrossRef]
- Schreiber, M.; Lin, Y.; Sommer, A.; Wassiliadis, N.; Morales Torricos, P.; Rogge, M.; Lewerenz, M.; Grosu, C.; Endisch, C.; Jossen, A.; Apparent, vs.; et al. Apparent vs. True Battery Aging: Impact of Various Load Characteristics on Accelerated Aging Tests 2025. [CrossRef]
- Lewerenz, M.; Dechent, P.; Sauer, D.U. Investigation of capacity recovery during rest period at different states-of-charge after cycle life test for prismatic Li(Ni1/3Mn1/3Co1/3)O2-graphite cells. Journal of Energy Storage 2019, 21, 680–690. [Google Scholar] [CrossRef]
- Lewerenz, M.; Sauer, D.U. Evaluation of cyclic aging tests of prismatic automotive LiNiMnCoO2-Graphite cells considering influence of homogeneity and anode overhang. Journal of Energy Storage 2018, 18, 421–434. [Google Scholar] [CrossRef]
- Fath, J.P.; Alsheimer, L.; Storch, M.; Stadler, J.; Bandlow, J.; Hahn, S.; Riedel, R.; Wetzel, T. The influence of the anode overhang effect on the capacity of lithium-ion cells – a 0D-modeling approach. Journal of Energy Storage 2020, 29, 101344. [Google Scholar] [CrossRef]
- Käbitz, S.; Gerschler, J.B.; Ecker, M.; Yurdagel, Y.; Emmermacher, B.; André, D.; Mitsch, T.; Sauer, D.U. Cycle and calendar life study of a graphite|LiNi1/3Mn1/3Co1/3O2 Li-ion high energy system. Part A: Full cell characterization. Journal of Power Sources 2013, 239, 572–583. [Google Scholar] [CrossRef]
- Solchenbach, S.; Tacconis, C.; Gomez Martin, A.; Peters, V.; Wallisch, L.; Stanke, A.; Hofer, J.; Renz, D.; Lewerich, B.; Bauer, G.; et al. Electrolyte motion induced salt inhomogeneity – a novel aging mechanism in large-format lithium-ion cells. Energy & Environmental Science 2024. [Google Scholar] [CrossRef]
- Obrovac, M.N.; Krause, L.J. Reversible Cycling of Crystalline Silicon Powder. Journal of The Electrochemical Society 2007, 154, A103. [Google Scholar] [CrossRef]
- Lewerenz, M.; Warnecke, A.; Sauer, D.U. Introduction of capacity difference analysis (CDA) for analyzing lateral lithium-ion flow to determine the state of covering layer evolution. Journal of Power Sources 2017, 354, 157–166. [Google Scholar] [CrossRef]
- Spingler, F.B.; Naumann, M.; Jossen, A. Capacity Recovery Effect in Commercial LiFePO4 / Graphite Cells. Journal of The Electrochemical Society 2020, 167, 040526. [Google Scholar] [CrossRef]
- Stadler, J.; Groch, T.K.; García, M.; Storch, M.; Fath, J.; Ecker, M.; Latz, A. Comprehensive analysis of lithium-ion cells and their aging trajectory toward nonlinear aging. Journal of Energy Storage 2023, 65, 107247. [Google Scholar] [CrossRef]
- Hogrefe, C.; Paul, N.; Boveleth, L.; Bolsinger, M.; Flügel, M.; Danner, T.; Latz, A.; Gilles, R.; Knoblauch, V.; Wohlfahrt-Mehrens, M.; et al. Lithium Redistribution Mechanism within Silicon-Graphite Electrodes: Multi-Method Approach and Method Validation. Journal of The Electrochemical Society 2024, 171, 070503. [Google Scholar] [CrossRef]
- Fuller, T.F.; Doyle, M.; Newman, J. Relaxation Phenomena in Lithium–Ion–Insertion Cells. Journal of The Electrochemical Society 1994, 141, 982–990. [Google Scholar] [CrossRef]
- Berhaut, C.L.; Mirolo, M.; Dominguez, D.Z.; Martens, I.; Pouget, S.; Herlin-Boime, N.; Chandesris, M.; Tardif, S.; Drnec, J.; Lyonnard, S. Charge Dynamics Induced by Lithiation Heterogeneity in Silicon–Graphite Composite Anodes. Advanced Energy Materials 2023, 13. [Google Scholar] [CrossRef]
- Kindermann, F.M.; Noel, A.; Erhard, S.V.; Jossen, A. Long-term equalization effects in Li-ion batteries due to local state of charge inhomogeneities and their impact on impedance measurements. Electrochimica Acta 2015, 185, 107–116. [Google Scholar] [CrossRef]
- von Lüders, C.; Zinth, V.; Erhard, S.V.; Osswald, P.J.; Hofmann, M.; Gilles, R.; Jossen, A. Lithium plating in lithium-ion batteries investigated by voltage relaxation and in situ neutron diffraction. Journal of Power Sources 2017, 342, 17–23. [Google Scholar] [CrossRef]
- Wilhelm, J.; Seidlmayer, S.; Keil, P.; Schuster, J.; Kriele, A.; Gilles, R.; Jossen, A. Cycling capacity recovery effect: A coulombic efficiency and post-mortem study. Journal of Power Sources 2017, 365, 327–338. [Google Scholar] [CrossRef]
- Farmann, A.; Sauer, D.U. A study on the dependency of the open-circuit voltage on temperature and actual aging state of lithium-ion batteries. Journal of Power Sources 2017, 347, 1–13. [Google Scholar] [CrossRef]
- Yao, K.P.C.; Okasinski, J.S.; Kalaga, K.; Almer, J.D.; Abraham, D.P. Operando Quantification of (De)Lithiation Behavior of Silicon–Graphite Blended Electrodes for Lithium–Ion Batteries. Advanced Energy Materials 2019, 9. [Google Scholar] [CrossRef]
- Richter, K.; Waldmann, T.; Paul, N.; Jobst, N.; Scurtu, R.G.; Hofmann, M.; Gilles, R.; Wohlfahrt-Mehrens, M. Low-Temperature Charging and Aging Mechanisms of Si/C Composite Anodes in Li-Ion Batteries: An Operando Neutron Scattering Study. ChemSusChem 2020, 13, 529–538. [Google Scholar] [CrossRef]
- Osswald, P.J.; Erhard, S.V.; Rheinfeld, A.; Rieger, B.; Hoster, H.E.; Jossen, A. Temperature dependency of state of charge inhomogeneities and their equalization in cylindrical lithium-ion cells. Journal of Power Sources 2016, 329, 546–552. [Google Scholar] [CrossRef]
- Schreiber, M.; Steiner, T.; Lienkamp, M. Cell Relaxation during Accelerated Aging Characterization: Impact of Depth of Discharge on the Aging Behavior. In EVS37—International Electric Vehicle Symposium and Exhibition (Seoul, Republic of Korea); 2024.
- Samsung SDI Co., Ltd. . Data Sheet - INR21700-50G.
- Kim, T.; Park, S.; Bae, J.; Jung, D.; Cheon, H.; Lee, W.G.; Choi, Y. Diagnosis of high-Ni NCA/Gr-Si cells before rapid capacity drop by monitoring the heterogeneous degradation. Materials horizons 2023. [Google Scholar] [CrossRef]
- Bonakdarpour, A.; Stoševski, I.; Tiwari, A.; Smith, S.R.; Way, B.M.; Wilkinson, D.P. Impact of Electrolyte Volume on the Cycling Performance and Impedance Growth of 18650 Li-ion Cells. Journal of The Electrochemical Society 2024, 171, 020543. [Google Scholar] [CrossRef]
- Li, X.; Colclasure, A.M.; Finegan, D.P.; Ren, D.; Shi, Y.; Feng, X.; Cao, L.; Yang, Y.; Smith, K. Degradation mechanisms of high capacity 18650 cells containing Si-graphite anode and nickel-rich NMC cathode. Electrochimica Acta 2019, 297, 1109–1120. [Google Scholar] [CrossRef]
- Harlow, J.E.; Glazier, S.L.; Li, J.; Dahn, J.R. Use of Asymmetric Average Charge- and Average Discharge- Voltages as an Indicator of the Onset of Unwanted Lithium Deposition in Lithium-Ion Cells. Journal of The Electrochemical Society 2018, 165, A3595–A3601. [Google Scholar] [CrossRef]
- Cheng, J.H.; Harlow, J.E.; Johnson, M.B.; Gauthier, R.; Dahn, J.R. Effect of Duty Cycle on the Lifetime of Single Crystal LiNi 0.5 Mn 0.3 Co 0.2 O 2 /Graphite Lithium-Ion Cells. Journal of The Electrochemical Society 2020, 167, 130529. [Google Scholar] [CrossRef]
- Maheshwari, A.; Heck, M.; Santarelli, M. Cycle aging studies of lithium nickel manganese cobalt oxide-based batteries using electrochemical impedance spectroscopy. Electrochimica Acta 2018, 273, 335–348. [Google Scholar] [CrossRef]
- Laszczynski, N.; Solchenbach, S.; Gasteiger, H.A.; Lucht, B.L. Understanding Electrolyte Decomposition of Graphite/NCM811 Cells at Elevated Operating Voltage. Journal of The Electrochemical Society 2019, 166, A1853–A1859. [Google Scholar] [CrossRef]
- Broussely, M.; Biensan, P.; Bonhomme, F.; Blanchard, P.; Herreyre, S.; Nechev, K.; Staniewicz, R.J. Main aging mechanisms in Li ion batteries. Journal of Power Sources 2005, 146, 90–96. [Google Scholar] [CrossRef]
- Harlow, J.E.; Ma, X.; Li, J.; Logan, E.; Liu, Y.; Zhang, N.; Ma, L.; Glazier, S.L.; Cormier, M.M.E.; Genovese, M.; et al. A Wide Range of Testing Results on an Excellent Lithium-Ion Cell Chemistry to be used as Benchmarks for New Battery Technologies. Journal of The Electrochemical Society 2019, 166, A3031–A3044. [Google Scholar] [CrossRef]
- Schreiber, M.; Abo Gamra, K.; Bilfinger, P.; Teichert, O.; Schneider, J.; Kröger, T.; Wassiliadis, N.; Ank, M.; Rogge, M.; Schöberl, J.; et al. Understanding lithium-ion battery degradation in vehicle applications: Insights from realistic and accelerated aging tests using Volkswagen ID.3 pouch cells. Journal of Energy Storage 2025, 112, 115357. [Google Scholar] [CrossRef]
- Laresgoiti, I.; Käbitz, S.; Ecker, M.; Sauer, D.U. Modeling mechanical degradation in lithium ion batteries during cycling: Solid electrolyte interphase fracture. Journal of Power Sources 2015, 300, 112–122. [Google Scholar] [CrossRef]
- Keil, P.; Jossen, A. Impact of Dynamic Driving Loads and Regenerative Braking on the Aging of Lithium-Ion Batteries in Electric Vehicles. Journal of The Electrochemical Society 2017, 164, A3081–A3092. [Google Scholar] [CrossRef]
Figure 1.
General testing scheme of the aging study. The pre-rest and post-rest CU procedures are identical for all test cases. The cycling interruption, DODs, and C-rates during cycling are varied in the respective substudies 1-3. During the rest phase, the storage SOC is set to the average SOC of the preceding cycling sequence to minimize the impact of the negative electrode’s overhang, except for substudy 4, where optimized relaxation methods are investigated. This figure has been adapted from our earlier publication [34].
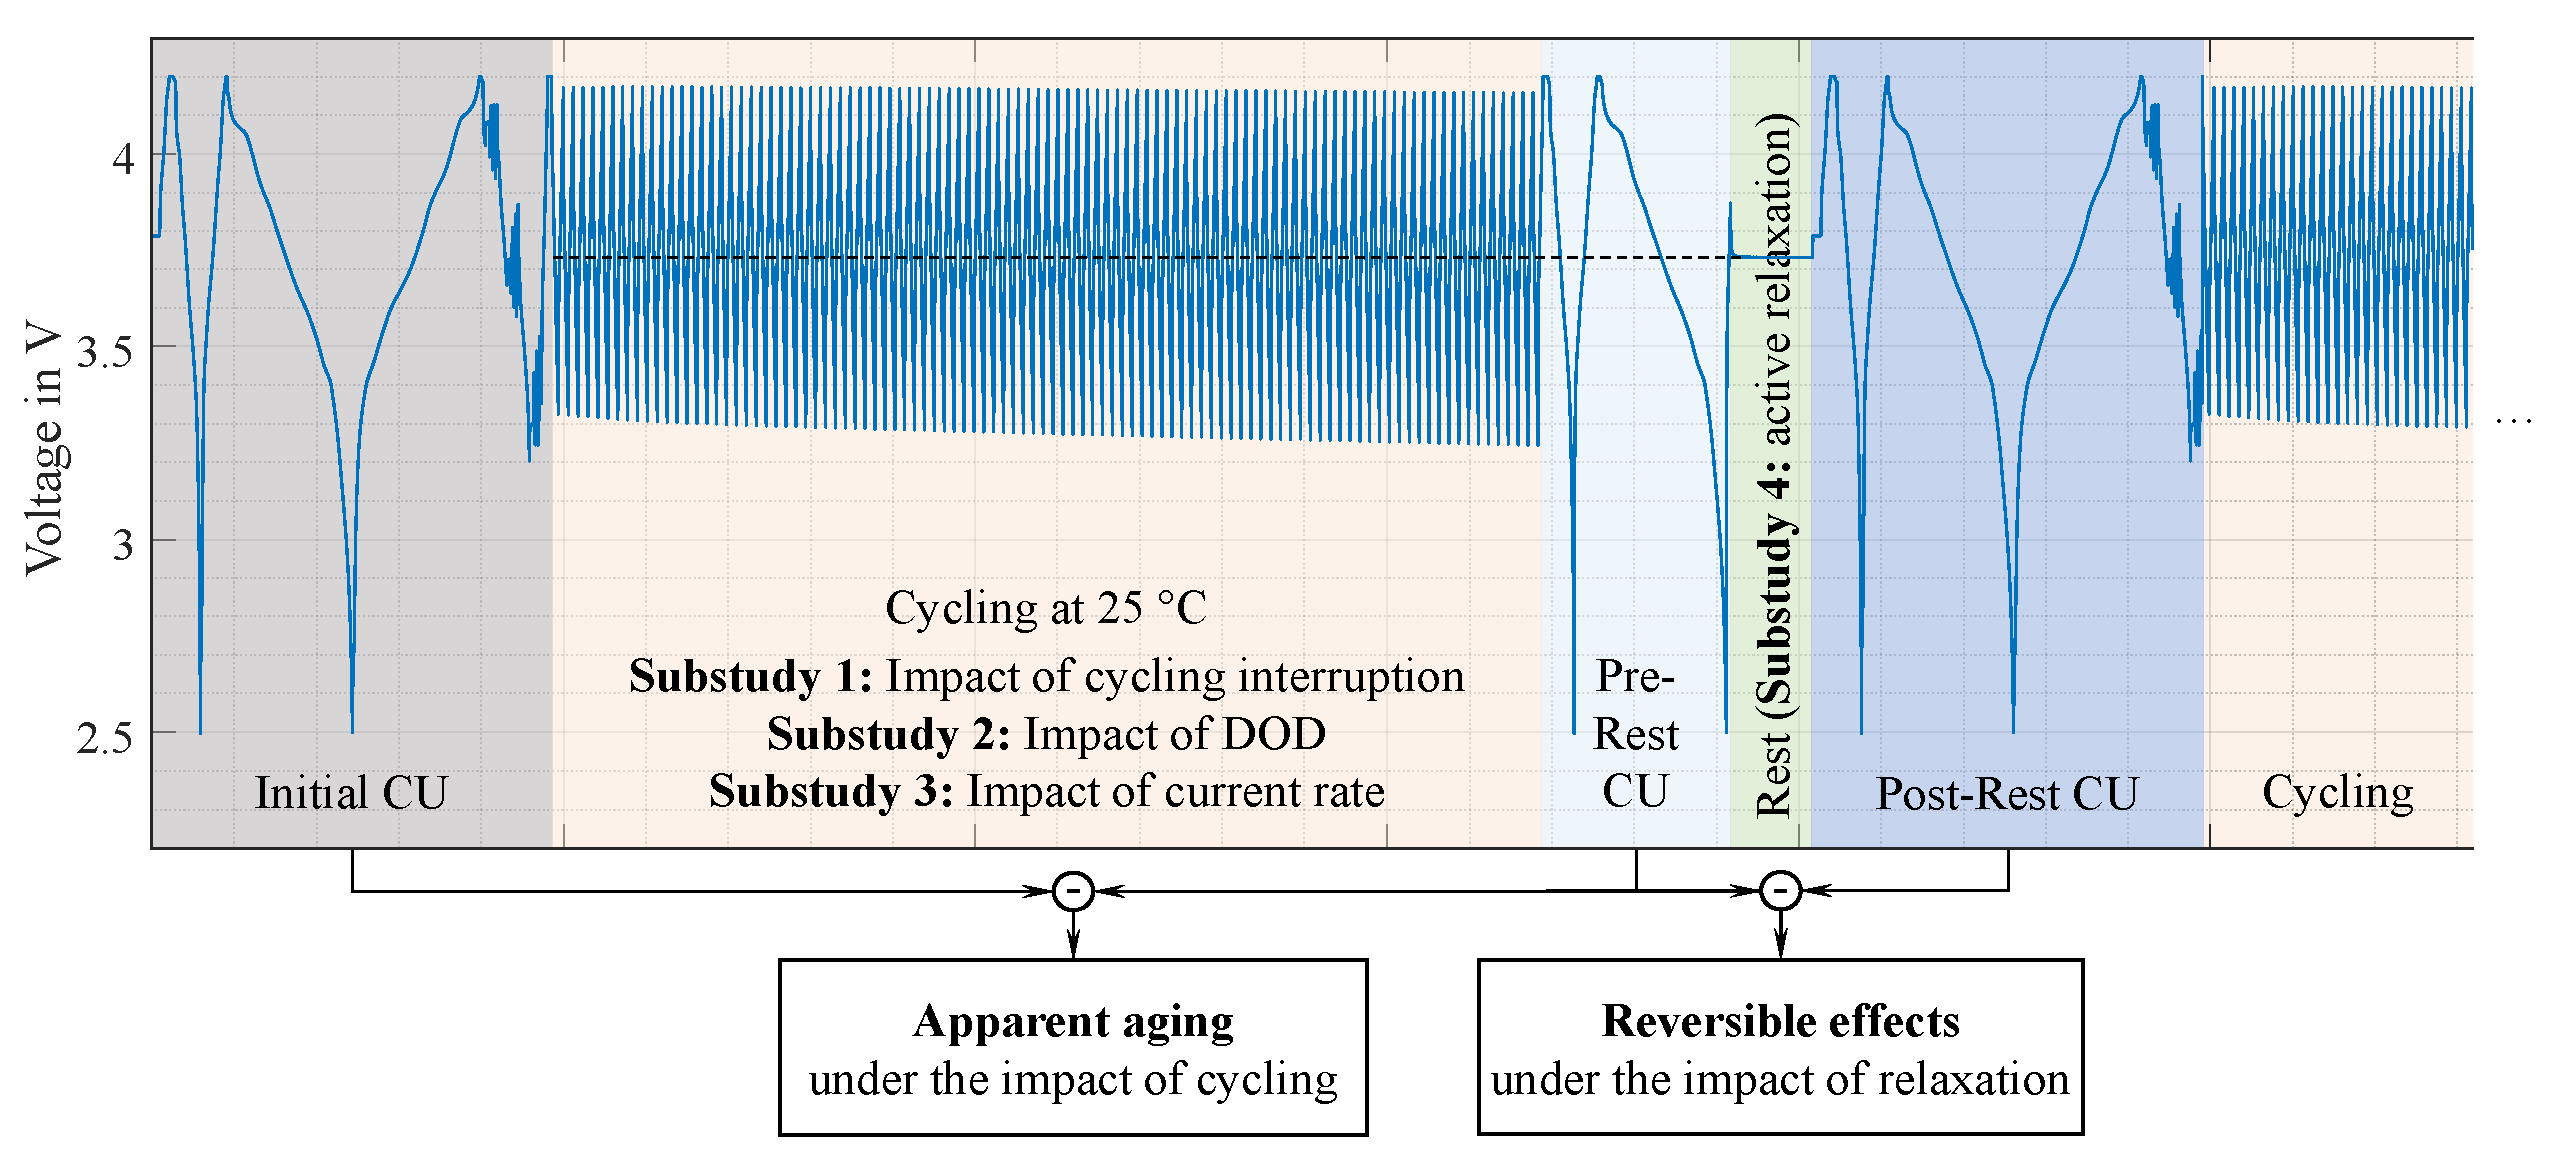
Figure 2.
Test design of Substudy 1: The initial and EOL CU are identical across all test cases, and cycling is uniformly performed at 1C/1C within the 20 to 100 SOC range.
Figure 2.
Test design of Substudy 1: The initial and EOL CU are identical across all test cases, and cycling is uniformly performed at 1C/1C within the 20 to 100 SOC range.
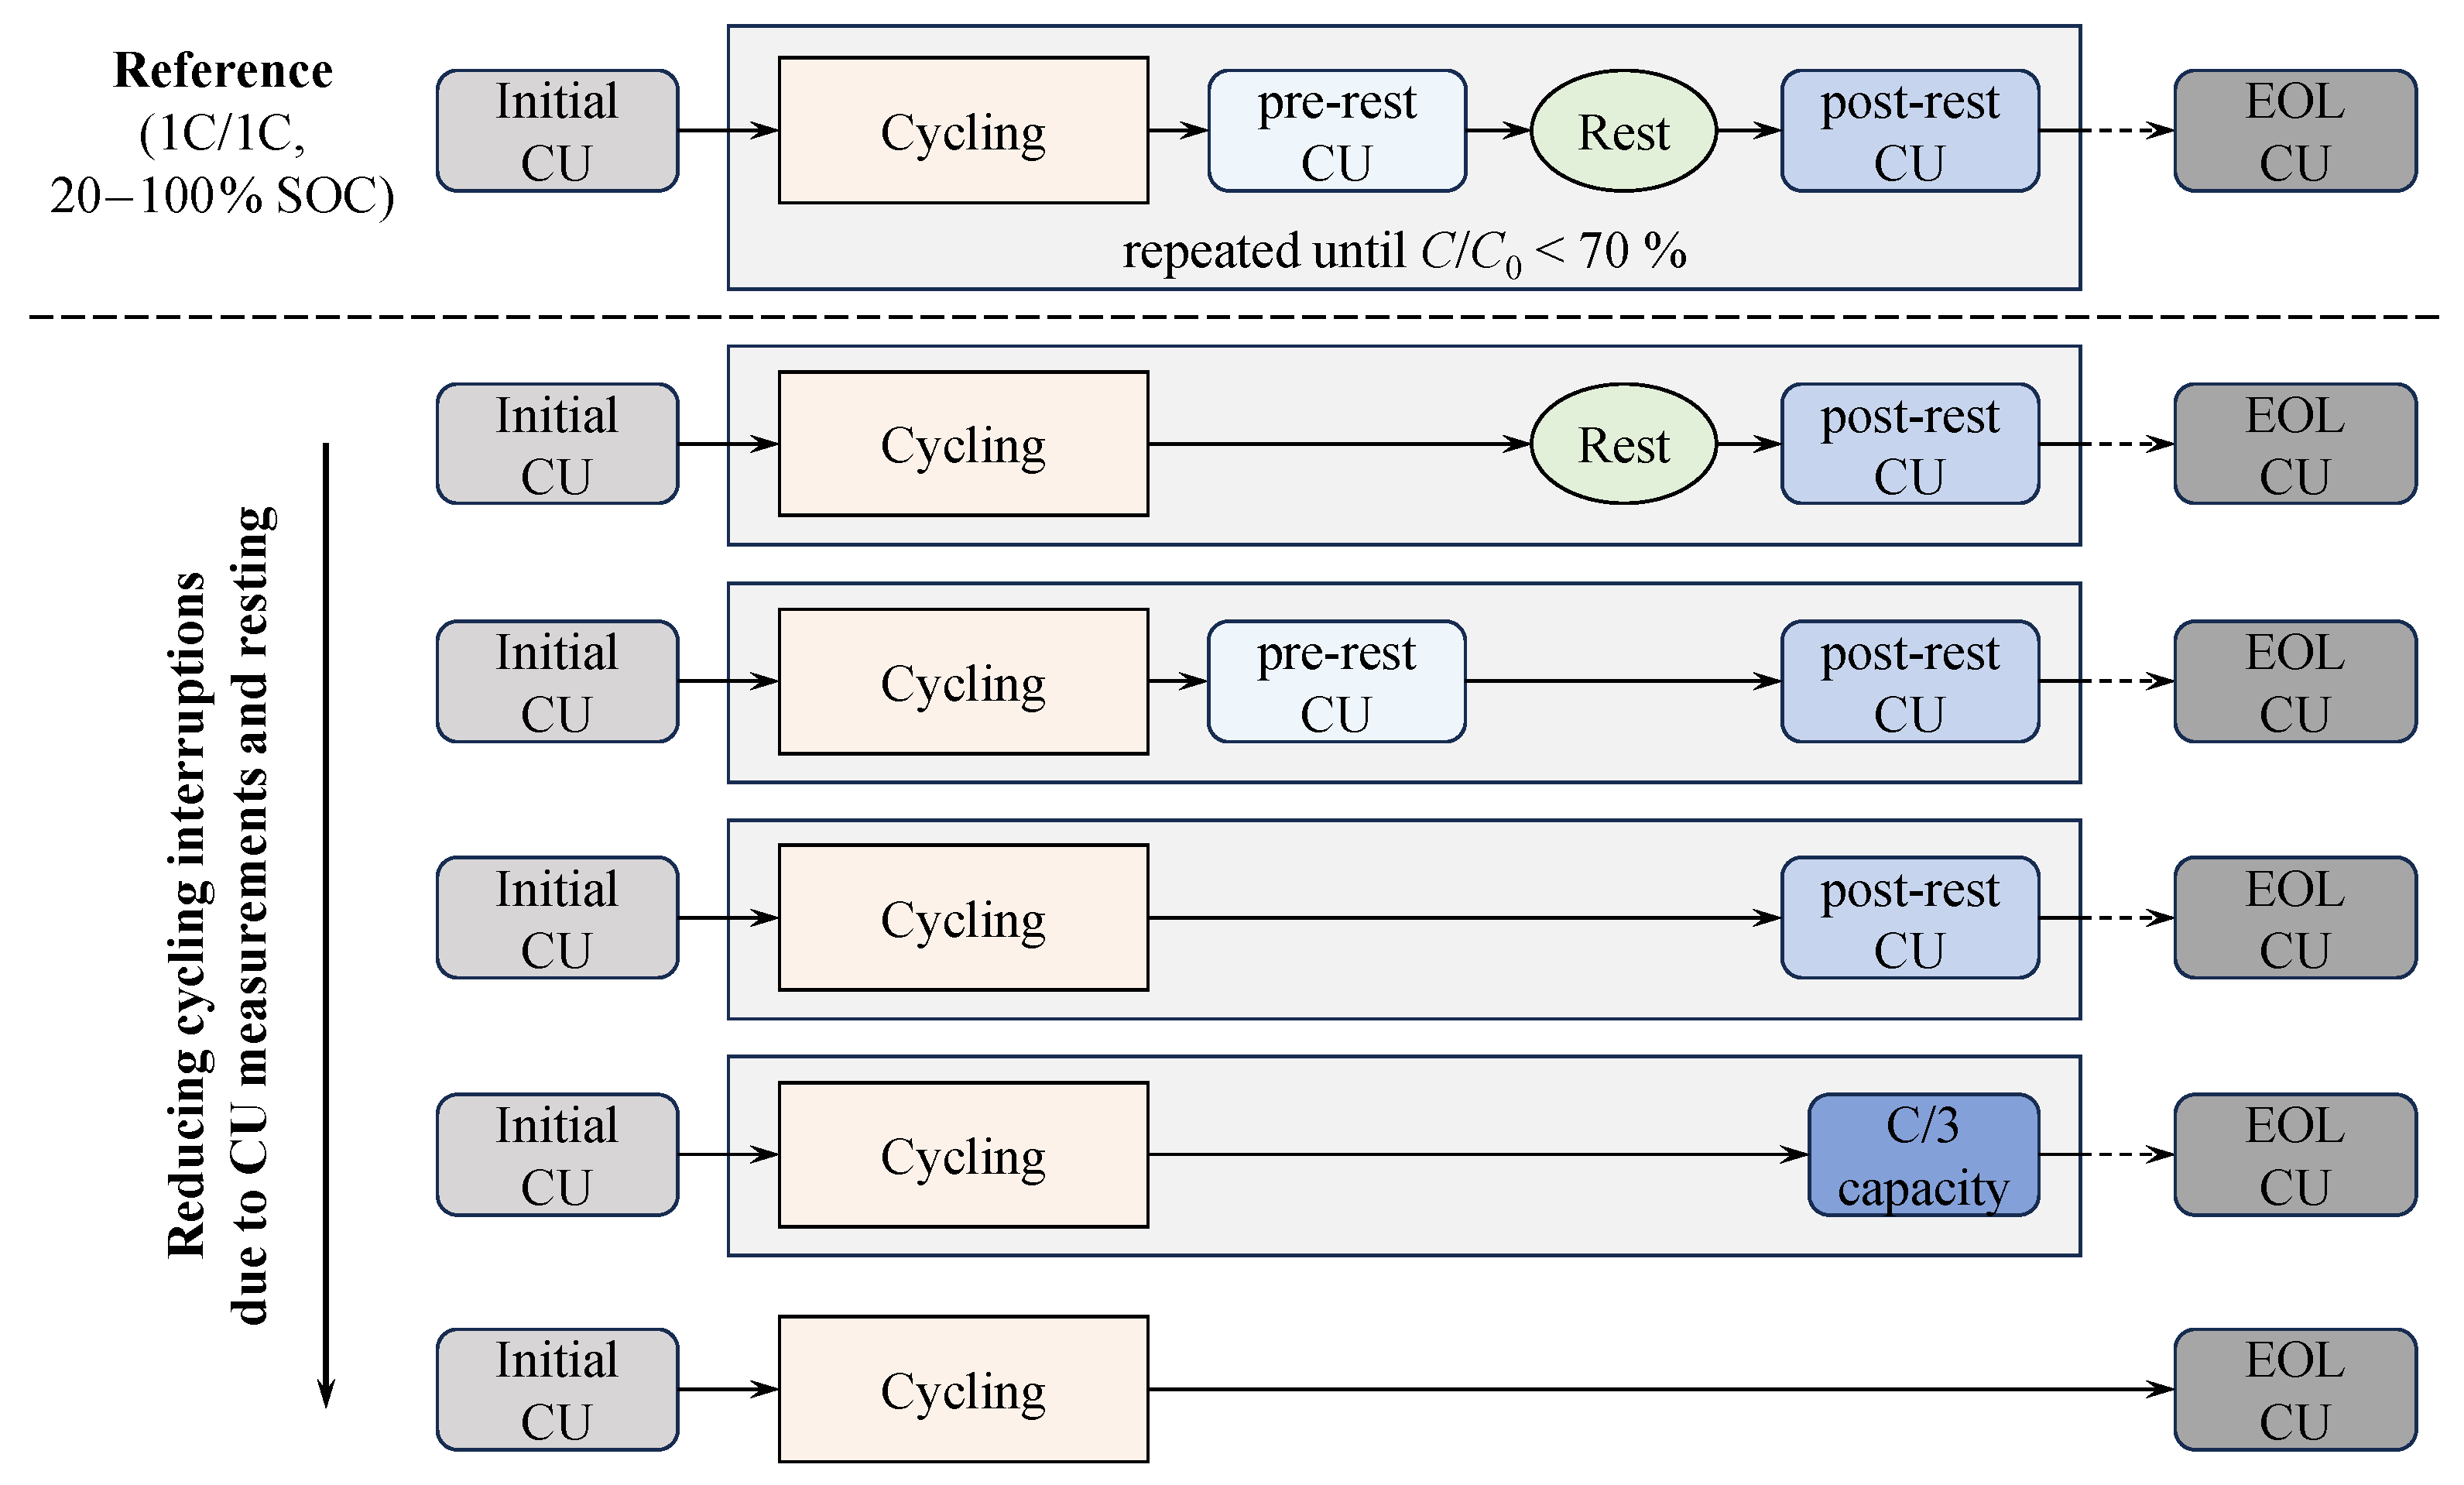
Figure 3.
Test design of Substudies 2, 3, and 4 in relation to the cell DV and the characteristic lithiation stages of the positive and negative electrode: In Substudy 2, the SOC range is varied, and the current rates remain fixed at 1C/1C, while in Substudy 3, the SOC range is kept constant at 0 to 100, and the current rates are modulated. Substudy 4 comprises three static relaxation test cases with idle phases at the SOC levels indicated by the green dashed lines, as well as one dynamic test case that includes a low-current charge cycle from 0 to 100 SOC. This figure has been adapted from our earlier publication [34].
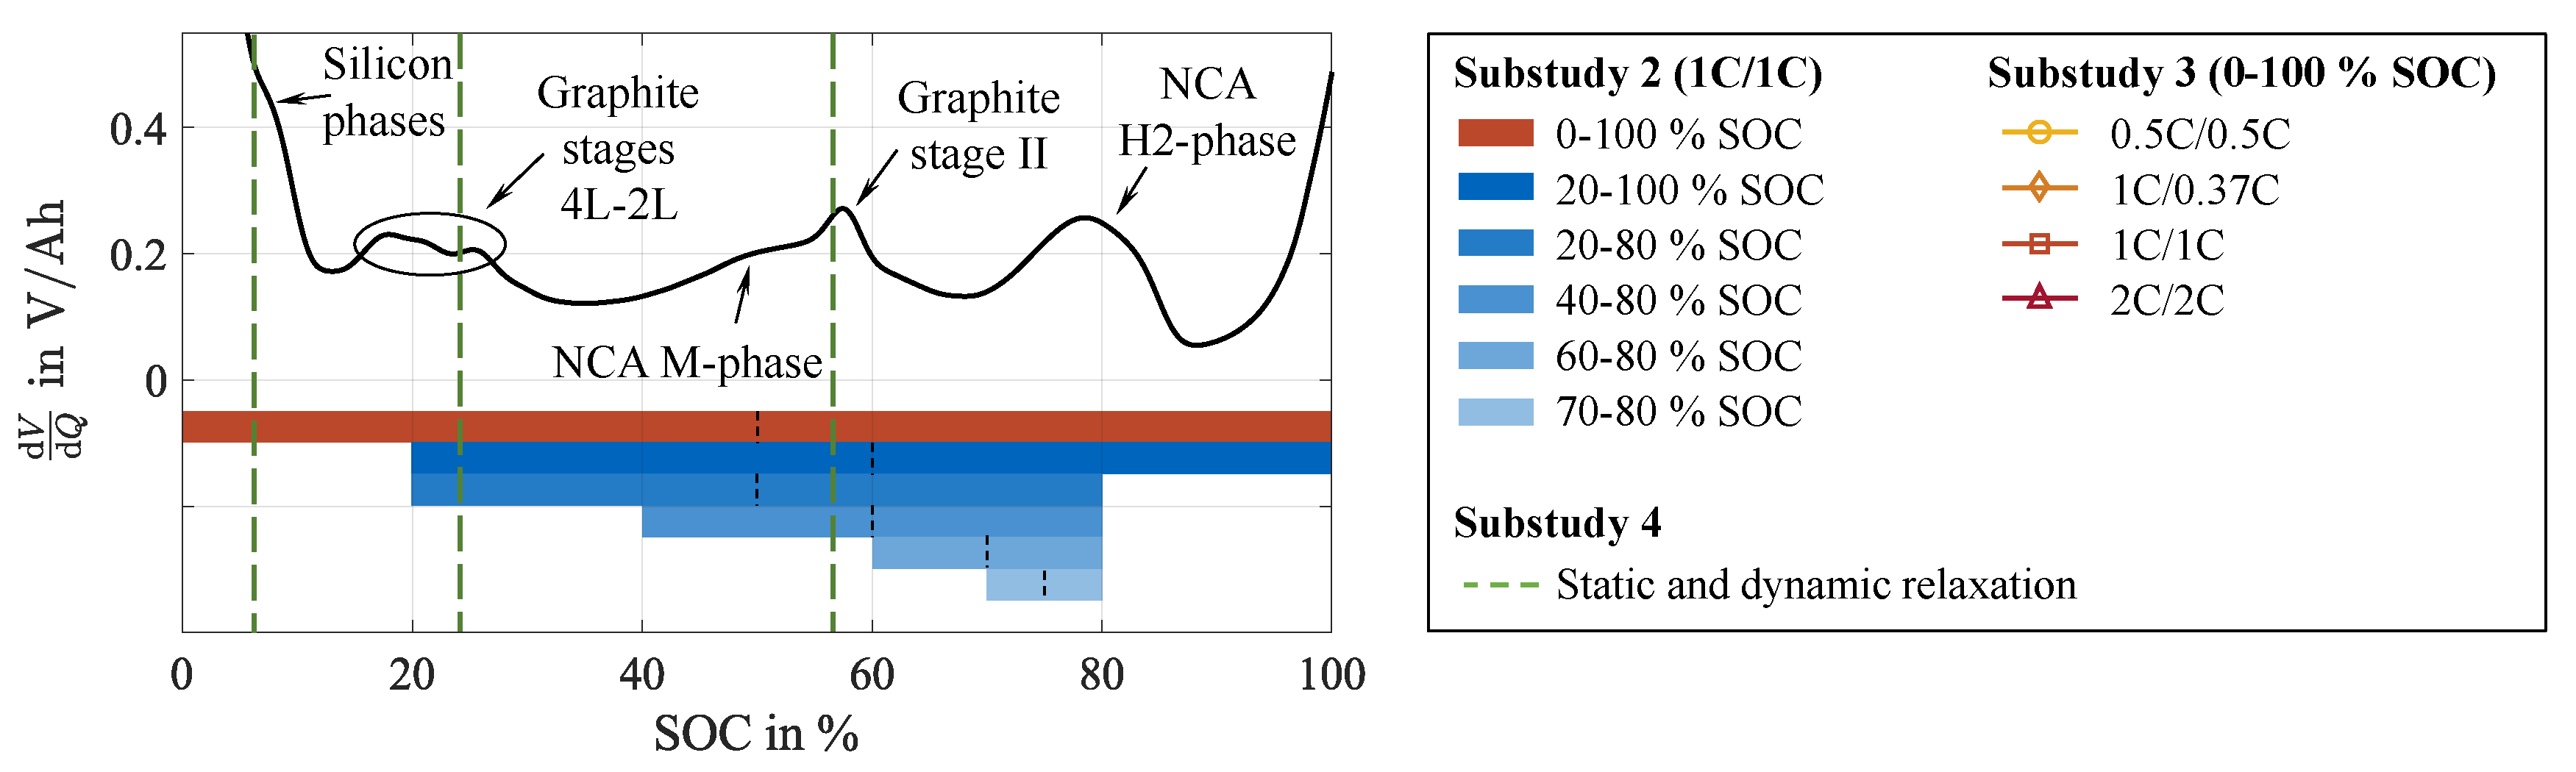
Figure 4.
Formation of reversible capacity losses during cycling: relative capacity measured before and after the ten-hour rest (a), capacity differences regained during CUs and rest (b). It has to be noted that the cell failed only a few cycles after the last CU point presented, indicated by the † symbol. This figure has been adapted from our earlier publication [34].
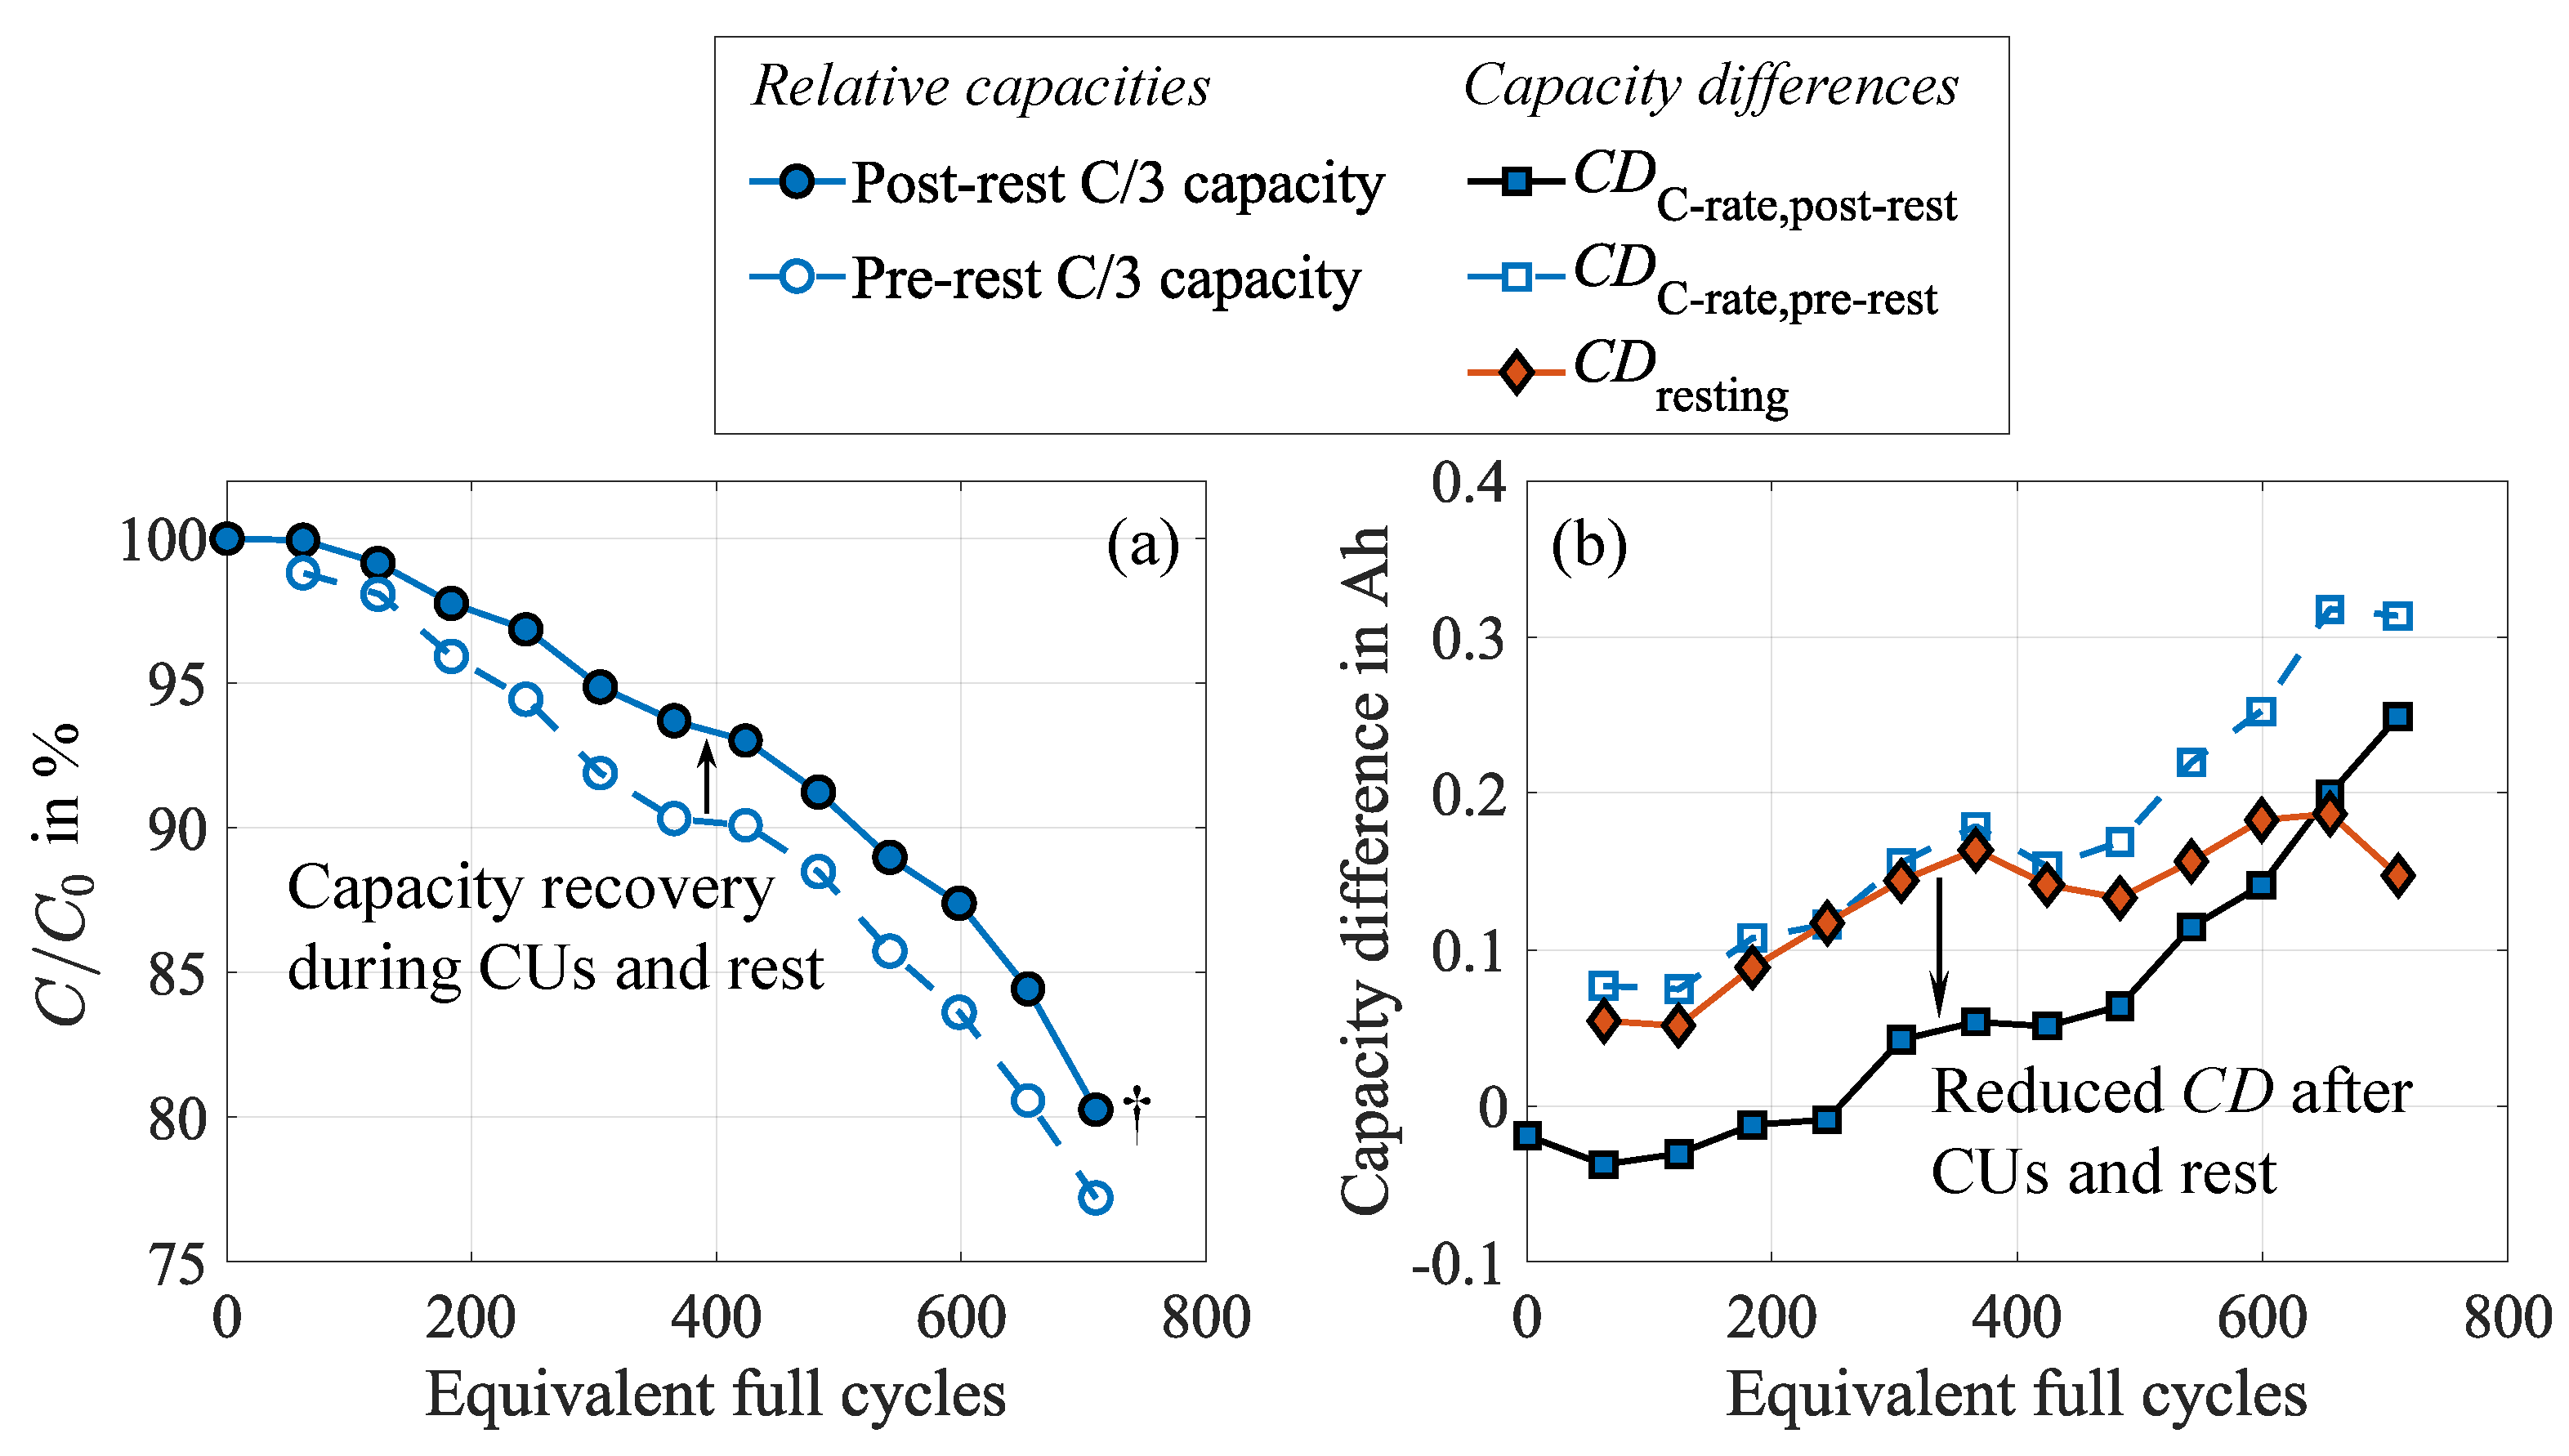
Figure 5.
Alterations in the end of discharge voltage throughout the cycle aging test: Shift of during cycling, CU, and rest (a). during two specific cycle intervals, normalized to the respective initial value of each interval, at an early aging state from cycle 1 to 100 (c) and an advanced aging state from cycle 901 to 1000 (d). Correlation between end of discharge voltage relaxation and capacity recovery during CU and rest (b). This figure has been adapted from our earlier publication [34].
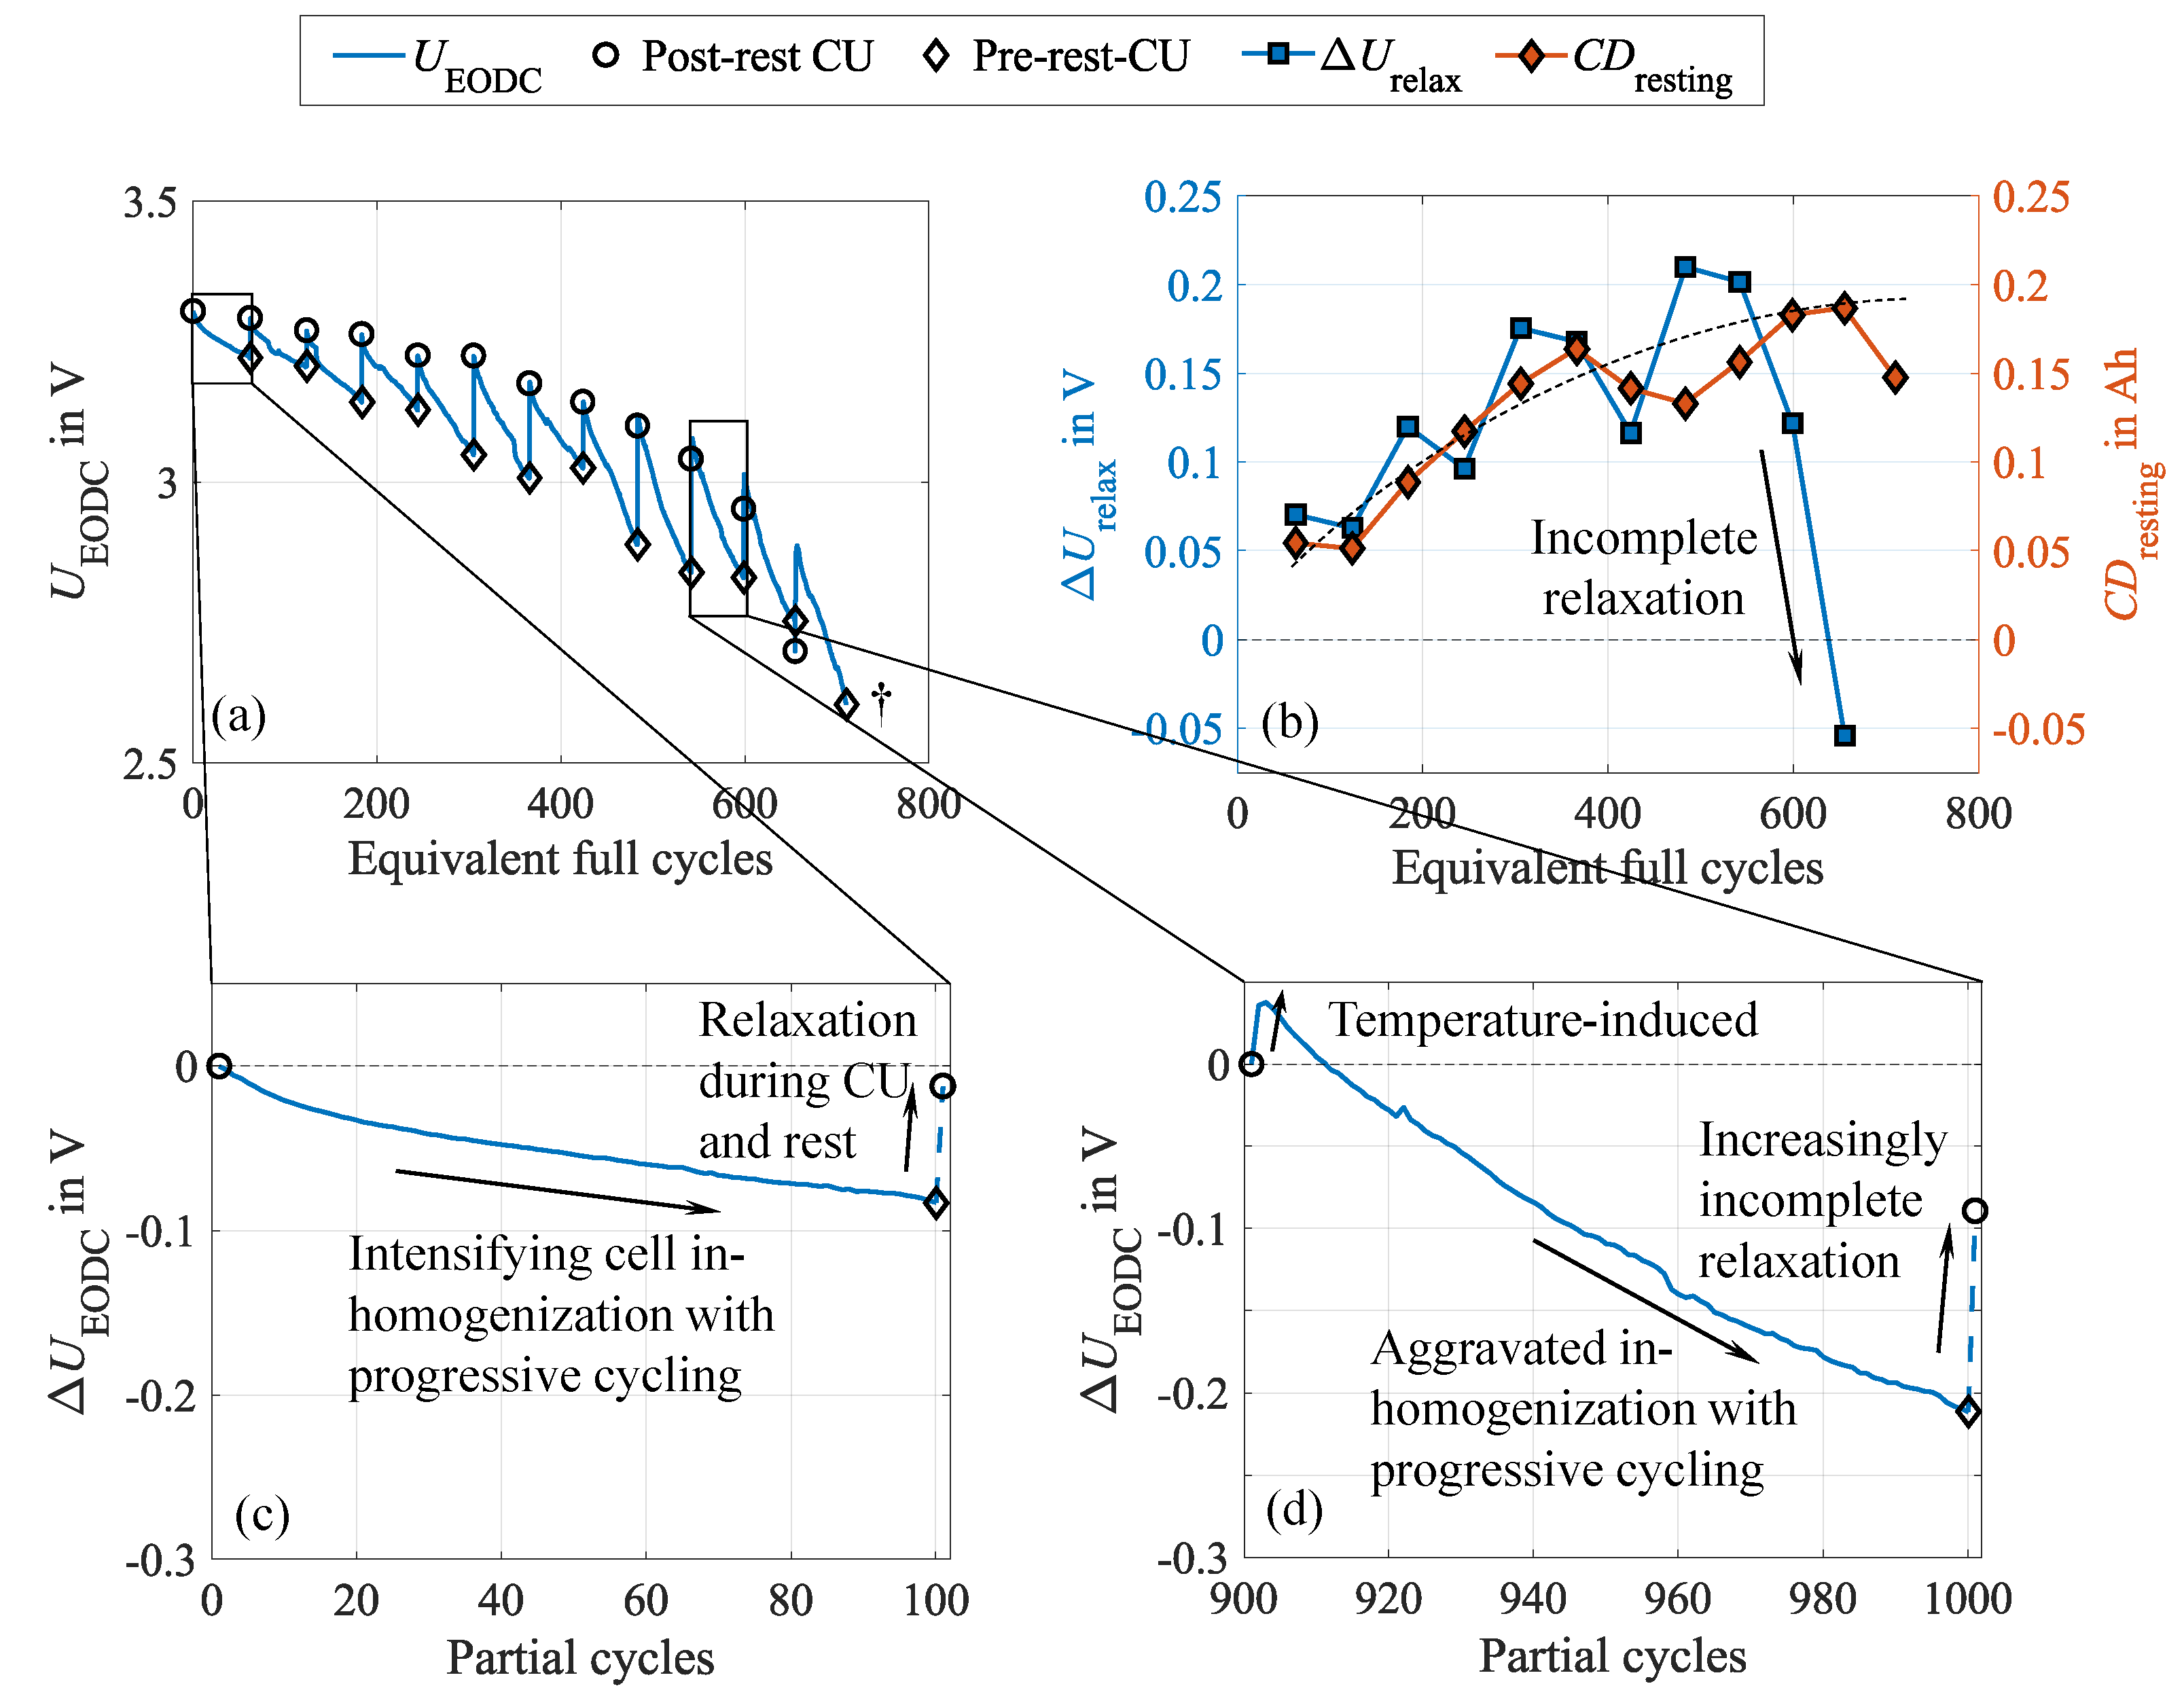
Figure 6.
Impact of reduced cycling interruption through CUs and rest on the cycle life performance and inhomogenization behavior: 1 omission of the pre-rest CU, 2 omission of the rest phase, 3 omission of the pre-rest CU and rest phase, 4 omission of all CU elements and rest phases except for the C/3 discharge measurement, 5 omission of all intermediate cycling interruptions, depicted by means of the relative capacity (a). Progression of over cycles; the asterisk markers indicate voltage relaxation due to unintended rest phases caused by a power outage (b). as an indicator for cell inhomogenization (c), and voltage relaxation during CUs and rest (d).
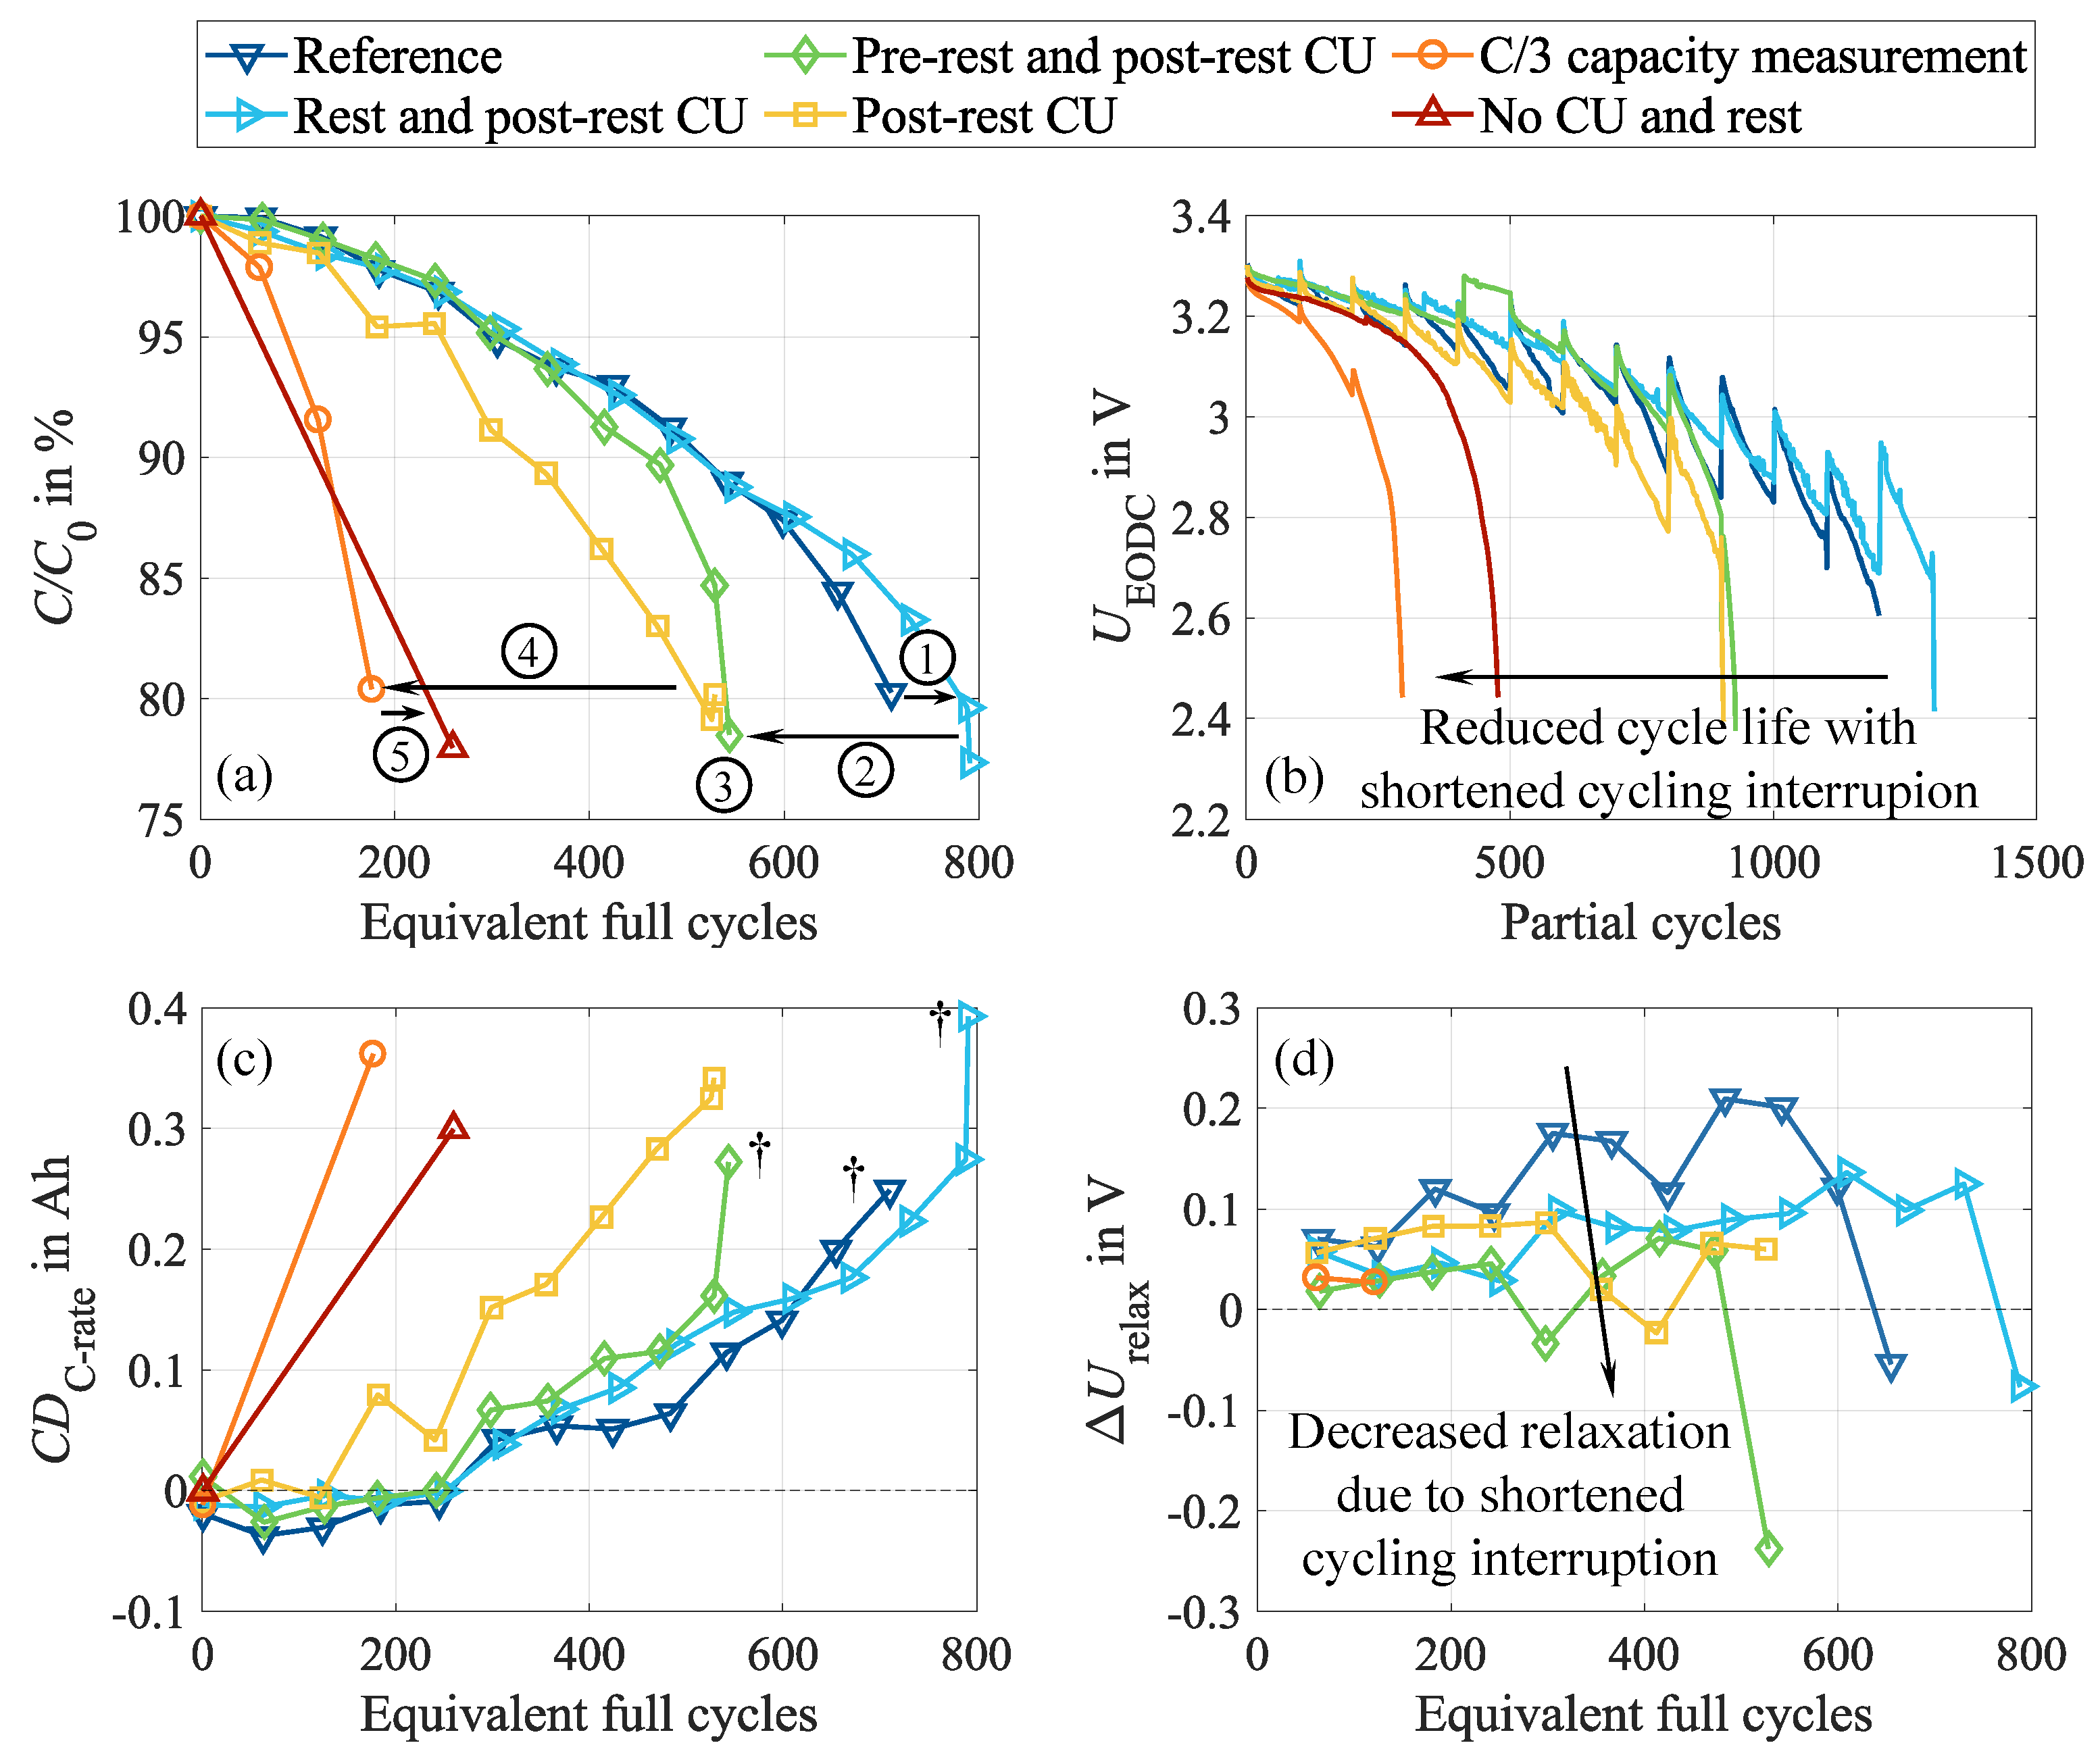
Figure 7.
Measurable cell deterioration, depending on the applied DOD in terms of capacity loss (a) and resistance increase (b). This figure has been adapted from our earlier publication [34].
Figure 7.
Measurable cell deterioration, depending on the applied DOD in terms of capacity loss (a) and resistance increase (b). This figure has been adapted from our earlier publication [34].
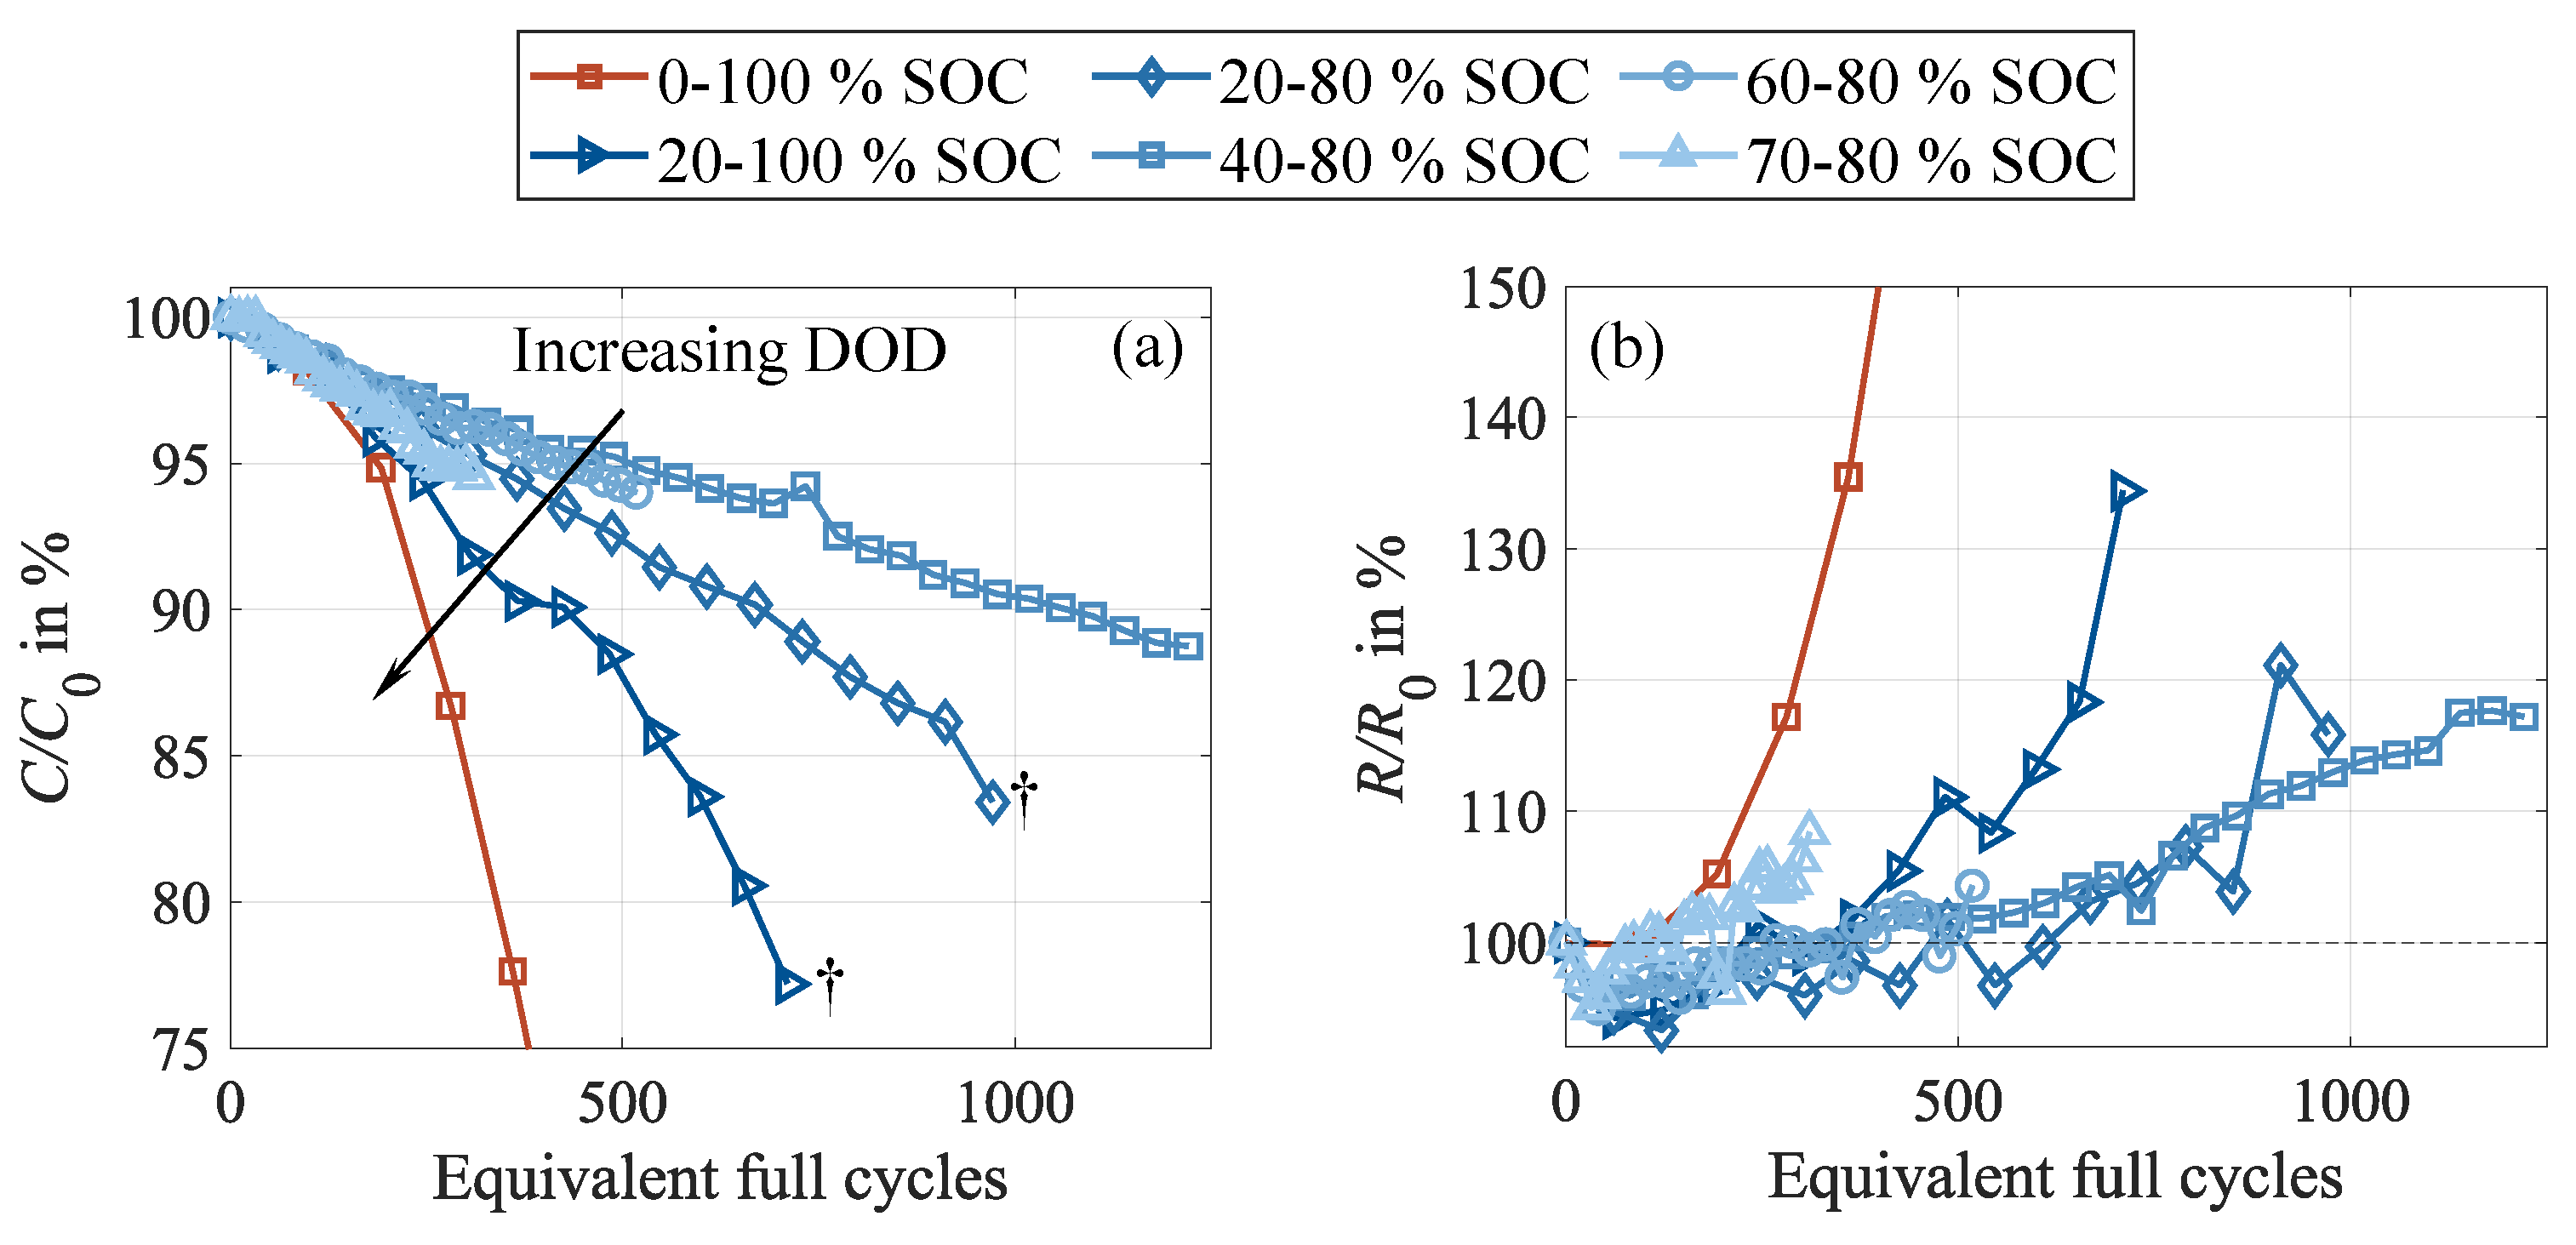
Figure 8.
Underlying cell behavior under the impact of the DOD: representing the capacity recovery (a), end of discharge voltage during cycling indicating cell inhomogenization (b), as a measure for cell relaxation and equalization of inhomogeneities (c), lithium stripping analysis proving the occurrence of lithium plating at the end of the experiment (d). This figure has been adapted from our earlier publication [34].
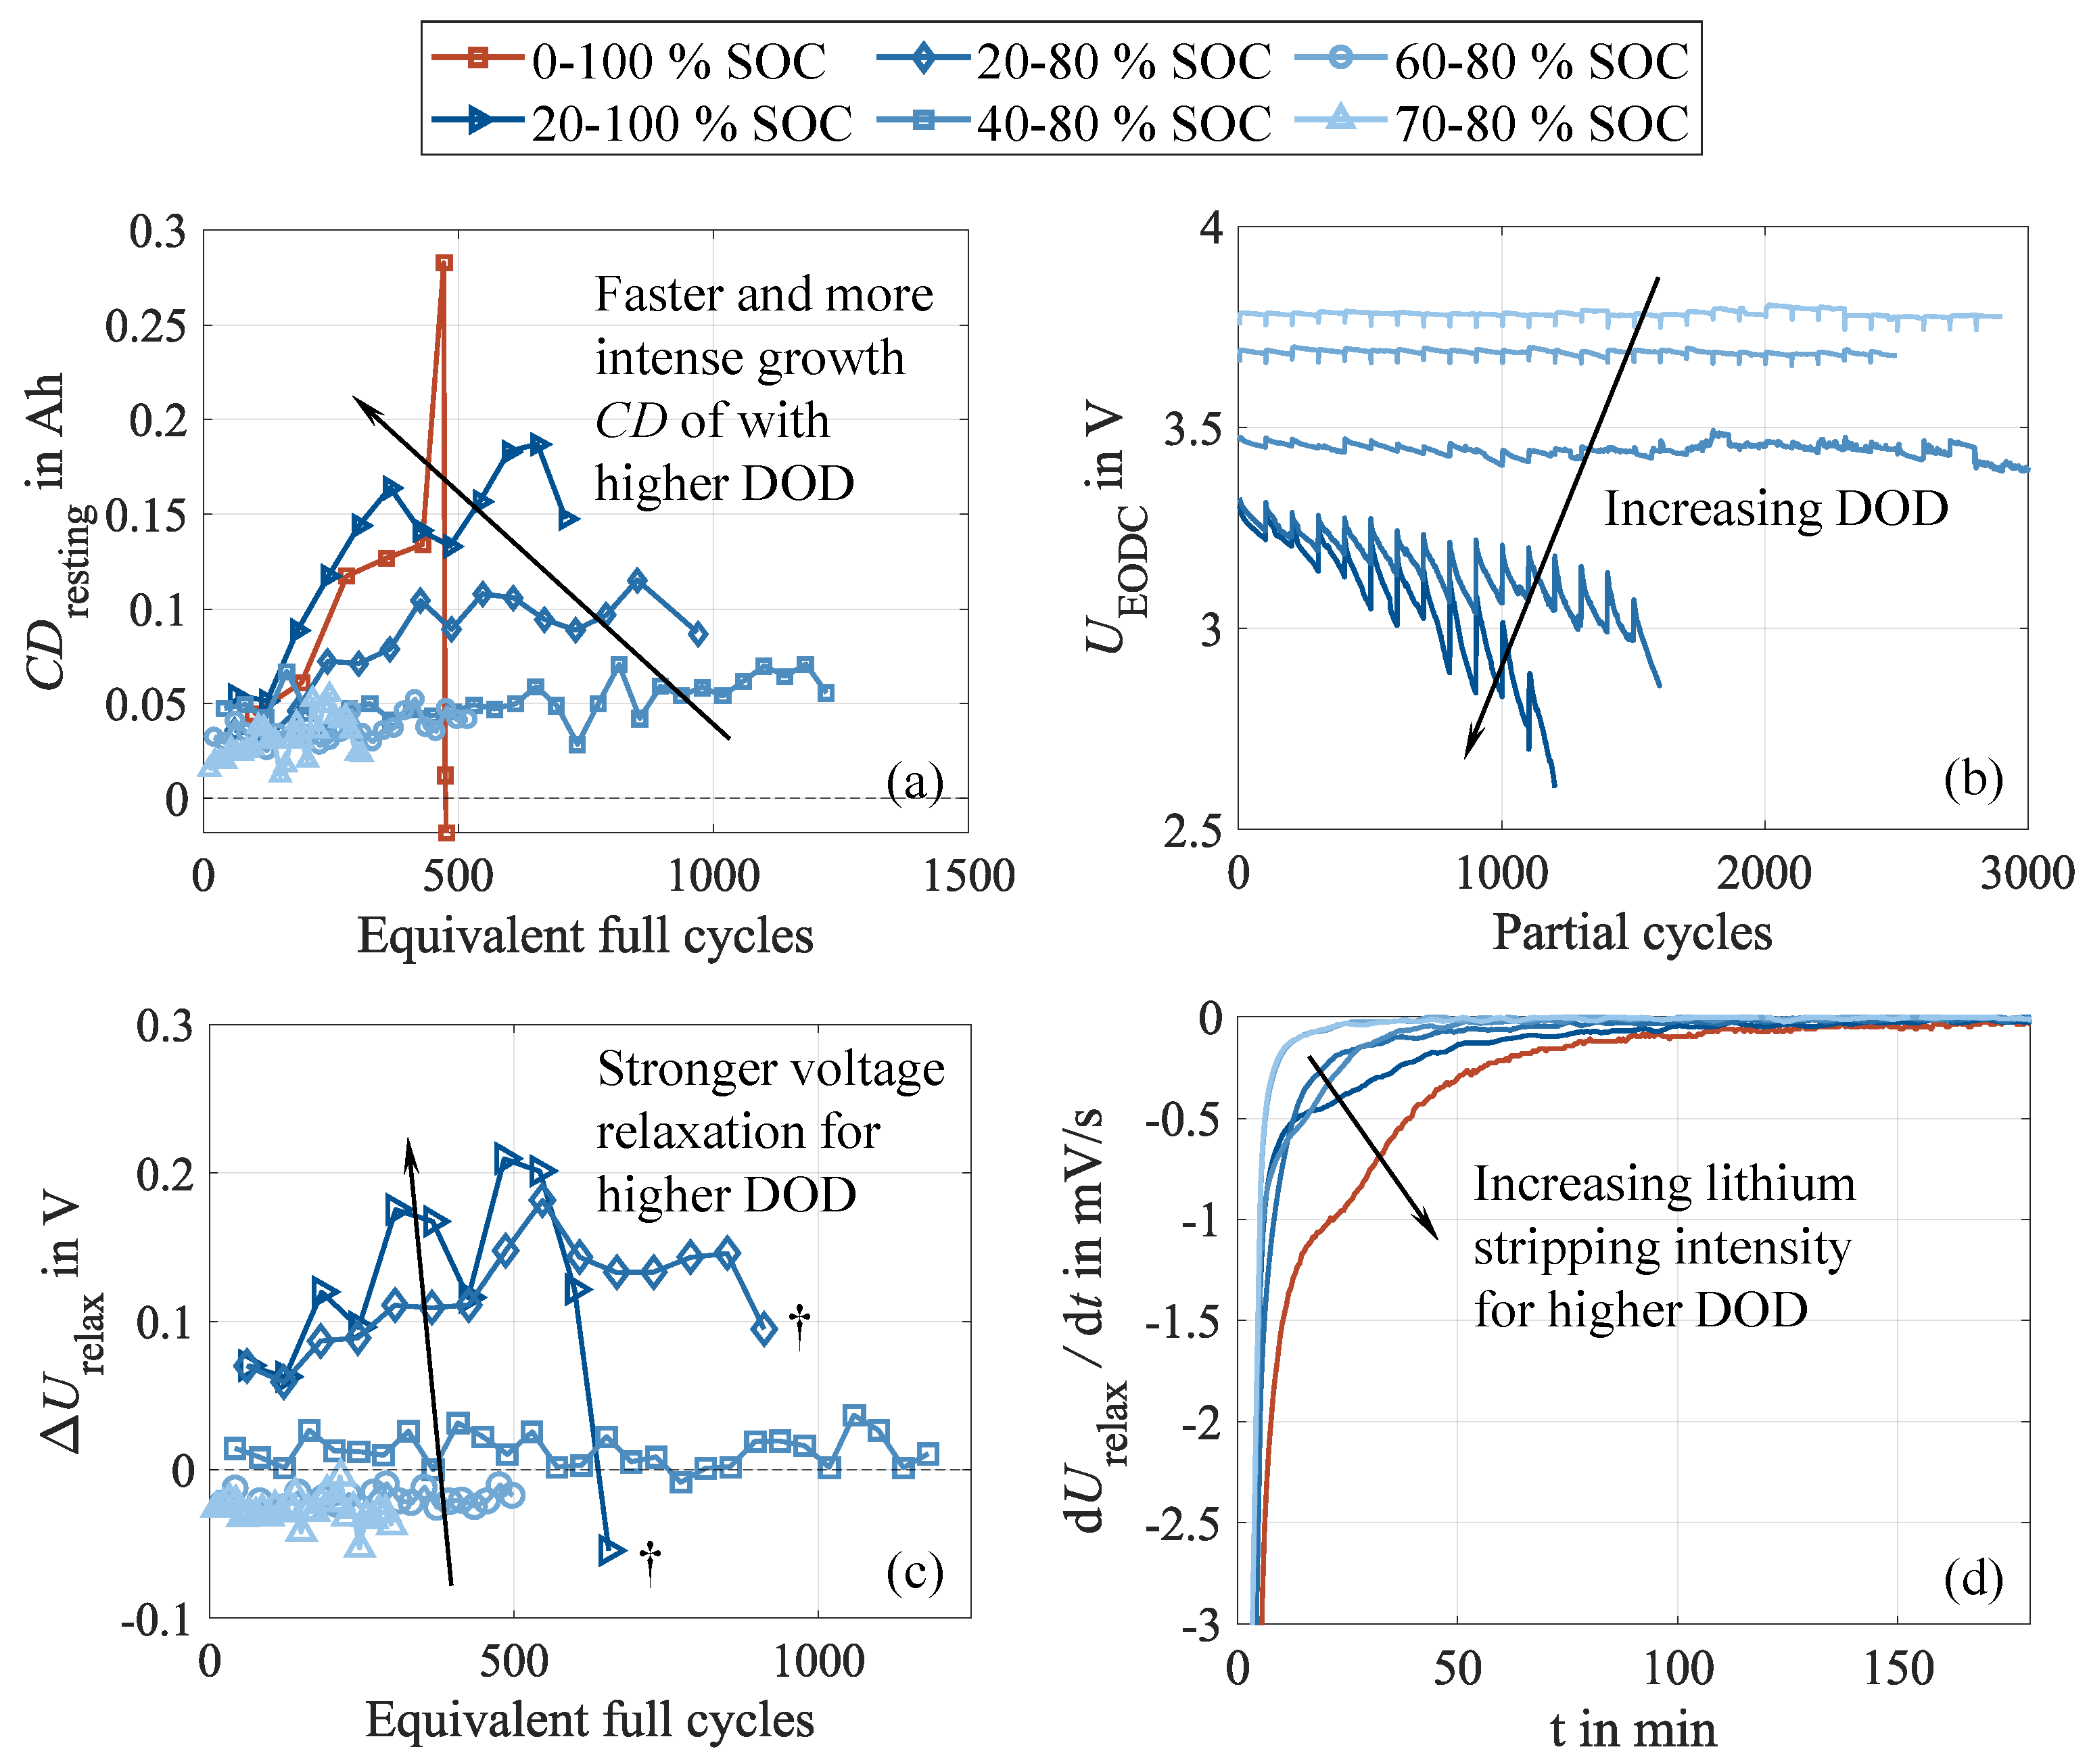
Figure 9.
Measurable cell deterioration, depending on the applied C-rates in terms of capacity loss (a) and resistance increase (b).
Figure 9.
Measurable cell deterioration, depending on the applied C-rates in terms of capacity loss (a) and resistance increase (b).
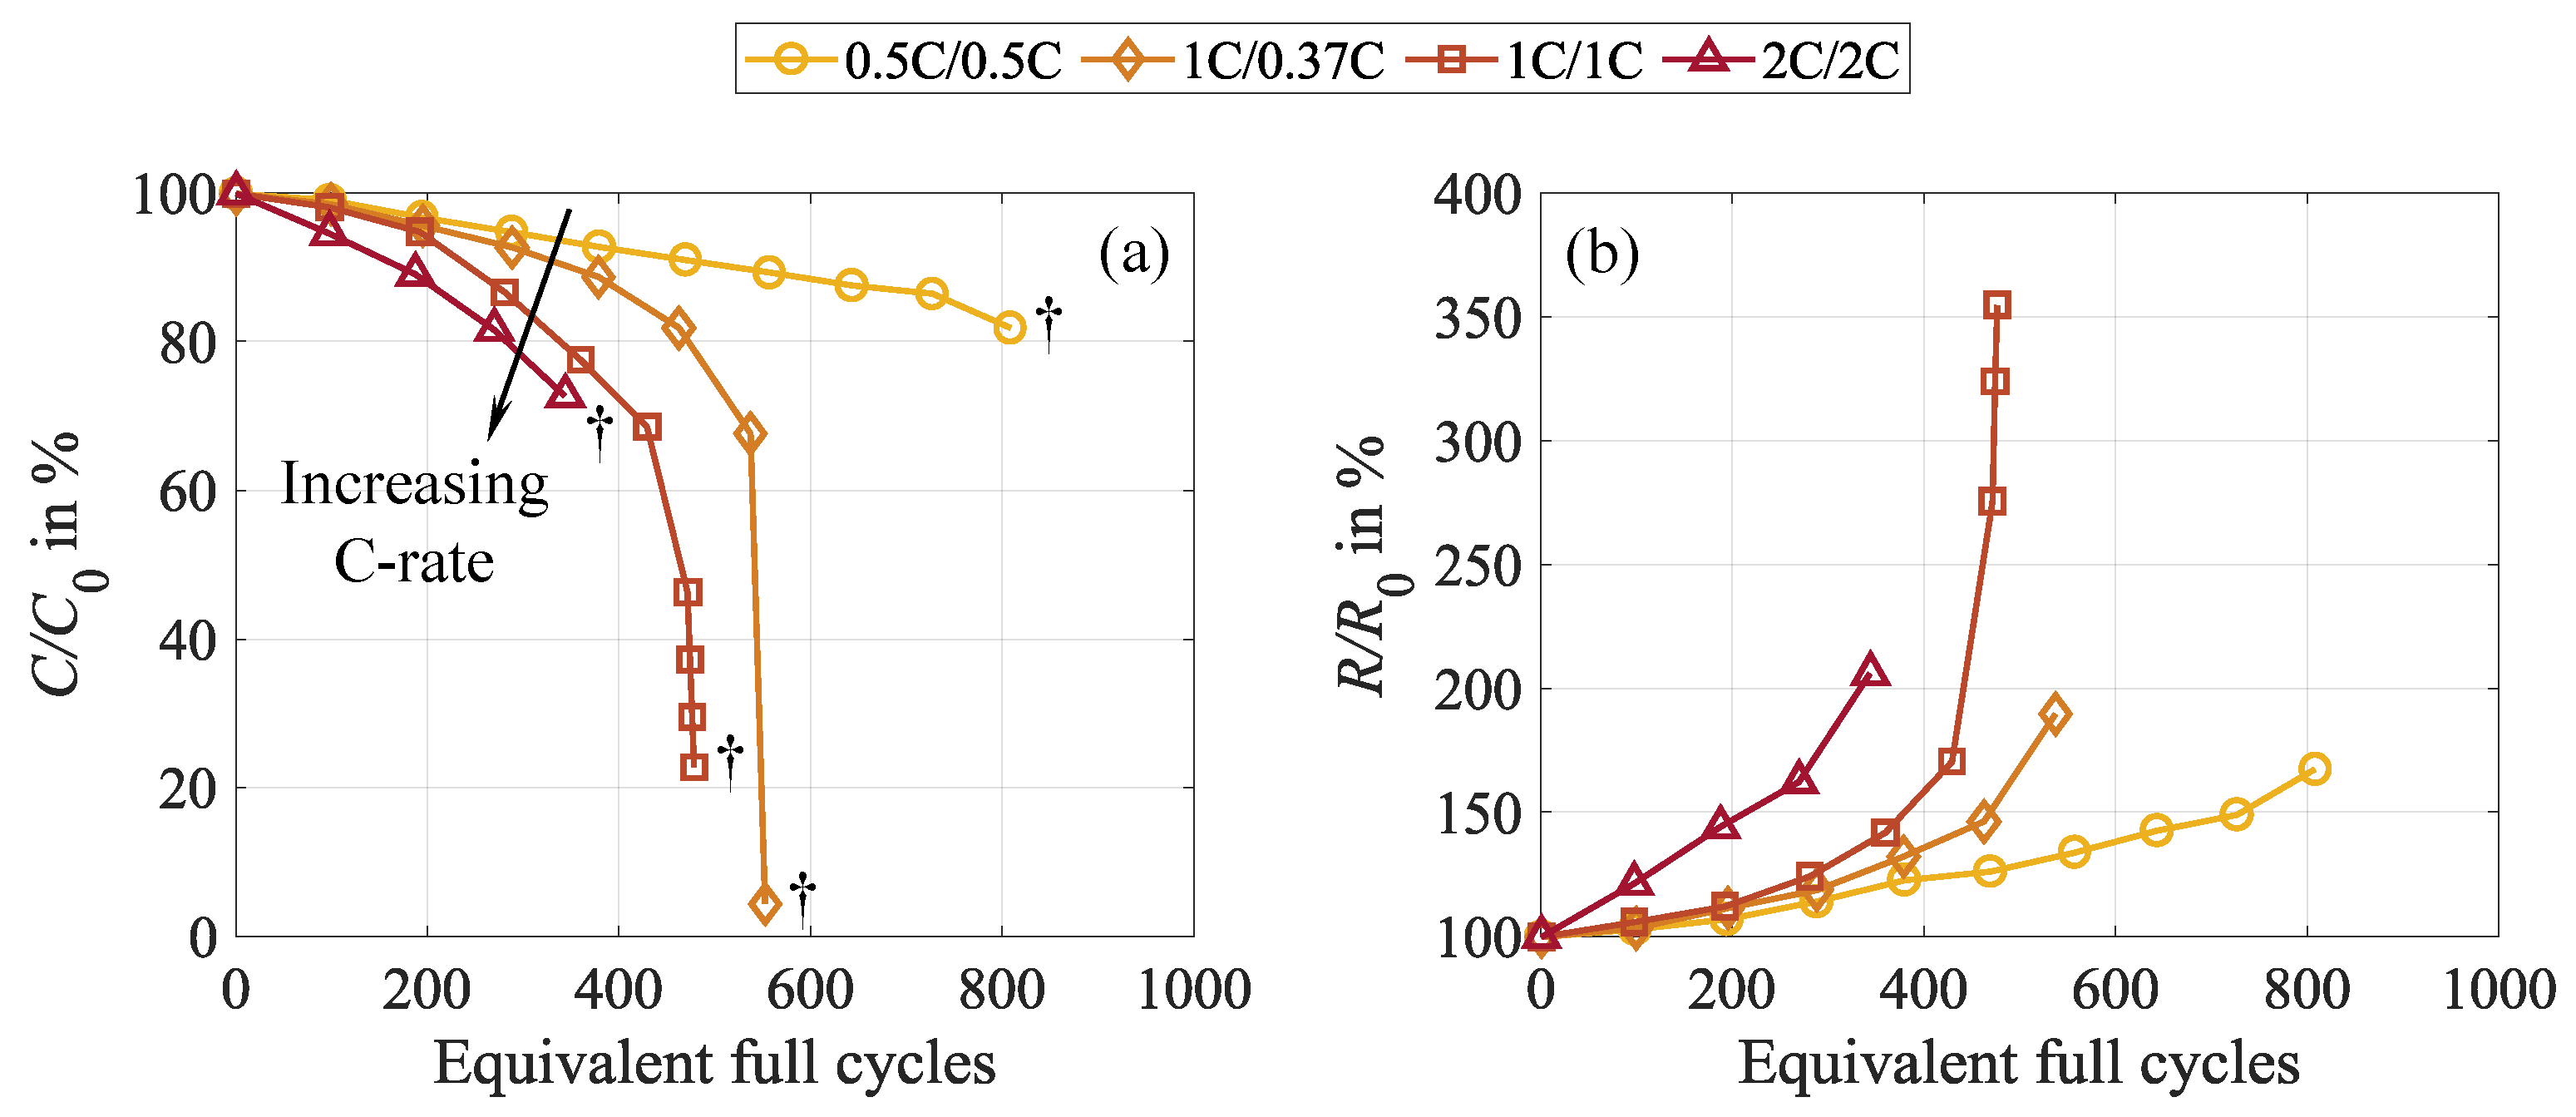
Figure 10.
Underlying cell behavior under the impact of the C-rate: extractable charge during cycling (a), indicating cell inhomogenization (b), as a measure for cell relaxation and equalization of inhomogeneities (c), lithium stripping analysis proving the occurrence of lithium plating at the end of the experiment (d).
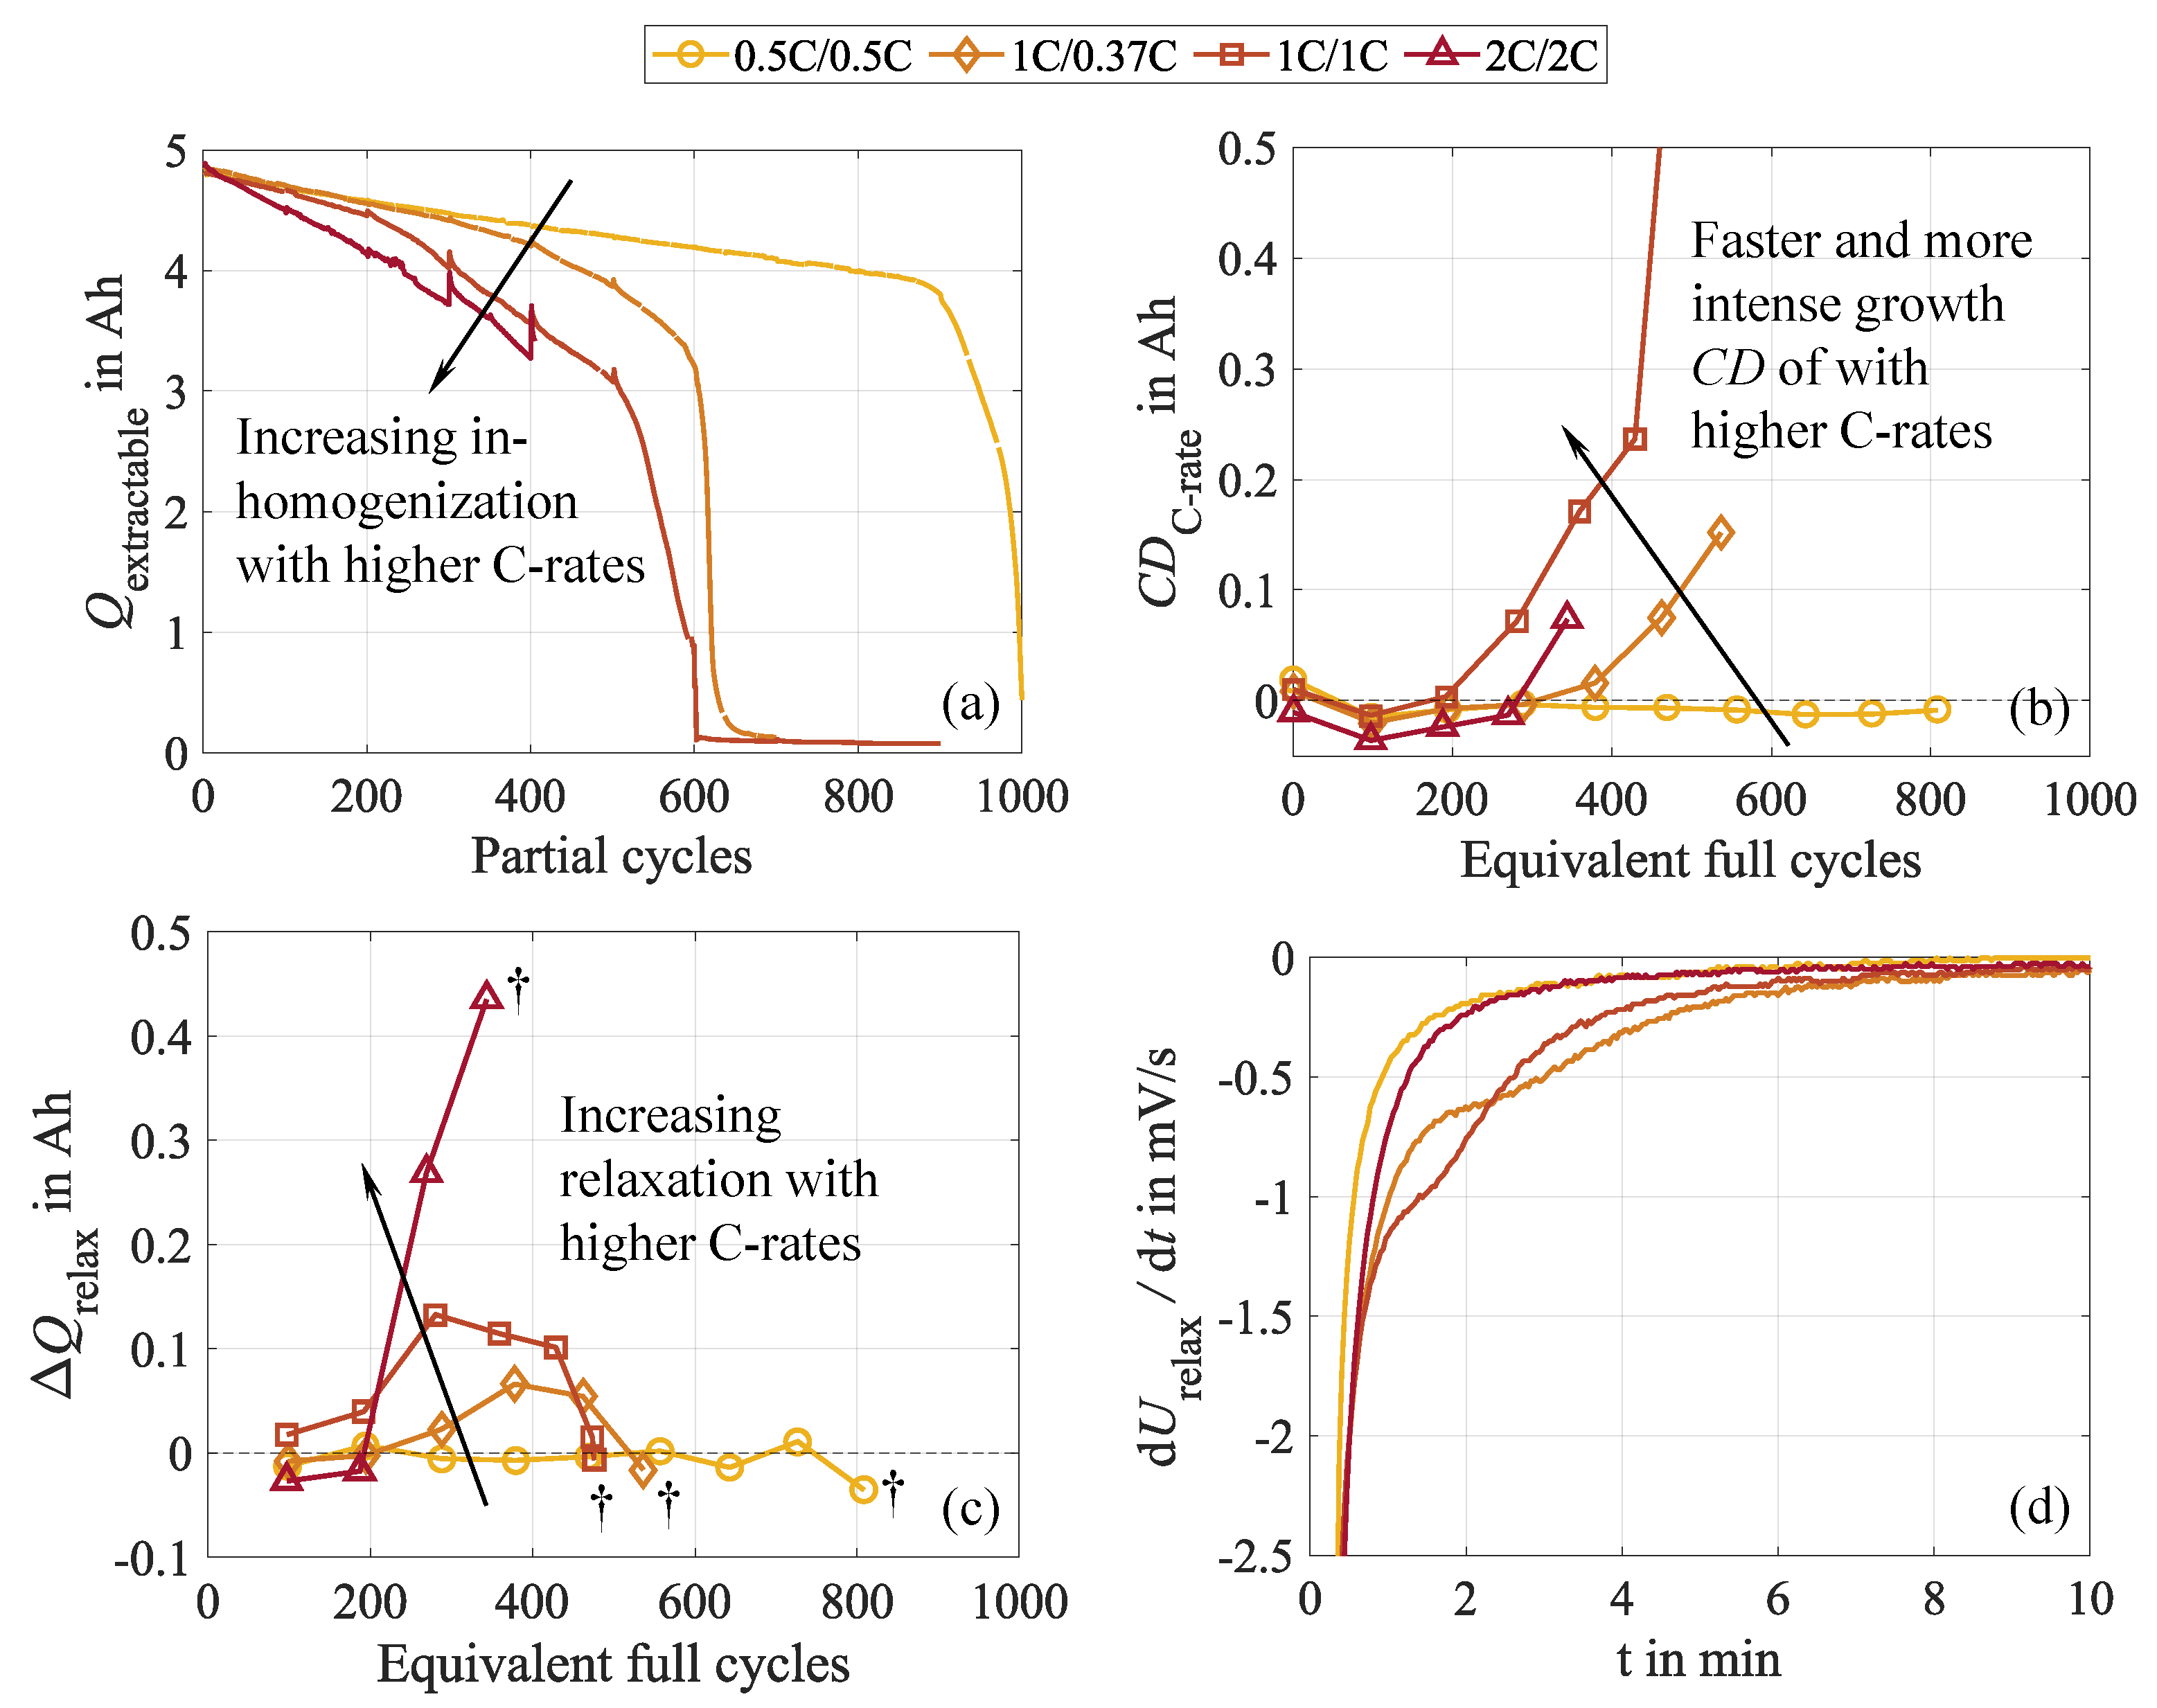
Figure 11.
Impact of recovery cycles on capacity loss (a) and resistance increase (b).
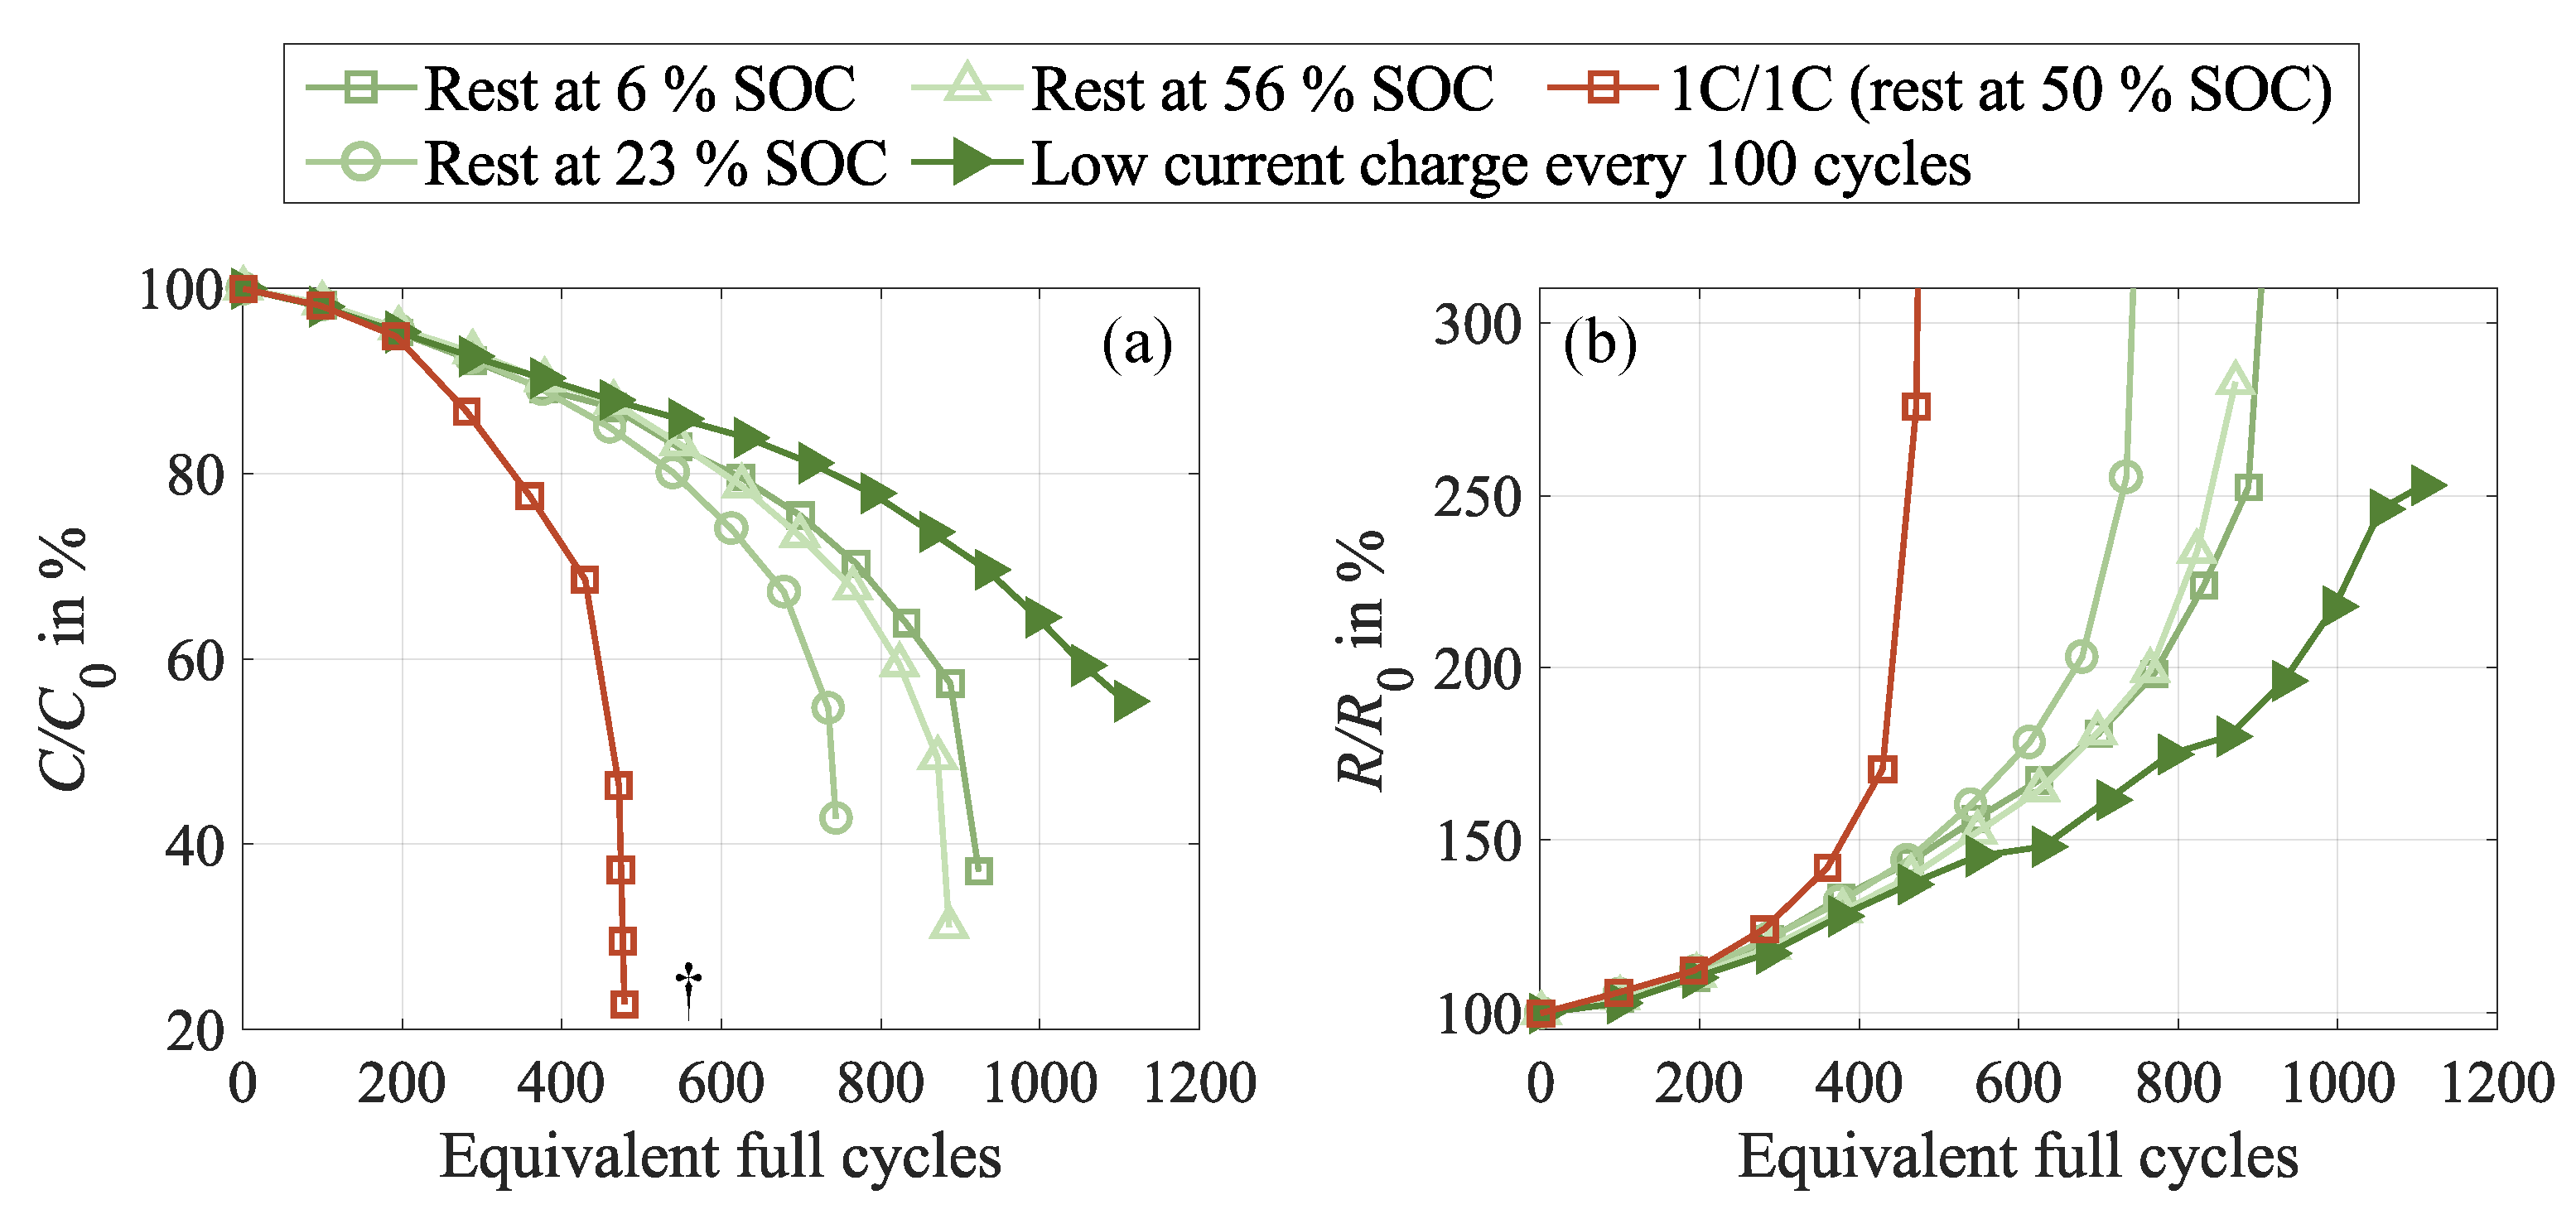
Figure 12.
Impact of recovery cycles on cell behavior: extractable charge during cycling (a), (b), (c), lithium stripping analysis (d). The stripping behavior of the 1C/1C test case is not visualized due to differing measurement durations among these substudies.
Figure 12.
Impact of recovery cycles on cell behavior: extractable charge during cycling (a), (b), (c), lithium stripping analysis (d). The stripping behavior of the 1C/1C test case is not visualized due to differing measurement durations among these substudies.
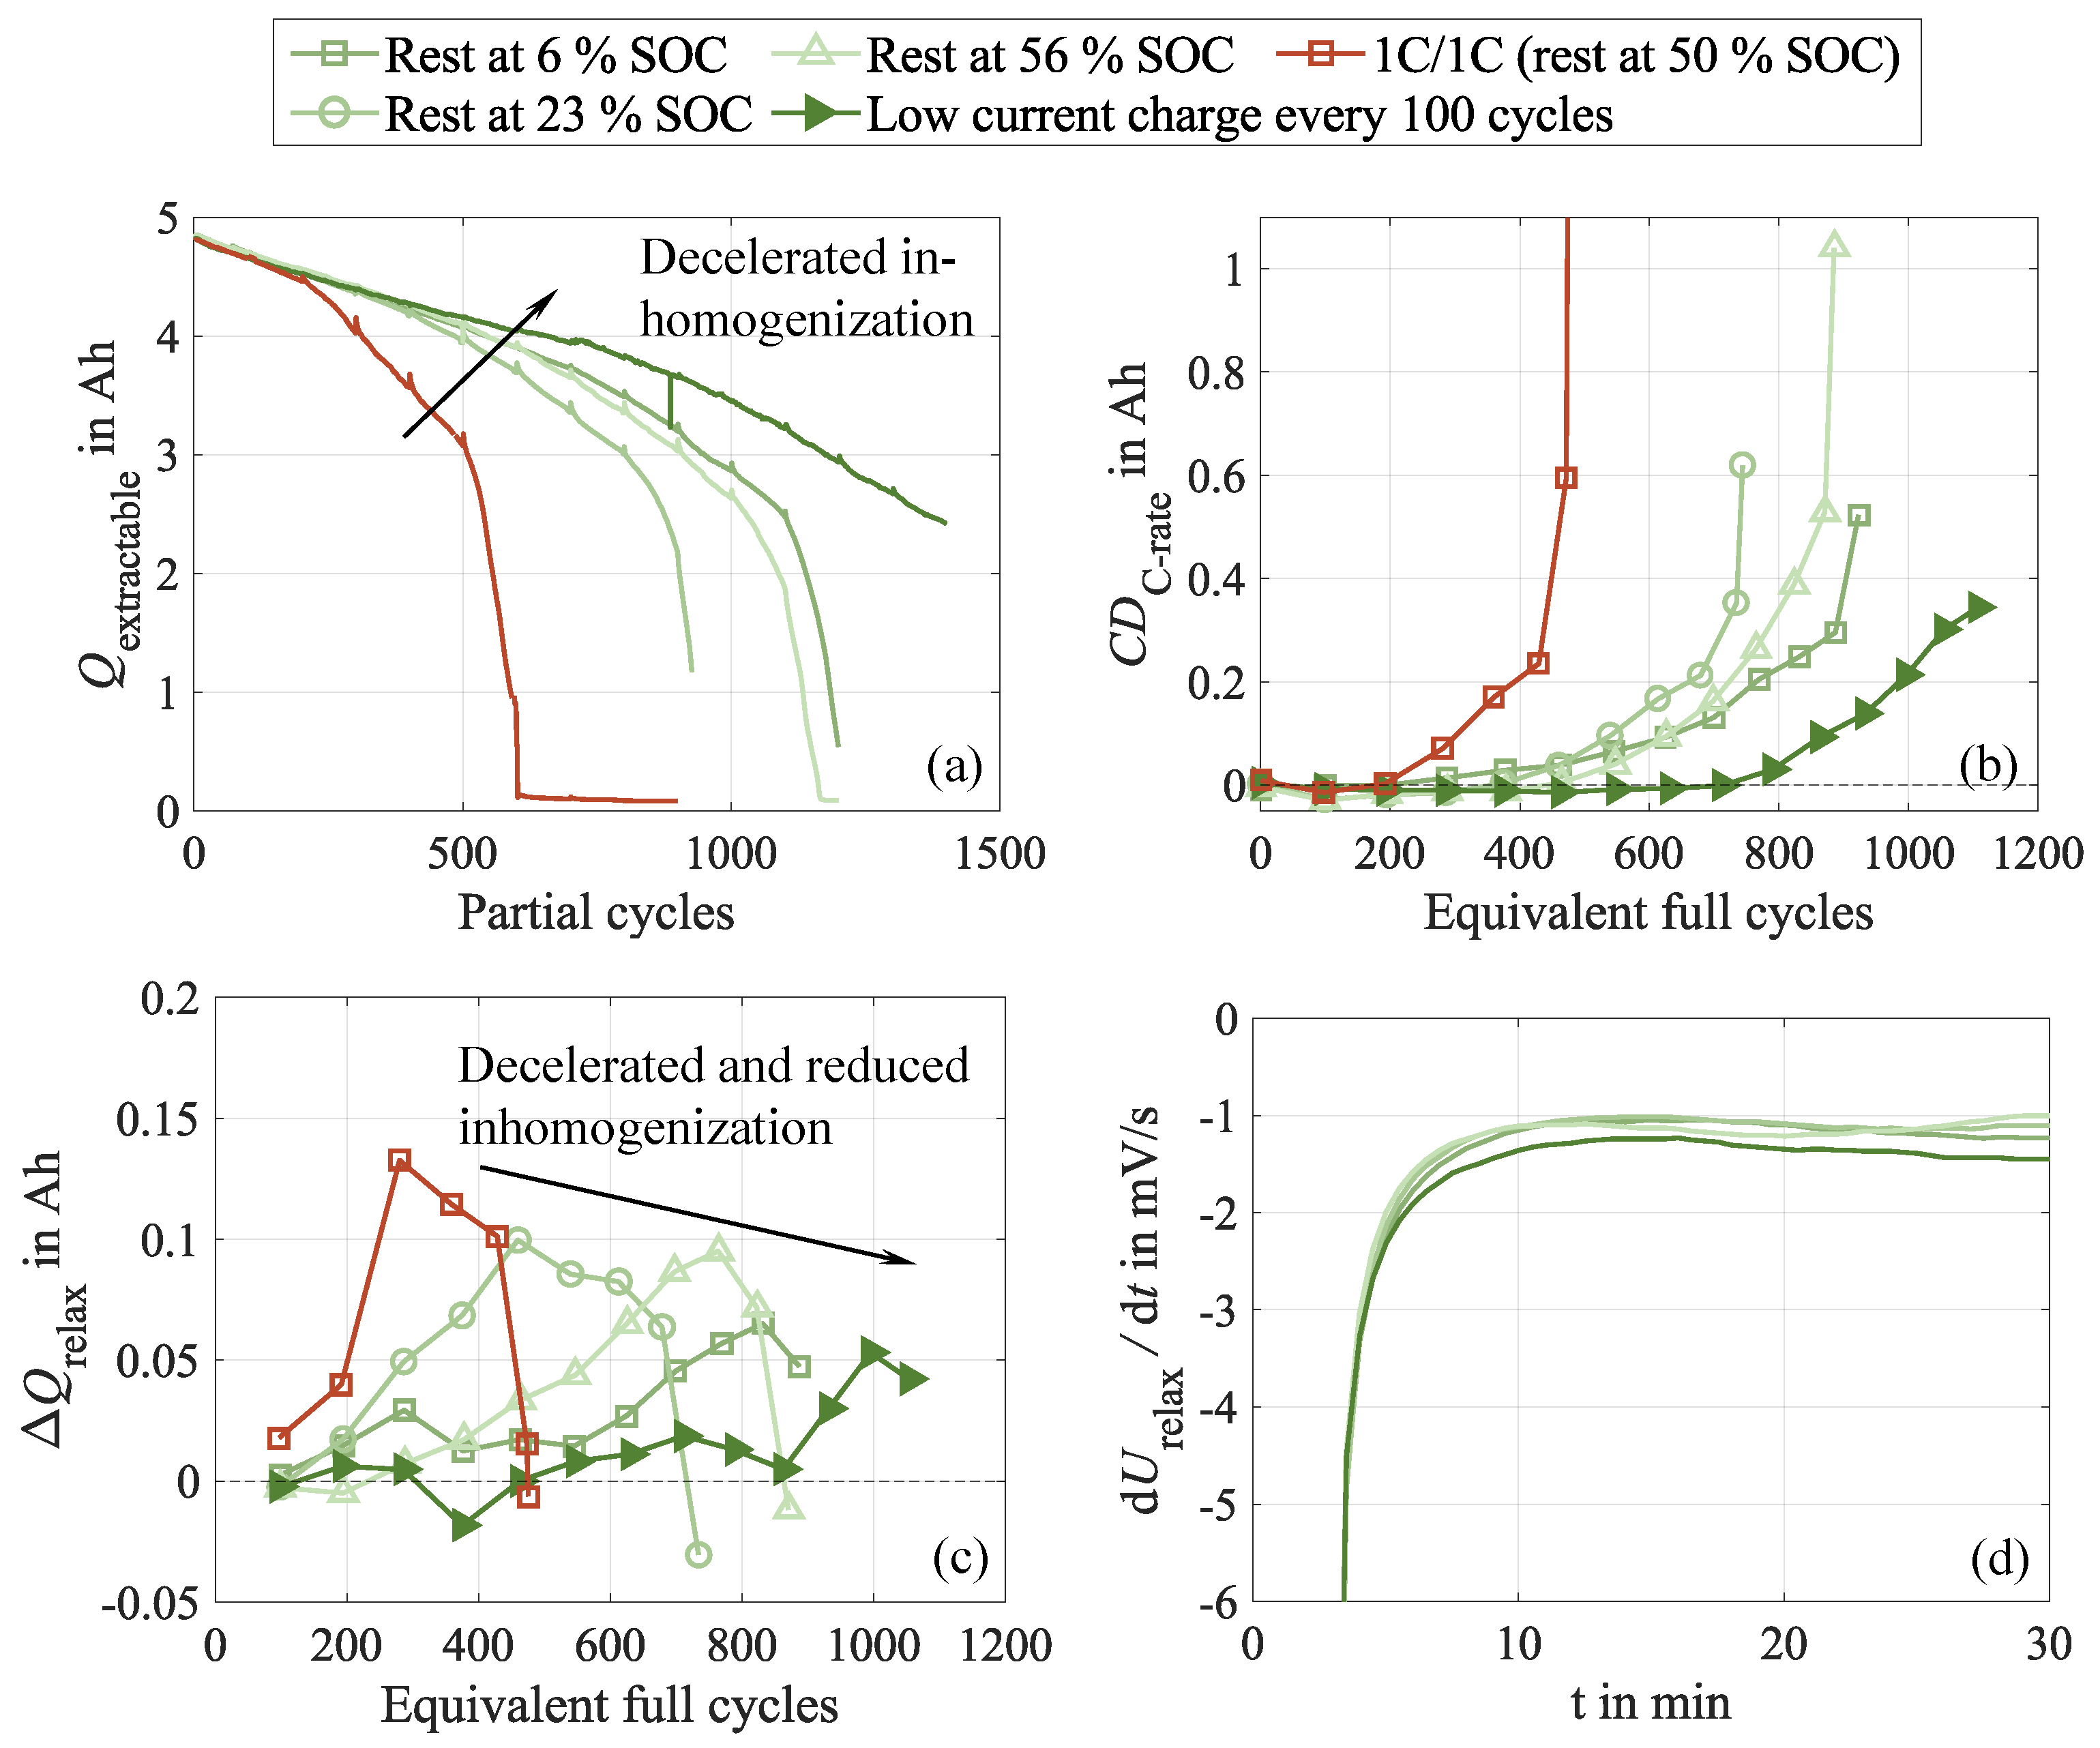
Figure 13.
Correlation between capacity loss (a), increase in capacity difference (b), and growth of recovered charge (c). Note that represents the results of the C-rate and recovery substudy, while corresponds to the results of the DOD substudy. The latter shows a distinct behavior, initially growing 1, and significantly declining from its maximum shortly before cell failure 2. The asterisk markers indicate the first detectable signs of lithium stripping for the individual test cases, while the gray shaded areas highlight the ranges in which these initial lithium stripping observations occur.


Table 1.
Specifications of the investigated battery, taken from the datasheet [35] and Kim et al. [36].
| Parameter | Value |
|---|---|
| Manufacturer | Samsung SDI |
| Cell type | INR21700-50G |
| Cell format | 21700 cylindrical |
| Positive electrode material | NCA (LiNixCoyAlzO2, stoichiometry unknown) |
| Negative electrode material | Silicon-graphite (stoichiometry unknown) |
| Nominal Capacity1 | |
| Nominal voltage | |
| Minimum voltage | |
| Maximum voltage |
1 Measured at C/5 and 25 °C.
Disclaimer/Publisher’s Note: The statements, opinions and data contained in all publications are solely those of the individual author(s) and contributor(s) and not of MDPI and/or the editor(s). MDPI and/or the editor(s) disclaim responsibility for any injury to people or property resulting from any ideas, methods, instructions or products referred to in the content. |
© 2025 by the authors. Licensee MDPI, Basel, Switzerland. This article is an open access article distributed under the terms and conditions of the Creative Commons Attribution (CC BY) license (http://creativecommons.org/licenses/by/4.0/).
Copyright: This open access article is published under a Creative Commons CC BY 4.0 license, which permit the free download, distribution, and reuse, provided that the author and preprint are cited in any reuse.


