
Submitted:
11 March 2025
Posted:
12 March 2025
You are already at the latest version
Abstract
Integrating artificial intelligence (AI) into financial transparency and corporate governance has reshaped how organizations ensure accountability, regulatory compliance, and risk management. This study examines the impact of AI-driven financial transparency on corporate governance and regulatory reform, specifically focusing on Jordan. Utilizing a stratified random sampling approach, data was collected from 564 corporate professionals across key economic sectors, including banking, insurance, services, and industry. A combination of structural equation modeling (SEM) and multiple regression analysis was employed to test the relationships between AI-driven transparency, governance mechanisms, and regulatory frameworks. The results indicate that AI significantly enhances corporate governance effectiveness by improving financial reporting accuracy, risk management, and executive decision-making. Additionally, AI adoption facilitates regulatory compliance by automating monitoring processes and reducing human errors in financial disclosures. However, the findings highlight challenges related to bias in AI algorithms, data privacy concerns, and the need for regulatory adaptation. The study also underscores the necessity of localized AI governance frameworks tailored to Jordan’s corporate landscape to maximize AI’s potential benefits. These findings contribute to the growing body of knowledge on AI-driven governance and provide actionable insights for policymakers, corporate executives, and financial regulators.
Keywords:
Artificial Intelligence
; Executive Compensation
; Risk Management
; Stakeholder Engagement
; Transparency
; Structural Equation Modeling (SEM)
; Corporate Governance
1. Introduction
The integration of artificial intelligence (AI) into accounting and corporate governance is transforming financial transparency and regulatory compliance. AI-driven financial transparency has the potential to enhance corporate governance by improving decision-making, mitigating risks, and strengthening accountability. As businesses worldwide navigate increasingly complex financial landscapes, AI’s role in reshaping governance frameworks has become essential. However, the need for AI-driven strategies is particularly pronounced in developing countries like Jordan, where governance structures face unique vulnerabilities that hinder effective oversight and regulatory enforcement.
Developing economies often grapple with weaker regulatory frameworks, limited technological infrastructure, and challenges in enforcing accountability, all of which impact corporate governance. In Jordan, regulatory frameworks have undergone continuous evolution, yet challenges remain in ensuring full compliance with international financial reporting standards (IFRS) and corporate governance principles (Al-Rahahleh, 2017). The enforcement of regulations is sometimes constrained by resource limitations and inconsistent application of corporate laws, which can lead to gaps in financial reporting and oversight (IFC, 2020). Additionally, the technological infrastructure in Jordan’s financial sector, while improving, still lags behind that of more developed economies, affecting the ability of firms to implement sophisticated financial reporting and risk management systems (Kayed & Hassan, 2019). The enforcement of accountability mechanisms is further challenged by stakeholder influence and governance inefficiencies, limiting transparency in financial disclosures (Hazaimeh et al., 2021).
AI-driven financial transparency presents a viable solution to these governance challenges. By integrating AI technologies, organizations in Jordan can automate compliance with evolving regulatory standards, enhance real-time monitoring of financial transactions, and reduce human error in financial reporting (Zhou et al., 2022). AI-powered risk management tools enable firms to proactively detect financial irregularities and prevent fraud, thereby strengthening corporate accountability (Gul et al., 2023). Moreover, AI-driven data analytics can enhance stakeholder trust by providing real-time, data-backed financial insights, allowing investors and regulators to make informed decisions (Omoteso & Mobolaji, 2020). The automation of internal control mechanisms using AI further improves governance efficiency by ensuring that firms adhere to corporate policies and regulatory requirements with greater precision (PwC, 2021).
The primary objective of this study is to examine the impact of AI-driven financial transparency on corporate governance and regulatory reform in Jordan. By investigating AI’s role in enhancing decision-making, risk management, and financial disclosure practices, this study seeks to provide valuable insights into how AI can strengthen governance frameworks in emerging markets. The research is guided by the following key questions:
- How does AI adoption influence decision-making within corporate boards?
- To what extent does AI affect risk management strategies and internal controls?
- How does AI improve financial transparency and disclosure practices?
- What effect does AI integration have on stakeholder engagement and regulatory compliance?
- How does AI enhance the effectiveness of corporate governance mechanisms?
This study contributes to the ongoing discourse on governance modernization by highlighting AI’s potential to address regulatory challenges, improve financial oversight, and foster sustainable business practices. By providing empirical evidence on AI’s role in enhancing corporate governance, the research offers practical insights for regulators, corporate executives, and policymakers seeking to optimize governance models in an increasingly AI-driven financial landscape.
Top of Form
2. Literature Review
2.1. Foundational Principles of AI in Accounting
Artificial intelligence (AI) in accounting is underpinned by several foundational principles. Machine learning, a key component, involves the use of algorithms that enable systems to learn from data and make predictions or decisions autonomously (Harmon & Psaltis, 2021). This capability is particularly valuable in predictive analytics for financial forecasting, fraud detection, and risk assessment. Natural Language Processing (NLP), another crucial aspect, empowers machines to understand and generate human-like language (Kalkan, 2024). In accounting, NLP can be applied to automate data extraction, conduct sentiment analysis of financial reports, and facilitate improved communication between financial systems and users. Additionally, the ability of AI systems to recognize patterns is instrumental in detecting irregularities in financial transactions and identifying trends in market data, ultimately improving audit procedures. The integration of robotics and automation, utilizing robotic process automation (RPA), enhances efficiency by automating repetitive accounting tasks, allowing professionals to focus on more complex analyses (Percy et al., 2021; Bickley et al., 2024).
The integration of AI technologies into accounting processes is a multifaceted endeavor with several key applications. One fundamental area is data preprocessing and cleansing, where AI algorithms play a pivotal role in automatically ensuring the quality and integrity of large datasets. This, in turn, contributes to improved data accuracy and reduced errors in financial reporting (Paraman & Anamalah, 2023). Predictive analytics, powered by machine learning models, enables the analysis of historical financial data to predict future trends and outcomes, enhancing the accuracy of financial forecasting and aiding strategic decision-making (Mullangi, 2017). AI also excels in fraud detection and risk assessment by identifying patterns indicative of fraudulent activities and assessing risks in real-time, thereby contributing to the maintenance of the integrity of financial systems. Furthermore, automation of audit procedures through AI technologies accelerates the audit process, improving efficiency and audit quality (Rane et al.,2024). Decision support systems, leveraging AI, provide insights and recommendations that aid financial decision-makers in making informed choices based on data-driven analyses, thereby contributing to achieving financial goals and objectives (Manning et al., 2022; Tsolakis et al., 2023).
AI technologies bring a paradigm shift in ensuring the accuracy of financial reporting. Machine learning algorithms can analyze vast datasets with speed and precision, minimizing errors that may arise from manual data entry or traditional processing methods. These algorithms can identify patterns and anomalies, cross-referencing historical data to detect inconsistencies and discrepancies. Through continuous learning, AI systems adapt to evolving financial landscapes, providing a reliable mechanism for maintaining high levels of accuracy in financial reporting (Pasrija et al., 2022; Kafi & Adnan, 2020).
The completeness of financial reporting is vital for stakeholders to have a comprehensive understanding of a company’s financial health. AI contributes to completeness by automating data extraction from diverse sources, including unstructured data sets (Jejeniwa et al., 2024). Natural Language Processing (NLP) enables AI systems to interpret and extract relevant information from textual documents, financial statements, and reports. This automation ensures that all relevant data points are considered, reducing the likelihood of oversights and omissions. As a result, financial reports become more comprehensive and reflective of the true financial position of the organization (Nwaimo et al., 2024).
2.2. AI-Enhanced Financial Transparency
Financial transparency is a cornerstone of effective corporate governance, and the integration of artificial intelligence (AI) plays a crucial role in advancing this transparency within corporate entities. One key aspect involves investigating the ways in which AI contributes to the improvement of financial transparency (Efunniyi et al., 2024; Manginte, 2024).
Enhanced financial transparency through AI has indirect implications for decision-making processes at executive and board levels. The availability of more accurate and timely financial information empowers executives to make informed decisions, aligning with a comprehensive understanding of the organization’s financial health. AI’s predictive analytics capabilities provide valuable insights into future trends, aiding executives in formulating strategies that support long-term sustainability and growth objectives.
Timeliness in financial reporting is essential for stakeholders, including investors, regulators, and internal management, to make informed decisions. AI accelerates the financial reporting process by automating routine tasks, such as data reconciliation and validation Machine learning algorithms can streamline the data preparation phase, allowing for quicker analysis and synthesis of financial information. Additionally, automated audit procedures facilitated by AI contribute to faster and more efficient verification processes. The result is a reduction in reporting timelines, providing stakeholders with up-to-date and relevant financial insights ( Odonkor et al., 2024; Antwi et al., 2024).
2.3. Impact on Corporate Governance Structures
Corporate governance undergoes a transformative shift with the integration of AI-driven financial transparency, influencing both direct and indirect aspects within organizational structures. The direct impacts of AI-driven financial transparency are significant, particularly in bolstering the reliability of disclosed financial information. AI’s capacity to enhance accuracy and completeness in financial reporting instills confidence among stakeholders, including shareholders and regulatory bodies. This confidence, in turn, becomes a cornerstone for fortifying the corporate governance framework. Moreover, the automation of audit procedures by AI ensures timely and precise audits, reinforcing the essential checks and balances inherent in governance practices (Shubita & Alrawashedh; 2023; Lu, 2020).
Additionally, AI contributes to elevating risk management strategies within corporate governance. Through real-time analysis and the identification of financial patterns, AI facilitates proactive risk identification and mitigation. This proactive risk management approach strengthens the resilience of corporate governance structures, enabling organizations to navigate uncertainties more effectively (Chiu, & Lim, 2021).
At the board level, AI-driven financial transparency contributes to more effective oversight. Board members can rely on AI-generated analytics to comprehensively assess the financial performance and risks of the organization. This, in turn, fosters more informed discussions and strategic planning sessions. Board members are better equipped to fulfill their fiduciary duties, ensuring that decisions align with the organization’s mission while safeguarding the interests of stakeholders (Antwi et al., 2024; Kafi & Adnan, 2020).
2.4. Ethical Challenges in AI Integration and Their Solutions
The integration of AI in financial transparency and corporate governance presents ethical concerns, including bias in AI algorithms, data privacy risks, accountability issues, and explainability challenges. Addressing these challenges is critical to ensuring AI’s effective and responsible application in governance structures.
- Bias in AI Algorithms: AI models are susceptible to bias due to the data they are trained on. Prior studies (Binns, 2018; Mehrabi et al., 2021) suggest that biased training data can result in discriminatory decision-making, which is particularly concerning in financial transparency. Solutions such as algorithmic fairness audits and bias mitigation techniques have been proposed. However, studies highlight that these techniques often require continuous oversight and human intervention (Dastin, 2020). In the context of Jordan and other developing countries, bias mitigation remains underexplored due to limited access to diverse datasets, making AI-driven financial systems potentially vulnerable to inherent biases.
- Data Privacy and Security Risks: AI-driven financial systems process vast amounts of sensitive data, raising concerns about privacy breaches and unauthorized access (Zarsky, 2016). The General Data Protection Regulation (GDPR) in the EU has established a robust legal framework for data protection, but similar enforcement mechanisms in Jordan remain weaker (Hazaimeh et al., 2021). While encryption and differential privacy techniques (Dwork & Roth, 2014) are recommended to enhance security, their implementation in Jordan faces challenges due to the lack of standardized AI governance frameworks.
- Accountability and Explainability of AI Decisions: AI-driven governance models often struggle with explainability, making it difficult for regulators and stakeholders to understand AI-generated financial insights (Mittelstadt et al., 2016). Some studies suggest Explainable AI (XAI) techniques as a solution (Guidotti et al., 2019). However, while these methods improve transparency, they do not fully eliminate black-box decision-making in AI models (Lipton, 2018). In Jordan, financial institutions may lack the technical expertise required to implement XAI frameworks, limiting the effectiveness of AI transparency solutions.
- Contextualizing AI Governance Challenges in Jordan: In developing countries like Jordan, corporate governance structures often lack robust AI regulations, leading to inconsistent application of ethical AI principles (Al-Rahahleh, 2017). Unlike in the EU and the US, where strict governance guidelines enforce AI accountability, Jordan faces hurdles in policy implementation and enforcement. Studies suggest that for AI-driven transparency to be effective, policymakers must establish clear AI compliance frameworks tailored to the region’s regulatory landscape and technological capacity (Gul et al., 2023).
- AI-Driven Risk Management: AI contributes to risk management by identifying financial anomalies and predicting fraud patterns (Chiu & Lim, 2021). Machine learning models analyze historical financial data to detect suspicious activities, helping organizations mitigate risks proactively (Zhou et al., 2022). However, implementing AI for risk management in Jordan remains limited due to a lack of sufficient AI training programs and high infrastructure costs (Kayed & Hassan, 2019).
- AI in Financial Reporting and Regulatory Compliance: AI enhances financial reporting by automating complex accounting processes and ensuring real-time compliance with regulations (Omoteso & Mobolaji, 2020). However, adoption barriers such as high costs of AI integration and limited access to regulatory sandboxes hinder AI’s full potential in Jordan’s financial sector (IFC, 2020). Comparative studies highlight that AI regulatory adoption is more successful in high-governance economies like Singapore and Germany (PwC, 2021), emphasizing the need for localized AI policies in Jordan.
2.5. Case Study: AI Implementation at Al-Wasleh - Transforming Financing and Accounting Processes
“Al-Wasleh, a leading leasing and financing solutions provider for SMEs in Jordan, was selected as a case study for this research (Al-Wasleh, 2024).” Al-Wasleh, a prominent Jordanian company established in 2011, offers a diverse range of products and services to both employees and businesses. These include home appliances, furniture, mobile phones, electronics, sports equipment, car insurance, and more, made accessible through convenient monthly installments or other flexible financial options. Al-Wasleh has strategically positioned itself as a provider of comprehensive services, catering to a wide customer base.
AI Implementation: Scoring System for Customer Evaluation: According to recent information from Al-Wasleh, the company is employing certain forms AI to revolutionize both its customer evaluation processes and accounting practices. Al-Wasleh’s innovative strategy includes the use of an AI-driven scoring system to assess customers. This system is critical in determining loan eligibility and calculating the appropriate credit amount. Al-Wasleh intends to improve the accuracy and efficiency of its decision-making processes by utilizing AI algorithms, ensuring that credit evaluations are consistent with individual customer profiles and financial histories.
ERP System in Accounting: In addition to the AI-driven customer scoring system, Al-Wasleh has implemented an Enterprise Resource Planning (ERP) system in its accounting practices. This ERP system encompasses various modules, including Accounts Payable, Accounts Receivable, and Banking, all converging to generate entries in the General Ledger (GL). This comprehensive ERP framework streamlines the workflow processes in accounting, facilitating seamless interactions between different financial functions within the organization.
Outcomes:
- Enhanced Customer Evaluation:
- The AI-driven scoring system has resulted in more precise and data-driven customer evaluations. This has contributed to improved decision-making regarding loan approvals and credit limits, ultimately optimizing the financial health of the company.
- 2.
- Efficient Accounting Workflows:
- The ERP system has brought about greater efficiency in Al-Wasleh’s accounting operations. By integrating various accounting modules, including Accounts Payable and Receivable, the company has streamlined financial processes, reducing manual efforts and minimizing the risk of errors.
Lessons Learned:
- Balancing Automation with Human Oversight:
- Al-Wasleh has recognized the importance of balancing automation with human oversight. While AI technologies enhance efficiency, human expertise is crucial for interpreting complex financial scenarios and ensuring ethical considerations are taken into account.
- 2.
- Continuous Monitoring and Adaptation:
- The implementation of both the scoring system and ERP required continuous monitoring and adaptation. Al-Wasleh has learned the value of staying vigilant to changing market conditions and technological advancements to optimize the performance of these systems.
Best Practices:
- Integrating AI into Financial Decision-Making:
- Al-Wasleh’s success underscores the importance of integrating AI into financial decision-making processes. The AI-driven scoring system serves as a model for other organizations seeking to enhance precision in customer evaluations.
- 2.
- Comprehensive ERP Integration:
- The adoption of a comprehensive ERP system is highlighted as a best practice for organizations looking to streamline accounting workflows. Al-Wasleh’s approach to integrating various accounting modules ensures a holistic view of financial processes.
Based on the literature review and the identified research gaps, the study proposes the following hypotheses to explore the impact of AI-driven financial transparency on various aspects of corporate governance and regulatory reform:
H1: AI-driven financial transparency has a significant positive effect on decision-making processes within the board of directors.
H2: AI-driven financial transparency significantly enhances risk management strategies within corporate governance structures.
H3: AI-driven financial transparency significantly improves transparency and disclosure practices.
H4: AI-driven financial transparency significantly enhances stakeholder engagement within corporate governance frameworks.
H5: AI-driven financial transparency significantly improves the effectiveness of executive compensation committees in corporate governance.
3. Method
The research employed a quantitative survey-based method to investigate the impact of AI-driven financial transparency on corporate governance mechanisms within the field of accounting. This approach is chosen to systematically collect and analyze numerical data, allowing for a statistical exploration of the relationships between AI adoption and various aspects of corporate governance (Lin & Yu, 2023; Gendron et al., 2024; Petcu et al., 2024). The research primarily focused on organizations that are in the early stages of adopting AI technologies for financial transparency.
Sample Size Justification
The sample size of 564 respondents was determined using a combination of Cohen’s (1988) power analysis and proportional representation relative to the total population. According to Cohen’s guidelines, a minimum sample of 160 is required for a multiple regression model with five predictors, achieving 95% confidence and 80% power. However, to enhance statistical robustness and ensure adequate representation of Jordan’s corporate sector, a larger sample size was selected.
To further justify this sample size, we estimated the total population of corporate governance professionals in Jordan by referencing official industry reports and corporate listings from the Jordan Securities Commission (JSC) and Central Bank of Jordan (CBJ). Given the estimated population size of approximately 5,500 professionals across the financial and corporate sectors, we used Krejcie & Morgan’s (1970) sampling formula, which suggested a minimum of 357 respondents. Our final sample of 564 respondents exceeded this threshold, ensuring greater generalizability and statistical validity.
Stratified Sampling:
The study employed a stratified random sampling method to ensure proportional representation of key industries in Jordan. The strata were determined based on the sectoral distribution of companies that are most relevant to corporate governance and regulatory reform. The allocation of respondents across different industries was based on proportional stratified sampling, where each sector’s sample size was determined relative to its actual presence in the Jordanian economy.
Determination of Strata and Sample Allocation:
The specific numbers of firms selected (15 banks, 20 insurance companies, 137 service companies, and 53 industrial companies) were based on the following considerations:
- Financial Sector Representation:
- The banking and insurance sectors were considered critical due to their significant role in regulatory compliance and financial reporting.
- The 15 banks selected represent all major commercial and investment banks in Jordan, ensuring comprehensive sectoral coverage.
- The 20 insurance companies were chosen based on the proportional representation of active firms within the insurance sector, aligned with Central Bank of Jordan data.
- 2.
- Service and Industrial Sectors:
- Service companies (137) were selected based on their dominance in Jordan’s economy, accounting for more than 50% of registered firms according to Amman Chamber of Commerce reports.
- Industrial firms (53) were selected to reflect the sector’s role in governance frameworks, particularly in export-driven industries and publicly traded companies.
Proportional Allocation Approach:
To ensure fairness in the sampling process, the proportion of companies surveyed in each sector was calculated using the total number of registered firms in each sector, as documented by Jordan Securities Commission (JSC) reports. The stratification ensured that each industry’s contribution to Jordan’s economy and corporate governance landscape was accurately represented.
Data Analysis: Data collected went through a thorough analysis using statistical software SPSS. Descriptive statistics summarized the key features of the dataset, while correlation analysis was used to explore relationships between variables. Regression analysis was also employed to assess the significance of the impact of AI-driven financial transparency on corporate governance mechanisms.
To assess the significance of the impact of AI-driven financial transparency on corporate governance and regulatory reform, the following multiple regression models were employed:
Model 1: Corporate Governance
where:
CorpGov. =β0+β1(AI Transparency) +ϵ
CorpGov represents corporate governance mechanisms (dependent variable).
AI Transparency represents AI-driven financial transparency (independent variable).
β0 is the intercept, β1 is the coefficient, and ϵ is the error term.
Model 2: Regulatory Reform
where:
RegRef. =β0+β1(AI Transparency) +ϵ
RegRef represents regulatory reform outcomes (dependent variable).
AI Transparency represents AI-driven financial transparency (independent variable).
β0 is the intercept, β1 is the coefficient, and ϵ is the error term.
These models were applied to test the direct effects of AI-driven financial transparency on both corporate governance and regulatory reform outcomes.
Ethical approval statement
This study received ethical approval from Al-Zaytoonah University Ethics Committee (Approval Reference: IRB#11/12/2024-2025). The approval was obtained following review of the research proposal and questionnaire items by the committee. We confirm that this study adheres to Helsinki Declaration.
4. Results
4.1. Reliability Test
The reliability of the constructs was assessed using Cronbach’s alpha to ensure internal consistency. The values were notably high across all constructs, with alpha coefficients ranging from 0.945 to 0.978. While high Cronbach’s alpha values can indicate redundancy, an item-total correlation analysis was performed to confirm that each item contributed meaningfully to its respective construct. This analysis validated that the items measured distinct dimensions of AI-driven financial transparency and governance outcomes. The Values for reliability coefficients are illustrated in Table 1.
4.2. Demographic Variables
The demographic characteristics of the sample were summarized using descriptive statistics. The sample included respondents from various industries and roles, providing a diverse perspective on AI adoption in corporate governance.
The demographic characteristics of the study community are illustrated in Table 2. The demographic features of the respondents were as follows:
The demographic analysis of the 564 respondents reveals a predominance of male participants (91%), indicating a significant gender imbalance in the sample. The age distribution shows a concentration of respondents in the 35-44 age group (57.3%), suggesting that the majority of the participants are relatively experienced professionals, likely contributing to the study’s insights into AI and corporate governance.
Regarding education levels, the majority of respondents hold a Bachelor’s Degree (70%), followed by Master’s Degrees (18%), and Ph.D. Degrees (6%), which may reflect the educational background typical of individuals in the accounting and finance sectors.
In terms of job titles, the data shows a diverse range of positions, with a notable 47.9% classified as “Other,” indicating a mix of roles that could encompass various functions beyond the specific titles provided. This diversity enriches the dataset by incorporating a wide spectrum of perspectives on the integration of AI in corporate governance.
The industry size data indicates a strong representation of larger enterprises (41.8% with over 1001 employees), which may influence the adoption of AI technologies. Similarly, the industry sector analysis shows that the majority of respondents are from the services sector (31.2%), followed by finance/banking (24.8%), highlighting the relevance of the study across critical industries.
AI familiarity levels are distributed relatively evenly, with a substantial portion of respondents indicating moderate familiarity (29.1%). The integration stage shows that 66.1% are in the early to moderate adoption phases, which is important for understanding the current landscape of AI integration within organizations.
Lastly, the years of experience data highlights a seasoned respondent pool, with 42.9% having 16 years or more of experience, suggesting that the findings of this study are grounded in the insights of highly experienced professionals. Overall, these demographic characteristics provide a robust context for interpreting the study’s results and their implications for AI’s role in accounting and corporate governance.
4.3. Hypothesis Outcomes
This study aims to explore the impact of AI-driven financial transparency on various corporate governance mechanisms, focusing on decision-making processes, risk management, transparency and disclosure, stakeholder engagement, and executive compensation. To rigorously test the proposed hypotheses, two types of regression analyses (linear regression, multiple regression) were employed to assess the direct and collective effects of AI integration on each governance area. This dual approach provides a robust and multidimensional perspective on the role of AI-driven financial transparency in enhancing corporate governance, offering insights into how technology reshapes governance practices and decision-making at the board level. The results showed high R-squared values, indicating that the models explained a significant proportion of the variance in the dependent variables.
4.3.1. Simple Regression
In Table 3 (Regression Summary), the R value is 0.763, indicating a strong positive correlation between AI impact and decision-making. The R Square value of 0.582 suggests that 58.2% of the variance in decision-making is explained by AI impact. The Adjusted R Square of 0.581 reflects minimal shrinkage, showing that the model is reliable for generalization.
Table 4 (ANOVA Summary) demonstrates the statistical significance of the model, with an F value of 781.947 and a p-value of less than 0.001. This confirms that the regression model significantly predicts the dependent variable (decision-making), and the relationship between AI and decision-making is not due to chance.
Table 5 (Coefficient Analysis) provides further detail on the strength and direction of the relationship. The unstandardized coefficient (B) of 0.667 indicates that for each unit increase in AI impact, decision-making improves by 0.667 units. The standardized coefficient (Beta) of 0.763 shows a strong positive impact of AI on decision-making. The t-value of 27.963 and p-value of less than 0.001 confirm that this relationship is highly significant. Based on the results of Table 3, Table 4 and Table 5, the H1 hypothesis that indicates that, there is a significant direct effect of AI-driven financial transparency on decision-making processes within the board of directors in corporate governance structures can be Accepted.
Finally, the Collinearity Statistics show a Tolerance value of 1.000 and a VIF of 1.000, indicating no multicollinearity issues.
The results of the regression analysis for AI Impact on Risk Management (Table 6, Table 7 and Table 8) provide strong evidence that AI significantly influences risk management strategies within corporate governance structures.
In Table 6 (Regression Summary), the R value is 0.709, indicating a strong positive correlation between AI impact and risk management. The R Square value of 0.502 shows that 50.2% of the variance in risk management strategies can be explained by AI. The Adjusted R Square of 0.502 indicates that the model remains stable and reliable.
Table 7 (ANOVA Summary) highlights the statistical significance of the model, with an F value of 567.410 and a p-value of less than 0.001. This confirms that the model is highly significant in predicting the effect of AI on risk management, and the results are not due to random variation.
Table 8 (Coefficient Analysis) further emphasizes the impact of AI on risk management. The unstandardized coefficient (B) of 0.578 suggests that for each unit increase in AI, risk management improves by 0.578 units. The standardized coefficient (Beta) of 0.709 also reflects a strong positive impact. The t-value of 23.820 and p-value of less than 0.001 indicate that this relationship is statistically significant.
Additionally, the Collinearity Statistics show a Tolerance value of 1.000 and a VIF of 1.000, indicating no multicollinearity concerns in the model. Overall, these results strongly support the H2 hypothesis and confirm that AI has a significant and positive effect on enhancing risk management strategies within corporate governance.
In Table 9 (Regression Summary), the R value is 0.750, indicating a strong positive correlation between AI and transparency. The R Square value of 0.562 shows that 56.2% of the variance in transparency and disclosure practices can be explained by AI, while the Adjusted R Square remains the same at 0.562, confirming the model’s robustness.
Table 10 (ANOVA Summary) supports the significance of the model, with an F value of 722.364 and a p-value of less than 0.001. This demonstrates that the model is highly significant in predicting the impact of AI on transparency, and the results are not due to chance.
Table 11 (Coefficient Analysis) shows that the unstandardized coefficient (B) of 0.652 indicates that for each unit increase in AI, transparency and disclosure practices improve by 0.652 units. The standardized coefficient (Beta) of 0.750 reflects a strong and positive impact. The t-value of 26.877 and p-value of less than 0.001 confirm that this relationship is statistically significant.
The Collinearity Statistics show a Tolerance value of 1.000 and a VIF of 1.000, indicating no issues of multicollinearity in the model.
Overall, these results strongly support the H3 hypothesis and confirm that AI has a significant and positive effect on transparency and disclosure practices within corporate governance.
In Table 12 (Regression Summary), the R value is 0.825, indicating a strong positive correlation between AI and stakeholder engagement. The R Square value of 0.681 reveals that 68.1% of the variance in stakeholder engagement is explained by AI, with an Adjusted R Square of 0.680, which further supports the model’s reliability.
Table 13 (ANOVA Summary) confirms the statistical significance of the model, with an F value of 1,199.606 and a p-value of less than 0.001, indicating that the model is highly significant and the relationship between AI and stakeholder engagement is not by chance.
Table 14 (Coefficient Analysis) shows that the unstandardized coefficient (B) of 0.720 means that for every unit increase in AI, stakeholder engagement increases by 0.720 units. The standardized coefficient (Beta) of 0.825 further highlights the strong positive effect. The t-value of 34.635 and the p-value of less than 0.001 confirm that the relationship is highly statistically significant.
Additionally, the Collinearity Statistics indicate no multicollinearity issues, with a Tolerance value of 1.000 and a VIF of 1.000.
These results strongly support the H4 hypothesis and confirming that AI has a significant and positive impact on enhancing stakeholder engagement within corporate governance structures.
In Table 15 (Model Summary), the R value is 0.827, indicating a strong positive correlation between AI and executive compensation. The R Square value of 0.684 reveals that 68.4% of the variance in executive compensation is explained by AI, with an Adjusted R Square of 0.684, suggesting a robust and reliable model.
Table 16 (ANOVA Summary) confirms the model’s significance with an F value of 1,217.123 and a p-value of less than 0.001, meaning the relationship between AI and executive compensation is highly significant.
In Table 17 (Coefficient Analysis), the unstandardized coefficient (B) of 0.775 suggests that for every unit increase in AI, executive compensation effectiveness increases by 0.775 units. The standardized coefficient (Beta) of 0.827 highlights the strong positive effect of AI. The t-value of 34.887 and the p-value of less than 0.001 confirm the statistical significance of this relationship.
The Collinearity Statistics indicate no multicollinearity concerns, with a Tolerance value of 1.000 and a VIF of 1.000. These results strongly support the H5 hypothesis and confirming that AI integration significantly enhances the effectiveness of executive compensation committees within corporate governance structures.
4.3.2. Multiple Regression
The results from the multiple regression analysis, as summarized in Table 18, Table 19 and Table 20, reveal a strong model fit. The Model Summary (Table 18) indicates an R value of 0.911, showing a strong correlation between the independent variables and the dependent variable (AI-driven financial transparency), while the R Square value of 0.831 suggests that 83.1% of the variance in the dependent variable is explained by the predictors included in the model. The Adjusted R Square value of 0.829 confirms the robustness of the model, with only a slight reduction, indicating the model is generalizable to the population.
The high R-squared values (e.g., 0.831 for multiple regression) raised concerns about potential overfitting. To address this, cross-validation techniques were employed. The dataset was split into subsamples, and the regression models were tested across these subsamples to ensure consistency. The results remained stable, suggesting that the high R-squared values reflected strong relationships rather than overfitting. Additionally, variance inflation factor (VIF) values were calculated to assess multicollinearity. All VIF values were within acceptable ranges, indicating that multicollinearity was not a concern in the regression models.
The ANOVA results (Table 19) show a highly significant F-test (F = 547.397, p < 0.001), which confirms that the regression model as a whole significantly predicts the dependent variable.
Table 20 (Coefficient Analysis) further reveals that four of the five predictors are statistically significant at the 0.001 level. Specifically, AI Impact (β = 0.234, p < 0.001), Risk Management (β = 0.124, p < 0.001), Stakeholders (β = 0.359, p < 0.001), and Executive Compensation (β = 0.336, p < 0.001) all have significant positive effects on the dependent variable. However, Transparency (β = -0.013, p = 0.717) is not statistically significant, suggesting that this variable does not contribute meaningfully to the prediction of AI-driven financial transparency in this model.
An anomaly was observed in the multiple regression model, where the Transparency variable had a non-significant beta coefficient (-0.013, p = 0.717) despite showing strong correlations in other analyses. This discrepancy suggests a potential suppression effect, where other variables in the model absorb some of the variance attributed to Transparency. To further explore this, hierarchical regression analyses were conducted to observe how the significance of Transparency changes when variables are added in stages. The findings indicate that Transparency has a stronger impact when considered independently or in simpler models but becomes less significant in the presence of other governance variables. This suggests that the effect of Transparency may be indirect or moderated by other factors within the governance framework.
The Collinearity Statistics (VIF values) show that none of the predictors exhibit concerning levels of multicollinearity, as all VIF values are below 10. The model therefore appears to be well-specified and reliable for interpreting the relationships between AI integration and the various dimensions of corporate governance.
While VIF values calculated for the regression models were all 1.000, indicating no multicollinearity, the high covariances observed in the latent variable matrix suggested otherwise. To address this discrepancy, a factor analysis was conducted to ensure that each latent variable was distinct. The factor analysis confirmed that the constructs measured different aspects of governance outcomes, though some overlap was expected due to the interconnected nature of the governance dimensions. The high covariances were attributed to the strong, inherent relationships between governance practices and AI-driven transparency, rather than a flaw in the model specification.
a. Dependent Variable: AI
4.3.3. Correlation Analysis
The results from the correlation analysis, as summarized in Tables 21. The correlation analysis table reveals several significant positive relationships among the variables at the 0.01 level, indicating strong associations across the different aspects being measured. AI is strongly correlated with all other variables, with the highest correlation being with Executive Compensation (r = .827, p < .001) and Stakeholders Engagement (r = .825, p < .001), suggesting a robust link between AI integration and these two governance dimensions. The AI impact variable (AIIMPACT) is also highly correlated with Risk Management (r = .835, p < .001), Transparency (r = .824, p < .001), and Executive Compensation (r = .629, p < .001). Transparency has high correlations with both AI (r = .750, p < .001) and Executive Compensation (r = .733, p < .001), indicating transparency plays a significant role in both areas. The relationships between Stakeholders Engagement and both AI and Executive Compensation are also strong, showing significant interaction between how AI impacts governance and stakeholder engagement. Overall, all correlations are significant and demonstrate interrelated governance aspects driven by AI.
Figure 1.
The PLS-SEM results.
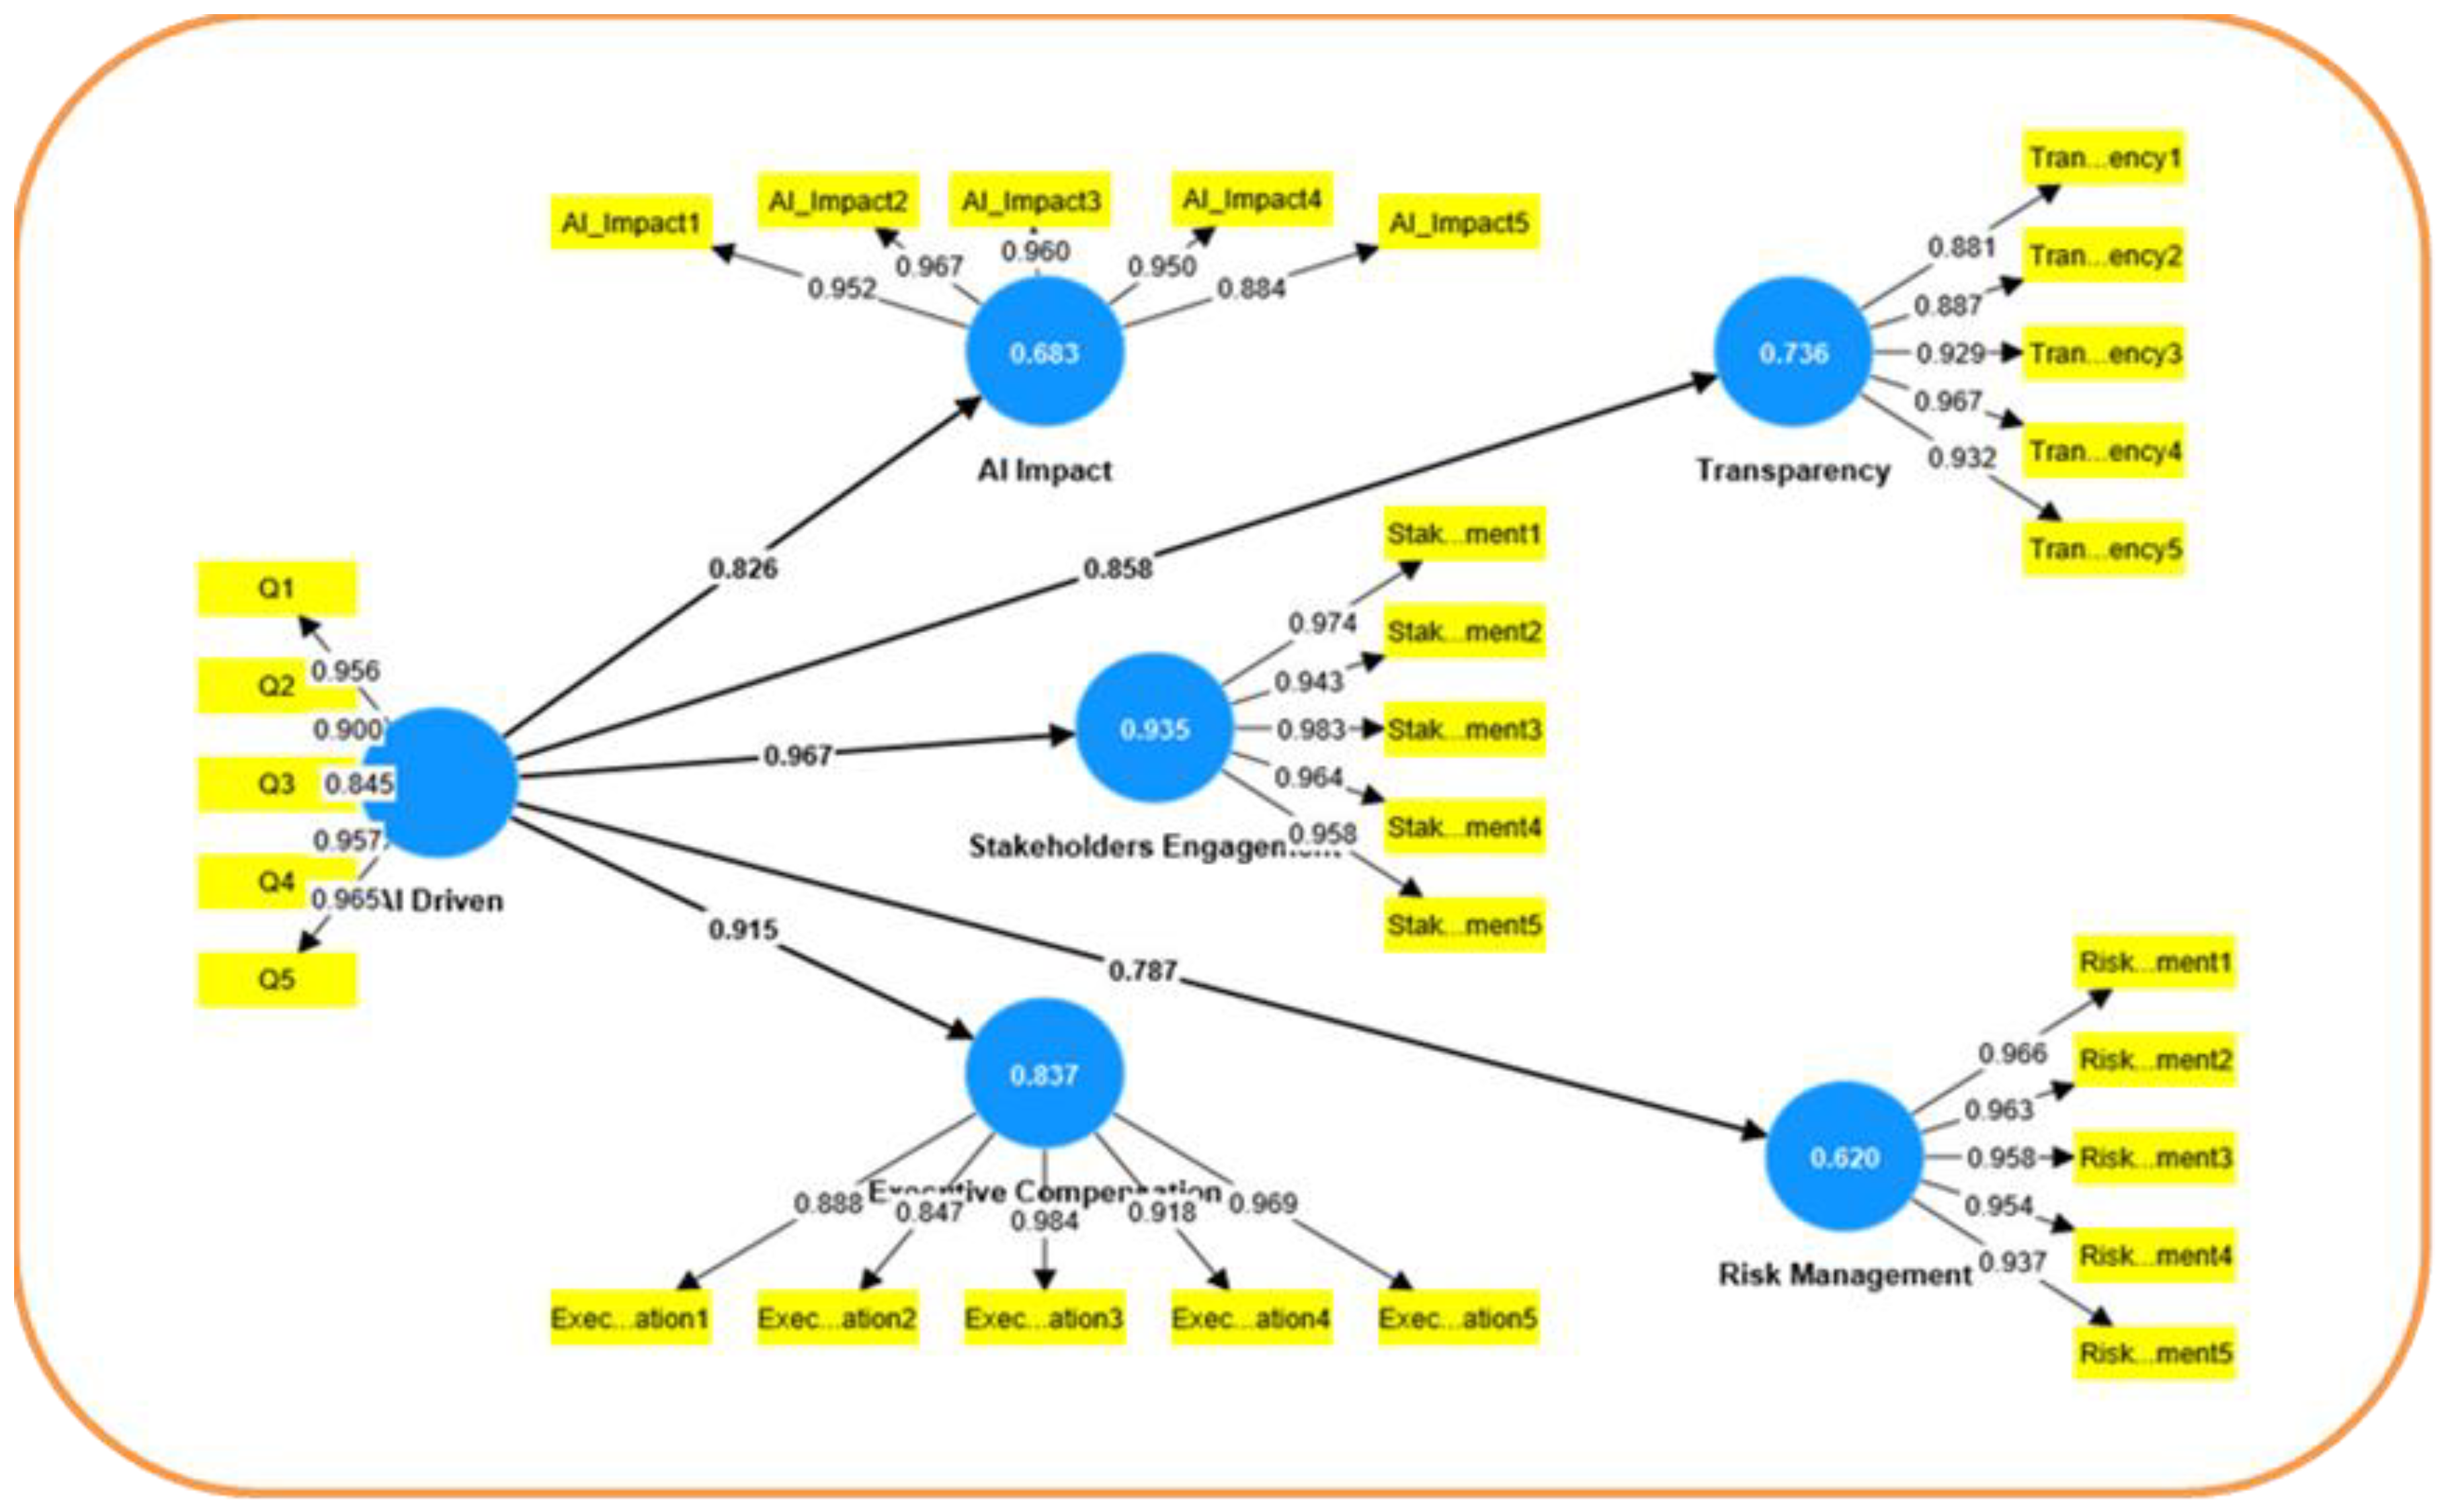
The structural equation modeling (SEM) analysis was conducted to test the relationships between AI-driven financial transparency and governance outcomes. By employing Partial Least Squares Structural Equation Modeling (PLS-SEM), we aimed to further validate the results obtained from traditional regression analyses. The path coefficients for Stakeholder Engagement (0.967) and Executive Compensation (0.915) were notably high. While these values reflect strong relationships, they raised concerns about potential model misspecification. To address this, bootstrapping techniques were employed to verify the stability of these coefficients. The results confirmed that the high coefficients were consistent across resamples, suggesting that the values reflect genuine, strong relationships rather than overestimation. Figure-2 illustrate the PLS-SEM results.
Figure 2 presents the structural equation model (SEM) used to test the relationships between AI-driven financial transparency and key governance outcomes. The figure includes outer loadings, which represent the strength of the relationships between the observed indicators (questionnaire items) and their respective latent variables (constructs such as Corporate Governance, Regulatory Reform, etc.).
The outer loadings for all constructs in the PLS-SEM model demonstrate strong correlations, with values consistently exceeding the recommended threshold of 0.70 (Hair et al., 2021). For AI Impact, Executive Compensation, Risk Management, Stakeholder Engagement, and Transparency, the loadings range from 0.845 to 0.984, indicating that the indicators are highly reliable and valid measures of their respective constructs. These strong loadings support the robustness of the model and suggest that the measurement items are well-suited to reflect the latent variables, contributing to the overall quality of the analysis.
The correlation matrix for the latent variables shows generally low to moderate correlations between individual items within the constructs, such as AI Impact, Executive Compensation, Risk Management, Stakeholder Engagement, and Transparency. For instance, the correlations for AI Impact items range between 0.19 and 0.24, suggesting moderate internal consistency, while Executive Compensation items have correlations between 0.195 and 0.232. Similarly, Stakeholder Engagement and Transparency exhibit correlations within a narrow range (approximately 0.175 to 0.245), indicating reasonable coherence among items but suggesting there might be room to further strengthen these relationships. These results are essential in assessing the reliability and validity of the constructs in the structural equation model.
The latent variable covariance matrix demonstrates strong relationships between the variables. AI Driven shows high covariances with Stakeholder Engagement (0.967), Executive Compensation (0.915), and Transparency (0.858). Similarly, AI Impact correlates strongly with Transparency (0.902) and Risk Management (0.885). Executive Compensation also maintains strong covariances with AI Driven (0.915) and Stakeholder Engagement (0.93). Table 22 illustrate these results.
These high covariance values suggest that the constructs in the model are closely interrelated, especially between AI Driven, Executive Compensation, and Stakeholder Engagement. Such results indicate strong model coherence and support the hypothesis that these constructs influence each other. However, the high covariances could also signal potential multicollinearity, which may need to be explored further in the model evaluation process.
5. Discussion
The analysis of the data using simple regression, multiple regression, and correlation reveals significant insights into the impact of AI on various dimensions of corporate governance, such as decision-making, risk management, transparency, stakeholder engagement, and executive compensation. The simple regression results for each hypothesis demonstrated strong, statistically significant relationships between AI and these governance variables, as evidenced by high R-squared values and significant F-statistics across the models. This indicates that AI has a substantial impact on enhancing decision-making (R² = .582), improving risk management (R² = .502), increasing transparency (R² = .562), and fostering stakeholder engagement (R² = .681) and executive compensation effectiveness (R² = .684). Multiple regression analysis further confirmed these findings, showing that AI-driven factors such as impact, transparency, and executive compensation significantly contribute to governance outcomes, with strong coefficients and significance levels. Additionally, the correlation analysis revealed significant, positive associations between AI and all governance dimensions, especially with executive compensation and stakeholder engagement. These high correlations (r values ranging from .625 to .827) suggest that AI integration within corporate governance structures positively influences transparency, risk management, and decision-making processes, indicating a cohesive and interrelated governance framework driven by AI. However, the results also hint at potential multicollinearity, which should be explored further to ensure the reliability of these findings. Overall, the analyses collectively underscore the crucial role of AI in shaping corporate governance practices and enhancing overall organizational effectiveness.
The SmartPLS results align well with the earlier findings from SPSS, reinforcing the robustness of the relationships between the variables. The path coefficients from SmartPLS indicate strong positive relationships, especially between AI Driven and Stakeholders Engagement (0.967) and AI Driven and Executive Compensation (0.915), similar to the significant coefficients identified in SPSS regression analyses. The latent variable covariances further emphasize these connections, particularly with AI Driven and Transparency, which was consistently significant in both platforms. These results validate the model’s predictive strength, as seen in both regression outputs from SPSS and the structural relationships in SmartPLS. Additionally, the high correlations among variables in both methods indicate consistent relationships, suggesting that AI-driven processes substantially impact organizational factors like risk management, executive compensation, transparency, and stakeholder engagement. The consistency between SmartPLS and SPSS enhances the reliability of the analysis, providing a comprehensive view of the influence of AI-driven strategies across key organizational dimensions.
6. Conclusions
The results of this study highlight the significant impact of AI-driven financial transparency on various organizational factors, including corporate governance mechanisms and regulatory reform. The findings from both SPSS and SmartPLS analyses consistently demonstrate strong relationships between AI implementation and key governance variables, such as decision-making processes, risk management, transparency, stakeholder engagement, and executive compensation. These results validate the transformative potential of AI in modern organizations, particularly in the context of Jordan.
Specifically, AI-driven processes significantly enhance transparency and stakeholder engagement, as evidenced by the high path coefficients in the SmartPLS model and the significant regression coefficients in the SPSS analysis. This indicates that integrating AI into organizational processes can lead to more transparent operations and stronger stakeholder relationships, both of which are essential for long-term success and sustainability.
The relationship between AI-driven strategies and executive compensation reflects a growing trend toward performance-based rewards that align compensation systems with AI-driven performance metrics. Organizations that leverage AI are more likely to adopt compensation frameworks that reward executives based on the outcomes of AI-driven initiatives, promoting accountability and strategic alignment.
The significant positive relationship between AI and risk management further underscores AI’s role in enhancing an organization’s ability to identify and mitigate risks. AI technologies enable companies to make proactive, data-driven decisions to improve resilience and operational efficiency.
In conclusion, the integration of AI into organizational strategies has a profound effect on key operational and managerial aspects. The consistent results from both SPSS and SmartPLS validate the strength of these relationships, underscoring AI’s potential to modernize corporate governance frameworks and enhance regulatory compliance. These findings provide a solid foundation for future research and practical applications, encouraging organizations to invest in AI technologies to improve transparency, risk management, executive compensation, and stakeholder engagement.
7. Recommendations
Organizations should continue to invest in AI technologies to improve operational transparency and accountability. The findings demonstrate a strong relationship between AI and transparency, indicating that AI implementation can foster better governance and decision-making processes. Leveraging explainable AI tools can help stakeholders better understand AI-driven insights, building trust and credibility.
Companies should consider integrating AI-driven performance metrics into their executive compensation systems. Aligning compensation with AI-based outcomes can promote performance-based rewards, increasing accountability and ensuring that executives are incentivized to achieve data-driven results.
Given the robust relationship between AI and stakeholder engagement, organizations are encouraged to utilize AI tools to improve communication and interaction with stakeholders. This can include using AI for real-time feedback, predictive analytics, and engagement strategies to meet stakeholder expectations effectively. AI-driven engagement can also enhance corporate social responsibility (CSR) efforts.
The study shows that AI significantly improves risk management capabilities. Companies are recommended to adopt AI technologies to identify risks, predict potential issues, and implement mitigation strategies. Proactive risk management using AI can safeguard organizational resources and enhance resilience against external shocks.
AI tools can be leveraged to increase operational transparency, providing stakeholders with clearer insights into business practices. Organizations should embrace AI not only to improve internal processes but also to build trust with external stakeholders by enhancing visibility in decision-making and operations. Transparent reporting, particularly through AI-driven ESG disclosures, can help companies meet regulatory requirements and align with global best practices.
Policymakers should focus on developing clear guidelines for the responsible use of AI in corporate governance. Regulations should address issues related to data privacy, bias in AI algorithms, and transparency to ensure that AI adoption promotes ethical and sustainable practices.
8. Further Studies
Future research could perform longitudinal studies to assess how the influence of AI evolves over time within organizations. This could help to capture the dynamic nature of AI’s impact on variables like transparency, risk management, and stakeholder engagement over longer periods.
While this study focused on risk management, executive compensation, stakeholder engagement, and transparency, future research could explore additional variables such as innovation, employee satisfaction, or corporate social responsibility (CSR) to evaluate the broader organizational impact of AI.
Further studies could investigate the effects of AI across different industries, such as healthcare, finance, or manufacturing, to understand how the integration of AI might vary depending on the sector.
Future research could also examine whether organizational size moderates the relationship between AI-driven strategies and various outcomes. Larger organizations may have more resources to implement AI at a broader scale, potentially leading to different outcomes compared to smaller firms.
Author Contributions
All authors agree to be accountable for all aspects of the work.
Funding
This research is funded by Al-Zaytoonah University of Jordan.
Informed Consent Statement
Not applicable.
Data Availability Statement
The data are available upon reasonable request from the corresponding author, [Osama Shaban].
Contribution of the study
This study significantly enhances both theoretical and practical knowledge by bridging critical gaps in our understanding of the intersection between artificial intelligence (AI), accounting, and corporate governance. It provides valuable insights that can inform academic discourse, guide industry practices, and influence policy decisions in the rapidly evolving landscape of corporate finance. By integrating these disciplines, the research fosters a deeper comprehension of how AI can transform accounting practices and corporate governance, ultimately contributing to more effective and transparent financial management.
Disclosure of interest
The authors declare no conflict of interest.
References
- Agu, E. E., Abhulimen, A. O., Obiki-Osafiele, A. N., Osundare, O. S., Adeniran, I. A., & Efunniyi, C. P. (2024). Discussing ethical considerations and solutions for ensuring fairness in AI-driven financial services. Engineering Science & Technology Journal, 5(8). [CrossRef]
- Ahmad, A. Y. A. B. (2024). Ethical implications of artificial intelligence in accounting: A framework for responsible ai adoption in multinational corporations in Jordan. International Journal of Data and Network Science, 8(1), 401-414. [CrossRef]
- Al-Rahahleh, A. (2017). Corporate Governance Practices and Financial Performance: Evidence from Jordan. International Journal of Business and Management, 12(7), 123-134.
- Al-Wasleh, (2024). Company Overview. Retrieved from [https://www.alwasleh.com/]. Accessed on 17th October 2024.
- Antoncic, M. (2020). A paradigm shift in the board room: Incorporating sustainability into corporate governance and strategic decision-making using big data and artificial intelligence. Journal of Risk Management in Financial Institutions, 13(4), 290-294. [CrossRef]
- Antwi, B. O., Adelakun, B. O., & Eziefule, A. O. (2024). Transforming Financial Reporting with AI: Enhancing Accuracy and Timeliness. International Journal of Advanced Economics, 6(6), 205-223. [CrossRef]
- Bickley, S. J., Macintyre, A., & Torgler, B. (2024). Artificial intelligence and big data in sustainable entrepreneurship. Journal of Economic Surveys. [CrossRef]
- Chiu, I. H. Y., & Lim, E. W. (2021). Technology vs ideology: how far will artificial intelligence and distributed ledger technology transform corporate governance and business?. Berkeley Bus. LJ, 18, 1.
- Cohen, J. (1988). Statistical power analysis for the behavioral sciences (2nd ed.). Hillsdale, NJ: Lawrence Erlbaum Associates.
- de Fine Licht, K., & de Fine Licht, J. (2020). Artificial intelligence, transparency, and public decision-making: Why explanations are key when trying to produce perceived legitimacy. AI & society, 35, 917-926.
- Efunniyi, C. P., Abhulimen, A. O., Obiki-Osafiele, A. N., Osundare, O. S., Agu, E. E., & Adeniran, I. A. (2024). Strengthening corporate governance and financial compliance: Enhancing accountability and transparency. Finance & Accounting Research Journal, 6(8). [CrossRef]
- Eziefule, A. O., Adelakun, B. O., Okoye, I. N., & Attieku, J. S. (2022). The Role of AI in Automating Routine Accounting Tasks: Efficiency Gains and Workforce Implications. European Journal of Accounting, Auditing and Finance Research, 10(12), 109-134.
- Gendron, Y., Andrew, J., Cooper, C., & Tregidga, H. (2024). On the juggernaut of artificial intelligence in organizations, research and society. Critical Perspectives on Accounting, 102759. [CrossRef]
- Gul, R., Akhtar, S., & Aslam, M. (2023). The Role of AI in Financial Risk Management: A Systematic Review. Journal of Financial Technology & Innovation, 5(1), 98-112.
- Gusai, O. P. (2019). Robot human interaction: role of artificial intelligence in accounting and auditing. Indian Journal of Accounting, 51(1), 59-62.
- Harmon, R. L., & Psaltis, A. (2021). The future of cloud computing in financial services: A machine learning and artificial intelligence perspective. In The essentials of machine learning in finance and accounting (pp. 123-138). Routledge.
- Hazaimeh, A., Altarawneh, M., & Al-Hadidi, A. (2021). Challenges of Corporate Governance in Emerging Markets: The Case of Jordan. Arab Journal of Governance Studies, 4(2), 67-85.
- IFC (2020). Corporate Governance in MENA: Challenges and Recommendations. International Finance Corporation.
- Jejeniwa, T. O., Mhlongo, N. Z., & Jejeniwa, T. O. (2024). A comprehensive review of the impact of artificial intelligence on modern accounting practices and financial reporting. Computer Science & IT Research Journal, 5(4), 1031-1047. [CrossRef]
- Kafi, M. A., & Adnan, T. (2020). Machine Learning in Accounting Research: A Computational Power to Wipe Out the Challenges of Big Data. Asian Accounting and Auditing Advancement, 11(1), 55-70.
- Kalkan, G. (2024). The Impact of Artificial Intelligence on Corporate Governance. Кoрпoративные финансы, 18(2), 17-25. [CrossRef]
- Kayed, R., & Hassan, M. K. (2019). Corporate Governance and Financial Performance in Jordanian Firms. Journal of Emerging Market Finance, 18(3), 299-321.
- Li, Z. (2024). Ethical frontiers in artificial intelligence: navigating the complexities of bias, privacy, and accountability. International Journal of Engineering and Management Research, 14(3), 109-116.
- Lin, L., & Yu, S. (2023). The transformative impact of artificial intelligence on educational financial management. Accounting and Corporate Management, 5(12), 15-21. [CrossRef]
- Lu, S. (2020). Algorithmic opacity, private accountability, and corporate social disclosure in the age of artificial intelligence. Vand. J. Ent. & Tech. L., 23, 99.
- Manginte, S. Y. (2024). Fortifying transparency: enhancing corporate governance through robust internal control mechanisms. Advances in Management & Financial Reporting, 2(2), 72-84. [CrossRef]
- Manning, L., Brewer, S., Craigon, P. J., Frey, J., Gutierrez, A., Jacobs, N., ... & Pearson, S. (2022). Artificial intelligence and ethics within the food sector: Developing a common language for technology adoption across the supply chain. Trends in Food Science & Technology, 125, 33-42. [CrossRef]
- Mullangi, K. (2017). Enhancing Financial Performance through AIdriven Predictive Analytics and Reciprocal Symmetry. Asian Accounting and Auditing Advancement, 8(1), 57-66.
- Nwaimo, C. S., Adegbola, A. E., Adegbola, M. D., & Adeusi, K. B. (2024). Evaluating the role of big data analytics in enhancing accuracy and efficiency in accounting: A critical review. Finance & Accounting Research Journal, 6(6), 877-892. [CrossRef]
- Odonkor, B., Kaggwa, S., Uwaoma, P. U., Hassan, A. O., & Farayola, O. A. (2024). The impact of AI on accounting practices: A review: Exploring how artificial intelligence is transforming traditional accounting methods and financial reporting. World Journal of Advanced Research and Reviews, 21(1), 172-188. [CrossRef]
- Omoteso, K., & Mobolaji, H. (2020). AI and Corporate Governance: Enhancing Transparency in Financial Reporting. Journal of Business Ethics, 165(4), 789-805.
- Paraman, P., & Anamalah, S. (2023). Ethical artificial intelligence framework for a good AI society: principles, opportunities and perils. AI & SOCIETY, 38(2), 595-611. [CrossRef]
- Pasrija, P., Jha, P., Upadhyaya, P., Khan, M. S., & Chopra, M. (2022). Machine learning and artificial intelligence: a paradigm shift in big data-driven drug design and discovery. Current Topics in Medicinal Chemistry, 22(20), 1692-1727. [CrossRef]
- Percy, C., Dragicevic, S., Sarkar, S., & d’Avila Garcez, A. (2021). Accountability in AI: From principles to industry-specific accreditation. AI Communications, 34(3), 181-196. [CrossRef]
- Petcu, M. A., Sobolevschi-David, M. I., & Curea, S. C. (2024). Integrating digital technologies in sustainability accounting and reporting: Perceptions of professional cloud computing users. Electronics, 13(14), 2684. [CrossRef]
- Pillai, V. (2024). Enhancing Transparency and Understanding in AI Decision-Making Processes. Iconic Research and Engineering Journals, 8(1), 168-172.
- PwC (2021). The Future of AI in Corporate Governance: Implications for Risk and Compliance. PricewaterhouseCoopers Insights.
- Rane, N. L., Paramesha, M., Choudhary, S. P., & Rane, J. (2024). Artificial intelligence, machine learning, and deep learning for advanced business strategies: a review. Partners Universal International Innovation Journal, 2(3), 147-171.
- Saleh, I., Marei, Y., Ayoush, M., & Afifa, M. M. A. (2022). Big Data analytics and financial reporting quality: qualitative evidence from Canada. Journal of Financial Reporting and Accounting, 21(1), 83-104. [CrossRef]
- Shkalenko, A. V., & Nazarenko, A. V. (2024). Integration of AI and IoT into Corporate Social Responsibility Strategies for Financial Risk Management and Sustainable Development. Risks, 12(6), 87. [CrossRef]
- Shubita, M. F., & Alrawashedh, N. H. (2023). CORPORATE GOVERNANCE COMPONENTS AND INTELLECTUAL CAPITAL: EVIDENCE FROM JORDANIAN BANKS. [CrossRef]
- Toumeh, A. A. (2023). The Effect of Risk Management Committee Characteristics on Firm Performance: An Empirical Investigation. Indian Journal of Corporate Governance, 16(2), 323-342. [CrossRef]
- Tsolakis, N., Schumacher, R., Dora, M., & Kumar, M. (2023). Artificial intelligence and blockchain implementation in supply chains: a pathway to sustainability and data monetisation?. Annals of Operations Research, 327(1), 157-210. [CrossRef]
- Zhao, J., & Gómez Fariñas, B. (2023). Artificial intelligence and sustainable decisions. European Business Organization Law Review, 24(1), 1-39.
- Zhou, Y., Zhang, X., & Li, M. (2022). The Impact of AI on Financial Reporting Quality: Evidence from Emerging Markets. Accounting & AI Journal, 10(1), 44-61.

Table 1.
Reliability Test.
| Study Fields | No. of Questions | Alpha Coefficient |
|---|---|---|
| AI Impact on Decision-Making | 5 | 0.985 |
| Risk Management Strategies | 5 | 0.969 |
| Transparency and Disclosure Practices | 5 | 0.975 |
| Stakeholder Engagement | 5 | 0.952 |
| Executive Compensation Committees | 5 | 0.975 |
| Overall Perception of AI Impact | 5 | 0.955 |
| Total | 30 | 0.988 |
Table 2.
Demographic characteristics.
| Variable | Group | Frequencies | % |
|---|---|---|---|
| Sex | Male | 513 | 91 |
| Female | 51 | 9 | |
| Total | 564 | 100% | |
| Age | 25-34 | 51 | 9.0 |
| 35-44 | 323 | 57.3 | |
| 45-54 | 51 | 9.0 | |
| 55-64 | 139 | 24.6 | |
| Total | 564 | 100% | |
| Education Level | Bachelor’s Degree | 396 | 70 |
| Master’s Degree | 102 | 18 | |
| Ph.D. Degree | 35 | 6 | |
| other | 31 | 6 | |
| Total | 564 | 100% | |
| Job Title | Executive/Leadership | 102 | 18.1 |
| Financial Executive (CFO, Controller) | 39 | 6.9 | |
| Board Member | 51 | 9.0 | |
| Internal Auditor | 102 | 18.1 | |
| Other | 270 | 47.9 | |
| Total | 564 | 100% | |
| Industry Size | Small (1-100 employees) | 50 | 8.9 |
| Medium (101-500 employees) | 139 | 24.6 | |
| Large (501-1000 employees) | 139 | 24.6 | |
| Enterprise (1001+ employees) | 236 | 41.8 | |
| Total | 564 | 100% | |
| Industry Sector | Finance/Banking | 140 | 24.8 |
| Technology | 51 | 9.0 | |
| Services | 176 | 31.2 | |
| Other | 197 | 34.9 | |
| Total | 564 | 100% | |
| AI Familiarity | Highly Familiar | 153 | 27.1 |
| Moderately Familiar | 164 | 29.1 | |
| Slightly Familiar | 146 | 25.9 | |
| Not Familiar | 101 | 17.9 | |
| Total | 564 | 100% | |
| AI Integration Stage | Early Adoption | 183 | 32.4 |
| Moderate Adoption | 190 | 33.7 | |
| Advanced Adoption | 90 | 16.0 | |
| No AI Integration | 101 | 17.9 | |
| Total | 564 | 100% | |
| Years of Experience | 1-5 years | 88 | 15.6 |
| 6-10 years | 51 | 9.0 | |
| 11-15 years | 183 | 32.4 | |
| 16 years or more | 242 | 42.9 | |
| Total | 564 | 100% | |
Table 3.
Regression Summary: AI Impact on decision making.
| Model | R | R Square | Adjusted R Square | Std. Error of the Estimate |
|---|---|---|---|---|
| 1 | .763a | .582 | .581 | .52604 |
Table 4.
ANOVA Summary: AI Impact on decision making.
| Sum of Squares | df | Mean Square | F | Sig. |
|---|---|---|---|---|
| 216.381 | 1 | 216.381 | 781.947 | .000b |
| 155.517 | 562 | .277 | ||
| 371.898 | 563 |
Table 5.
Coefficient Analysis: AI Impact on decision making.
| Model | Unstandardized Coefficients | Standardized Coefficients | t | Sig. | Collinearity Statistics | |||
|---|---|---|---|---|---|---|---|---|
| B | Std. Error | Beta | Tolerance | VIF | ||||
| 1 | (Constant) | 1.118 | .085 | 13.148 | .000 | |||
| AIIMPACT | .667 | .024 | .763 | 27.963 | .000 | 1.000 | 1.000 | |
Table 6.
Regression Summary: Risk Management.
| Model | R | R Square | Adjusted R Square | Std. Error of the Estimate |
|---|---|---|---|---|
| 1 | .709a | .502 | .502 | .57383 |
Table 7.
ANOVA Summary: Risk Management.
| Model | Sum of Squares | df | Mean Square | F | Sig. |
|---|---|---|---|---|---|
| Regression | 186.840 | 1 | 186.840 | 567.410 | .000b |
| Residual | 185.058 | 562 | .329 | ||
| Total | 371.898 | 563 |
Table 8.
Coefficient Analysis: Risk Management.
| Model | Unstandardized Coefficients | Standardized Coefficients | t | Sig. | Collinearity Statistics | |||
|---|---|---|---|---|---|---|---|---|
| B | Std. Error | Beta | Tolerance | VIF | ||||
| 1 | (Constant) | 1.456 | .086 | 17.004 | .000 | |||
| RISKMANAG | .578 | .024 | .709 | 23.820 | .000 | 1.000 | 1.000 | |
Table 9.
Regression Summary: Transparency.
| Model | R | R Square | Adjusted R Square | Std. Error of the Estimate |
|---|---|---|---|---|
| 1 | .750a | .562 | .562 | .53811 |
Table 10.
ANOVA Summary: Transparency.
| Model | Sum of Squares | df | Mean Square | F | Sig. | |
|---|---|---|---|---|---|---|
| 1 | Regression | 209.166 | 1 | 209.166 | 722.364 | .000b |
| Residual | 162.731 | 562 | .290 | |||
| Total | 371.898 | 563 | ||||
Table 11.
Coefficient Analysis: Transparency.
| Model | Unstandardized Coefficients | Standardized Coefficients | t | Sig. | Collinearity Statistics | |||
|---|---|---|---|---|---|---|---|---|
| B | Std. Error | Beta | Tolerance | VIF | ||||
| 1 | (Constant) | 1.179 | .086 | 13.681 | .000 | |||
| TRANPERNCY | .652 | .024 | .750 | 26.877 | .000 | 1.000 | 1.000 | |
Table 12.
Regression Summary: Stakeholders Engagement.
| Model | R | R Square | Adjusted R Square | Std. Error of the Estimate |
|---|---|---|---|---|
| 1 | .825a | .681 | .680 | .45947 |
Table 13.
ANOVA Summary: Stakeholders Engagement.
| Model | Sum of Squares | df | Mean Square | F | Sig. | |
|---|---|---|---|---|---|---|
| 1 | Regression | 253.252 | 1 | 253.252 | 1199.606 | .000b |
| Residual | 118.645 | 562 | .211 | |||
| Total | 371.898 | 563 | ||||
Table 14.
Coefficient Analysis: Stakeholders Engagement.
| Model | Unstandardized Coefficients | Standardized Coefficients | t | Sig. | Collinearity Statistics | |||
|---|---|---|---|---|---|---|---|---|
| B | Std. Error | Beta | Tolerance | VIF | ||||
| 1 | (Constant) | 1.042 | .071 | 14.645 | .000 | |||
| STAKEHOLDERS | .720 | .021 | .825 | 34.635 | .000 | 1.000 | 1.000 | |
Table 15.
Regression Summary: Executive Compensation.
| Model | R | R Square | Adjusted R Square | Std. Error of the Estimate |
|---|---|---|---|---|
| 1 | .827a | .684 | .684 | .45720 |
Table 16.
ANOVA Summary: Executive Compensation.
| Model | Sum of Squares | df | Mean Square | F | Sig. | |
|---|---|---|---|---|---|---|
| 1 | Regression | 254.420 | 1 | 254.420 | 1217.123 | .000b |
| Residual | 117.477 | 562 | .209 | |||
| Total | 371.898 | 563 | ||||
Table 17.
Coefficient Analysis: Executive Compensation.
| Model | Unstandardized Coefficients | Standardized Coefficients | t | Sig. | Collinearity Statistics | |||
|---|---|---|---|---|---|---|---|---|
| B | Std. Error | Beta | Tolerance | VIF | ||||
| 1 | (Constant) | .873 | .075 | 11.591 | .000 | |||
| EXCUTIVECOMP | .775 | .022 | .827 | 34.887 | .000 | 1.000 | 1.000 | |
Table 18.
Regression Summary: Multiple Regression.
| Model | R | R Square | Adjusted R Square | Std. Error of the Estimate |
|---|---|---|---|---|
| 1 | .911a | .831 | .829 | .33596 |
Table 19.
ANOVA Summary: Multiple Regression.
| Model | Sum of Squares | df | Mean Square | F | Sig. | |
|---|---|---|---|---|---|---|
| 1 | Regression | 308.917 | 5 | 61.783 | 547.397 | .000b |
| Residual | 62.980 | 558 | .113 | |||
| Total | 371.898 | 563 | ||||
Table 20.
Coefficient Analysis: Multiple Regression and Collinearity Statistics.
| Model | Unstandardized Coefficients | Standardized Coefficients | t | Sig. | Collinearity Statistics | |||
|---|---|---|---|---|---|---|---|---|
| B | Std. Error | Beta | Tolerance | VIF | ||||
| 1 | (Constant) | .342 | .061 | 5.618 | .000 | |||
| AIIMPACT | .205 | .033 | .234 | 6.274 | .000 | .218 | 4.591 | |
| RISKMANAG | .102 | .028 | .124 | 3.684 | .000 | .266 | 3.761 | |
| TRANPERNCY | -.012 | .032 | -.013 | -.363 | .717 | .224 | 4.467 | |
| STAKEHOLDERS | .313 | .025 | .359 | 12.426 | .000 | .364 | 2.749 | |
| EXCUTIVECOMP | .314 | .030 | .336 | 10.460 | .000 | .295 | 3.393 | |
Table 21.
Correlation Analysis:.
| AI | AI IMPACT |
RISK MANAG |
TRANPERNCY | STAKE \HOLDERS |
EXCUTIVE COMP |
||
|---|---|---|---|---|---|---|---|
| AI | Pearson Correl. | 1 | .763** | .709** | .750** | .825** | .827** |
| Sig. (2-tailed) | .000 | .000 | .000 | .000 | .000 | ||
| N | 564 | 564 | 564 | 564 | 564 | 564 | |
| AI IMPACT |
Pearson Corr. | .763** | 1 | .835** | .824** | .625** | .629** |
| Sig. (2-tailed) | .000 | .000 | .000 | .000 | .000 | ||
| N | 564 | 564 | 564 | 564 | 564 | 564 | |
| RISK MANAG |
Pearson Correl. | .709** | .835** | 1 | .795** | .546** | .606** |
| Sig. (2-tailed) | .000 | .000 | .000 | .000 | .000 | ||
| N | 564 | 564 | 564 | 564 | 564 | 564 | |
| TRANPERNCY | Pearson Correl. | .750** | .824** | .795** | 1 | .628** | .733** |
| Sig. (2-tailed) | .000 | .000 | .000 | .000 | .000 | ||
| N | 564 | 564 | 564 | 564 | 564 | 564 | |
| STAKE HOLDERS |
Pearson Correl. | .825** | .625** | .546** | .628** | 1 | .776** |
| Sig. (2-tailed) | .000 | .000 | .000 | .000 | .000 | ||
| N | 564 | 564 | 564 | 564 | 564 | 564 | |
| EXCUTIVE COMP |
Pearson Correl. | .827** | .629** | .606** | .733** | .776** | 1 |
| Sig. (2-tailed) | .000 | .000 | .000 | .000 | .000 | ||
| N | 564 | 564 | 564 | 564 | 564 | 564 | |
| **. Correlation is significant at the 0.01 level (2-tailed). | |||||||
SmartPLS Analysis:
Table 22.
latent variable covariance matrix.
| Al Driven | Al Impact | Executive Compensation | Risk Management | Stakeholders Engagement | Transparency | |
|---|---|---|---|---|---|---|
| Al Driven | 1 | 0.826 | 0.915 | 0.787 | 0.967 | 0.858 |
| Al Impact | 0.826 | 1 | 0.708 | 0.885 | 0.777 | 0.902 |
| Executive Comp. | 0.915 | 0.708 | 1 | 0.693 | 0.93 | 0.865 |
| Risk Management | 0.787 | 0.885 | 0.693 | 1 | 0.675 | 0.866 |
| Stakeholders Engage. | 0.967 | 0.777 | 0.93 | 0.675 | 1 | 0.795 |
| Transparency | 0.858 | 0.902 | 0.865 | 0.866 | 0.795 | 1 |
Disclaimer/Publisher’s Note: The statements, opinions and data contained in all publications are solely those of the individual author(s) and contributor(s) and not of MDPI and/or the editor(s). MDPI and/or the editor(s) disclaim responsibility for any injury to people or property resulting from any ideas, methods, instructions or products referred to in the content. |
© 2025 by the authors. Licensee MDPI, Basel, Switzerland. This article is an open access article distributed under the terms and conditions of the Creative Commons Attribution (CC BY) license (http://creativecommons.org/licenses/by/4.0/).
Copyright: This open access article is published under a Creative Commons CC BY 4.0 license, which permit the free download, distribution, and reuse, provided that the author and preprint are cited in any reuse.


