
Submitted:
10 March 2025
Posted:
11 March 2025
You are already at the latest version
Abstract
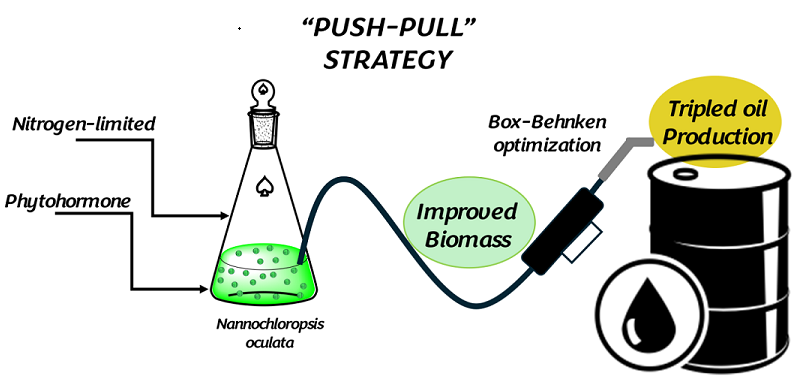
The high demand for sustainable biodiesel feedstocks has led to the exploration of innovative strategies to enhance lipid productivity in microalgae. This study introduces a push-pull strategy to optimize lipid accumulation in Nannochloropsis oculata. The benzyl amino purine (BAP) and naphthalene acetic acid (NAA) stimulation, acting as the 'push' component, significantly boost growth and nutrient-stress tolerance. Meanwhile, the 'pull' component, nitrogen (N) deficiency, triggers lipid biosynthesis. A Box-Behnken design was employed to optimize the factors named BAP fraction (0-1), total phytohormone (PH) BAP/NAA mix dose (0-20 ppm), and N-concentration (0-50%). The combined BAP/NAA treatment not only significantly increased biomass (15% higher than the control) but also mitigated N-stress with higher doses (20 ppm). Lipid yield surged from 12.4% to 38.87% under optimized conditions (23.25% N, 39.5 ppm NAA, and BAP fraction 0). The push-pull strategy contributed to boosting lipid synthesis and balancing biomass production. N-limitation and total PH dosage were the determining factors in this strategy. This work demonstrates the potential of the push-pull strategy in increasing lipid accumulation, offering a promising and optimistic solution for biodiesel production at scale from microalgae. By reducing dependence on fossil fuels, N. oculata emerges as a confident feedstock for oil extraction and biodiesel.
Keywords:
microalgae nitrogen-stress
; lipid biosynthesis
; Phytohormone stimulation
; auxins
; cytokinin
; Box-Behnken
; optimization
; Biodiesel
1. Introduction
Fossil fuels have been the basis of global social and economic development for a long time. Greenhouse gas (GHG) emissions are expected to peak in the next few years, but it is imperative that they decline rapidly. The decisions made by consumers and government policies in the coming years will have profound implications for energy markets and the future of our planet, highlighting the potential gravity of the situation. By 2023, fossil fuels represented up to 80% of the energy mix, and their demand has been increasing, as well as concerns about the depletion of reserves of these finite resources [1]. There is a linear relationship between energy consumption, populational economic growth, and carbon dioxide emissions. Consequently, the current climate change problem is due primarily to the generation of greenhouse gases (GHG) from burning fossil fuels. Therefore, a change in the energy model is essential, with a vision focused on creating greener fuels to achieve carbon neutrality while meeting the global demand for energy services. This new model must be based on the use of renewable energies. Biofuels are energetically sustainable, their stability and energy density are high, and they reduce emissions of atmospheric pollutants [2]. However, the voracious demand for energy and the high costs of raw materials for biofuel production make their use globally unfeasible, perpetuating the use of fossil fuels [3]. Biodiesel is a renewable alternative fuel capable of competing with petroleum diesel. Biodiesel is the only alternative fuel used directly in existing engines, as its density and cetane number are similar to conventional diesel. The production and burning of biodiesel reduces emissions of particulate matter, polycyclic aromatic hydrocarbons, carbon dioxide, and sulfur dioxide by up to 41% [4]. Biodiesel is a biofuel from mono-alkyl esters of long-chain fatty acids obtained mainly from vegetable oils. The most commonly used vegetable oils for biodiesel are palm oil (32%), soybean oil (26%), and canola oil (15%); the remaining 27% corresponds to other raw materials, such as used vegetable oils, virgin vegetable oils and animal fats [5]. Producing biodiesel to substitute petroleum would negatively impact on the agri-food sector, leading to ethical dilemmas and enduring discussion between food or fuel.
Microalgae emerge as a beacon of hope in the biofuel dilemma. Among the various feedstocks considered for biofuel generation, microalgae stand out due to their high fatty acid content. Large-scale cultivation of microalgae not only produces high O2 ratios and reduces atmospheric CO2 concentration but also does so without compromising the production of food, fodder, and other products derived from food crops [6,7]. The versatility of microalgae biomass, which can be converted into biodiesel, bio-oil, bioethanol, biohydrogen, and biomethane through thermochemical and biochemical processes, offers a promising and sustainable solution. This approach allows for the simultaneous and sustainable production of energy and specific high-value compounds under a biorefinery concept, which integrates biomass conversion processes to produce fuels, power, and chemicals.
Microalgal biodiesel provides sufficient environmental advantages to merit subsidy. However, the main limitation is biomass recovery, which refers to collecting and extracting the microalgal biomass and production costs compared to other feedstocks. Therefore, the search and selection of highly oil-producing strains and the development of optimized cultivation conditions to achieve competitive cost and maximum productivity of microalgal biodiesel is urgent [8]. An initial analysis of several microalgal species suggested that Nannochloropsis sp. showed the most promise as a potential feedstock for biofuel production. The potential of Nannochloropsis sp. as a biofuel feedstock is intriguing and should pique the audience's interest. Nannochloropsis oculata has been shown to have a high potential for biodiesel production: it has a high growth rate and CO2 fixation, high lipid content, and yield, and is easy to grow in saline, non-saline environments and under various pH and temperature conditions [9]. In addition, N. oculata possesses a high percentage of monounsaturated fatty acids, making it an ideal feedstock for biodiesel production [10].
While microalgae have long been considered promising feedstocks for biodiesel, the economics of microalgal biodiesel production need significant improvement. This challenge should serve as a call to action, motivating the audience to further research and innovate in this field. Several strategies have been evaluated to boost microalgal biomass and lipids. For example, there are those based on the generation of abiotic stress, which refers to non-living factors in the environment that can increase the accumulation of lipid microalgae by modifying variables such as nitrogen (N), phosphorus (P), sulfur (S), pH, salinity, temperature, and light. Of all the above, N-deficiency is the most effective resource to modify the carbon storage pattern favoring the synthesis of lipids, mainly triacylglycerol (TAG). In Chlorella vulgaris, a three-day N-deficiency increased to 33.33% lipid content with low biomass, photosynthetic pigment, and protein production [11]. In Nannochloropsis oceanica, gradual N-depletion for 7 days stimulated carbohydrate and TAG biosynthesis; the increase was 1.34 and 0.15-fold in carbohydrates and lipids, respectively. Although N-depletion stress strategies are a practical resource that favors lipid synthesis, they decrease cell division and growth, generating low biomass and, consequently, low lipid productivity [12,13].
On the other hand, studies on supplementing microalgal cultures with phytohormones (PH) have shown promising results in metabolic regulation. Singh et al. [14] evaluated the synergistic effect of auxins (indole acetic acid, indole butyric acid, and indole propionic acid) and cytokinins (benzyl amino purine and thidiazuron). They determined that treatment with the auxin indole butyric acid (AIB) increased cell size, while the cytokinin 6-benzyl amino purine (BAP) mainly promoted cell division in Desmodesmus sp. JS07, which favored biomass production and increased lipid content. Similarly, the combined effect of indole acetic acid (IAA) and BAP was evaluated on the growth of Nannochloropsis sp. The addition of auxins and cytokinins to the culture medium positively affected biomass production (3.65 g/L) and carbohydrate content (0.30 mg/L) [15]. This innovative approach to enhancing lipid production in microalgae recently pique the global scientific interest.
Other studies have revealed that applying PH under N-depletion improved lipid accumulation and maintained microalgal growth. This stimulant/stressing strategy, here defined as the push-pull type, could provide a way out of the bottleneck present in microalgal abiotic stress methodologies and strengthen those where only stimulus with growth regulators has been used. For example, the combined effect of 3-indole acetic acid (IAA) supplementation with N-depletion was evaluated in Nannochloropsis oceanica. The result was that combining IAA with N-depletion increased the biomass dry weight and the amount of fatty acids [16]. Another interesting study evaluated in Scenedesmus obliquus the effect of benzyl amino purine (BAP) and gibberellic acid (GA) coupled with N-limitation on cell growth, biomass, and fatty acids. The results were that BAP increased the biomass by 1.44 and GA by 1.35-fold. The total lipids increased by 2.8 and 1.11-fold. The phytohormone addition to S. obliquus at different initial nitrogen percentages N0%, N25%, and N50% showed significant cell growth and biomass productivity compared to control cultures. The BAP and GA N-starved induced 55% and 50% of the highest lipid yields [17].
The auxin naphthalene acetic acid (15 ppm) was applied to Chlorella vulgaris cultures under N- and P-deficiency. This phytohormone did not show a significant effect on cell growth. However, it did stimulate the accumulation of neutral lipids in combination with N-limitation. Lipid content increased by 107% and doubled using 10 ppm NAA under simultaneous N- and P-limitation [18].
Nowadays, it is not only sufficient to use experimental strategies that improve the response of microalgae to one or more variables. If the objective is to determine the best operability conditions of a process, using optimization tools is indispensable to find the values that maximize lipids and biomass concentration in microalgal cultures. Response surface methodology (RSM) overcomes the limitations associated with single-factor optimization. Among the main types of response surface designs are the Composite Central Design (CCD) and the Box-Behnken design (BBD). The Box-Behnken design is a quadratic model, which can only be applied when three or more factors are used [19]. Few studies have used experimental designs by RSM to optimize microalgal cultures stimulated with phytohormones. One of them was the evaluation of the effect of selenium (Se) and gibberellic acid (GA) on lipid content and biomass productivity in Tetradesmus obliquus using RSM. Optimizing the dose of Se (15 ug/L) and GA (50 uM) allowed the increase of the lipid content by 42.80 % with a biomass productivity of 0.964 g/L/d [20]. By using the RSM the combined effect of zeatin, IAA, and GA on biomass and lipid production in Acutodesmus obliquus under nitrogen limitation it was optimized the microalgae lipid production, where lipid content increased 1.9-fold over the control while maintaining biomass production [21]. The optimum conditions were 0.1 ppm zeatin, 1 ppm IAA, and five ppm GA. In another study, the combined effect of three phytohormones: myoinositol (MI), IAA, and abscisic acid (ABA) used RSM to analyze the biomass production in Dunaliella salina. The increased biomass by 1.2-fold over the control was achieved with the optimized doses of 552 ppm MI, 0.14 M IAA, and 0.22 M ABA. The effects of phytohormone supplementation under nutrient depletion are species-dependent [22]. The individual behavior of microalgae species exposed to a particular phytohormone and the response to an applied stress strategy are arbitrary. The optimization of parameters between variables is crucial to increase the quantity and improve the quality of microalgal products. Consequently, cost reduction and better use of renewable resources would be achieved, contributing to biofuel production's sustainability. The objective of this research was to evaluate the effect on lipid and biomass production of a mixture of the phytohormones 6-benzylaminopurine and naphthaleneacetic acid in combination with N-deficiency on the microalga Nannochloropsis oculata. Using a Box-Behnken experimental design, the BAP fraction, the BAP/NAA mixture dose and the N concentration were optimized to obtain higher lipid yields for biodiesel production while preserving microalgal growth.
2. Materials and Methods
The Nannochloropsis oculata (UTEX 2164) was obtained from the algal collection of the University of Texas, U.S.A. Transparent 4 L glass vials were used with 3.5 L of Basal Bold Medium (BBM) [23] with an optical density (750 nm) of N. oculata at 0.2. Cultures were incubated at 24°C ± 2 °C, with light/dark cycles of 16/8 h with fluorescent cool-white LED lamps (Tecnolite) at an intensity of 65 µmol m2 s-1. An aeration system was adapted with a flow rate of 2.5 L/min, continuously injected through a pump. The optical density of the culture was measured using a UV-visible spectrophotometer (Thermo Scientific Genesys 10s) at 750 nm (OD750) every 72 hours to determine the growth kinetics. Once the early stationary stage was detected, the biomass was harvested by centrifugation of the medium at 4500 ppm for 10 minutes. The biomass was kept under refrigeration (6 °C) until experimental assays.
2.1. Experimental Design and Statistical Analysis
The experimental design for optimizing biomass and lipid production was carried out using a BBD in Design-Expert® v11 Trial software for Windows (STAT-EASE®).
In the experimental design, the independent variables were: 1) BAP fraction (A), 2) BAP/NAA total dose (B), and 3) N-concentration (C). Each factor has three concentration levels, which are shown in Table 1. A block with five central points was adopted, with a design matrix of 17 trials. In addition, one trial was kept as a control at a standard nitrogen concentration. This control was labeled as N100% and without phytohormone supplementation.
The response or dependent variable analyzed by the experimental design was lipid content (%).
The acquired data were fitted to a second-order polynomial model using Equation (1), which represents the model used to analyze the responses of the three-factor experimental design.
where y is the response (% lipid), X1 = BAP fraction, X2 = Total BAP/NAA mixture dose, X3 = N concentration (%), β0 = compensating term; β₁, β₂ and β₃ = linear term coefficients; β₄, β₅ and β₆ = coefficients for factor interaction β₇, β₈ and β₉ = quadratic effect coefficients, ∑error = random error.
y = β0 + β₁X₁ + β₂X₂ + β₃X₃ + β₄X₁X₂ + β₅X₁X₃ + β₆X₂X₃ + β₇X₁² + β₈X₂² + β₉X₃² + ∑error
Once the experimental data were obtained, an analysis of Variance (ANOVA) was used, and the F- test was performed to establish the mathematical correlation between the inputs and outputs. P- values must be less than 0.05 to establish the significance of the model and its terms. Response surface and contour plots were used to visualize the dependence of the responses on each factor.
2.2. Nannochloropsis Oculate Experimental Trials
The Basal Bold medium was prepared with different concentrations of N. The N-concentrations (%) of the BBM were N0%, N25%, N50%, and N100%. The 250 mg/L sodium nitrate (NaNO3) medium was taken as N100%. The pH was adjusted to 8.0 with 1N sodium hydroxide (NaOH) and autoclaved at 1 bar for 15 min. According to the experimental design (Table 1), 17 assays were performed by adding the medium and the corresponding phytohormones. The assays were performed in sterile 1 L glass bottles. N. oculata was inoculated in 500 mL of BBM, and the D.O. of the medium was adjusted to 0.2 in a UV-visible spectrophotometer (Thermo Scientific Genesys 10s) at 750 nm.
Stock solutions of phytohormones were prepared at a concentration of 6000 ppm, sterilized in the autoclave, capped from light, and kept refrigerated until use (PhytoTechnology Laboratories®).
Culture conditions were established similarly to those described for the stock culture. Lipid and biomass concentrations were quantified periodically until an early stationary phase was detected.
2.3. Biomass quantification
The dry weight (DW) biomass was estimated based on a linear relationship between OD750 uv-visible (Thermo Scientific Genesys 10s) and biomass g/L DW, which was obtained after a multiple data NAAlysis and calculated using Equation (2) [17]:
Biomass (mg/L) = 729.36 (D.O.750) + 52.553
R2 = 0.9921
R2 = 0.9921
2.4. Lipid Quantification
The sulpho-phospho-vanillin (SPV) method was used for lipid quantification as follows [24].
An aliquot (1 mL) was taken from the microalgae culture, and the cells were centrifugated at 5000 rpm for 10 min. The biomass was washed (3 X 2 mL) with deionized water and dried at 100°C until constant weight. The biomass (DW) was used for the SPV reaction. The lipid estimation was performed in a GENESYS 10S UV-Vis Spectrophotometer (Thermo Fisher Scientific, USA).
3. Results
The experimental design results were grouped according to nitrogen concentration (N0%, N25%, and N50%). In Figure 1a–c, the biomass production of all trials, including a control (N100%), is shown.
In Figure 1a, the lowest amounts of biomass were obtained under N0% concentrations in runs 2,9,12, and 13 (R2, R9 and R12 and R13). The N. oculata cultures maintained a low but constant biomass production for the first nine days. The addition of the BAP/NAA mixture, a potential game-changer, significantly favored microalgae survival, offering a promising avenue for further research. However, on day 11, the ability of the phytohormones to alleviate nutrient stress in N. oculata declined as a considerable decrease in biomass was observed, accelerating the entry into the cell death phase. The potential of phytohormones to enhance microalgae survival in N. oculata is evidenced at a dose of 20 ppm, characterized by a higher production of dry cell weight (0.29 g/L) compared to lower doses of BAP/NAA (12.5 ppm and 5 ppm), which caused a slight decrease in the amount of biomass. Data from the runs with phytohormone and N25% are shown in Figure 1b. The 20 ppm doses of individual phytohormones addition, R1 and R3 in Table 2, consistently produced the highest amounts of biomass at the end of the evaluation (BAP: 1.049 g/L and NAA: 0.953 g/L).
In contrast to the N0% cultures, those with a concentration of N25% could extend the early stationary phase until day 24. The results show that a high concentration of BAP or NAA is a determinant for extending the development of N. oculata cultures. The mixture of both phytohormones in equal proportions at a total dose of 12.5 ppm exceeded biomass production compared to the application of BAP or NAA at 12.5 ppm individually (Table 2). This suggests the BAP/NAA mixture imparts a synergistic stimulatory effect on N. oculata cell division. It is important to note that the stimulation of cell cultures with 5 ppm of N25% and phytohormones slightly exceeded the amount of biomass of the control culture (N100%) at day 24 of incubation (Figure 1c). Regarding the cultures with N50% and phytohormones, the total concentrations of the BAP/NAA mixture 5, 12.5 and 20 ppm was not shown to increase biomass production compared to the control (N100%). Even the high dose of the BAP/NAA mixture at N50%, appears to be accelerating the aging of the N. oculata culture. For example, the 20 ppm BAP/NAA (1:1) N50% dose obtained approximately half the biomass (0.353 g/L) concerning the control (0.767 g/L). The 12.5 and 5 ppm doses of FH (N50%) also showed lower final cell dry weight production with the N100% control (Figure 1c). The results reveal that when N-deficiency is considerable (0%-25%), BAP/NAA mixture mitigate the cell nutrient stress. However, when the amount of N in the N. oculata culture is sufficient (50%), the PH stimulating effect is detrimental.
3.1. Push-Pull Strategy on Lipids Production
Microalgae have been shown to increase their lipid content when subjected to stress conditions, including nitrogen limitation [25]. This increase in lipid content is significant as it can be harnessed for biofuel production and other industrial applications. The higher lipid content in microalgae under stress conditions means a higher potential for biofuel production, making this research particularly relevant for the biofuel industry. In this study, N-limitation (N0%, N25%, and N50%) in N. oculata cultures significantly stimulated lipid accumulation compared to the control (N100%) (Figure 2a-c). This increase in lipid content under stress conditions is a promising tool for the biofuel industry, as it suggests that under certain conditions, microalgae can produce significantly higher lipid content, which can be converted into biofuel. The potential of the research contributes to the biofuel industry is a significant implication of this study. The N0% trials significantly increased lipid content during the nine days of incubation, at which time the early stationary phase, a period of reduced growth rate, was detected. The highest lipid percentages were obtained with the 20 ppm and 12.5 ppm doses. The 20-ppm dose of BA/+NAA (1: 1) and N0% succeeded in accumulating 26.25 % lipids in N. oculata, 2.11-fold higher than the control. Meanwhile, with the 12.5 ppm dose of NAA, N0% 25.19% was obtained, which was 2.03 times higher than the control. In the case of the trials with N25%, the highest result in lipid content was presented in R3. This stimulus obtained 25.19 % lipids, 2.03-fold more than the control. Similarly, the rest of the runs with 25% N with 12.5 ppm phytohormone mixture (BAP/NAA) reached up to 22.5% lipid content. Finally, runs 5,11,15, and 17 (Table 2) were the ones that obtained the lowest lipid ratios. With N50% and PH, these cultures accumulated lipids in a range of 14.28-16.98% on day 21. However, it is observed that day 14 was where the N50% cultures presented the highest lipid percentages, ranging from 18.1 to 22.1 %. The N50% cultures with PH also presented a higher lipid accumulation than the control. On day 21, the 5-ppm dose (BAP+NAA) had the lowest content at 12.96%, while the highest yield was at the 20 ppm dose (BAP/NAA) at 16.98%. These data show lipid biosynthesis is not only exerted by N-deficiency but also by phytohormone stimulus, a significant finding for biofuel production
3.2. Response Surface Methodology for lipid N. oculata Optimization
A response surface design (RSM) was used in this study. Unlike factorial designs, where the best treatment is the “winner” of the total examined, RSM determines the optimal point, i.e., the best combination of the factors studied in the operability region. Using statistical and mathematical methods, RSM evaluates the effects of various control parameters on different system responses and identifies an optimal combination of these factors to optimize system performance [19]. The Box-Behnken design (BBD) is a rotating or quasi-rotating second-order response surface methodology design. It is based on three-level incomplete factorial designs and is specifically designed to establish cause-and-effect relationships between factors and responses in experiments. Unlike the CCD, the BBD does not contain combinations with factors at higher or lower levels at the same time, ensuring that measurements are not taken in extreme situations [26]. The RSM is a powerful tool that can predict the PH and N effects on lipid production in N. oculata and optimize these responses, offering a promising future for research in this field.
The Box-Behnken design variables and results obtained for biomass and lipid content in Nannochloropisis oculata is shown in Table 2. The independent variables were BAP fraction (ppm) (A), total doses of BAP/NAA(ppm) (B), and N concentration in culture (C). Regression equation coefficients were calculated, and the data were fitted to a second-order polynomial equation for lipid and biomass production.
The obtained second-order quadratic model equation (3) is below.
X = 21.84 - 1.65*A + 3.00*B - 2.36*C - 0.5550*AB + 2.09*AC - 2.01*BC - 1.62*A2 + 0.4215*B2 - 3.67*C2
The coded factors are X = lipid yield, A = fraction of BAP in the mixture, total dose (BAP/NAA), and C nitrogen concentration.
According to the Analysis of variance (ANOVA) for lipid yield, the model is statistically significant as it presents a significance level p-value of 0.0406 (<0.05) and an F-value of 4.00 (>1). A significance level (p-value) of 0.05 indicates that the probability that the model does not fit the data is only 5%. Also, the lack of fit is insignificant, with a p-value of 0.795 (>0.05) and an F-value of 0.3461 (<1). A non-significant lack of fit indicates that the model adequately describes the functional relationship between the experimental factors and the response variable. The model fit is good and can be used as a predictor of response (Table 2). P-values < 0.05 indicate that the model terms are significant; for this case, only factors B, C, and C2 are significant. The linear terms AC and BC are not significant for the model. In addition, AB is the interaction term with the lowest p-value, which is why N concentration significantly affects lipid production in this model.
3.3. Effect of Model Terms on Biomass Production
The 3D response surface plot, a graphical representation of the relationship between two factors and a response, shows the effect of phytohormone concentration on lipid production. The mixture dose (BAP/NAA) is one of the most significant factors according to the ANOVA analysis. Since it is a stimulant mixture, it is important to analyze the role of each phytohormone on lipid productivity; for this purpose, a response surface plot is presented (Figure 3a,b). The B factor had a high influence on lipid production. As the value of B increases, lipid concentration is observed to increase. Therefore, the highest concentration evaluated in this study (20 ppm) has higher significance on the response. Factor A (fraction of BAP in the mixture) also has significance in lipid accumulation (p-value 0.0008). However, contrary to factor B, as the applied dose of BAP decreases, the % lipid increases. According to the above, the highest lipid yield can be obtained with a low BAP concentration and a high NAA concentration.
In the ANOVA analysis, the quadratic term of factor C (N-concentration) is found to be a significant factor in lipid content. This means that the relationship between N-concentration and lipid content is not linear but rather follows a quadratic pattern. The contour plot (Figure 3b) shows lipid production with respect to N and PH concentrations, further illustrating this relationship.
The best lipid yields were obtained with N-limitation (Figure 4a,b). N. oculate medium with N25% presented results consistent with high lipid production. Meanwhile, cultures with N0% presented high and low values depending on the total dose of PH applied. However, the early cell death in the N0% cultures cause the high cell lipid production to be unbalanced with a low amount of biomass, even with the PH stimulus. Figure 3a shows the inverse relationship given in N50% cultures. As N values are raised, the lipid yield decreases. In this case, no significant effect of the applied phytohormone dose on lipid yield was observed (Figure 3b).
The combined effect of BAP/NAA, a higher stimulatory effect on biomass and lipid production was expected compared to the individual effect. The trials with 12.5 ppm of the NAA+BAP mixture showed stimulatory effects on biomass and lipid production (Figure 3 and Figure 4). However, looking at the individual effect of BAP and NAA at a concentration of 20 ppm with N25%, a high lipid yield was obtained with NAA (25.19%) and the highest biomass production with BAP (1.049 g/L).
4. Discussion
The potential impact of exogenous phytohormone addition to microalgal culture, as demonstrated in this study, could inspire further research in the field. The biochemical effects of a mix of phytohormones, such as BAP and NAA, on specific microalgae species have not been fully explored. Furthermore, the functional role of BAP and NAA in the oleaginous N. oculata lipid production under N-limited conditions presents a promising area for future investigation.
The absence of N has lower biomass productivity because the limitation of this nutrient decreases cell growth to conserve energy and nutrients [27].
In addition, such results were visible through color change, as the assays changed from strong green to light green, as shown in Figure 21. Nitrogen is a major component for building chloroplasts and synthesizing chlorophyll, so nitrogen depletion led to chloroplast decomposition [28]. BAP and NAA added in N. oculata (N25%) as single doses at 20 ppm showed the highest biomass on day 21 of incubation, with 1.049 g/L and 0.953 g/L, respectively. It has been found that in microalgae, cytokinins are key in the cell signaling process of N. The cytokinin BAP added to Desmodesmus sp. cultures exerted a more significant stimulus (push) on biomass production (1.8 g/L) as opposed to the auxins indole-3-acetic acid (IAA) (1.3 mg/L) and indole-3-propionic acid (IPA) (1.44 g/L), at a concentration of 10 ppm. The stimulatory effect was attributed to the fact that cytokinins in microalgae stimulate key enzymes involved in nitrogen assimilation and amino acid synthesis, consequently enhancing cell growth and division [14]. In another study, the addition of BAP to Chlamydonoma was associated with an increase in cell number by enhancing the photorespiration process and elevating mRNA levels and Serine-glyoxylate aminotransferase (SGAT) activity [29]. It is reported that cytokinins influence cellular carbon and nitrogen metabolism by stimulating the activity of the nicotinamide adenine dinucleotide (NADH)-dependent enzyme hydroxy pyruvate, increasing photosynthetic pigments. Likewise, cytokinins such as BAP can stimulate NADH-dependent glutamate dehydrogenase activity [30]. In Chlorella pyrenoidosa, the effect of 4 phytohormones: BAP, 6-furfuryl amino purine (Kinetin), GA, NAA and indole-3-butyric acid (IBA) on the yields of biomass and α-linolenic acid was studied. The result was that only NAA and BAP induced high biomass yields of 2.2-fold and 1.26-fold, respectively [31]. Conversely to our results, NAA responded better than BAP in C. pyrenoidosa. It is well known that the response or effect of a growth regulator is species-specific.
On the other hand, auxins such as NAA have shown in several studies a considerable effect on the growth rate of microalgae [32,33]. NAA and other phytohormones were added to B. braunii B12 to evaluate its effect on biomass and carotenoid production. The most effective phytohormone was NAA (50 mg/L) in stimulating cell growth and carotenoid accumulation. The cell growth increased 2-fold compared with that of the control [34].
The combined effect of BAP and NAA had two behaviors. At higher doses of the mixture (20 ppm) and N25%, the effect was stimulatory on biomass, while at the same dose of the mixture and N50%, the effect was inhibitory (Figure 1c). BAP and NAA (N0% and N25%) can activate mechanisms that mitigate nutrient stress to achieve crop growth at low N-concentrations. Cytokinins and auxins have been shown to alleviate oxidative stress in N-limited microalgal cells by positively regulating the activity of antioxidant enzymes. Increased antioxidant activity decreases the generation of reactive oxygen species (ROS) and cell damage. BAP is a potent phytohormone that promotes ROS scavenging. For example, BAP strongly activated EROS scavenging enzymes catalase (CAT) and ascorbate peroxidase (APX) [14,35]. Similarly, auxin AIA was shown to increase peroxide dismutase (SOD) activity to a greater extent than CAT and APX in Acutudesmus obliquus [36]. Earlier studies have revealed that BAP and NAA has been used growth regulator to promote microalgal cell growth, enlargement and boost lipid accumulation [37,38].
However, the inhibitory effect observed in N50% cultures spiked with the BAP/NAA mixture at 20 ppm is likely because high doses of cytokinins block cell proliferation and induce programmed cell death (PCD). In Arabidopsis plants, high doses of cytokinins have been observed to induce programmed cell death (PCD) in proliferating cells [39]. One of the most intriguing aspects of our study is the dose-dependent nature of the paradoxical effect of auxins. Depending on the dose, auxins can either stimulate or inhibit the development of N. oculate. A high dose of phytohormones, in combination with a sufficient N concentration (50%), was the key factor triggering the inhibitory effect. This dose-dependent paradoxical effect of auxins is a fascinating area for further research.
N-limitation leads to lower biomass productivity to conserve energy and nutrients [40]. This study's experimental data with N-limitation exceeded lipid production compared to the control. Nitrogen deficiency induces most of the carbon fixed by photosynthesis to modify its pathway towards lipid synthesis. This mechanism increases lipid content and decreases carbohydrate content, which is reflected in a reduction of cell division [41]. The decrease in cell division alters the lipid biosynthetic pathway to accumulate more saturated and unsaturated lipids to resist cellular stress [42].
ANOVA analysis shows that factor B (BAP/NAA dose mixture) significantly affected lipid production. As B increases, lipid concentration increases. FHs are important as exogenous additives for lipid accumulation. Plant hormones promote cell growth and lipid accumulation even under stress conditions [43]. Similar to this study, NAA has been reported to affect lipid synthesis positively. NAA participated in lipid biosynthesis regulatory signals of Chlorella vulgaris by modifying the content of endogenous indole-3-acetic acid, jasmonic acid, and salicylic acid. NAA (1 ppm) generated 47% lipid content in C. vulgaris microalgae [37]. In Scenedesmus sp and Chlorella sorokinina a mixture of two auxins at a total dose of 20 mg/L (10 mg/L NAA + 10 mg/L IBA) increased lipid content 2.4 and 2.9-fold over the control (no phytohormones) under nitrogen-limiting conditions [44].
In this work, factor C (N-content) was one of the primary growth parameters influencing lipid production (Table 2). N. oculata N0% and phytohormones doubled lipid production concerning the control (Table 1). A dose of PH under nitrogen depletion may reinforce the prioritization of carbon flow for lipid synthesis. PH (which ones) increase the expression of genes such as accD (acetyl-CoA carboxylase heteromeric beta subunit (ACCase), which is involved in carbon fixation and lipid biosynthesis, acetyl-CoA carboxylase being a key enzyme in lipid biosynthesisb[45]. When evaluating the effect of N concentration on lipid content in N. oculata without phytohormone stimulation, a concentration of N25% (75 mg/L) doubled lipid content from 7.9 to 15.8% and increased lipid content 1.9-fold over the control. A decrease in lipid content was observed when factor C was increased to N50% and factor B was increased to the maximum dose (20 ppm) (Figure 2a). Similarly, in Desmodesmus sp. JS07, the addition of a total dose of 15 ppm of a mixture of BAP and IBA (indole 3-butyric acid lipid production was high. However, a dose of 20 ppm decreased lipid yield [14]. In congruence with our results, 12.5 ppm doses generated higher % lipids than 20 ppm doses (Figure 2b). Increasing the dose of phytohormones can decrease lipid production in microalgae. For example, in Graesiella emersonii and Chlorophyta sp., the effect of N-limitation was analyzed in cultures supplemented with a mixture of indole acetic acid (IAA) and kinetin (K) at 10 ppm, 20 ppm, and 30 ppm. The 20 ppm dose generated the highest lipid productivity, while the 30 ppm dose showed a drop in lipid yield [46].
Based on the above, the push-pull strategy (phytohormone stimulation/N-limitation) is suitable for stimulating lipid biosynthesis in N. oculata. This methodology allowed increased biomass production, decreased N concentrations in the medium, and significantly increased lipid content for biodiesel production. A solution to maximize lipid production was selected to optimize the target response (% lipids). The proportion of BAP in the PH mixture was minimized, the concentration of the total PH dose was maximized, and a range of N0% to N25% was maintained. The total PH dose limit was 40 ppm (Table 3).
The solution to the optimization and experimental validation are shown in Table 4.
Auxins such as indole acetic acid (IAA), indole butyric acid (IBA), indole propionic acid (IPA) applied in Chlorella pyrenoidosa and Scenedesmus quadricauda from 5-60 ppm showed that from 40-60 ppm lipid production was superior to lower concentrations [47]. According to the optimization table, with a concentration of 39.5 ppm NAA and 23.25% N, the % lipid increased to 38.87 ± 0.927 %. This presented result showed an error percentage of less than 10%. Less than 10 % error results are considered statistically acceptable [48].
5. Conclusions
The push-pull strategy's efficacy in optimizing lipid production in Nannochloropsis oculata was demonstrated, resulting in a substantial increase from 12.4% to 38.87%. This significant improvement underscores the success of the strategy. The effect of phytohormone addition (BAP and NAA), even under nitrogen limitation, improved biomass productivity, highlighting the potential of this approach to balance growth and lipid accumulation. There is a critical role between nitrogen deficiency and phytohormone dosing in redirecting metabolic pathways toward lipid biosynthesis, so many avenues remain open for metabolic and other stressor research applying the push-pull strategy. This strategy holds great promise for industrial applications, especially in developing sustainable biorefineries. The environmental advantages of using microalgae as a renewable feedstock make this work a cornerstone for advancing green technologies.
Author Contributions
For research articles with several authors, a short paragraph specifying their individual contributions must be provided. The following statements should be used “Conceptualization, H.C.C.A. and G.V.C.R.; methodology, R.G.T.C..; software, T.I.P. validation, T.I.P. and M.K C. N.; formal analysis, H.C.C.A.; investigation, R.G.T.C..; resources, H.C.C.A.;; data curation, H.C.C.A. and R.G.T.C.; writing—original draft preparation, H.C.C.A..; writing—review and editing, H.C.C.A.; visualization, G.V.C.R.; supervision, T.I.P. and M.K.C.N.; project administration, H.C.C.A. All authors have read and agreed to the published version of the manuscript.
Funding
This research received no external funding.
Institutional Review Board Statement
Not applicable.
Informed Consent Statement
Not applicable.
Data Availability Statement
The original contributions presented in this study are included in the article. Further inquiries can be directed to the corresponding authors.
Acknowledgments
Hans Christian Correa-Aguado gratefully acknowledge Secretaría de Investigación y Posgrado del Instituto Politécnico Nacional for financial support project 20220082.
Conflicts of Interest
The authors declare no conflicts of interest.
Abbreviations
The following abbreviations are used in this manuscript:
| ABA | abscisic acid |
| BAP | Benzyl Amino Purine |
| BBD | Box-Behnken design |
| BBM | Bolds Basal Medium |
| CCD | Central Compose Design |
| GA | Gibberellic Acid |
| IAA | Indole-3-Acetic Acid |
| IBA | Indole-3-Butyric Acid |
| NAA | Naphthyl Acetic Acid |
| MI | Myositol |
| RSM | Response Surface Methodology |
References
- IEA (2024), W.E.O., IEA, Paris. Pathways for the energy mix. Peaks coming into view? 2024 01/03/2025]; Licence: CC BY 4.0 (report); CC BY NC SA 4.0 (Annex A)]. Available from: https://www.iea.org/reports/world-energy-outlook-2024.
- Chen, L.; G. Msigwa, Strategies to achieve a carbon neutral society: a review. Environ. Chem. Lett, 2022. 20(4): p. 2277-2310. [CrossRef]
- Nordin, I.; K. Elofsson, Cost-effective reductions in greenhouse gas emissions: Reducing fuel consumption or replacing fossil fuels with biofuels. Energy Policy, 2024. 190: p. 114138. [CrossRef]
- Amdi, H.; I. Hajjout, Review on Biodiesel Generations: Energy Demand, Costs, and Emissions. Procedia Comput. Sci., 2024. 236: p. 127-134. [CrossRef]
- Issariyakul, T. and A.K. Dalai, Biodiesel from vegetable oils. Renewable Sustainable Energy Rev., 2014. 31: p. 446-471. [CrossRef]
- Das, V.; A.M. Tripathi, Cobalt-doped CaO catalyst synthesized and applied for algal biodiesel production. Renew. Energy, 2020. 161: p. 1110-1119. [CrossRef]
- Masojídek, J.; K. Ranglová, Variables governing photosynthesis and growth in microalgae mass cultures. Processes, 2021. 9(5): p. 820. [CrossRef]
- Getachew, D.; K. Mulugeta, Values and drawbacks of biofuel production from microalgae. J. Appl. Biotechnol. Rep., 2020. 7(1): p. 1-6.DOI: 10.30491/jabr.2020.105917.
- Faé Neto, W.A.; C.R. Borges Mendes, Carotenoid production by the marine microalgae Nannochloropsis oculata in different low-cost culture media. Aquac. Res., 2018. 49(7): p. 2527-2535. [CrossRef]
- Ma, X.-N.; T.-P. Chen, Lipid production from Nannochloropsis. Marine Drugs, 2016. 14(4): p. 61. [CrossRef]
- Pancha, I.; K. Chokshi, Nitrogen stress triggered biochemical and morphological changes in the microalgae Scenedesmus sp. CCNM 1077. Biores. technol., 2014. 156: p. 146-154.
- Kamalanathan, M.; M. Pierangelini, Impacts of nitrogen and phosphorus starvation on the physiology of Chlamydomonas reinhardtii. J. of Appl. Phycol., 2016. 28: p. 1509-1520. [CrossRef]
- Şirin, P.A. and S. Serdar, Effects of nitrogen starvation on growth and biochemical composition of some microalgae species. Folia microbiol., 2024. 69(4): p. 889-902. [CrossRef]
- Singh, J.; D. Jain, Auxin and cytokinin synergism augmenting biomass and lipid production in microalgae Desmodesmus sp. JS07. Process Biochem., 2020. 95: p. 223-234. [CrossRef]
- Ermavitalini, D.; A. Rahayu. Effect of indole 3-acetic acid (IAA) and 6-benzyl amino purine (BAP) on Nannochloropsis sp. culture growth. in IOP Conference Series: Earth and Environmental Science. 2021. IOP Publishing.
- Touliabah, H.E.-S. and A.W. Almutairi, Effect of phytohormones supplementation under nitrogen depletion on biomass and lipid production of Nannochloropsis oceanica for integrated application in nutrition and biodiesel. Sustainability, 2021. 13(2): p. 592. [CrossRef]
- Correa-Aguado, H.C.; G.V. Cerrillo-Rojas, Benzyl amino purine and gibberellic acid coupled to nitrogen-limited stress induce fatty acids, biomass accumulation, and gene expression in Scenedesmus obliquus. Phyton-Int. J. of Experiment. Botany, 2021. [CrossRef]
- Motlagh, Z.N.; M.A. Mahdavi, Naphthalene acetic acid and scorbic acid significantly improve neutral lipid accumulation in Chlorella species under nutrient limitations. Algal Res., 2023. 76: p. 103311. [CrossRef]
- Susaimanickam, A.; P. Manickam, A comprehensive review on RSM-coupled optimization techniques and its applications. Arch. Comput. Methods Eng., 2023. 30(8): p. 4831-4853. [CrossRef]
- Vinitha, V.; S. Meignanalakshmi, Synergistic effect of selenium and gibberellic acid for enhanced biomass, lipid and improved biodiesel quality from Tetradesmus obliquus through response surface methodology. Biores Technol., 2024. 406: p. 131017. [CrossRef]
- Renuka, N.; A. Guldhe, Combined effect of exogenous phytohormones on biomass and lipid production in Acutodesmus obliquus under nitrogen limitation. Energy Convers., 2018. 168: p. 522-528. [CrossRef]
- Lv, H.; Q.-e. Wang, Enhancing biomass production of Dunaliella salina via optimized combinational application of phytohormones. Aquaculture, 2019. 503: p. 146-155. [CrossRef]
- Andersen, R., Algal culturing techniques. 2005, London, UK: Elsevier Academic Press.
- Park, J.; H.J. Jeong, Easy and rapid quantification of lipid contents of marine dinoflagellates using the sulpho-phospho-vanillin method. Algae, 2016. 31(4): p. 391-401. [CrossRef]
- Breuer, G.; P.P. Lamers, The impact of nitrogen starvation on the dynamics of triacylglycerol accumulation in nine microalgae strains. Bioresource technology, 2012. 124: p. 217-226. [CrossRef]
- Szpisják-Gulyás, N.; A.N. Al-Tayawi, Methods for experimental design, central composite design and the Box–Behnken design, to optimise operational parameters: A review. Acta Aliment., 2023. 52(4): p. 521-537. [CrossRef]
- Yodsuwan, N.; S. Sawayama, Effect of nitrogen concentration on growth, lipid production and fatty acid profiles of the marine diatom Phaeodactylum tricornutum. Agri. Nat. Res., 2017. 51(3): p. 190-197.
- Yu, Z.; H. Pei, Phytohormone addition coupled with nitrogen depletion almost tripled the lipid productivities in two algae. 2018. 247: p. 904-914.
- Tian, B.j.; Y. Wang, Synthesis of the photorespiratory key enzyme serine: glyoxylate aminotransferase in C. reinhardtii is modulated by the light regime and cytokinin. Physiol. Plant, 2006. 127(4): p. 571-582. [CrossRef]
- Xie, Z.; S. Ma, Effects of six phytohormones on the growth behavior and cellular biochemical components of Chlorella vulgaris 31. J. Appl Phycol, 2023. 35(4): p. 1589-1602. [CrossRef]
- Kokkiligadda, S.; B. Pandey, Effect of plant growth regulators on production of alpha-linolenic acid from microalgae Chlorella pyrenoidosa. Sādhanā, 2017. 42(10): p. 1821-1824. [CrossRef]
- Du, H.; F. Ahmed, The effects of plant growth regulators on cell growth, protein, carotenoid, PUFAs and lipid production of Chlorella pyrenoidosa ZF strain. Energies, 2017. 10(11): p. 1696. [CrossRef]
- Liu, J.; W. Qiu, Stimulatory effect of auxins on the growth and lipid productivity of Chlorella pyrenoidosa and Scenedesmus quadricauda. Algal res, 2016. 18: p. 273-280. [CrossRef]
- Du, H.; J. Ren, Plant growth regulators affect biomass, protein, carotenoid, and lipid production in Botryococcus braunii. Aquac. Int., 2020. 28: p. 1319-1340. [CrossRef]
- Piotrowska-Niczyporuk, A.; A. Bajguz, Growth, metabolite profile, oxidative status, and phytohormone levels in the green alga Acutodesmus obliquus exposed to exogenous auxins and cytokinins. Journal of Plant Growth Regul, 2018. 37: p. 1159-1174. [CrossRef]
- Piotrowska-Niczyporuk, A.; A. Bajguz, Growth, metabolite profile, oxidative status, and phytohormone levels in the green alga Acutodesmus obliquus exposed to exogenous auxins and cytokinins. 2018. 37: p. 1159-1174.
- Liu, T.; F. Liu, The boosted biomass and lipid accumulation in Chlorella vulgaris by supplementation of synthetic phytohormone analogs. Bioresource technol., 2017. 232: p. 44-52. [CrossRef]
- Ermavitalini, D.; A. Rahayu, Effect of indole 3-acetic acid (IAA) and 6-benzyl amino purine (BAP) on Nannochloropsis sp. culture growth. IOP Conf. Ser.: Earth Environ. Sci, 2021. 649(1): p. 012003. [CrossRef]
- Carimi, F.; M. Zottini, Cytokinins: new apoptotic inducers in plants. Planta, 2003. 216: p. 413-421. [CrossRef]
- Rai, V.; M. Muthuraj, Real-time iTRAQ-based proteome profiling revealed the central metabolism involved in nitrogen starvation induced lipid accumulation in microalgae. Sci. reports, 2017. 7(1): p. 45732. [CrossRef]
- Yu, Z.; M. Song, The effects of combined agricultural phytohormones on the growth, carbon partitioning and cell morphology of two screened algae. Biores. technol., 2017. 239: p. 87-96. [CrossRef]
- Song, X.; B.-F. Liu, Overview on stress-induced strategies for enhanced microalgae lipid production: Application, mechanisms and challenges. Resour. Conserv. Recycl., 2022. 183: p. 106355. [CrossRef]
- Babu, S.S.; R. Gondi, Microalgae biomass and lipids as feedstock for biofuels: sustainable biotechnology strategies. Sustainability, 2022. 14(22): p. 15070. [CrossRef]
- Yu, Z.; H. Pei, Phytohormone addition coupled with nitrogen depletion almost tripled the lipid productivities in two algae. Bioresource technol., 2018. 247: p. 904-914. [CrossRef]
- Guldhe, A.; N. Renuka, Effect of phytohormones from different classes on gene expression of Chlorella sorokiniana under nitrogen limitation for enhanced biomass and lipid production. Algal Res., 2019. 40: p. 101518. [CrossRef]
- Mandal, M.K.; N.K. Chanu, Exogenous addition of indole acetic acid and kinetin under nitrogen-limited medium enhances lipid yield and expression of glycerol-3-phosphate acyltransferase and diacylglycerol acyltransferase genes in indigenous microalgae: A potential approach for biodiesel production. Biores. Technol., 2020. 297: p. 122439. [CrossRef]
Figure 1.
Biomass (g/L) in N. oculata calculated in the early stationary phase of each treatment. A: Culture with N0% concentration, B: with N25% concentration, C: with N50% concentration. Blue lines: BAP/NAA total dose 5 ppm, green lines: BAP/NAA total dose 12.5 ppm, yellow lines: BAP/NAA total dose 20 ppm. A triangle ( ▲) in the connecting line of the graph represents the fraction of BAP = 1 and NAA = 0. The circle ( ●) shows the assays with the fraction of BAP = 0.5 and NAA = 0.5, and the square ( ■) is the fraction of BAP = 0 and NAA = 1 in the total dose of BAP/NAA mixture. The red color represents the control culture: N100% without PH stimulation.
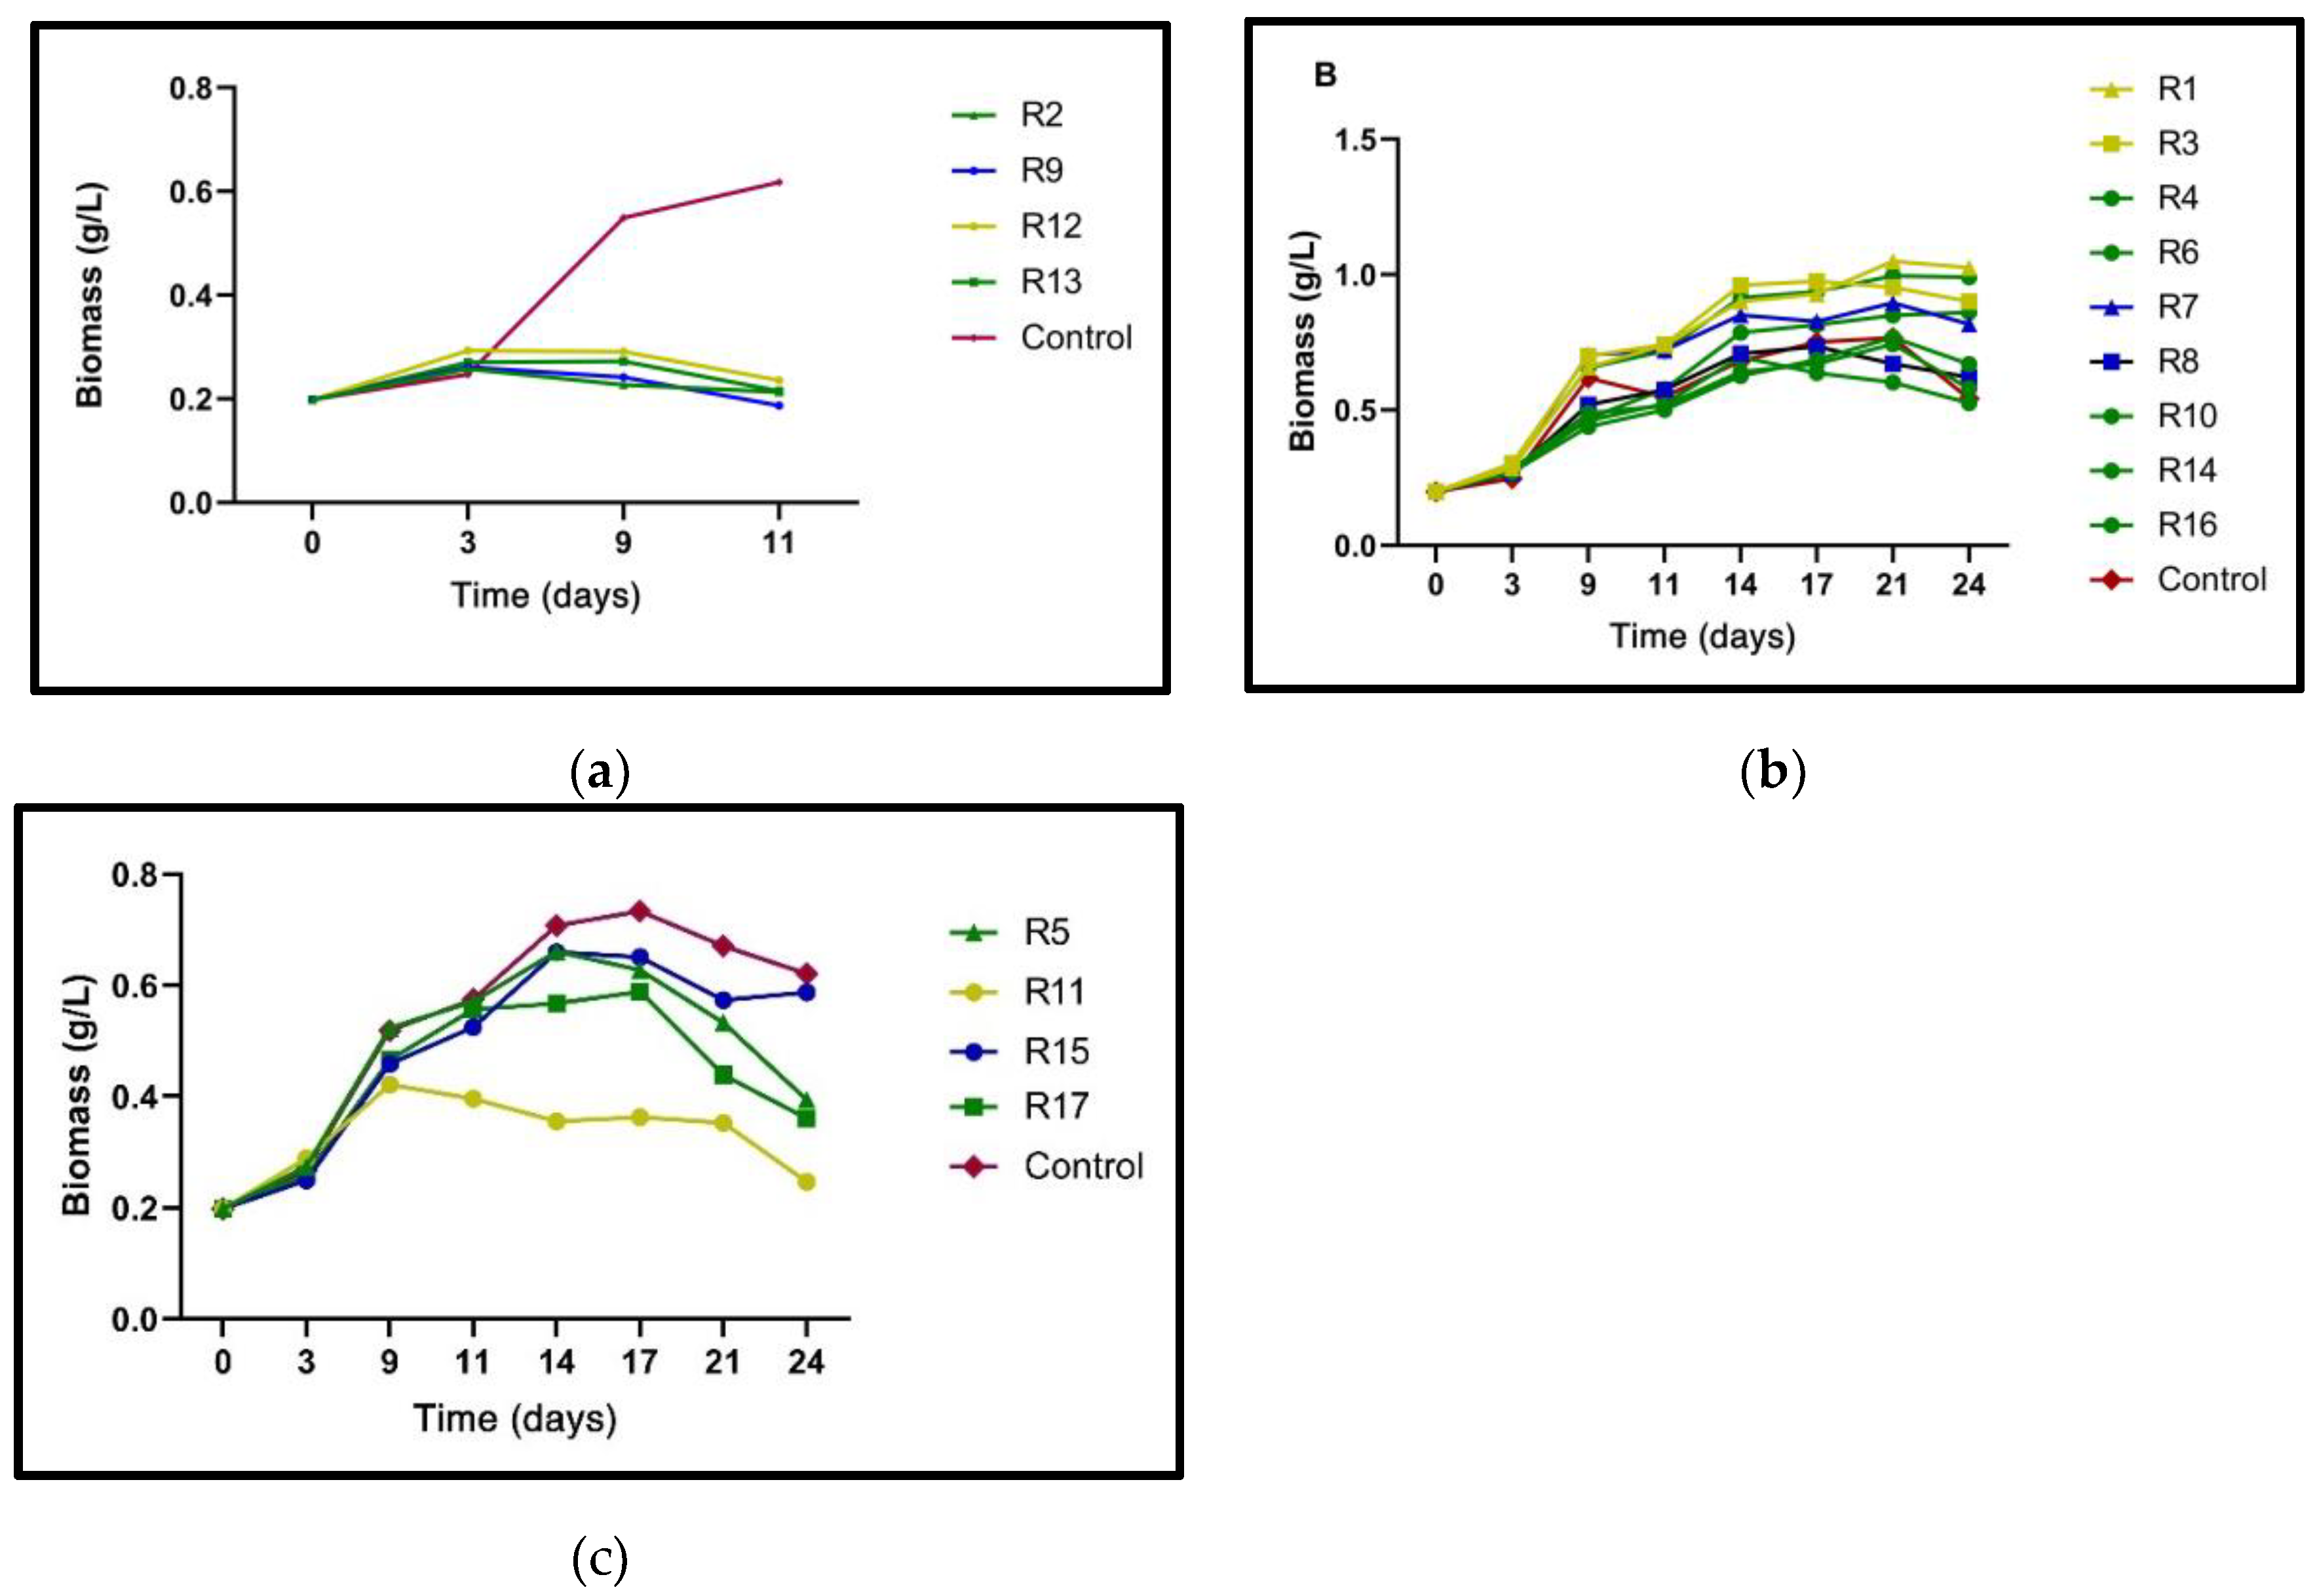
Figure 2.
Lipid yield (%) in N. oculata calculated in the early stationary phase of each treatment. A: culture with N0% concentration, B: with N25% concentration, C: with N50% concentration. Blue lines: PH total dose 5 ppm, green lines: PHtotal dose 12.5 ppm, yellow lines: PH total dose 20 ppm. A triangle ( ▲) in the connecting lines of the graph represents the fraction of BAP = 1 and NAA = 0. The circle ( ●) shows the assays with the fraction of BAP = 0.5 and NAA = 0.5, and the square ( ■) is the fraction of BAP = 0 and NAA = 1 in the total dose of BAP/NAA mixture. The red color represents the control culture: N100% without PH stimulation.
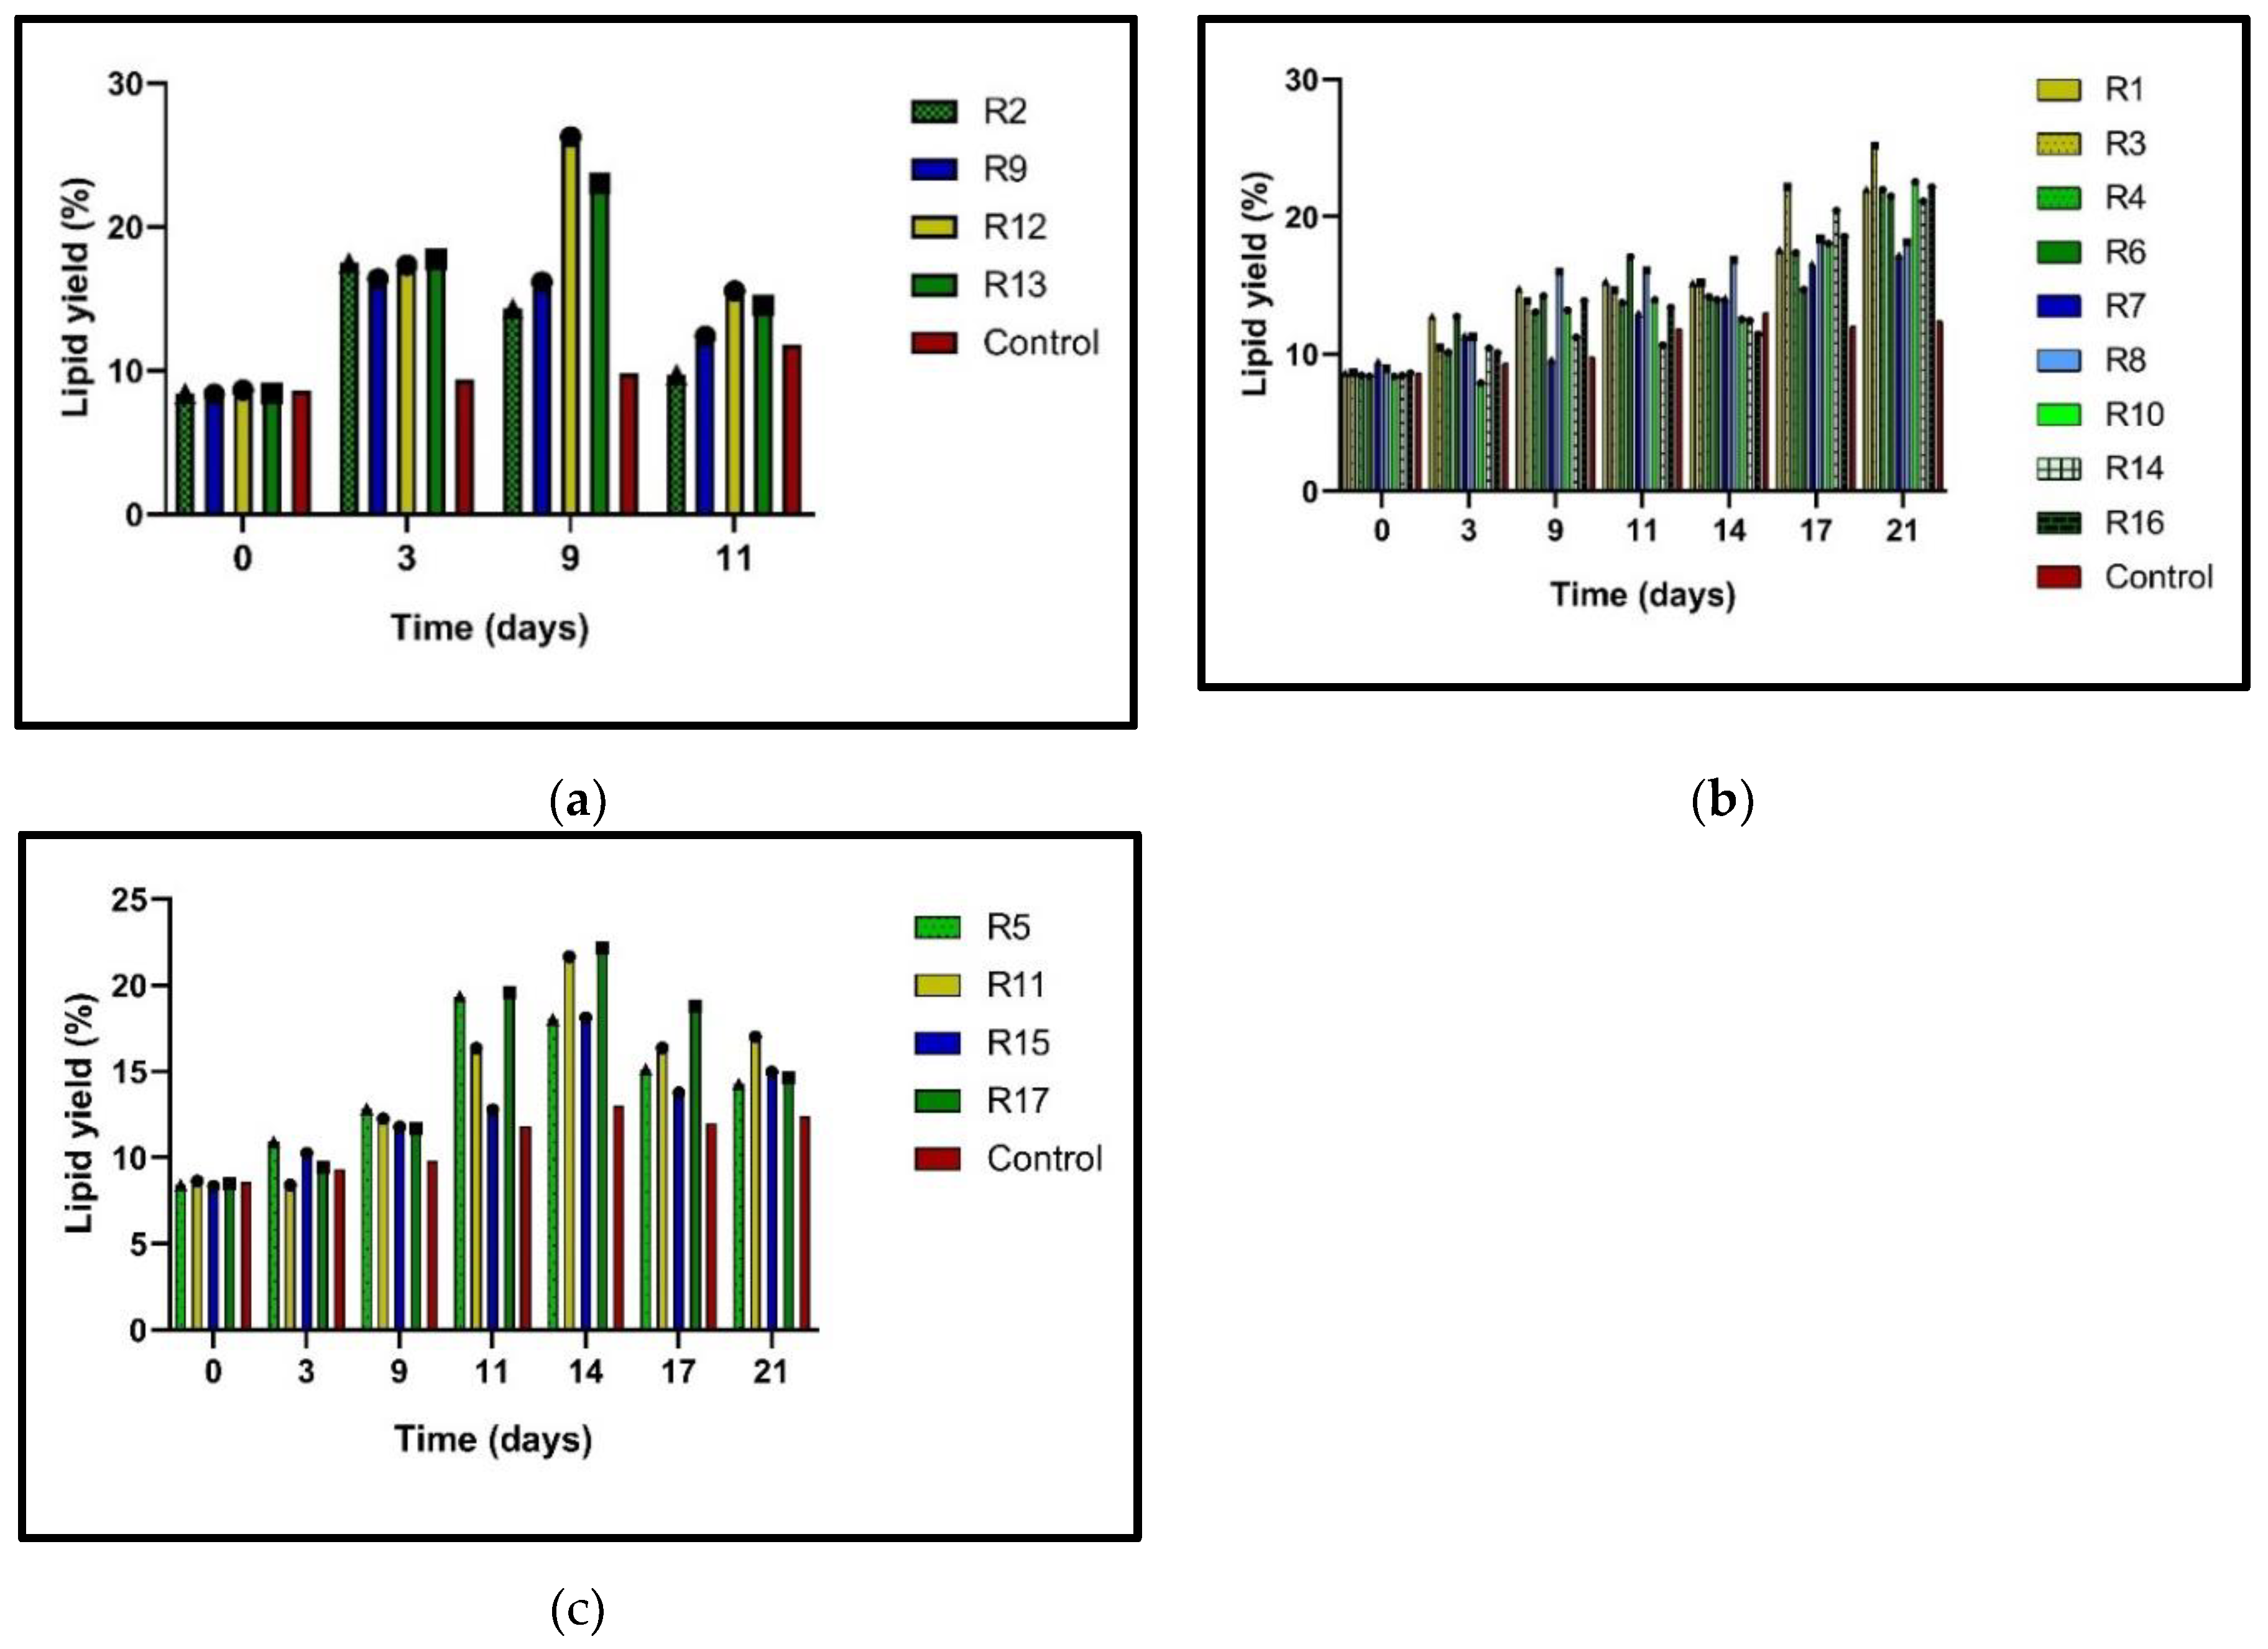
Figure 3.
(a) 3D response surface plot. (b) Contour plot. A: BAP fraction and B: BAP/NAA dosage effects on yield of total lipid in N. oculata.
Figure 3.
(a) 3D response surface plot. (b) Contour plot. A: BAP fraction and B: BAP/NAA dosage effects on yield of total lipid in N. oculata.
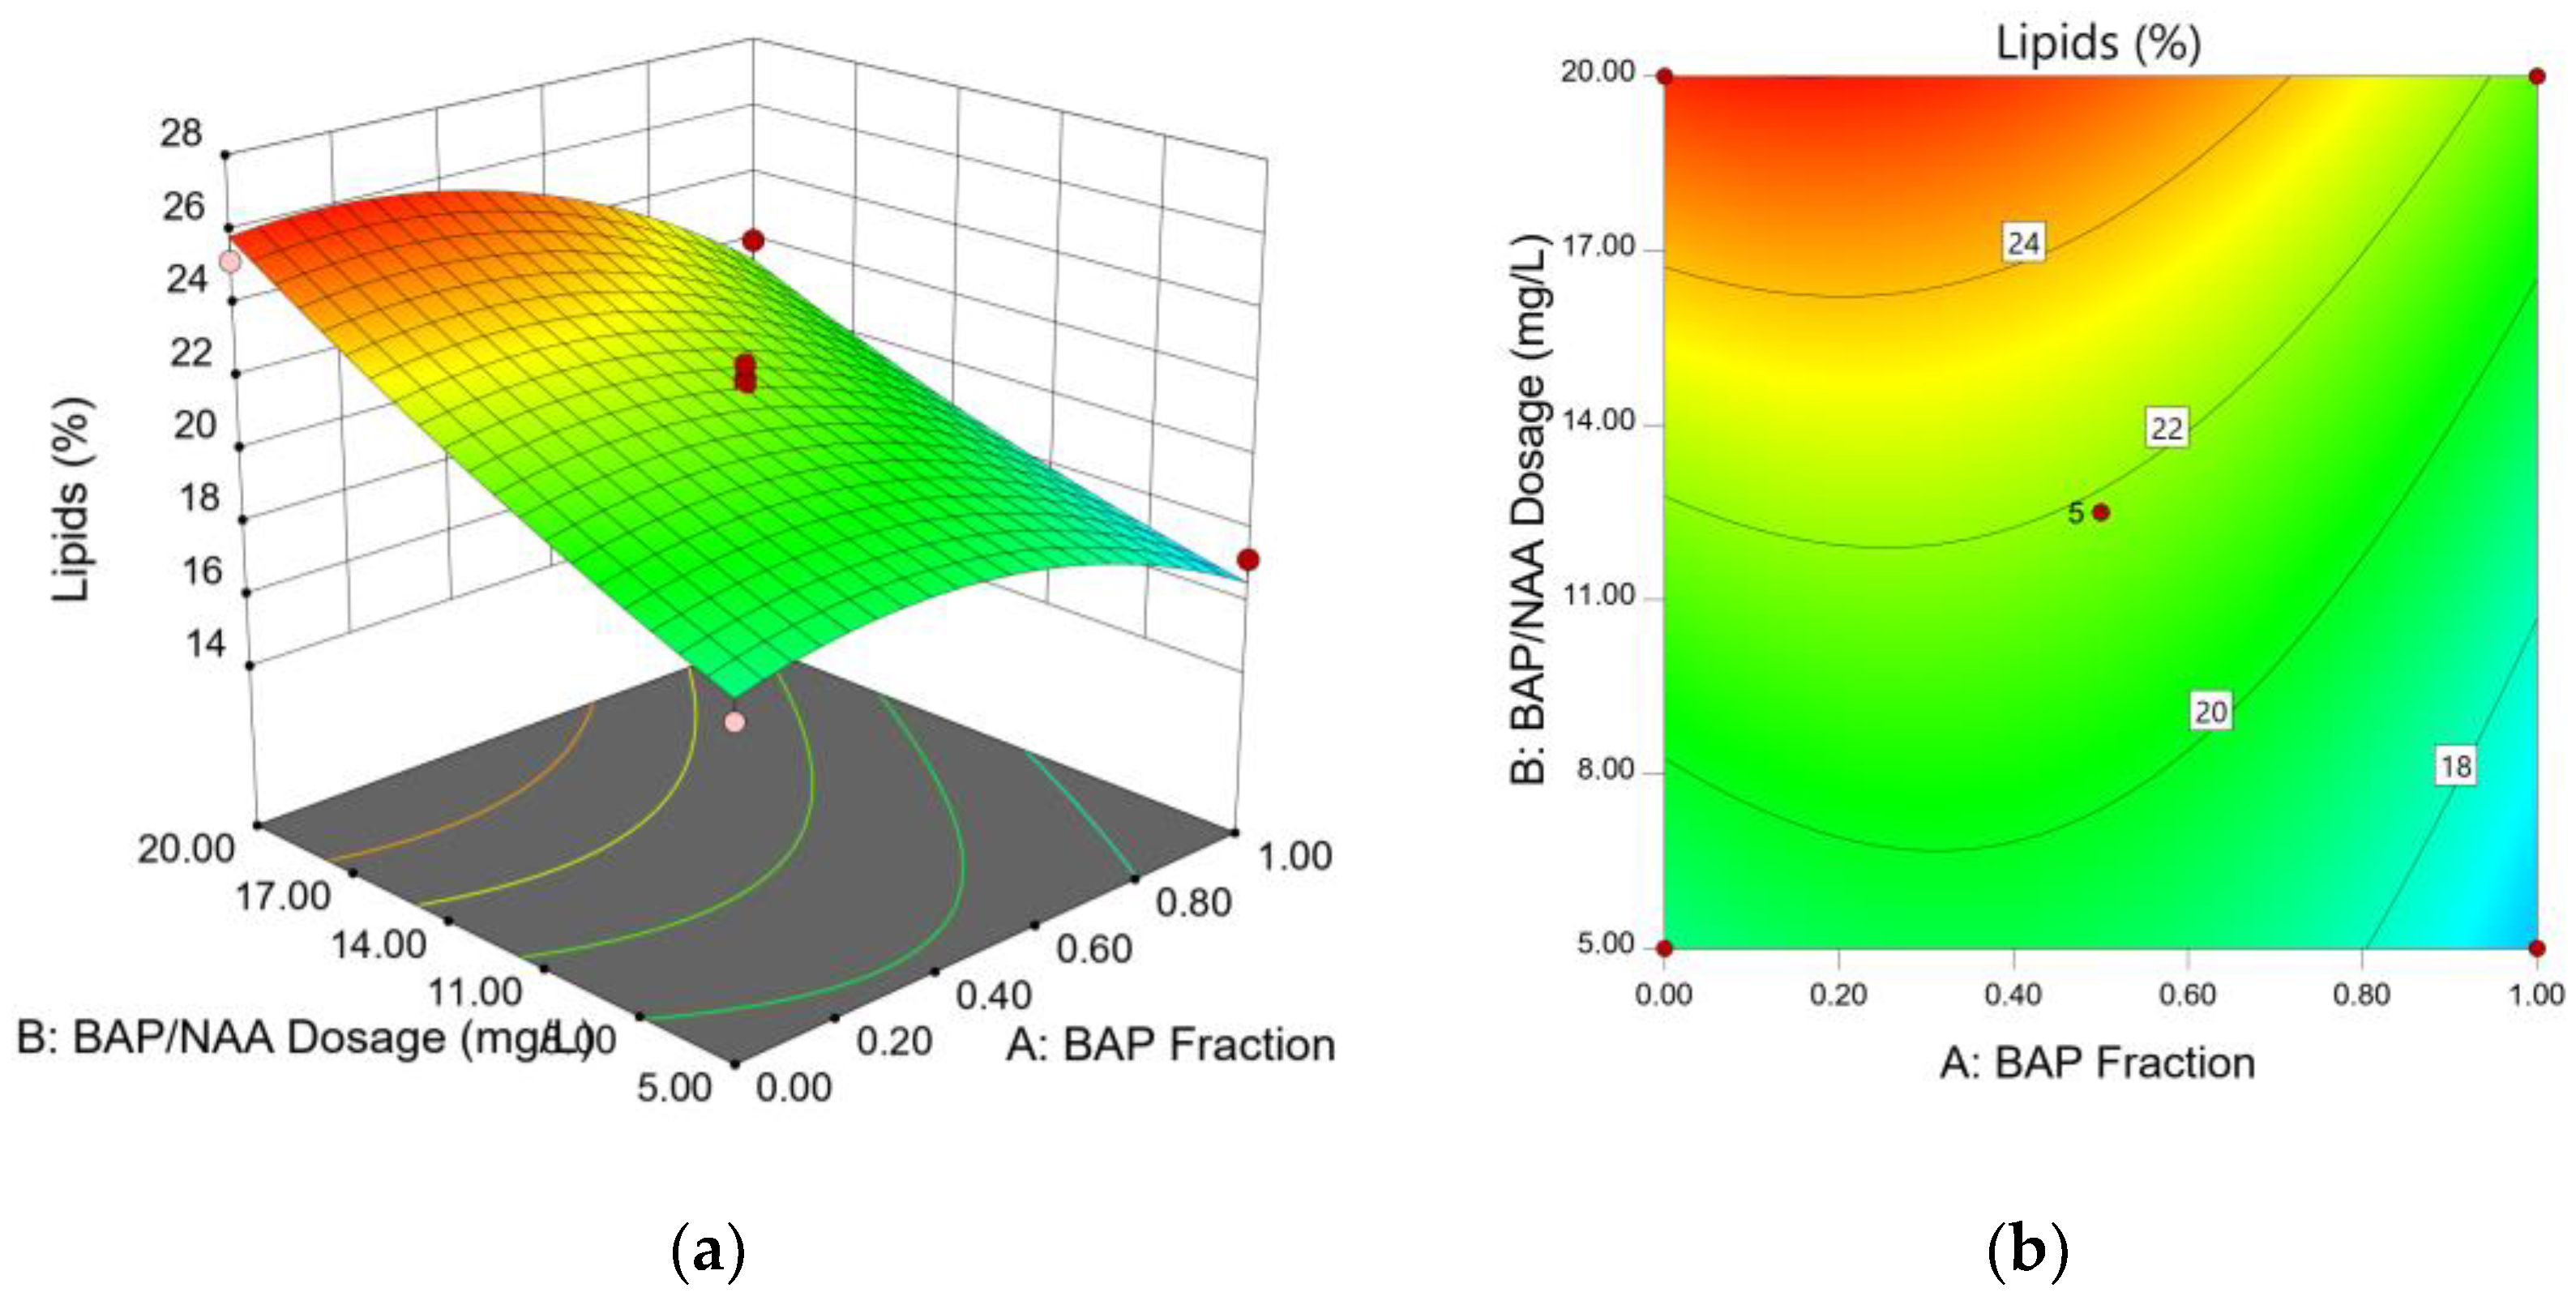
Figure 4.
(a) 3D response surface plot. (b) Contour plot. B: BAP/NAA dosage and C: concentration of nitrogen effects on yield of total lipid in N. oculata.
Figure 4.
(a) 3D response surface plot. (b) Contour plot. B: BAP/NAA dosage and C: concentration of nitrogen effects on yield of total lipid in N. oculata.
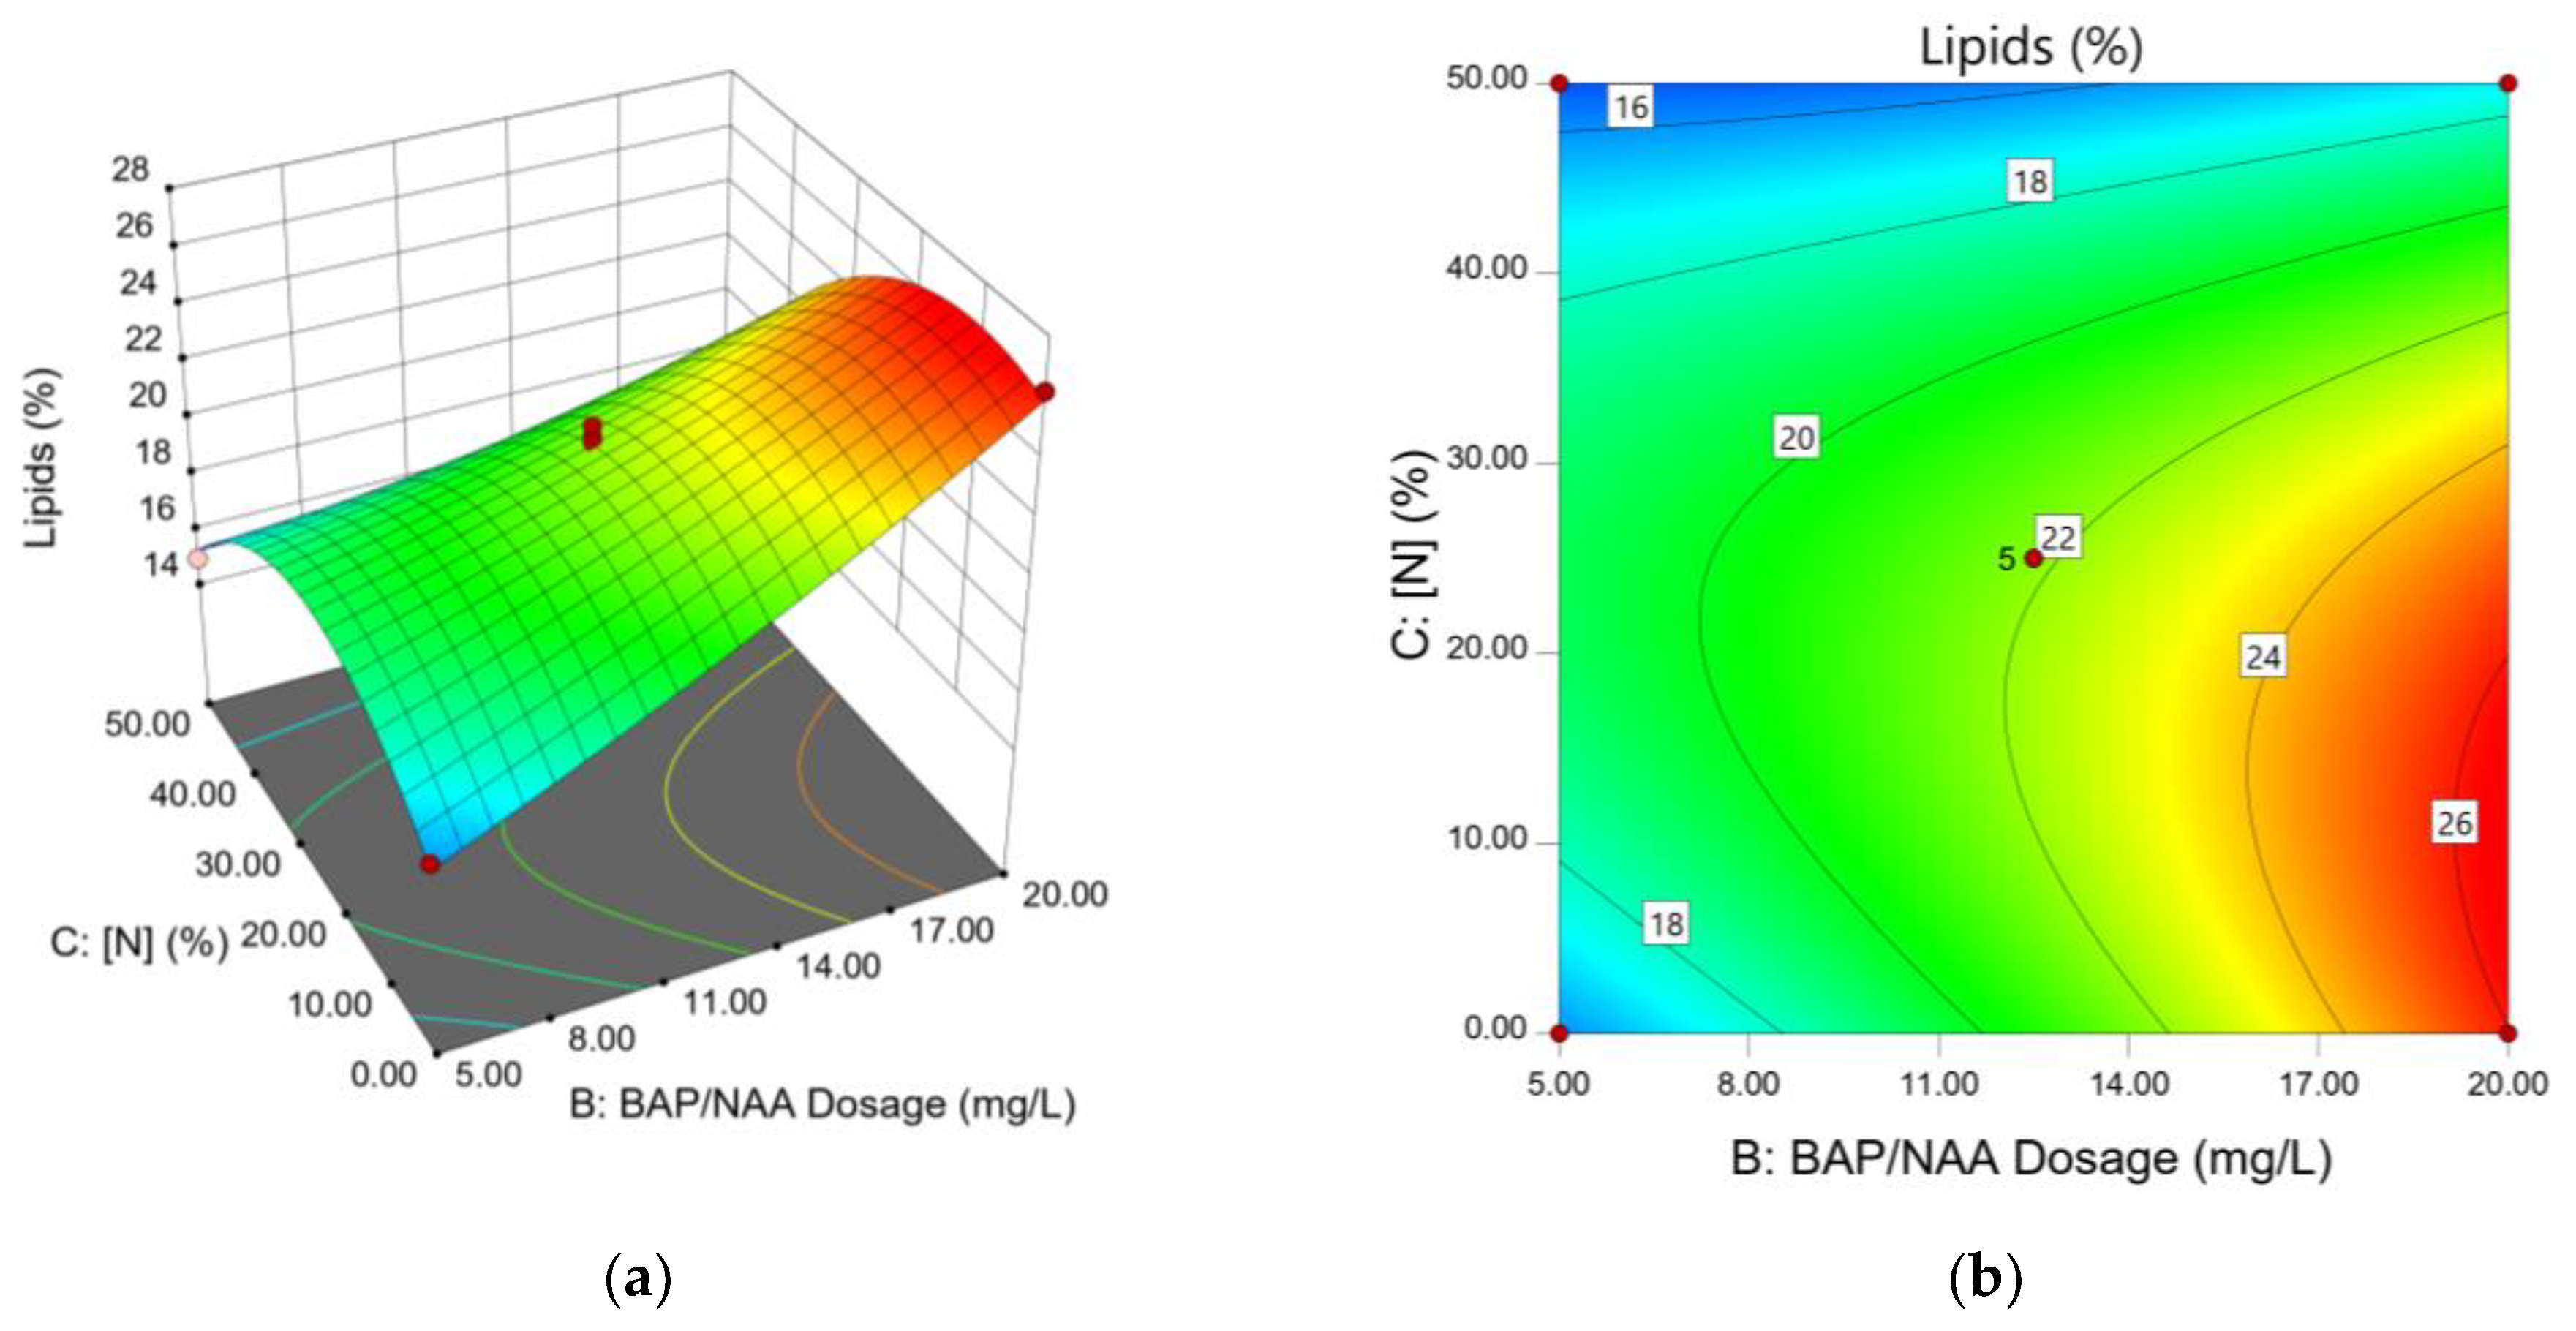

Table 1.
Factors and levels for the experimental design for the optimization of phytohormone (BAP/NAA) and nitrogen concentration in N. oculata cultures.
Table 1.
Factors and levels for the experimental design for the optimization of phytohormone (BAP/NAA) and nitrogen concentration in N. oculata cultures.
| Factors | Factor Code | Levels | |
| Low | High | ||
| BAP Fraction | A | 0 | 1 |
| BAP/NAA total Dose (ppm) | B | 5 | 20 |
| N Concentration (%) | C | 0 | 50 |
Table 2.
Box-Behnken design matrix with 17 runs using a quadratic model.
| Run | BAP Fraction |
BAP/NAA Dose (ppm) |
N (%) |
Lipids (%) observed |
Lipids (%) Predicted |
|---|---|---|---|---|---|
| 1 | 1 | 20 | 25 | 22.01 | 21.43 |
| 2 | 1 | 12.5 | 0 | 14.31 | 15.17 |
| 3 | 0 | 20 | 25 | 25.19 | 25.84 |
| 4 | 0.5 | 12.5 | 25 | 21.95 | 21.84 |
| 5 | 1 | 12.5 | 50 | 14.28 | 14.63 |
| 6 | 0.5 | 12.5 | 25 | 21.49 | 21.84 |
| 7 | 1 | 5 | 25 | 17.20 | 16.55 |
| 8 | 0 | 5 | 25 | 18.16 | 18.74 |
| 9 | 0.5 | 5 | 0 | 16.17 | 15.95 |
| 10 | 0.5 | 12.5 | 25 | 22.51 | 21.84 |
| 11 | 0.5 | 20 | 50 | 17.02 | 17.22 |
| 12 | 0.5 | 20 | 0 | 26.26 | 25.96 |
| 13 | 0 | 12.5 | 0 | 23.03 | 22.65 |
| 14 | 0.5 | 12.5 | 25 | 21.12 | 21.84 |
| 15 | 0.5 | 5 | 50 | 14.96 | 15.26 |
| 16 | 0.5 | 12.5 | 25 | 22.14 | 21.84 |
| 17 | 0 | 12.5 | 50 | 14.63 | 13.76 |
| Control | 0 | 100 | 0 | 12.4 |
BAP: benzyl amino purine. NAA: Naphtalene aceti acid. N: nitrogen.
Table 2.
Analysis of variance for response surface quadratic model to study the effect BAP fraction, BAP+NAA Dosage and N-concentration on lipid yield in N. oculata.
Table 2.
Analysis of variance for response surface quadratic model to study the effect BAP fraction, BAP+NAA Dosage and N-concentration on lipid yield in N. oculata.
| Source | Sum of Squares | df | Mean Square | F-value | p-value |
|---|---|---|---|---|---|
| Model | 243.48 | 9 | 27.05 | 39.98 | < 0.0001 |
| A | 21.75 | 1 | 21.75 | 32.14 | 0.0008 |
| B | 71.82 | 1 | 71.82 | 106.14 | < 0.0001 |
| C | 44.46 | 1 | 44.46 | 65.71 | < 0.0001 |
| AB | 1.23 | 1 | 1.23 | 1.82 | 0.2192 |
| AC | 17.43 | 1 | 17.43 | 25.76 | 0.0014 |
| BC | 16.20 | 1 | 16.20 | 23.94 | 0.0018 |
| A² | 11.10 | 1 | 11.10 | 16.40 | 0.0049 |
| B² | 0.7481 | 1 | 0.7481 | 1.11 | 0.3280 |
| C² | 56.59 | 1 | 56.59 | 83.63 | < 0.0001 |
| Residual | 4.74 | 7 | 0.6766 | ||
| Lack of Fit | 3.56 | 3 | 1.19 | 4.06 | 0.1048 |
| Pure Error | 1.17 | 4 | 0.2929 |
A: BAP Fraction. B: BAP/NAA Dosage. C: nitrogen concentration.
Table 3.
Levels and factors for the Optimization of lipid yield in N. oculata.
| Name | Goal | Lower Limit | Upper Limit | Lower Weight | Upper Weight | Importance |
|---|---|---|---|---|---|---|
| A | minimize | 0 | 1 | 1 | 1 | 3 |
| B | is in range | 20 | 40 | 1 | 1 | 3 |
| C | is in range | 0 | 25 | 1 | 1 | 3 |
| Lipids | maximize | 14.28 | 26.26 | 1 | 1 | 5 |
A: BAP Fraction. B: BAP/NAA Dosage. C: nitrogen concentration.
Table 4.
Theoretical model validation results against experimental values in the push-pull strategy for N. oculata lipid yield optimization.
Table 4.
Theoretical model validation results against experimental values in the push-pull strategy for N. oculata lipid yield optimization.
| BAP Fraction |
BAP/NAA Dosage |
% N | Theoretical Lipid Yield* |
Experimental Lipid Yield** |
% Error |
|---|---|---|---|---|---|
| 0 | 39.500 | 23.249 | 40.915 ± 0.82 | 38.87 ± 0.927 | 4.99 |
*Mean ± CI (95% confidence interval), ** Mean ± SD (standard deviation, n = 3).
Disclaimer/Publisher’s Note: The statements, opinions and data contained in all publications are solely those of the individual author(s) and contributor(s) and not of MDPI and/or the editor(s). MDPI and/or the editor(s) disclaim responsibility for any injury to people or property resulting from any ideas, methods, instructions or products referred to in the content. |
© 2025 by the authors. Licensee MDPI, Basel, Switzerland. This article is an open access article distributed under the terms and conditions of the Creative Commons Attribution (CC BY) license (http://creativecommons.org/licenses/by/4.0/).
Copyright: This open access article is published under a Creative Commons CC BY 4.0 license, which permit the free download, distribution, and reuse, provided that the author and preprint are cited in any reuse.


