Submitted:
10 March 2025
Posted:
11 March 2025
You are already at the latest version
Abstract
Bermudagrass is a warm season turfgrass commonly grown in drought prone areas. Harnessing natural genetic variation available in germplasm is a principal strategy to enhance its resilience to drought stress. This study was carried out to assess the comparative performance of bermudagrass hybrids under drought conditions and their subsequent recovery following the drought period. A total of 48 hybrids including two commercial cultivars, ‘Tifway’ and ‘TifTuf’, were established under optimum growth conditions in the greenhouse and then subjected to drought stress by withholding irrigation for four weeks. The dry down experiment was laid out in a randomized complete block design with four replications. Turf color, visual quality, and active spectral re-flectance data were collected weekly and used to assess the health and vigor of the hybrids during progression of the drought stress for four weeks and through recovery after re-watering. Analysis of variance revealed significant differences among the hybrids for color, visual quality, and spectral vegetation indices. A multivariate analysis grouped the hybrids into a drought tolerant with full recovery after re-watering, moderately tolerant, and susceptible to extended drought stress without recovery. These results showed the prevalence of genetic diversity for drought tolerance that prove instrumental in the development of bermudagrass cultivars resilient to drought stress and improved water use efficiency.
Keywords:
regrowth
; color
; drought recovery
; visual quality
; spectral reflectance
; optical indices
1. Introduction
The turfgrass industry in the desert southwest USA is increasingly facing a water scarcity challenge to maintaining healthy and resilient landscapes. Frequent and prolonged droughts, higher temperatures, and declining freshwater resources have become significant threats to turfgrasses (Serba et al., 2022; Gopinath et al., 2022). Water scarcity and the rise in temperature could worsen in the future, primarily due to changes in global weather patterns (Shao et al., 2008; Braun et al., 2023).
The objective of turfgrass and landscape irrigation is to provide sufficient soil moisture, which is essential for turfgrass growth, shoot density, and acceptable turf quality. In ideal aesthetic conditions, turfgrasses contains 75–85% water by weight (Beard, 1966) and will start wilting with a 10% decrease in water content (Beard, 1973). This will affect subsequent environmental, social, and economic benefits of turfgrass, indicating high water requirements for turfgrass management in desert environments where high temperatures intensify evapotranspiration (ET). Inadequate water availability in the soil profile also limits the ability of turfgrasses to uptake nutrients necessary for its growth, leads to deterioration of turf color and quality, and increased susceptibility to pests and diseases (Huang, 2006). Severe water shortage in the soil can desiccate and kill turfgrass and therefore truncate its ability to fulfil its intended purpose (Huang, 2008; Serba et al., 2022).
Breeding to develop drought tolerant turfgrass varieties is a common strategy for sustaining the turfgrass industry in arid and semi-arid environments. Use of drought resistant turfgrass species and cultivars is advocated to reduce turfgrass irrigation needs (Carrow et al., 1990; Carrow, 1995). The strategy requires leveraging genetic variation prevalent within a selected species (Yu et al., 2023). Moreover, the effectiveness of selecting drought-tolerant genotypes greatly depends on a better understanding of drought tolerance and the recovery characteristics observed after a prolonged drought episode.
Hybrid bermudagrass (Cynodon dactylon × C. transvaalensis) is a widely used turfgrass for home lawns, golf courses, sports fields, and parks. Studies have been conducted to compare, characterize, and understand drought tolerance mechanisms and physiology among bermudagrass genotypes (Leksungnoen et al., 2009; Riaz et al., 2010; Katuwal et al., 2020). Bermudagrass's ability to maintain its functional and aesthetic qualities under limited water availability is a focal point of study (Carrow, 1996; Huang et al., 2019) and highlights the combined importance of soil depth and the genetic composition of cultivars in sustaining turfgrass functionality during periods of drought stress. Research shows significant genetic diversity in bermudagrass, which is well-adapted for regions experiencing drought and elevated temperatures (Husmoen et al., 2012; Huang et al., 2019; Katuwal et al., 2020; Gopinath et al., 2022). A range of drought stress response differences have been observed in bermudagrass (Shi et al., 2012; Yu et al., 2023) mainly through drought avoidance and tolerance mechanisms such as osmotic adjustment, antioxidant metabolism, and rooting characteristics (Katuwal et al., 2020). Intraspecific diversity in rooting depth has been documented for bermudagrass in an ideal soil condition (Hays et al., 1991). Gopinath et al (Gopinath et al., 2022) reported significant variations among several bermudagrass genotypes for leaf firing, turf quality, canopy temperature, and normalized difference vegetation index (NDVI) values in the field. Root traits which allow for the absorption of water from deeper soil layers without restriction were likely linked to better performance of some of the genotypes.
Understanding inherent genetic variation regarding drought tolerance and recovery after prolonged drought stress among germplasm sources can bring a new insight supporting bermudagrass breeding programs. It is crucial for developing drought and heat-resistant varieties that support quality landscapes while maximizing water conservation. Utilization of the natural diversity present in bermudagrass is essential for the development of improved cultivars that can thrive in harsh environmental conditions and meet recreational and ecosystem services needs in the desert southwest. Therefore, we investigated 48 hybrid turf bermudagrass genotypes with an induced drought stress using a dry down experiment in a controlled greenhouse environment by withholding irrigation for four weeks before re-watering. The objectives of this study were to examine the relative drought tolerance of the genotypes and their recovery potential after a prolonged drought stress.
2. Materials and Methods
2.1. Study Materials and Greenhouse Conditions
A total of 48 turf type bermudagrass hybrids including two commercial cultivars, ‘Tifway’ and ‘TifTuf’, were evaluated. The entries were established under optimum growth conditions in a greenhouse. The experiment was arranged in the middle of the greenhouse chamber on a bench between an evaporative cooler and exhaust fans. Plants were subjected to acute water stress by withholding irrigation for four weeks and then were rewatered. The greenhouse condition throughout the experimental period consisted of a natural light intensity average of 2,000 µmole m-2 s-1 for an average of 13 hours, with mean daily temperatures of 32.2 °C (90 °F) and 26.7 °C (85 °F) during the day and night, respectively.
2.2. Seedling Establishment, Turfgrass Maintenance and Drought Treatment
The plants for this experiment were grown from plugs taken from a field experiment at Maricopa
Agricultural Center (MAC), Maricopa, Arizona (33°3′24″N 112°2′48″W). The plugs were planted in a 20 cm wide x 40 cm deep polyethylene pot (Stuewe and Sons Inc., Corvallis, Oregon) filled with a mixture of Pro-Mix general purpose growing medium (Premier Horticulture Ltd., Quebec, Canada) and fine sand (USGA specific 90:10 sand/peat moss mix (v:v)) in 1:1 ratio (v:v). All the pots were subjected to a pre-trial conditioning treatment by watering once a week for a month. Irrigation was provided to the plants manually from overhead shower. Once a full canopy was formed by all the genotypes and uniform visual turf quality obtained, the plants were trimmed to 10-cm above the pot top and consistently maintained by weekly trimming conducted one day prior to data collection. Then, irrigation was withheld and the following day the soil volumetric water content (VWC%) was measured by fully inserting a 12-cm probe from the top surface of each pot using a FieldScout TDR 350 digital soil moisture meter (Spectrum Technologies, Inc., Aurora, IL, USA). This dry-down drought stress lasted for four weeks. After this period, each pot was well-watered to allow the soil moisture to return to field capacity to initiate the recovery process.
2.3. Experimental Design, Response Variables, and Statistical Analysis
The 48 hybrid bermudagrass genotypes, including ‘Tifway’ and ‘TifTuf’, were laid out in a randomized complete block design (RCBD) with four replications. The experiment was arranged in the middle of the greenhouse chamber on a bench between an evaporative cooler and exhaust fans. Response variables such as visual turf color and quality assessment along with active spectral reflectance, color imagery, and soil moisture data were collected on a weekly basis. Turfgrass color and quality ratings were visually assessed using 1- 9 scale of the NTEP evaluation guideline (Morris and Shearman, 2000; Morris, 2004), where 1 = worst, 6 = minimum acceptable level, and 9 = best.
The active spectral reflectance data were captured with a height independent active crop canopy sensor, the 'RapidScan CS-45' (Holland Scientific, Lincoln, NE, USA), which measures canopy reflectance at the wavelengths of 670 nm, 730 nm, and 780 nm. The sensor was held in nadir view 40-cm above the surface of the pots without any background. Images were taken by hand using an Olympus Tough TG4 with locked exposure settings. All the data were collected between 1:00 to 2:00 pm in the afternoon. Spectral vegetation indices such as normalized difference red edge index (NDRE) (Gitelson and Merzlyak, 1994), normalized difference vegetation index (NDVI) (Raun et al., 2001), dark green color index (DGCI) (Rorie et al., 2011), normalized green-blue difference vegetation index (NGBVI) (Bendig et al., 2015; Solano-Alvarez et al., 2022), and normalized red-blue difference vegetation index (NRBVI) (De Swaef et al., 2021) were calculated using the formulae provided in the respective references. The data were collected weekly for four weeks without watering and one week after re-watering. These observations were used to assess the responses of the genotypes to the progression of drought stress and for recovery after prolonged simulated drought.
Weekly soil moisture status was monitored using a FieldScout TDR 350 digital soil moisture meter and volumetric water content (VWC %) was recorded. The measurement was made by first placing the moisture sensor in the first pot and waiting a few minutes to allow for some thermal equilibration before beginning. The pot was then left in place for one to three seconds prior to the measurement, and it was measured at a speed of roughly three to six seconds. Only one measurement was taken per pot after multiple measurements were confirmed to yield a stable reading.
Data were subjected to statistical analyses of variance, multivariate analysis such as cluster, and correlation analyses using R and SAS statistical software. R packages including ‘FactoMineR’ (Lê et al., 2008), and ‘cluster’ (Mächler et al., 2012) were used in the multivariate analyses and visualization of results. Replications were designated as random while the genotypes were fixed effects in the analysis.
3. Results
3.1. Effect of Drought on Bermudagrass Aesthetics and Vegetation Indices
Induced drought impacted the average overall color and quality scores of bermudagrass hybrids tested for drought tolerance in a controlled environment (Figure 1). Though there were variations among the hybrids tested, the average color and quality scores decreased as the drought progressed. The initial effect of drought was minimal in the first two weeks, however, by week four after drought initiation (T_4), the average color and quality scores were dramatically reduced to below the acceptable level of visuall score being 6. As induced drought stress continued from T_0 through T_4, mean color scores were significantly decreased from 7.3 to 3.5 (Figure 1a). The mean color differences were significant between different time points except T_0 and T_1. After the drought was halted average color scores of the hybrids after recovery (T_5), increased to the T_3 stage average. Similarly, turf quality was linearly decreased as drought stress continued from T_0 through T_4.
Some of the active spectral vegetation indices and imaging data depicted an overall decline in average performance of the genotypes through week four (T_4) (Figure 1b). NDVI and NDRE showed continual reduction as the drought stress sustained with significant differences among the time points. NDVI scores significantly decreased from 0.87 at T_0 to 0.51 at T_4. Overall NDVI scores of the hybrids were statistically recovered to T_3 level one week after the induced drought was halted via re-watering. Likewise, average NDRE differences were observed among the time points. On the other hand, DGCI, NGBVI, and NRBVI did not show substantial differences between different stages of drought stress and in recovery phase.
The mean separation for visual assessment and spectral reflectance (LSD0.05) for all the genotypes showed that there were significant differences between the weeks (Figure 3). Average color and quality scores were significantly affected starting at week three (T_2) ( Figure S1a). After rewatering, color recovered faster than quality. The spectral vegation indices showed the same trend (Figure S1b) and the total fraction of green (NDVI) decreased faster than the DGCI.
3.2. Variation in Drought Response and Recovery Among Bermudagrass Hybrids
Combined analysis of variance indicated that visual ratings and optical indices of bermudagrass hybrids were significantly affected by genotype, time (length of drought stress), and their interaction effects (Table 1). There were highly significant differences among the hybrids for color and quality, as well as four spectral vegetation indices namely NDRE, NDVI, DGCI, NGBVI, and NRBVI. There were highly significant differences among the six time points when the performance data were collected during the drought stress study. Genotype by time interaction was also significant for color (p ≤ 0.001), quality (p ≤ 0.001), NGBVI (p ≤ 0.001), and NRBVI (p ≤ 0.001), DGCI (p ≤ 0.01), NDRE (p ≤ 0.05), and NDVI(p ≤ 0.05).
Individual weekly time point data analysis of variance of visual and optical indices showed differences among turf bermudagrass hybrids (Table S1). Genotypic difference for visual color and quality during the dry down (T_0 to T_4) and recovery (T_5) phases were significant. Differences in visual color and quality at T_0 and T_1 were mainly due to genetic differences. Pre-drought stress (T_0), hybrids such as OSU 1156 and OSU 2118 gave the highest and lowest color scores of 8.8 and 6.3, respectively. Similarly, the mean highest and lowest turf quality scores recorded were 8.5 and 5.5 for OSU 2101 and OSU 2119, respectively.
Mean color and quality scores of the genotypes showed palpable variation among the genotypes four weeks after withholding irrigation (Figure 2a) and after recovery (Figure 2b). Genotypes such as OSU 2119, OSU 1617, OSU 2118, OSU 2107, and OSU 2018 maintained acceptable levels of greenness and turf quality. OKC 1876 showed acceptable color but lower visual quality. On the other hand, OSU 2021 showed acceptable quality but a lower color score.
3.3. Correlation of Visual Ratings and Spectral Reflectance
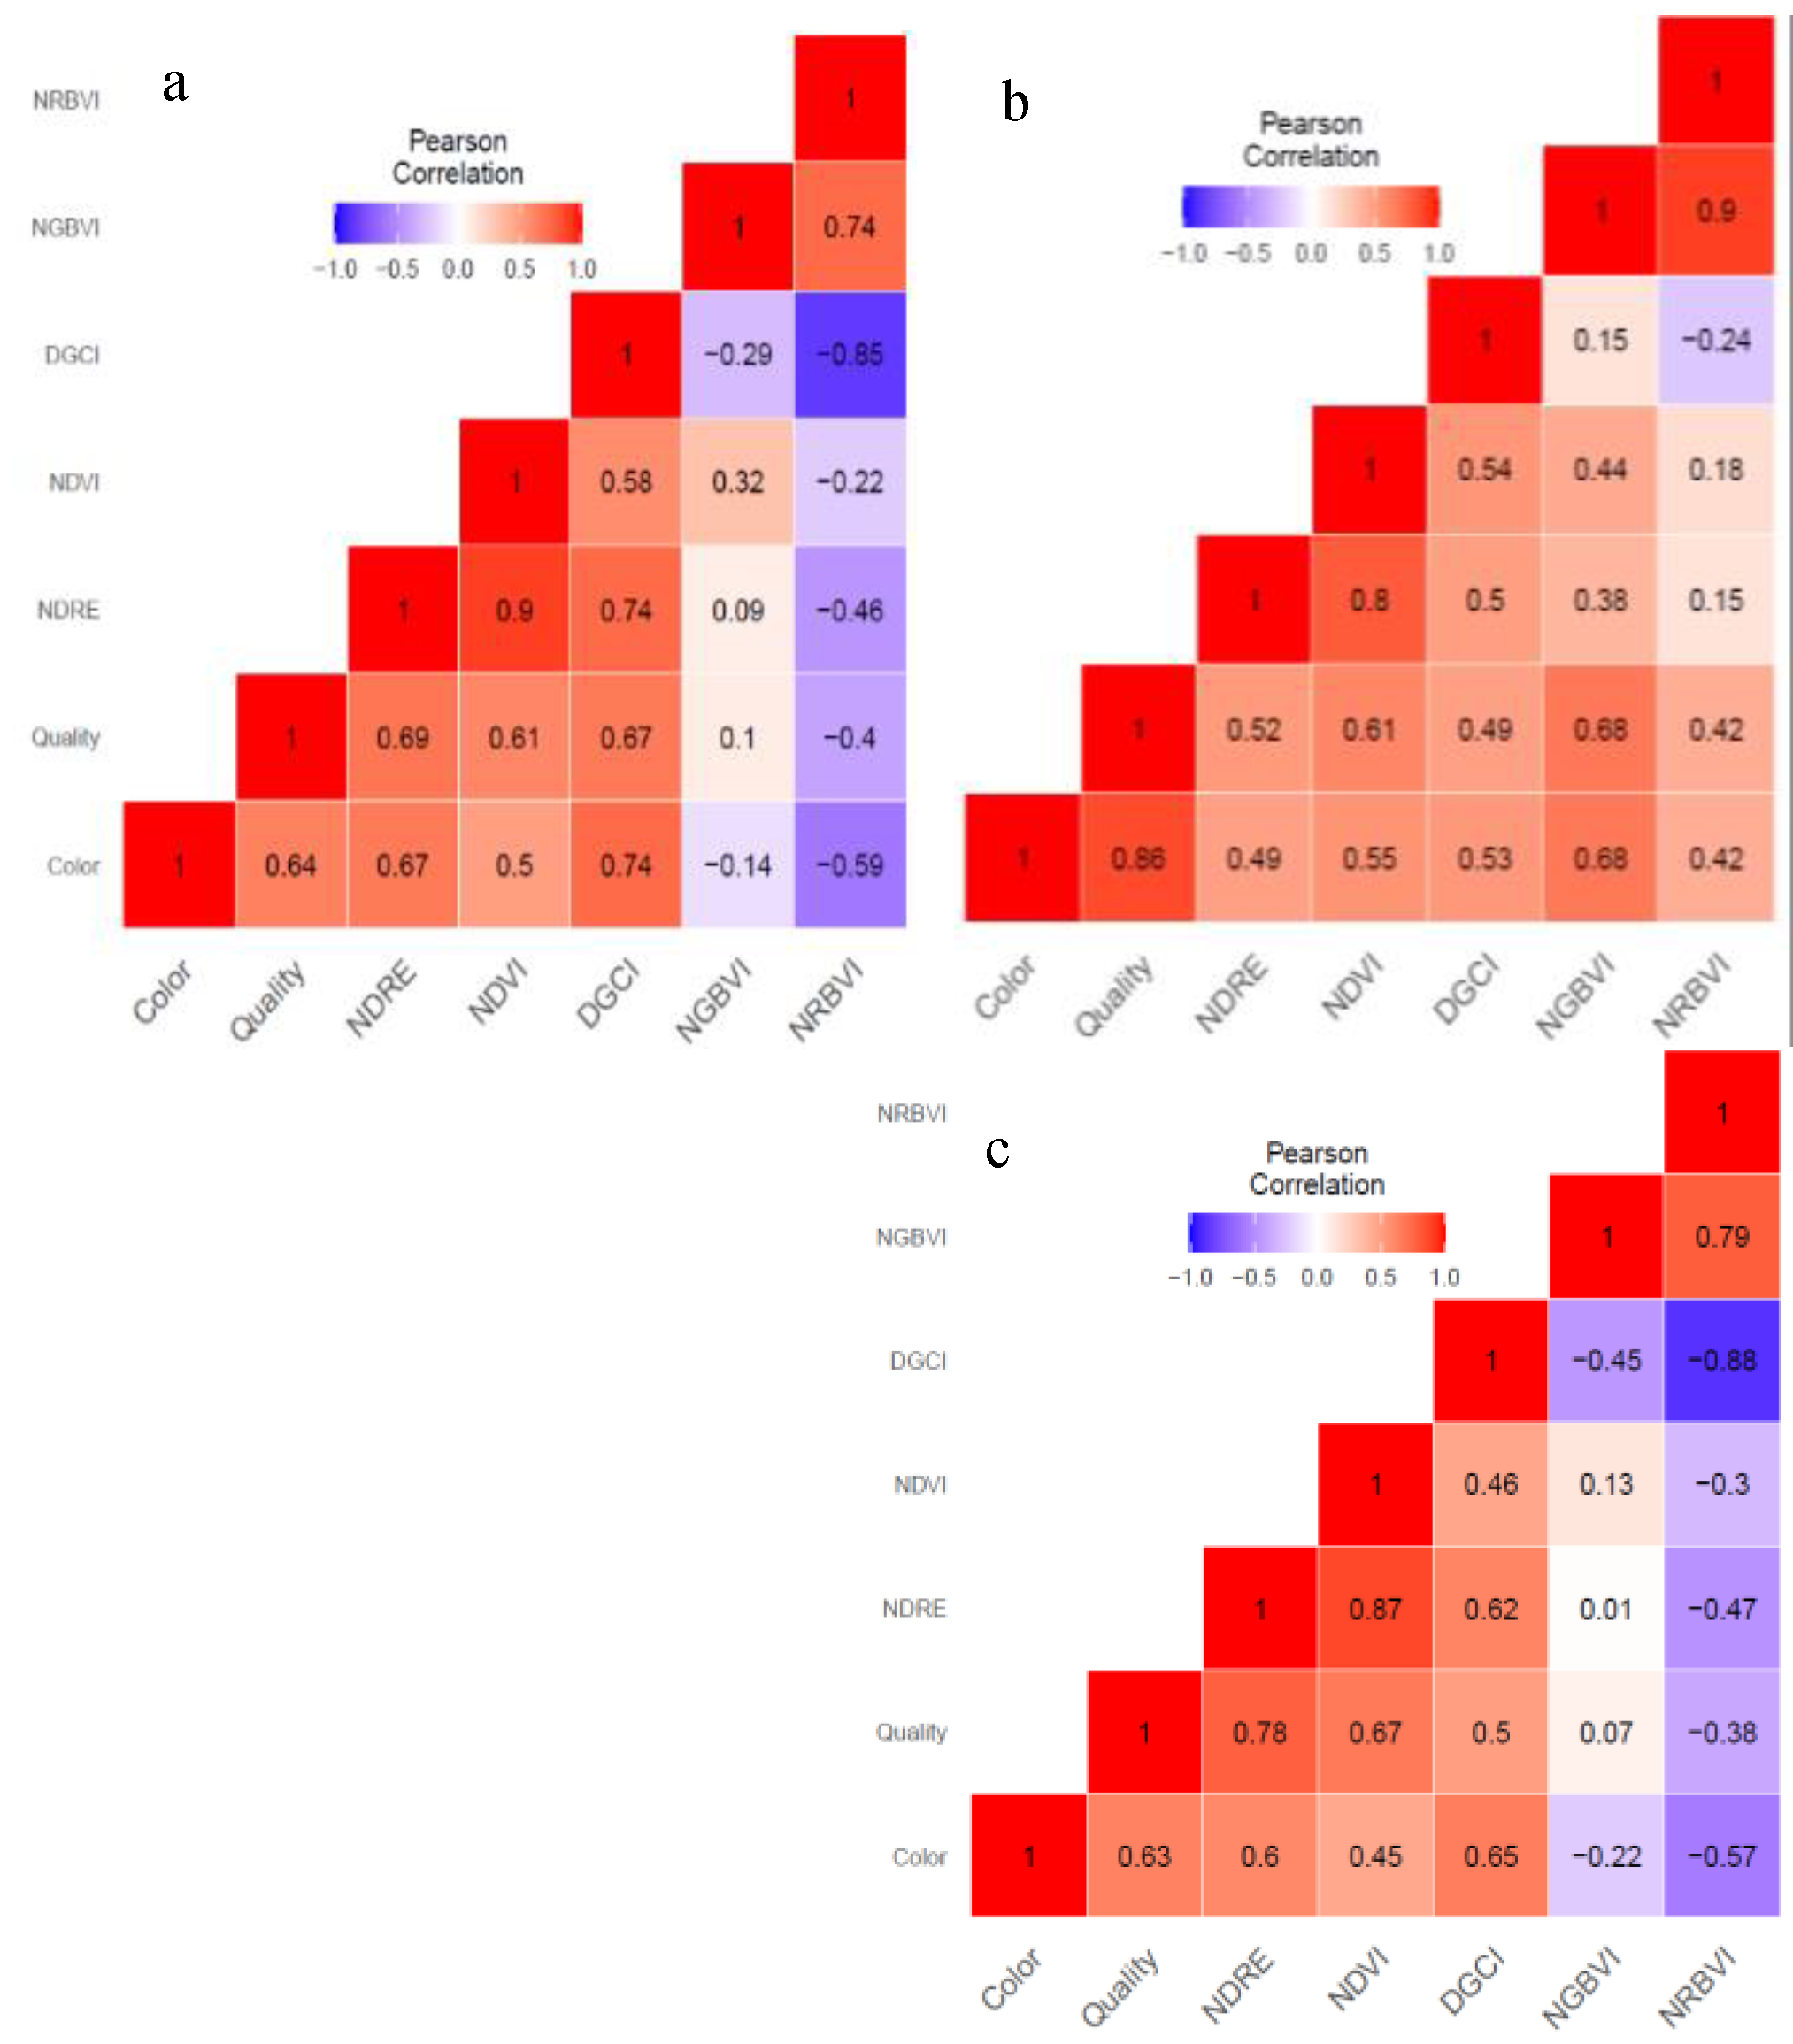
Pearson correlation analysis was performed to quantify the magnitude and determine direction of associations among the visual assessement scores and optical indices at T_0, T_4, and T_5 time points (Figure 3). The correlation coefficients were computed for each pair of the two visual assessment and five spectral parameters considered in the study. Correlation coefficients revealed that various degrees of associations are prevalent among visual assessment and active spectral reflectance-based vegetation indices during the progression of drought stress and recovery phase after rewatering. In general, visual color and quality were positively correlated with NDRE, NDVI, and DGCI in pre-stress, maximum stress and recovery phases. Color had strong positive correlation with quality (r = 0.64, p ≤ 0.001), NDVI (r = 0.50, p ≤ 0.001), NDRE (r = 0.67, p ≤ 0.001), and DGCI (r = 0.74, p ≤ 0.001). Likewise, quality showed strong positive associations with NDVI (r = 0.61, p ≤ 0.001), NDRE (r = 0.69, p ≤ 0.001), and DGCI (r = 0.67, p ≤ 0.001). Among the spectral vegetation indices, NDRE had strong positive correlation with NDVI (r = 0.90, p ≤ 0.001) and DGCI (r = 0.74, p ≤ 0.001). NRBVI was negatively correlated with color, quality and other vegetation indices (except NGBVI) at pre-stress and after recovery. The associations of NGBVI with color (r = -0.14), quality (r = 0.10), and NDRE (r = 0.09) were non-significant.
Four weeks after drought induction, most pair-wise correlation coefficients of visual assessemnt scores and optical indices were strongly positive. Color is positively correlated with quality (r = 0.86, p ≤ 0.001), NDVI (r = 0.55, p ≤ 0.001), DGCI (r = 0.52, p ≤ 0.001), and NGBVI (r = 0.68, p ≤ 0.001). Turf quality also had a positive and strong correlation with NDVI (r = 0.61, p ≤ 0.001), NDRE (r = 0.52, p ≤ 0.001), and NGBVI (r = 0.68, p <0.001). Furthermore, NDVI had a strong positive correlation with NDRE (r = 0.80, p ≤ 0.001) and DGCI (r = 0.54, p ≤ 0.001). The association of NDRE with DGCI (r = 0.5, p ≤ 0.001) and NGBVI with NRBVI (r = 0.9, p ≤ 0.001) were found to be strong and positive as well.
At recovery phase, strong positive association was observed for color with quality (r = 0.63, p ≤ 0.001), NDRE (r = 0.60, p ≤ 0.001), and DGCI (r = 0.65, p ≤ 0.001). Similarly, quality had strong positive association with NDVI (r = 0.67, p ≤ 0.001), NDRE (r = 0.78, p ≤ 0.001), and DGCI (r = 0.50, p ≤ 0.001). Furthermore, NDRE with NDVI (r = 0.87, p ≤ 0.001) and DGCI (r = 0.62, p ≤ 0.001) showed strong positive correlation. Other pair-wise comparison including NGBVI with NRBVI (r = 0.79, p ≤ 0.001) showed strong positive relationship. NDVI showed moderate positive correlation with color (r =0.45, p < 0.001) and DGCI (r = 0.46, p ≤ 0.001). In contrast, NRBVI had significant negative associations with DGCI (r = -0.88, p ≤ 0.001) and color (r = -0.57, p ≤ 0.001). Negative association of NRBVI with quality (r = -0.38, p ≤ 0.001), NDRE (r = -0.47, p ≤ 0.001), and NDVI (r = -0.3, p ≤ 0.001) were also observed. A statistically significant negative association was also observed between NGBVI and DGCI (r = -0.45, p ≤ 0.001). Despite the significant positive or negative correlations presented above, no association was detected (p ≤ 0.05) for NGBVI with quality (r = 0.07), NDVI (r = 0.13), and NDRE (r = 0.01).
Figure 3.
Pearson correlation of spectral vegetation indices and visual color and quality traits of 48 turf bermudagrass hybrids (a) before the onset of drought stress (T_0), (b) after four weeks (T_4), and (c) one week in recovery after rewatering (T_5). Normalized Difference Vegetation Index (NDVI), Normalized Difference Red Edge Index (NDRE), Soil Adjusted Vegetation Index (SAVI), Dark Green Color Index (DGCI), Normalized Red Blue Vegetation Index (NRBVI), and Normalized Green-Blue Vegetation Index (NGBVI). Magnitude and direction of correlation is indicated by the heat map as red for positive and blue for negative associations.
3.4. Clustering of Bermudagrass Hybrids Pre-, Post-Stress and After Recovery
Hierarchical agglomerative cluster analysis was conducted utilizing visual assessment, spectral reflectance, and imaging data collected at pre-drought stress (T_0), at maximum drought stress (T_4), and during recovery (T_5) revealed distinct grouping patterns (Figure 4). These differences typically reflect the physiological and genetic responses of the genotypes to water stress and their ability to recover after prolonged dry spells. The pre-stress genotypes cluster originates from baseline physiological traits like growth rate, leaf area, color, and similarities in genetic makeup and metabolic profiles. The cluster of genotypes four weeks post drought stress initiation (maximum drought stress) shifted the groupings of the genotypes dramatically. Genotypes which exhibited high color and quality scores such as OSU 1617, OSU 2119, and OSU 2018 were characteristically grouped together, while susceptible genotypes OSU 1156, OSU 2102, and OSU 2113 were grouped.
At recovery phase, the pattern of groupings of the genotypes was vividly changed. This regrouping based on visual assessment and spectral vegetation indices data highlights the differential ability of the bermudagrass genotypes to resume normal growth and photosynthesis after prolonged drought stress. Genotypes which demonstrated rapid recovery and regrowth such as OSU 2119, OSU 2021, and OSU 1617 were grouped together. Some of the genotypes did not return to their original clusters, indicating perpetual physiological or structural changes due to drought stress. Those with delayed response and those lacked the recovery ability were grouped separately.
3.5. Principal Component Analysis
Using weekly visual and spectral reflectance data, principal component analysis (PCA) was used to analyze the 48 bermudagrass genotypes. The first three principal component explained about 91% of the total variance of visual and spectral reflectance scores of 48 bermudagrass genotypes before the initiation of drought stress (Figure 5a). NGBVI and NRBVI mostly contributed through PC 2. Except for NRBVI and NGBVI, the remaining spectral indices and visual asessement scores showed higher degrees of positive association. Variance contribution of each spectral indices was higher than that of visual scores.
At four weeks post drought induction, the first three principal components explained about 92.9% of the variance. The first and second principal components explained about 60.7 and 23.9%, respectively. The third component explained only 8.1% of the total variance. Color, quality, NDRE, and SAVI contributed through the first principal component. Similarly, DGCI, NRBVI, and NGBVI contributed through the second principal component. Spectral indices that contributed through the first and second principal components further contributed through the third principal component (8.3%) (Figure 5b).
After 4 weeks of acute water stress the plants were rewatered. Then, one week after rewatering (T_5) entries were evaluated for their recovery using the same set of visual assessments, spectral and optical indices. One week into the recovery, 89.9% of the variance was explained by the first three components (Figure 5A). The first and second principal components explained 61 and 22.5% of the variance. Color, quality, SAVI, DGCI, NDRE, and NRBVI contributed through the first component. Contributions to the second principal component came from NDVI, NGBVI, and NRBVI. Furthermore, color and NDVI contributed to the third principal component (6.4).
The number of principal components (PC) maintained for further analysis was determined by plotting eigenvalues or percentage of explained variances of each dimension (Figure 5c). PCA identified the components that explained significant portion of the variance, the contribution of each parameter to the total variance, and the relationship among the visual and spectral scores.
3.6. Soil Moisture Depletion
Weekly soil moisture content monitoring of the pots of bermudagrass hybrids in the dry down and recovery experiment in a controlled setting revealed continual reduction in VWC% as the drought period progressed (Figure 6A). The moisture sensor data also revealed substantial differences among the pots (figure 6B). It appears that the density of the turfgrass and the level of compaction may account for some of the variations.
4. Discussion
We conducted a dry-down study on 46 turf type bermudagrass hybrids along with two commercial hybrids, ’Tifway’ and ‘TifTuf’. Our investigation was based on variations in visual ratings for color and quality, and active spectral reflectance-based vegetation indices, mainly NDVI, NRDE, and image DGCI as metrics to estimate overall performance of the hybrids in response to extended induced drought stress. The induced drought in a controlled environment impacted the average color and quality scores of most of the bermudagrass genotypes starting at week three (T_3).
Despite differences among the hybrids evaluated, average color and quality scores declined as the drought proceeded. The proportion of bermudagrass hybrids that retained acceptable color score were 100% at one week (T_1) and two weeks (T_2) but reduced to 27% three weeks (T_3) after drought induction. Turf quality scores also showed a linear decline as drought stress progressed throughout the study. Four weeks after drought induction, the average color and quality scores for almost all accessions had dropped substantially to below acceptable levels.
Four weeks after inducing drought conditions, there were noticeable differences in the average color and quality scores among the genotypes. Genotypes such as OSU2119, OSU1617, OSU 2118, OSU 2107, and OSU 2018 maintained acceptable levels of greenness and turf quality after four weeks without irrigation. In contrast, OKC 1876 exhibited acceptable color but had a low-quality score, while OSU 2021 showed acceptable quality with a low color score. A study of 460 common bermudagrass genotypes for genetic variation in drought resistance under natural and imposed drought conditions identified three main clusters based on turf quality and green cover as response variables (Zhou et al., 2013).
Several studies have been conducted to characterize, compare, and understand drought tolerance characteristics among different sets of bermudagrass genotypes and physiological mechanisms underlying the differences (Leksungnoen et al., 2009; Riaz et al., 2010; Katuwal et al., 2020). A study into physiological responses of drought tolerance in bermudagrass grouped genotypes into drought tolerant, moderately tolerant, and susceptible types (Shi et al., 2012). This grouping was probably based on relative water loss, as cell membrane damage (electrolyte leakage), osmolytes, accumulation of hydrogen peroxide (H2O2), and antioxidant enzymes activities.
The standard controls, ‘Tifway’ and ‘TifTuf’ did not retain acceptable visual ratings beyond three weeks after drought induction. In contrary to our findings, in a study conducted to investigate differences in drought response among bermudagrass and seashore paspalum genotypes, ‘TifTuf’ had consistently maintained higher quality ratings with low canopy temperatures, higher relative water content, and the greatest accumulation of osmolytes during drought (Jespersen et al., 2019).
Both visual assessments and active spectral reflectance measurements were utilized to evaluate the health and vigor of the genotypes throughout the drought stress period and during recovery. Analysis of variance indicated significant differences among the hybrids in terms of color and quality, as well as in four optical indices: NDRE, NDVI, DGCI, NGBVI, and NRBVI. These results are in agreement with a previous report of genetic variation among the hybrids for spectral vegetation indices under optimal growing condition (Serba et al., 2023). Highly significant differences were also observed among the six time points. Additionally, the interaction between genotype and time was significant for the visual and spectral indices. Significant differences among the genotypes at pre-drought, at maximum drought, after recovery, between time points, and the genotype-time interaction effects for all the visual assessment and spectral reflectance data indicates genetic variation among the bermudagrass hybrids for both drought tolerance and recovery potential. This result is aligned with previous reports where wilt and leaf firing variations of turfgrasses during dry-down periods reflect relative drought resistance of genotypes (Carrow, 1996).
As visual turf quality and color assessments are subjective, objective high throughput multispectral assessment is valuable. Spectral reflectance indirectly can detect water content via leaf angle and area and depicts a variability in grass water status in water deficit condition (Jiang et al., 2009). Analysis of variance for NDRE, NDVI, DGCI, NGBVI, and NRBVI showed significant differences among genotypes, time, and genotype by time interaction effects. As the reflectance spectra of the genotypes underwent a gradual reduction with increased turfgrass desiccation, vegetation indices are acclaimed as effective indicators of water stress in bermudagrass (Caturegli et al., 2020).
The NDVI exhibited significant variations across different time points. Average NDVI scores decreased significantly from 0.87 to 0.35 as induced drought stress proceeded during dry down phase. However, the overall NDVI scores of the hybrids statistically returned to the T_3 level one week after the drought was alleviated through re-watering. Katuwal et al (Katuwal et al., 2020) reported that drought tolerant bermudagrass genotypes maintained higher NDVI values compared to drought susceptible ones. Haghverdi et al (Haghverdi et al., 2021) reported a strong association of NDVI and visual rating values. The NDVI is a non-invasive tool that has been pivotal in vegetation analysis to monitor photosynthetic activity, overall plant health by evaluating the difference in reflectance between near-infrared (NIR) and red light under various environmental conditions (Thapa et al., 2019). Changes in other spectral indices, including NDRE, DGCI, NGBVI, and NRBVI, followed the same trend, indicating that drought progression had a significant impact on active spectral reflectance. These variations observed among the hybrids suggest that spectral reflectance can be used bermudagrass breeding to select genotypes for leaf water potential and for recovery from extended drought condition. Investigating the variations in vegetation indices among the hybrids under water stress conditions is also crucial to understanding drought adaptive mechanisms and optimum management of turfgrass irrigation.
The result indicates that substantial drought response variations exist among the 48 bermudagrass hybrids evaluated under a controlled environment. Similar results were observed in controlled and field condition investigations (Yu et al., 2023). Four weeks of dry down period uncovered substantial drought response variation among the hybrids. Dry down periods vary significantly depending up on the genotype (natural or experimental genotypes), study conditions (field vs controlled). A study that evaluated 10 bermudagrass genotypes under greenhouse and field condition indicated that genotypes under field condition tend to perform better for longer dry down phases (up to 60 days) vs 9 days under controlled environment (Gopinath et al., 2022). The reduced rooting zone in a pot and inability to access deep water storage induced quicker and more extreme stress than the field environment.
Drought response variation among turf bermudagrass hybrids could prove instrumental in the development of bermudagrass cultivars resilient to drought stress and improved water use. Genotypic variation for responses to reduced soil water supply among bermudagrass is attributed to shoot and root traits affecting water access, retention, and use (Harlan et al., 1970; Beard, 1989; Husmoen et al., 2012). Among shoot and root traits, canopy configuration or leaf orientation, shoot density, growth habit, rooting depth, and root density are the important characteristics (Beard, 1973; Huang et al., 1998). Bermudagrass leaf characteristics that contribute to drought tolerance are hailed to be thick leaf cuticles, smaller stomatal openings, and low evapotranspiration rate (Carrow, 1996; Qian and Fry, 1997; Zhou et al., 2013). This variation facilitates the likelihood of selecting more desirable superior genotypes for appropriate landscapes in the desert southwest. In addition to variation in drought response, the breeding program is recommended to focus on developing genotypes with a more extensive root system and higher root-to-shoot ratio as an effective strategy to improve the drought performance of bermudagrass (Yu et al., 2023).
Although determining drought tolerance mechanisms is beyond the scope of this study, bermudagrass has various drought response mechanisms including physiological adaptations (osmotic adjustment, stomatal regulation, photosynthetic efficiency, hormonal response, root architectural adjustments (Shi et al., 2012). Morphological adaptations including changes in leaf morphology, accumulation of cuticular wax, tillering responses, internode elongation, biomass allocation, and enhancements in seed production and viability (Liu et al., 2017).
A Pearson coefficient of correlation analysis was performed to assess the relation-ships between visual and optical indices at 0 and 4 weeks after drought induction and. In the recovery phase (T_5). Correlation analysis revealed associations among visual assessment traits and optical vegetation indices for bermudagrass hybrids evaluated for drought response during the extended drought stress and recovery phase after rewatering. The results agree with previous reports where visual and vegetation indices were highly and positively correlated (Yu et al., 2023).
Clustering and principal component analyses of bermudagrass hybrids during the dry down and recovery phases elucidated the pattern and association of indices and genotypes. Degrees of contribution of each indices varies, to some extent, during the drought initiation, maximum drought event, and recovery phases. During the dry down and recovery phases, the first three principal components explained about 88.4 to 92.9 percent of the variance based on the spectral and vegetation indices. Among the indices, NDVI had the lowest contribution to the total variation at four weeks after drought induction. Yet color and quality had remarkable effect on the total variance among the 48 bermudagrass hybrids at the maximum drought stress treatment (i.e. four weeks after drought induction). This indicates that the various spectral and vegetative indices respond differentially to the induced stress. Findings of the current study are instrumental in the breeding process for the development of superior bermudagrass cultivars suitable for drought prone and water-scarce areas. This shift of genotypes grouping under maximum drought stress is primarily due to variations in drought tolerance, largely attributed to variations in osmotic adjustment (proline accumulation, soluble sugars), stomatal regulation and water retention capacity, and antioxidant enzyme activity (Huang et al., 2019). Based on the response characteristics, the 48 bermudagrass genotypes can be grouped into three groups such as highly drought tolerant with full recovery after re-watering, moderately tolerant, and susceptible to extended drought stress without recovery.
5. Conclusions
In general, distinct genotypes demonstrated varying capacities for drought tolerance and drought recovery. The results indicate that hybrids exhibit trait diversity to cope with various recurring water deficits or to recover from extended drought stress. These abilities reflect the extent of genetic variation and the significant potential of the germplasm under study for developing new cultivars suitable for arid and semi-arid environments. Under drought stress conditions, both color and quality were affected, as measured by spectral vegetation indices and visual assessments. The persistence and recovery rate of few genotypes were high implying better water use efficiency.
Better understanding the drought tolerance mechanisms in those identified hybrids is a crucial next step in the development of drought resilient bermudagrass cultivars. Transcriptome profiling and metabolome profiling would lend insight into the mechanistic basis of drought tolerance in those identified hybrids.
Controlled environments are valuable tools for scientific research, enabling the manipulation of variables and the observation of specific factors of interest. However, it's important to recognize that these environments may not fully replicate field conditions. Field conditions are incredibly complex, comprising of several biotic and abiotic interactions. Therefore, additional field evaluations are needed to assess the relative long-term performance of different genotypes.
Supplementary Materials
The following supporting information can be downloaded at: www.mdpi.com/xxx/s1, Figure S1: Mean separation of the weekly time points of turf bermudagrass hybrids (a) for visual color and quality and (b) optical indices.
Author Contributions
MAM, DDS conceptualized and designed the study, performed the experiments, MMC collected the spectral data and reviewed the manuscript; RWH reviewed the manuscript; YW provided the study materials, reviewed the manuscript; CFW supervised the work. All authors have read and agreed to the published version of the manuscript.
Funding
This research received no external funding. This research was conducted as part of USDA-ARS National Program 215: Pastures, Forage and Rangeland Systems (CRIS: 2020-21500-001-000D). Mention of a trade names or commercial products in this publication is solely for the purpose of providing specific information and does not imply recommendation or endorsement by the U.S. Department of Agriculture or any part herein. USDA is an equal opportunity provider and employer.
Institutional Review Board Statement
Not applicable.
Informed Consent Statement
Not applicable.
Data Availability Statement
All data are presented in the main text and supplementary information.
Acknowledgments
This research was conducted as part of USDA-ARS National Program 215: Pastures, Forage and Rangeland Systems (CRIS: 2020-21500-001-000D).
Conflicts of Interest
The authors declare no conflicts of interest.
References
- Beard, J.B. 1966. Selected turfgrass variety evaluation: Winterkill and drought tolerance. Michigan Turfgrass Report 3: 7-9.
- Beard, J.B. 1973. Turfgrass: Science and culture. Prentice-Hall, Inc., Englewood Cliffs, New Jersey.
- Beard, J.B. 1989. Turfgrass water stress: Drought resistance components, physiological mechanisms, and species-genotype diversity. In: H. Takatoh, editor, Proceedings of the 6th International Turfgrass Research. Tokyo. 31 July–5 Aug. p. 23–28.
- Bendig, J., K. Yu, H. Aasen, A. Bolten, S. Bennertz, et al. 2015. Combining UAV-based plant height from crop surface models, visible, and near infrared vegetation indices for biomass monitoring in barley. Int. J. Appl. Earth Obs. Geoinf. 39: 79–87. [CrossRef]
- Braun, R.C., C.M. Straw, D.J. Soldat, M.A.H. Bekken, A.J. Patton, et al. 2023. Strategies for reducing inputs and emissions in turfgrass systems. Crop. Forage Turfgrass Manag. 9(1): e20218. [CrossRef]
- Carrow, R.N. 1995. Drought resistance aspects of turfgrasses in the southeast: evapotranspiration and crop coefficients. Crop Sci. 35(6): 1685–1690. [CrossRef]
- Carrow, R.N. 1996. Drought resistance aspects of turfgrasses in the southeast: root-shoot responses. Crop Sci. 36(3): 687–694. [CrossRef]
- Carrow, R.N., R.C. Shearman, and J.R. Watson. 1990. Turfgrass. In: Stawart, B.A. and Nielson, D.R., editors, Irrigation of Agricultural Crops. Agronomy Monograph 30, ASA-CSSA-SSSA, Madison, WI. p. 889–919.
- Caturegli, L., S. Matteoli, M. Gaetani, N. Grossi, S. Magni, et al. 2020. Effects of water stress on spectral reflectance of bermudagrass. Sci. Rep. 10(1): 15055. [CrossRef]
- Gitelson, A. , and M.N. Merzlyak. 1994. Quantitative estimation of chlorophyll-a using reflectance spectra: Experiments with autumn chestnut and maple leaves. J. Photochem. Photobiol. B Biol. 22(3): 247–252. [CrossRef]
- Gopinath, L., J.Q. Moss, Y. Wu, and B.M. Schwartz. 2022. Drought response of 10 bermudagrass genotypes under field and controlled environment conditions. Agrosystems, Geosci. Environ. 5(4): e20300. [CrossRef]
- Haghverdi, A., M. Reiter, A. Sapkota, and A. Singh. 2021. Hybrid bermudagrass and tall fescue turfgrass irrigation in central California: I. Assessment of visual quality, soil moisture and performance of an ET-Based smart controller. Agronomy 11(8). [CrossRef]
- Harlan, J.R., J.M.J. de Wet, and K.M. Rawal. 1970. Origin and distribution of the seleucidus race of Cynodon dactylon (L.) pers. var. Dactylon (gramineae). Euphytica 19(4): 465–469. [CrossRef]
- Hays, K.L., J.F. Barber, M.P. Kenna, and T.G. McCollum. 1991. Drought Avoidance Mechanisms of Selected Bermudagrass Genotypes. HortScience HortSci 26(2): 180–182. [CrossRef]
- Huang, B. 2006. Turfgrass Water Requirements and Factors Affecting Water Usage. In: Beard, J.B. and Kenna, M.P., editors, Proceedings of the Workshop on Water Quality and Quantity Issues for Turfgrasses in Urban Landscapes. Council for Agricultural Science and Technology, Las Vegas, Nevada. p. 193–203.
- Huang, B. 2008. Turfgrass water requirements and factors affecting water usage. Water quality and quantity issues for turfgrasses in urban landscapes. p. 193–203.
- Huang, B., J. Fry, and B. Wang. 1998. Water relations and canopy characteristics of tall fescue cultivars during and after drought stress. HortScience 33: 837–840.
- Huang, S., S. Jiang, J. Liang, M. Chen, and Y. Shi. 2019. Current knowledge of bermudagrass responses to abiotic stresses. Breed. Sci. 69(2): 215–226. [CrossRef]
- Husmoen, D., D.M. Vietor, F.M. Rouquette Jr, and J.T. Cothren. 2012. Variation of responses to water stress between ‘Tifton 85’ and ‘Tifway’ or ‘Coastal’ bermudagrass. Crop Sci. 52(5): 2385–2391. [CrossRef]
- Jespersen, D., M. Leclerc, G. Zhang, and P. Raymer. 2019. Drought performance and physiological responses of bermudagrass and Seashore paspalum. Crop Sci. 59(2): 778–786. [CrossRef]
- Jiang, Y., H. Liu, and V. Cline. 2009. Correlations of leaf relative water content, canopy temperature, and spectral reflectance in perennial ryegrass under water deficit conditions. HortScience horts 44(2): 459–462. [CrossRef]
- Katuwal, K.B., B. Schwartz, and D. Jespersen. 2020. Desiccation avoidance and drought tolerance strategies in bermudagrasses. Environ. Exp. Bot. 171: 103947. [CrossRef]
- Lê, S., J. Josse, and F. Husson. 2008. FactoMineR: An R package for multivariate analysis. J. Stat. Softw. 25(1 SE-Articles): 1–18. [CrossRef]
- Leksungnoen, N., P. Johnson, and R. Kjelgren. 2009. Physiological responses to drought of turfgrass species under field conditions.
- Liu, J., H. Yang, S.N. Gosling, M. Kummu, M. Flörke, et al. 2017. Water scarcity assessments in the past, present, and future. Earth’s Futur. 5(6): 545–559. [CrossRef]
- Mächler, M., P. Rousseeuw, A. Struyf, M. Hubert, and K. Hornik. 2012. Cluster: Cluster analysis basics and extensions.
- Morris, K. 2004. A guide to NTEP turfgrass ratings. https://www.ntep.org/ntep/reports/ratings.htm#quality. (accessed 12 June 2024) (accessed 31 October 2024).
- Morris, K.N., and R.C. Shearman. 2000. The National Turfgrass Evaluation Program: assessing new and improved turfgrasses. Diversity 16(1/2): 19–22.
- Qian, Y., and J.D. Fry. 1997. Water relations and drought tolerance of four turfgrasses. J. Am. Soc. Hortic. Sci. [CrossRef]
- Raun, W.R., J.B. Solie, G. V Johnson, M.L. Stone, E. V Lukina, et al. 2001. In-season prediction of potential grain yield in winter wheat using canopy reflectance. Agron. J. 93(1): 131–138. [CrossRef]
- Riaz, A., A. Younis, M. Hameed, and S. Kiran. 2010. Morphological and biochemical responses of turf grasses to water deficit conditions. Pakistan J. Bot. 42.
- Rorie, R.L., L.C. Purcell, D.E. Karcher, and C.A. King. 2011. The Assessment of Leaf Nitrogen in Corn from Digital Images. Crop Sci. 51(5): 2174–2180. [CrossRef]
- Serba, D.D., R.W. Hejl, W. Burayu, K. Umeda, B.S. Bushman, et al. 2022. Pertinent water-saving management strategies for sustainable turfgrass in the desert U.S. southwest. Sustainability 14(19): 12722. [CrossRef]
- Serba, D.D., Y. Wu, R.W. Hejl, C.F. Williams, and K.F. Bronson. 2023. Spectral reflectance estimated genetic variation in hybrid turf bermudagrass. Grass Res. 3(1). [CrossRef]
- Shao, H.-B., L.-Y. Chu, C.A. Jaleel, and C.-X. Zhao. 2008. Water-deficit stress-induced anatomical changes in higher plants. C. R. Biol. 331(3): 215–225. [CrossRef]
- Shi, H., Y. Wang, Z. Cheng, T. Ye, and Z. Chan. 2012. Analysis of natural variation in bermudagrass (Cynodon dactylon) reveals physiological responses underlying drought tolerance. PLoS One 7(12): 1–12. [CrossRef]
- Solano-Alvarez, N., J.A. Valencia-Hernández, S. Vergara-Pineda, J.R. Millán-Almaraz, I. Torres-Pacheco, et al. 2022. Comparative analysis of the NDVI and NGBVI as indicators of the protective effect of beneficial bacteria in conditions of biotic stress. Plants 11(7). [CrossRef]
- De Swaef, T., W.H. Maes, J. Aper, J. Baert, M. Cougnon, et al. 2021. Applying RGB- and thermal-based vegetation indices from UAVs for high-throughput field phenotyping of drought tolerance in forage grasses. Remote Sens. 13(1). [CrossRef]
- Thapa, S., J. Rudd, Q. Xue, M. Bhandari, S. Krishna Reddy, et al. 2019. Use of NDVI for characterizing winter wheat response to water stress in a semi-arid environment. J. Crop Improv. 33: 1–16. [CrossRef]
- Yu, S., D.L. Martin, J.Q. Moss, and Y. Wu. 2023. Advanced turf-type bermudagrass experimental genotypes show marked variation in drought response. HortScience 58(6): 600–607. [CrossRef]
- Zhou, Y., C.J. Lambrides, and S. Fukai. 2013. Drought resistance of C4 grasses under field conditions: Genetic variation among a large number of bermudagrass (Cynodon spp.) ecotypes collected from different climatic zones. J. Agron. Crop Sci. 199(4): 253–263. [CrossRef]
Figure 1.
Effects of induced drought on (a) visual turf assessment scores and (b) optical indices on bermudagrass hybrids in drought stress with irrigation withholding for four weeks in a controlled environment and recovery after rewatering.
Figure 1.
Effects of induced drought on (a) visual turf assessment scores and (b) optical indices on bermudagrass hybrids in drought stress with irrigation withholding for four weeks in a controlled environment and recovery after rewatering.
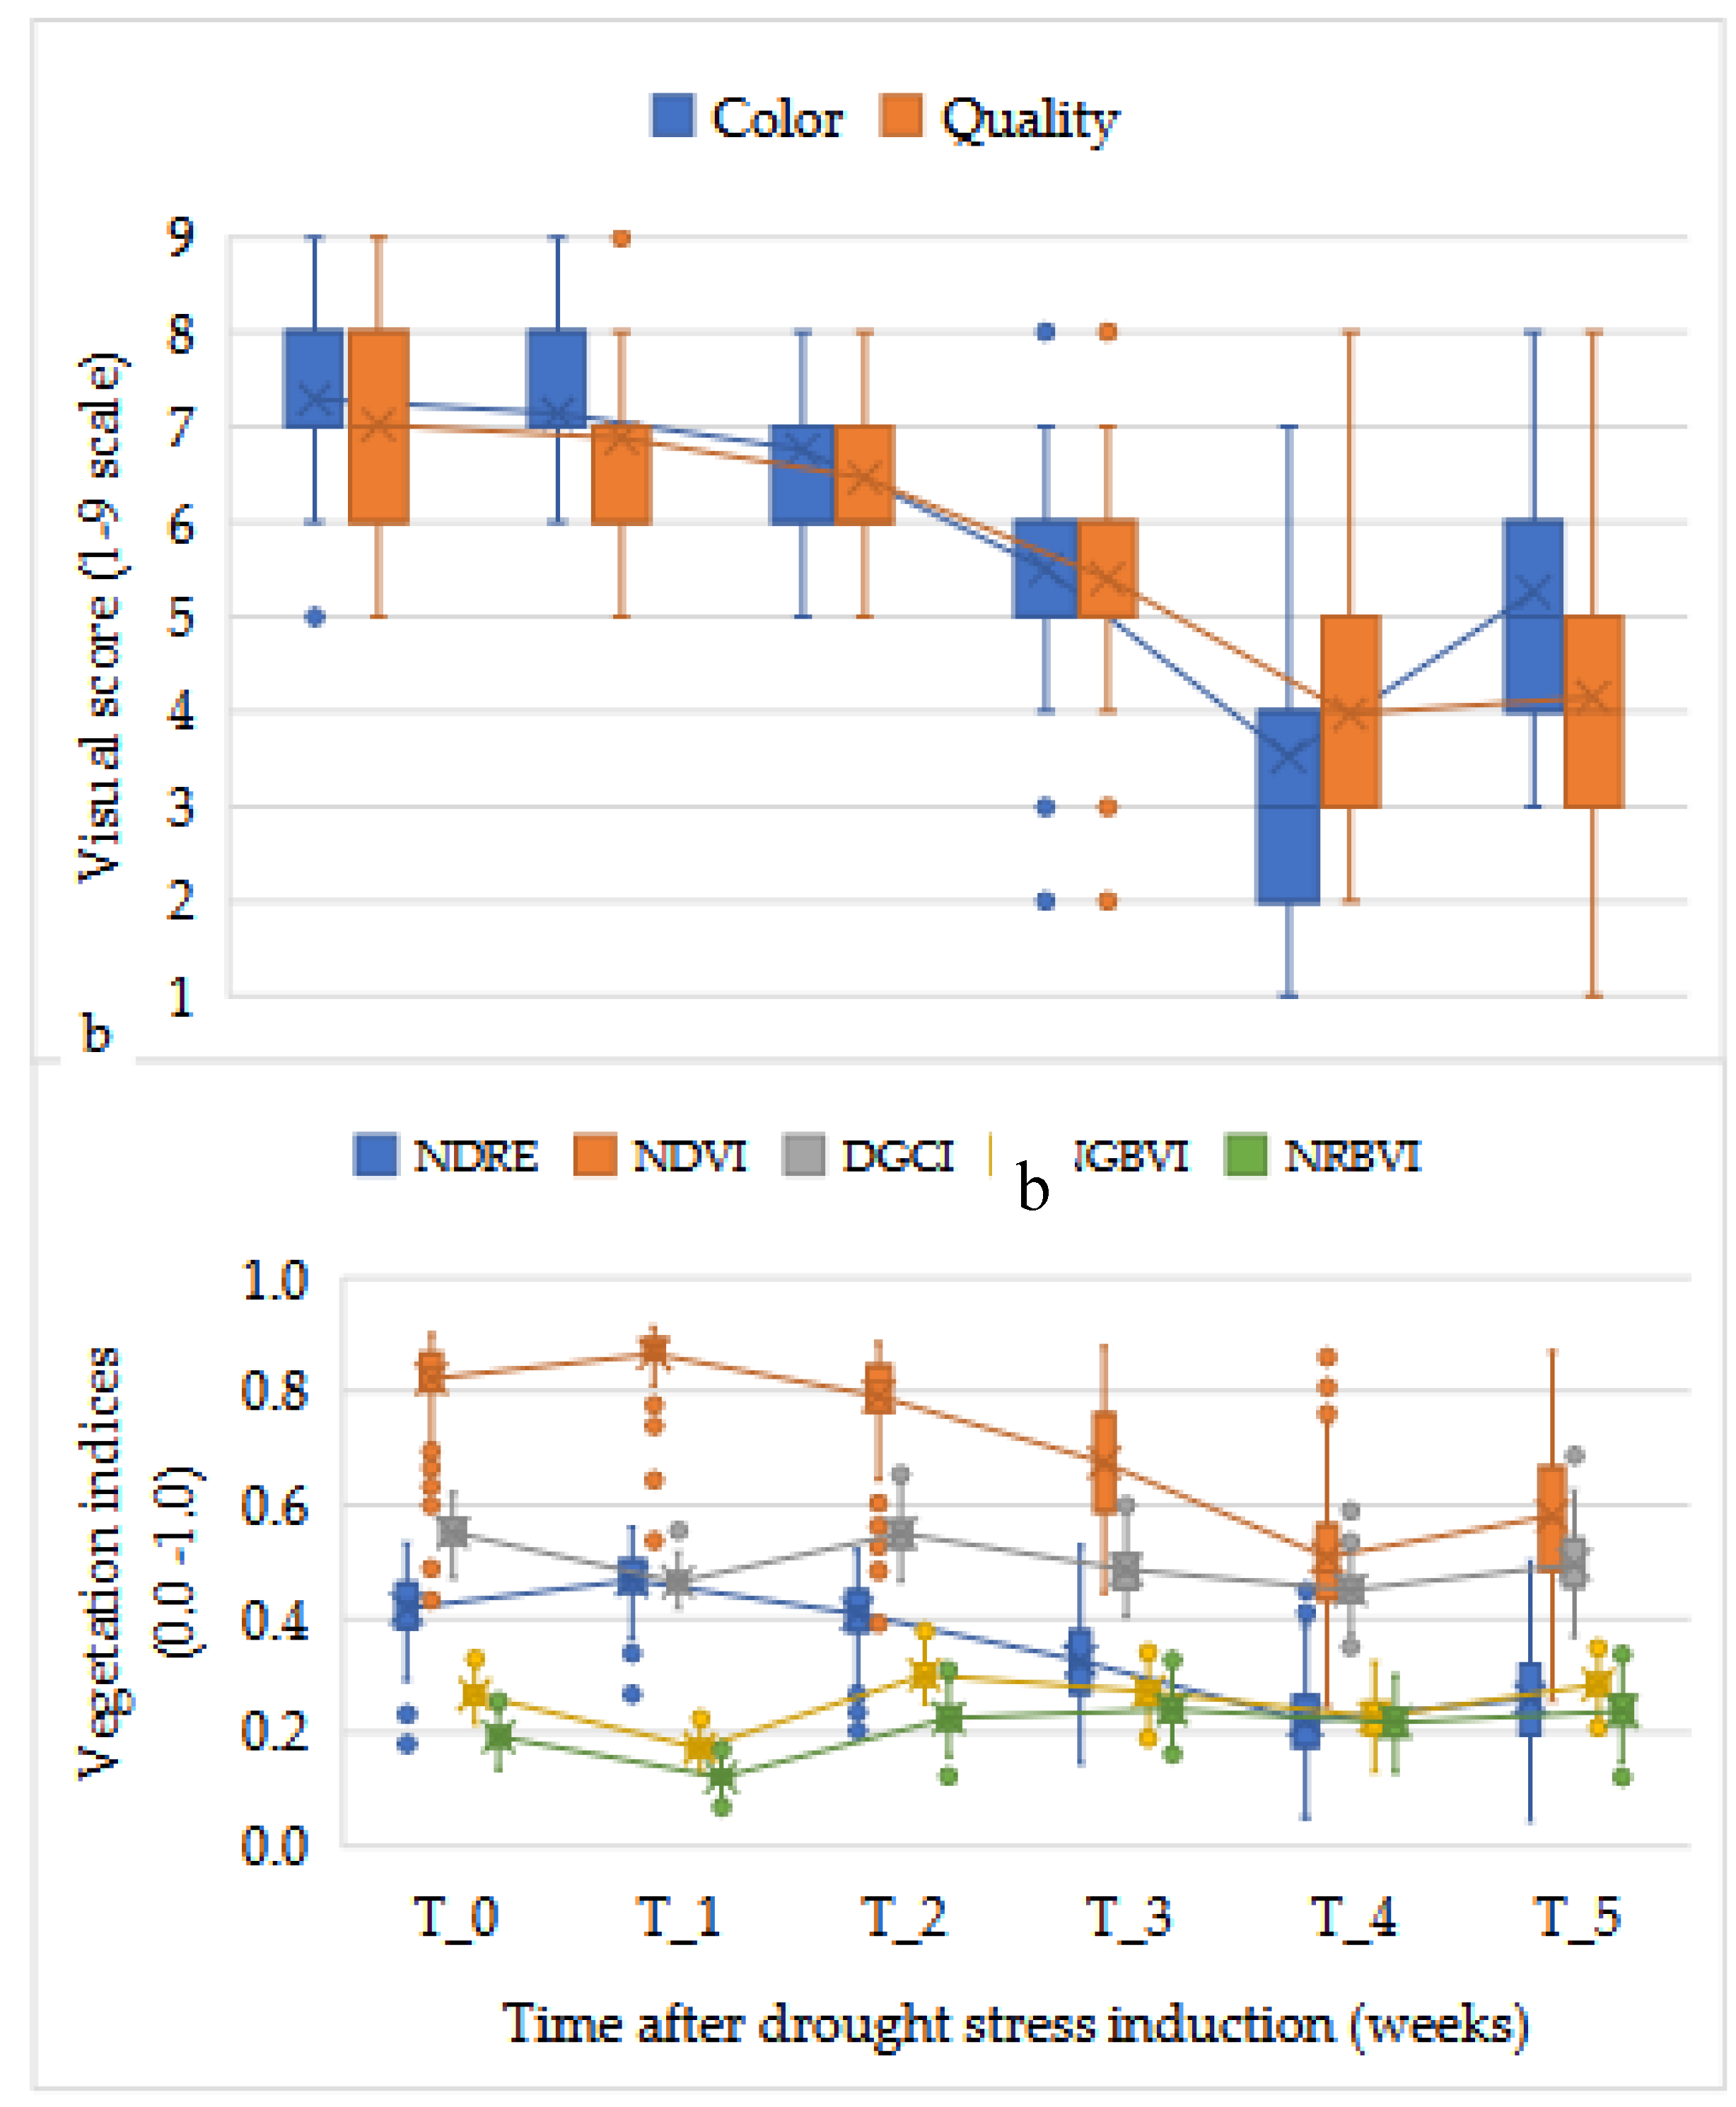
Figure 2.
Average color and quality scores of bermudagrass hybrids (a) four weeks post drought stress initiation and (b) one week after rewatering in a controlled environment.
Figure 2.
Average color and quality scores of bermudagrass hybrids (a) four weeks post drought stress initiation and (b) one week after rewatering in a controlled environment.

Figure 4.
Dendrogram of hierarchical agglomerative clustering using visual assessment and spectral vegetation indices data of 48 bermudagrass hybrids (a) before withholding irrigation (T_0), (b) four week (T_4) after induced drought, and (c) at recovery, one week after rewatering (T_5).
Figure 4.
Dendrogram of hierarchical agglomerative clustering using visual assessment and spectral vegetation indices data of 48 bermudagrass hybrids (a) before withholding irrigation (T_0), (b) four week (T_4) after induced drought, and (c) at recovery, one week after rewatering (T_5).
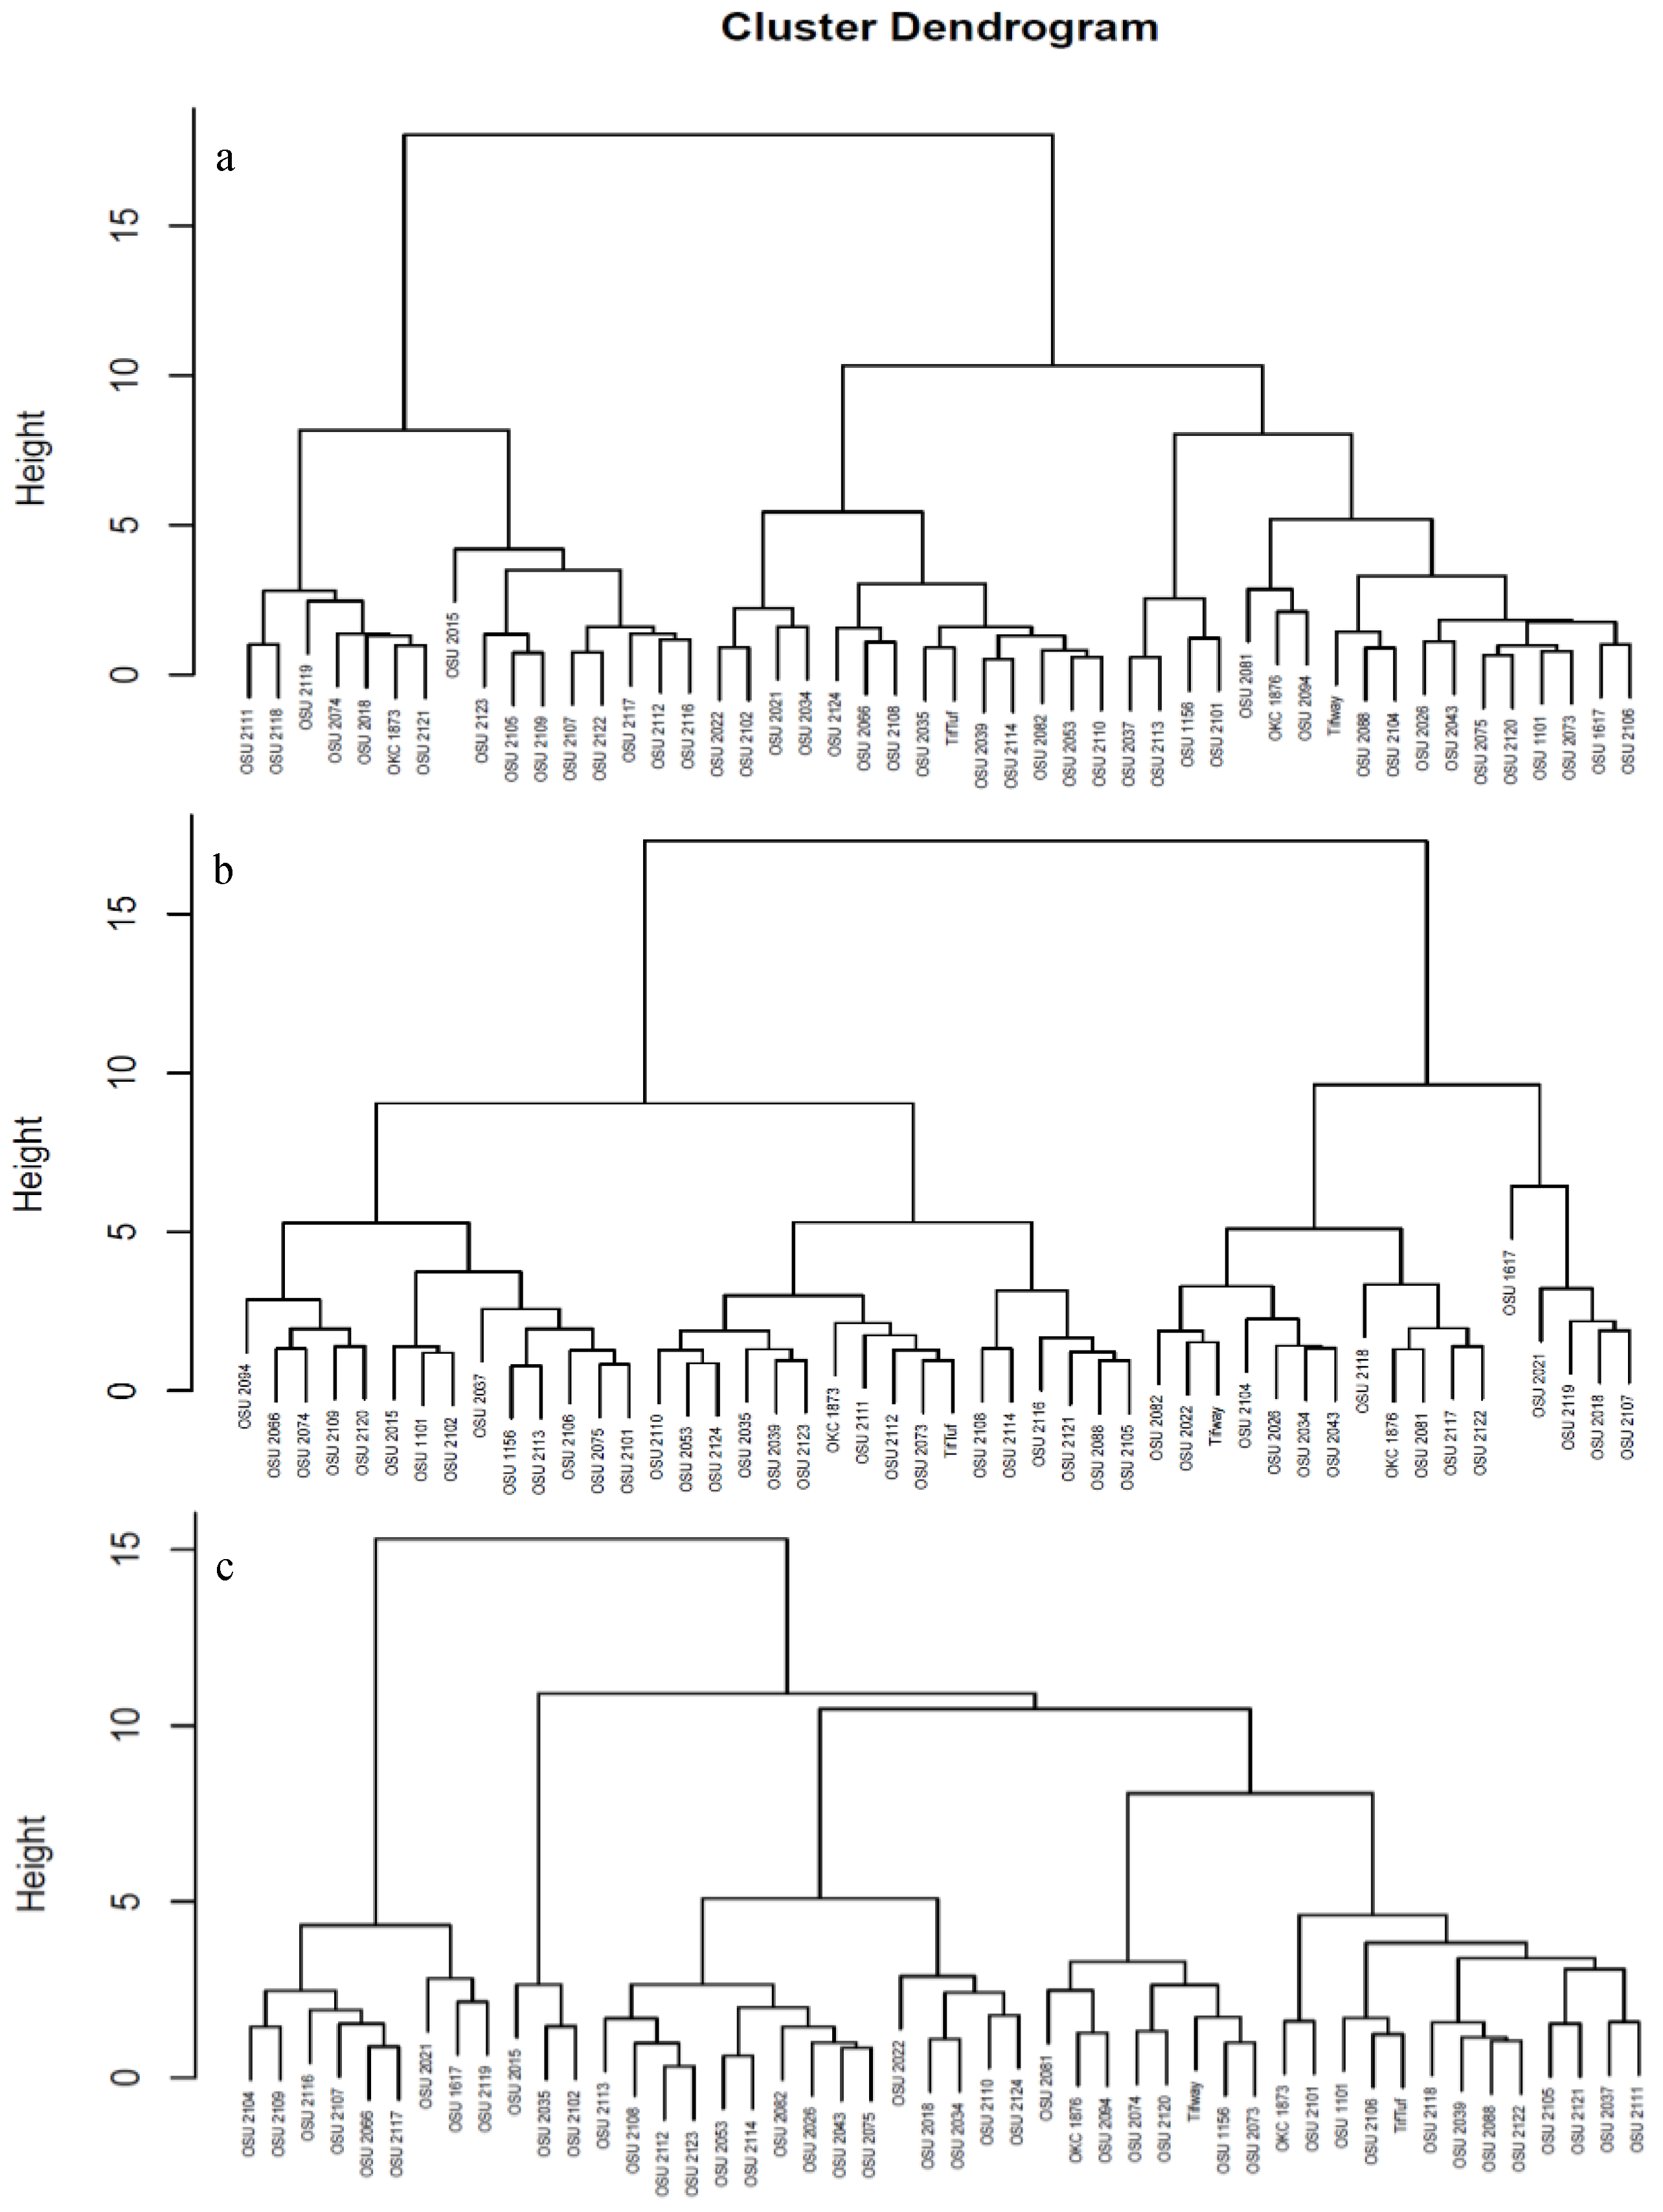
Figure 5.
Principal component analysis, (a) relative contribution of the visual and spectral scores, (b) scree plots used to determine the optimum number of principal components that retained significant proportion of the variance, and (c) the first principal component and its contributors at T_0, T_4, and T_5.
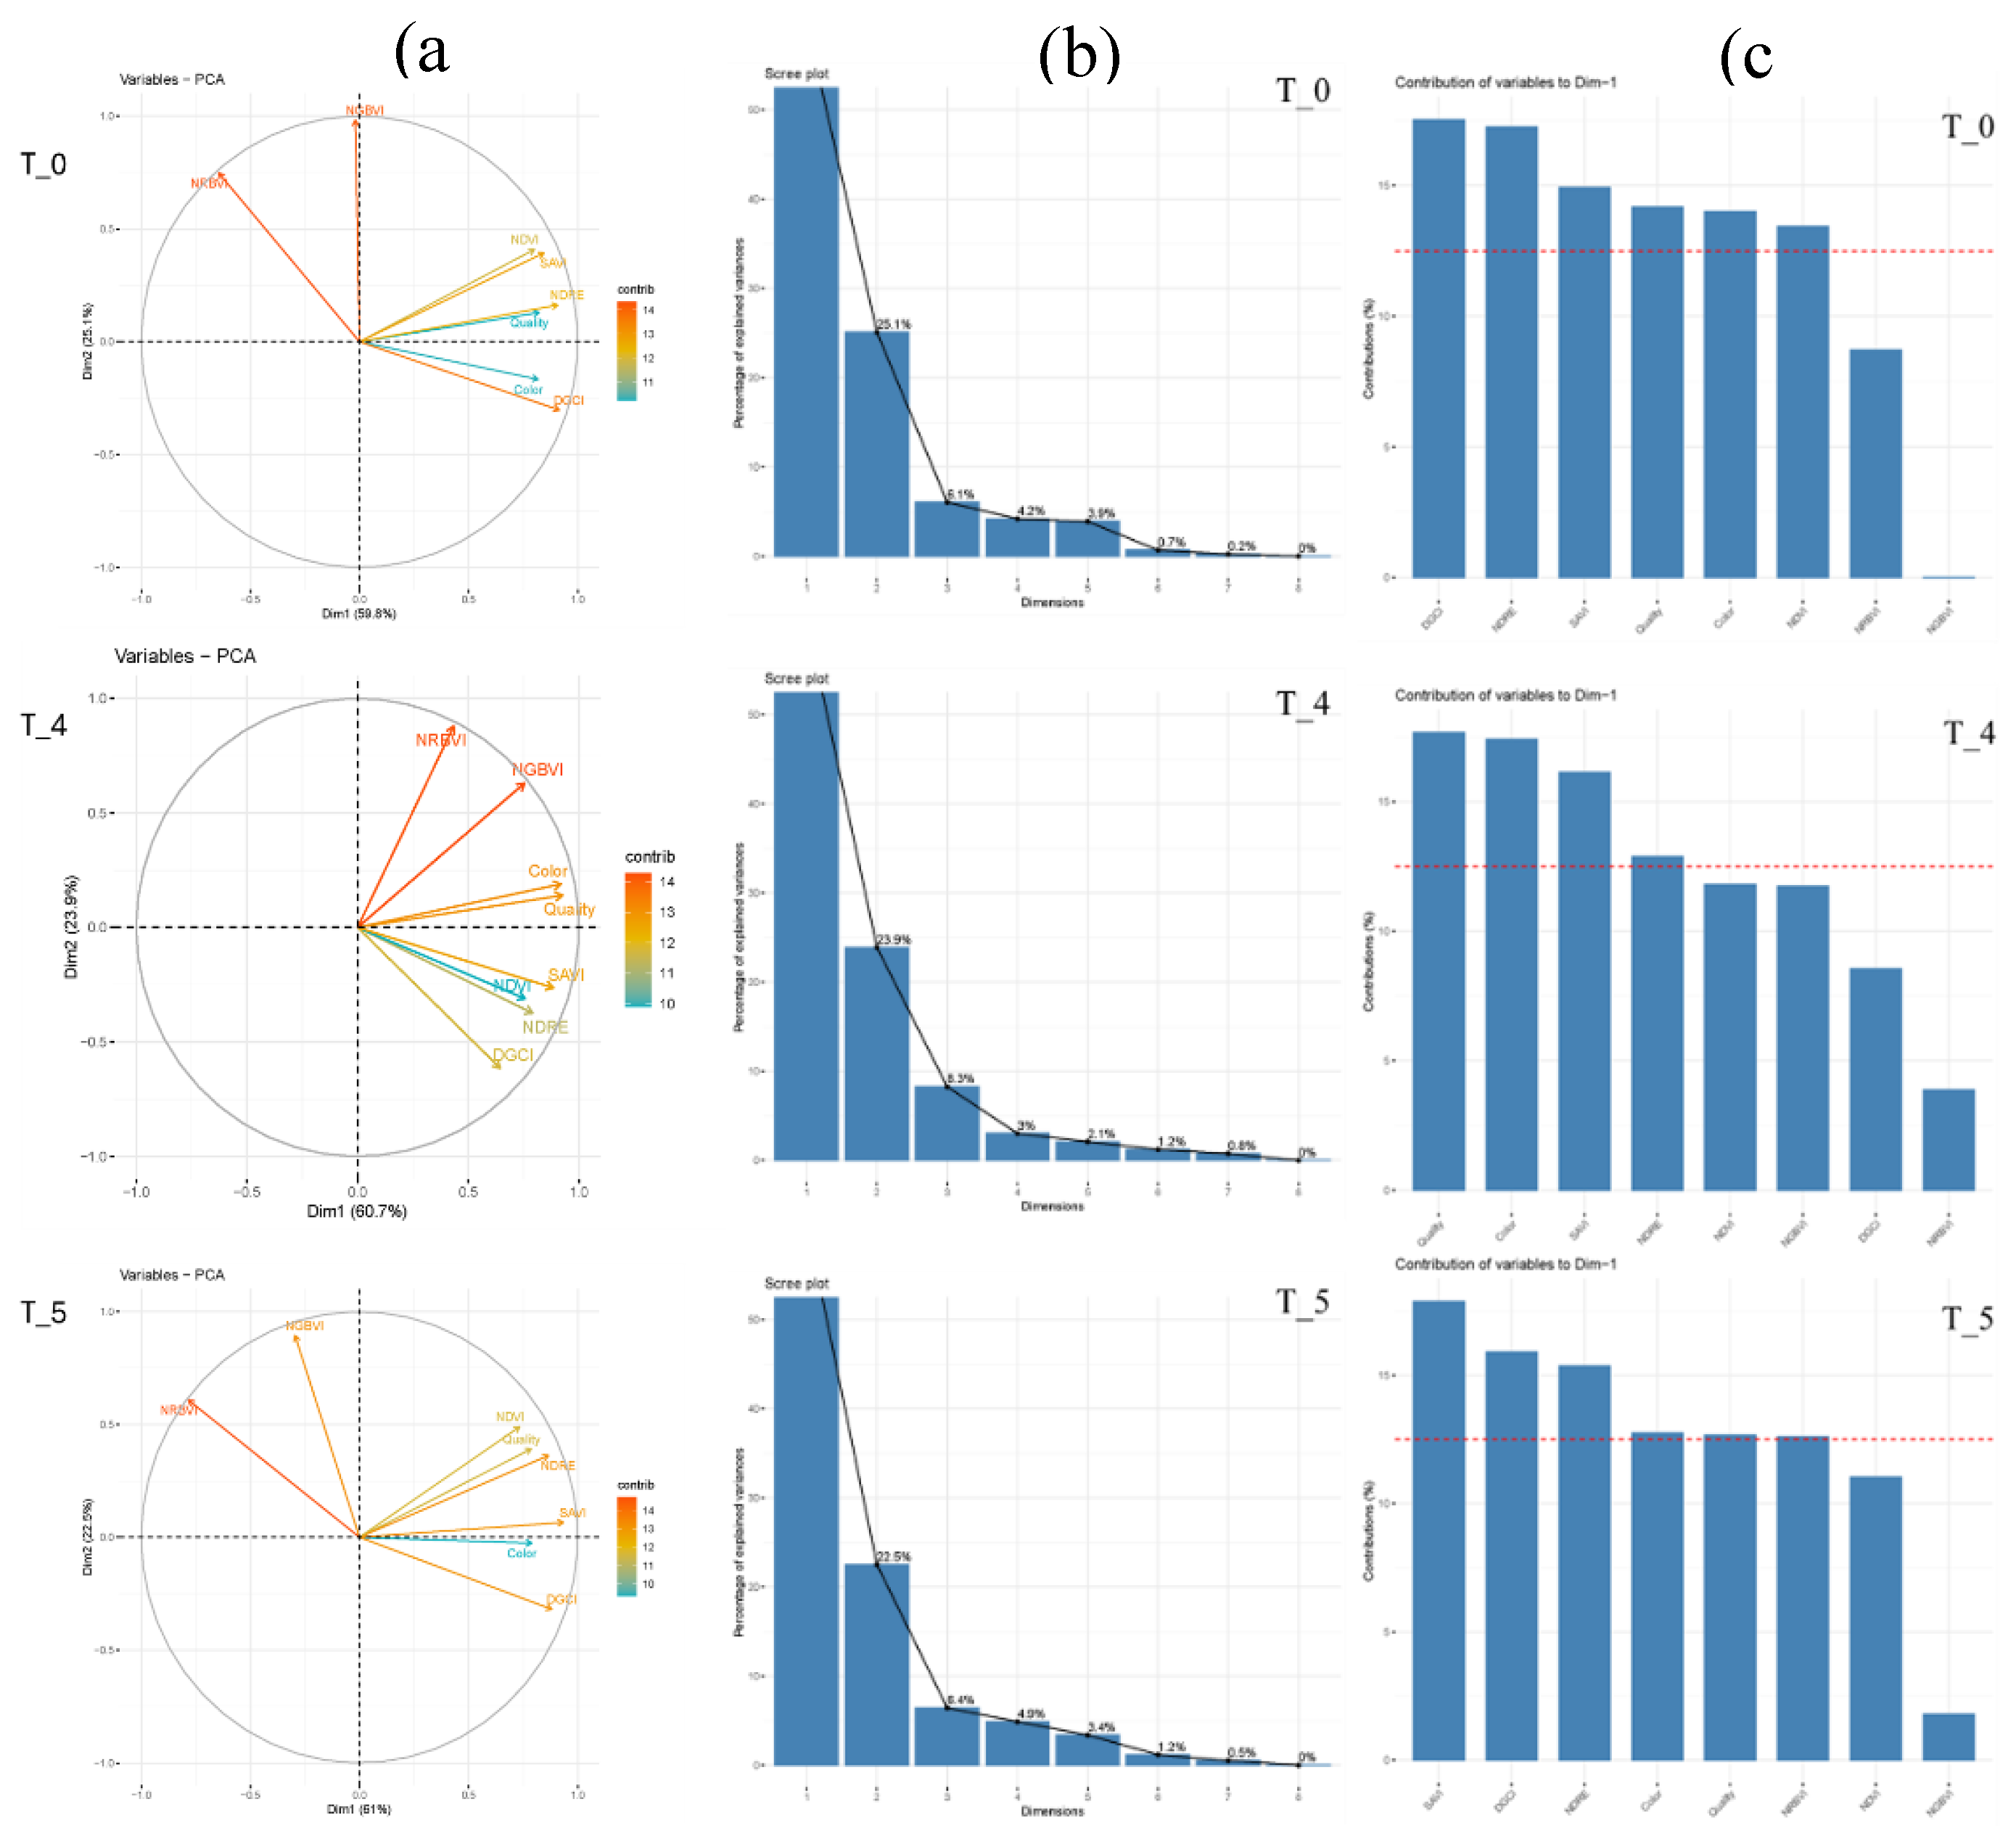
Figure 6.
Average weekly soil moisture content (A) for overall experiment and (B) for 192 individual pots of bermudagrass hybrids in a controlled setting during the dry down and recovery experiment.
Figure 6.
Average weekly soil moisture content (A) for overall experiment and (B) for 192 individual pots of bermudagrass hybrids in a controlled setting during the dry down and recovery experiment.
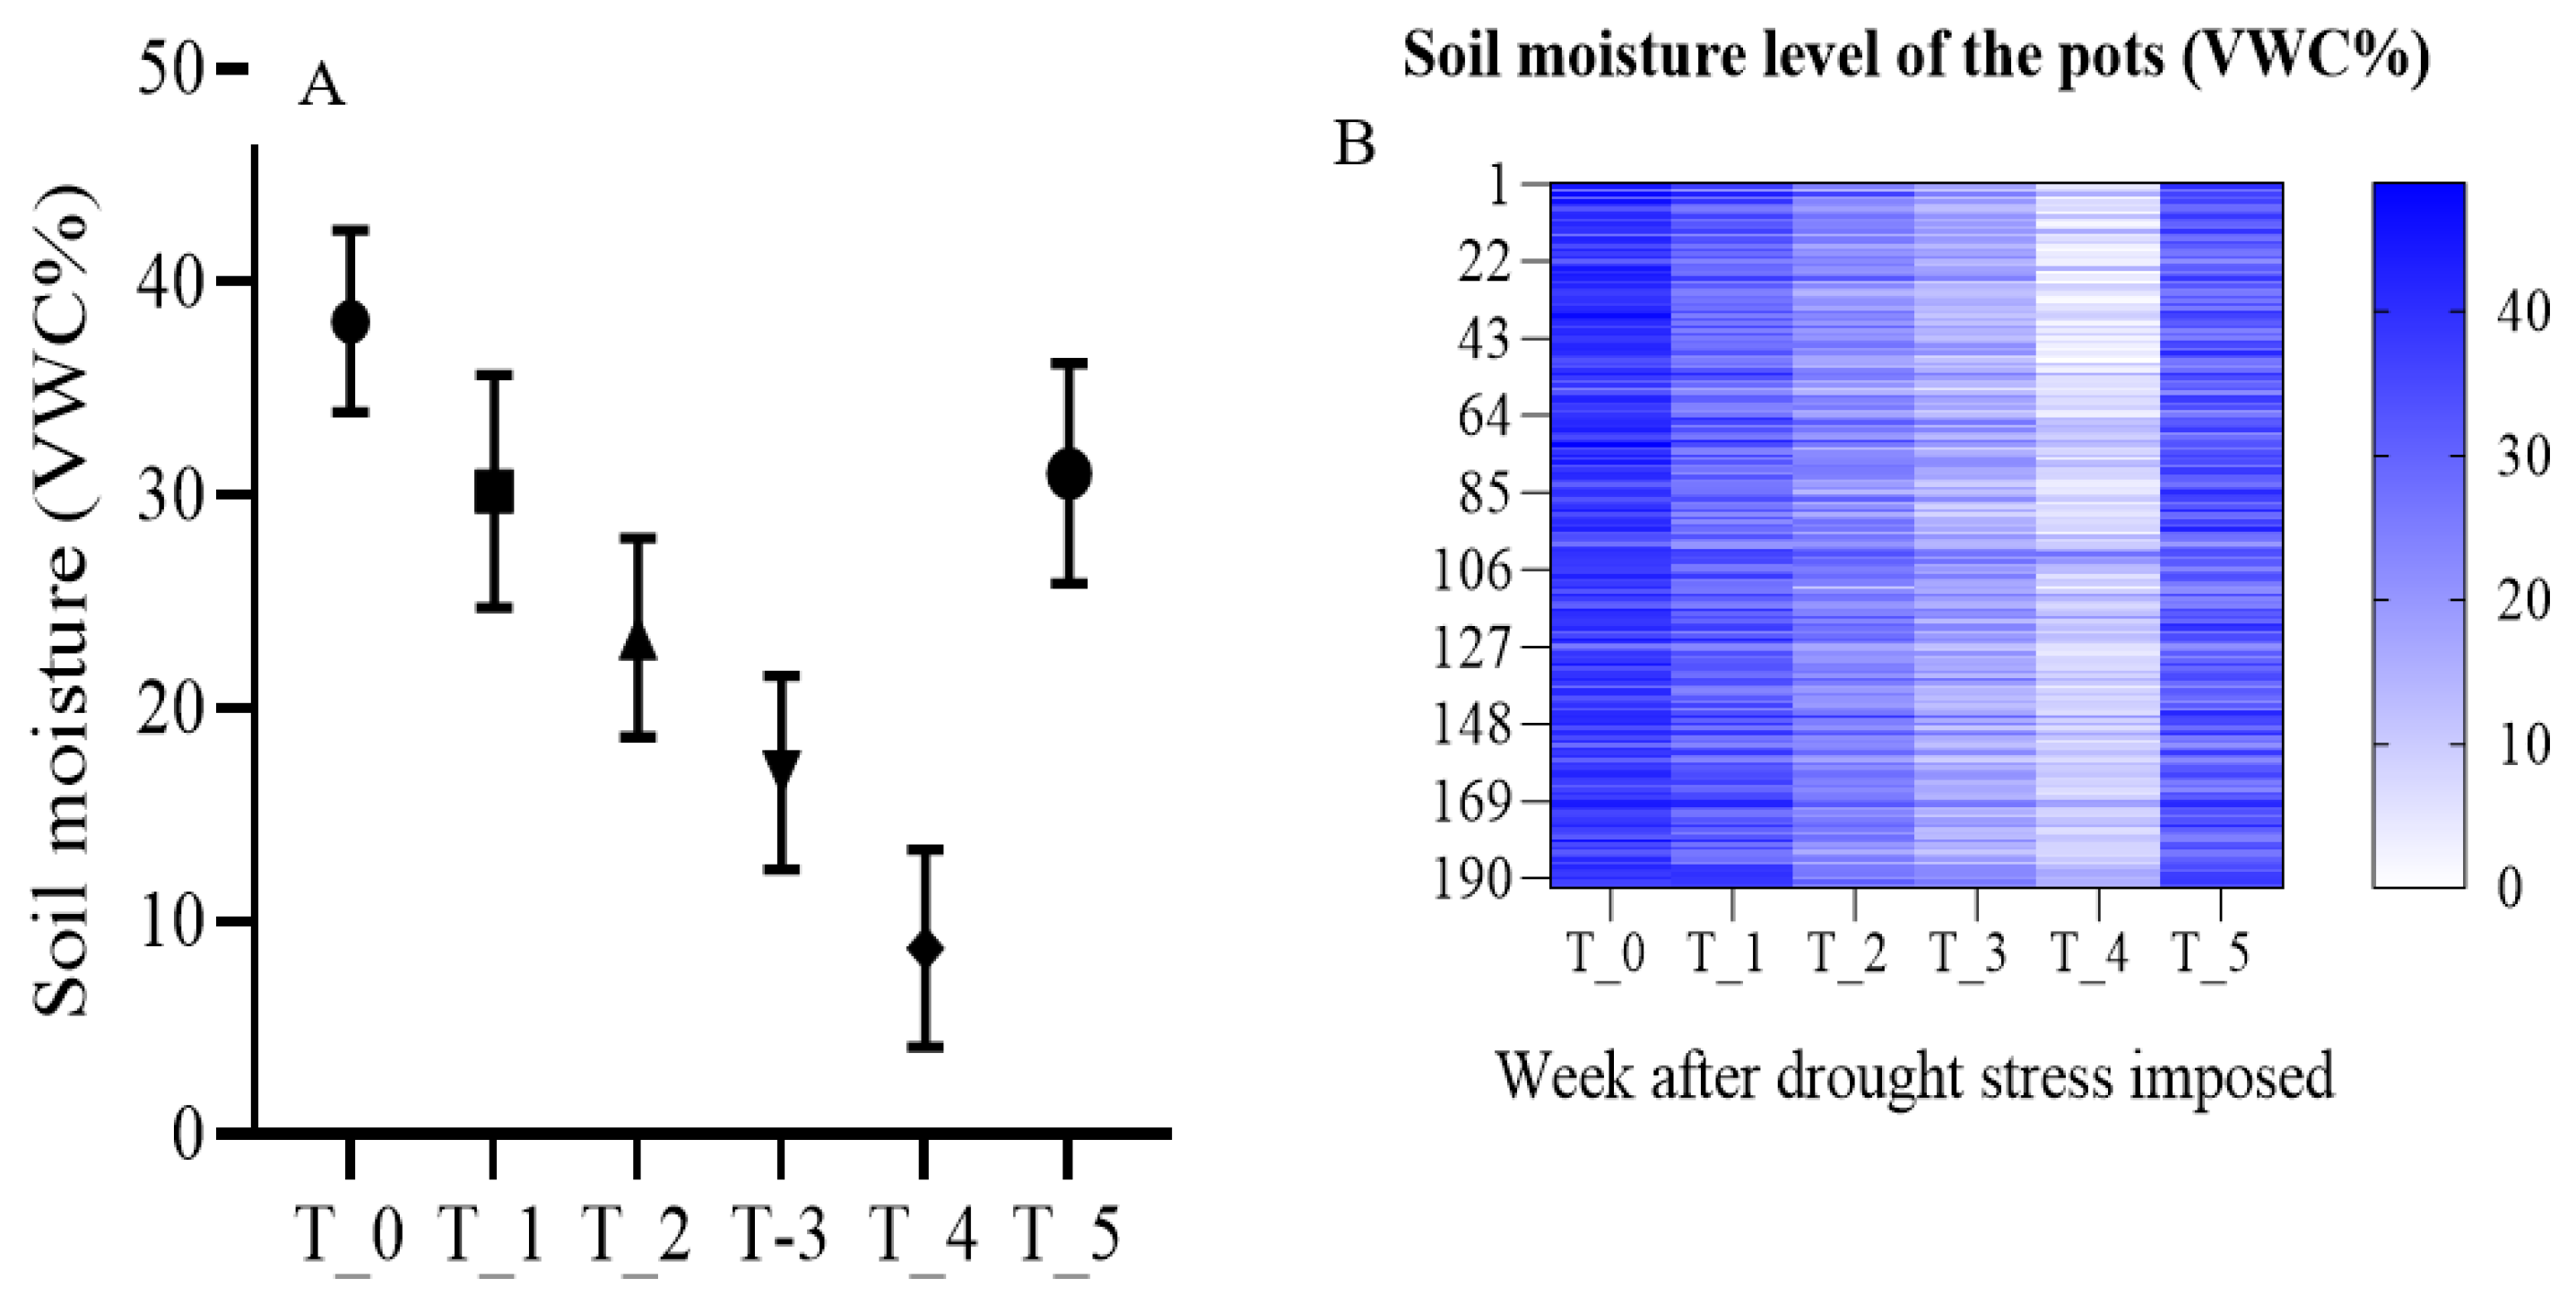

Table 1.
Combined analysis of variance for visual ratings and spectral vegetation indices of 48 hybrid bermudagrass studied for drought tolerance in a controlled environment at Maricopa, AZ during 2023.
Table 1.
Combined analysis of variance for visual ratings and spectral vegetation indices of 48 hybrid bermudagrass studied for drought tolerance in a controlled environment at Maricopa, AZ during 2023.
| Source | DF | Mean Square | ||||||
|---|---|---|---|---|---|---|---|---|
| Color | Quality | NDRE | NDVI | DGCI | NGBVI | NRBVI | ||
| Replication | 3 | 7.8*** | 9.0*** | 0.059*** | 0.106*** | 0.014*** | 0.008*** | 0.005*** |
| Genotype | 47 | 3.9*** | 4.7*** | 0.020*** | 0.039*** | 0.008*** | 0.005*** | 0.006*** |
| Time | 5 | 400.4*** | 352.8*** | 1.817*** | 3.912*** | 0.348*** | 0.431*** | 0.387*** |
| Genotype*Time | 235 | 1.5*** | 1.2*** | 0.005* | 0.009* | 0.002** | 0.001*** | 0.001*** |
| R2 | 0.80 | 0.78 | 0.78 | 0.80 | 0.73 | 0.87 | 0.84 | |
| CV | 14.6 | 15.2 | 17.3 | 11.7 | 6.6 | 8.5 | 11.3 | |
| Mean | 5.9 | 5.6 | 0.35 | 0.71 | 0.50 | 0.25 | 0.21 | |
NDVI = Normalized Difference Vegetation Index, NRDE = Normalized Difference Red Edge Index, DGCI = Dark Green Color Index, NGBVI = Normalized Green-Blue Vegetation Index, and NRBVI = Normalized Red Blue Vegetation Index; *, **, *** Significant at 0.05, 0.01, 0.001 probability levels.
Disclaimer/Publisher’s Note: The statements, opinions and data contained in all publications are solely those of the individual author(s) and contributor(s) and not of MDPI and/or the editor(s). MDPI and/or the editor(s) disclaim responsibility for any injury to people or property resulting from any ideas, methods, instructions or products referred to in the content. |
© 2025 by the authors. Licensee MDPI, Basel, Switzerland. This article is an open access article distributed under the terms and conditions of the Creative Commons Attribution (CC BY) license (http://creativecommons.org/licenses/by/4.0/).
Copyright: This open access article is published under a Creative Commons CC BY 4.0 license, which permit the free download, distribution, and reuse, provided that the author and preprint are cited in any reuse.


