
Submitted:
10 March 2025
Posted:
11 March 2025
You are already at the latest version
Abstract
Accurate segmentation of the nasal cavity and paranasal sinuses in CT scans is crucial for disease assessment, treatment planning, and surgical navigation. It also facilitates the advanced computational modeling of airflow dynamics and enhances endoscopic surgery preparation. This work presents a novel ensemble framework for 3D nasal CT segmentation that synergistically combines CNN-based and transformer-based architectures, 3D-NASE. By integrating 3D U-Net, UNETR, and Swin UNETR with majority and soft voting strategies, our approach leverages both local details and global context to improve segmentation accuracy and robustness. Results on the NasalSeg dataset demonstrate that the proposed ensemble method surpasses previous state-of-the-art results by achieving a 35.95% improvement in the DICE score and reducing the standard deviation by 4.57%. These promising results highlight the potential of our method to advance clinical workflows in diagnosis, treatment planning, and surgical navigation while also promoting further research into computationally efficient and highly accurate segmentation techniques.
Keywords:
3D CT Segmentation
; Nasal CT
; 3D U-Net
; UNETR
; Swin UNETR
; Ensemble Methods
1. Introduction
An accurate understanding of nasal cavity and paranasal sinus morphology is vital for clinical applications, disease detection, treatment planning, endonasal surgery simulations, or surgical navigation. For instance, the precise delineation of regions such as the nasal cavity and paranasal sinuses in computed tomography (CT) scans is vital for assessing sinus-related diseases [1], planning endoscopic surgeries [2], and enabling advanced computational models of airflow dynamics [3,4].
Segmentation data is key in diagnosis, surgical preparation, and robotic system navigation. Volume and surface area quantification help assess nasal health and the impact of inhaled substances [5]. Also, detailed anatomical knowledge supports endoscopic sinus surgery, guiding structural reconstruction, and outcome evaluation. Although manual segmentation has long been considered the gold standard in clinical practice, it is inherently labor-intensive and prone to both inter- and intra-observer variability. These limitations have fueled the search for robust, automated segmentation approaches that can deliver consistent and reproducible results. In this context, a precise, automated segmentation of anatomical structures in 3D medical imaging becomes critical for effective diagnosis, treatment planning, and surgical navigation [5,6].
Furthermore, the recent surge in radiomics research has underscored the importance of high-quality segmentation as a foundation for extracting reliable quantitative imaging features [7]. Radiomics seeks to convert medical images into high-dimensional data by extracting features that capture subtle tissue heterogeneity and underlying pathophysiological processes. The spectrum of features ranges from classical handcrafted descriptors, such as shape, first-order intensity statistics, and texture measures, to sophisticated representations learned by deep neural networks, including convolutional neural networks (CNNs), recurrent neural networks (RNNs), and transformer-based architectures. Such diversity in feature representation plays a crucial role in enhancing diagnostic accuracy, prognostication, and the prediction of treatment responses.
Moreover, the introduction of novel datasets, such as the NasalSeg [8] dataset, has begun to address the scarcity of large-scale, annotated imaging data necessary for training and benchmarking advanced segmentation models. This work proposes an ensemble-based segmentation framework that synergistically combines multiple 3D architectures, 3D-NASE. Our approach integrates CNN-based models with transformer-based networks that exploit self-attention mechanisms. By fusing these complementary architectures, our method aims to enhance segmentation robustness and improve generalization across anatomical variations and heterogeneous imaging conditions. Ultimately, this framework not only refines segmentation accuracy but also provides a reliable basis for subsequent radiomic analysis.
The remainder of the paper is organized as follows. In Section 2, we review the state-of-the-art radiomic segmentation by discussing both 2D and 3D approaches and the emerging trends and challenges in the field. Section 3 details the materials and methods used in our study, including the architectures of U-Net, 3D U-Net, UNETR, and Swin UNETR, along with the description of the NasalSeg dataset and the evaluation metrics. In Section 4, we introduce 3D-NASE and outline the experimental setup. Section 5 presents the quantitative experimental results, while Section 6 offers a qualitative analysis of the segmentation outputs. We discuss the limitations of our approach in Section 7 and conclude the paper with final remarks and directions for future work in Section 8.
2. Related Work
Over the past decade, significant progress has been made in radiomic segmentation through contributions from traditional image processing, machine learning, and deep learning methodologies. This section provides a comprehensive review of the state-of-the-art segmentation techniques in radiomics. The discussion is organized into four subsections, with a focus on the 2D (Section 2.1) and 3D (Section 2.2) segmentation approaches, along with a discussion of their distinctions and complementarities (Section 2.3), and future developments (Section 2.4).
2.1. 2D Radiomic Segmentation
2D segmentation techniques have been extensively explored due to their simplicity and relatively low computational burden. Early methods predominantly relied on classical image processing techniques such as thresholding, region growing, edge detection, and active contour models [9,10]. These methods proved effective when target structures exhibited high contrast and well-defined boundaries.
More recently, the emergence of deep learning models has shifted the common approaches toward more automatic and fast architectures capable of segmenting clinically relevant regions in different imaging techniques [11,12].
However, despite their computational efficiency and ease of implementation, 2D segmentation methods inherently lack the ability to fully exploit the volumetric context present in modern imaging modalities [13]. This shortcoming limits their utility in applications where three-dimensional structural continuity [14] is critical, such as in tumor delineation or the assessment of complex anatomical regions.
2.2. 3D Radiomic Segmentation
High-resolution volumetric imaging has spurred a paradigm shift toward 3D segmentation methods. Unlike 2D approaches, 3D segmentation takes advantage of the complete spatial context, resulting in a more comprehensive and accurate delineation of anatomical structures [13,15]. Volumetric methods are particularly indispensable in modalities like CT and magnetic resonance (MR) imaging, where the intricate spatial relationships between tissues must be preserved.
Deep learning has become the cornerstone of modern 3D segmentation [16,17]. The 3D U-Net architecture [18], for example, has emerged as a benchmark due to its encoder-decoder structure, which facilitates the capture of both local and global context across multiple scales. In addition to CNN-based models, transformer-based architectures have recently been introduced to model long-range dependencies across the volume [19]. With their self-attention mechanisms, these models are adept at identifying subtle variations and heterogeneities within the data, which are often missed by conventional convolutional filters [20].
Hybrid approaches have also been proposed, combining the rapid processing of 2D methods with the spatial accuracy of 3D segmentation [21,22]. Typically, these frameworks commence with a 2D segmentation step to quickly identify candidate regions, followed by a refined 3D segmentation to ensure volumetric consistency. This two-tiered strategy effectively balances the trade-offs between computational efficiency and segmentation accuracy [23], making it highly attractive for real-time clinical applications [24].
2.3. Comparative Analysis and Challenges
A comparative analysis between 2D and 3D segmentation techniques reveals a range of trade-offs. While 2D methods offer simplicity and speed [25,26], they are limited by their inability to capture inter-slice contextual information. On the other hand, 3D approaches, despite their higher computational demands, provide a more faithful representation of anatomical structures [27,28]. One of the primary challenges with 3D segmentation is the substantial computational overhead associated with processing volumetric data. High-resolution images require large amounts of memory and extended training times, often necessitating specialized hardware or cloud-based resources.
Another significant challenge is the variability in imaging protocols and acquisition parameters across different clinical centers. This variability can lead to discrepancies in image quality and intensity distributions, thereby affecting the generalizability of segmentation models [29]. To address these issues, recent research has focused on developing standardized preprocessing pipelines and data harmonization techniques essential for mitigating inter-scanner and inter-center variations.
Furthermore, the integration of segmentation outputs into radiomic pipelines poses additional challenges. High-quality segmentation is a prerequisite for reliable feature extraction, as errors in delineation can propagate and degrade the performance of downstream predictive models [30]. As such, the development of explainable and robust segmentation methods is a critical area of ongoing research.
2.4. Emerging Trends and Future Directions
The field of radiomic segmentation is rapidly evolving, driven by innovations that bridge the gap between traditional methods and modern deep learning techniques. One emerging trend is the integration of self-supervised learning and foundation models [31,32], which aim to leverage large-scale unannotated data to improve model robustness and reduce the reliance on extensively labeled datasets. These approaches are particularly promising for addressing the limitations posed by data scarcity in medical imaging [33,34].
Another exciting direction is the development of multi-modal segmentation frameworks. By fusing complementary information from different imaging modalities such as CT, MR, and positron emission tomography (PET), researchers are beginning to overcome the limitations inherent in single-modality analysis. Multi-modal fusion techniques can enhance the accuracy and reliability of segmentation, particularly in complex clinical scenarios where different modalities provide unique and complementary insights [35,36].
3. Materials and Methods
In this section, we present the materials and methods employed in our study, focusing on the architectures used for medical image segmentation (Section 3.1, Section 3.2, Section 3.3 and Section 3.4). We detail these networks’ theoretical foundations and practical adaptations to handle volumetric data, which is essential for accurately delineating complex anatomical structures. In addition, we provide a dataset description in Section 3.5 and the metrics definition in Section 3.6.
3.1. U-Net
U-Net [37] is a popular biomedical image segmentation architecture with an encoder-decoder structure. In the encoding stage, the network progressively reduces the spatial dimensions of the input through a series of convolutional layers followed by a downsampling operation. For instance, if denotes the feature map at layer l, a typical downsampling can be expressed as
where D might represent a max pooling operation (e.g., with a stride of 2) or a convolution with a stride greater than one. This reduction not only decreases computational complexity but also helps in capturing contextual information over larger regions. In the decoding stage, the spatial resolution is gradually recovered using an upsampling operation. Mathematically, if is the feature map at a deeper layer in the decoder, then upsampling can be described as
where U may be implemented via transposed convolutions or interpolation followed by convolution. The network further refines the segmentation by incorporating skip connections that merge the high-resolution features from the encoder with the upsampled features in the decoder, thereby preserving fine structural details.
3.2. 3D U-Net
3D U-Net [18] extends the principles of U-Net to volumetric data by replacing two-dimensional operations with their three-dimensional counterparts. In this architecture, the downsampling operator is adapted to process volumetric feature maps. If is the 3D feature map at layer l, the volumetric downsampling is represented as
where aggregates information along the depth, height, and width dimensions simultaneously. Similarly, the upsampling operator in the decoder is defined as
which reconstructs the spatial dimensions of the volume, again using transposed convolutions or interpolation methods adapted to three dimensions. The integration of skip connections in 3D U-Net allows the network to effectively combine coarse, context-rich features with finer details, thereby enabling accurate segmentation of complex anatomical structures in modalities such as CT and MRI.
3.3. UNETR
UNETR [19] integrates a transformer-based [38] encoder into the U-Net framework to capture long-range dependencies in volumetric data. The input volume x is first divided into non-overlapping patches, each of which is embedded into a token via a linear projection, i.e.,
where is the ith patch and denotes the embedding function. The transformer encoder then processes the sequence of tokens using self-attention, which is computed as
with Q, K, and V being the query, key, and value matrices, respectively, and the key dimension. The resulting encoded representation is reshaped and fed into a U-Net style decoder that recovers spatial resolution through an upsampling operation
while incorporating skip connections to merge high-resolution features from the encoder. This design enables UNETR to effectively combine global context with local details.
3.4. Swin UNETR
Swin UNETR [20] extends the UNETR framework by employing the Swin Transformer [39] architecture, which utilizes a hierarchical structure with window-based self-attention. In this model, the input volume is partitioned into patches, and self-attention is computed locally within non-overlapping windows. The attention mechanism is the same as defined in [19] applied independently over each window. A subsequent shift in the window partitioning enables the capture of cross-window dependencies, ensuring that global context is effectively modeled. Following the transformer encoding, a decoder analogous to that of UNETR performs upsampling. This approach synergizes local attention with global context, thereby improving the segmentation of complex volumetric data [20].
3.5. Dataset
The NasalSeg dataset [8] is a large-scale, open-access resource developed for the automatic segmentation of the nasal cavity and paranasal sinuses from 3D CT images. It comprises 130 head CT scans collected from independent patients, including 74 males and 56 females, with an age range of 24 to 82 years (mean years). All scans were acquired using a Biograph 64 scanner (Siemens, Erlangen, Germany) at the Department of Nuclear Medicine/PET Center, Huashan Hospital, and typically exhibit a volume of pixels, with an in-plane resolution of mm and a slice spacing of 1.5 mm.
Each scan is accompanied by meticulous, pixel-wise annotations of five anatomical structures: the left nasal cavity, right nasal cavity, nasal pharynx, left maxillary sinus, and right maxillary sinus. These annotations were initially performed by skilled annotators and subsequently refined and verified by senior experts to ensure high accuracy and consistency. Furthermore, the dataset is organized into five pre-defined folds to support cross-validation and robust benchmarking of segmentation algorithms.
We report samples of the NasalSeg dataset along with over-imposed annotations in Figure 1
3.6. Metrics
We evaluate our 3D segmentation results using several quantitative metrics that capture different aspects of performance. For a binary segmentation task, we define the following basic terms: represents True Positives (the number of correctly identified positive elements), represents True Negatives (the correctly identified negative elements), represents False Positives (negative elements incorrectly labeled as positive), and represents False Negatives (positive elements that were missed). In multi-class segmentation, these metrics are computed for each class individually and then averaged to yield an overall performance score, ensuring that performance is fairly assessed even when class distributions vary.
The quality of the segmentation overlap is measured by the DICE coefficient, which is calculated as
This metric is widely adopted in medical image segmentation because it effectively captures the degree of overlap between the predicted segmentation and the ground truth. A DICE score of 1 indicates perfect overlap, while scores closer to 0 reflect poor agreement. The formulation penalizes both FPs and FNs equally, making it a robust indicator of segmentation quality.
Another critical measure is the Intersection over Union (IoU), which, for a single class, is defined as
IoU quantifies the ratio of the intersection between the predicted and actual segmentation regions relative to their union, offering an intuitive measure of error when extra regions are included or parts of the target are missed. For multi-class segmentation, the mean Intersection over Union (mIoU) is calculated by averaging the IoU values across all classes:
where C is the total number of classes and the subscript c indicates that the metric is computed for each class separately. This aggregate metric is particularly useful in evaluating the overall performance across diverse anatomical structures.
To further analyze segmentation performance, we employ Sensitivity (or Recall) to assess the proportion of actual positive elements that are correctly identified:
A high sensitivity is crucial, especially in medical applications, because it ensures that most of the true positives are captured, thereby reducing the risk of missing critical regions.
Complementary to Sensitivity, Specificity measures the proportion of actual negative elements that are correctly identified:
High specificity is important for minimizing the inclusion of irrelevant regions in the segmentation, which is particularly critical when false positives can lead to misinterpretations.
Precision, also known as Positive Predictive Value (PPV), evaluates the accuracy of the positive predictions:
This metric indicates the proportion of predicted positive elements that are indeed correct. High precision reflects the reliability of the segmentation in not overestimating the presence of the target structure.
Similarly, the Negative Predictive Value (NPV) assesses the correctness of the negative predictions:
A high NPV ensures that the segmentation method reliably identifies non-target areas, which is essential for maintaining overall segmentation integrity.
Finally, the overall performance of the segmentation is summarized by the Accuracy metric:
Accuracy measures the proportion of correctly classified elements (both positive and negative) out of all elements. Although it provides a global performance view, it should be interpreted alongside the other metrics, especially in scenarios with class imbalance.
Together, these metrics offer a comprehensive framework for assessing segmentation performance. They not only quantify the spatial overlap between the predicted and ground truth segmentations but also provide insights into the balance between correctly identifying positive elements and avoiding erroneous classifications. This multi-faceted evaluation is critical for refining segmentation algorithms, particularly in high-stakes applications such as medical imaging.
4. The Proposed Framework: 3D-NASE
Ensemble methods offer a robust strategy for enhancing 3D segmentation performance by reducing variance, improving generalization, and mitigating noise and artifacts, particularly in applications like medical imaging. They reduce individual model errors and overfitting by aggregating predictions from diverse models that capture distinct spatial features, yielding more accurate and consistent outputs. This integration of models, each specializing in different aspects of the data, such as fine-grained boundaries or global context, ensures comprehensive and robust segmentation, and recent computational advances have made it feasible to deploy ensembles in even the most intensive 3D tasks, providing a reliable and efficient solution for managing high-dimensional, heterogeneous data. To improve our performance and propose a more dependable framework for 3D nasal segmentation, we train state-of-the-art models, namely 3D U-Net, UNETR, and Swin UNETR, each designed to learn features using both CNN and transformer-based architectures; after training, we employ two ensembling strategies: majority voting and soft voting. We report a schematization of our pipeline in Figure 2 .
Experimental Setup. We conducted our experiments on a workstation equipped with an RTX 4060ti GPU 16GB VRAM and an Intel Core i5-13400 processor. All models were trained for 800 epochs with a learning rate of , and the best models were selected based on the highest DICE score on the validation set. 3D-NASE was built upon the MONAI repository [40]. For optimization, we employed AdamW together with the DICE loss function.
Data augmentation was an integral part of our training process. Specifically, we utilized two common strategies: random cropping and intensity normalization. For random cropping, a random volume crop with a region of interest (ROI) of voxels was extracted from each input image. After an analysis performed over the size of the images, it was identified that a ROI of allows a significant portion of the anatomical structure of interest to be captured, while reducing the variability introduced by irrelevant or background regions. Intensity normalization was performed on a per-channel basis by considering only non-zero voxels, scaling their intensities to have a mean of 0 and a standard deviation of 1.
5. Experimental Results
This section presents the experimental evaluation conducted and the results obtained. We evaluated the employed architectures as stand-alone and the proposed ensemble-based framework across different folds since every experiment uses a five-fold cross-validation approach to ensure a fair assessment and mitigate potential biases. The complete set of experiments across folds is presented in Table 1 , where we also compared the results with the baseline provided by [8]. As can be seen, our soft voting approach improves the DICE score by and reduces the standard deviation by , thereby highlighting enhanced adaptability and stability under varying training conditions. Moreover, the ensemble strategy achieves a improvement over Swin UNETR, the best stand-alone model. Although the improvement is marginal, these results illustrate that leveraging the diverse knowledge acquired by different models leads to more reliable outcomes.
Notably, the current state-of-the-art for the NasalSeg dataset [8] exhibits lower performance than individual models and ensemble strategies regarding the DICE score and demonstrates higher variability across folds.
Extending the evaluation to a broader range of segmentation metrics, Table 2 demonstrates that 3D-NASE precisely segment the relevant regions, as indicated by high accuracy, specificity, and NPV; however, they tend to under-segment the analyzed volumes, except for the nasal pharynx, which suffers from over-segmentation. These insights are further supported by the results provided in Table 3 , which shows the DICE score for the five different classes.
Among the classes with similar performance, the right and left nasal cavities are the most challenging to segment, likely due to intra-observer differences observed in the model predictions. This aspect is evidenced by the average DICE score and the higher standard deviation for these two classes, which is an order of magnitude greater than that for the other classes.
6. Qualitative Results
The qualitative results are presented in Figure 3 . All models exhibit a tendency toward over-segmentation for the nasal pharynx. This issue is particularly evident in 3D U-Net and UNETR, which also often predict small, scattered label fragments across different image regions. These fragmented predictions result in artifacts and inconsistencies in the final segmentation masks.
The proposed ensemble methods effectively mitigate this issue by filtering out small-scale imperfections, leading to more refined and coherent segmentation. However, larger over-segmentation artifacts tend to persist even in the ensemble predictions, indicating that while ensemble strategies improve overall segmentation quality, they may not entirely eliminate over-segmentation when it occurs on a larger scale.
The qualitative results presented in Figure 3 align with the observations made during the discussion of the quantitative results. Specifically, the regions most affected by segmentation errors are the right and left nasal cavities. These structures are either misclassified as other anatomical classes, as seen in the U-Net prediction for the second image, or other classes are mistakenly predicted as nasal cavities, as observed in the U-Net prediction for the third image.
These findings further reinforce the quantitative evaluation, highlighting the challenges associated with segmenting the nasal cavity regions. This suggests that their complex shape, small size, and similarity in intensity to surrounding structures contribute to the models’ difficulty in accurately distinguishing them.
7. Limitations
While our proposed framework for nasal segmentation demonstrates significant improvements over the current state of the art, it also presents some limitations.
It still exhibits artifacts and instances of over-segmentation and under-segmentation that vary across different anatomical classes. Such inconsistencies can compromise the reliability of the segmentation outputs, particularly when delineating complex or subtle structures.
Another critical limitation is the necessity for a large number of training epochs to achieve satisfactory results. This high computational demand can hinder accessibility, especially for smaller institutions or research groups with limited resources in a fine-tuning scenario. The extensive training requirements not only prolong the development cycle but also increase the overall cost of deployment.
Moreover, while the ensemble methodology provides marginal performance gains, it requires all three selected models to be trained on the same dataset and perform inference on the same volume. This integrated approach further compounds computational and memory resource requirements, posing a significant challenge in scenarios where real-time performance is essential.
Future work should focus on optimizing training strategies to reduce the number of required epochs, as well as exploring more resource-efficient ensemble methods. By addressing these issues, it may be possible to maintain or even enhance segmentation performance while reducing the computational burden, thus broadening the applicability of the framework in resource-constrained environments.
8. Conclusions
In this work, we introduced 3D-NASE, an ensemble-based segmentation framework that integrates the complementary strengths of CNN and attention-based architectures for 3D nasal CT segmentation. By merging predictions from 3D U-Net, UNETR, and Swin UNETR through majority and soft voting, our method effectively captures both fine-grained details and long-range contextual information. Experimental results on the NasalSeg dataset reveal that our ensemble approach not only outperforms individual models but also improves the overall state-of-the-art segmentation performance, with a notable increase in the DICE score and a reduction in variability across cross-validation folds. Despite these significant gains, challenges such as over-segmentation artifacts and high computational demands persist. Future work will focus on optimizing the training pipeline and exploring more resource-efficient ensemble strategies to further enhance segmentation accuracy and efficiency, thus broadening the clinical applicability of the proposed framework.
Author Contributions
Conceptualization, L.Z., A.P.; methodology, L.Z., A.L.,A.P.; Investigation, L.Z., A.L., A.P. and C.D.R.; software, L.Z., A.P.; writing—original draft, L.Z., A.L. ,A.P.; writing—review and editing, L.Z., A.L., A.P. and C.D.R.; supervision, A.L., C.D.R.;. All authors have read and agreed to the published version of the manuscript.
Funding
We acknowledge financial support under the National Recovery and Resilience Plan (NRRP), Mission 4 Component 2 Investment 1.5 - Call for tender No.3277 published on December 30, 2021 by the Italian Ministry of University and Research (MUR) funded by the European Union - NextGenerationEU. Project Code ECS0000038 - Project Title eINS Ecosystem of Innovation for Next Generation Sardinia - CUP F53C22000430001- Grant Assignment Decree No. 1056 adopted on June 23, 2022 by the Italian Ministry of University and Research (MUR).
Conflicts of Interest
The authors declare no conflict of interest.
Abbreviations
The following abbreviations are used in this manuscript:
| CT | Computed Tomography |
| MR | Magnetic Resonance |
| PET | Positron Emission Tomography |
| CNN | Convolutional Neural Network |
| RNN | Recurrent Neural Network |
| TP | True Positive |
| FP | False Positive |
| FN | False Negative |
| IoU | Intersection over Union |
| PPV | Positive Predictive Value |
| NPV | Negative Predictive Value |
| ROI | Region of Interest |
References
- Siu, J.; Dong, J.; Inthavong, K.; Shang, Y.; Douglas, R.G. Quantification of airflow in the sinuses following functional endoscopic sinus surgery. Rhinology 2020, 58, 257–265.
- Lee, S.; Fernandez, J.; Mirjalili, S.A.; Kirkpatrick, J. Pediatric paranasal sinuses—Development, growth, pathology, & functional endoscopic sinus surgery. Clinical Anatomy 2022, 35, 745–761.
- Shang, Y.; Inthavong, K. Numerical assessment of ambient inhaled micron particle deposition in a human nasal cavity. Experimental and computational multiphase flow 2019, 1, 109–115.
- Pourmehran, O.; Psaltis, A.; Vreugde, S.; Zarei, K.; Shang, Y.; Inthavong, K.; Wormald, P.J. Evaluating nebulisation and nasal irrigation efficiency in post-operative chronic rhinosinusitis patients through computational fluid dynamics simulation. Computer Methods and Programs in Biomedicine 2025, p. 108697.
- Jing, H.; Cui, X. A review on numerical studies of airflow dynamics and particle deposition in human respiratory system. Particuology 2024.
- Laura, C.O.; Hartwig, K.; Distergoft, A.; Hoffmann, T.; Scheckenbach, K.; Brüsseler, M.; Wesarg, S. Automatic segmentation of the structures in the nasal cavity and the ethmoidal sinus for the quantification of nasal septal deviations. In Proceedings of the Medical Imaging 2021: Computer-Aided Diagnosis. SPIE, 2021, Vol. 11597, pp. 582–591.
- Avrunin, O.G.; Tymkovych, M.Y.; Abdelhamid, I.Y.; Shushliapina, N.O.; Nosova, Y.V.; Semenets, V.V. Features of image segmentation of the upper respiratory tract for planning of rhinosurgical surgery. In Proceedings of the 2019 IEEE 39th International Conference on Electronics and Nanotechnology (ELNANO). IEEE, 2019, pp. 485–488.
- Zhang, Y.; Wang, J.; Pan, T.; Jiang, Q.; Ge, J.; Guo, X.; Jiang, C.; Lu, J.; Zhang, J.; Liu, X.; et al. NasalSeg: A Dataset for Automatic Segmentation of Nasal Cavity and Paranasal Sinuses from 3D CT Images. Scientific Data 2024, 11, 1329. Publisher: Nature Publishing Group, . [CrossRef]
- Homayounieh, F.; Singh, R.; Nitiwarangkul, C.; Lades, F.; Schmidt, B.; Sedlmair, M.; Saini, S.; Kalra, M.K. Semiautomatic Segmentation and Radiomics for Dual-Energy CT: A Pilot Study to Differentiate Benign and Malignant Hepatic Lesions. American Journal of Roentgenology 2020, 215, 398–405. Publisher: American Roentgen Ray Society, . [CrossRef]
- Parmar, C.; Velazquez, E.R.; Leijenaar, R.; Jermoumi, M.; Carvalho, S.; Mak, R.H.; Mitra, S.; Shankar, B.U.; Kikinis, R.; Haibe-Kains, B.; et al. Robust Radiomics Feature Quantification Using Semiautomatic Volumetric Segmentation. PLOS ONE 2014, 9, e102107. Publisher: Public Library of Science, . [CrossRef]
- Holbrook, M.D.; Blocker, S.J.; Mowery, Y.M.; Badea, A.; Qi, Y.; Xu, E.S.; Kirsch, D.G.; Johnson, G.A.; Badea, C.T. MRI-Based Deep Learning Segmentation and Radiomics of Sarcoma in Mice. Tomography 2020, 6, 23–33. [CrossRef]
- Lin, Y.C.; Lin, G.; Pandey, S.; Yeh, C.H.; Wang, J.J.; Lin, C.Y.; Ho, T.Y.; Ko, S.F.; Ng, S.H. Fully automated segmentation and radiomics feature extraction of hypopharyngeal cancer on MRI using deep learning. European Radiology 2023, 33, 6548–6556. [CrossRef]
- Avesta, A.; Hossain, S.; Lin, M.; Aboian, M.; Krumholz, H.M.; Aneja, S. Comparing 3D, 2.5D, and 2D Approaches to Brain Image Auto-Segmentation. Bioengineering 2023, 10, 181. [CrossRef]
- Shusharina, N.; Söderberg, J.; Edmunds, D.; Löfman, F.; Shih, H.; Bortfeld, T. Automated delineation of the clinical target volume using anatomically constrained 3D expansion of the gross tumor volume. Radiotherapy and oncology : journal of the European Society for Therapeutic Radiology and Oncology 2020, 146, 37–43. [CrossRef]
- Shivdeo, A.; Lokwani, R.; Kulkarni, V.; Kharat, A.; Pant, A. Evaluation of 3D and 2D Deep Learning Techniques for Semantic Segmentation in CT Scans. 2021 International Conference on Artificial Intelligence, Big Data, Computing and Data Communication Systems (icABCD) 2021, pp. 1–8. Conference Name: 2021 International Conference on Artificial Intelligence, Big Data, Computing and Data Communication Systems (icABCD) ISBN: 9781728185927 Place: Durban, South Africa Publisher: IEEE, . [CrossRef]
- Wu, W.; Gao, L.; Duan, H.; Huang, G.; Ye, X.; Nie, S. Segmentation of pulmonary nodules in CT images based on 3D-UNET combined with three-dimensional conditional random field optimization. Medical Physics 2020, 47, 4054–4063. _eprint: https://onlinelibrary.wiley.com/doi/pdf/10.1002/mp.14248, . [CrossRef]
- X, F.; Nj, T.; Sh, P.; Ch, M. Brain Tumor Segmentation Using an Ensemble of 3D U-Nets and Overall Survival Prediction Using Radiomic Features. PubMed 2020.
- Çiçek, O.; Abdulkadir, A.; Lienkamp, S.S.; Brox, T.; Ronneberger, O. 3D U-Net: Learning Dense Volumetric Segmentation from Sparse Annotation. 2016. [CrossRef]
- Hatamizadeh, A.; Tang, Y.; Nath, V.; Yang, D.; Myronenko, A.; Landman, B.; Roth, H.R.; Xu, D. UNETR: Transformers for 3D Medical Image Segmentation. In Proceedings of the 2022 IEEE/CVF Winter Conference on Applications of Computer Vision (WACV), Waikoloa, HI, USA, 2022; pp. 1748–1758. [CrossRef]
- Cai, Y.; Long, Y.; Han, Z.; Liu, M.; Zheng, Y.; Yang, W.; Chen, L. Swin Unet3D: a three-dimensional medical image segmentation network combining vision transformer and convolution. BMC Medical Informatics and Decision Making 2023, 23, 33. [CrossRef]
- Hu, P.; Zhou, H.; Yan, T.; Miu, H.; Xiao, F.; Zhu, X.; Shu, L.; Yang, S.; Jin, R.; Dou, W.; et al. Deep learning-assisted identification and quantification of aneurysmal subarachnoid hemorrhage in non-contrast CT scans: Development and external validation of Hybrid 2D/3D UNet. NeuroImage 2023, 279, 120321. [CrossRef]
- Gu, H.; Gan, W.; Zhang, C.; Feng, A.; Wang, H.; Huang, Y.; Chen, H.; Shao, Y.; Duan, Y.; Xu, Z. A 2D–3D hybrid convolutional neural network for lung lobe auto-segmentation on standard slice thickness computed tomography of patients receiving radiotherapy. BioMedical Engineering OnLine 2021, 20, 94. [CrossRef]
- Shirokikh, B.; Shevtsov, A.; Dalechina, A.; Krivov, E.; Kostjuchenko, V.; Golanov, A.; Gombolevskiy, V.; Morozov, S.; Belyaev, M. Accelerating 3D Medical Image Segmentation by Adaptive Small-Scale Target Localization. Journal of Imaging 2021, 7, 35. Number: 2 Publisher: Multidisciplinary Digital Publishing Institute, . [CrossRef]
- de Araújo, A.S.; Pinho, M.S.; Marques da Silva, A.M.; Fiorentini, L.F.; Becker, J. A 2.5D Self-Training Strategy for Carotid Artery Segmentation in T1-Weighted Brain Magnetic Resonance Images. Journal of Imaging 2024, 10, 161. Number: 7 Publisher: Multidisciplinary Digital Publishing Institute, . [CrossRef]
- Satpute, N.; Naseem, R.; Palomar, R.; Zachariadis, O.; Gómez-Luna, J.; Cheikh, F.A.; Olivares, J. Fast parallel vessel segmentation. Computer Methods and Programs in Biomedicine 2020, 192, 105430. [CrossRef]
- Yan, J.; Zhuang, T.g.; Zhao, B.; Schwartz, L.H. Lymph node segmentation from CT images using fast marching method. Computerized Medical Imaging and Graphics 2004, 28, 33–38. [CrossRef]
- El Badaoui, R.; Bonmati Coll, E.; Psarrou, A.; Asaturyan, H.A.; Villarini, B. Enhanced CATBraTS for Brain Tumour Semantic Segmentation. Journal of Imaging 2025, 11, 8. Number: 1 Publisher: Multidisciplinary Digital Publishing Institute, . [CrossRef]
- Jin, Z.; Gong, J.; Deng, M.; Zheng, P.; Li, G. Deep Learning-Based Diagnosis Algorithm for Alzheimer’s Disease. Journal of Imaging 2024, 10, 333. Number: 12 Publisher: Multidisciplinary Digital Publishing Institute, . [CrossRef]
- Vasiliuk, A.; Frolova, D.; Belyaev, M.; Shirokikh, B. Limitations of Out-of-Distribution Detection in 3D Medical Image Segmentation. Journal of Imaging 2023, 9, 191. Number: 9 Publisher: Multidisciplinary Digital Publishing Institute, . [CrossRef]
- Poirot, M.G.; Caan, M.W.A.; Ruhe, H.G.; Bjørnerud, A.; Groote, I.; Reneman, L.; Marquering, H.A. Robustness of radiomics to variations in segmentation methods in multimodal brain MRI. Scientific Reports 2022, 12, 16712. [CrossRef]
- Wang, C.; Jiang, L.; Wu, X.; Tian, Z.; Peng, B.; Zhao, H.; Jia, J. GroupContrast: Semantic-Aware Self-Supervised Representation Learning for 3D Understanding. In Proceedings of the 2024 IEEE/CVF Conference on Computer Vision and Pattern Recognition (CVPR), Seattle, WA, USA, 2024; pp. 4917–4928. [CrossRef]
- Qi, L.; Jiang, Z.; Shi, W.; Qu, F.; Feng, G. GMIM: Self-supervised pre-training for 3D medical image segmentation with adaptive and hierarchical masked image modeling. Computers in Biology and Medicine 2024, 176, 108547. [CrossRef]
- Zhang, S.; Metaxas, D. On the challenges and perspectives of foundation models for medical image analysis. Medical Image Analysis 2024, 91, 102996. [CrossRef]
- Pai, S.; Bontempi, D.; Hadzic, I.; Prudente, V.; Sokač, M.; Chaunzwa, T.L.; Bernatz, S.; Hosny, A.; Mak, R.H.; Birkbak, N.J.; et al. Foundation model for cancer imaging biomarkers. Nature Machine Intelligence 2024, 6, 354–367. Publisher: Nature Publishing Group, . [CrossRef]
- L, X.; X, T.; X, J.; H, C.; B, Q.; B, C.; X, L.; J, Z.; L, L. Automatic segmentation-based multi-modal radiomics analysis of US and MRI for predicting disease-free survival of breast cancer: a multicenter study. PubMed 2024.
- Zhan, F.; He, L.; Yu, Y.; Chen, Q.; Guo, Y.; Wang, L. A multimodal radiomic machine learning approach to predict the LCK expression and clinical prognosis in high-grade serous ovarian cancer. Scientific Reports 2023, 13, 16397. Publisher: Nature Publishing Group, . [CrossRef]
- Ronneberger, O.; Fischer, P.; Brox, T. U-Net: Convolutional Networks for Biomedical Image Segmentation. 2015. [CrossRef]
- Vaswani, A.; Shazeer, N.; Parmar, N.; Uszkoreit, J.; Jones, L.; Gomez, A.N.; Kaiser, L.u.; Polosukhin, I. Attention is All you Need. In Proceedings of the Advances in Neural Information Processing Systems. Curran Associates, Inc., 2017, Vol. 30.
- Liu, Z.; Lin, Y.; Cao, Y.; Hu, H.; Wei, Y.; Zhang, Z.; Lin, S.; Guo, B. Swin Transformer: Hierarchical Vision Transformer using Shifted Windows.
- Cardoso, M.J.; Li, W.; Brown, R.; Ma, N.; Kerfoot, E.; Wang, Y.; Murrey, B.; Myronenko, A.; Zhao, C.; Yang, D.; et al. MONAI: An open-source framework for deep learning in healthcare, 2022, [arXiv:cs.LG/2211.02701].
Figure 1.
Samples from the NasalSeg dataset along with corresponding labels.
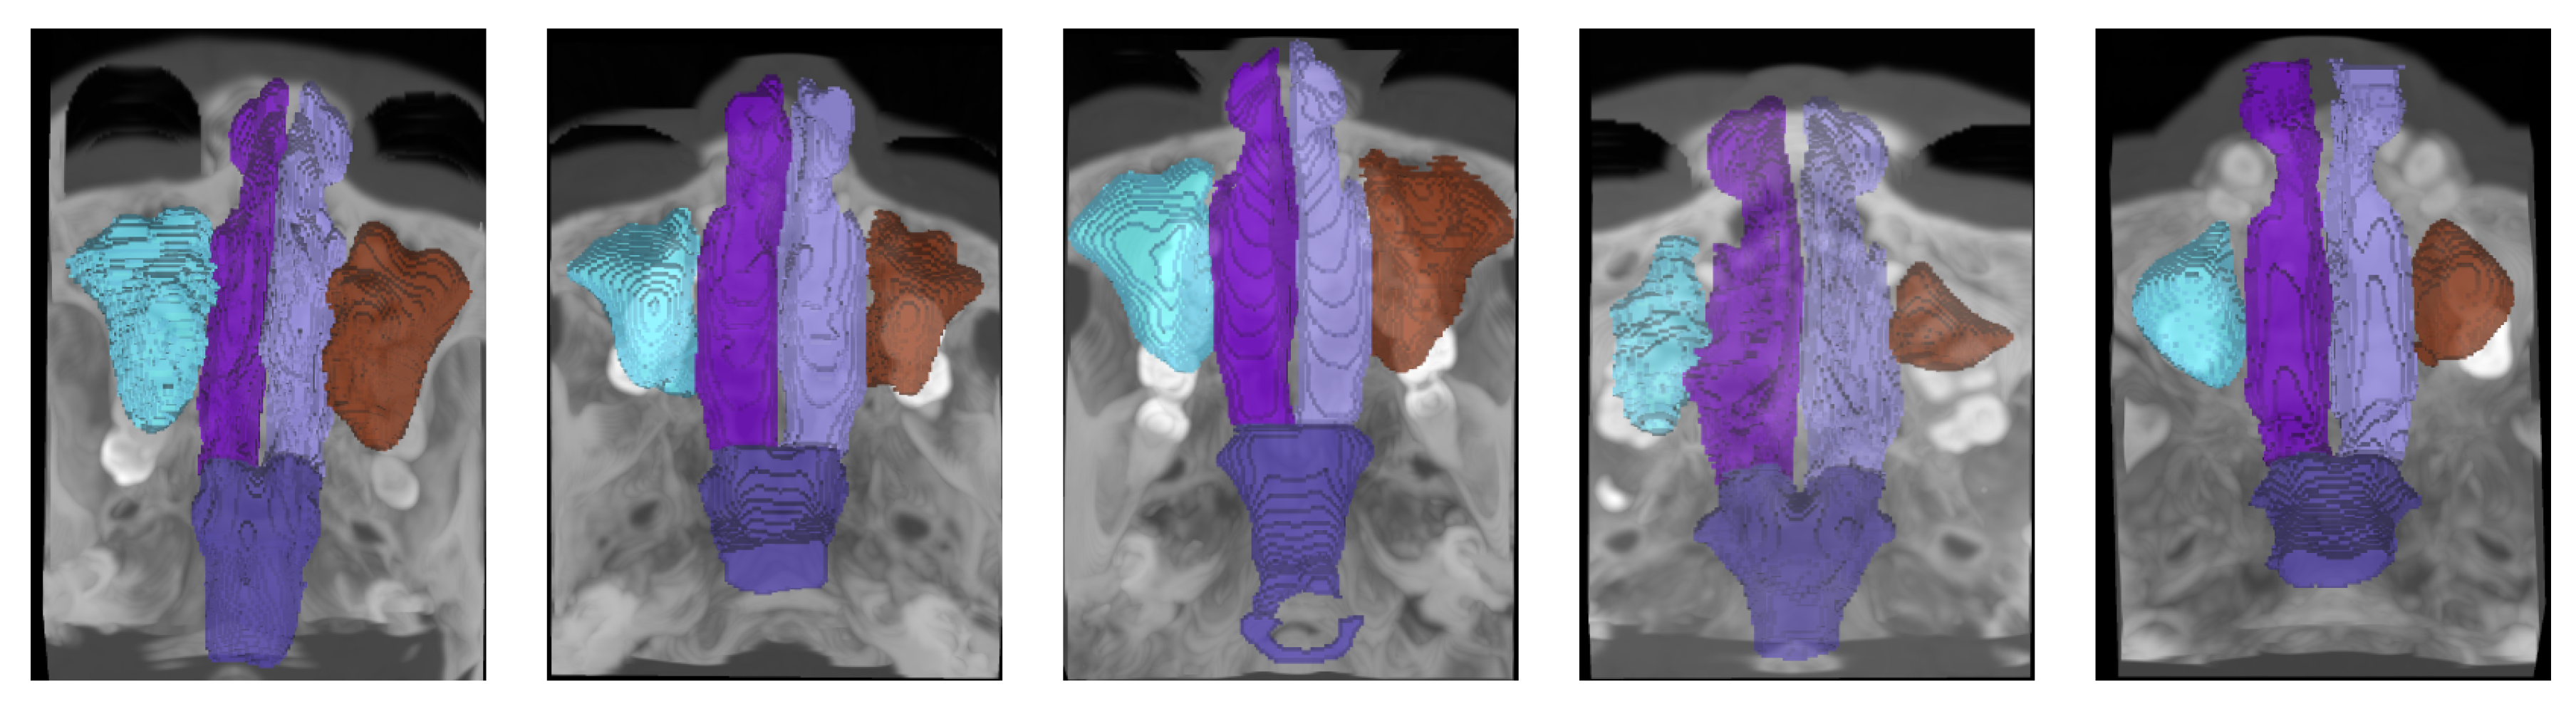
Figure 2.
The proposed framework, 3D-NASE: the input volume is processed in parallel by the selected models, their outputs are concatenated, and an ensemble strategy is applied to generate the final prediction.
Figure 2.
The proposed framework, 3D-NASE: the input volume is processed in parallel by the selected models, their outputs are concatenated, and an ensemble strategy is applied to generate the final prediction.
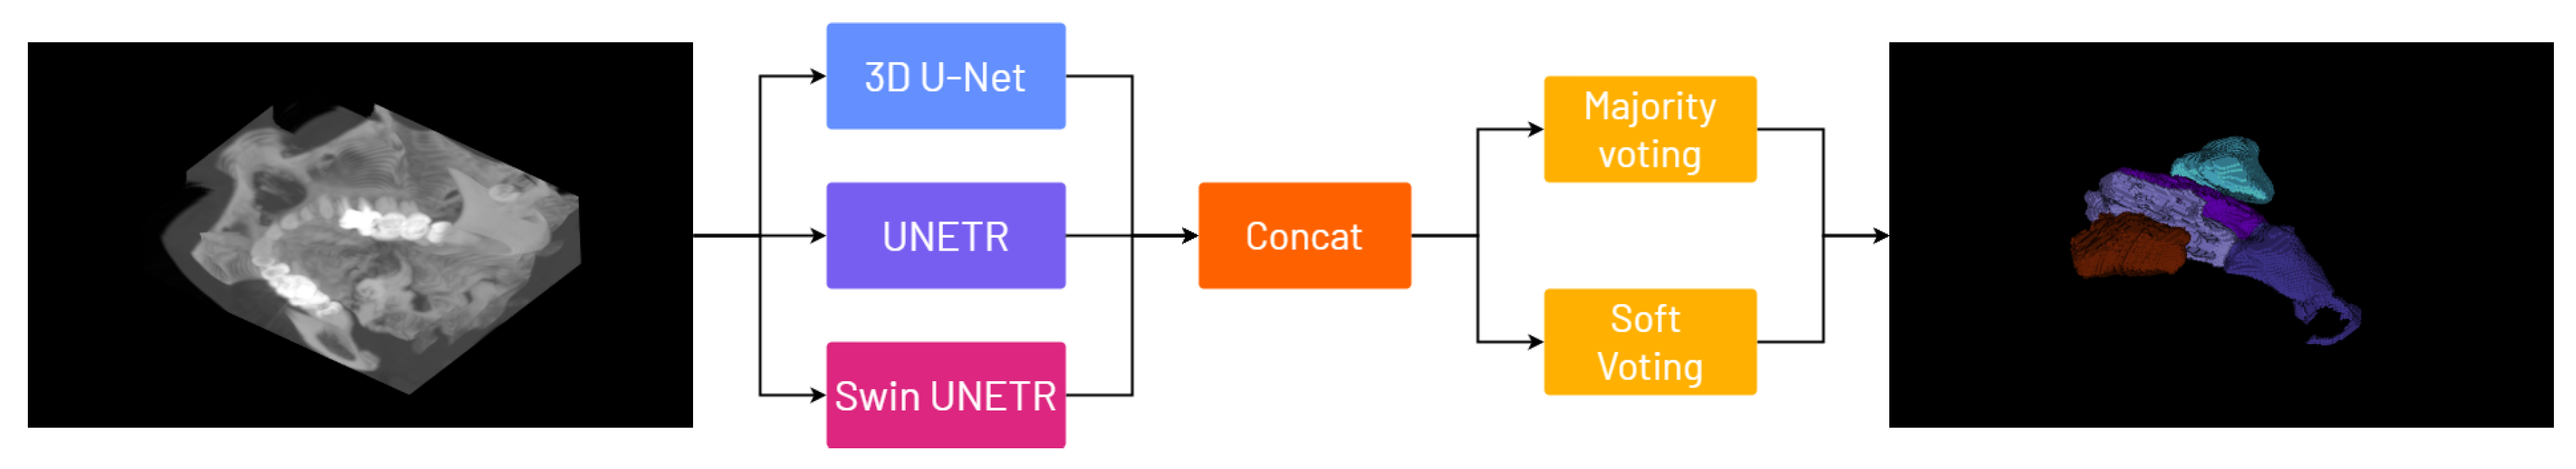
Figure 3.
Qualitative results: Original images, ground truth labels, and predictions from 3D U-Net, UNETR, Swin UNETR, majority voting, and soft voting.
Figure 3.
Qualitative results: Original images, ground truth labels, and predictions from 3D U-Net, UNETR, Swin UNETR, majority voting, and soft voting.
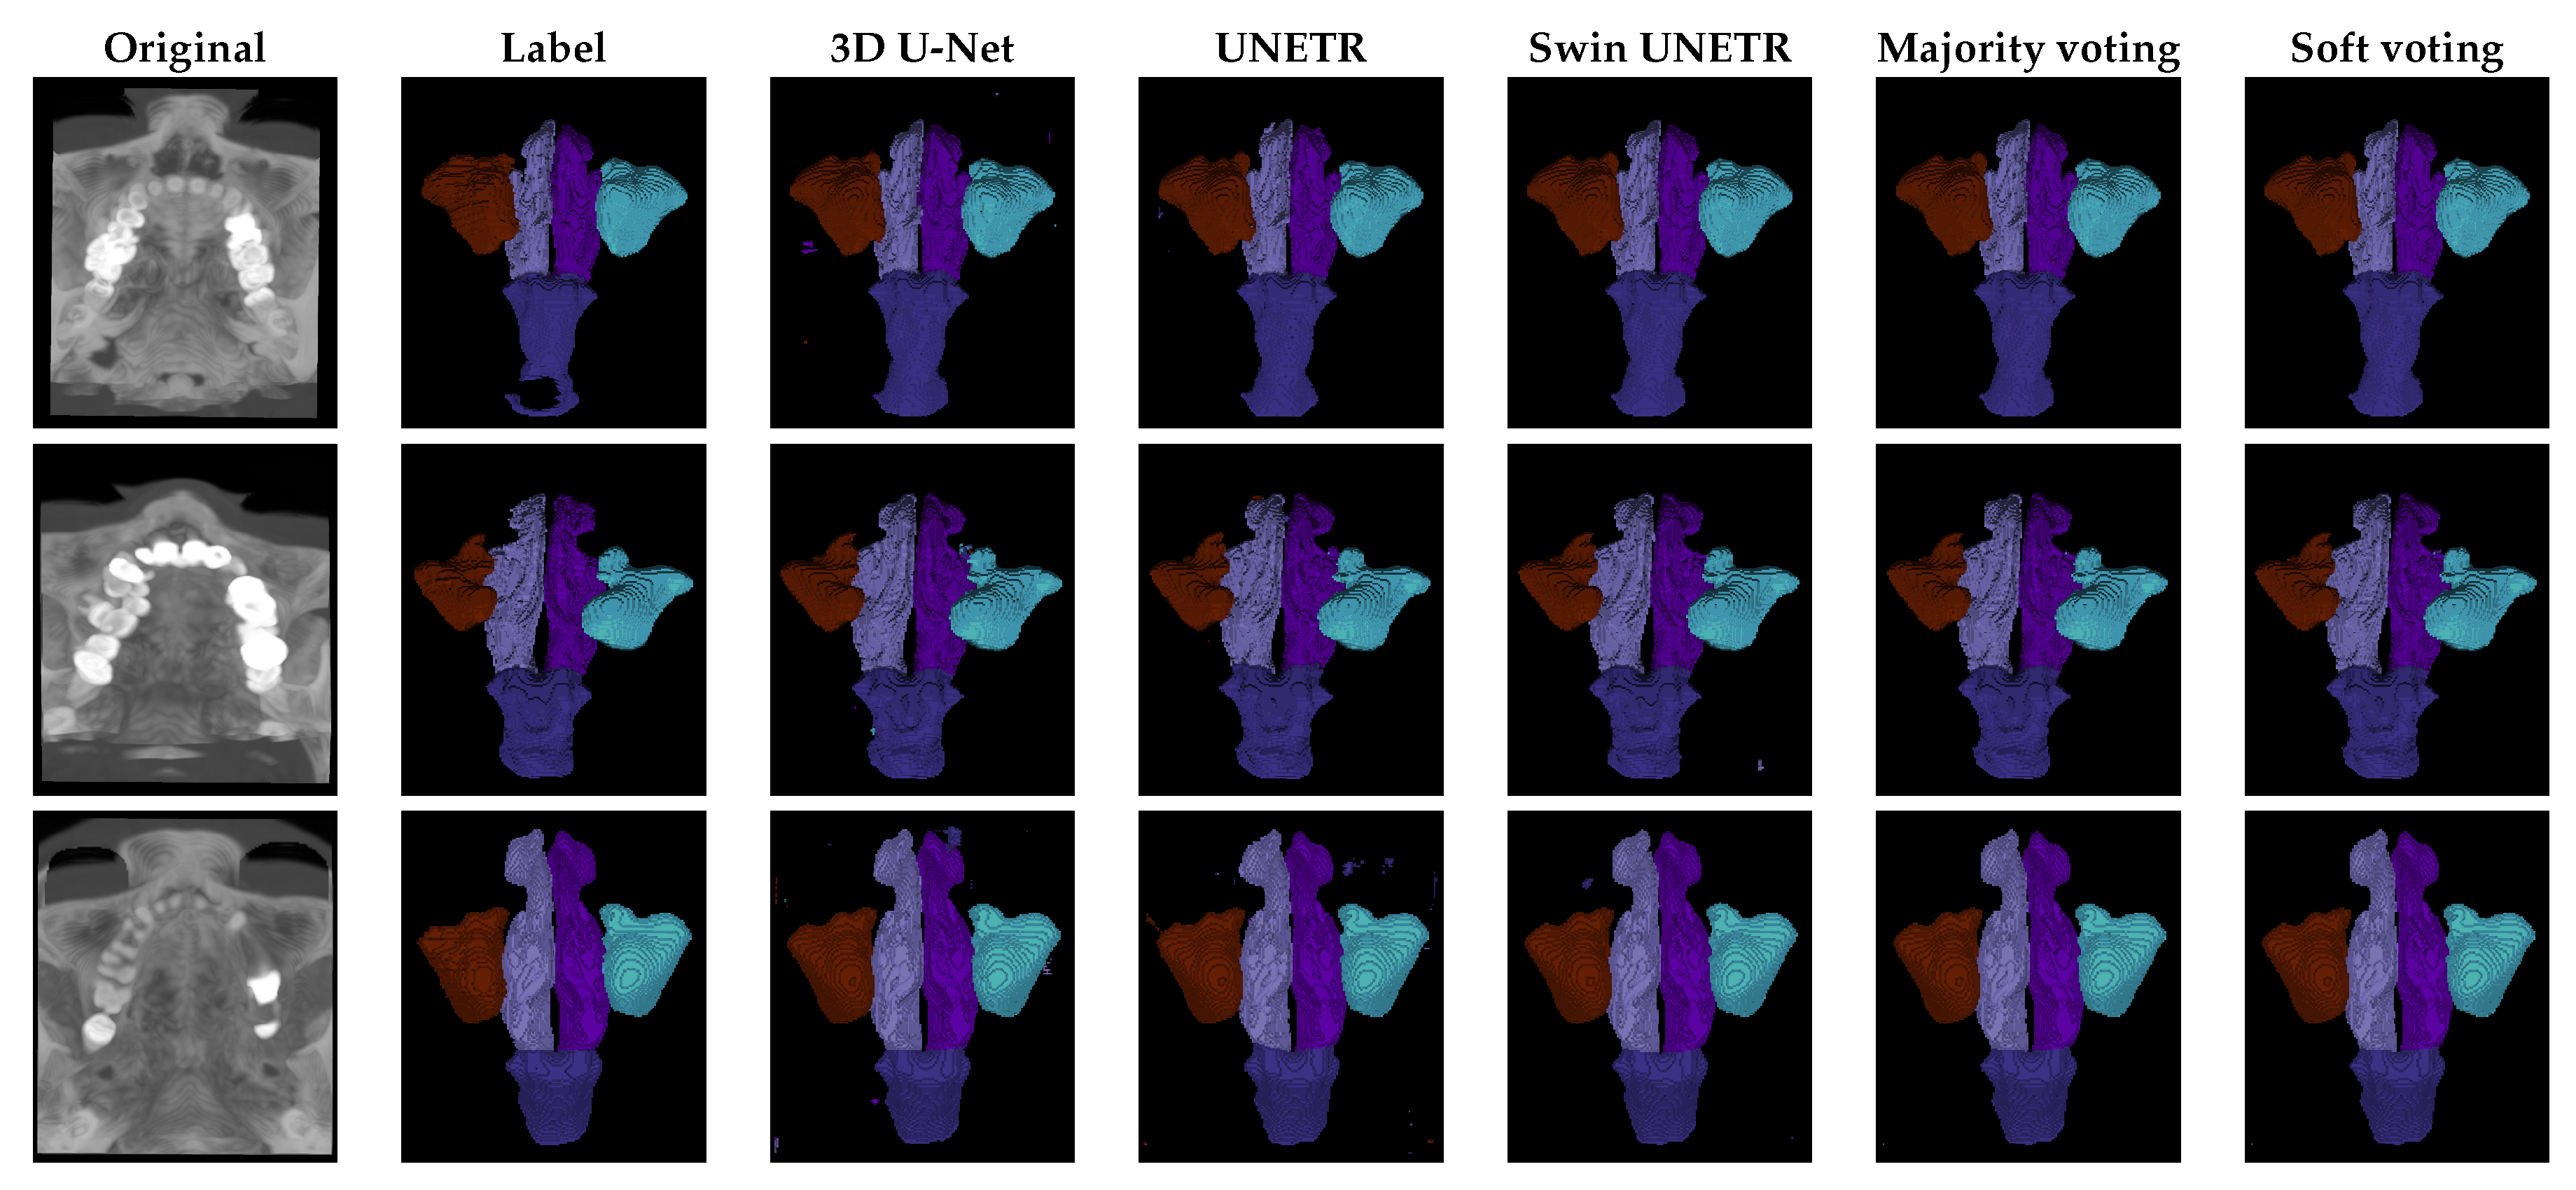

Table 1.
DICE scores across folds demonstrate that 3D-NASE with soft voting approach outperforms the current state-of-the-art on the NasalSeg dataset by . Notably, ensemble methods achieve superior segmentation performance compared to individual networks.
Table 1.
DICE scores across folds demonstrate that 3D-NASE with soft voting approach outperforms the current state-of-the-art on the NasalSeg dataset by . Notably, ensemble methods achieve superior segmentation performance compared to individual networks.
| Fold# | 0↑ | 1↑ | 2↑ | 3↑ | 4↑ | AVG↑ |
|---|---|---|---|---|---|---|
| Baseline [8] | 56.25 | 65.70 | 62.31 | 58.73 | 49.76 | 58.55± 5.43 |
| 3D U-Net | 94.06 | 93.37 | 91.01 | 92.89 | 94.75 | 93.22±1.48 |
| UNETR | 93.89 | 92.23 | 93.19 | 92.62 | 94.68 | 93.32±0.82 |
| Swin UNETR | 94.09 | 93.91 | 93.78 | 93.37 | 95.51 | 94.13±0.87 |
| 3D-NASE (Majority voting) | 95.16 | 93.97 | 94.25 | 93.46 | 95.53 | 94.47±0.85 |
| 3D-NASE (Soft voting) | 95.18 | 93.99 | 93.48 | 94.28 | 95.56 | 94.50±0.86 |
Table 2.
Quantitative comparison of segmentation performance across different models on the NasalSeg dataset. The soft voting ensemble achieves the highest DICE, mIoU, and Sensitivity, outperforming individual networks. Additionally, ensemble methods maintain high specificity and accuracy, demonstrating their effectiveness in producing reliable segmentation results.
| Method | DICE↑ | mIoU ↑ | Sensitivity↑ | Specificity↑ | Accuracy↑ | PPV↑ | NPV↑ |
| 3D U-Net | 93.22 ± 1.48 | 88.88 ± 1.49 | 93.74 ± 1.73 | 98.97 ± 0.30 | 99.65 ± 0.03 | 93.41 ± 0.65 | 98.96 ± 0.16 |
| UNETR | 93.32 ± 0.82 | 88.86 ± 0.79 | 94.33 ± 0.74 | 99.12 ± 0.10 | 99.64 ± 0.02 | 92.92 ± 0.99 | 98.85 ± 0.13 |
| Swin UNETR | 94.13 ± 0.87 | 90.20 ± 0.90 | 94.98 ± 0.97 | 99.21 ± 0.06 | 99.69 ± 0.03 | 93.80 ± 0.85 | 99.01 ± 0.18 |
| 3D-NASE (Majority voting) | 94.47 ± 0.85 | 90.52 ± 0.78 | 94.87 ± 0.92 | 99.19 ± 0.07 | 99.70 ± 0.02 | 94.26 ± 0.79 | 99.08 ± 0.11 |
| 3D-NASE (Soft voting) | 94.50 ± 0.86 | 90.56 ± 0.78 | 94.91 ± 0.92 | 99.20 ± 0.07 | 99.70 ± 0.02 | 94.27 ± 0.79 | 99.09 ± 0.11 |
Table 3.
DICE scores for each anatomical class segmented by different models on the NasalSeg dataset. The soft voting ensemble achieves the highest Dice scores across all classes, demonstrating superior segmentation performance for the maxillary sinuses, nasal cavities, and nasal pharynx.
Table 3.
DICE scores for each anatomical class segmented by different models on the NasalSeg dataset. The soft voting ensemble achieves the highest Dice scores across all classes, demonstrating superior segmentation performance for the maxillary sinuses, nasal cavities, and nasal pharynx.
| Method | Background↑ | Maxillary Sinus (R)↑ | Maxillary Sinus (L)↑ | Nasal Cavity (R)↑ | Nasal Cavity (L)↑ | Nasal Pharynx↑ |
| 3D U-Net | 99.49 ± 0.07 | 94.97 ± 1.92 | 94.06 ± 2.88 | 88.83 ± 2.95 | 88.49 ± 2.74 | 93.88 ± 2.06 |
| UNETR | 99.48 ± 0.05 | 94.72 ± 0.8 | 94.62 ± 1.72 | 89.08 ± 2.95 | 88.93 ± 2.83 | 94.18 ± 1.31 |
| Swin UNETR | 99.55 ± 0.05 | 95.64 ± 0.77 | 94.54 ± 2.37 | 90.3 ± 2.81 | 90.27 ± 2.88 | 95.38 ± 0.94 |
| 3D-NASE (Majority voting) | 99.56 ± 0.04 | 95.91 ± 0.58 | 95.12 ± 1.69 | 90.38 ± 2.95 | 90.33 ± 2.88 | 95.53 ± 0.8 |
| 3D-NASE (Soft voting) | 99.57 ± 0.04 | 95.93 ± 0.58 | 95.14 ± 1.7 | 90.42 ± 2.95 | 90.37 ± 2.89 | 95.55 ± 0.8 |
Disclaimer/Publisher’s Note: The statements, opinions and data contained in all publications are solely those of the individual author(s) and contributor(s) and not of MDPI and/or the editor(s). MDPI and/or the editor(s) disclaim responsibility for any injury to people or property resulting from any ideas, methods, instructions or products referred to in the content. |
© 2025 by the authors. Licensee MDPI, Basel, Switzerland. This article is an open access article distributed under the terms and conditions of the Creative Commons Attribution (CC BY) license (http://creativecommons.org/licenses/by/4.0/).
Copyright: This open access article is published under a Creative Commons CC BY 4.0 license, which permit the free download, distribution, and reuse, provided that the author and preprint are cited in any reuse.


