1. Introduction
Diabetes mellitus is a metabolic condition resulting from impaired insulin secretion, characterized by elevated fasting blood glucose, excessive thirst, hunger, urination, and weight loss. Management of the condition generally involves ongoing medication to regulate blood sugar levels [
1]. According to statistics, approximately 9 % of adults worldwide are affected by diabetes, with more than 90 % of diabetes patients are type 2 diabetics (T2DM) [
2]. The clinical manifestations of T2DM are hyperglycemia and insulin resistance. When the feedback pathway of insulin action and insulin secretion is destroyed, all insulin-sensitive organs in the human body will be greatly affected, leading to the failure of synthesize glycogen with glucose normally, and resulting in increased glucose concentration in the blood and the formation of hyperglycemia [
3].
Alpha-glucosidase is a key digestive enzyme that degrades starch into monosaccharides, and many compounds show their biological activities of decreasing blood glucose by inhibiting α-glucosidase [
4,
5]. At present, the common drugs used as α-glucosidase inhibitors include: acarbose, sitagliptin, miglitol [
6]. However, many α-glucosidase inhibitors are prone to cause hypoglycemia, gastrointestinal dysfunction, increased insulin resistance, liver toxicity and other adverse side effects. As a result, the search for safe, effective and economical dietary anti-diabetic compounds is of great importance [
7].
Mulberry as a valuable plant, its different parts (leaves, branches, roots) have been widely utilized for centuries in the management of diabetes, rheumatics, arthritis and other diseases [
8,
9]. Mulberry leaves contain polyphenolic compounds, such as flavonoids, which consist of two benzene rings connected by a heterocyclic six-membered pyrone ring. Their structure is generally believed to be closely associated with their biological activities, including antioxidant, cardiovascular protective, and anticancer effects [
10,
11]. Studies have shown that rats taking mulberry leaf extract for 5 weeks reduced blood sugar levels in the body by 5 %, and oral administration of 0.8 g and 1.2 g mulberry leaf powder significantly inhibited post-meal blood sugar and insulin secretion [
12,
13].
Mulberry resources are rich in prenylated flavonoids, such as D and G, each containing one prenyl group. Wen’s research indicated that compared to non-prenylated flavonoids, prenylated flavonoids exhibit significantly enhanced activities in areas such as immunomodulation, cardiovascular protection, and improvement of metabolic diseases. Moreover, the structure-activity relationship of a single prenyl group in flavonoids shows activity ranked as follows: C-8 prenyl > C-3 prenyl > C-6 prenyl [
14]. Prenylation significantly enhanced the inhibitory effects of parent compounds like quercetin, genistein, and chalcone on α-glucosidase activity [
15].
Currently, there was limited research focused on the target and mechanism of inhibition of α-glucosidase by sanggenone D and kuwanon G. In this study, enzymatic kinetics, Fourier transform infrared spectra, fluorescence spectroscopy and molecular docking techniques were applied to explore the inhibitory effect and mechanism of α-glucosidase inhibition by sanggenone D and kuwanon G. Besides, the high glucose model of human hepatocellular carcinoma HepG2 cells was established to investigate the effect of sanggenone D and kuwanon G on reducing the glucose level, and the pathway of their action was explored by western blotting. The results would provide useful reference for the application of sanggenone D and kuwanon G in hypoglycemic functional food.
2. Materials and Methods
2.1. Materials
Alpha-glucosidase, acarbose and p-nitrophenyl-α-D-glucopyranoside were sourced from Shanghai Yuanye Biotechnology Co., Ltd., Shanghai, China. Sanggenone D and kuwanon G were sourced from Baoji Chenguang Biotechnology Co., Ltd., Baoji, China with purity of > 98%. HepG2 cells were sourced from Yuji Biotechnology Co., Ltd., China. Trypsin, fetal bovine serum, double antibody, non-essential amino acid and High-glucose Dulbecco’s modified Eagle’s medium (DMEM) were sourced from Casbad, California, USA. CCK-8 kit, glucose assay kit, total cholesterol (TC) kit, triglyceride (TG) kit were sourced from Nanjing Jiancheng Bioengineering Institute, Nanjing, China. Analytical grade reagents with purity of > 99.8% were used for the experiment, along with ultra-pure water.
2.2. Inhibitory Activity
Samples of 50 μL serial dilution concentration (sangenone D: 50, 100, 200, 400, 600, 800 μg/mL; kuwanon G: 50, 100, 200, 250, 300, 400 μg/mL; acarbose: 25, 50, 75, 100, 125, 250 ng/mL) were put into a 96-well plate, then 50 μL of 1 U/mL α-glucosidase solution (prepared in pH 6.8, 0.1 mol/L PBS) was added, and incubated at 37 °C for 10 min. Subsequently, 50 μL of 2 mmol/L p-NPG was added, and the mixture was incubated at 37 °C for 20 minutes. Finally, 50 μL of 1 mol/L Na
2CO
3 was added into an ice bath for 5 min to terminate the reaction. The absorbance was measured at 405 nm and the α-glucosidase inhibitory activity was calculated according to formula (1):
Aa is the absorbance of the sample group, Ab is the absorbance of the sample background group (equal volume of buffer instead of enzyme solution), Ac is the absorbance of the control group (equal volume of buffer instead of the sample solution), and Ad is the absorbance of the control background group (equal volume of buffer instead of the sample and enzyme solution).
2.3. Inhibition Kinetics Assay
The inhibition assay of α-glucosidase was adapted from MORTEZA with some modification [
16]. 50 μL α-glucosidase solution (1 U/mL) was added to 96-well plates, and 50 μL sample solution with different concentrations (sangenone D: 0, 20, 100, 200 μg/mL; kuwanon G: 0, 10, 20, 40 μg/mL) was incubated at 37 ℃ for 10 min. Subsequently, different concentrations of pNPG solution were added and incubated at 37 ℃ for 20 min. Finally, sodium carbonate solution (50 μL, 2 mmol/L) was added to terminate the reaction. Colorimetry was performed at 405 nm using a spectrophotometer to determine the change in absorbance of the enzymatic reaction system. The reversible inhibitory effect types of sanggenone D and kuwanon G on the enzyme were analyzed by the Lineweaver-Burk equation. The relevant parameters were calculated using Formulas (2)–(4).
In the formula, V represents the reaction rate, and Vm represents the maximum reaction rate. [I] is the concentration of the compound sample, and [S] is the substrate concentration. Km represents the Michaelis constant, and KI and KIS represent the inhibitory constants of the compound sample on α-glucosidase and the α-glucosidase-substrate complex, respectively.
2.4. Multi-Fluorescence Spectroscopy
100 μL of 1 U/mL α-glucosidase extract was mixed with PNPG solutions of different concentrations (sangenone D: 0, 1, 5, 10, 20, 50, 60 μg/mL; kuwanon G: 0, 1, 5, 10, 20, 40, 60 μg/mL) and incubated at three temperatures of 298 K, 304 K, and 310 K for 5 min, the mixture were scanned with fluorescence spectroscopy (SpectraMax i3x, Molecular Devices, LLC., CA, USA). The excitation wavelength was set at 280 nm, the emission wavelength was 300 - 500 nm, and the widths of both excitation and emission slits were 5 nm. The fluorescence quenching parameters were calculated according to the following equations.
Stern-Volmer dynamic collision quenching equation:
F0 and F represent the fluorescence intensity peaks of α-glucosidase without and with the compound, respectively; [Q] is the sample concentration; τ0 is the protein’s average lifetime (10-8 s).
2.5. FT-IR Measurements
Fourier transform infrared spectroscopy (VERTEX 7.0, BRUKER Co., Ltd., Germany) was used to detect the secondary conformation of α-glucosidase before and after sample treatment by infrared amide I (1600 cm
-1-1700 cm
-1) type curve fitting. In the experiment, the α-glucosidase (1 U/mL ) was mixed with G (100 μg/mL) and D (150 μg/mL) in equal volume respectively [
17].
2.6. Molecular Docking
Molecular docking techniques were employed to investigate the binding conformation of small molecules and proteins, and the binding energy, binding site and binding mode of the interaction between sangenone D, kuwanon G and α-glucosidase were analyzed. The crystal structure of the α-glucosidase protein used for docking was acquired from the PDB database (PDB ID: 5NN4), while the 3D structures of the small molecules were retrieved from PubChem and subjected to energy minimization using the MMFF94 force field.
AutoDock Vina 1.1.2 software was used to perform molecular docking. Before docking, the α-glucosidase protein (EC 3.2.1.20) was processed using PyMol 2.5.2, which involved eliminating water molecules, salt ions, and small molecules. Subsequently, position the docking box with its center aligned to the centroid of the ligand in the original crystal structure. Additionally, all processed small molecules and the receptor protein were converted into PDBQT format. During docking, the global search precision was set to 32, with all other parameters set to their default values. The docking conformation with the highest score was considered the binding conformation, and the docking results were subsequently visualized and analyzed using PyMol 2.5.2. [
18,
19].
The small molecule-protein complex obtained through docking was used as the initial structure for all-atom molecular dynamics simulations, which were carried out using AMBER 18 software [
20]. Prior to the simulation, energy optimization of the system was performed using 2500 steps of steepest descent and 2500 steps of conjugate gradient methods. During the simulation, the nonbonded cutoff distance was set to 10 Å, and the Particle Mesh Ewald (PME) method was applied to calculate long-range electrostatic interactions. The SHAKE algorithm was used to constrain hydrogen bond lengths, and the Langevin algorithm was employed for temperature control. The collision frequency (γ), system pressure, and integration timestep were set to 2 ps⁻¹, 1 atm, and 2 fs, respectively. Trajectories were saved every 10 ps for subsequent analysis.
The protein-ligand binding free energies for all systems were computed via the MM/GBSA approach [
21]. MD trajectories of 90 to 100 ns were employed for the calculations in this research, with the detailed formula as follows.
In formula (7), , and represent internal energy, van der Waals action and electrostatic interaction, respectively. Internal energy includes Ebond, Eangle and Etorsion. and are collectively referred to as the free energies of solvation. GGB is the free energy of polar solvation and GSA is the free energy of non-polar solvation.
2.7. Cell Experiment
2.7.1. HepG2 Cell Cultivation
DMEM complete medium was config. d according to 88 % DMEM high glucose medium, 10 % fetal bovine serum, 1 % double antibodies and 1 % non-essential amino acids. HepG2 cells were seeded in the complete medium and incubated at 37 °C with 5 % CO
2. When the cell confluence grew to 80 % - 90 %, the passage was carried out at a ratio of 1:3. According to the method of Cao et al., hyperglycemic model was established through insulin induction [
22].
2.7.2. Toxicity Test of HepG2 Cells
HepG2 cells in logarithmic growth stage were inoculated with 4 × 10
4 cells per well in a 96-well plate and cultured at 37 °C and 5 % carbon dioxide for 24 h. After the cell coverage reached 80 %, 100 µL of sangenone D and kuwanon G with different concentrations were added for 24 h. Then, 100 µL CCK-8/ complete culture solution (1:9) was added to each well, and the absorbance at 450 nm was measured by enzymoleter after 1 h culture.
2.7.3. Determination of Cellular Glucose, TC and TG Content
The sample concentration used in this experiment was determined by CCK8 experiment. HepG2 cells were inoculated with 2 × 10⁵ in a 12-well plate and cultured for 24 h. After being attached to the wall, the samples containing different concentrations were replaced and the cells were treated for 24 h. The relevant indexes were determined by kit method according to the instructions of the manufacturer.
2.7.4. Western Blotting
The tissue proteins were extracted with cold total protein extraction buffer (TPEB) and protein concentration was determined by bicinchoninic acid assay (BCA) method. 20 μg of protein samples were separated by SDS-PAGE and transferred to a polyvinylidene difluoride (PVDF) membrane. The membrane was washed with PBST for 5 min, then incubated with 5% skim milk at room temperature for 1 h. Subsequently, the membrane was cleaned with PBST five times for 5 min and incubated overnight at 4°C with the primary antibody. Finally, the membrane was incubated with the secondary antibody at room temperature for 1 h.
2.8. Statistical Analysis
The experiments were conducted in triplicate, and data analysis was performed with Graphpad software (GraphPad Software Co., Ltd., Santiago, CA, USA). One-way ANOVA was used to assess differences, with statistical significance set at p < 0.05.
3. Results and Discussion
3.1. α-Glucosidase Inhibition Rate
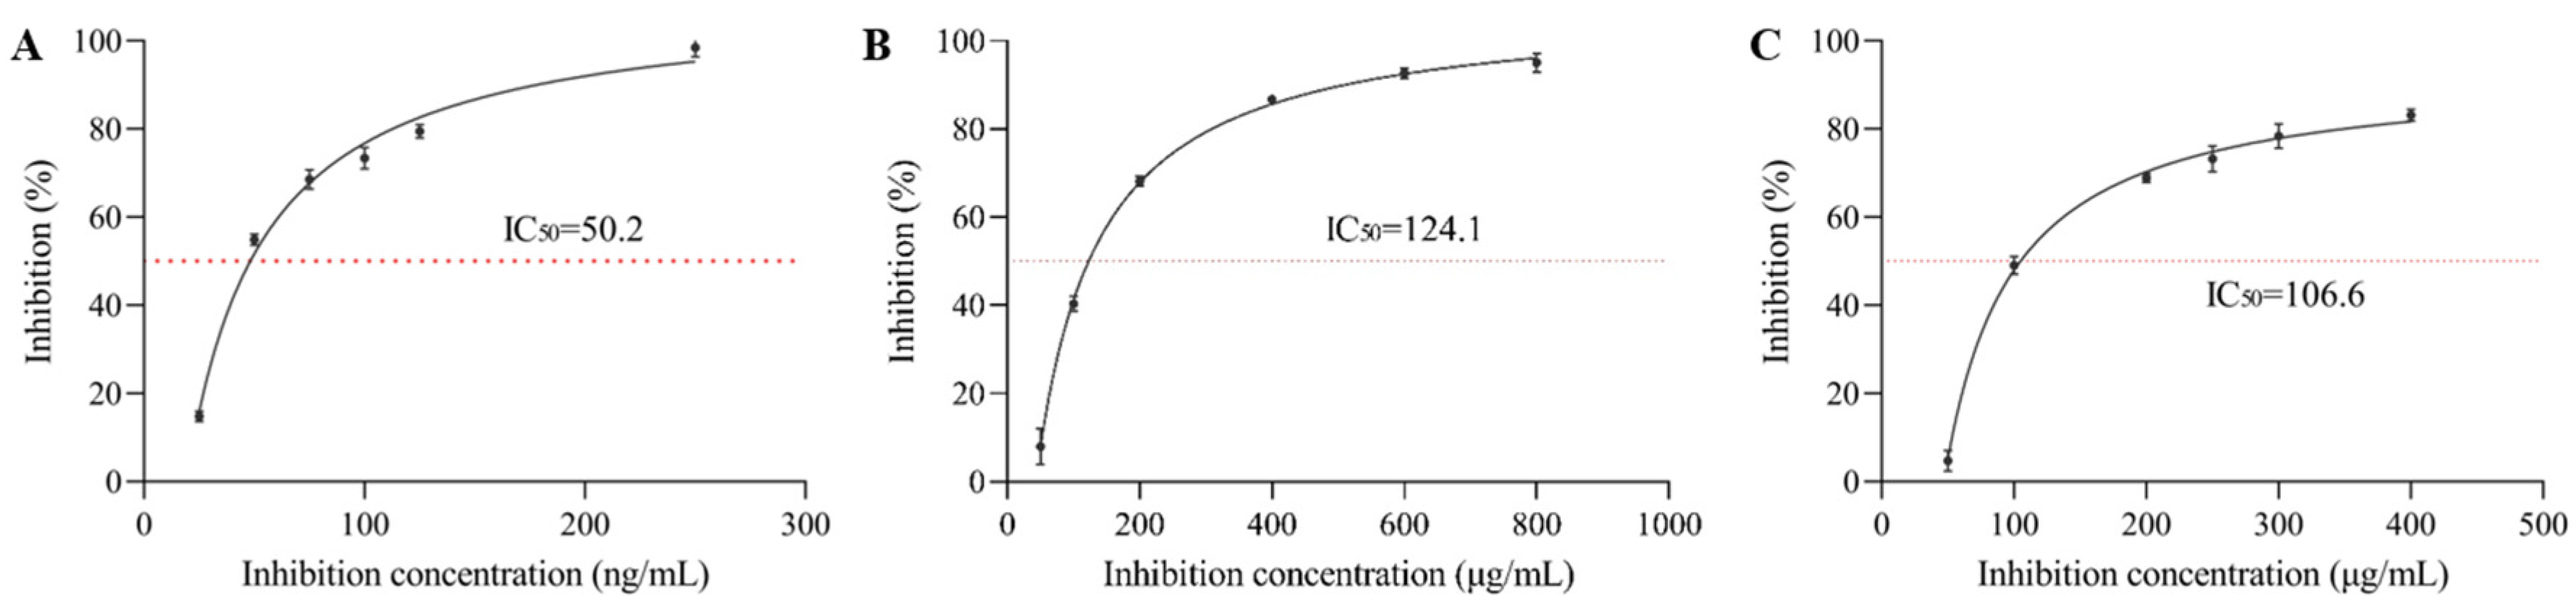
The properties of essential groups in enzyme molecules are changed by the influence of certain substances, resulting in the reduction or loss of enzyme activity called inhibition. As shown in
Figure 1, the inhibition rate of α-glucosidase by acarbose (positive control), sangenone D and kuwanon G increased with higher compound concentration in a dose-dependent manner. The semi-inhibitory concentration values of acarbose, sangenone D and kuwanon G were 3.10 × 10
-7 mol/L, 4.51 × 10
-5 mol/L and 3.83 × 10
-5 mol/L, respectively, which indicated that kuwanon G had higher inhibitory activity on α-glucosidase than sangenone D, while lower than acarbose. Although there is a certain gap compared to positive drugs, the activity is relatively strong when compared with other reported natural product compounds. For example, the IC
50 of ferulic acid for α-glucosidase was 0.866 mg/mL [
23], and the IC
50 of the dodecyl-acylated derivatives of phlorizin and polydatin for α-glucosidase were 55.10 and 70.95 μM, respectively [
24]. Compared with kuwanon G, sangenone D was cyclized, which weakened the activity of isopentenyl group and reduced one phenolic hydroxyl group, resulting in less hydrogen bonding with amino acid residues at the active site of α-glucosidase, herein, the decreased inhibitory activity, which was also verified in subsequent molecular docking simulations [
25].
3.2. Inhibition Type on α-Glucosidase Activity
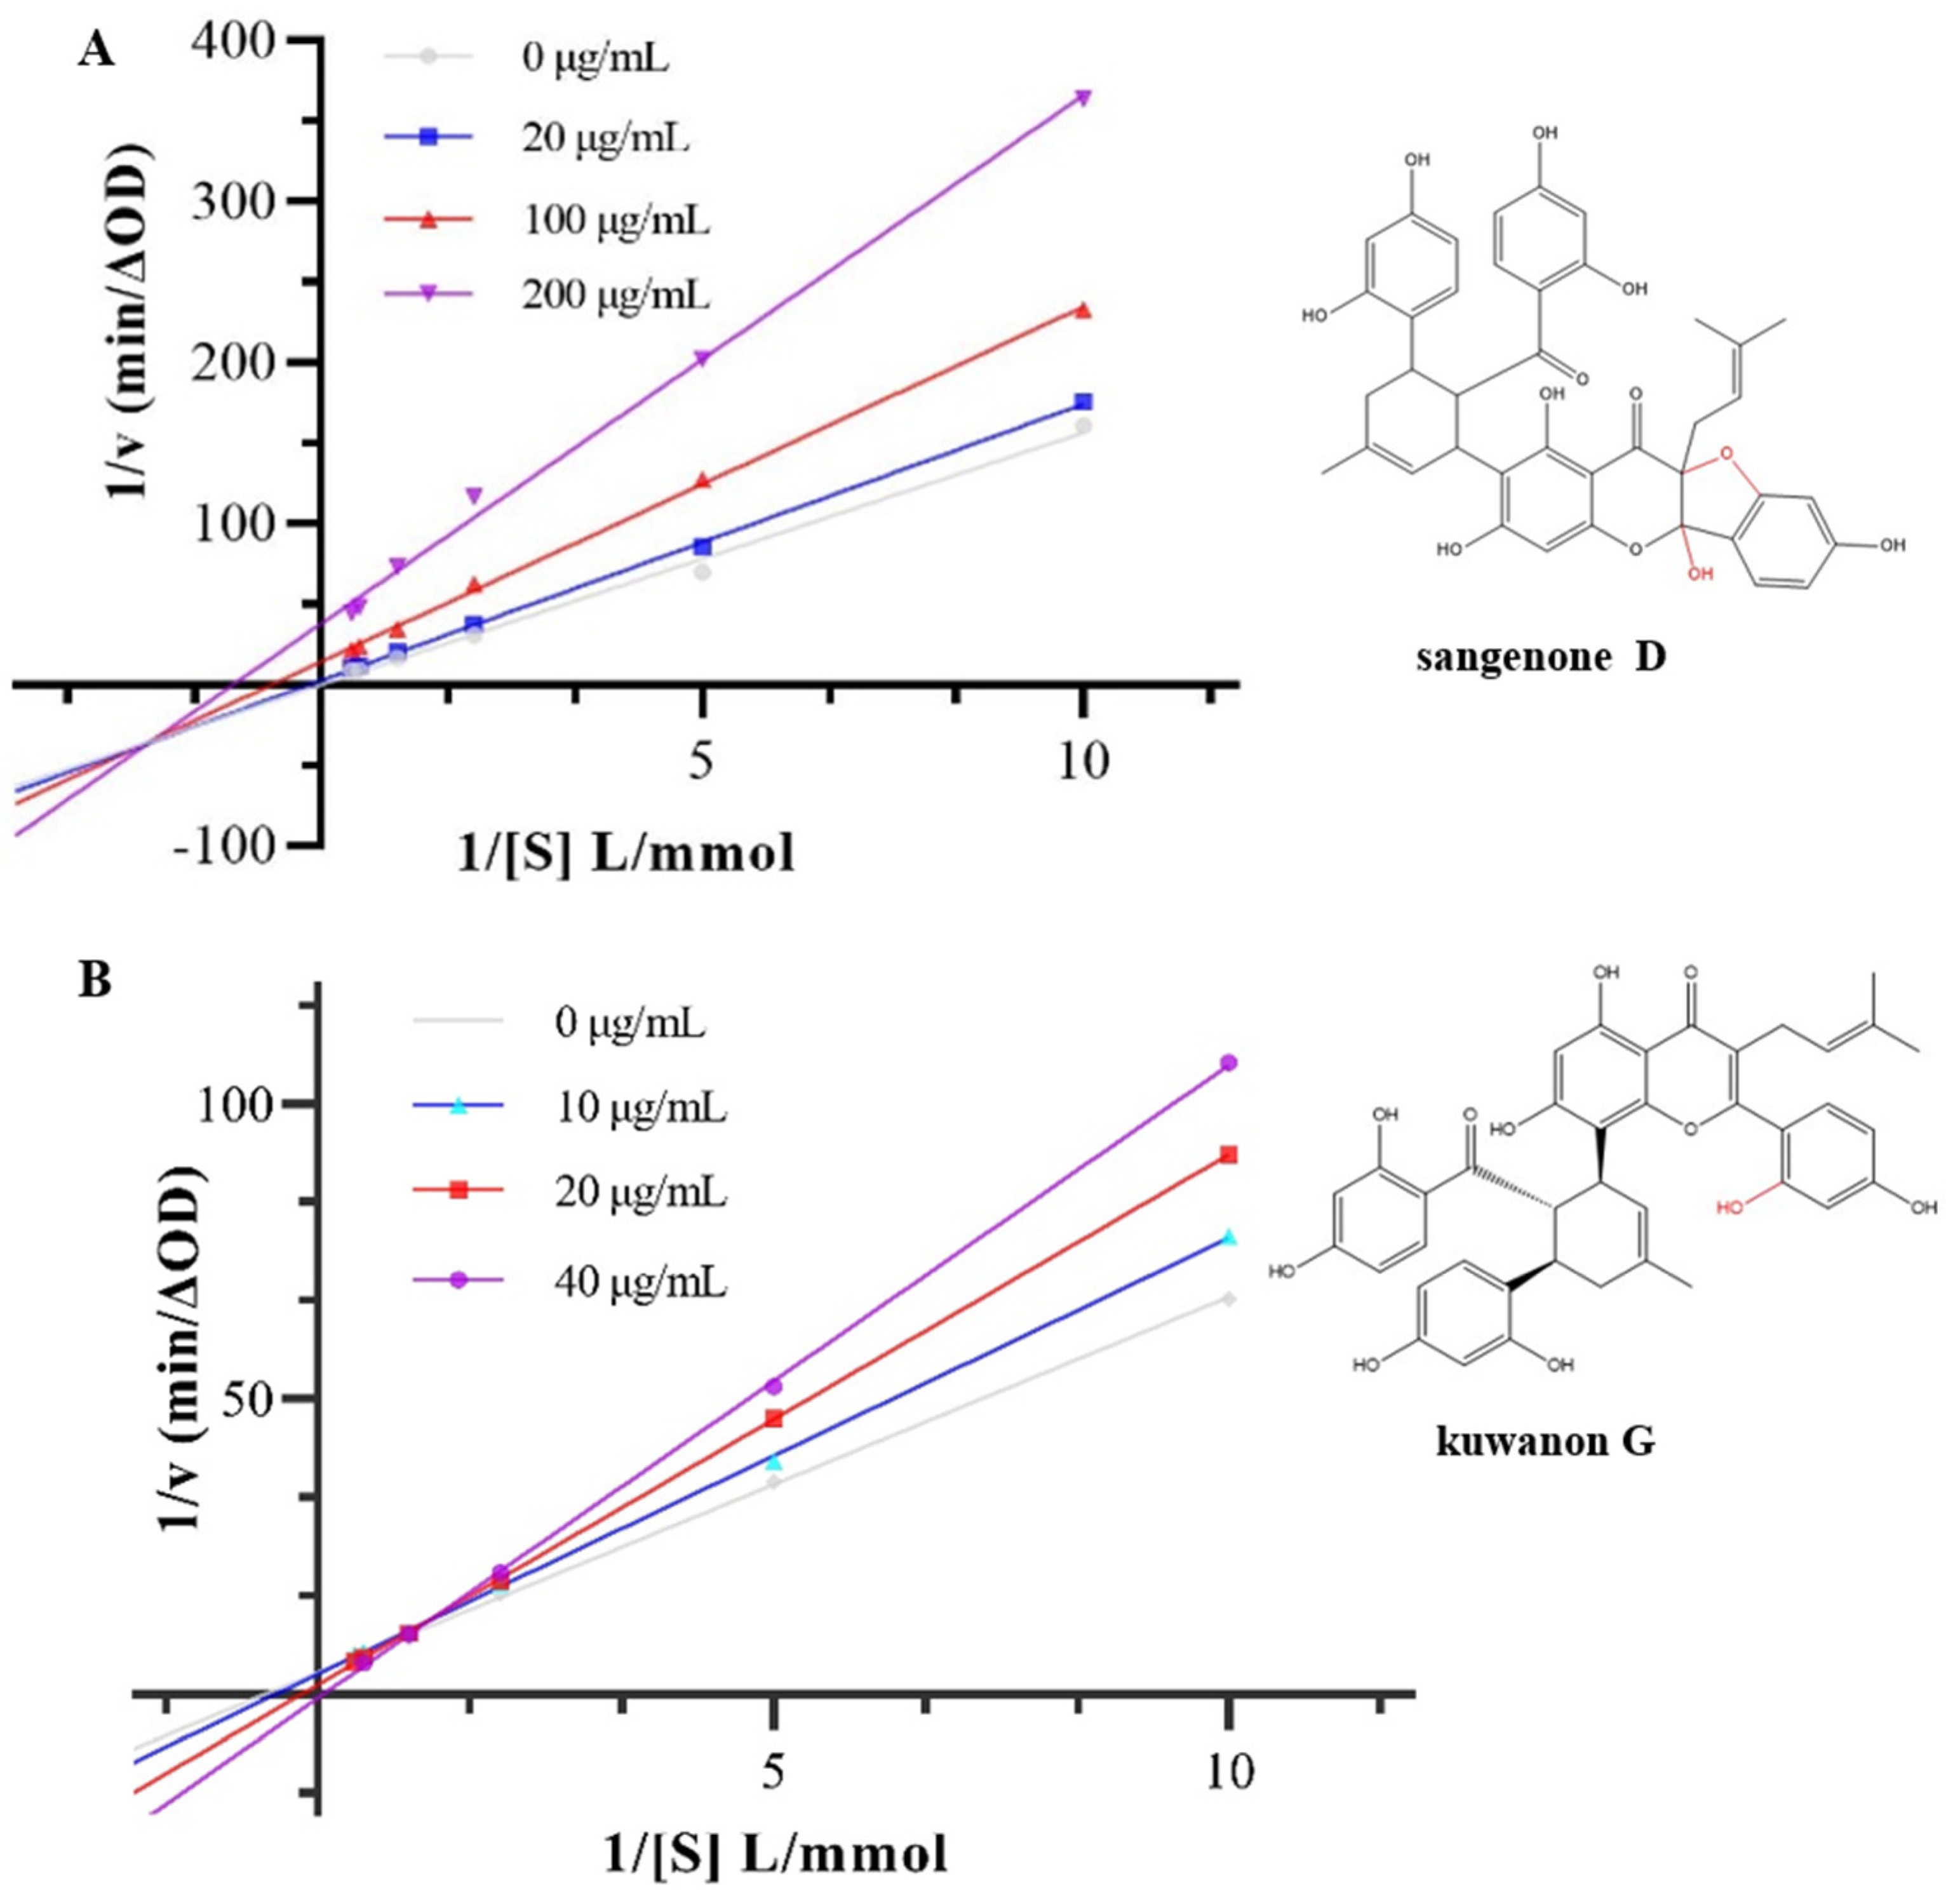
The inhibition type of α-glucosidase was determined according to the intersections in the Lineweaver Burk diagram [
26]. The Lineweave-Burk curves of sangenone D and kuwanon G with α-glucosidase were exhibited in
Figure 2. The double reciprocal curves of different concentrations of sangenone D intersected in the third phase quadrant. The slope of the line increased with the increase of sangenone D concentration, while both Km and the Vm decreased, which indicated the mixed inhibition of non-competitive and anti-competitive [
27]. The double reciprocal curves of kuwanon G intersected in the first quadrant of the phase diagram. With the increase of kuwanon G concentration, the Km value increased while the Vm value decreased, which represented the competitive inhibition type [
17]. The curves in the
Figure 2 showed a strong linear correlation, suggesting that the two phenolic compounds interact with α-glucosidase through one or a group of binding sites [
28]. The reason for the different inhibition types might be that cyclization lead to a change from a single competitive inhibition to a mixed inhibition, which weakened its inhibitory effect. However, due to little change in the overall structure, cyclization does not lead to a change in the number of inhibitory sites, which was still one or a group of binding sites. According to
Table 1, the Kis values of sangenone D and kuwanon G were lower than Ki values, suggesting that their interaction with α-glucosidase-substrate complex was weaker than α-glucoglycinase-substrate complex [
29].
3.3. Fluorescence Spectroscopy Analysis of Binding Mechanism and Properties
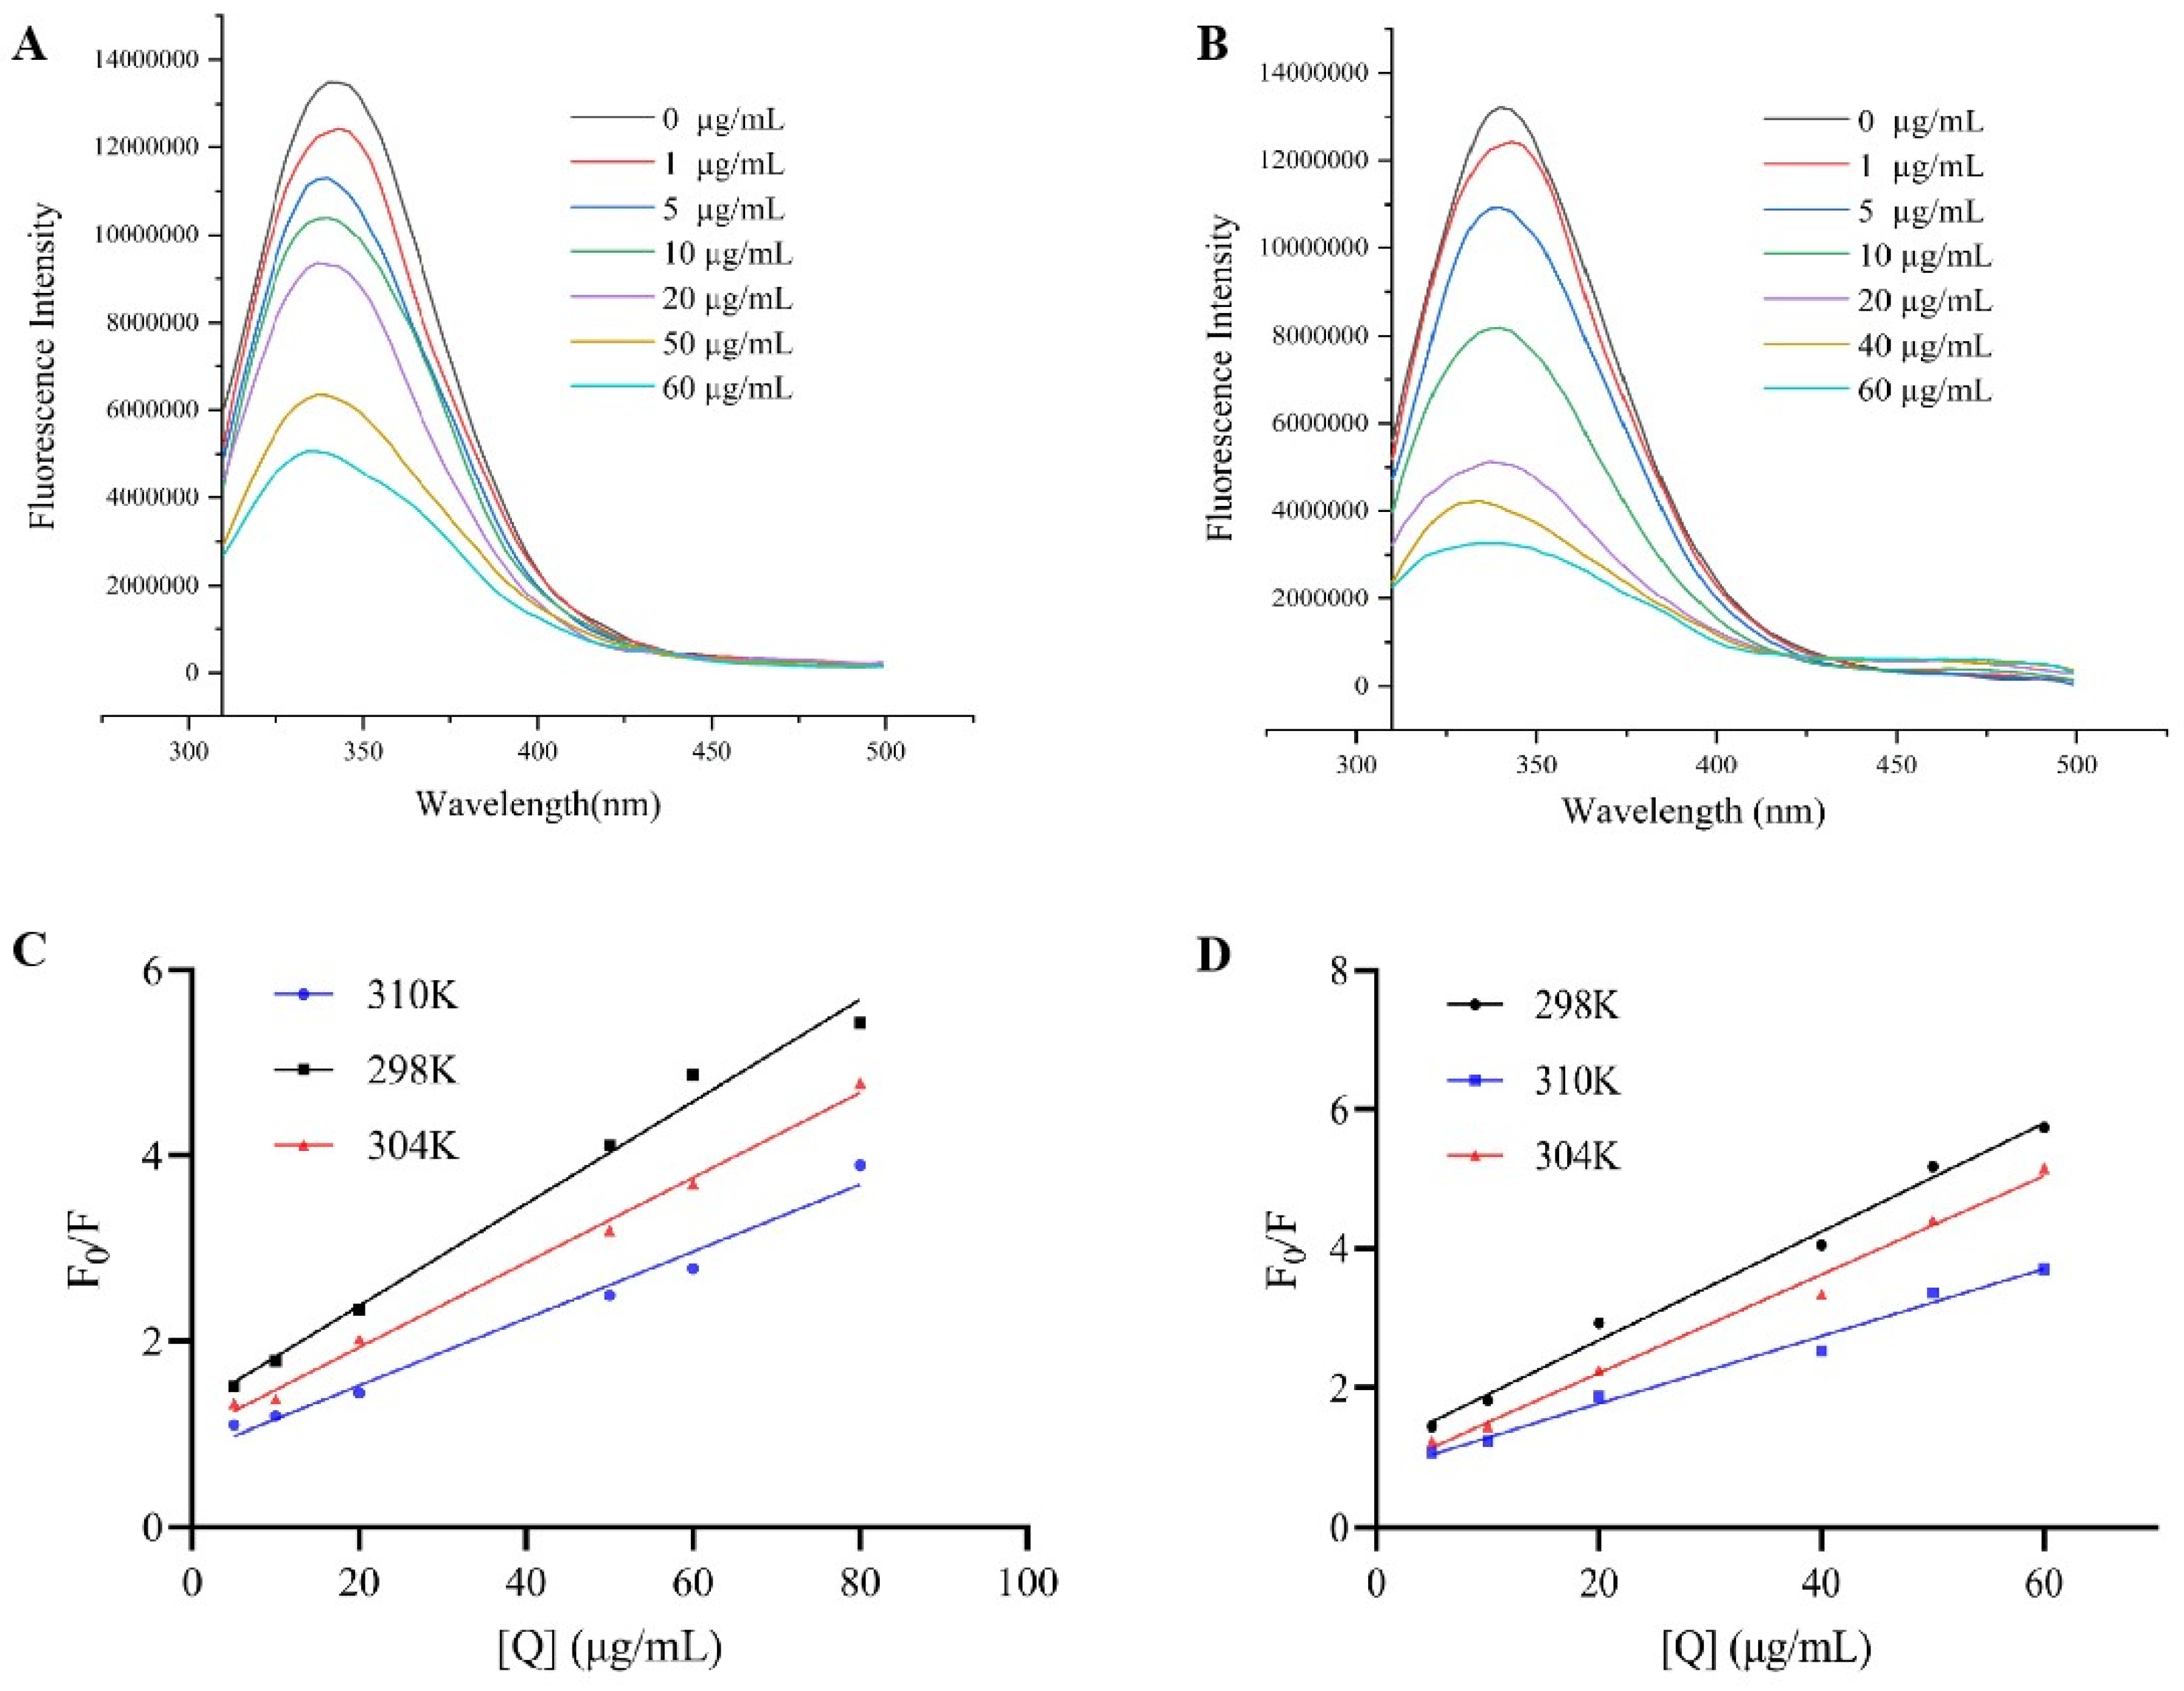
The aromatic amino acids in α-glucosidase produced endogenous fluorescence when exposed to a specific excitation wavelength. The fluorescence intensity together with the position of the maximum emission wavelength were affected by the enzyme folding state and the environment surrounding the aromatic amino acid residues [
30]. As shown in
Figure 3A,B, under 280 nm excitation, the α-glucosidase solution displayed notable fluorescence between 300 and 500 nm, with the peak occurring at 340 nm. The fluorescence intensity of α-glucoglycase declined progressively as the concentration of sangenone D and kuwanon G increased, and the maximum emission wavelength of the mixed solution shifted blue with regularity. These results indicated that sangenone D and kuwanon G could quench the endogenous fluorescence of the enzyme by interacting with α-glucosidase.
Fluorescence quenching occurs in two forms: static quenching and dynamic quenching. In static quenching, non-fluorescent products are formed through the interaction of quenchers with fluorophores, with the quenching constant decreasing as temperature rises. Dynamic quenching occurs when excited fluorescent molecules collide with quenchers, leading to a decrease in fluorescence intensity, and its quenching constant increases with rising temperature [
31]. The type of Stern-volmer quenching curve, the change of static quenching constant at different temperatures and the apparent quenching rate constant are the important basis for judging the quenching type [
32]. The Stern-Volmer quenching curve exhibited a nice linear correlation when F0/F is plotted against [Q], and the quenching constant (Ksv) value decreases as the temperature increases. Moreover, the Ksv value aligned with the α-glucosidase inhibitory activity, following the order: kuwanon G > sangenone D (
Figure 3C,D). In addition, the quenching rate constant (Kq) values for both compounds exceeded the maximum diffusion-controlled quenching constant of 2.0 × 10
10 L/(mol·s), illustrating that the quenching of α-glucosidase by sangenone D and kuwanon G were of the static quenching type [
33]. As shown in
Table 2, Ka value was negatively correlated with temperature, which was consistent with the change of Ksv, indicating that sangenone D, kuwanon G and α-glucosidase form an unstable complex, and the binding force of the interaction between the two was destroyed by the increase of temperature, and the stability of the complex decreased with the increase of temperature, which accorded with the general characteristics of static quenching type. In addition, at the experimental temperature, the value of n was close to 1, which could be inferred that there was only one binding site on the α-glucosidase for sangenone D and kuwanon G.
3.4. FT-IR Analysis
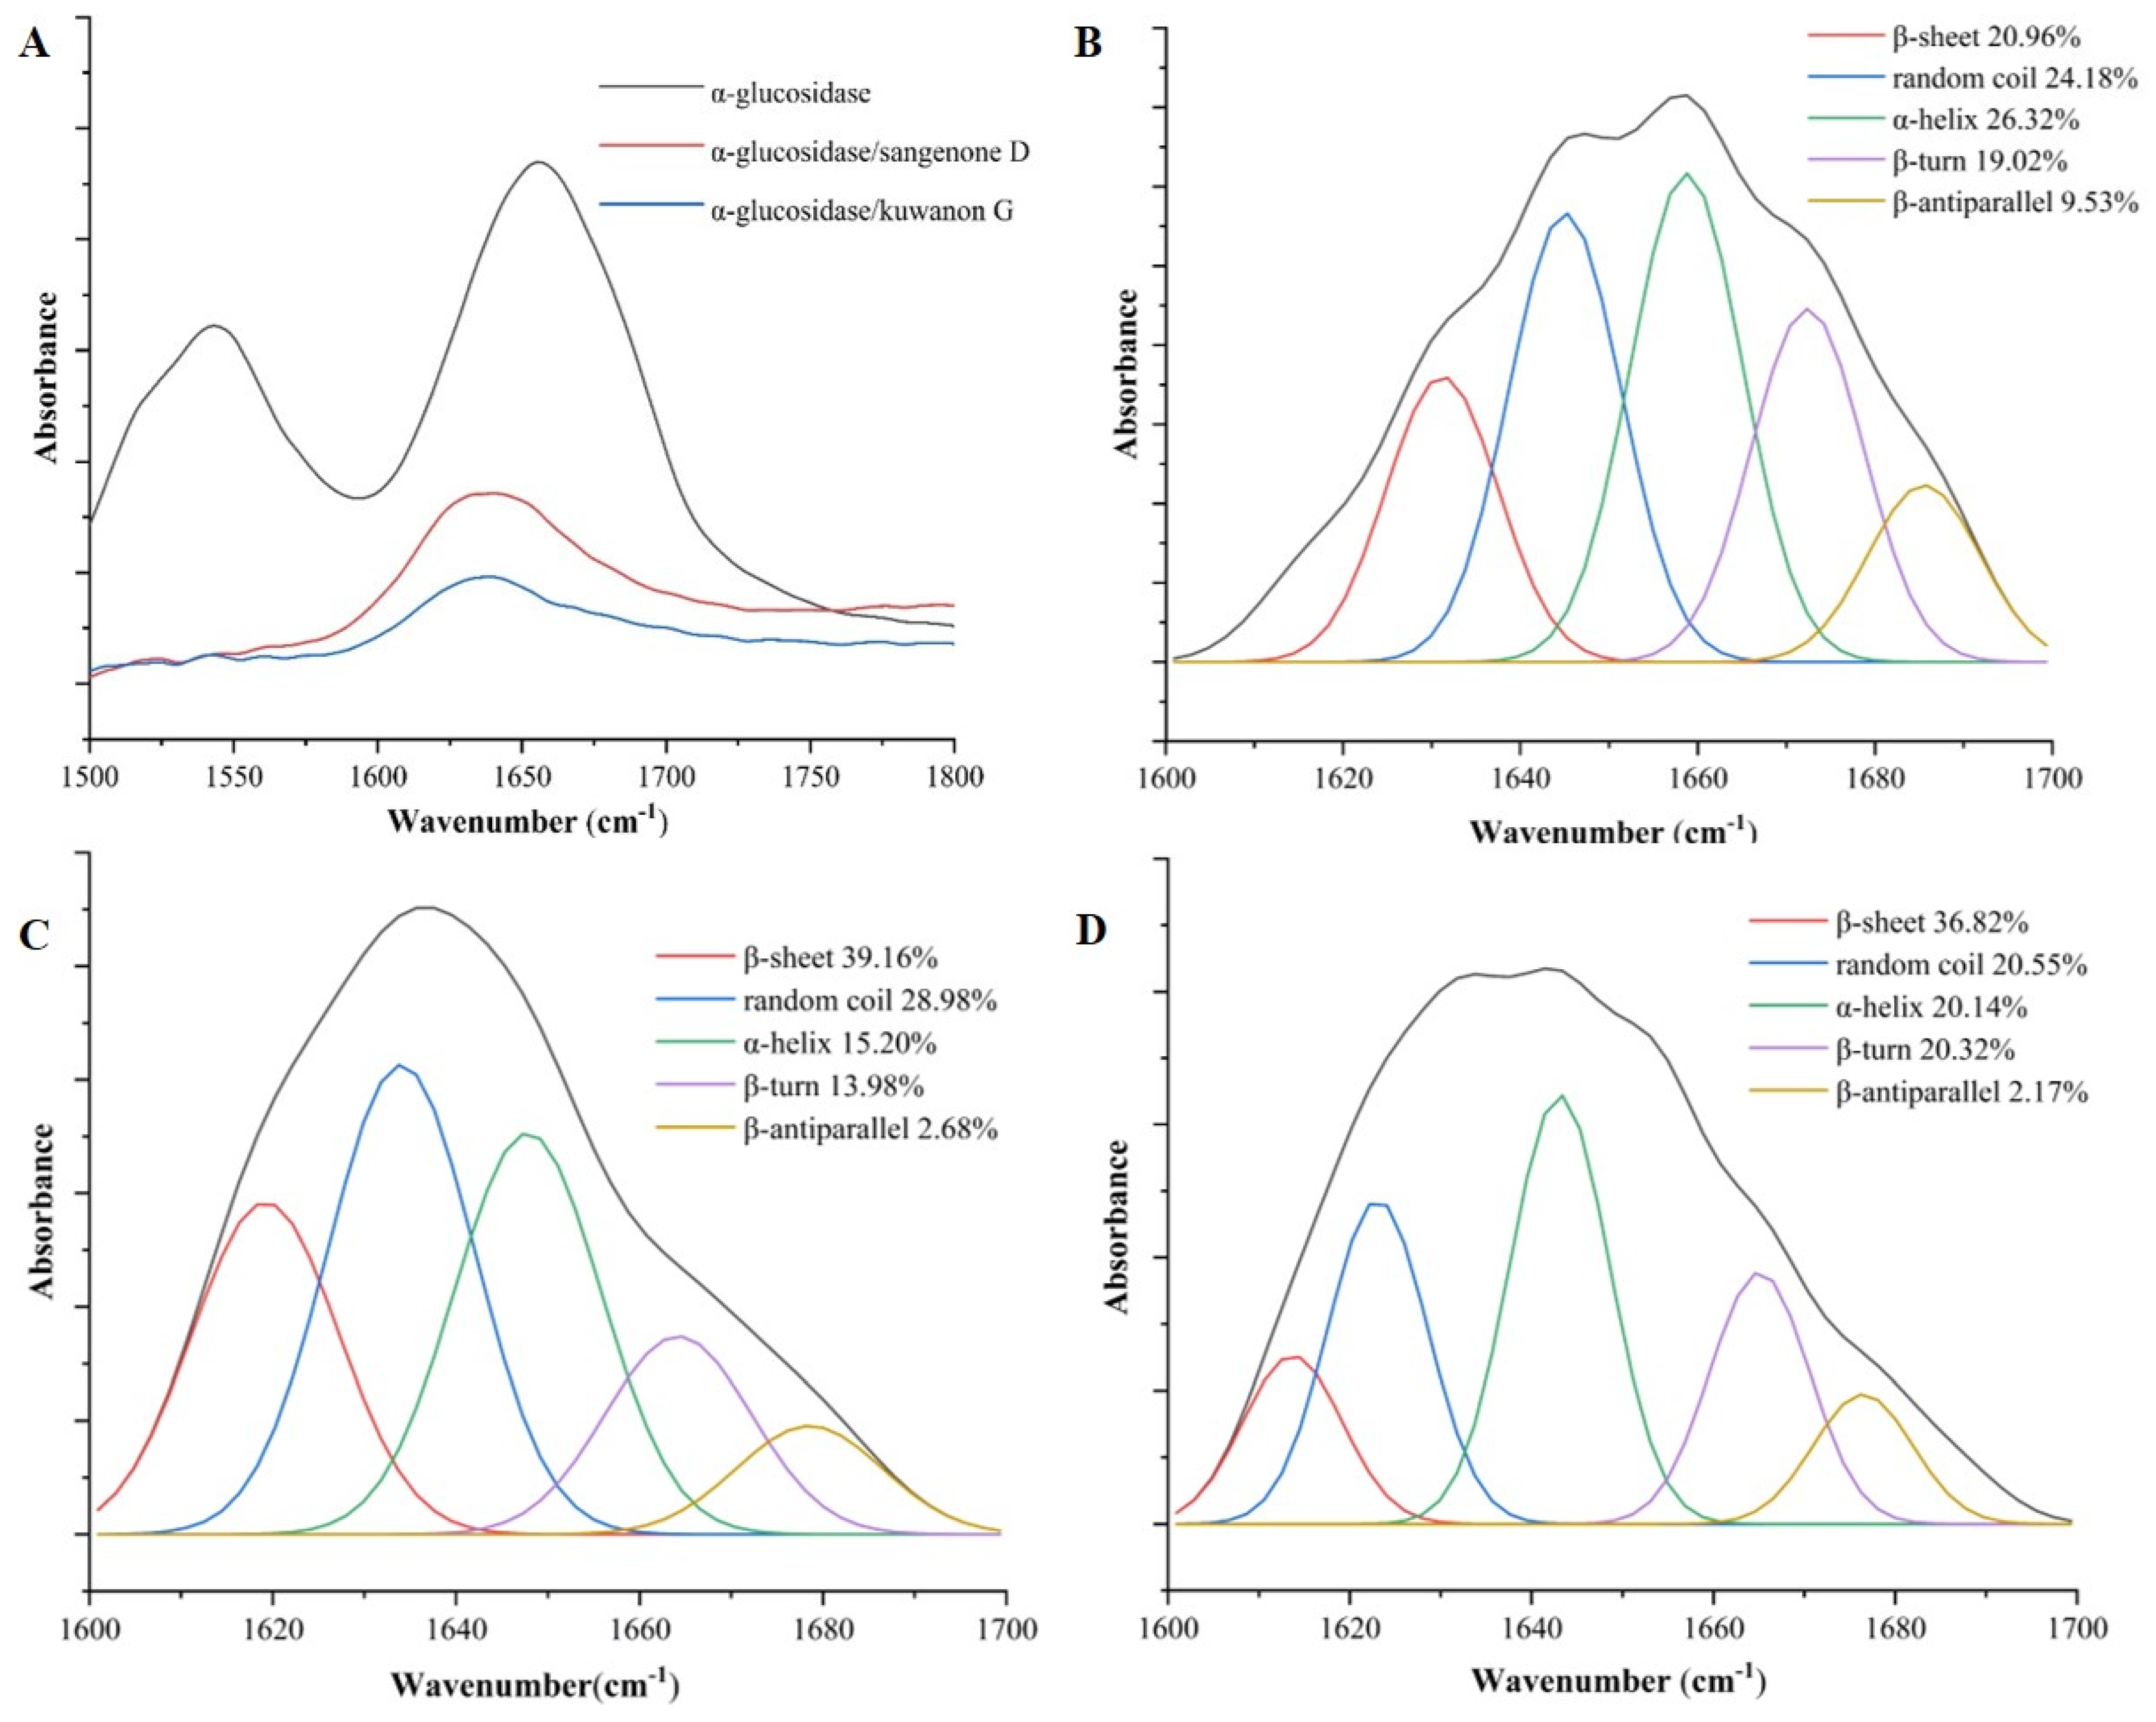
The secondary structure of the protein was altered upon interaction with phenolic compounds [
34]. The effects of sangenone D and kuwanon G on the secondary conformation of α-glucosidase were analyzed using FT-IR spectroscopy. Because the amide Ι band produced by the C=O double bond stretching vibration is more responsive to changes in protein secondary structure than the amide ΙI band, this study mainly used the amide Ι band to quantitatively analyze the change of α-glucosidase secondary structure [
35]. As shown in
Figure 4A, after adding sangenone D and kuwanon G to α-glucosidase, the peak position of the amide Ι band moved left from 1656 cm
-1 to 1639 cm
-1 and 1637 cm
-1, respectively. Besides, The free α-glucosidase contained 26.32% α-helix, 20.96 % β-sheet, 19.02 % β-turn, 9.53 % β-antiparallel, and 24.18 % random coil, respectively (
Figure 4B). With the addition of sangenone D and kuwanon G, α-helix of the α-glucoglycase complex was reduced to 15.20 %, 19.46 %, β-antiparallel was reduced to 2.67 %, 2.17 %, while β-sheet was increased to 39.16 %, 36.82 %, respectively. These findings indicated that the secondary conformation of α-glucosidase was altered by sangenone D and kuwanon G (
Figure 4C,D). The secondary structure around the catalytic site of α-glucosidase was crucial for maintaining enzyme activity stability [
36]. With the addition of inhibitors, α-helix content dropped significantly and β-sheet content rose obviously, which were speculated to relate to the decrease of α-glucosylase activity. The effect of sangenone D and kuwanon G on secondary structure was different obviously, which might be the reason for their different inhibitory activities on α-glucosidase.
3.5. Molecular Docking
3.5.1. Docking Mode Analysis
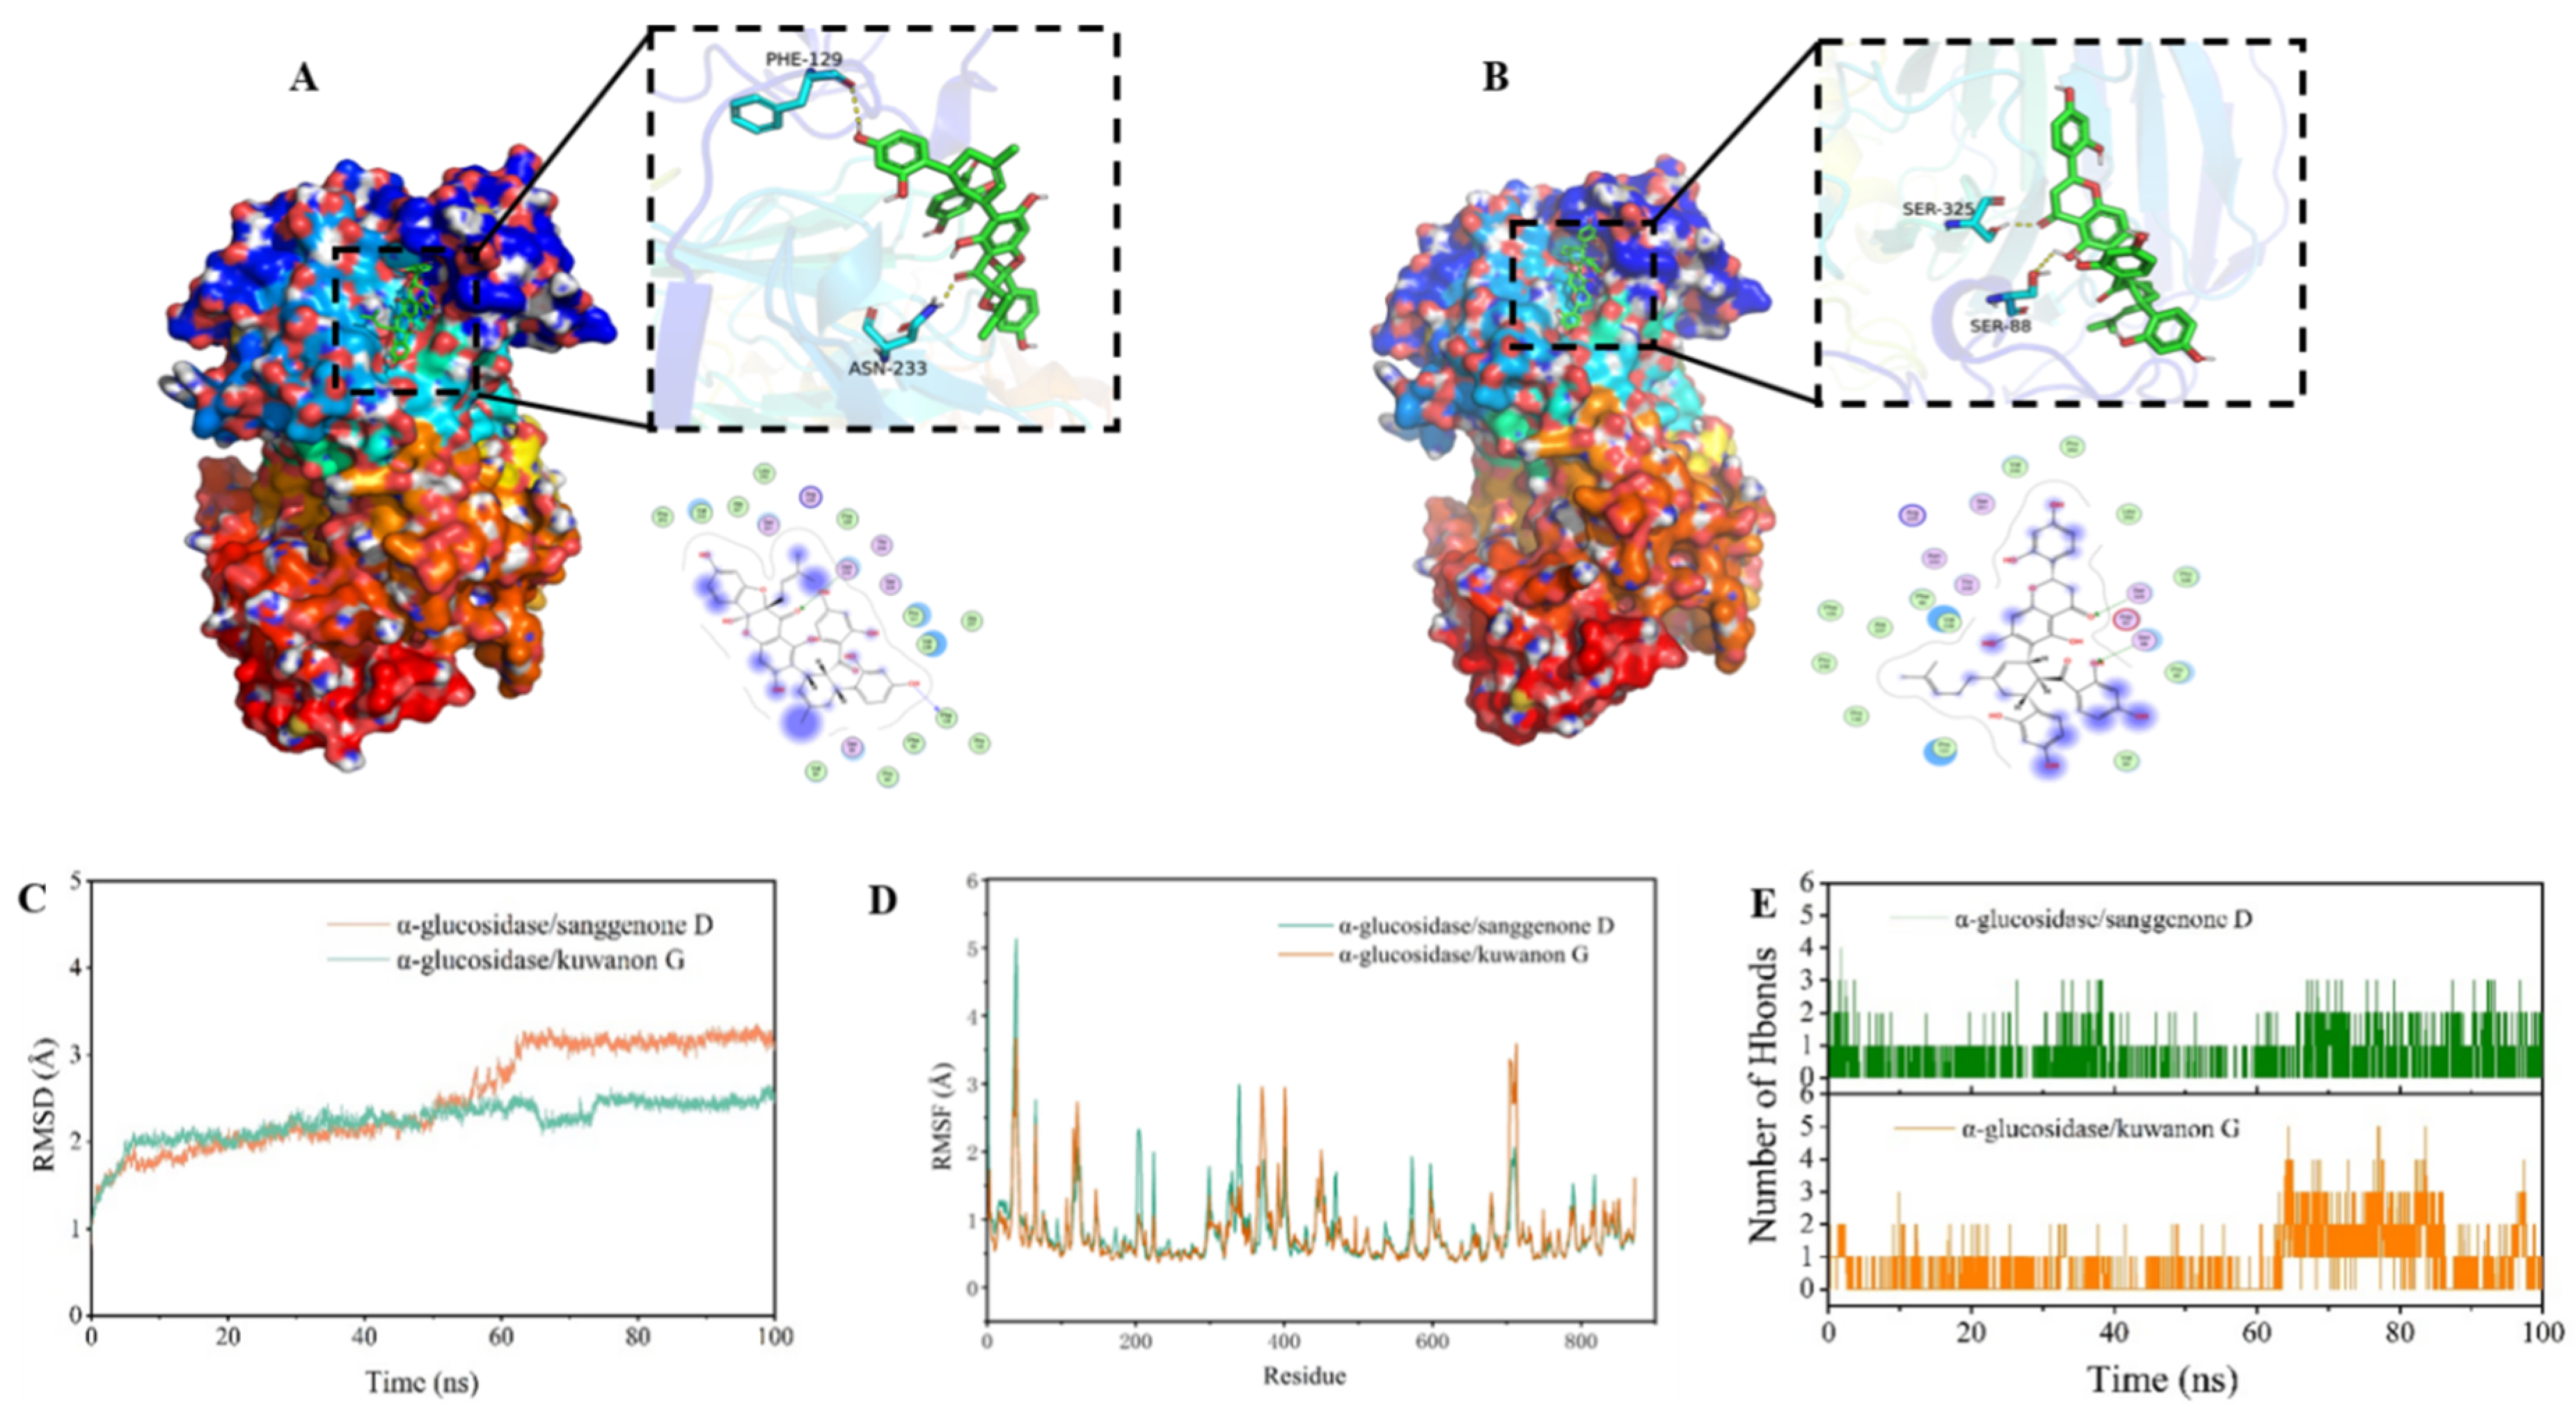
To further investigate the inhibition mechanism and exacted binding site on α-glucosidase, sangenone D and kuwanon G were molecular-docked with α-glucosidase, respectively. The negative binding affinity indicated the spontaneous binding between the compound and α-glucosidase, with a larger absolute value indicating a stronger binding force and improved docking effect [
37]. In this study, the values of binding affinity of sangenone D/α-glucosidase and kuwanon G/α-glucosidase were -7.73 and -7.94 kcal/mol, respectively, indicating that kuwanon G had a better inhibitory effect on α-glucosidase, which was consistent with the previous IC
50 results.
As demonstrated in
Figure 5, sangenone D and kuwanon G attach to the active pocket inside the α-glucosidase protein. As could be observed from the mutual detail map, the binding sites of sangenone D complex were PRO-253, VAL-230, ALA-327, PRO-326, PRO-131, VAL-236, PH-90, PRO-85, VAL-84, PH-129, ASN-233, SER-251, SER-88, and SER-325 amino acid construction. Among them, there was hydrophobic interaction with PRO-253, VAL-230, ALA-327, PRO-326, PRO-131, VAL-236, PH-90, PRO-85, VAL-84 and PH-129, and hydrogen bonding with PH-129 and ASN-233 (
Figure 5A). In the same way, the binding sites of kuwanon G complex are VAL-230, PRO-253, LEU-252, PRO-326, PRO-85, VAL-84, VAL-236, PH-90, ALA-237, PRO-238, PRO-130, PRO-131, SER-325, and SER-88 amino acid construction. Among them, hydrophobic effects were observed between kuwanon G and VAL-230, PRO-253, LEU-252, PRO-326, PRO-85, VAL-84, VAL-236, PH-90, ALA-237, PRO-238, PRO-130, and PRO-131, and hydrogen bonding occurred with SER-325 and SER-88 at the site (
Figure 5B). These interactions were the primary factor that ensures the stable combination between small molecules and α-glucosidase. In a word, these results indicated that the compounds interacted with the amino acid residues of α-glucosidase, thereby occupying the active site and inhibiting the activity of the enzyme. Besides, the hydrophobic forces and hydrogen bonds were the main driving forces of the interaction [
38].
3.5.2. MD Simulation
The root mean square deviation (RMSD) in molecular dynamics simulations indicates the movement of the complex. A higher RMSD with larger fluctuations suggest more intense motion, while a lower RMSD indicate less movement [
39]. As shown in
Figure 5C, RMSD fluctuated less during the simulation of α-glucosidase/sanggenon D and α-glucosidase/kuwanon G complexes, which meant that the complex structure did not disintegrate, indicating a high stability in the binding of the small molecules to the protein. Additionally, the fluctuation of α-glucosidase/kuwanon G was relatively small, suggesting that kuwanon G bound more stably to the protein with better inhibition effect, which was consistent with the results of IC
50.
In molecular dynamics simulations, the root mean square fluctuation (RMSF) indicated the changes in protein flexibility [
40]. After binding to the protein, the drug typically reduces the protein’s flexibility, so as to stabilize the protein and play the role of inhibiting enzyme activity. As illustrated in
Figure 5D, apart from the local region of the protein, the RMSF of the protein was less than 2 angstroms, indicating that the main structural rigidity of α-glucosidase was very high, which might be due to the binding effect of the enzyme and the small molecules sanggenon D and kuwanon G with inhibitory effects.
Hydrogen bonding was among the strongest types of non-covalent interactions. The hydrogen bond count between ligand molecules and proteins was monitored over 100 ns during the molecular dynamics simulations. As depicted in
Figure 5E, the number of hydrogen bonds formed by α-glucosidase/sanggenon D and α-glucosidase/kuwanon G in the simulation process ranges from 0 to 6. Most of the α-glucosidase/sanggenon D data were concentrated within 1-2, while most of the α-glucosidase/kuwanon G complex data were concentrated within 2-3. In general, the inhibitory activity of flavonoids on α-glucosidase was correlated with the quantity and location of hydroxyl functionalities in the compounds, which in turn affects the number of hydrogen bonds [
33]. According to the present result, kuwanon G formed more hydrogen bonds with the α-glucosidase than sanggenon D, which contributed to understanding why kuwanon G has a better inhibitory effect than sanggenon D.
3.5.3. MM-GBSA Result
The binding energy was computed using the MM-GBSA method based on molecular dynamics simulation trajectories, offering a more precise assessment of the interaction between small molecules and target proteins. As shown in
Table 3, the combined energies of α-glucosidase/sanggenon D and α-glucosidase/ kuwanon G were -9.83 ± 2.44 and -13.83 ± 2.94 kcal/mol. A negative number indicated that both molecules had an affinity for the target protein, and a lower value for α-glucosidase/kuwanon G complex represented a stronger binding than α-glucosidase/sanggenon D. In addition, the main contribution of α-glucosidase/sanggenon D and α-glucosidase/ kuwanon G combination were van der Waals energy.
3.6. CCK-8 Assay
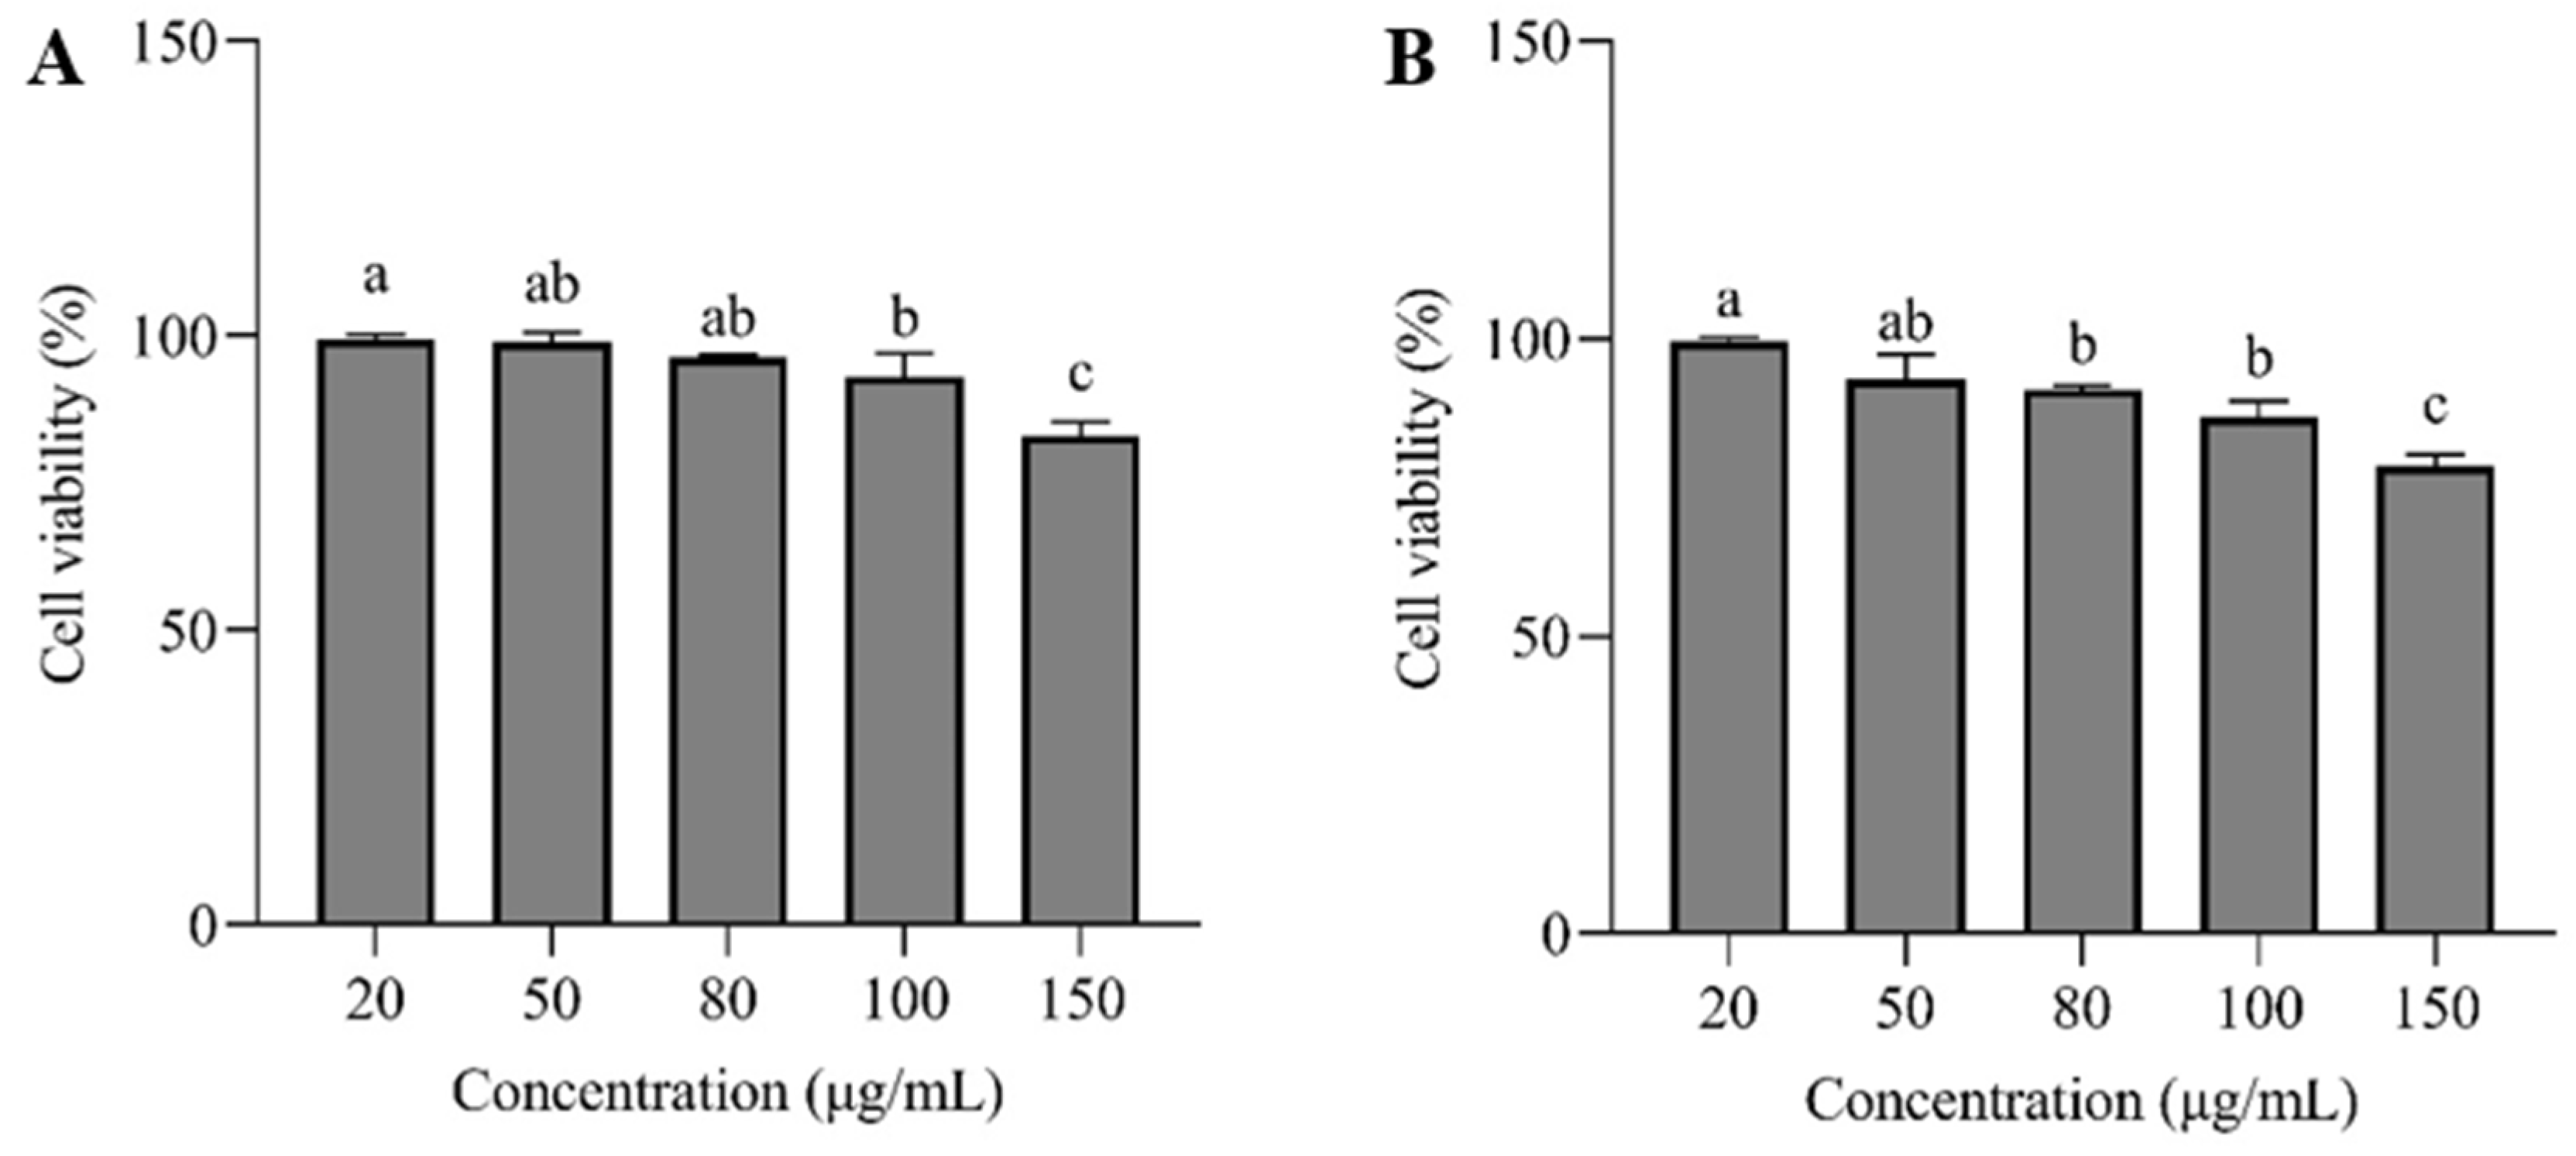
Cell survival assay is essential for assessing sample concentration and cytotoxicity. The cytotoxicity test results of HepG2 treated with sanggenon D and kuwanon G are shown in
Figure 6. When the concentrations of sanggenon D and kuwanon G were less than 100 and 80 μg/mL, respectively, the survival percentage of HepG2 cells remained above 90 %, reflecting that sanggenon D and kuwanon G were safe for HepG2 cells within this concentration range. This provided a reference for selecting the appropriate concentration range for subsequent experiments.
3.7. Glucose, TC, TG Contents
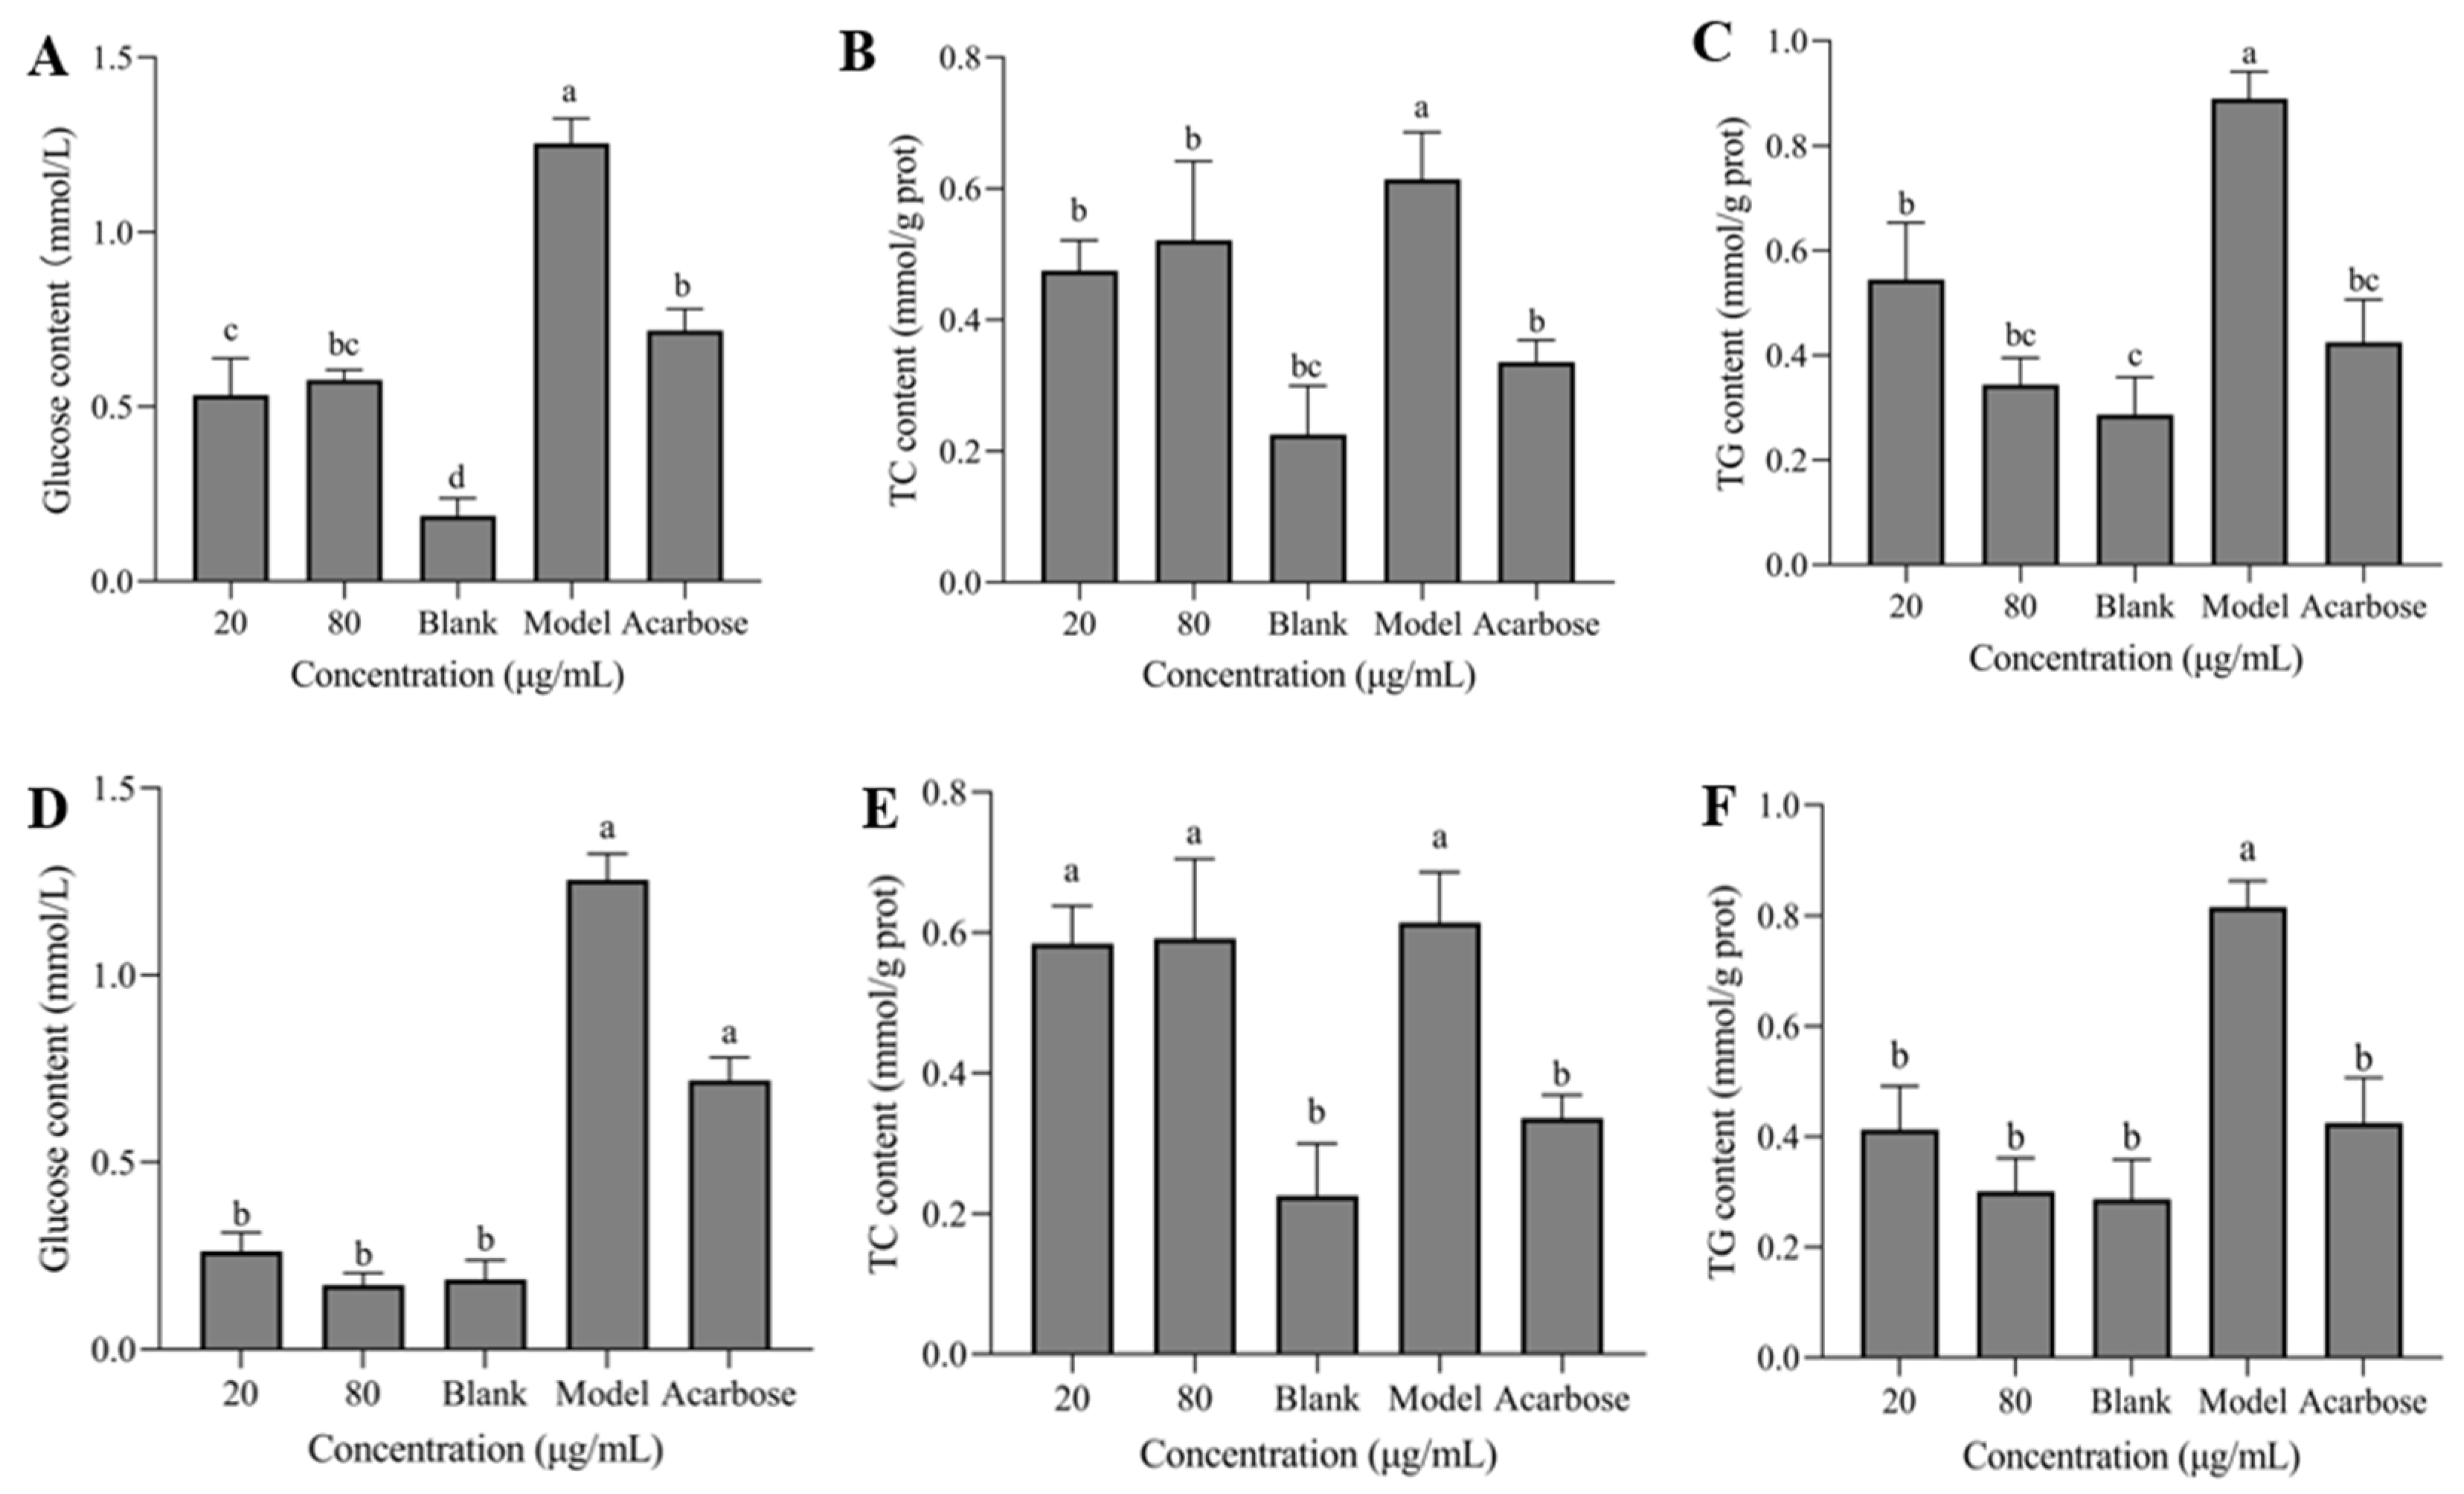
In
Figure 7A–F, the model group showed significantly higher levels of intracellular glucose, TC, and TG compared to the blank group. Compared with the model group, the contents of glucose, TC and TG in HepG2 cells were significantly reduced following the treatment with different concentrations of sanggenon D and kuwanon G, and no significant difference was shown between samples with different concentrations, which exhibited better inhibitory effect than the positive control basically.
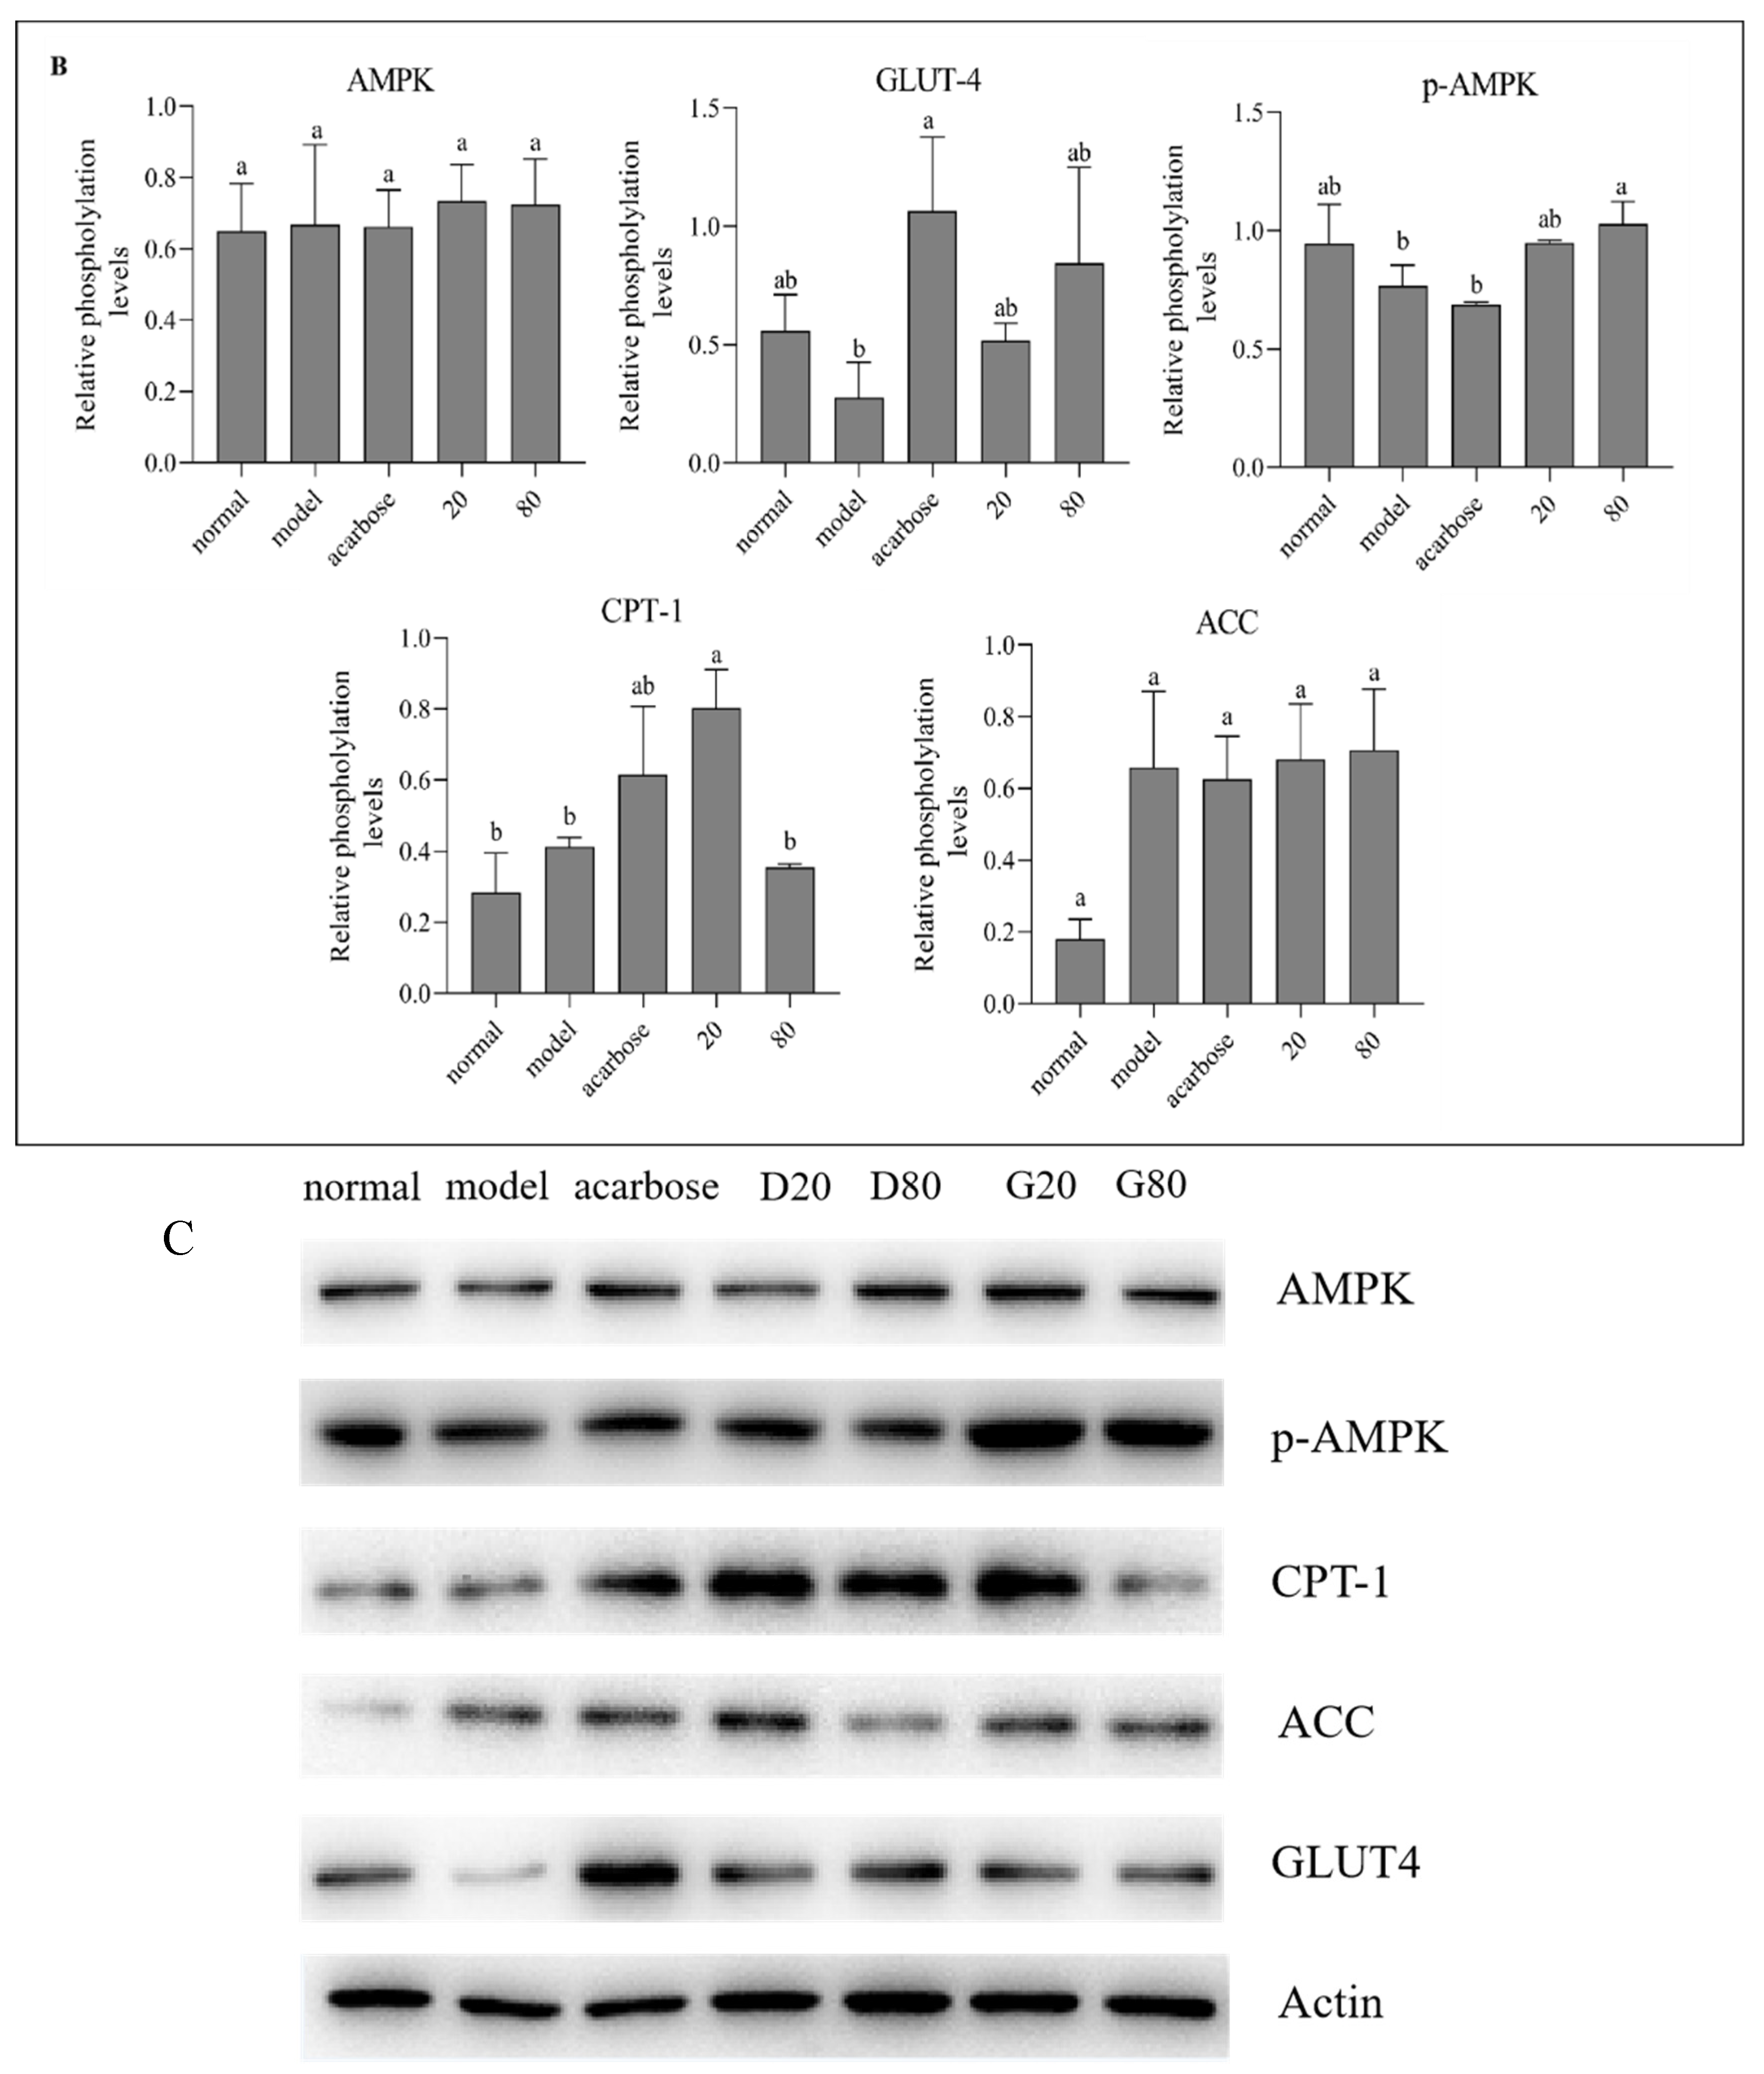
3.8. Western Blot Analysis
The primary pathological basis of T2DM is insulin resistance, characterized by decreased insulin sensitivity and impaired glucose metabolism in insulin-targeted tissues [
41]. Multiple pathways were involved in IR biological signal transduction. Adenosine 5‘-monophosphate (AMP)-activated protein kinase (AMPK) is a metabolic regulator, widely involved in the glycolipid metabolic process, has become a new clinical treatment target for metabolic diseases based on IR [
42]. Glucose transporter type 4 (GLUT4), an insulin-modulated glucose transporter in the AMPK pathway, enhances insulin sensitivity and glucose tolerance in adipose tissue when highly expressed [
43]. Therefore, the corresponding dietary intervention targeting AMPK-GLUT4 signaling pathway is beneficial for improving the diabetic metabolic and reduce insulin resistance. Studies have shown that polyphenols such as quercetin mainly enhance glucose absorption in muscle and adipose cells by activating the AMPK pathway, which translocates GLUT4 to the plasma membrane [
44,
45]. Korean red pepper polyphenol extract stimulated muscle cell uptake of glucose by activating AMPK, which regulating peroxisome proliferator-activated receptor gamma (PPAR-γ) and acetyl-CoA carboxylase (ACC) expression negatively [
46]. p-Coumaric acid promoted the phosphorylation of AMPK, increased the phosphorylation of ACC and the mRNA expression of carnitine palmitoyltransferase1 (CPT-1) in L6 skeletal muscle cells, thereby facilitating the β-oxidation of fatty acids, reducing the deposition of triglycerides, and promoting glucose absorption of cells [
47].
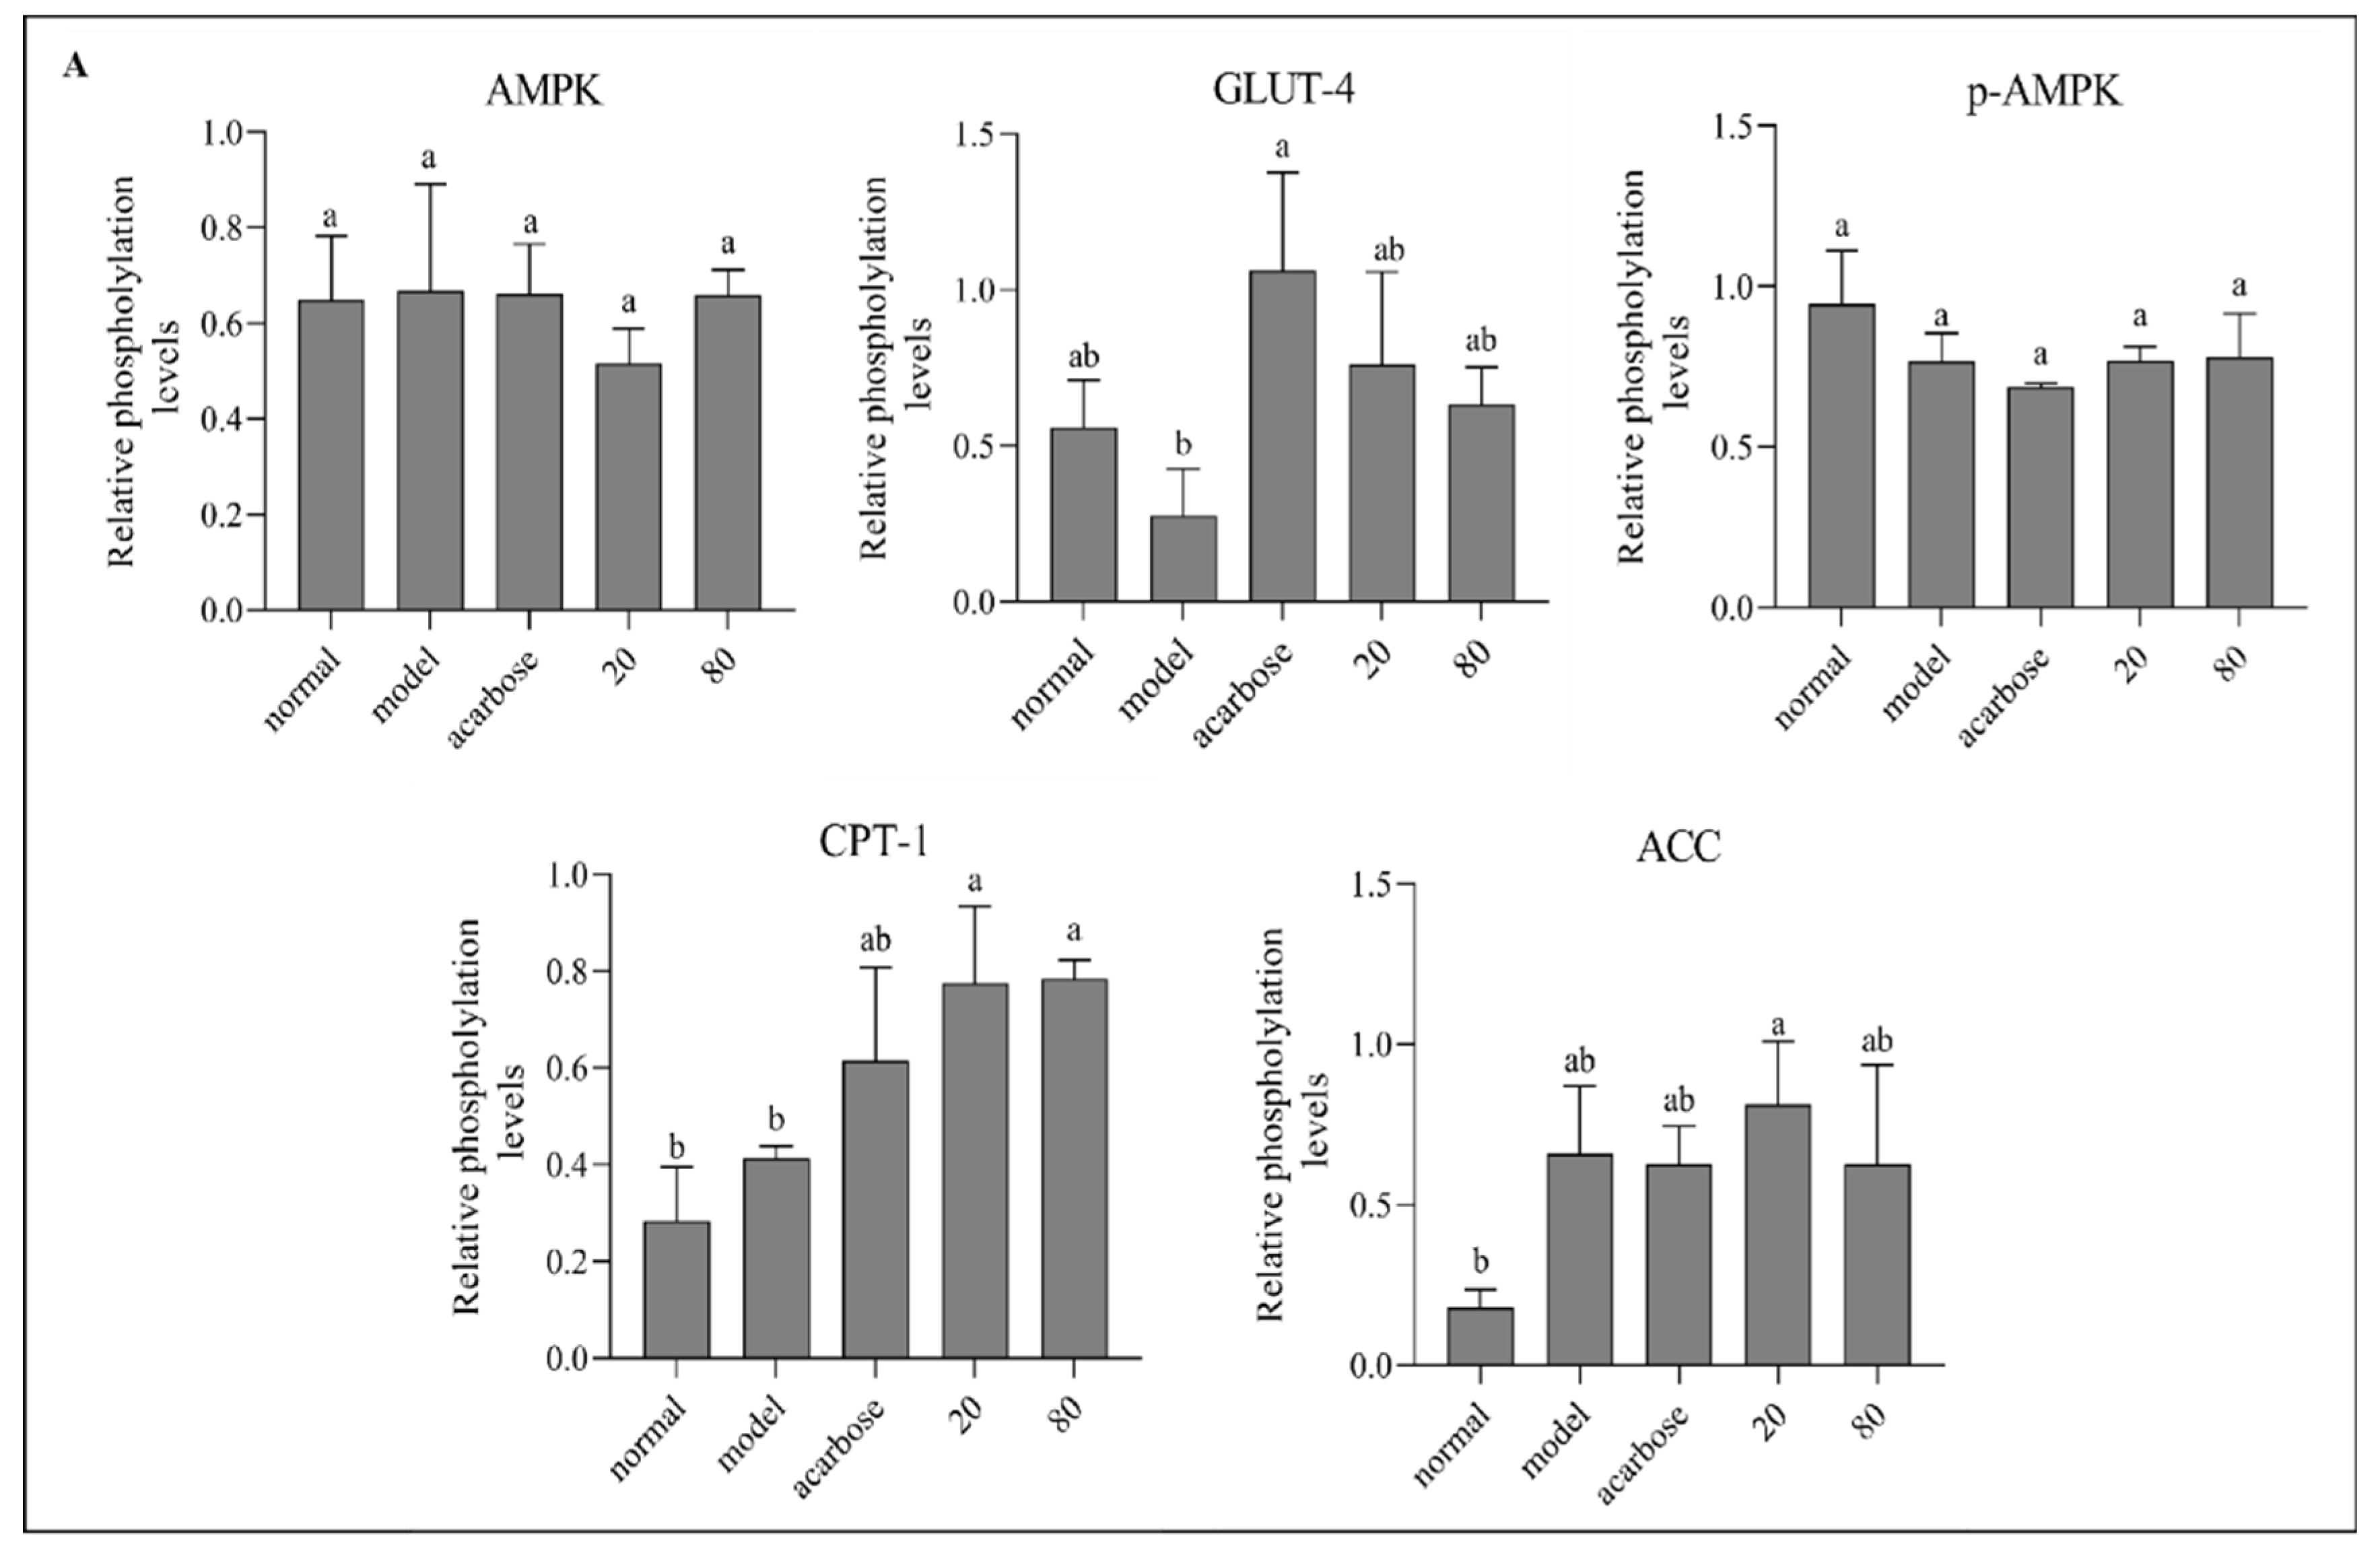
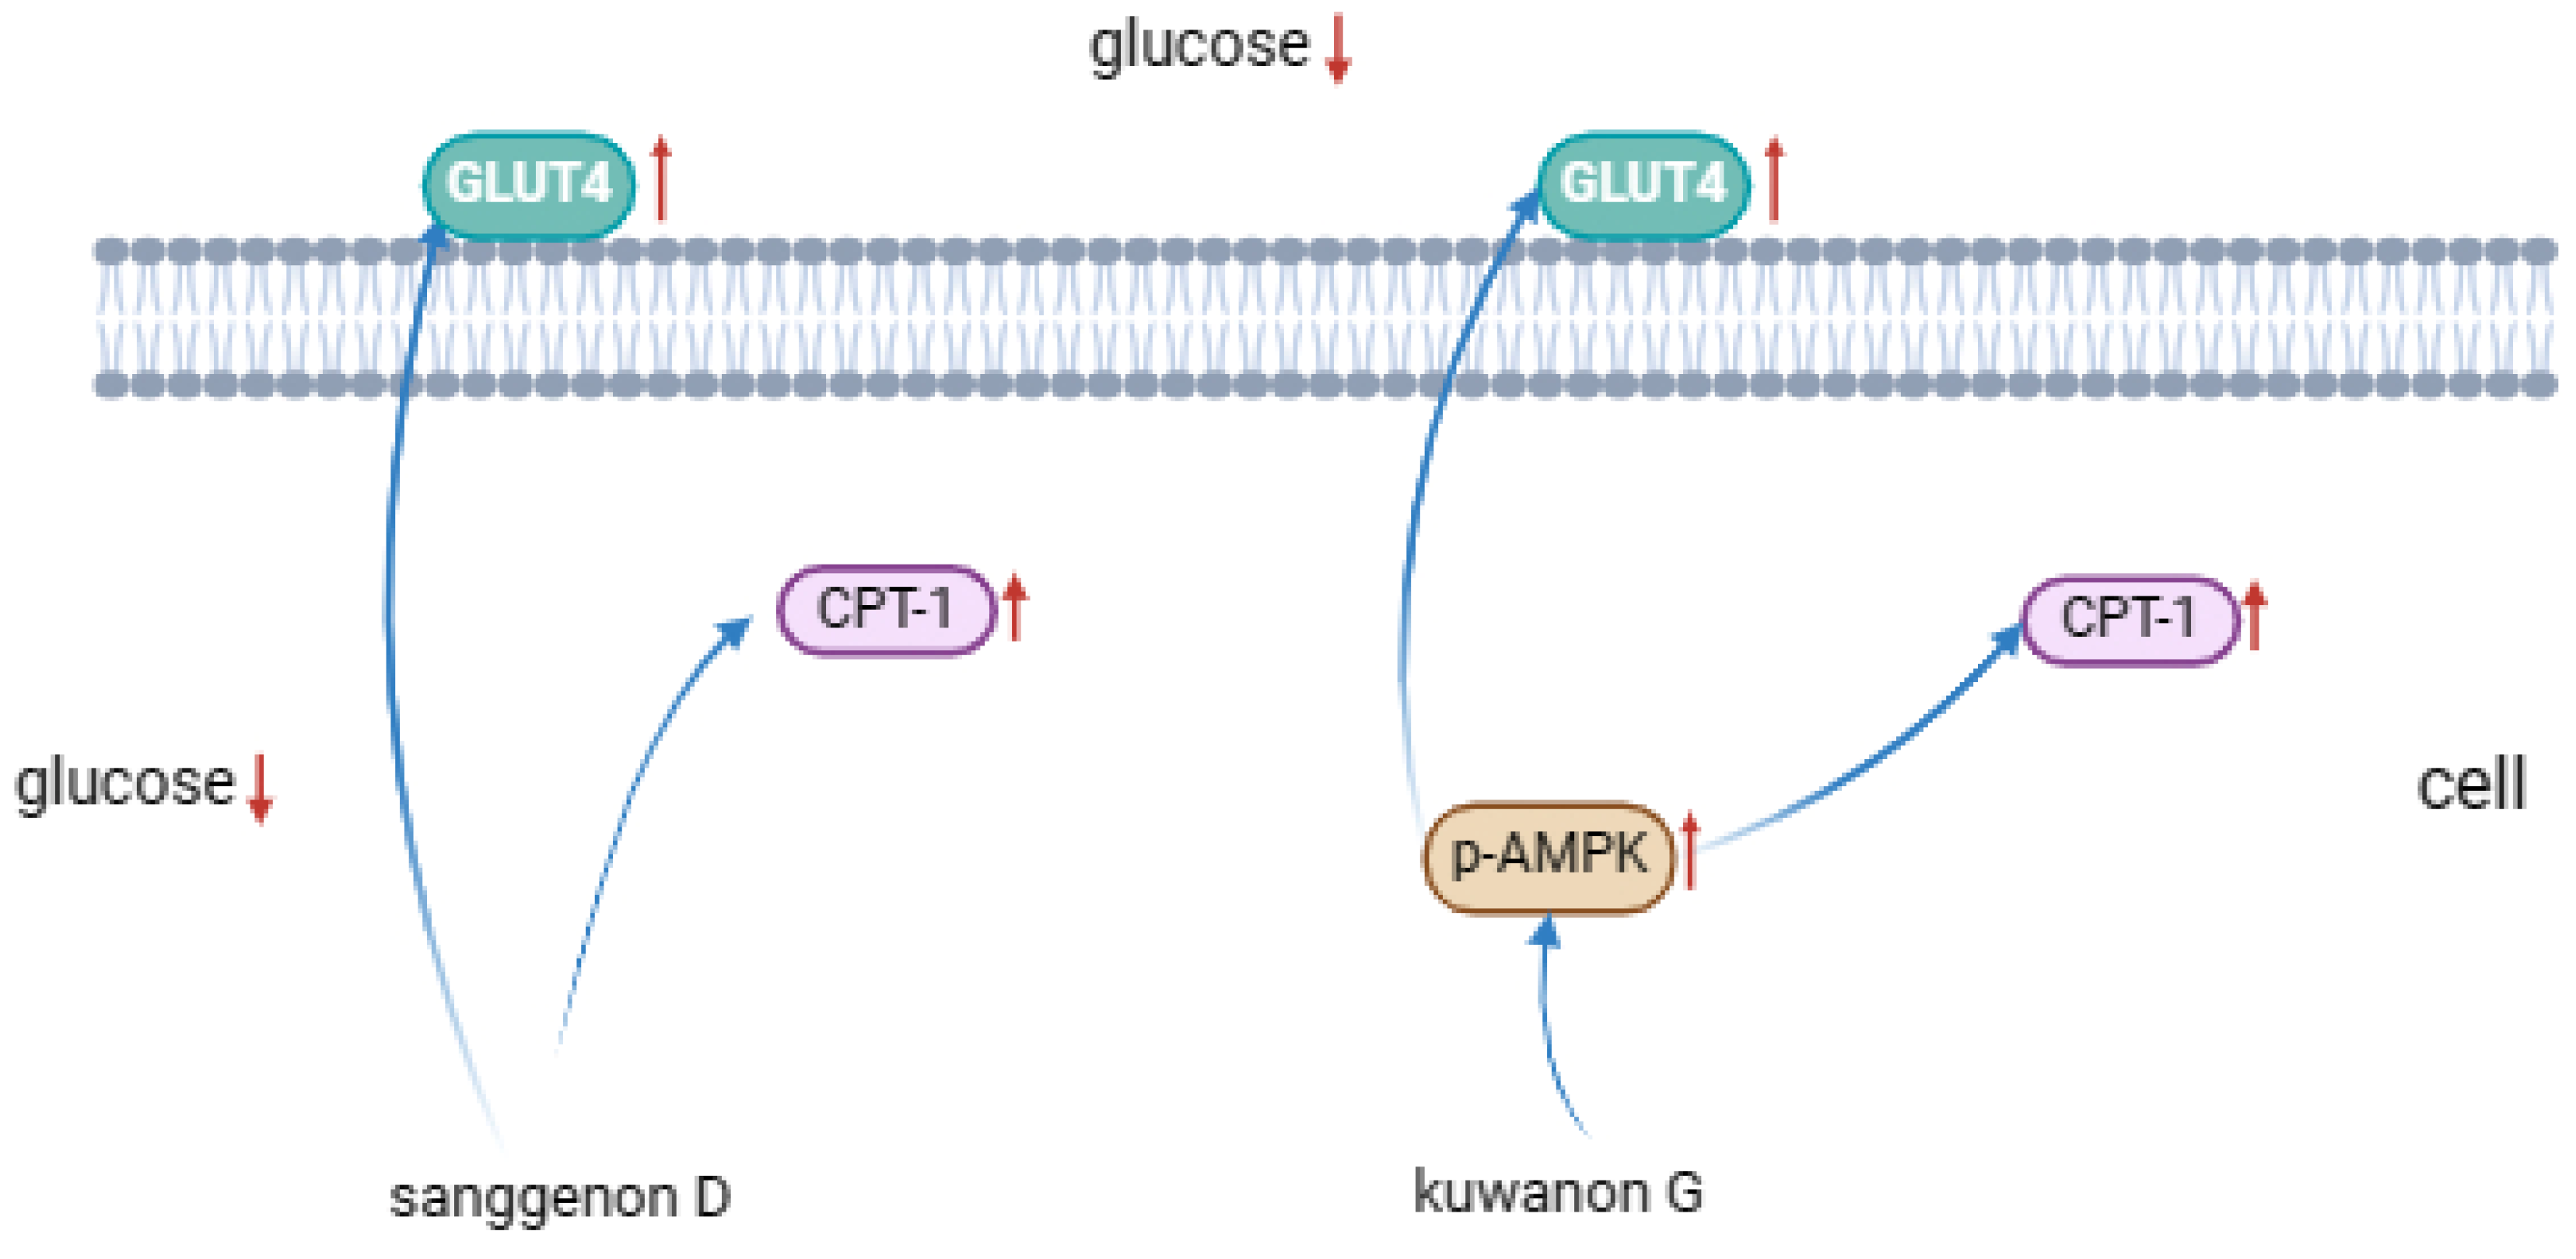
Figure 8 describes the protein expression levels of AMPK, GLUT4, p-AMPK, ACC and CPT-1 in HepG2 cells after sample treatment with different concentrations. Compared with the model group, GLUT4 expression was notably up-regulated in both groups, and p-AMPK was significantly promoted in kuwanon G group, indicating that AMPK phosphorylation was significantly activated in kuwanon G group, which might be one of the reasons why kuwanon G obtained better inhibitory effect than sanggenon D. In addition, both Sanggenon D and kuwanon G significantly upregulated the expression of CPT-1, and CPT-1 could promote the decomposition and oxidation of fatty acids, which corresponded to the decrease of TC and TG results. The mechanism of action in regulating glucose metabolism was summarized in
Figure 9.
4. Conclusions
The inhibition mechanisms and the structure–activity relationships of sanggenon D and kuwanon G on α-glucosidase were analyzed in this study. The results suggested that two flavonoids could effectively inhibit α-glucosidase activity, and the inhibitory effect of kuwanon G was better than that of sanggenon D. The reason might be that cyclization weakened the activity of the isopentene group and removed a phenol hydroxyl group, resulting in the formation of fewer hydrogen bonds. Furthermore, fluorescence and FT-IR analyses indicated that both compounds changed the microenvironment and secondary structure of α-glucosidase through static quenching. Moreover, molecular docking results confirmed that the stability, binding energy, and affinity matched the inhibitory activity of the two compounds. Their main binding to α-glucosidase occurred spontaneously through hydrophobic interactions and hydrogen bonds with amino acid residues. Through the establishment of HepG2 cell high glucose model, it was verified that both sanggenon D and kuwanon G had a good hypoglycemic effect. Western blot results showed that sanggenon D and kuwanon G regulated blood glucose, and the mechanism might be related to the activation of GLUT4 pathway.
Acknowledgments
This research received funding from the Aquaculture Collaborative Innovation Center of GDAAS [No.XT202502], and the Science & Technology Projects of Guangdong Province [No.2024A1515011122; No. 2023B0202010004]. The authors would like to acknowledge the contribution of Agricultural Products Processing Project of Guangdong Key Laboratory [No.202406], and the China Agriculture Research System of MOF and MARA [No.CARS-18-ZJ0503].
Conflicts of Interest
The authors declare that they have no financial interest or personal relationships that influenced the work reported in this paper.
Abbreviations Used
T2DM, type 2 diabetics; DMEM, Dulbecco’s modified Eagle’s medium; TC, total cholesterol; TG, triglyceride; TPEB, total protein extraction buffer; BCA, bicinchoninic acid assay; PVDF, polyvinylidene difluoride; PBST, Phosphate Buffered Saline with Tween-20; RMSD, root mean square deviation; RMSF, root mean square fluctuation; AMPK, 5′-monophosphate AMP activated protein kinase; GLUT4, glucose transporter type 4; PPAR-γ, peroxisome proliferator-activated receptor gamma; ACC, acetyl-CoA carboxylase; CPT-1, carnitine palmitoyltransferase1.
References
- Eid, S.; Sas, K.M.; Abcouwer, S.F.; Feldman, E.L.; Gardner, T.W.; Pennathur, S.; Fort, P.E. New insights into the mechanisms of diabetic complications: role of lipids and lipid metabolism. Diabetologia 2019, 62, 1539–1549. [Google Scholar] [CrossRef]
- Zheng, Y.; Ley, S.H.; Hu, F.B. Global aetiology and epidemiology of type 2 diabetes mellitus and its complications. Nat. Rev. Endocrinol. 2018, 14, 88–98. [Google Scholar] [CrossRef]
- Lee, S.-H.; Park, S.-Y.; Choi, C.S. Insulin Resistance: From Mechanisms to Therapeutic Strategies. Diabetes Metab. J. 2022, 46, 15–37. [Google Scholar] [CrossRef]
- Smirnova, I.E.; Galimova, Z.I.; Sapozhnikova, T.A.; Khisamutdinova, R.Y.; Thi, T.H.N.; Kazakova, O.B. New Dipterocarpol-Based Molecules with α-Glucosidase Inhibitory and Hypoglycemic Activity. ChemBioChem 2023, 25, e202300716. [Google Scholar] [CrossRef]
- Tan, Y.; Chang, S.K.; Zhang, Y. Comparison of α-amylase, α-glucosidase and lipase inhibitory activity of the phenolic substances in two black legumes of different genera. Food Chem. 2017, 214, 259–268. [Google Scholar] [CrossRef]
- Ma, Y.-Y.; Zhao, D.-G.; Zhou, A.-Y.; Zhang, Y.; Du, Z.; Zhang, K. α-Glucosidase Inhibition and Antihyperglycemic Activity of Phenolics from the Flowers of Edgeworthia gardneri. J. Agric. Food Chem. 2015, 63, 8162–8169. [Google Scholar] [CrossRef]
- Patel, P.; Shah, D.; Bambharoliya, T.; Patel, V.; Patel, M.; Patel, D.; Bhavsar, V.; Padhiyar, S.; Patel, B.; Mahavar, A.; et al. A Review on the Development of Novel Heterocycles as α-Glucosidase Inhibitors for the Treatment of Type-2 Diabetes Mellitus. Med. Chem. 2024, 20, 503–536. [Google Scholar] [CrossRef]
- Chan, E.W.-C.; Lye, P.-Y.; Wong, S.-K. Phytochemistry, pharmacology, and clinical trials of Morus alba. Chin. J. Nat. Med. 2016, 14, 17–30. [Google Scholar] [CrossRef]
- Zhang, R.; Zhang, Q.; Zhu, S.; Liu, B.; Liu, F.; Xu, Y. Mulberry leaf (Morus alba L.): A review of its potential influences in mechanisms of action on metabolic diseases. Pharmacol. Res. 2021, 175, 106029. [Google Scholar] [CrossRef]
- Jucá, M.M.; Filho, F.M.S.C.; De Almeida, J.C.; Mesquita, D.D.S.; Barriga, J.R.D.M.; Dias, K.C.F.; Barbosa, T.M.; Vasconcelos, L.C.; Leal, L.K.A.M.; Ribeiro, J.E.; et al. Flavonoids: biological activities and therapeutic potential. Nat. Prod. Res. 2020, 34, 692–705. [Google Scholar] [CrossRef]
- Van Acker, S.A.B.E.; Van Den Berg, D.-J.; Tromp, M.N.J.L.; Griffioen, D.H.; Van Bennekom, W.P.; Van Der Vijgh, W.J.F.; Bast, A. Structural aspects of antioxidant activity of flavonoids. Free Radic. Biol. Med. 1996, 20, 331–342. [Google Scholar] [CrossRef]
- Kimura, T.; Nakagawa, K.; Kubota, H.; Kojima, Y.; Goto, Y.; Yamagishi, K.; Oita, S.; Oikawa, S.; Miyazawa, T. Food-Grade Mulberry Powder Enriched with 1-Deoxynojirimycin Suppresses the Elevation of Postprandial Blood Glucose in Humans. J. Agric. Food Chem. 2007, 55, 5869–5874. [Google Scholar] [CrossRef]
- Musabayane, C.; Bwititi, P.; Ojewole, J. Effects of oral administration of some herbal extracts on food consumption and blood glucose levels in normal and streptozotocin-treated diabetic rats. Methods Find. Exp. Clin. Pharmacol. 2006, 28, 223–8. [Google Scholar] [CrossRef]
- Wen, L.; Zhou, T.; Jiang, Y.; Chang, S.K.; Yang, B. Prenylated flavonoids in foods and their applications on cancer prevention. Crit. Rev. Food Sci. Nutr. 2021, 62, 5067–5080. [Google Scholar] [CrossRef]
- Sun, H.; Li, Y.; Zhang, X.; Lei, Y.; Ding, W.; Zhao, X.; Wang, H.; Song, X.; Yao, Q.; Zhang, Y.; et al. Synthesis, α-glucosidase inhibitory and molecular docking studies of prenylated and geranylated flavones, isoflavones and chalcones. Bioorganic Med. Chem. Lett. 2015, 25, 4567–4571. [Google Scholar] [CrossRef]
- Sadeghi, M.; Miroliaei, M.; Ghanadian, M.; Szumny, A.; Rahimmalek, M. Exploring the inhibitory properties of biflavonoids on α-glucosidase; computational and experimental approaches. Int. J. Biol. Macromol. 2023, 253, 127380. [Google Scholar] [CrossRef]
- Zou, Y.; Mei, C.; Liu, F.; Xing, D.; Pang, D.; Li, Q. The lipase inhibitory effect of mulberry leaf phenolic glycosides: The structure-activity relationship and mechanism of action. Food Chem. 2024, 458, 140228. [Google Scholar] [CrossRef]
- Burley, S.K.; Berman, H.M.; Kleywegt, G.J.; Markley, J.L.; Nakamura, H.; Velankar, S. Protein Data Bank (PDB): The single global macromolecular structure archive. Methods Mol. Biol. 2017, 1067, 627–641. [Google Scholar]
- Trott, O.; Olson, A.J. AutoDock Vina: Improving the speed and accuracy of docking with a new scoring function, efficient optimization, and multithreading. J. Comput. Chem. 2010, 31, 455–461. [Google Scholar] [CrossRef]
- Salomon-Ferrer, R.; Case, D.A.; Walker, R.C. An overview of the Amber biomolecular simulation package. WIREs Comput. Mol. Sci. 2012, 3, 198–210. [Google Scholar] [CrossRef]
- Genheden, S.; Ryde, U. The MM/PBSA and MM/GBSA methods to estimate ligand-binding affinities. Expert Opin. Drug Discov. 2015, 10, 449–461. [Google Scholar] [CrossRef]
- Cao, M.; Wang, J.; Jiang, X.; Sun, Z.; Zhao, L.; Chen, G. Phenolic Constituents from Black Quinoa Alleviate Insulin Resistance in HepG2 Cells via Regulating IRS1/PI3K/Akt/GLUTs Signaling Pathways. J. Agric. Food Chem. 2023, 71, 18780–18791. [Google Scholar] [CrossRef]
- Zheng, Y.; Zheng, Y.; Tian, J.; Tian, J.; Yang, W.; Yang, W.; Chen, S.; Chen, S.; Liu, D.; Liu, D.; et al. Inhibition mechanism of ferulic acid against α-amylase and α-glucosidase. Food Chem. 2020, 317, 126346. [Google Scholar] [CrossRef]
- Xu, Z.; Hileuskaya, K.; Kraskouski, A.; Yang, Y.; Huang, Z.; Zhao, Z. Inhibition of α-glucosidase activity and intestinal glucose transport to assess the in vivo anti-hyperglycemic potential of dodecyl-acylated phlorizin and polydatin derivatives. Food Funct. 2024, 15, 4785–4804. [Google Scholar] [CrossRef]
- Sepehri, S.; Farhadi, G.; Maghbul, M.; Nasiri, F.; Faramarzi, M.A.; Mahnam, K.; Mojtabavi, S.; Mahdavi, M.; Oranj, Z.M. A new route to the synthesis of 2-hydrazolyl-4-thiazolidinone hybrids, evaluation of α-glucosidase inhibitory activity and molecular modeling insights. Heliyon 2024, 10, e36408. [Google Scholar] [CrossRef]
- Sari, S.; Barut, B.; Özel, A.; Şöhretoğlu, D. Tyrosinase inhibitory effects of Vinca major and its secondary metabolites: Enzyme kinetics and in silico inhibition model of the metabolites validated by pharmacophore modelling. Bioorganic Chem. 2019, 92, 103259. [Google Scholar] [CrossRef]
- Li, Y.Q.; Zhou, F.C.; Gao, F.; Bian, J.S.; Shan, F. Comparative Evaluation of Quercetin, Isoquercetin and Rutin as Inhibitors of α-Glucosidase. J. Agric. Food Chem. 2009, 57, 11463–11468. [Google Scholar] [CrossRef]
- Peng, X.; Zhang, G.; Zeng, L. Inhibition of α-glucosidase by vitamin D3 and the effect of vitamins B1 and B2. Food Funct. 2015, 7, 982–991. [Google Scholar] [CrossRef]
- Sun, L.; Warren, F.J.; Netzel, G.; Gidley, M.J. 3 or 3′-Galloyl substitution plays an important role in association of catechins and theaflavins with porcine pancreatic α-amylase: The kinetics of inhibition of α-amylase by tea polyphenols. J. Funct. Foods 2016, 26, 144–156. [Google Scholar] [CrossRef]
- Sano, K.; Kuribara, T.; Ishii, N.; Kuroiwa, A.; Yoshihara, T.; Tobita, S.; Totani, K.; Matsuo, I. Fluorescence Quenching-based Assay for Measuring Golgi endo-α-Mannosidase. Chem. – Asian J. 2019, 14, 1965–1969. [Google Scholar] [CrossRef]
- Genovese, D.; Cingolani, M.; Rampazzo, E.; Prodi, L.; Zaccheroni, N. Static quenching upon adduct formation: a treatment without shortcuts and approximations. Chem. Soc. Rev. 2021, 50, 8414–8427. [Google Scholar] [CrossRef]
- Chen, X.; He, X.; Zhang, B.; Sun, L.; Liang, Z.; Huang, Q. Wheat gluten protein inhibits α-amylase activity more strongly than a soy protein isolate based on kinetic analysis. Int. J. Biol. Macromol. 2019, 129, 433–441. [Google Scholar] [CrossRef]
- Yang, J.; Wang, X.; Zhang, C.; Ma, L.; Wei, T.; Zhao, Y.; Peng, X. Comparative study of inhibition mechanisms of structurally different flavonoid compounds on α-glucosidase and synergistic effect with acarbose. Food Chem. 2021, 347, 129056. [Google Scholar] [CrossRef]
- Zhang, G.; Ma, Y. Mechanistic and conformational studies on the interaction of food dye amaranth with human serum albumin by multispectroscopic methods. Food Chem. 2013, 136, 442–449. [Google Scholar] [CrossRef]
- Haroun, A.A.; El Toumy, S.A. Effect of natural polyphenols on physicochemical properties of crosslinked gelatin-based polymeric biocomposite. J. Appl. Polym. Sci. 2010, 116, 2825–2832. [Google Scholar] [CrossRef]
- Wongsa, P.; Phatikulrungsun, P.; Prathumthong, S. FT-IR characteristics, phenolic profiles and inhibitory potential against digestive enzymes of 25 herbal infusions. Sci. Rep. 2022, 12, 1–11. [Google Scholar] [CrossRef]
- Nie, C.; Zou, Y.; Liao, S.; Gao, Q.; Li, Q. Molecular Targets and Mechanisms of 6,7-Dihydroxy-2,4-dimethoxyphenanthrene from Chinese Yam Modulating NF-κB/COX-2 Signaling Pathway: The Application of Molecular Docking and Gene Silencing. Nutrients 2023, 15, 883. [Google Scholar] [CrossRef]
- Mohseni-Shahri, F.S.; Moeinpour, F.; Nosrati, M. Spectroscopy and molecular dynamics simulation study on the interaction of sunset yellow food additive with pepsin. Int. J. Biol. Macromol. 2018, 115, 273–280. [Google Scholar] [CrossRef]
- Santana, D.; Trindade, I.; Carvalho, Y.; Carvalho-Neto, A.; Silva, E.; Silva-Júnior, E.; Leite, R.; Quintans-Júnior, L.; Aquino, T.; Serafini, M.; et al. Analytical techniques to recognize inclusion complexes formation involving monoterpenes and cyclodextrins: A study case with (–) borneol, a food ingredient. Food Chem. 2021, 339, 127791. [Google Scholar] [CrossRef]
- Zhang, X.; Li, D.; Wang, K.; Xie, J.; Liu, Y.; Wang, T.; Liu, S.; Huang, Q.; Guo, Q.; Wang, H. Hyperoside inhibits pancreatic lipase activity in vitro and reduces fat accumulation in vivo. Food Funct. 2023, 14, 4763–4776. [Google Scholar] [CrossRef]
- White, S.L.; Pasupathy, D.; Sattar, N.; Nelson, S.M.; Lawlor, D.A.; Briley, A.L.; Seed, P.T.; Welsh, P.; Poston, L. Metabolic profiling of gestational diabetes in obese women during pregnancy. Diabetologia 2017, 60, 1903–1912. [Google Scholar] [CrossRef]
- Garcia, D.; Shaw, R.J. AMPK: Mechanisms of Cellular Energy Sensing and Restoration of Metabolic Balance. Mol. Cell 2017, 66, 789–800. [Google Scholar] [CrossRef] [PubMed]
- Shepherd, P.; Gnudi, L.; Tozzo, E.; Yang, H.; Leach, F.; Kahn, B. Adipose cell hyperplasia and enhanced glucose disposal in transgenic mice overexpressing GLUT4 selectively in adipose tissue. J. Biol. Chem. 1993, 268, 22243–22246. [Google Scholar] [CrossRef]
- Nakamura, M.T.; Yudell, B.E.; Loor, J.J. Regulation of energy metabolism by long-chain fatty acids. Prog. Lipid Res. 2014, 53, 124–144. [Google Scholar] [CrossRef] [PubMed]
- Zhang, B.; Kang, M.; Xie, Q.; Xu, B.; Sun, C.; Chen, K.; Wu, Y. Anthocyanins from Chinese Bayberry Extract Protect β Cells from Oxidative Stress-Mediated Injury via HO-1 Upregulation. J. Agric. Food Chem. 2010, 59, 537–545. [Google Scholar] [CrossRef] [PubMed]
- Yang, H.J.; Jang, D.-J.; Hwang, J.-T. Anti-diabetic effects of Korean red pepper via AMPK and PPAR-γ activation in C2C12 myotubes. J. Funct. Foods 2012, 4, 552–558. [Google Scholar] [CrossRef]
- Yoon, S.-A.; Kang, S.-I.; Shin, H.-S.; Kang, S.-W.; Kim, J.-H.; Ko, H.-C.; Kim, S.-J. p-Coumaric acid modulates glucose and lipid metabolism via AMP-activated protein kinase in L6 skeletal muscle cells. Biochem. Biophys. Res. Commun. 2013, 432, 553–557. [Google Scholar] [CrossRef]
Figure 1.
The inhibitory effect of different concentrations of (A) acarbose, (B) sangenone D and (C) kuwanon G on α-glucosidase activity.
Figure 1.
The inhibitory effect of different concentrations of (A) acarbose, (B) sangenone D and (C) kuwanon G on α-glucosidase activity.
Figure 2.
Inhibition kinetic of hyperoside on α-glucosidase by Lineweaver-Burk plots (A) sangenone D, (B) kuwanon G.
Figure 2.
Inhibition kinetic of hyperoside on α-glucosidase by Lineweaver-Burk plots (A) sangenone D, (B) kuwanon G.
Figure 3.
The effect of different concentration compounds on florescence spectra (A) sangenone D, (B) kuwanon G; Stern-Volmer plots indicating α-glucosidase fluorescence quenching at different temperature (C) sangenone D, (D) kuwanon G.
Figure 3.
The effect of different concentration compounds on florescence spectra (A) sangenone D, (B) kuwanon G; Stern-Volmer plots indicating α-glucosidase fluorescence quenching at different temperature (C) sangenone D, (D) kuwanon G.
Figure 4.
The FT-IR spectra of α-glucosidase-inhibitor(A).The effect of sangenone D and kuwanon G on the secondary conformation of α-glucosidase. (B) α-glucosidase black control, (C) sangenone D, (D) kuwanon G.
Figure 4.
The FT-IR spectra of α-glucosidase-inhibitor(A).The effect of sangenone D and kuwanon G on the secondary conformation of α-glucosidase. (B) α-glucosidase black control, (C) sangenone D, (D) kuwanon G.
Figure 5.
3D binding diagram and molecular dynamics simulation of α-glucosidase with sangenone D and kuwanon G. (A) sangenone D, (B) kuwanon G, (C) Root mean square deviation (RMSD), (D) Root mean square fluctuation value (RMSF) based on molecular dynamics simulation, (E) number of hydrogen bond.
Figure 5.
3D binding diagram and molecular dynamics simulation of α-glucosidase with sangenone D and kuwanon G. (A) sangenone D, (B) kuwanon G, (C) Root mean square deviation (RMSD), (D) Root mean square fluctuation value (RMSF) based on molecular dynamics simulation, (E) number of hydrogen bond.
Figure 6.
Survival rate of HepG2 cells treated with (A) sangenone D and (B) kuwanon G.
Figure 6.
Survival rate of HepG2 cells treated with (A) sangenone D and (B) kuwanon G.
Figure 7.
Effect of sangenone D on glucose content in supernatant (A) and intracellular TC (B) and TG (C) content; effect of kuwanon G on glucose content in supernatant (D) and intracellular TC (E) and TG content (F).
Figure 7.
Effect of sangenone D on glucose content in supernatant (A) and intracellular TC (B) and TG (C) content; effect of kuwanon G on glucose content in supernatant (D) and intracellular TC (E) and TG content (F).
Figure 8.
Effect of sanggenone D (A) and kuwanon G (B) on glucose transport related mRNA expression in HepG2 cells, Western blot images of AMPK, p-AMPK, CPT-1, ACC and GLUT4 (C).
Figure 8.
Effect of sanggenone D (A) and kuwanon G (B) on glucose transport related mRNA expression in HepG2 cells, Western blot images of AMPK, p-AMPK, CPT-1, ACC and GLUT4 (C).
Figure 9.
Mechanism of sanggenone D and kuwanon G effects on regulating glucose.
Figure 9.
Mechanism of sanggenone D and kuwanon G effects on regulating glucose.
Table 1.
Km, Vm, Ki and Kis values of the compounds inhibiting α-glucosidase activity.
Table 1.
Km, Vm, Ki and Kis values of the compounds inhibiting α-glucosidase activity.
| |
concentration (μg/mL) |
Km |
Vm |
Ki |
Kis |
| Sanggenon D |
0 |
78.49 |
5.02 |
252.95 |
9.86 |
| 20 |
17.18 |
1.00 |
| 100 |
1.57 |
0.071 |
| 200 |
0.89 |
0.027 |
| Kuwanon G |
0 |
1.73 |
0.27 |
83.46 |
50.89 |
| 10 |
2.17 |
0.29 |
| 20 |
5.68 |
0.63 |
| 40 |
15.98 |
1.49 |
Table 2.
KSV, Kq, Ka and n of compounds on α-glucosidase at three temperatures.
Table 2.
KSV, Kq, Ka and n of compounds on α-glucosidase at three temperatures.
| |
T(K) |
KSV(×104
L/mol) |
Ra |
Kq(×1012 L/mol) |
Ka(×103
L/mol) |
n |
Rb |
| Sanggenon D |
298 |
3.90 ± 0.04 |
0.98 |
3.90 ± 0.04 |
7.28 ± 0.21 |
0.81 |
0.98 |
| 304 |
3.24 ± 0.02 |
0.99 |
3.24 ±0.02 |
16.73 ± 0.14 |
0.93 |
0.99 |
| 310 |
2.56 ± 0.02 |
0.98 |
2.56 ±0.02 |
180.18 ± 0.30 |
1.22 |
0.98 |
| Kuwanon G |
298 |
5.41 ± 0.01 |
0.99 |
5.41 ± 0.01 |
36.85 ± 0.17 |
0.96 |
0.99 |
| 304 |
4.91 ± 0.03 |
0.99 |
4.91 ± 0.03 |
194.98 ± 0.42 |
1.15 |
0.99 |
| 310 |
3.35 ± 0.01 |
0.98 |
3.35 ± 0.01 |
1984.27 ± 0.33 |
1.43 |
0.98 |
Table 3.
Binding free energies and energy components predicted by MM/GBSA (kcal/mol).
Table 3.
Binding free energies and energy components predicted by MM/GBSA (kcal/mol).
| System name |
α-glucosidase/sanggenon D |
α-glucosidase/ kuwanon G |
| ΔEvdw |
-22.55 ± 4.19 |
-26.16 ± 2.43 |
| ΔEelec |
109.95 ± 4.95 |
59.73 ± 5.51 |
| ΔGGB |
-94.59 ± 3.78 |
-44.70 ± 6.19 |
| ΔGSA |
-2.63 ± 0.51 |
-2.69 ± 0.26 |
| ΔGbind |
-9.83 ± 2.44 |
-13.83 ± 2.94 |
|
Disclaimer/Publisher’s Note: The statements, opinions and data contained in all publications are solely those of the individual author(s) and contributor(s) and not of MDPI and/or the editor(s). MDPI and/or the editor(s) disclaim responsibility for any injury to people or property resulting from any ideas, methods, instructions or products referred to in the content. |
© 2025 by the authors. Licensee MDPI, Basel, Switzerland. This article is an open access article distributed under the terms and conditions of the Creative Commons Attribution (CC BY) license (http://creativecommons.org/licenses/by/4.0/).